Article

Study on the Transient Responses of Composite Lining Tunnels Subjected to Blasting P-Waves and SV-Waves


1
Jiangxi Communications Investment Maintenance Technology Group Co., Ltd., Nanchang 330200, China
2
Jiangxi Provincial Key Laboratory of Highway Bridge and Tunnel Engineering, Nanchang 330200, China
3
School of Civil Engineering and Architecture, East China Jiaotong University, Nanchang 330013, China
4
The Fourth Construction Co., Ltd. of CSCEC 7th Division, Xi’an 710016, China
*
Authors to whom correspondence should be addressed.
Appl. Sci. 2026, 16(13), 6668; https://doi.org/10.3390/app16136668
Submission received: 18 May 2026 / Revised: 26 June 2026 / Accepted: 30 June 2026 / Published: 3 July 2026

Abstract

Grounded in the principles of wave dynamics, this study employs the wave function expansion approach to mathematically describe how plane P- and SV-waves scatter around a composite tunnel lining embedded in an unbounded medium. To establish the transient analytical framework for the dual-layer structure subjected to blast excitations, we integrate Fourier integral transforms alongside the Heaviside step and Dirac delta functions. We systematically analyze how the tunnel’s transient dynamic stress concentration factor (DSCF) responds to variations in the shear modulus ratio, as well as the specific characteristics of the incoming waves (i.e., wave type and dimensionless pulse duration). Furthermore, a seismic mitigation strategy featuring a “soft-exterior, rigid-interior” configuration is theoretically explored. The analytical outcomes theoretically indicate that short-duration transient waves provoke severe dynamic stress concentrations within the lining, with SV-waves posing a markedly greater threat to structural integrity than P-waves. Analyses reveal that the peak dynamic stress concentration (DSCFmax) primarily localizes at the tunnel’s crown and invert. Interestingly, altering the pulse duration does not significantly shift this spatial distribution pattern. Ultimately, analytical results suggest that adopting the “soft-exterior, rigid-interior” design and optimizing the thickness of the primary support can substantially alleviate these stress concentrations, providing preliminary theoretical guidance for vibration attenuation.

1. Introduction

Tunnels are widely utilized in engineering, particularly for applications in the transportation sector, including for railroads, highways, and subways. However, subterranean development often necessitates explosive methods near pre-existing structures, a scenario commonly encountered during the upgrading of aging rail corridors [1] or the excavation of intersecting transit networks [2]. The intense energy released during these blasting sequences fundamentally jeopardizes the structural equilibrium of adjacent tunnels, leading to severe degradation, including boundary fissures [3], severe localized deformations, and potential structural collapse [4]. To address this, a rigorous evaluation of the transient wave propagation characteristics and energy dissipation mechanisms within the surrounding rock-lining system is critical. Gaining a deeper analytical understanding of these dynamic wave interactions is essential for designing resilient infrastructure and mitigating the catastrophic risks associated with blast-induced vibrations.
In the context of elastodynamics, blast-induced seismic disturbances are fundamentally categorized into longitudinal and transverse waves [5]. P-waves are compressional waves wherein the medium’s particle motion is parallel to the direction of wave propagation [6], inducing volumetric changes. S-waves are shear waves characterized by particle motion perpendicular to the propagation direction, causing shape deformation without volumetric change [7]. Depending on their polarization relative to a reference boundary or plane of incidence, S-waves are further decoupled into SV-waves and SH-waves [8,9]. At the earliest, Pao et al. [10] first proposed the dynamic response of deep circular lining in infinite space under seismic waves, and introduced the dynamic stress concentration factor (DSCF) to characterize the dynamic characteristics of circular lining in their work. Subsequently, many scholars paid attention to this meaningful problem, especially the scattering of P-, SV- and SH-waves by circular lining embedded in full space [11,12,13,14]. However, most tunnel structures in practical engineering are not deeply buried. Some scholars have employed the large circular arc assumption [15,16] to simulate the horizontal ground surface and the Fourier–Bessel series method to investigate the dynamic response of elastic half-space SH- and SV-waves on tunnels without significant errors. Lee et al. [17] studied the dynamic stress response of a shallow buried tunnel lining under the action of SH-waves and showed that the wave interference between the tunnel and the zero-stress surface leads to the variation in DSCF with depth. Subsequently, scholars solved the dynamic response of shallow circular lining subjected to elastic half-space P-waves based on the large arc assumption, and discussed in detail the effects of parameters such as incident angle, burial depth, and lining stiffness on the dynamic response of circular lining [18,19]. The propagation characteristics of elastic waves in various underground structures were thoroughly investigated, such as solving the dynamic response solution of deep composite lining in saturated soil by the wave function expansion method [20,21]. Some studies [22,23] considered the rock mass–lining interface with defects, and the DSCF of the rock mass and lining were evaluated and discussed. The results showed that the bonding conditions had a significant effect on the dynamic response of lined tunnels. Furthermore, in recent years, some scholars [24,25] have placed resonators on the surface to isolate surface waves and body waves within a certain range, thereby preventing earthquake-induced damage to underground structures.
The studies mentioned above focused on the effects of steady-state incident waves on tunnels. However, in blasting or drilling engineering, transient waves propagate deep into the surrounding rock, inflicting severe damage upon the tunnel lining and adjacent infrastructure [26]. To resolve the transient response model, several researchers [27,28,29] have idealized blast loads using triangular, half-sine, or exponential waveforms. By applying Fourier or Laplace transforms, these studies explored the transient dynamic behavior of circular tunnels subjected to P-wave excitations [19]. In practice, Fourier and Laplace transforms will experience singularity issues during inversion. To address this problem, researchers have developed two main approaches: one combines Duhamel’s integral with the trapezoidal rule for Fourier transforms [30,31], which has been applied to analyze the dynamic responses of circular cavities under blasting P-waves, and the other uses Den Iseger’s [32] and Durbin’s [33] algorithms based on Laplace transforms to formulate solutions for the transient behavior of tunnels subjected to blast-induced longitudinal waves.
While prior investigations have predominantly focused on the transient dynamics of unlined cavities and single-shell structures subjected to blast-induced P-waves, they frequently overlook the composite support architectures—comprising initial and secondary linings—that are ubiquitous in contemporary geotechnical practice. Furthermore, the critical implications of blast-induced SV-waves on subterranean infrastructure remain largely unexplored. To address these gaps, this study examines the transient behavior of circular tunnels featuring composite linings under both P- and SV-wave excitations. Building upon established steady-state analytical frameworks and contextualized by real-world engineering scenarios, we systematically evaluate parametric influences on DSCF to propose robust seismic attenuation strategies. The remainder of this paper is organized as follows: Section 2 defines the computational model and steady-state solutions. Section 3 outlines the derivation of the transient response. Section 4 provides a detailed analysis of the computational results, and Section 5 summarizes the core conclusions.

2. Computational Framework and Steady-State Formulations

2.1. Calculation Model

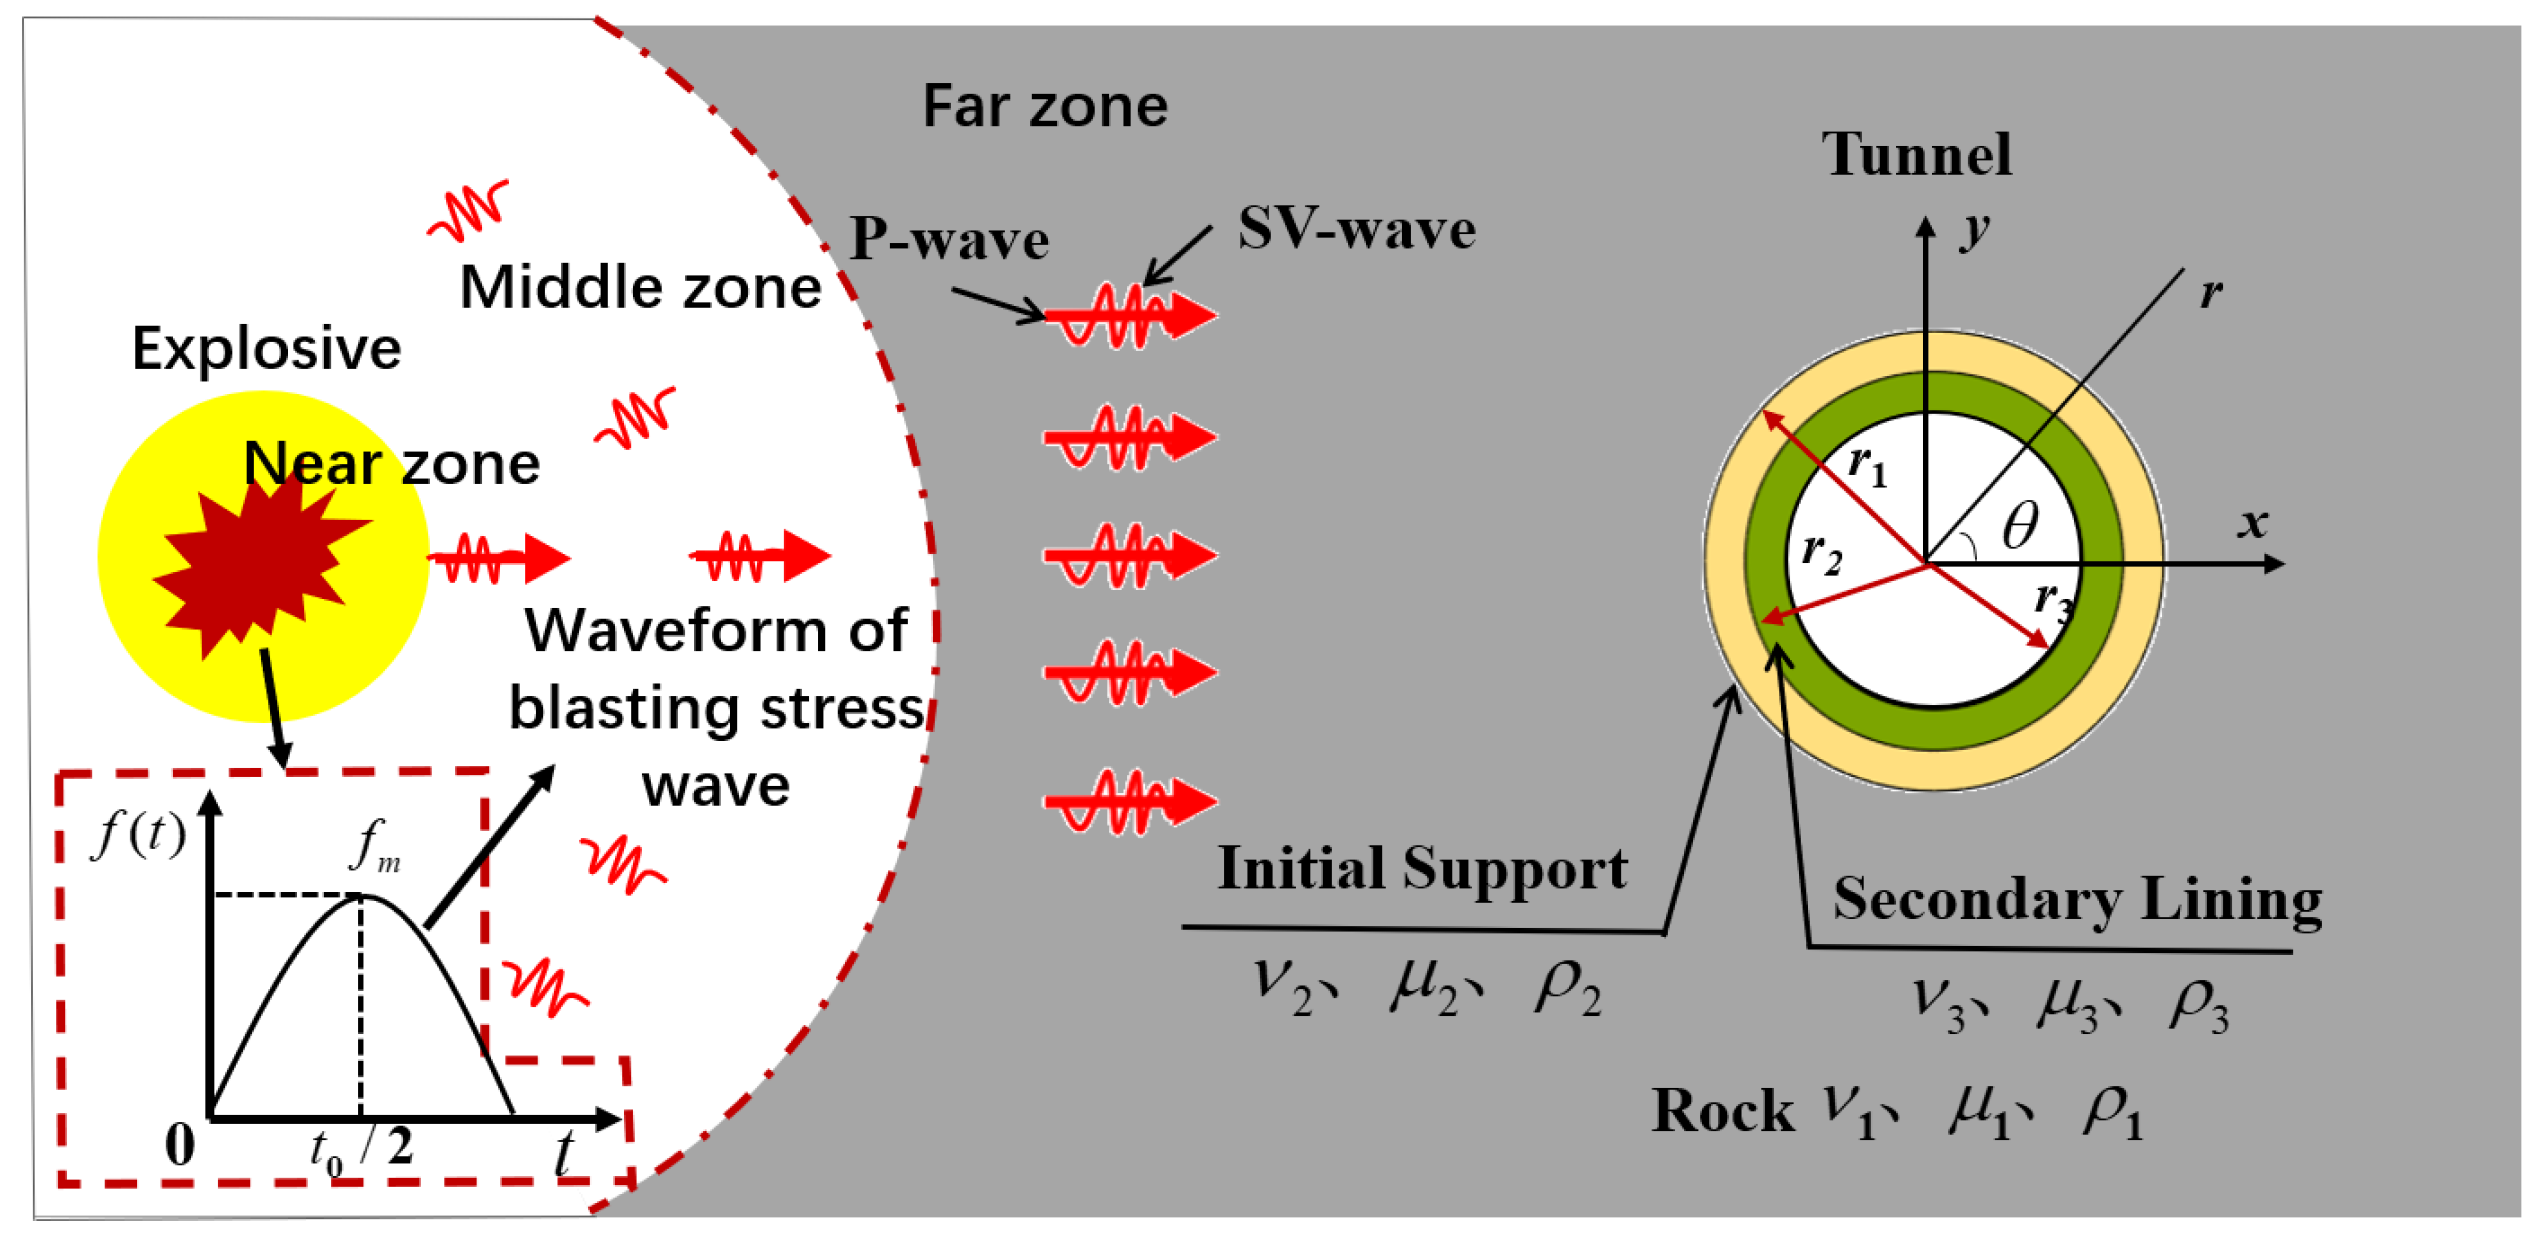
Within a certain distance, the seismic waves generated by explosives in rock can be approximated as plane harmonic waves. Given that the incident planar P- or SV-waves travel orthogonally to the tunnel’s longitudinal axis, the problem simplifies to a plane strain state. Referring to the geometric model in Figure 1, the spatial domain is mapped using both Cartesian (x, y) and polar (θ, r) coordinate systems. Herein, r2 and r3 define the outer and inner boundaries of the primary support, while r1 marks the outer radius of the secondary lining. The material variables μ , ρ , and v represent the shear modulus, mass density, and Poisson’s ratio for the surrounding rock (subscript 1), primary support (subscript 2), and secondary lining (subscript 3). During blasting, the seismic waves are incredibly complex in the time domain. To simplify the theoretical calculations, these waves are approximated as half-sine waves, as depicted in Figure 1. Given that any transient response can be mathematically decomposed into a superposition of multi-frequency harmonic components, we first formulate the steady-state analytical solutions for the tunnel under harmonic excitations.

2.2. Wave Field Analysis

Based on the Helmholtz decomposition theorem, the displacement field in the elastodynamic Navier-Cauchy equations can be decoupled into a scalar potential φ (representing the irrotational compressional waves) and a vector potential ψ (representing the equivoluminal shear waves). To satisfy the circular boundary conditions of the composite tunnel, the incident plane waves must be transformed from Cartesian coordinates into cylindrical wave functions. Utilizing the Jacobi–Anger expansion identity, the foundational incident potentials in polar coordinates are defined as follows:
φ ( j ) ( i ) = 0 , for   SV   waves φ 0 n = 0 ε n i n J n ( α 1 r ) cos n θ   e i ω t , for   P   waves
ψ ( j ) ( i ) = φ 0 n = 0 ε n i n J n ( β 1 r ) sin n θ   e i ω t , for   SV   waves 0 , for   P   waves
where φ 0 represents the incident excitation amplitude, while α 1 and β 1 correspond to the longitudinal and transverse wavenumbers, respectively. The parameter ω denotes the circular frequency of the excitation, and J n ( ) is the n -order Bessel function of the first kind. The Neumann factor ε n is specified as ε n = 1 for n = 0 and ε n = 2 for n 1 . For the incident wave fields φ ( j ) ( i ) and ψ ( j ) ( i ) , the superscripts denote the incident wave field. At the same time, the subscript j = p denotes the P-wave incident potential function, and j = SV denotes the SV-wave incident potential function.
The passage of P- or SV-waves across the boundary separating the surrounding rock and the primary lining induces reflected longitudinal and transverse wave fields. Their corresponding potential functions are expressed as:
φ r = n = 0 A n H n ( 1 ) ( α 1 r ) cos ( n θ ) e i ω t ψ r = n = 0 B n H n ( 1 ) ( β 1 r ) sin ( n θ ) e i ω t
Consequently, the superimposed wave field within the hosting rock mass is formulated as follows:
φ 1 = φ ( j ) ( i ) + φ r ψ 1 = ψ ( j ) ( i ) + ψ r
In a similar manner, the comprehensive potential fields within the secondary lining and the primary support layers are defined respectively as follows:
φ 2 = n = 0 C n H n ( 1 ) ( α 2 r ) + D n H n ( 2 ) ( α 2 r ) cos n θ ψ 2 = n = 0 F n H n ( 1 ) ( β 2 r ) + G n H n ( 2 ) ( β 2 r ) sin n θ φ 3 = n = 0 K n H n ( 1 ) ( α 3 r ) + L n H n ( 2 ) ( α 3 r ) cos n θ ψ 3 = n = 0 M n H n ( 1 ) ( β 3 r ) + N n H n ( 2 ) ( β 3 r ) sin n θ
where α m and β m denote the compressible and shear wavenumbers, where the subscript m = 1 , 2 , 3 designates the hosting rock, the secondary lining, and the primary support, respectively. The terms H n ( 1 ) ( ) and H n ( 2 ) ( ) represent the n -th order Hankel functions of the first and second kind, respectively, while A n N n constitute the set of undetermined expansion coefficients.

2.3. Steady-State Response

The governing equations defining the dynamic displacement and stress fields within the respective domains under the excitation of incident P- or SV-waves are formulated as follows:
u r = φ r + 1 r ψ θ u θ = 1 r φ θ ψ r σ r r = λ 2 φ + 2 μ 2 φ r 2 + r 1 r ψ θ σ θ θ = λ 2 φ + 2 μ 1 r φ r + 1 r 2 φ θ 2 + 1 r 1 r ψ θ r θ σ r θ = 2 μ 1 r 2 φ r θ 1 r 2 φ θ + μ 1 r 2 2 ψ θ 2 r r 1 r ψ r
where 2 φ = 2 φ r 2 + 1 r φ r + 1 r 2 2 φ θ 2 defines the Laplace operator in polar coordinates; u r and u θ represent the radial and circumferential displacements, respectively; σ r r , σ θ θ , and σ r θ denote the respective components of radial, circumferential, and shear dynamic stresses; and λ and μ symbolize the Lamé constants of the respective medium.
Based on the displacement and traction continuity requirements at the interface linking the hosting rock and the primary support ( r = r 1 ), the corresponding boundary conditions are established as:
σ r r ( 2 ) = σ r r ( 1 ) ,         σ r θ ( 2 ) = σ r θ ( 1 ) u r ( 2 ) = u r ( 1 ) ,         u θ ( 2 ) = u θ ( 1 )
Similarly, at r = r 2 :
σ r r ( 3 ) = σ r r ( 2 ) ,         σ r θ ( 3 ) = σ r θ ( 2 ) u r ( 3 ) = u r ( 2 ) ,         u θ ( 3 ) = u θ ( 2 )
Furthermore, at the internal boundary of the tunnel ( r = r 3 ), the traction-free boundary conditions are formulated as:
σ r r ( 3 ) = 0 ,         σ r θ ( 3 ) = 0
Equations (4) and (5) are substituted into Equation (6), and then the resulting displacement–stress expressions in Equations (7)–(9) are used to derive the following matrix equation:
A i j X i = B j , i , j = 1 , 2 , ...10
where { X i } = [ A n , B n , C n , D n , F n , G n , K n , L n , M n , N n ] T is the column vector containing the 10 sets of unknown infinite expansion coefficients across the three media, [ A i j ] is a 10 × 10 complex coefficient matrix populated by Hankel and Bessel functions governed by the geometric and physical parameters of the structural layers, and { B j } is the load vector generated by the incident wave potentials. The specific expressions for these matrix elements are detailed in Appendix A. The system of linear equations is solved analytically in Matlab2023a for each truncation order n . To ensure exact mapping to the subsequent transient convolution, the calculation process for these wave coefficients is executed directly without applying normalization. By solving this matrix system, the undetermined expansion coefficients are uniquely determined.
D S C F = σ θ θ * = σ θ θ / σ 0
where σ 0 = μ β 1 2 φ 0 denotes the peak initial stress amplitude within the continuous medium induced by the incident wave in the absence of the tunnel structure [24]. Although computing all five displacement and stress components is required to satisfy boundary conditions, our analysis focuses on the DSCF. Because the inner lining ( r = r 3 ) is traction-free ( σ r r = σ r θ = 0 ), the hoop stress σ θ θ dominates, making DSCF the primary metric for evaluating seismic structural damage.

3. Evaluation of Transient Dynamic Responses

To bridge the gap between the aforementioned harmonic solutions and the instantaneous shock environments typical of blasting operations, spectral decomposition is employed. The transient blast load is transformed into the frequency domain via the Fourier method, allowing the overall transient response of the composite-lined tunnel to be derived through the integration of these individual harmonic solutions:
g ( x i , t ) = 1 2 π + χ ( x i , ω ) F ( ω ) e i ω t d ω
where χ ( x i , ω ) represents the steady-state frequency response function (admittance). This function is fundamentally determined by substituting the uniquely solved expansion coefficients from Equation (10) back into the dynamic stress formulations (Equation (11)) for a given angular frequency ω under a unit amplitude harmonic excitation. Furthermore, F ( ω ) is the Fourier spectrum of the source disturbance.
Based on the previous literature [34], and to maintain strict dimensional consistency within our non-dimensionalized analytical framework, the transient blast load is defined as a function of the dimensionless time τ :
f ( τ ) = sin ( π τ τ 0 ) , 0 τ < τ 0 0 , τ τ 0
In the computational model presented in Figure 1, the temporal origin (t = 0) is defined exactly when the incident wavefront impinges upon the primary support’s external boundary (r = r1). To generalize the analysis, the elapsed physical time t is non-dimensionalized as τ :
τ = c p 1 t / r 1
where c p 1 denotes the P-wave velocity of the surrounding rock mass. Within this framework, τ 0 in Equation (13) explicitly denotes the dimensionless duration of the half-sine blasting pulse. To characterize the actual physical process, the real (dimensional) blast duration t 0 (unit: s) is introduced, which is mathematically linked to the dimensionless duration via τ 0 = c p 1 t 0 / r 1 . Consequently, τ 0 fundamentally dictates the loading and unloading rates of the transient disturbance. To systematically investigate how the blast load characteristics impact structural responses, this dimensionless pulse duration τ 0 is selected as the primary control parameter varied across all computational cases.
By incorporating the Dirac delta function δ ( t ) and the Heaviside step function, the integration process is simplified [34]. Introducing the impulse excitation into the inverse Fourier transform yields the unit impulse response g δ ( x i , t ) , which can then be temporally integrated upon the wave’s arrival at the primary support boundary to define the unit step response g h ( x i , t ) as follows:
g h ( x i , t ) = 2 π 0 χ ( x i , ω ) ω sin ( ω t ) d ω
According to the Duhamel integral, the dynamic response to any input function can be expressed as
g ( x i , t ) = f ( 0 ) g h ( t ) + 0 t f ( ξ ) g h ( t ξ ) d ξ
where ξ is introduced as a dummy integration variable for physical time to avoid notational conflict with the dimensionless time τ .
Ultimately, substituting the half-sine pulse excitation from Equation (13) along with the integrated step response into the convolution framework of Equation (16) yields the explicit time-history analytical solution for the transient dynamic response around the composite-lined tunnel:
g ( x i , τ ) = 2 π τ 0 0 χ ( x i , ω ) ( 1 cos ω τ ) ω 2 d ω , 0 τ < τ 0 2 π τ 0 0 χ ( x i , ω ) [ cos ω ( τ τ 0 ) cos ω τ ] ω 2 d ω , τ τ 0
Theoretically, the steady-state response χ ( x , ω ) of a compound-lined tunnel can be calculated theoretically by Equation (11). However, since the expression of the analytical solution is difficult to obtain, it becomes complicated to integrate Equation (17) directly. Therefore, the trapezoidal quadrature method [24,25] is used to approximate these analytical solutions. The transient dynamic response is efficiently solved using the trapezoidal quadrature rule. First, the steady-state real parts are evaluated at discrete wavenumbers via Equation (11) to construct individual trapezoidal sub-responses. These components are then sequentially integrated and superposed to determine the total time-history response.
To ensure reproducibility, the computational implementation is detailed as follows. The 10 × 10 boundary condition matrices are solved directly in MATLAB, strictly avoiding any intermediate normalization during wave coefficient calculations to preserve exact physical scaling. For the wave function expansions, a truncation order of n = 20 is adopted. Because the transient dynamic response is derived via the inverse Fourier transform rather than a time-marching method, accuracy is governed by the frequency domain discretization. To strictly prevent aliasing artifacts and ensure complete convergence, the numerical integration is conducted with a fine frequency step of Δ ω = 0.01 and an upper limit of ω m a x = 250 Hz. Finally, all subsequent data visualizations are generated using the origin.

4. Calculation Results and Analysis

4.1. Model Validation

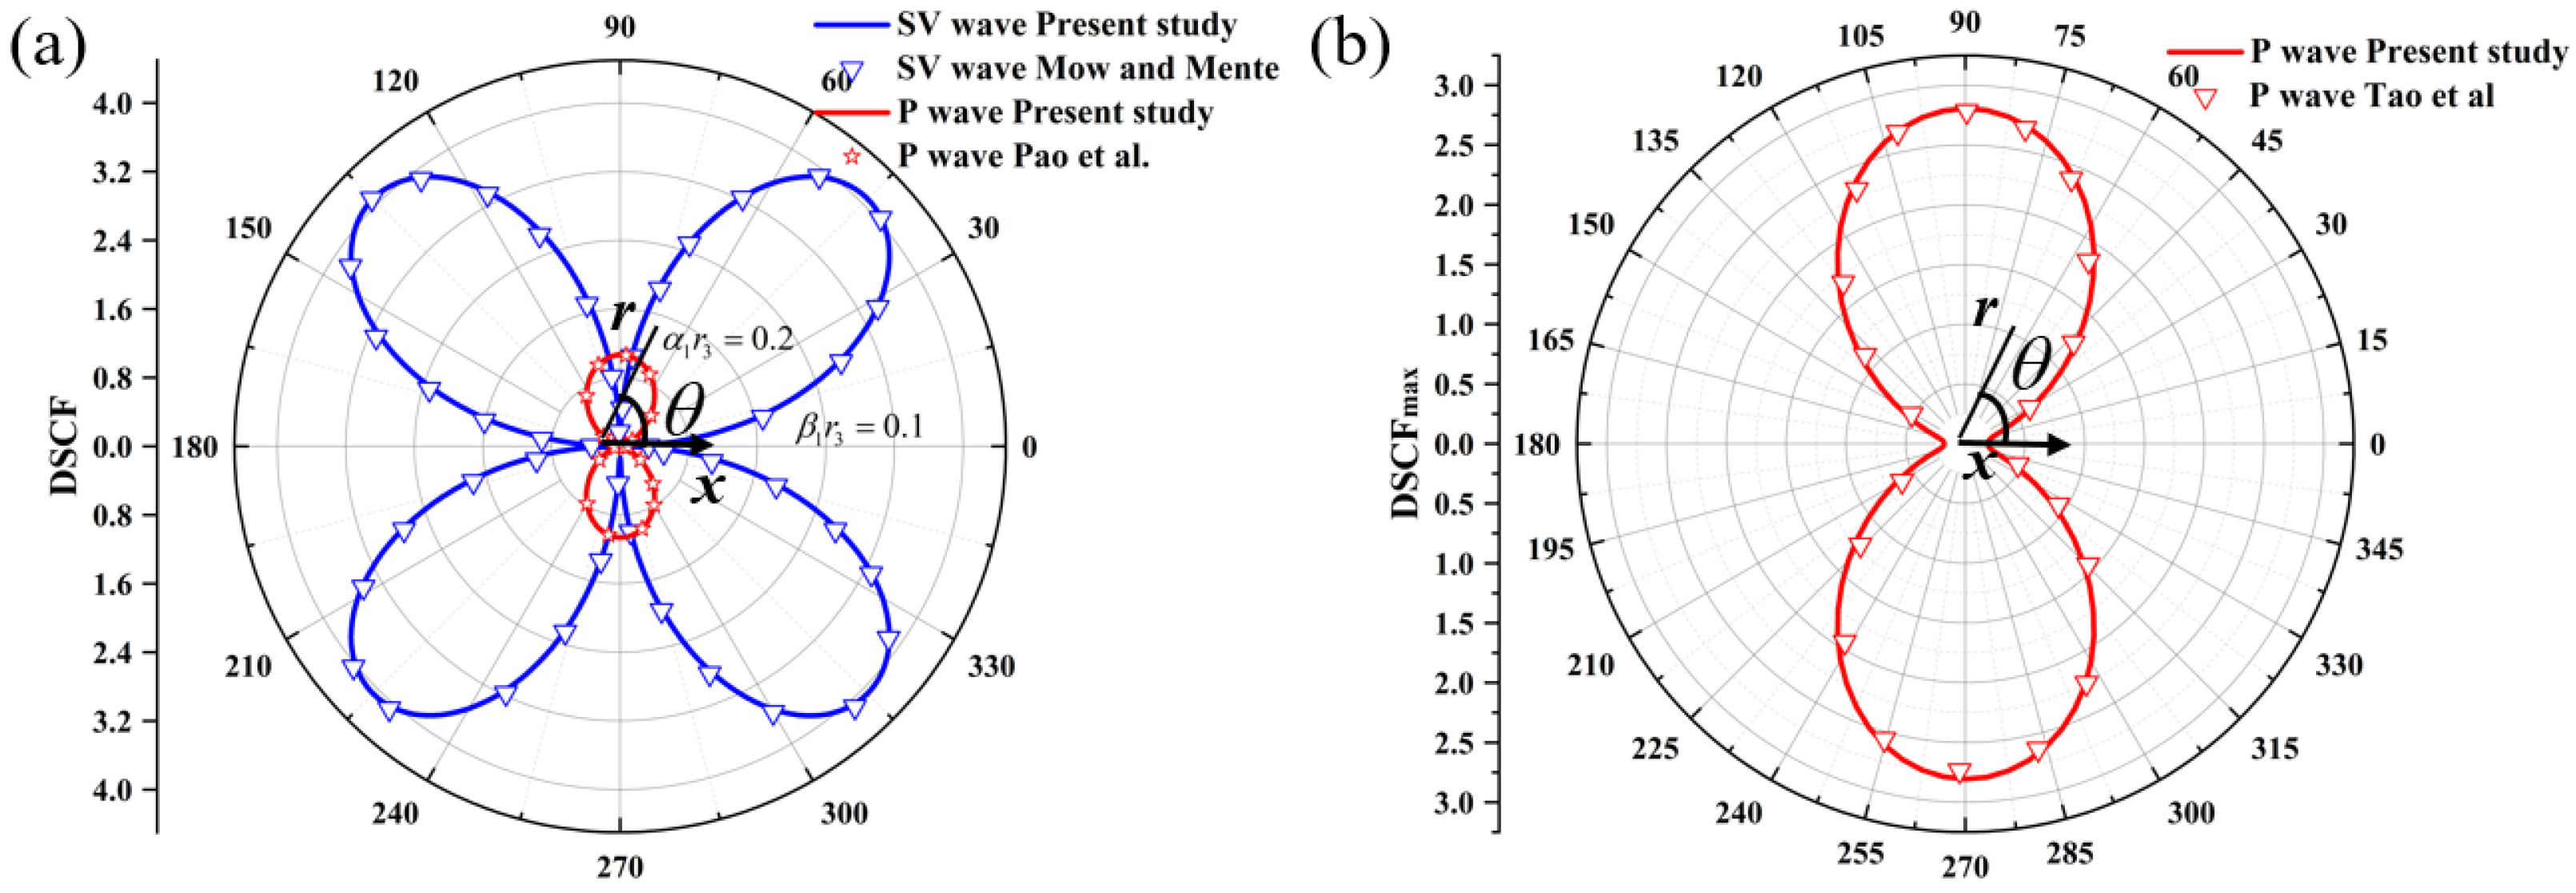
To evaluate the reliability of the proposed transient analytical framework, the present solutions are benchmarked against the established findings from the literature [10,34,35]. First, a steady-state boundary validation is performed by considering a limiting scenario where the thickness of the secondary lining approaches zero. By maintaining all remaining parameters identical to those in references [10,34,35], the computed curves exhibit excellent agreement, as depicted in Figure 2a. Furthermore, to verify the precision of the trapezoidal quadrature numerical scheme, the multi-layered model is degenerated into a classic unlined circular cavity. Under this configuration, the physical inputs are configured to match the parameters in the literature [34], and the corresponding comparisons demonstrate a close correlation in Figure 2b. Consequently, the developed theoretical framework is fully validated and deemed suitable for investigating the transient dynamic responses of the “host rock–primary support–secondary lining” composite structure.

4.2. Parameter Analysis

To verify the practical applicability and engineering design reference value of the proposed analytical framework, the Hongshan South Road Tunnel project is adopted as a case study. By employing its actual geometric and physical material parameters, the theoretical analysis is extended to validate the actual response of composite linings subjected to blast-induced waves. The Hongshan South Road Tunnel complex is excavated utilizing the drill-and-blast method. The ensuing blasting-induced seismic waves pose a potential dynamic threat to the operational safety of the overlying subway system, given the close proximity of approximately 5 m between the two structures. In the current analytical model, the internal radius of the secondary lining (r3) is designated as 5 m. The comprehensive geometric dimensions and physical material properties of the tunnel are detailed in Table 1 [2], where the bracketed figures indicate the defined variation ranges for the computational parameters.
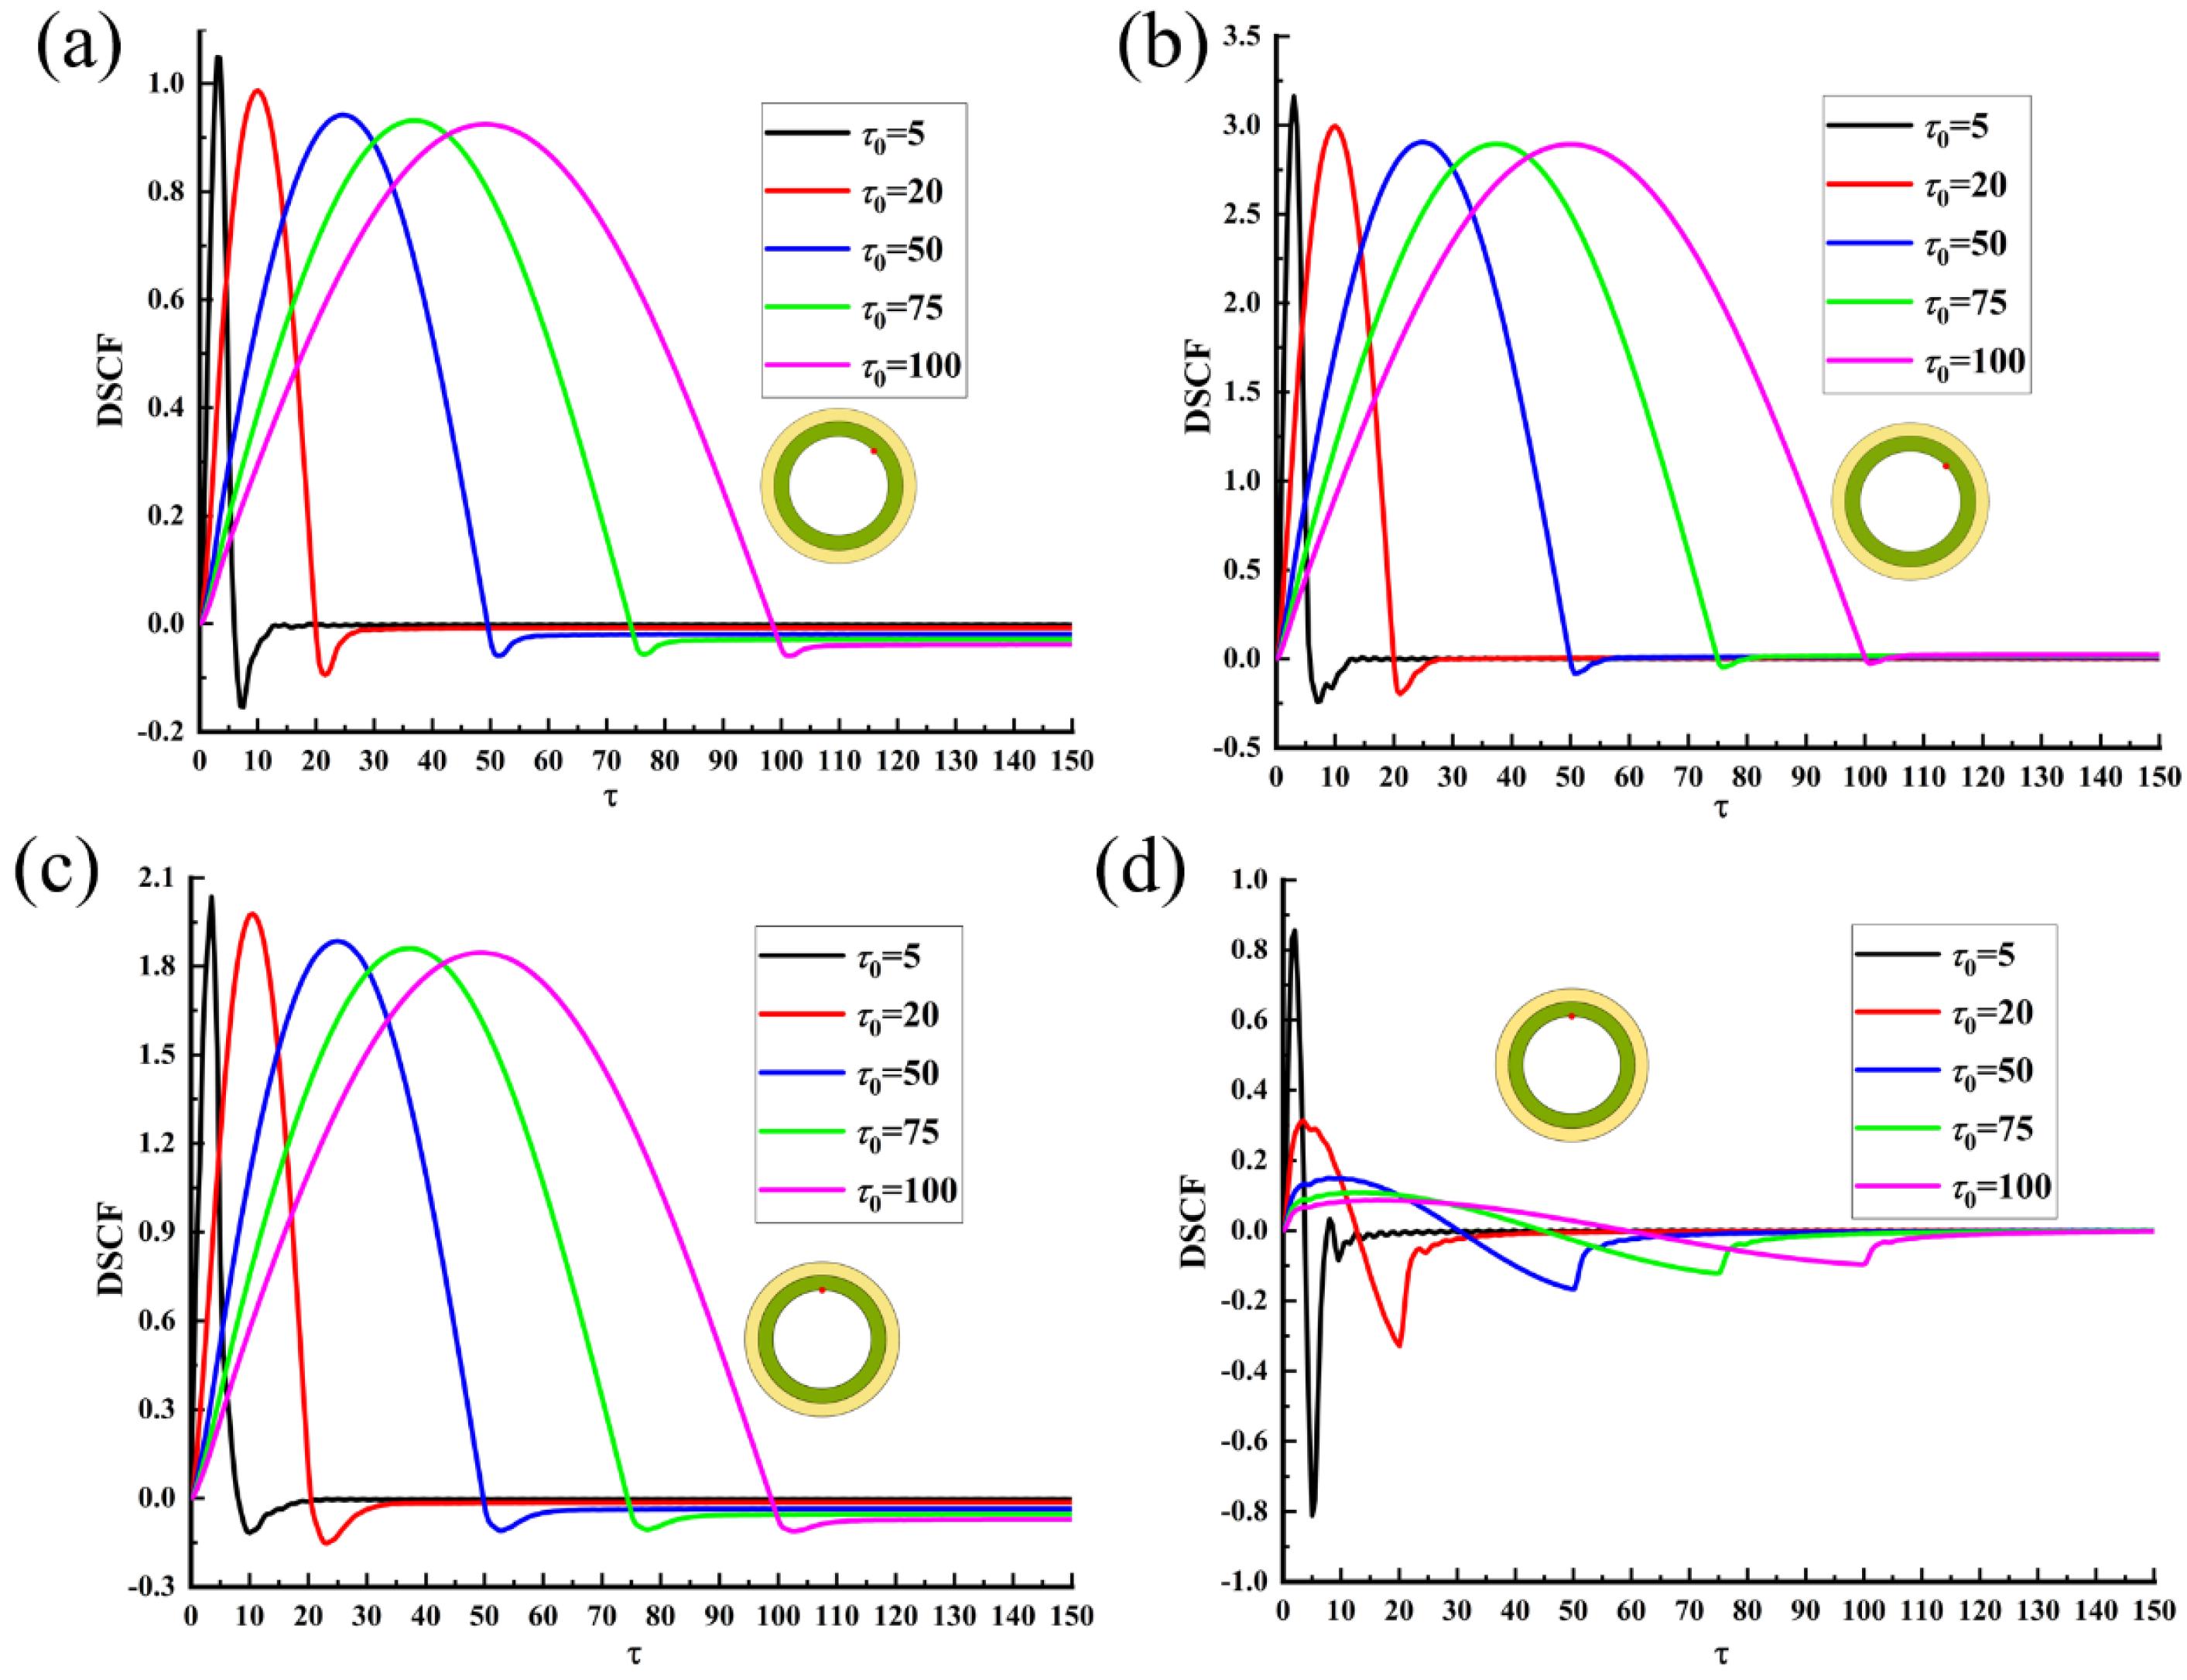
To illustrate how the dimensionless pulse duration governs the structural response, the transient DSCF variations over time at designated locations [e.g., θ = π / 2   and   π / 4 ] under both P- and SV-wave impacts are plotted in Figure 3. The DSCF rapidly rose to a positive peak, swiftly fell to a negative value, and finally returned to zero. This phenomenon demonstrates that during the scattering of the transient incident wave around the lining, the structural response undergoes a distinct stress inversion, transitioning from peak compressive states to severe tensile stresses. The DSCF was negatively correlated with the pulse duration under both transient P-wave and SV-wave effects. Shorter pulse durations produced higher DSCF peaks because they caused faster loading and unloading of the blast load, resulting in more intense and localized transient responses within the structure. At position θ = π / 4 , the DSCF under SV-wave effects was three times greater than that under P-wave effects. Conversely, at positions θ = π / 2 , the DSCF under P-wave effects was significantly higher than that under SV-wave effects. Notably, for extremely short incident pulses (e.g., τ 0 = 5 ), the curves exhibit rapid, high-frequency oscillations. This is a physical manifestation of intense multi-path diffraction and repeated wave reflections trapped within the boundaries of the composite lining due to the high-frequency nature of the excitation, rather than a numerical instability. Conversely, longer pulse durations induce slower loading and unloading phases, yielding noticeably smoother response curves.
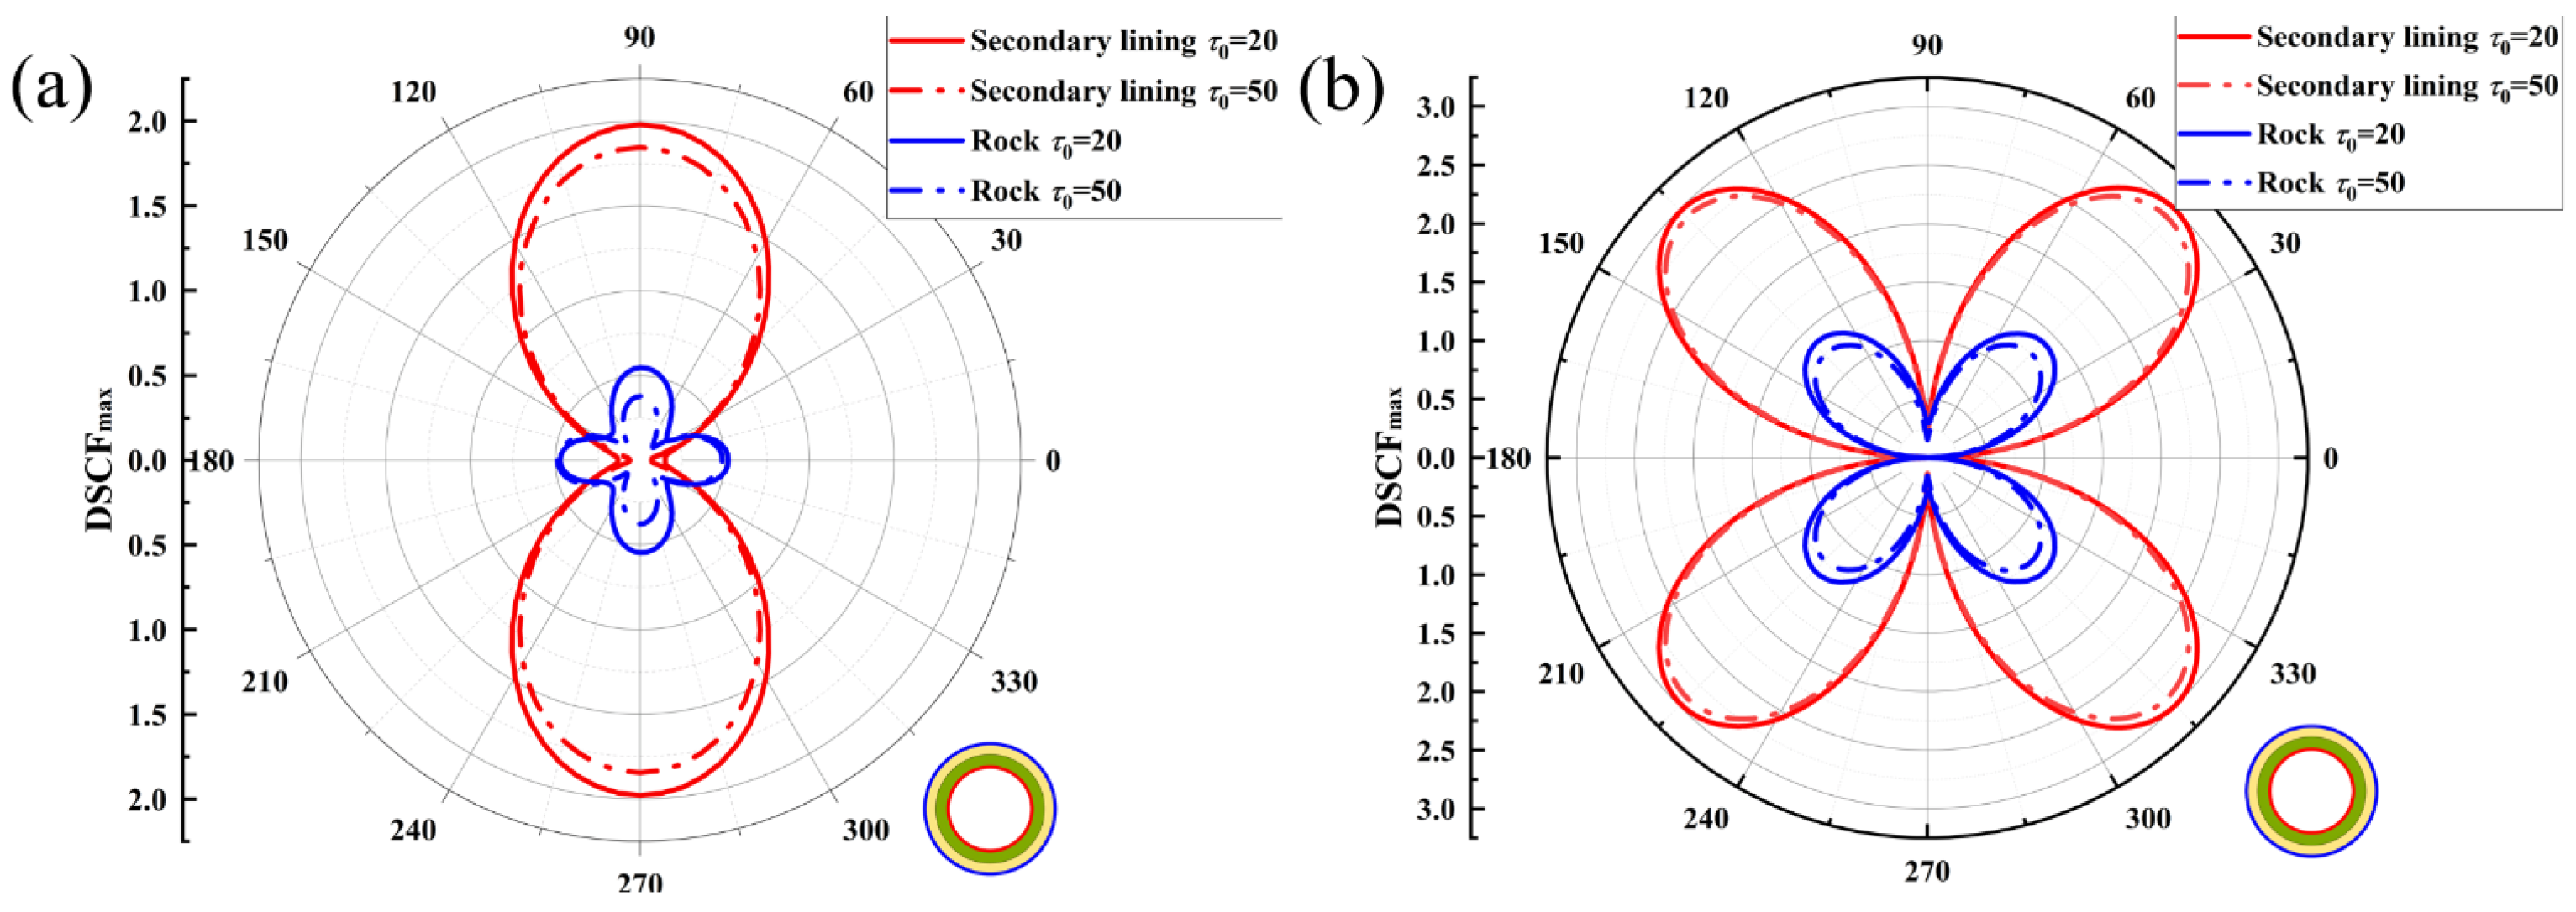
The parametric analyses focus on the outer boundary r = r1 and the inner free surface r = r3—the two physical ex-tremes representing initial wave–structure interaction and peak stress concentration, respectively. The intermedi-ate interface r = r2 is omitted from the line plots for clarity, but its behavior is fully captured in the corresponding spatial cloud diagrams. To illustrate the DSCF of the lining and surrounding rock under blasting P-wave and SV-wave effects, dimensionless pulse durations of τ 0 = 20 and 50 were used to determine the distribution patterns of the DSCFmax at various locations on the surrounding rock (blue) and the inner lining (red). As illustrated in Figure 4, the blue and red contours delineate the spatial responses of the hosting rock and the secondary lining, respectively. The circumferential distribution of the DSCFmax exhibits pronounced symmetry for both structural domains. Furthermore, an increase in the pulse duration noticeably attenuates the peak response magnitude of the dynamic stresses. Under P-wave effects, the peak DSCFmax values on the inner lining occurred around 90° and 270°, perpendicular to the direction of incidence, while the values along the direction of incidence were close to zero. In contrast, the distribution curve for the surrounding rock approximated a cloverleaf pattern, with four local maxima located approximately at 0°, 90°, 180°, and 270°. Therefore, monitoring the stress concentration and potential damage at the tunnel lining’s crown and invert is crucial. The maximum DSCFmax values in Figure 4a,b were compared, and the latter showed 1.4-times-greater values on the inner lining and three-times-greater values on the surrounding rock. This was because shear waves, with their transverse vibration characteristics and higher energy transfer efficiency, caused more significant damage to underground structures than longitudinal waves.

4.3. Lining Parameter Optimization Study

To establish a rigorous framework for structural optimization, it is imperative to quantify the sensitivity of the transient dynamic fields to the intrinsic layout of the tunnel lining. In this section, the material stiffness (quantified by the shear modulus ratio) and the geometric constraints (governed by the structural thickness) are selected as the primary design coordinates. By systematically mapping their multi-parametric variations, the modulation mechanisms governing the DSCFmax across the hosting rock and the inner lining boundaries are thoroughly elucidated. This evaluation isolates the dominant physical drivers of the transient wave diffraction, thereby providing crucial theoretical benchmarks for the seismic isolation engineering and structural design of multi-layered tunnels. For clarity, blue and red curves represent DSCFmax at the surrounding rock’s outer boundary and the secondary lining’s inner surface, respectively, while squares, circles, triangles, and stars indicate dimensionless pulse durations of τ0 = 10, 20, 30, and 50.
(1)
Lining Shear Modulus
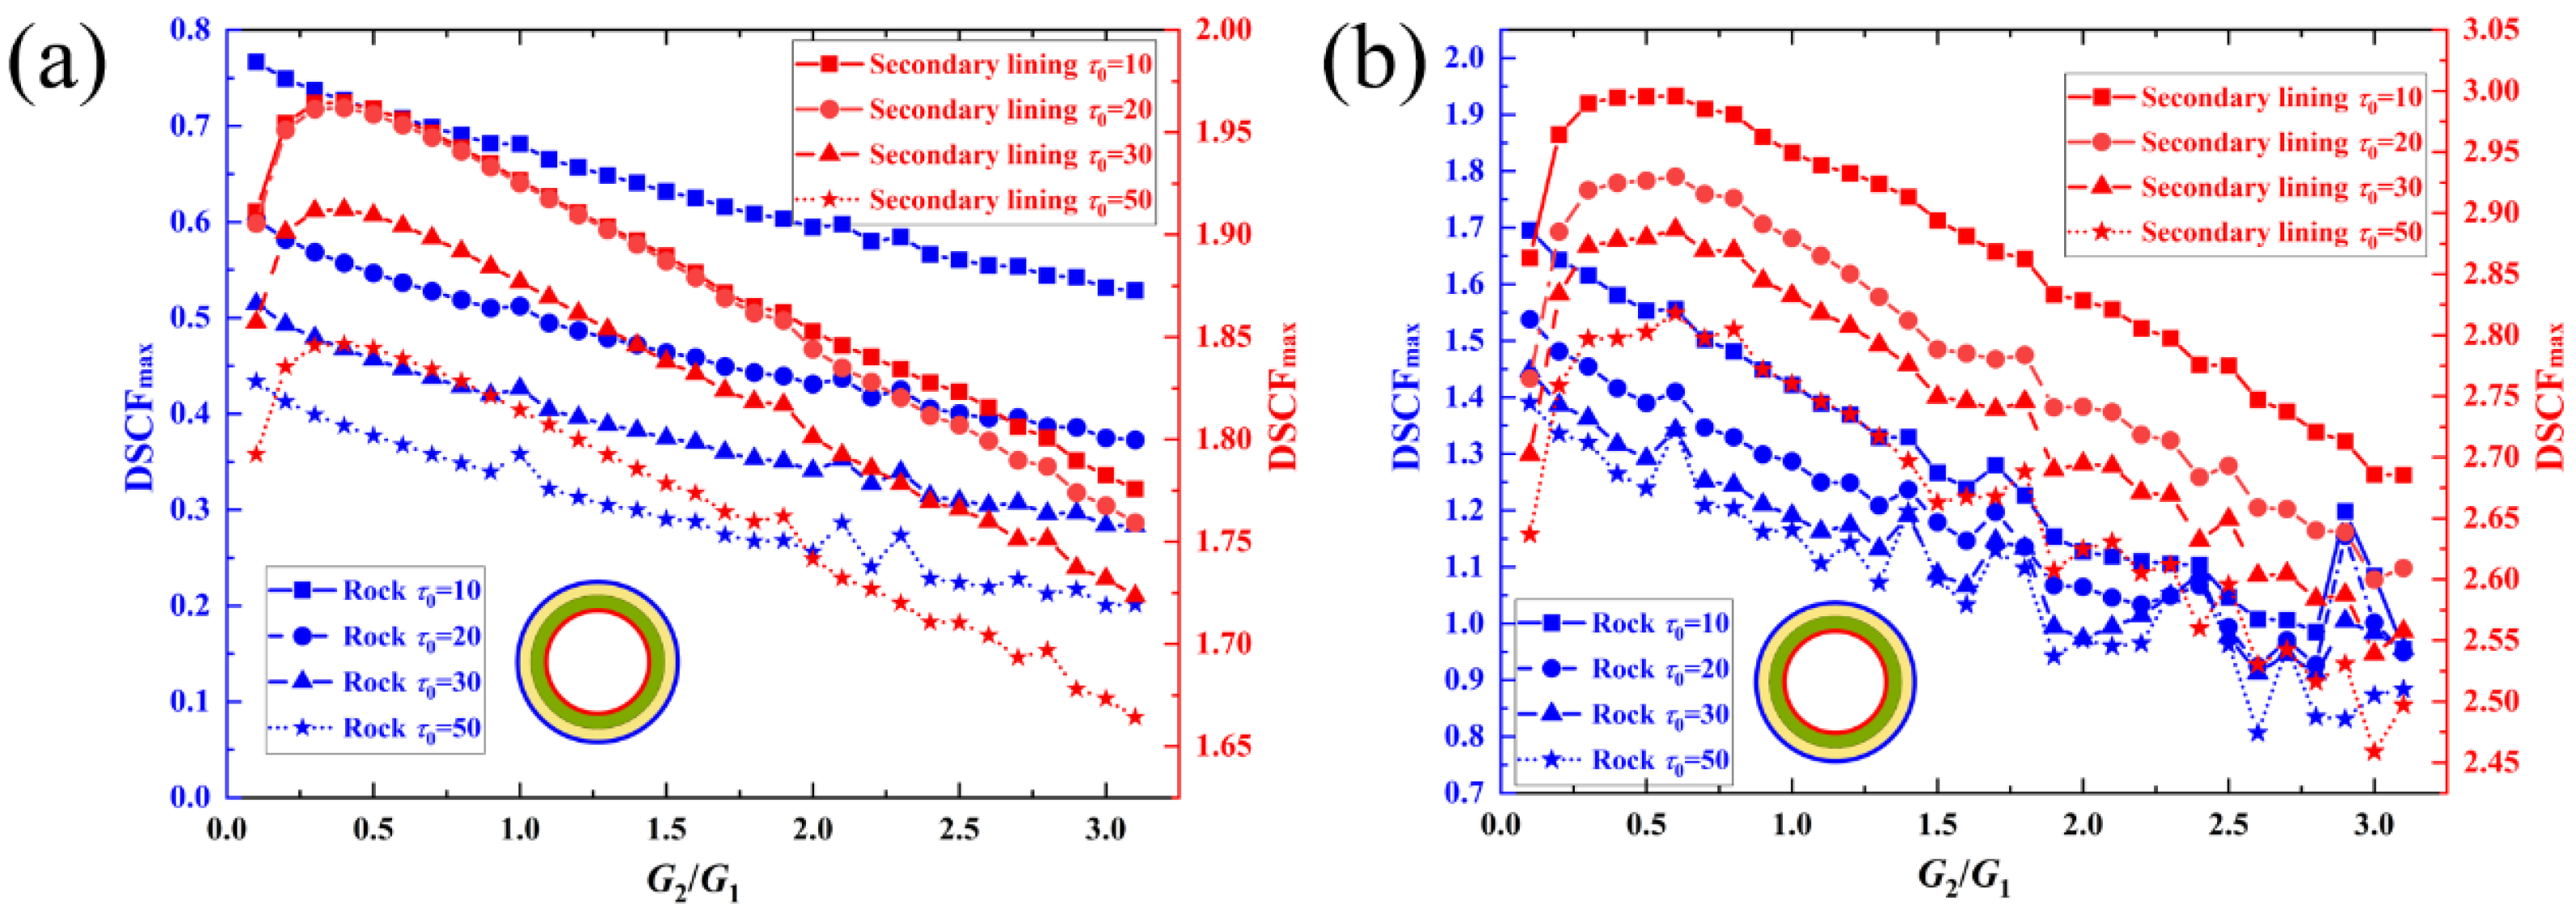
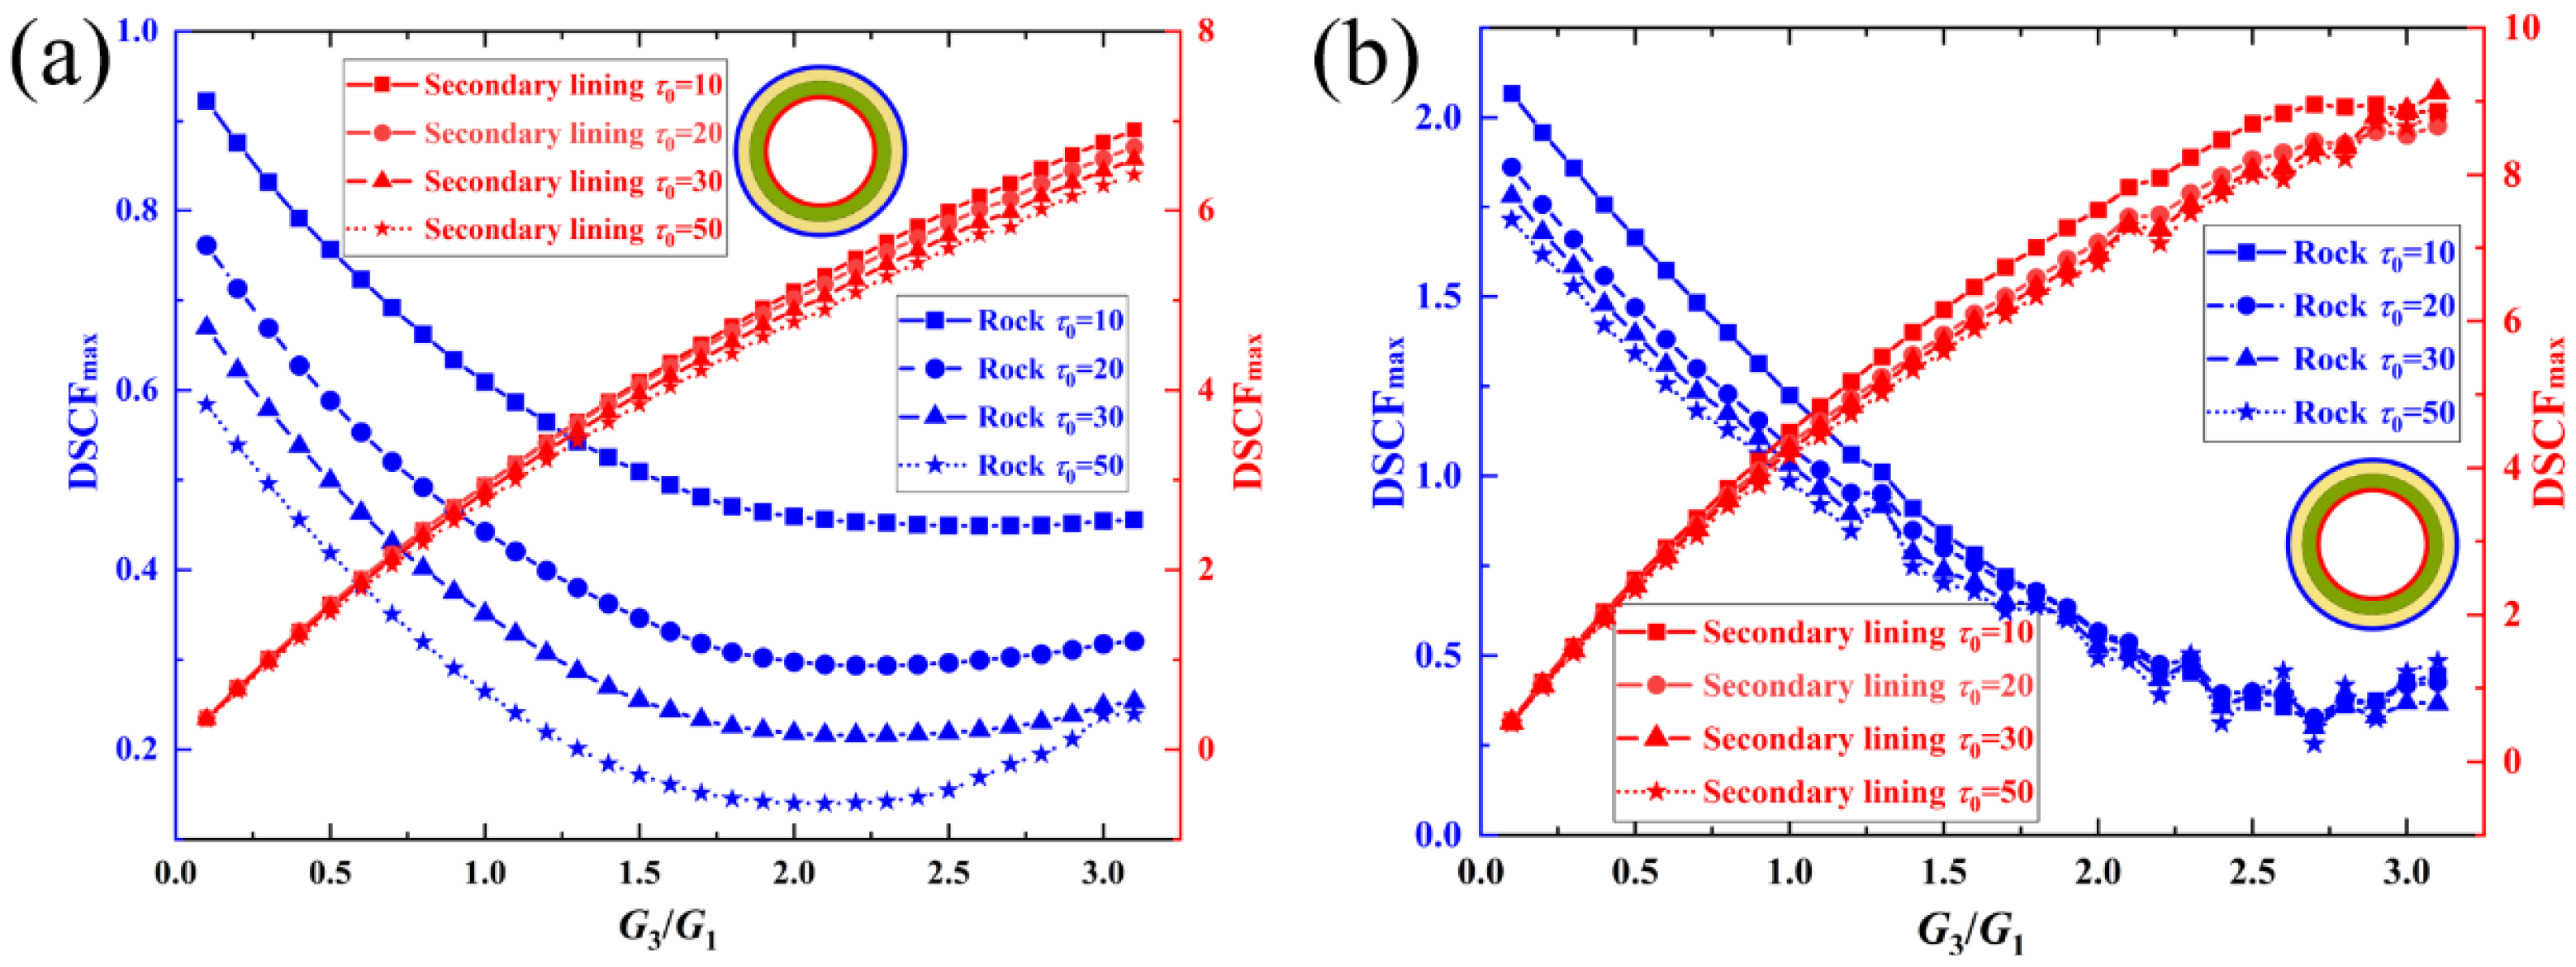
This section quantifies the sensitivity of the peak dynamic stress concentrations to the elasticity contrasts of the primary support and secondary lining, elucidating how the relative stiffness of each structural layer modulates the DSCFmax within the hosting rock and lining layout. Within the illustrated graphs, the stiffness mismatches between the lining layers and the geological medium are scaled by G2/G1 (primary support-to-rock shear modulus ratio) and G3/G1 (secondary lining-to-rock shear modulus ratio). All other parameters remained consistent with those in the previous section. As shown in Figure 5, under the transient P-wave and SV-wave effects, the impact of G2/G1 of the surrounding rock on DSCFmax followed a consistent trend: it initially increased and then decreased for the inner lining, while it decreased for the surrounding rock. Elevated modulus ratios exacerbate the high-frequency fluctuations under transient SV-wave impacts. This phenomenon is attributed to the augmented shear wave velocity within high-stiffness domains, which accelerates the energy flux accumulation and intensifies localized dynamic stress gradients, ultimately inducing pronounced oscillatory behaviors. For example, with a pulse duration τ 0 = 20 , increasing G2/G1 reduced DSCFmax in the surrounding rock by 38.1% and in the lining by 10.1% under transient P-wave effects and by 37.8% and 11.3%, respectively, under transient shear wave effects. As plotted in Figure 6, as the stiffness ratio G3/G1 increases, the DSCFmax of the surrounding rock exhibits a non-monotonic evolution characterized by an initial attenuation followed by a subsequent rebound. Conversely, the peak dynamic response within the lining structure undergoes a continuous monotonic amplification. The pulse duration significantly impacted DSCFmax in the surrounding rock. For instance, with a pulse duration τ 0 = 20 , increasing G3/G1 reduced DSCFmax in the surrounding rock by 61.4% and increased it in the lining 18 times under transient P-wave effects, whereas it reduced DSCFmax by 77.5% in the surrounding rock and increased it 14.9 times in the lining under transient SV-wave effects.
(2)
Lining Thickness
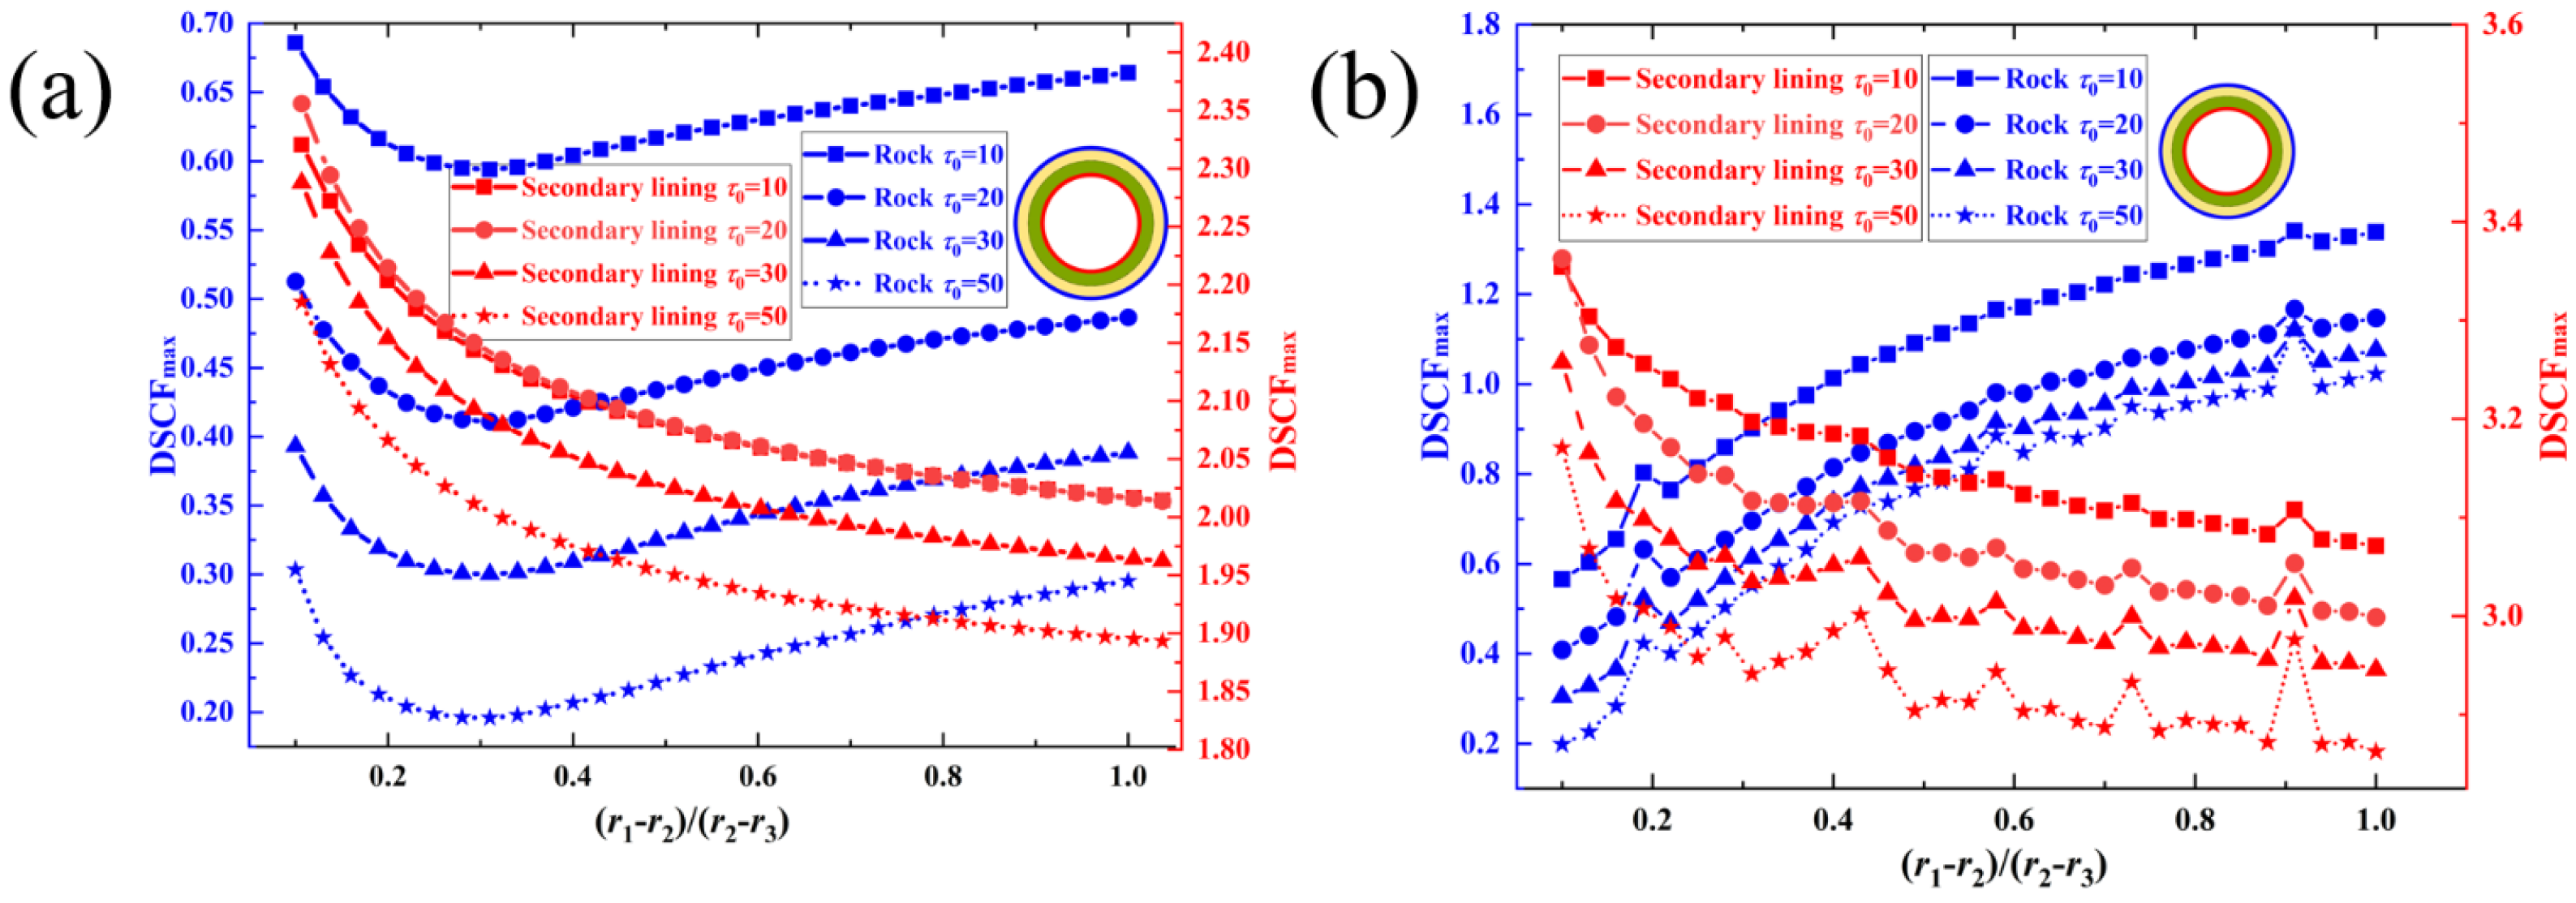
Assuming all other variables remain constant, this research investigated how the primary support to secondary lining thickness ratio, denoted as (r1r2)/(r2r3), influences the DSCFmax within both the adjacent rock mass and the lining structure. As illustrated in Figure 7, this ratio exerts a highly uniform influence on the lining’s DSCFmax under the excitation of both transient P-waves and SV-waves. For transient P-wave effects, DSCFmax in the surrounding rock first decreased and then increased, while for transient SV-wave effects, it generally decreased. For variations in thickness, thicker primary supports induce complex multiple reflections and wave mode conversions (SV- to P-waves) at the interfaces. This alters the overall impedance matching of the system, causing the non-linear interference of wave trains that manifests as sharp peaks in the dynamic response. For example, with a wavelength t 0 = 20 , increasing (r1r2)/(r2r3) reduced DSCFmax in the surrounding rock by 19.6% and in the lining by 14.53% under transient P-wave effects, whereas it increased DSCFmax in the surrounding rock by 178.7% and reduced it in the lining by 11.1% under transient SV-wave effects. Overall, the thickness ratio had a more pronounced impact on the surrounding rock.
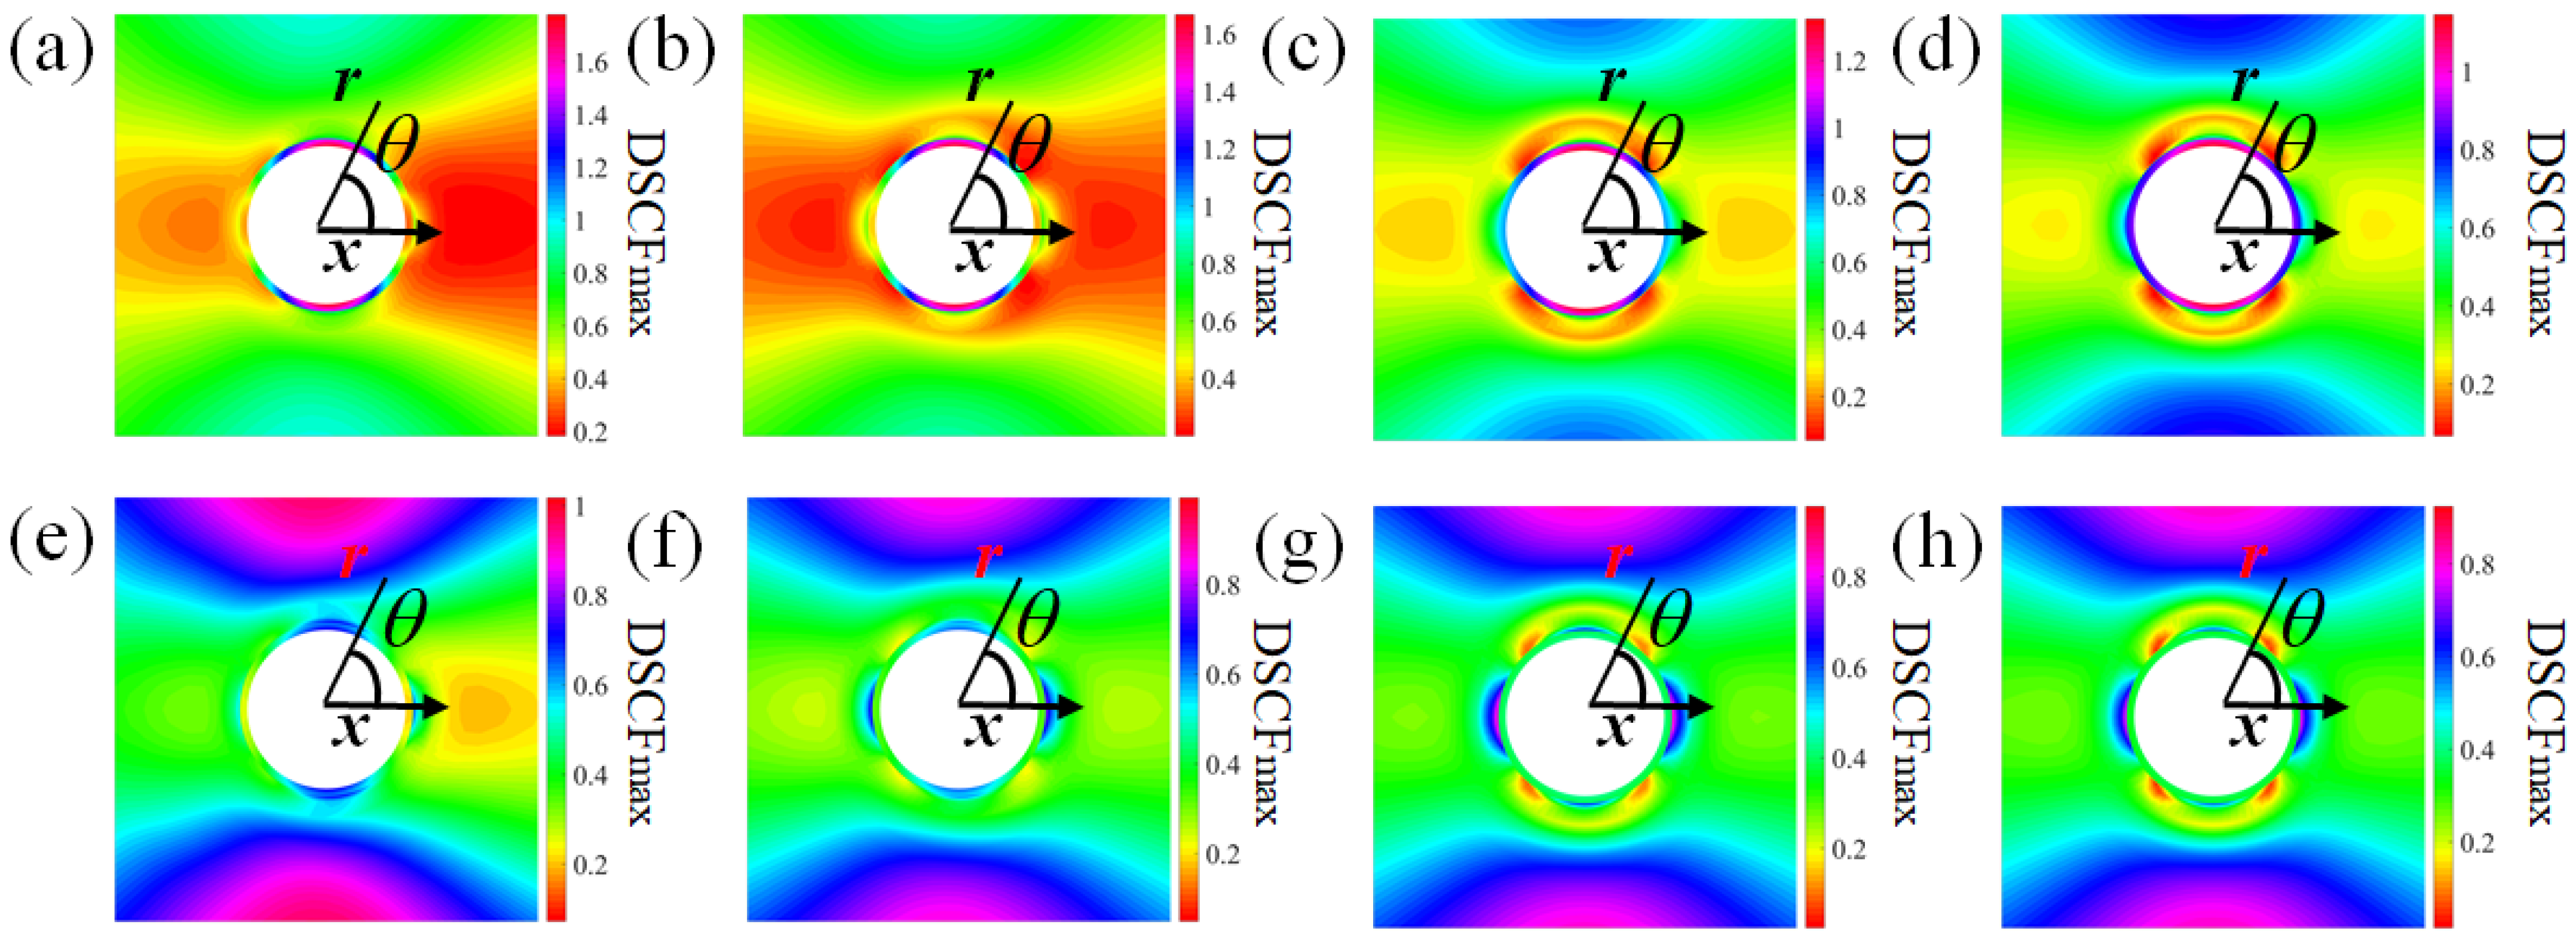
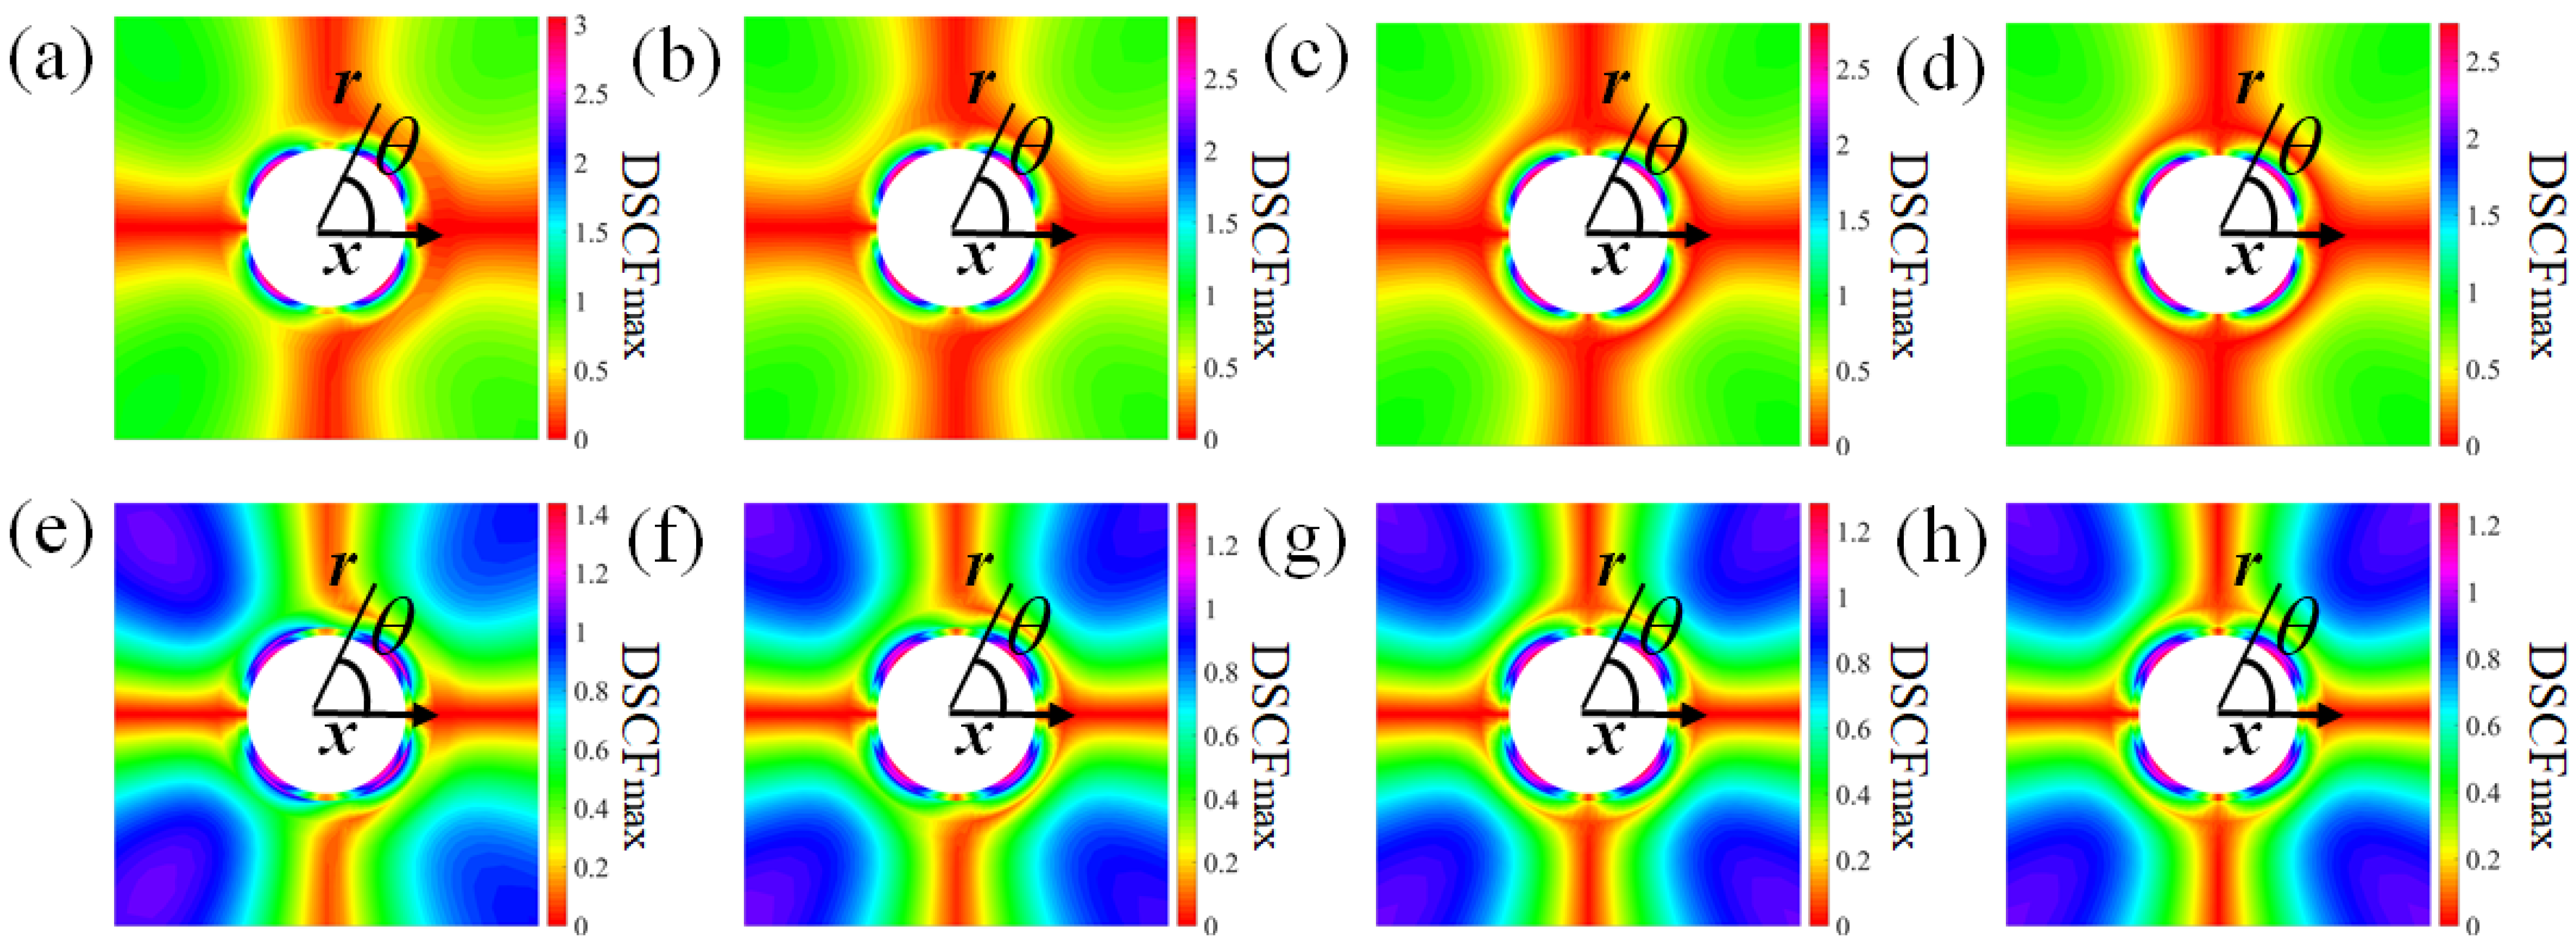
Figure 8 and Figure 9 illustrate the propagation of peak dynamic stress across various media under different incident wave types and pulse durations. The parameters used are consistent with those in Table 1. Because transient SV-waves have a substantial impact on the lining, they were prioritized in the optimization. The optimized parameters were G3/G1 = 0.3, G2/G1 = 3.0, and (r1r2)/(r2r3) = 0.4, with the other parameters remaining the same. Figure 8 demonstrates that under blasting P-wave conditions, the dynamic stress variation extended outward in an arc from the lining–surrounding rock interface. Stress concentration primarily occurred on the lining perpendicular to wave propagation, gradually decreasing along the propagation direction from the lining to the surrounding rock. Under the optimized conditions, the stress concentration shifted to the surrounding rock in the vertical direction, likely due to improved stress distribution in the lining, making stress more uniform in the adjacent rock mass, thereby mitigating stress concentration on the lining structure. With an increase in pulse duration, the stress concentration zones on the lining shifted from the upper and lower extremities towards the lateral sides. Based on the comparison of Figure 9a–d with Figure 9e–h, shorter pulse durations showed a more significant reduction in the dynamic stress concentration, ranging from 44.5% to 20%. Figure 9 shows the dynamic stress distribution under transient SV-wave effects, with consistent patterns before and after optimization. Initially, dynamic stress concentration on the lining formed a cloverleaf pattern at the 45°, 135°, 215°, and 305° directions. As the propagation time increased, the surrounding rock stress extended outward in an arc, with stresses perpendicular and along the propagation direction gradually approaching zero. Based on the comparison of Figure 9a–d with Figure 9e–h, the pulse duration had a minimal effect on the reduction in the dynamic stress concentration, with a reduction of about 55% after optimization. Ultimately, elevating the initial support stiffness alongside decreasing the secondary lining stiffness yielded positive results, successfully reducing the SV-wave to P-wave peak dynamic stress ratio on the lining from approximately 1.8 (pre-optimization) to 1.4 (post-optimization).

5. Conclusions

Analytical solutions for the transient response of composite tunnel linings under the excitation of blasting P- and SV-waves were formulated utilizing the Fourier transform and Duhamel’s integral. By coupling actual engineering scenarios with parameter optimization, the following key conclusions are established:
(1) In the seismic design of a tunnel, the focus is on implementing shock absorption measures in the area of isodynamic stress concentration in the vault and arch bottom to cope with the rapid stress changes caused by transient P-wave and SV-waves, especially because the pulse duration is shorter and the peak value is larger.
(2) Compared to P-waves, transient SV-wavs induced a substantially higher peak DSCFmax. Consequently, it is crucial to prioritize the effects of blast-induced SV-waves when formulating seismic designs and implementing vibration mitigation strategies.
(3) Adopting measures such as a “soft-exterior, rigid-interior” approach and increasing the thickness of the initial support effectively reduces the dynamic stress concentration in composite linings. In practice, dynamic stress concentration is mainly observed in the lining, whereas optimization shifts this concentration to the surrounding rock.
Finally, as this study relies on analytical formulations without current experimental or independent numerical validation, the proposed “soft-exterior, rigid-interior” strategy represents a theoretical prediction rather than a verified engineering recommendation. Future research will validate these analytical insights through three-dimensional numerical simulations and scaled physical model tests.

Author Contributions

Y.R.: Resources, Writing—original draft and review/editing, Funding acquisition, Investigation; Z.L.: Writing—original draft and review/editing, Software; H.D.: Supervision, Funding acquisition, Writing—critical revision; Y.S.: Supervision, Funding acquisition, Conceptualization; L.G.: Supervision, Data curation, Writing—critical revision; Z.H.: Methodology, Validation, Resources, Data curation. All authors have read and agreed to the published version of the manuscript.

Funding

The work was supported by the Jiangxi Province’s Leading Talent Program for Cultivating Academic and Technical Leaders in Major Disciplines (No. 20225BCJ22014), the Jiangxi Outstanding Talent Support Program—a project for cultivating academic and technical leaders in major disciplines (No. 20232BCJ23069), the Science and Technology Project of Jiangxi Provincial Department of Transportation (No. 2023C0007), the National Natural Science Foundation (52478344) and the Natural Science Foundation of Jiangxi Province (2024QT04, 20242BAB25300), the Science and Technology Project of Jiangxi Provincial Department of Transportation (2024ZG011).

Institutional Review Board Statement

Not applicable.

Informed Consent Statement

Not applicable.

Data Availability Statement

The data that support the findings of this study are available from the corresponding author upon reasonable request.

Acknowledgments

We are grateful to our teammates for their dedicated support and collaborative efforts throughout this research.

Conflicts of Interest

Authors Yao Rong and Yang Sun were employed by the Jiangxi Communications Investment Maintenance Technology Group Co., Ltd. Author Zhipan Han was employed by The Fourth Construction Co., Ltd. of the CSCEC 7th Division. The remaining authors declare that the research was conducted in the absence of any commercial or financial relationships that could be construed as a potential conflict of interest.

Appendix A

This appendix provides the detailed algebraic expressions necessary to construct the linear system defined in Equation (10) of the main text. When the cylindrical wave function expansions (Equations (1)–(5)) are substituted into the stress and displacement definitions (Equation (6)), and subsequently restricted by the 10 interface and boundary conditions (Equations (7)–(9)), a 10 × 10 matrix equation emerges: [ A i j ] { X i } = { B j } . To simplify the presentation of this massive matrix, we first define a series of intermediate differential operators ( ϵ and E ). These operators represent the radial and circumferential derivatives of the Bessel and Hankel functions evaluated at the layer boundaries.
ε 11 ( l ) ( α r ) = n 2 + n 1 / 2 β 2 r 2 Q n ( l ) ( α r ) α r Q n 1 ( l ) ( α r ) ε 12 ( l ) ( β r ) = n ( n + 1 ) Q n ( l ) ( β r ) + β r Q n 1 ( l ) ( β r ) ε 21 ( l ) ( α r ) = n 2 + n + 1 / 2 β 2 r 2 α 2 r 2 Q n ( l ) ( α r ) + α r Q n 1 ( l ) ( α r ) ε 22 ( l ) ( β r ) = n ( n + 1 ) Q n ( l ) ( β r ) β r Q n 1 ( l ) ( β r ) ε 41 ( l ) ( α r ) = n [ ( n + 1 ) Q n ( l ) ( α r ) + α r Q n 1 ( l ) ( α r ) ] ε 42 ( l ) ( β r ) = n 2 + n 1 / 2 β 2 r 2 Q n ( l ) ( β r ) + β r Q n 1 ( l ) ( β r ) ε 71 ( l ) ( α r ) = α r Q n 1 ( l ) ( α r ) n Q n ( l ) ( α r ) ε 72 ( l ) ( β r ) = n Q n ( l ) ( β r ) ε 81 ( l ) ( α r ) = n Q n ( l ) ( α r ) ε 82 ( l ) ( β r ) = β r Q n 1 ( l ) ( β r ) n Q n ( l ) ( β r ) Q n ( l ) ( ) = J n ( ) , l = 1 H n ( 1 ) ( ) , l = 3 H n ( 2 ) ( ) , l = 4
The excitation load vector [ B j ] on the right side of Equation (10) is generated entirely by the incident P-wave or SV-wave potentials. Its elements are defined as follows:
B 1 = i n φ 0 ε n E 41 1 ( β 1 r ) , forSVwaves E 11 1 ( α 1 r ) , forPwaves B 2 = i n φ 0 ε n E 11 1 ( β 1 r ) , forSVwaves E 41 1 ( α 1 r ) , forPwaves B 3 = i n φ 0 ε n E 81 1 ( β 1 r ) , forSVwaves E 71 1 ( α 1 r ) , forPwaves B 4 = i n φ 0 ε n E 71 1 ( β 1 r ) , forSVwaves E 81 1 ( α 1 r ) , forPwaves
A 11   = E 11 3 α 1 r , A 12   = E 12 3 β 1 r A 13   = μ 2 E 12 3 α 2 r A 14   = μ 2 E 12 4 α 2 r A 15   = E 12 3 β 2 r , A 16   = μ 2 E 12 4 β 2 r , A 17 = A 18 = A 19 = A 110 = 0 A 21   = E 41 3 α 1 r , A 22   = E 42 3 β 1 r A 23   = μ 2 E 42 3 α 2 r A 24   = μ 2 E 42 4 α 2 r A 25   = E 42 3 β 2 r , A 26   = μ 2 E 42 4 β 2 r , A 27 = A 28 = A 29 = A 210 = 0 A 31   = E 71 3 α 1 r , A 32   = E 72 3 β 1 r A 33   = μ 2 E 72 3 α 2 r A 34   = μ 2 E 72 4 α 2 r A 35   = E 72 3 β 2 r , A 36   = μ 2 E 72 4 β 2 r , A 37 = A 38 = A 39 = A 310 = 0 A 41   = E 81 3 α 1 r , A 42   = E 82 3 β 1 r A 43   = μ 2 E 82 3 α 2 r A 44   = μ 2 E 82 4 α 2 r A 45   = E 82 3 β 2 r , A 46   = μ 2 E 82 4 β 2 r , A 47 = A 48 = A 49 = A 410 = 0
A 51   = A 52   = 0 , A 53   = μ 2 E 12 3 α 2 r , A 54   = μ 2 E 12 4 α 2 r , A 55   = E 12 3 β 2 r , A 56   = μ 2 E 12 4 β 2 r A 57 = μ 1 E 11 3 α 3 r , A 58 = μ 1 E 11 4 α 3 r , A 59 = μ 1 E 12 3 β 3 r , A 510 = μ 1 E 12 4 β 3 r A 61   = A 62   = 0 , A 63   = μ 2 E 42 3 α 2 r , A 64   = μ 2 E 42 4 α 2 r , A 65   = E 42 3 β 2 r , A 66   = μ 2 E 42 4 β 2 r A 67 = μ 1 E 41 3 α 3 r , A 68 = μ 1 E 41 4 α 3 r , A 69 = μ 1 E 42 3 β 3 r , A 610 = μ 1 E 42 4 β 3 r A 71   = A 72   = 0 , A 73   = μ 2 E 72 3 α 2 r , A 74   = μ 2 E 72 4 α 2 r , A 75   = E 72 3 β 2 r , A 76   = μ 2 E 72 4 β 2 r A 77 = μ 1 E 71 3 α 3 r , A 78 = μ 1 E 71 4 α 3 r , A 79 = μ 1 E 72 3 β 3 r , A 710 = μ 1 E 72 4 β 3 r A 81   = A 82   = 0 , A 83   = μ 2 E 82 3 α 2 r , A 84   = μ 2 E 82 4 α 2 r , A 85   = E 12 3 β 2 r , A 86   = μ 2 E 82 4 β 2 r A 87 = μ 1 E 81 3 α 3 r , A 88 = μ 1 E 81 4 α 3 r , A 89 = μ 1 E 82 3 β 3 r , A 810 = μ 1 E 82 4 β 3 r
A 91 = A 92 = A 93 = A 94 = A 95 = A 96 = 0 , A 97 = E 11 3 α 3 r A 98 = E 11 4 α 3 r , A 99 = E 12 3 β 3 r , A 910 = E 12 4 β 3 r A 101 = A 102 = A 103 = A 104 = A 105 = A 106 = 0 , A 107 = E 41 3 α 3 r A 108 = E 41 4 α 3 r , A 109 = E 42 3 β 3 r , A 1010 = E 42 4 β 3 r
These expressions populate the matrix system in Equation (10). Solving it yields the wave expansion coefficients. Substituting these coefficients into Equation (6) determines the circumferential stress at the inner boundary, which is then normalized to calculate the DSCF defined in Equation (11).

References

  1. Cao, Y.; Li, D.; Gao, X.; Bi, S.; Yu, K.; Zhou, D. Age-Friendly Environment Design of High-Speed Railway Stations from a Healthy Ageing Perspective: A Case Implementation in Nanjing, China. Buildings 2024, 14, 3280. [Google Scholar] [CrossRef] [Scilit]
  2. Ma, Y.; Sallan, J.M.; Lordan, O. Rail Transit Networks and Network Motifs: A Review and Research Agenda. Sustainability 2024, 16, 3641. [Google Scholar] [CrossRef] [Scilit]
  3. Cen, L.; Peng, X.; Dai, Q.; Li, C.; Yi, X. Creep leakage process of remaining soils in near-surface fissures in a karst area with bedrock outcrops. CATENA 2023, 221, 106802. [Google Scholar] [CrossRef] [Scilit]
  4. Lin, Z.; Jiang, Y.; Xu, C.; Chi, M.; Fang, T.; Guan, L.; Feng, G.; Lin, G. Performance of adjacent metro tunnels during deep excavation: A case study in Hangzhou. Transp. Geotech. 2025, 53, 101585. [Google Scholar] [CrossRef] [Scilit]
  5. Le Lay, G.; Daerr, A. Phase-locking parametric instability coupling longitudinal and transverse waves on rivulets in a Hele-Shaw cell. Phys. Rev. Lett. 2025, 134, 014001. [Google Scholar] [PubMed]
  6. Ayeoribe, O.P.; Akinsanmi, O.; Esan, A.; Oluwole, A.S. Waveguides, antennas, and wave propagation. SSRN Electron. J. 2025. [Google Scholar] [CrossRef] [Scilit]
  7. Amoruso, A.; Crescentini, L. Shape and volume change of pressurized ellipsoidal cavities from deformation and seismic data. J. Geophys. Res. Solid Earth 2009, 114, B02210. [Google Scholar] [CrossRef] [Scilit]
  8. Uebayashi, H.; Sekiguchi, H. Decomposed SH-, SV-, and P-wavefields and their visualizations for interpretation of reproduced synthetic waves in the Osaka sedimentary basin, Japan, due to a Mw 5.6 earthquake beneath its edge. Earth Planets Space 2025, 77, 165. [Google Scholar] [CrossRef] [Scilit]
  9. Wang, Q.; Wang, S.; Zhao, Y.; Geng, P.; Shen, H.; Deng, L. Theoretical insights into tunnel portal dynamics: Effects of SV waves on seismic partitioning and structural strain. Soil Dyn. Earthq. Eng. 2025, 199, 109675. [Google Scholar] [CrossRef] [Scilit]
  10. Pao, Y.-H.; Mow, C.-C.; Achenbach, J.D. Diffraction of Elastic Waves and Dynamic Stress Concentrations. J. Appl. Mech. 1973, 40, 213–219. [Google Scholar] [CrossRef] [Scilit]
  11. Huang, Q.; Huang, Y.; Liu, Y.; Guo, Q.; Liu, Z.; Ding, H.; Li, L. Transient Dynamic Response and Anti-Seismic Measures of Deep-Buried Composite Lining Tunnels Subject to Blasting SV-Wave Disturbance. SDHM Struct. Durab. Health Monit. 2026, 20, 16. [Google Scholar] [CrossRef] [Scilit]
  12. Bi, J.; Shan, Y.; Feng, Y.; Wang, S.; Sun, W.; Yin, C. Seismic Response Characteristics of a Biased Rock Tunnel Subjected to Obliquely Incident SV Waves. Symmetry 2026, 18, 999. [Google Scholar] [CrossRef] [Scilit]
  13. Skabylov, A.; Zhexebay, D.; Khokhlov, S.; Agishev, A.; Abdizhalilova, L.; Zhakipova, M.; Azamat, R.; Orazakova, A.; Yuxiao, Q.; Ibraimov, M. Seismic P-Wave Detection Using CWT and Deep Image Classification With YOLO. IEEE Access 2025, 13, 181267–181285. [Google Scholar] [CrossRef] [Scilit]
  14. Sun, B.; Guo, J.; Zhang, Y.; Chu, F. Efficient Analysis of Unlined Elliptic Tunnels: An Approximate Method for Dynamic Response to Incident Plane SH Waves. J. Earthq. Eng. 2024, 28, 4193–4208. [Google Scholar] [CrossRef] [Scilit]
  15. He, R.; Huang, X.; Zhang, J. Analytical Solution for the Topographic Effect of an Offshore Circular-Arc Canyon Under P-Wave Incidence. Int. J. Numer. Anal. Methods Geomech. 2025, 49, 720–737. [Google Scholar] [CrossRef] [Scilit]
  16. Ma, Q.; Zhang, M.; Zhou, F.; Shao, S. Analytical Analysis of the Scattering Problem of Plane SV Waves Caused by a Circular Arc Canyon in an Unsaturated Half-Space. Int. J. Geomech. 2025, 25, 04025058. [Google Scholar] [CrossRef] [Scilit]
  17. Lee, V.W.; Trifunac, M.D. Response of tunnels to incident SH-waves. J. Eng. Mech. Div. 1979, 105, 643–659. [Google Scholar] [CrossRef] [Scilit]
  18. Mei, W.; Xia, Y.; Han, G.; Pan, P.-Z.; Li, M.; Wang, Z. Theoretical responses of shallow-buried circular cavity subjected to transient P wave. Comput. Geotech. 2021, 139, 104411. [Google Scholar] [CrossRef] [Scilit]
  19. Xia, Y.; Han, G.; Mei, W.; Pan, P.-Z.; Li, M.; Yan, M.; Yan, Y. Dynamic Responses of a Shallow Lined Tunnel with Imperfect Interface Under Transient P Wave. Int. J. Struct. Stab. Dyn. 2024, 24, 2450187. [Google Scholar] [CrossRef] [Scilit]
  20. Li, Z.; Tao, M.; Du, K.; Cao, W.; Wu, C. Dynamic stress state around shallow-buried cavity under transient P wave loads in different conditions. Tunn. Undergr. Space Technol. 2020, 97, 103228. [Google Scholar] [CrossRef] [Scilit]
  21. Zhao, H.; Tao, M.; Li, X.; Mikada, H.; Xu, S. Influence of excavation damaged zone on the dynamic response of circular cavity subjected to transient stress wave. Int. J. Rock Mech. Min. Sci. 2021, 142, 104708. [Google Scholar] [CrossRef] [Scilit]
  22. Zhang, Y.; Zhang, N.; Dai, D.; Chen, X. Dynamic Stress Concentration and Particle Velocity Response of a Composite Lining Tunnel with Imperfect Interfaces Subjected to Blasting P Waves. Int. J. Geomech. 2023, 23, 06023018. [Google Scholar] [CrossRef] [Scilit]
  23. Zhao, N.; Shao, Z.; Yuan, B.; Chen, X.; Wu, K. Analytical approach to estimating the influence of friction slip contact between surrounding rock and concrete lining on mechanical response of deep rheological soft rock tunnels. Appl. Math. Model. 2023, 113, 287–308. [Google Scholar] [CrossRef] [Scilit]
  24. Ding, H.; Yu, Y.; Xu, C.; Pu, X.; Guo, W.; Tong, L. Analytical modeling for nonlinear seismic metasurfaces of saturated porous media. Int. J. Mech. Sci. 2025, 303, 110666. [Google Scholar] [CrossRef] [Scilit]
  25. Yu, Y.; Ding, H.; Tong, L.; Xu, C.; Lin, C.; Liu, Z.; Pu, X. Elastic metasurfaces for Scholte waves at fluid–poroelastic interfaces. Int. J. Mech. Sci. 2026, 321, 111657. [Google Scholar] [CrossRef] [Scilit]
  26. Baek, M.; Ryu, H.-H.; Chang, I. Analysis of tunneling effects on existing adjacent tunnels using 2D physical model experiment and numerical simulations. KSCE J. Civ. Eng. 2026, 30, 100479. [Google Scholar] [CrossRef] [Scilit]
  27. Mei, W.; Pan, P.; Wang, Z.; Xie, Y.; Feng, Y.; Chi, F. Dynamic responses and failure characteristics of surrounding rock in a deep-buried tunnel with an arbitrary cross-section subjected to blasting P-wave. Comput. Geotech. 2025, 186, 107447. [Google Scholar] [CrossRef] [Scilit]
  28. Mei, W.; Xia, Y.; Pan, P.; Li, M.; Han, G. Influence of Wavelength-to-Excavation Span Ratio on Dynamic Failure Characteristics of a Deep-Buried Tunnel Subjected to Disturbance. Int. J. Geomech. 2022, 22. [Google Scholar] [CrossRef] [Scilit]
  29. Tao, M.; Li, Z.; Cao, W.; Li, X.; Wu, C. Stress redistribution of dynamic loading incident with arbitrary waveform through a circular cavity. Int. J. Numer. Anal. Methods Geomech. 2019, 43, 1279–1299. [Google Scholar] [CrossRef] [Scilit]
  30. Luo, H.; Tao, M.; Hong, Z.; Xiang, G.; Wu, C. Analysis of the dynamic response and damage characteristic for the tunnel under near-field blasts and far-field earthquakes. Undergr. Space 2025, 21, 331–351. [Google Scholar] [CrossRef] [Scilit]
  31. Xiang, G.; Tao, M.; Zhao, R.; Zhao, H.; Wu, C.; Memon, M.B. Dynamic characteristics of rockbolt anchorage structure under radial cylindrical P wave. Soil Dyn. Earthq. Eng. 2023, 174, 108176. [Google Scholar] [CrossRef] [Scilit]
  32. Mei, W.; Xia, Y.; Pan, P.-Z.; Li, M.; Tan, S.; Zhang, Y. Transient responses of deep-buried unlined tunnels subjected to blasting P wave. Comput. Geotech. 2022, 146, 104729. [Google Scholar] [CrossRef] [Scilit]
  33. Shakeri, R.; Mesgouez, A.; Lefeuve-Mesgouez, G. Transient response of a concrete tunnel in an elastic rock with imperfect contact. Int. J. Min. Sci. Technol. 2020, 30, 605–612. [Google Scholar] [CrossRef] [Scilit]
  34. Tao, M.; Zhao, H.T.; Li, Z.W.; Zhu, J.B. Analytical and numerical study of a circular cavity subjected to plane and cylindrical P-wave scattering. Tunn. Undergr. Space Technol. 2020, 95, 103143. [Google Scholar] [CrossRef] [Scilit]
  35. Mow, C.C.; Mente, L.J. Dynamic stresses and displacements around cylindrical discontinuities due to plane harmonic shear waves. J. Appl. Mech. 1963, 30, 598. [Google Scholar] [CrossRef] [Scilit]
Figure 1. Schematic diagram of the computational model and blast load characteristics.
Applsci 16 06668 g001
Figure 2. Validation of the proposed framework via limiting cases [10,34,35], (a) simple harmonic P-wave (red) and SV-wave (blue), (b) verification of the dynamic responses of transient P-waves.
Applsci 16 06668 g002
Figure 3. Time-history curves of the transient DSCF on the secondary lining under different pulse durations ( τ 0 = 5 ,   20 ,   50 ,   75 ,   100 ). (a) P-wave, θ = π / 4 ; (b) SV-wave, θ = π / 4 ; (c) P-wave, θ = π / 2 ; (d) SV-wave, θ = π / 2 .
Applsci 16 06668 g003
Figure 4. Circumferential distribution of DSCFmax on the outer boundary of the surrounding rock (blue curves) and the inner surface of the secondary lining (red curves) under different pulse durations ( τ 0 = 20 ,   50 ). (a) P-wave, (b) SV-wave.
Applsci 16 06668 g004
Figure 5. Effect of the primary support-to-rock shear modulus ratio (G2/G1) on DSCFmax at the surrounding rock (blue curves) and secondary lining (red curves) under varying pulse durations ( τ 0 = 10 ,   20 ,   30 ,   50 ). (a) Transient P-waves; (b) transient SV-waves.
Applsci 16 06668 g005
Figure 6. Effect of the secondary lining-to-rock shear modulus ratio (G3/G1) on DSCFmax at the surrounding rock (blue curves) and secondary lining (red curves) under varying pulse durations ( τ 0 = 10 ,   20 ,   30 ,   50 ). (a) Transient P-waves; (b) transient SV-waves.
Applsci 16 06668 g006
Figure 7. Effect of the lining thickness ratio (r1r2)/(r2r3) on DSCFmax at the surrounding rock (blue curves) and secondary lining (red curves) under varying pulse durations ( τ 0 = 10 ,   20 ,   30 ,   50 ). (a) Transient P-waves; (b) transient SV-waves.
Applsci 16 06668 g007
Figure 8. Spatial distribution cloud maps of dynamic stresses at varying pulse durations under transient P-wave action: (ad) pre-optimization results (“actual”) for τ0 = 10, 20, 50, and 100; (eh) corresponding post-optimization results (“optimized”).
Applsci 16 06668 g008
Figure 9. Spatial distribution cloud maps of dynamic stresses at varying pulse durations under transient SV-wave action: (ad) pre-optimization results (“actual”) for τ0 = 10, 20, 50, and 100; (eh) corresponding post-optimization results (“optimized”).
Applsci 16 06668 g009
Table 1. Physical properties and parametric variation ranges for the respective material layers [2].
MediumModulus of Elasticity E/GPaDensity ρ / kg m 3 Poisson v Thickness d/m
Rock5026000.26——
Secondary lining25 (5–150)25000.250.15 (0.045–0.45)
Primary support32 (3.2–96)25000.300.45
Disclaimer/Publisher’s Note: The statements, opinions and data contained in all publications are solely those of the individual author(s) and contributor(s) and not of MDPI and/or the editor(s). MDPI and/or the editor(s) disclaim responsibility for any injury to people or property resulting from any ideas, methods, instructions or products referred to in the content.