Article

Optimization of Fermentation and Spray-Drying Conditions for the Production of Oat-Based Postbiotic Powder


by
Francesca Passannanti
1,2,†,
Giulia Lentini
1,2,†,
Marianna Gallo
1,2,3,
Rosa Colucci Cante
1,2,*,
Federica Nigro
2,
Andrea Luigi Budelli
4 and
Roberto Nigro
1
1
Department of Chemical Engineering, Materials, and Industrial Production, University of Naples Federico II, P. Tecchio 80, 80125 Naples, Italy
2
I. T. P. Innovation and Technology Provider S.r.l., Via Bisignano a Chiaia, 68, 80121 Naples, Italy
3
Department of Industrial Engineering, University of Niccolò Cusano, Via Don Carlo Gnocchi 3, 00166 Rome, Italy
4
Heinz Innovation Center, Nieuwe Dukenburgseweg 19, 6534 AD Nijmegen, The Netherlands
*
Author to whom correspondence should be addressed.
These authors contributed equally to the work.
Appl. Sci. 2026, 16(12), 6107; https://doi.org/10.3390/app16126107
Submission received: 17 April 2026 / Revised: 11 June 2026 / Accepted: 12 June 2026 / Published: 17 June 2026
(This article belongs to the Special Issue Food Fermentation: New Advances and Applications: 2nd Edition)

Abstract

Postbiotics, a type of fermented functional food, are attracting attention alongside the more common pro- and prebiotics. The main production stages—fermentation, thermal inactivation, and drying—significantly influence the functional effects of these foods. This study investigated the impact of pH control during the fermentation of oat flour suspension and optimized spray-drying parameters to produce oat-based postbiotic powders. A Lacticaseibacillus paracasei CBA L74 fermented hydrolyzed oat suspension was analyzed at 37 °C for 24 h, with and without pH control. Both pH conditions produced similar bacterial growth (~109 CFU/mL) and lactic acid (~9 g/L). No significant differences were observed in polyphenols, flavonoids, or antioxidant activity, indicating that pH control did not noticeably improve productivity or the phytochemical properties. The best results—57.40% drying yield and 3.9% relative humidity—were achieved when the postbiotic suspension (diluted 1:4 with water) was mixed 1:1 with maltodextrins, and the spray drying process was conducted with 50 L/min air flow, 200 °C, 3.2 bar atomization pressure, and 5 L/min feed flow. These results support the possibility of scaling the production process from laboratory-optimized parameters and represent a first step toward a cost-effective and industrially feasible route for manufacturing stable oat-based postbiotic powders.

1. Introduction

Fermentation is a biotechnological process that has been utilized since ancient times to enhance the preservation and palatability of foods, as well as to produce new products such as wine and beer. Nowadays, given the great attention consumers pay to health and healthy food, fermentation is used to improve the nutritional value and digestibility of foods and impart “functionality”. Functional food is defined as a “food, which beneficially affects one or more target functions in the body, beyond adequate nutritional effects, in a way that is relevant to either an improved state of health and well-being and/or reduction of risk of disease” [1].
Functional foods can be natural or modified, as they may naturally contain beneficial substances or be processed through methods such as fermentation to add or remove specific components. Dairy products, such as yogurt or fermented milk, are the best-known fermented foods; however, growing interest is directed toward alternative products, such as cereals or legumes, which offer interesting nutritional and functional characteristics. Oats, for example, present unique characteristics.
Compared to other cereals, oats have a higher lipid content (5–9%) and a higher vitamin content, including the fat-soluble vitamin E, known for its antioxidant properties, as well as a high level of phytochemicals such as polyphenols and phytic acid [2].
Moreover, oats are a rich source of polyphenols, of which avenanthramides are the most abundant, with a high antioxidant potential. Another interesting compound is β-glucan, a soluble fiber that represents one of the main reasons oats have antidiabetic and hypocholesterolemic effects. Oat consumption is also associated with other beneficial effects, such as immunomodulation and the prevention of certain pathological conditions, including atherosclerosis and some forms of cancer [3]. For all of these reasons, oats represent a promising substrate for producing oat-based functional foods through fermentation, as demonstrated in previous studies [4], which highlighted the cereal’s excellent nutritional characteristics and its potential as a suitable fermenting matrix in controlled bioprocesses. In particular, oat fermentation is responsible for several changes, including increased digestibility of carbohydrates and fibers and improved bioavailability of certain phytochemicals, vitamins, and minerals [5]. Moreover, using probiotic microorganisms as fermenting strains, oats can also be enriched with live microbial species that possess beneficial properties, such as promoting a healthy microflora and stimulating the immune system.
Among the fermented functional foods, postbiotics have been gaining attention alongside the better-known categories of pro- and prebiotic products, which are currently more prevalent on the market. A postbiotic is recognized as a “preparation of inanimate microorganisms and/or their components that confer a health benefit on the host. Postbiotics must contain inactivated microbial cells, cell components, and metabolites, such as enzymes, peptides, and organic acids, produced in the final or intermediate stage of the metabolic process of the probiotic bacteria, which all synergistically contribute to observed health benefits” [6].
Although postbiotics do not contain live microorganisms, they exhibit beneficial health effects through mechanisms like those of probiotics, thereby minimizing the risks associated with their intake and representing a safer option for immunodeficient patients or infants [7]. After fermentation, using selected strains, system setups, and optimized process conditions, the probiotic biomass is inactivated by heat, filtration, sonication, centrifugation, and ultraviolet radiation.
During these inactivation treatments, bacterial lysis can release various compounds, including DNA, enzymes, lipoteichoic acids, and other intracellular metabolites [8], which exert immunostimulatory and anti-infection effects [9,10], as well as antioxidant and anticancer properties [11]. Liquid postbiotics can be further stabilized through drying, yielding shelf-stable, functional powders that enable easy, cost-effective handling, transportation, and storage [12]. Spray drying is one of the most widely used drying techniques at an industrial scale: it is 6 to 10 times more energy efficient and 30 to 50 times cheaper than freeze-drying; the technology is readily available, characterized by ease of maintenance and operation, and therefore suitable for large-scale production [13]. The entire process of postbiotic production should be developed by properly optimizing each single unit operation, such as substrate preparation and sterilization, fermentation, microbial deactivation, and drying, to increase the total yields and productivity and/or improve the quality of the final products. During fermentation, selecting appropriate operational parameters can modulate microbial growth, metabolism, and nutritional changes. Fermentation time, temperature, and pH are all factors to consider, as they can affect microorganism activity and the product’s health effects [14,15]. For example, temperature and pH can modulate the growth and metabolic kinetics of microorganisms [16,17] by enhancing beneficial effects, such as the antagonistic activity of probiotic bacteria against pathogens [18] or the inhibition of the toxic gliadin peptide’s entry into epithelial cells [19]. Regarding the drying procedure, proper dryer design and operating conditions, such as air temperature, air flow rate, feed flow rate, atomization pressure, and types and concentrations of additives, should be accurately selected [20]. One of the main issues in the spray drying of sugar-rich food products is the high content of low-molecular-weight compounds with low glass transition temperatures. These materials tend to stick and cake, leading to increased powder deposition on the dryer walls, which in turn results in a decrease in powder yield, product deterioration, and severe maintenance problems [21,22].
Therefore, polysaccharide-based additives such as maltodextrin, gum Arabic, and waxy starch are commonly used as carriers to increase the glass transition temperature (Tg), favoring the drying efficiencies and the chemical stability, water solubility, hygroscopicity, and flow properties of the resulting products [23].
The present work aimed to identify the optimal lab-scale operating parameters to ensure the highest efficiency of the entire production system that leads to an oat-based semifinished postbiotic, placing a particular focus on the final chemical and physical properties of the resulting product and the overall feasibility of the process.
To the best of our knowledge, no studies have optimized the laboratory-scale production process of an oat-based postbiotic; our work addresses this gap by evaluating fermentation without pH control and the selection of suitable spray-drying parameters.
Regarding fermentation optimization, the potential effect of pH on fermentation was investigated. The fermenting strain used has already been confirmed as a probiotic in previous investigations [24,25,26,27]. The process was carried out either by leaving the pH uncontrolled or by controlling it through the addition of NaOH to assess the practicality of implementing a pH control system in terms of microbial load, growth kinetics, and microorganism metabolic activity.
In particular, growth curves, lactic acid production, fermentation process yields, and kinetic parameters, namely doubling time (td), number of generations (n), and constant growth rate (k), were determined in both conditions and compared. Additionally, several phytochemical parameters were evaluated as further markers potentially affected by the process. These included antioxidant activity, total polyphenol content, and total flavonoid content. The evaluation particularly considered whether fermentation was conducted under controlled or uncontrolled pH conditions. In this regard, Ghosh et al. (2015) [28] demonstrated a pH-dependent modulation of both phenolic compounds and antioxidant properties during fermented palm juice processing. This finding highlights the close relationship between pH changes during fermentation and phytochemical parameters.
Once the optimal fermentation conditions were defined, the spray drying of the fermented and inactivated oat suspension was studied. In particular, the dilution degree of the substrate to avoid nozzle fouling and the concentration of maltodextrins used as bulking agents were optimized; moreover, some operating parameters (such as atomization pressure and inlet air temperature) were set to achieve the maximum yield of recovered, dried postbiotic.

2. Materials and Methods

2.1. Strain

Lacticaseibacillus paracasei CBA L74 (patented by Heinz Italia S.p.A., Milan, Italy), a Gram-positive and homofermentative strain, was used as a fermenting microorganism. It was stored at −80 °C in an animal-free broth (20 g/L Bacto Yeast Extract (BD Biosciences, Milan, Italy), 0.5 g/L MgSO4 (Sigma-Aldrich, Milan, Italy), 50 g/L glucose (Sigma-Aldrich, Milan, Italy), and 0.5 g/L citric acid (Sigma-Aldrich, Milan, Italy)) with 20% glycerol. To revitalize it, 9 mL of the same animal-free broth was used, and the mixture was incubated for 24 h at 37 °C. After revitalization, a bacterial concentration of about 108 CFU/mL was obtained.

2.2. Oat Flour Suspension

Whole oat flour (Le Farine magiche, Lo Conte Group, Avellino, Italy) was purchased in a local market. A water suspension containing 15% w/v oat flour and 1% w/v glucose was prepared and pretreated as described by Lentini et al. [4]. Briefly, an enzymatic pretreatment using 0.036% w/v amylase (E-BLAAM, Megazyme, Bray, Ireland) was performed to prevent starch gelatinization during subsequent sterilization, which is necessary to obtain a sterile matrix before fermentation and to ensure efficient mixing and medium homogeneity, as reported by Gallo et al. [29]. The sterilization was carried out at 134 °C for 40 min.

2.3. Experimental Apparatus

2.3.1. Fermentation Apparatus

A lab-scale fermenter with a working volume of 1 L was used to perform the fermentation trials. It consisted of a batch reactor (20 cm high, 10 cm ID) equipped with an external jacket for water circulation and heated by a thermostatic bath. Mixing was enabled by the stainless-steel head plate, which mounted a rotating shaft with three Rushton turbines. The mixing system described was connected to a motor, allowing the speed to be regulated. This system was used for both the fermentation process and the subsequent microbial reduction phase. Via an inlet port on the head plate, a probe (In Pro 3100, Mettler Toledo, Milan, Italy) was inserted into the reactor to allow for the inner measurement of temperature and pH; pH control was, indeed, realized by a M300 transmitter (Mettler Toledo, Milan, Italy) connected to the probe and able to regulate the feeding of a 4 M NaOH solution through a peristaltic pump, every time the pH recorded (in the case of pH control fermentation) was less than 6.2.

2.3.2. Drying Apparatus

The postbiotic suspension was spray-dried using a lab spray dryer, OLT-SD8000B. It was made of a glass drying chamber (43 cm high, 20 cm ID), a pressure atomizer (diameter: 1 mm), a glass cyclone (30 cm high, 7.5 cm ID), and a glass collection chamber. Before proper tests, conditioning with distilled water was carried out to simulate a continuous process.

2.4. Experimental Plan

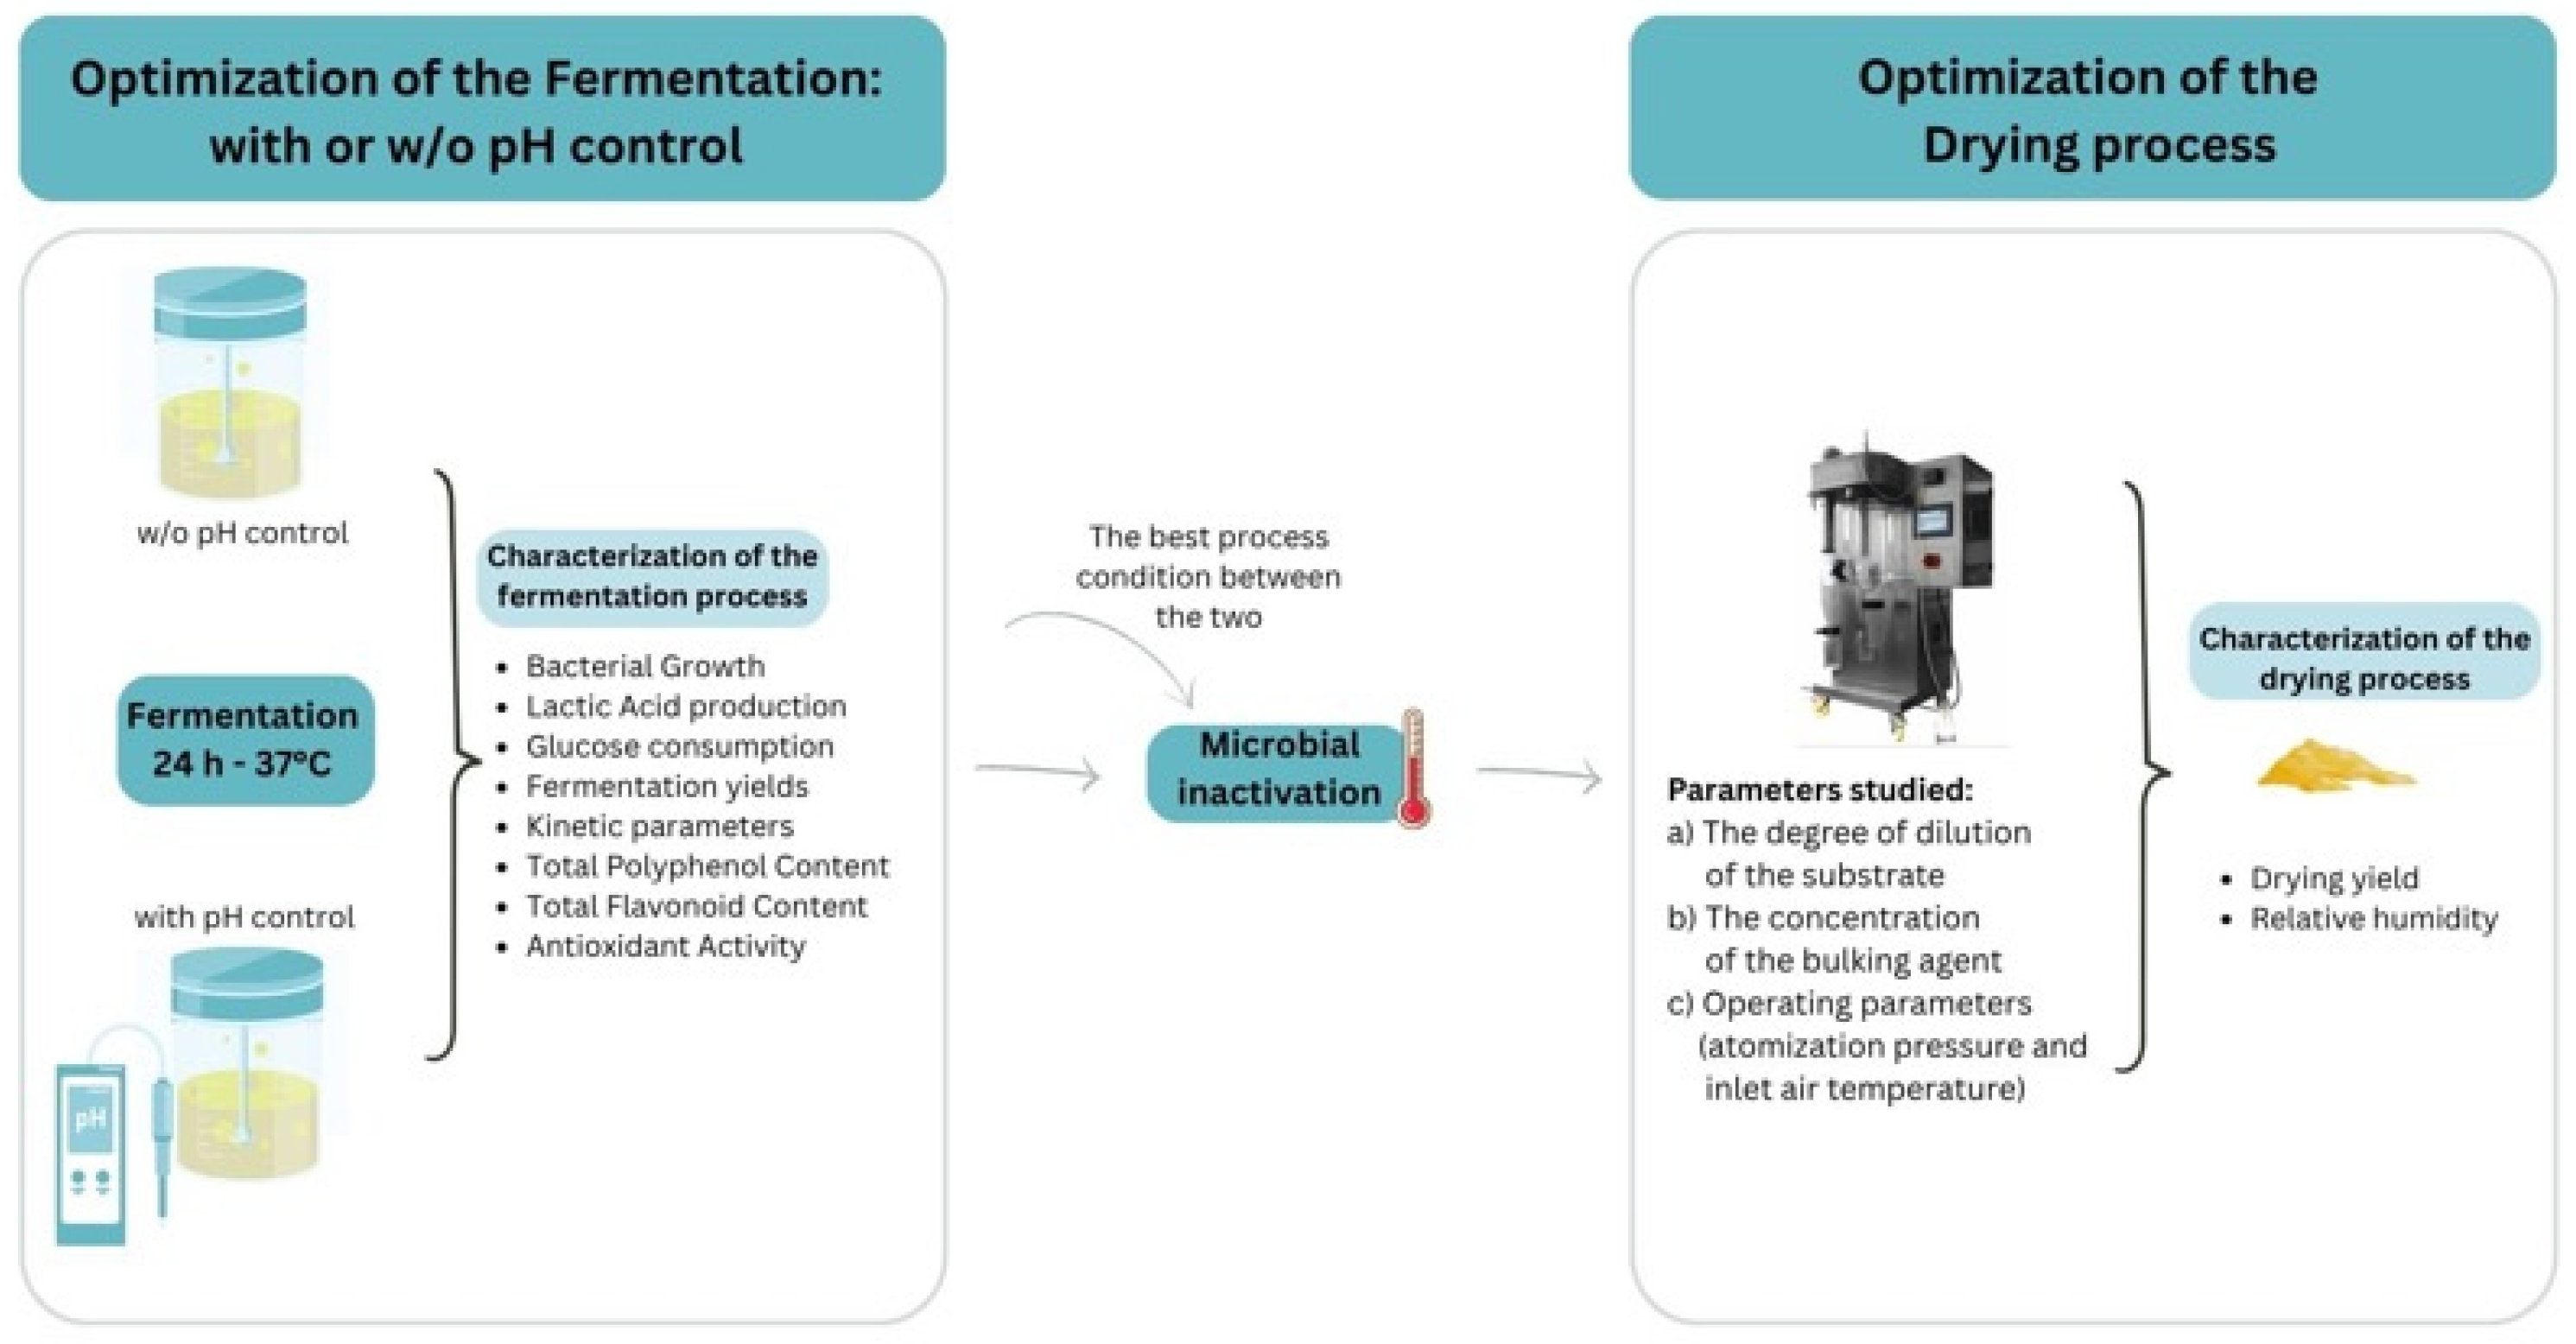
Figure 1 shows a schematic representation of the entire experimental campaign. Firstly, fermentation trials were carried out with and without pH control at the microorganism’s optimal pH (6.2). Fermentation outcomes, including microbial growth, glucose consumption, lactic acid production, and kinetic parameters, were compared across both pH conditions; moreover, a preliminary characterization of the resulting fermented oat suspension was provided for antioxidant components and scavenging activity. After thermal inactivation of the oat product resulting from the best fermentation condition, the drying process was optimized by studying the impact of some operative parameters (air temperature, atomization pressure, use of bulking materials, and dilution degree of the feed liquid) on the total recovery yield and the final humidity of the postbiotic powders.

2.5. Experimental Protocols

2.5.1. Fermentation

The oatmeal suspension, pretreated as described above, was cooled to 37 °C after being loaded into the fermenter. The revitalized L. paracasei CBA L74 was inoculated (1% v/v), and the fermentation started, which was carried out for 24 h at 37 °C (mixing speed 70 rpm). Two different conditions were studied: in the first experimental set, fermentation was carried out without pH control, while in the second, pH was controlled at 6.2 with the addition of 4M NaOH. After 24 h of fermentation, to achieve the best fermentation conditions, a heat treatment at 85 °C for 30 s (mixing speed: 100 rpm; average heating rate: 3 °C/min) was performed in the same bioreactor used for the fermentation process to inactivate the bacterial load. After heat treatment, the bacterial count was measured to confirm microbial deactivation.

2.5.2. Drying

The final spray-drying protocol was derived from an optimization study that was divided into two phases:
Phase 1: Formulation tests of the feed substrate at fixed operating parameters, by varying:
  • The degree of dilution of the substrate (to avoid nozzle fouling problems);
  • The concentration of maltodextrins used as a bulking agent. The amount of bulking agent was added based on the initial solids content in the oat-based suspension (equal to 15%).
Phase 2: Optimization of some operating parameters (atomization pressure and inlet air temperature) once the best formulation had been identified.
Table 1 presents the two phases of the study and details the formulations and process conditions tested.

2.6. Analytical Methods

2.6.1. Microbiological Analysis

Aseptic sampling was performed at specific times: 10 min after bacterial inoculation (T0), and at 2 (T2), 4 (T4), 6 (T6), 8 (T8), 14 (T14), 16 (T16), 18 (T18), 20 (T20), 22 (T22), and 24 (T24) hours from the start. Microbiological analysis involved serial dilution and the spread plate method on various agar plates. MRS agar (Oxoid, Basingstoke, UK) was used to enumerate Lactobacilli, while MacConkey agar (Oxoid, Basingstoke, UK) and Gelatin Peptone Bios Agar (Biolife, Milan, Italy) were used to check for potential microbial contaminants. Plates were incubated at 37 °C for 48 h before analysis.

2.6.2. Lactic Acid Analysis

Lactic acid, the primary metabolite produced by L. paracasei CBA L74, was quantified using HPLC (high-performance liquid chromatography) on an Agilent 1100 series instrument (Agilent Technologies, Milan, Italy) equipped with a visible/UV detector. The mobile phase was a 0.27% (w/v) aqueous solution of KH2PO4 at pH = 1.5, amended with H3PO4, with a column temperature of 60 °C and a flow rate of 1 mL/min. Detection was set at a wavelength of 210 nm.

2.6.3. Glucose Consumption

The D-Glucose Assay Kit, GOPOD Format (Megazyme), was used to evaluate glucose consumption during fermentation with controlled and uncontrolled pH. Samples were preliminarily pretreated, diluted with distilled water at a ratio of 1:20, sonicated for 15 min, centrifuged at 10,000× g for 10 min, and filtered (0.45 µm). After the kit treatment, spectrophotometric absorbance was read at 510 nm.

2.6.4. Total Polyphenol Content (TPC), Total Flavonoid Content (TFC), and Antioxidant Activity (AA)

Preliminarily, a polyphenol extraction was performed on both the hydrolyzed oatmeal and the 24 h fermented oatmeal samples [30,31]. Briefly, 7 mL of ethanol solution (70% v/v) was added to 0.5 g of the samples. A sonication of 15 min, followed by centrifugation (2000 rpm for 15 min), was carried out. Supernatants were recovered, the sedimented pellets were redissolved in ethanol, and the same extraction procedure was repeated three times. The supernatants from the three extraction steps were combined, and the resulting extracts were used to evaluate the total polyphenol content (TPC), total flavonoid content (TFC), and antioxidant activity (AA).
TPC was determined by the Folin–Ciocalteu method, as described by Colucci Cante [32], with slight modifications. Briefly, 1 mL of extract was mixed with 0.3 mL of Folin–Ciocalteu reagent and 1 mL of Na2CO3 (7.5% w/v). The solution was then diluted to 10 mL with deionized water. After overnight incubation in the dark, absorbance was measured at 720 nm. The total phenolic content was expressed as milligrams of gallic acid equivalent (GAE) using a calibration curve prepared with gallic acid as the standard phenol (0.05–0.25 mg/mL). TFC was determined by the aluminum chloride colorimetric method, as described by Colucci Cante [32], with minor modifications. Briefly, 5 mL of extract was mixed with 0.5 mL of a 2% (w/v) AlCl3 solution, then diluted to 10 mL with 70% v/v ethanol. After a night in the dark, absorbance was measured at 420 nm.
Total flavonoid content (TFC) was indicated as milligrams of quercetin equivalent (QE) through a calibration curve previously obtained using ethanol solutions at different quercetin concentrations (0.0015 ÷ 0.02 mg/mL). The AA was evaluated using the 2,2′-azinobis (3-ethyl-benzothiazoline-6-sulfonic acid) ABTS method, according to Thaipong [33], with slight modifications. Briefly, a working solution (S1) was prepared by mixing two stock solutions: a 7.4 mM ABTS+ solution and a 2.6 mM potassium persulfate solution, in a 2:1 ratio, and allowing the reaction to proceed for 12 h in the dark. The solution (S1) was then diluted with pure ethanol until an absorbance of 0.7 ± 0.02 (S2) was obtained using a spectrophotometer at 734 nm. Next, 0.15 mL of each sample extract was allowed to react with 2.850 mL of the solution (S2) for 2 h in the dark. After this reaction period, the samples’ absorbance was measured at 734 nm. Antioxidant activity was expressed as µM Trolox equivalents (TE), using a calibration curve prepared with Trolox solutions at known concentrations (25–600 µM).

2.6.5. Relative Humidity of Powders

The moisture content of the spray-dried postbiotic suspension was measured using a Kern DBS 60-3 thermobalance (KERN & SOHN GmbH, Balingen, Germany). The thermobalance weighs and dries the sample using an infrared heater, which returns the moisture value within a few minutes.

2.7. Process Yield

2.7.1. Fermentation Process Yield

The fermentation process with and without pH control was characterized in terms of process yield. The yield can be calculated according to Equations (1) and (2), which relate to the cells or the primary metabolite (lactic acid) produced.
Y c e l l s = C e l l s   p r o d u c e d S u b s t r a t e   c o n s u m p t i o n
Y c e l l s is defined as the ratio between the mass of cells produced and glucose consumption during 24 h of fermentation, expressed as [ m g c e l l s g g l u c o s e ].
Y m e t a b o l i t e = m e t a b o l i t e   p r o d u c e d S u b s t r a t e   c o n s u m p t i o n
Y m e t a b o l i t e is defined as the ratio between the mass of lactic acid produced and glucose consumption during 24 h of fermentation, expressed as [ g l a c t i c   a c i d g g l u c o s e ]. To obtain the g of bacteria, a conversion factor (1.67 × 10⁻¹² g/CFU), previously calculated for Lacticaseibacillus paracasei CBA L74, was used.

2.7.2. Drying Process Yield

The spray-drying yield is expressed as the ratio of the product’s weight obtained and recovered after the spray-drying process to the total solid content present in the fermented feed solution. The yield is shown in Equation (3):
Y i e l d S p r a y d r y i n g = D r i e d   p r o d u c t   o b t a i n e d g S o l i d   c o n t e n t   f e r m e n t e d   f e e d   s o l u t i o n g

2.8. Growth Kinetic Parameters

Once the bacterial growth curve was obtained, the doubling time (td), which is the time needed for bacteria to double their number during exponential growth, was calculated according to Equation (4) [34]:
t d = t e x p n
where texp is the duration of the exponential growth phase, while n is the number of generations, calculated according to Equation (5) [34]:
N f = N o × 2 n
where Nf and N0 are the number of bacteria found at the end and at the beginning of the exponential growth phase, respectively. Finally, the constant growth rate was calculated according to Equation (6):
k = n t e x p = 1 t d

2.9. Statistical Analysis

Statistical evaluations were performed using GraphPad Prism (Version 9.0.0). Each test was carried out in triplicate, and the means and standard deviations of the collected dataset were calculated. Statistical significance was evaluated using one-way ANOVA followed by Tukey’s multiple comparisons test. This analysis was applied to the bacterial growth curve, lactic acid production, and glucose consumption. A Student t-test was used to evaluate the statistical differences for the yields and the kinetic parameters.

3. Results and Discussion

3.1. Microbiological and Chemical Analyses

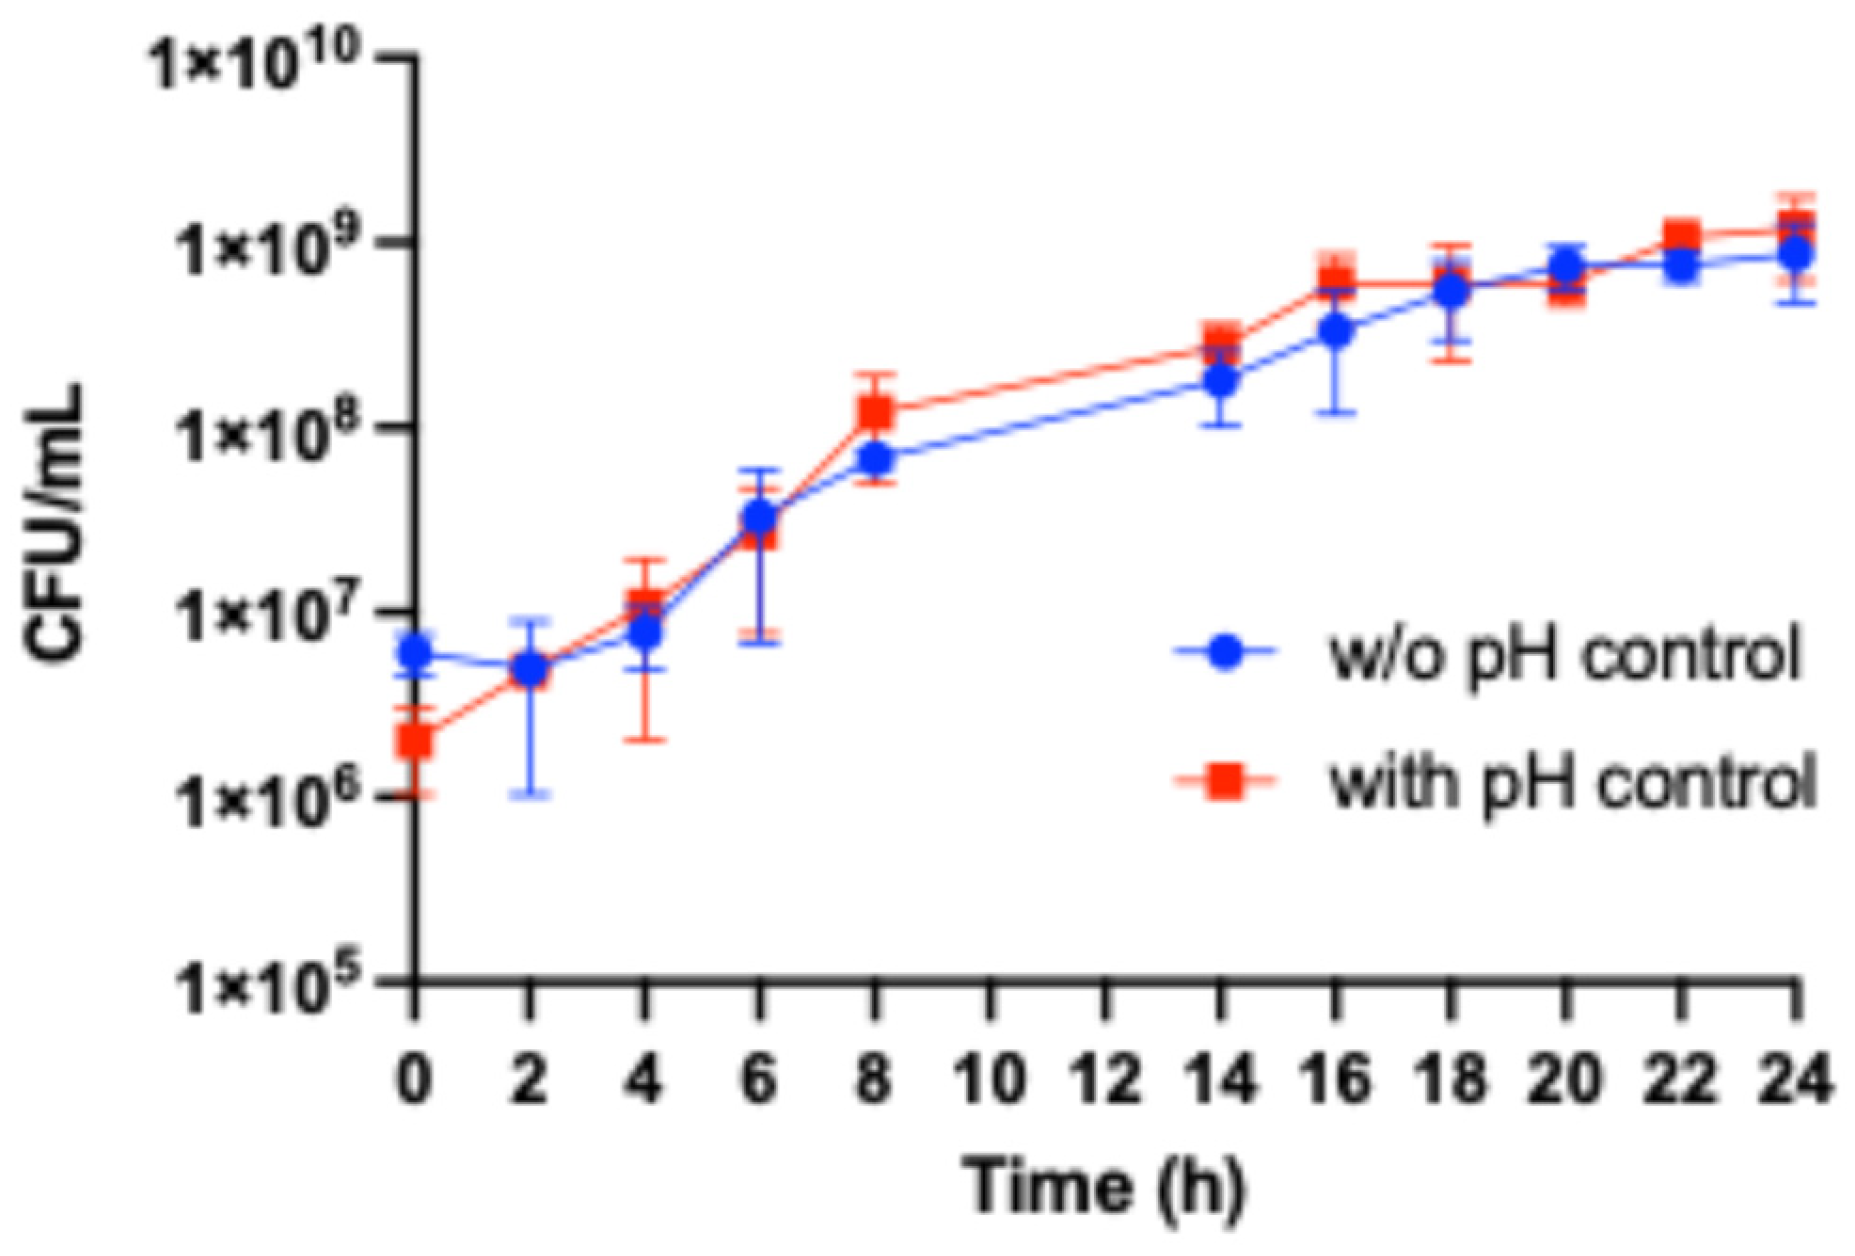
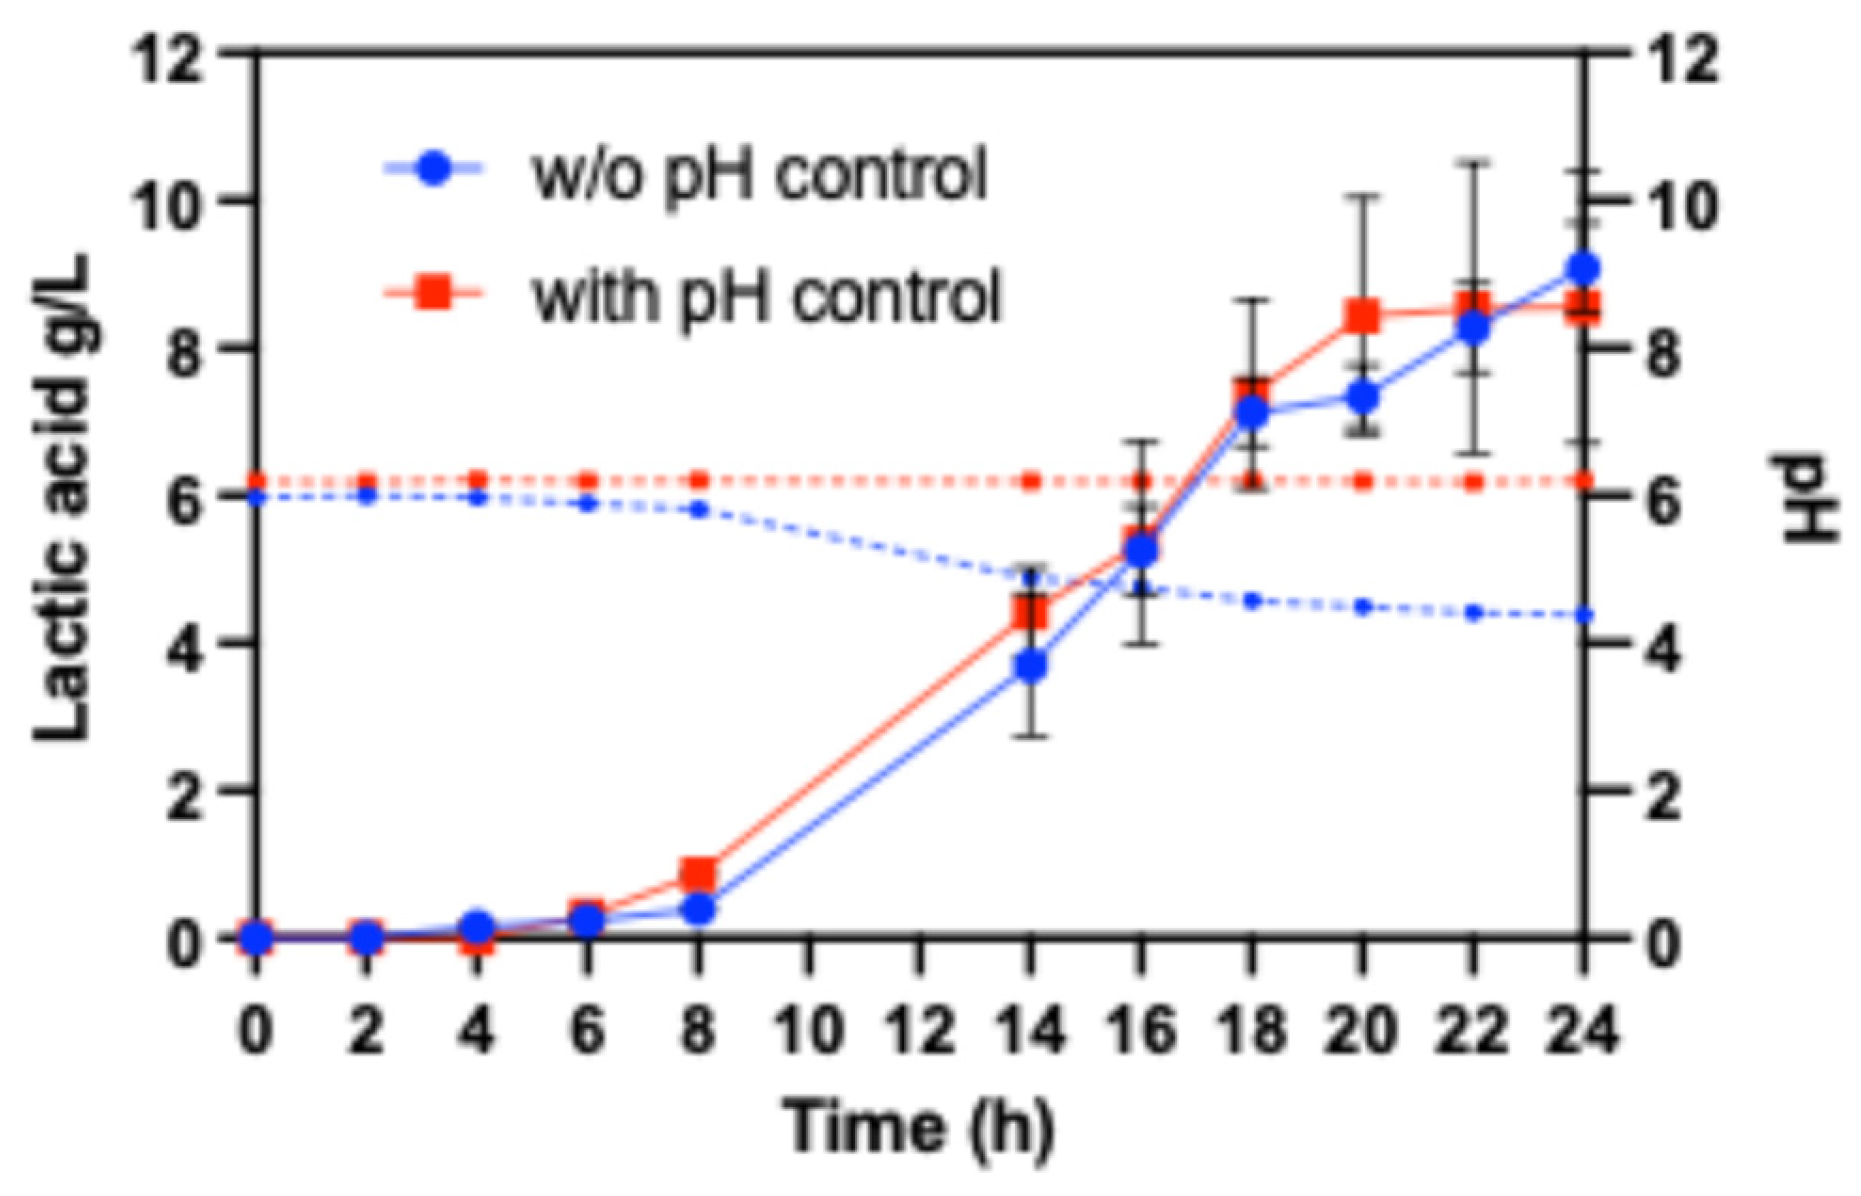
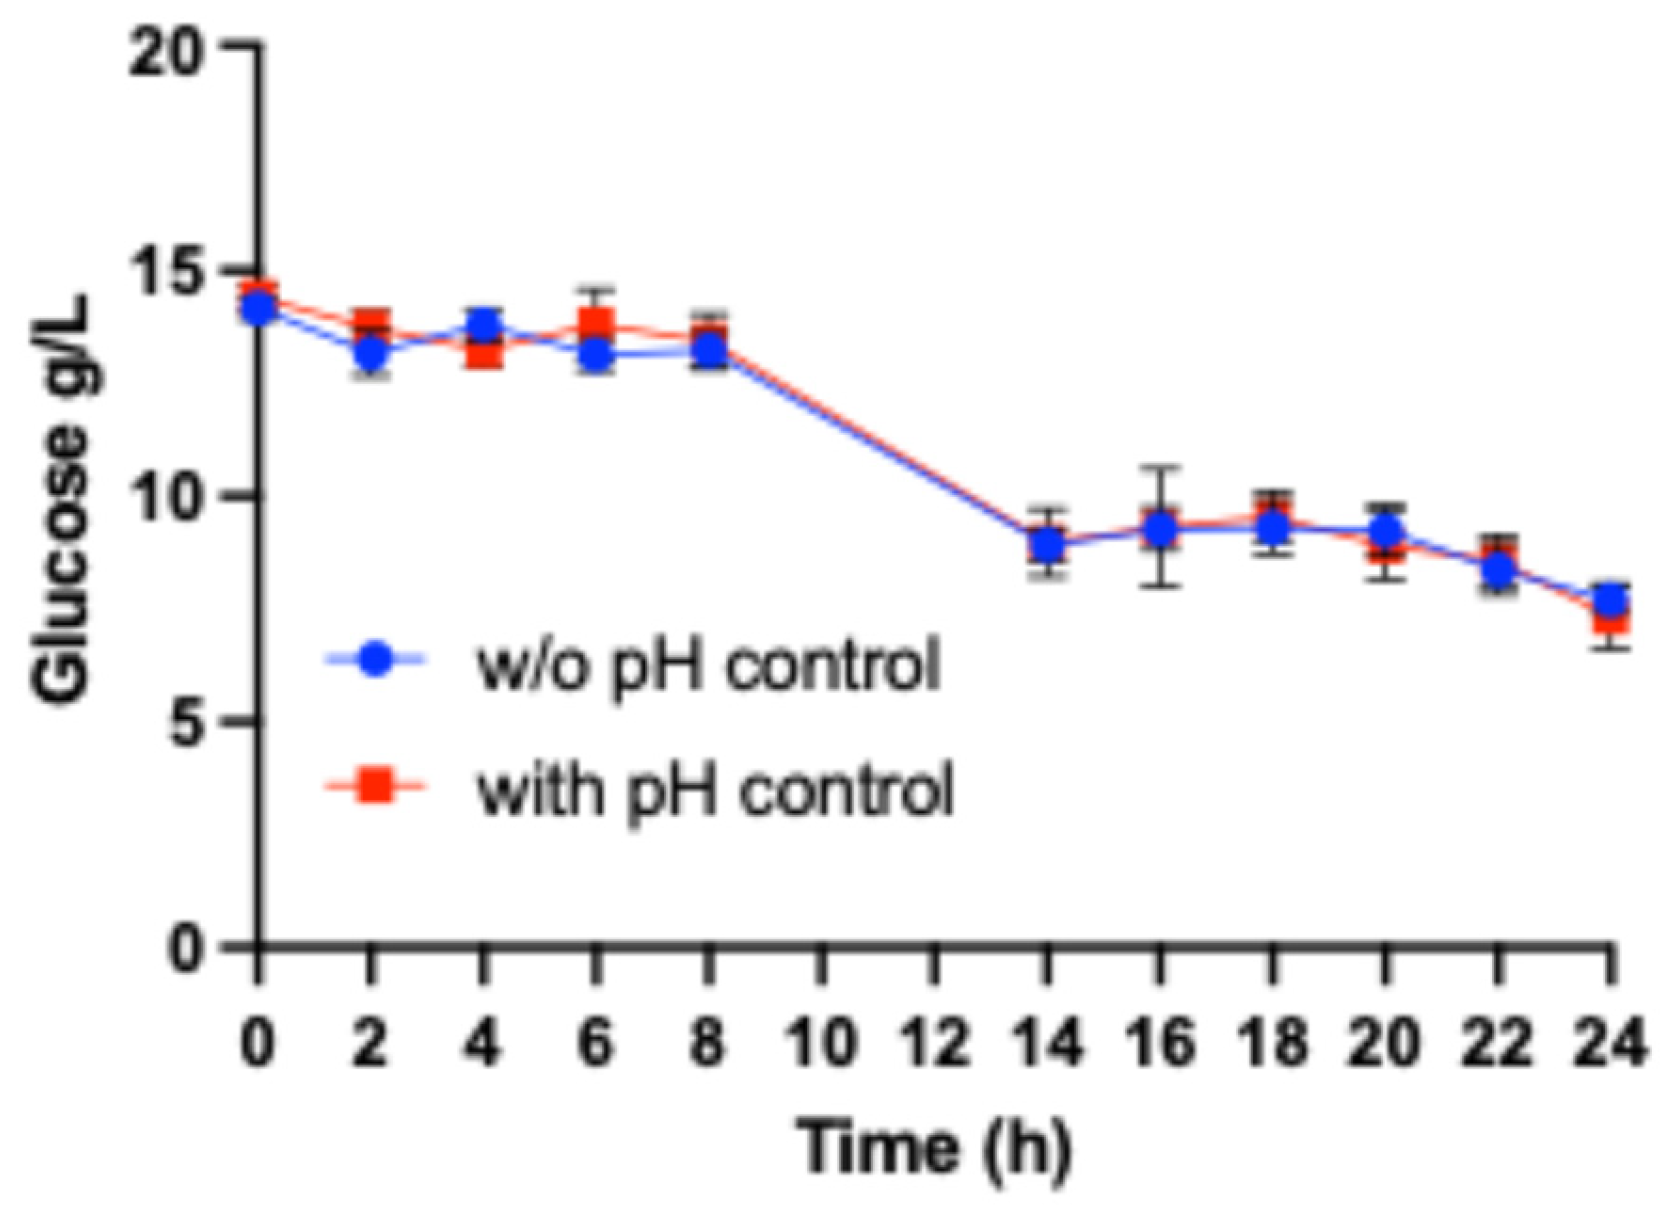
Oat samples were collected during fermentation trials conducted with and without pH control and were characterized from both microbiological and chemical perspectives. Figure 2, Figure 3 and Figure 4 compare the bacterial growth, lactic acid production, and glucose reduction, respectively, recorded during 24-h processes performed with and without pH control.
As it is possible to note from Figure 2, a perfect overlap of the bacterial growth trend was observed up to 24 h of fermentation, reaching final bacterial concentrations of 8.70 × 10⁸ ± 3.99 × 10⁸ CFU/mL and 1.19 × 10⁹ ± 5.70 × 10⁸ CFU/mL without and with pH control, respectively.
In Figure 3, a similar trend in lactic acid content produced under both pH conditions can be observed.
In both cases, lactic acid started to be produced after 4 h of process; subsequently, it increased steadily up to 24 h of fermentation, reaching no significantly different concentrations of 9.08 ± 0.616 g/L and 8.56 ± 1.85 g/L, without and with controlling pH, respectively.
Regarding the pH behavior during the two processes shown in Figure 3, a constant value of 6.20 was maintained when the control with NaOH solution was adopted. In contrast, it progressively decreased in non-controlled pH conditions, according to the trend of the lactic acid content, until reaching a minimum value of 4.39 ± 0.02.
Glucose consumption was evaluated at the same sampling times considered for bacterial growth and lactic acid production, and the representative consumption curves are shown in Figure 4.
The glucose reduction observed during both processes was perfectly comparable: the glucose concentration in the oat suspension at time t0 was close to 14 g/L; then, it decreased as the fermentation proceeded until reaching not significantly different concentrations of 7.70 ± 0.30 g/L and 7.33 ± 0.72 g/L after 24 h with and without pH control, respectively, with overall consumptions of 6.47 g/L and 7.07 g/L. However, the results obtained for bacterial growth and lactic acid content partially contrast with those in previous literature investigations. Guyot et al. [35] fermented an MRS broth with L. manihotivorans LMG 18010T; the pH control allowed for an increase in both bacterial and lactic acid concentrations. Similarly, Mussatto et al. [36] evaluated the effect of pH control on the bacterial growth and lactic acid production of L. delbrueckii UFV H2B20 on a hydrolysate obtained from brewer’s spent grain: they found no differences between the fermentation carried out with and without pH control for up to 12 h of the process. However, after this time, by controlling the pH at 6.0, the fermentation continued actively until 60 h of the process; conversely, when the pH was left uncontrolled, the process appeared to halt. The authors justified the differences by claiming that the pH reached after 12 h of fermentation (4.6) significantly influenced the subsequent metabolic behavior of the microorganisms. Although a similar pH value of 4.39 ± 0.02 was achieved during the last exponential phase of the microorganism in both controlled and non-controlled conditions, in the current work, there was no significant improvement in bacterial growth rate or lactic acid metabolism when the pH was maintained at 6.20.
Gallo et al. [19] used L. paracasei CBA L74 to ferment rice, either controlling the pH at 5.8 or not, over 24 h. In the final hours of fermentation, bacterial growth trends were similar in both cases; however, there was a significant increase in lactic acid production when the pH was controlled. This likely resulted from the notable pH drop to 3.5 ± 0.06 after 24 h of fermentation when pH was not regulated. Thus, a low pH was not suitable for optimal metabolic activity of the microorganism compared to the pH-controlled process. Conversely, in this study, it is plausible that the pH during the final stages of fermentation did not restrict the microorganism’s metabolic activity, as it remained well above the lactic acid pKa (3.86) [37]. When pH remains above the pKa of lactic acid, it predominantly exists in the lactate form; this might have contributed to limiting the product inhibition phenomena throughout the 24 h of fermentation performed without pH control. Although this hypothesis was not directly verified in the present study, it could explain the absence of substantial differences in lactic acid yields between controlled and non-controlled pH conditions. Finally, the results obtained are certainly strain-specific, as evidenced by studies in the literature on different Lactobacilli. For example, Giraud et al. [38] demonstrated that lowering the pH to 4 in Lactobacillus plantarum cultures reduced the growth rate without significantly affecting the overall biomass or metabolite yields. In addition, a more recent investigation on Lactobacillus acidophilus CCFM137 reported that maintaining the fermentation pH at 4.5 improved the fermentative performance compared to higher pH conditions [39].
Furthermore, oat samples collected before and after fermentation under both pH conditions were characterized for total polyphenol content (TPC), total flavonoid content (TFC), and antioxidant activity (AA), as these parameters were chosen as indicators of fermentation-related modifications. The results are summarized in Table 2.
As shown in Table 2, under both pH conditions, all the parameters analyzed appeared to decrease after 24 h of fermentation. However, the differences were not statistically significant, indicating that fermentation did not affect the phytochemical parameters. Additionally, a comprehensive overview of these parameters across multiple sampling points is presented in the Supplementary Materials under both controlled and uncontrolled pH conditions (Table S1).
Lentini et al. [4], who further investigated oat fermentation and found the same result, observed that a previously applied thermal sterilization treatment increased the polyphenol content more than subsequent fermentation. James et al. [40] found that longer fermentation times significantly decreased the total polyphenols and flavonoids in some legumes. They hypothesized that this decrease could be due to several factors, such as polyphenol oxidase activity, leaching of lipophilic polyphenols into the medium, and their oxidation. However, a notable increase in total phenolic content was observed in red beans, suggesting that the phenomenon may depend on the matrix [41]. Natural matrices can contain different bound phenolic compounds, which are bonded with polysaccharides and other macromolecules to varying degrees. Therefore, they may respond differently to thermal treatments or fermentation, either retaining or releasing polyphenols in free form [42]. Conversely, several studies show that fermentation with specific yeasts can significantly boost antioxidant activity, total polyphenol content, total flavonoids, and total tannins in green coffee beans over time [43].
Regarding operating conditions during fermentation, pH control did not appear to be a crucial factor influencing phenol, flavonoid content, or antioxidant activity. However, in a study on palm juice [28], the higher the pH setting, the higher the final TPC (best result at 5.5) and TFC (best result at 6.5) after 72 h of fermentation. The controversial result achieved in our study may depend on two reasons: the first is that the pH reached during the free-pH fermentation was not extremely acidic; the second is that each phenolic species can show a different pH-sensitivity, with an altered stability depending on both the pH values and the structure of the molecule [44].

3.2. Fermentation Process Yields

Cell yield and product yield were calculated according to Equations (1) and (2) for the two conditions explored (with and w/o pH control). The results are summarized in Table 3.
According to the fermentation results previously described, controlling the pH did not improve either the cell yield or the product yield. The fungal species Rhizopus arrhizus studied by Jin et al. [45] produced a lactic acid yield of 0.94 mg mg−1 of starch or sugars when using waste streams as the fermenting substrate under no pH control conditions.
Similarly, Moon et al. [46] reported that a fermentation using L. paracasei subsp. paracasei in MRS medium, controlling the pH at 6.5, reached a lactic acid yield of 0.95 mg per mg after 48 h. Both values were lower than those observed in this study.
Consistent observations have also been reported for other cereal-based fermentations: Li et al. [47] showed that wheat-bran hydrolysates supported efficient lactic acid production by L. rhamnosus, (0.99 g g−1), in line with the high fermentability observed in our oat-based system.

3.3. Bacterial Growth Parameters

Generation numbers (n), doubling times (td), and constant growth rate (k) were evaluated for fermentations performed with and without controlling pH, as summarized in Table 4.
As shown in Table 4, the process, whether or not the pH was controlled, exhibited similar generation numbers, doubling times, and constant growth rates, as expected.
A similar study was conducted by Colucci Cante et al. [48] for rice fermentations performed for 24 h with and without pH control using the same microorganism L. paracasei CBA L74; a similar number of generations to those determined in this study, but a higher constant growth rate (w/o pH control: k = 0.66 h−1; with pH control: k = 0.83 h−1) and a shorter doubling time (w/o pH control: td = 1.52 h; with pH control td = 1.21 h) were found. In the present study, the evaluation of the kinetic parameters accurately reflected the similarity of the growth curves constructed for each process condition and previously discussed. Finally, given the absence of a significant improvement in fermentation performance and phytochemical characteristics when controlling pH throughout the process, free-pH fermentation was selected as the first optimized unit operation for oat-based postbiotic production, due to its greater affordability in terms of process productivity and energy consumption.

3.4. Spray-Drying Optimization Process

The wet postbiotic resulting from fermentation at an uncontrolled pH and thermal inactivation of the biomass was then subjected to an optimization study aimed at maximizing the spray drying process yield, according to Equation (3), and minimizing the moisture content of the resulting dried products.
The study was divided into two parts: in the first phase, the formulation was optimized by evaluating the optimal dilution degree of the substrate, such as to avoid nozzle fouling problems, and the optimal concentration of maltodextrins used as a bulking agent. Table 5 reports the results of Phase 1.
The oat-based viscous wet postbiotic caused fouling and nozzle clogging during the spray-drying process, making it impossible to recover the final postbiotic product from the collection chamber. Consequently, in subsequent tests, the suspension was diluted with water to lower its viscosity.
As reported in Table 5, the liquid postbiotic diluted 1:4 allowed for a process yield of 56.5 ± 0.71% but a final product relative humidity of 8.16 ± 0.22%. From an industrial perspective, preserving a dry product requires a residual humidity of less than 5%. For this reason, starting from formulation 5, which led to the highest drying efficiency, a bulk material (maltodextrin) was added to compensate for any loss of physical properties and stability caused by the sample dilution (necessary to avoid fouling of the atomizer), thus obtaining both high efficiency and low humidity in the final product. Therefore, tests 6 and 7 were conducted by adding maltodextrins in ratios ((1:0.5) and (1:1)) relative to the initial solids content present in the external liquid (equal to 15%). All tests performed during Phase 1 were conducted without changing the feed flow rate, air flow rate, air temperature, and atomizer pressure value. As reported in Table 5, formulations 6 and 7 showed a recovery yield comparable to formulation 5 but significantly improved the final relative humidity of the product.
In particular, Test 7, where maltodextrins were added in a (1:1) ratio to the initial solids content of the liquid postbiotic, produced a residual moisture value of 3.9 ± 0.14%, which is acceptable at the industrial level. As expected, the addition of maltodextrins made the process more efficient, as it significantly increased the glass transition temperature of the feed suspension and reduced the hygroscopicity of the dried products [49].
At this point, the second phase of the study was conducted by setting up tests with formulation 7 but varying some operating parameters of the process, such as the atomizing pressure and inlet temperature of the air, which could be manipulated. It was chosen to conduct the subsequent tests by reducing the incoming air temperature to prevent thermal degradation of the bioactive compounds, reduce the risk of forming burnt or degraded particles, reduce energy consumption, and, above all, avoid an excessively sticky consistency and an inhomogeneous particle distribution of the final product.
However, since decreasing the incoming air’s temperature (Tair-IN) could cause a slowing of the solvent’s evaporation rate, an increase in the pressure at the atomizer (Patomization) was realized, allowing for the production of smaller droplets with a larger evaporation surface, thus ensuring more efficient drying.
Table 6 presents the tested formulation, the adopted operating parameters, the process yield, and the relative humidity achieved during Phase 2 of this experiment.
By progressively decreasing the inlet air temperature in the drying chamber (Tair-IN, 200 °C, 160 °C, and 140 °C) and increasing the atomization pressure (Patomization, 3.2 bar, 4 bar, and 4.5 bar, respectively), the process performance worsened in terms of yield and relative humidity in the final product.
As a result of the optimization study of the drying operating parameters, test 7 continued to provide the best yield and relative humidity performance at 57.40 ± 0.57% and 3.90 ± 0.14%, respectively. Similarly, Gül et al. [50] attempted to optimize the spray-drying parameters for a cereal-based fermented beverage. They conducted their experiments with an inlet air temperature set at 180 °C and a feed rate of 9.5 mL/min. The resulting process yield was 30.29%, which is lower than the yield obtained for formulation 7. However, the relative humidity achieved was significantly lower, measuring 0.2%. Finally, the increase in atomization pressure did not compensate for the slowdown in drying caused by the lower air temperature, failing to improve the yields achieved in test 7, which proved to be the most promising in terms of feed formulation and drying parameters. Possible strategies include appropriate modulation of the airflow rate and feeding higher-solid-content suspensions by properly reducing dilution or increasing the maltodextrin amount, thereby improving the final yields and residual humidity. In addition, the outlet air temperatures (T_air-out) recorded during each spray-drying test are also reported in Table 5 and Table 6. Although this parameter could not be independently adjusted in our laboratory-scale equipment, its inclusion provides a clearer picture of the thermal profile experienced by the product during drying and helps contextualize the observed differences in yield and residual humidity.
It should be noted that the spray dryer used in this study is a bench-top laboratory system, which does not allow for the modulation of several key industrial variables such as feed rate, cyclone separation efficiency, or precise control of T air-out.
These parameters are indeed critical for full process optimization at the pilot and industrial scale, and will represent essential targets for future scale-up studies.
Based on the trends observed here, it is reasonable to expect that higher cyclone efficiency and optimized feed rates would improve powder recovery, while more accurate thermal control could further reduce residual moisture and enhance product stability. These considerations outline the technological direction for future development, building upon the optimized formulation and operating conditions identified in the present work.

4. Conclusions

This work optimized the lab-scale production process for a fermented postbiotic product derived from oats. Among the fermented functional foods, postbiotics are gaining increasing attention, alongside the more popular pro- and prebiotic product categories currently on the market. A postbiotic is a ‘preparation of inanimate microorganisms and/or their components that confer a health benefit to the host’. To obtain the postbiotic, a probiotic microorganism was used to ferment an oat suspension under two conditions: free pH and controlled pH at 6.2 throughout the fermentation (24 h). Once the optimal fermentation conditions were defined, which, from an economic point of view, can be characterized by the free pH, the spray drying of the fermented and inactivated oat suspension was investigated. In particular, the degree of substrate dilution required to avoid nozzle fouling and the concentration of maltodextrins used as bulking agents were optimized, and certain operating parameters (such as atomization pressure and inlet air temperature) were set to maximize the yield of dried postbiotic recovered. In the present work, no statistically significant differences were found in either bacterial growth or lactic acid, suggesting that the pH obtained did not significantly alter lactobacilli metabolism. Regarding the functional properties, although the markers studied in this work (total polyphenols, total flavonoids, and antioxidant activity) did not vary, this does not exclude the possibility that other characteristics may be influenced by the pH of the fermentation process. Prospects include performing a complete economic evaluation to confirm the feasibility of the free pH-process, which is preliminary and fundamental for both pilot and industrial-scale-up investigations; moreover, an in vitro biological assay can be carried out to assess whether the process also influences the biological properties of the final postbiotic product.

Supplementary Materials

The following supporting information can be downloaded at: https://www.mdpi.com/article/10.3390/app16126107/s1, Table S1: Total Polyphenol Content (TPC), Total Flavonoid Content (TFC), and Antioxidant Activity (AA) measured at the beginning (T0), after 18 h (T18), 24 h (T24), and 48 h (T48) of the fermentations carried out without and with pH control. The postbiotic product (P), obtained after 24 h of fermentation without pH control and subsequently subjected to thermal inactivation and spray-drying, was also evaluated. The same lowercase letters in the same columns indicate non-statistically significant differences (p > 0.05). GAE: gallic acid equivalents; QE: quercetin equivalents; TE: Trolox equivalents.

Author Contributions

Conceptualization, F.P., G.L., M.G. and R.N.; methodology, F.P., G.L., M.G. and R.C.C.; validation, F.P., G.L., M.G. and R.C.C.; formal analysis, F.P., G.L., M.G., R.C.C. and F.N.; investigation, F.P., G.L., M.G., R.C.C. and F.N.; resources, A.L.B.; data curation, F.P., G.L. and M.G.; writing—original draft preparation, F.P., G.L. and R.C.C.; supervision, R.N. and A.L.B. All authors have read and agreed to the published version of the manuscript.

Funding

This research received no external funding.

Data Availability Statement

Data is contained within the article or Supplementary Material.

Conflicts of Interest

Authors Francesca Passannanti, Giulia Lentini, Marianna Gallo, Rosa Colucci Cante and Federica Nigro were employed by the company I. T. P. Innovation and Technology Provider S.r.l. The remaining authors declare that the research was conducted in the absence of any commercial or financial relationships that could be construed as a potential conflict of interest.

References

  1. European Union. The European Parliament and the CRegulation (ec) no 1924/2006 of the European Parliament and of the Council on Nutrition and Health Claims made on Foods CELEX 32006R1924 En TXT. Off. J. Eur. Union. 2006, 404, 9–25. [Google Scholar]
  2. Rasane, P.; Jha, A.; Sabikhi, L.; Kumar, A.; Unnikrishnan, V.S. Nutritional Advantages of Oats and Opportunities for Its Processing as Value Added Foods—A Review. J. Food Sci. Technol. 2015, 52, 662. [Google Scholar] [CrossRef] [PubMed]
  3. Paudel, D.; Dhungana, B.; Caffe, M.; Krishnan, P. A Review of Health-Beneficial Properties of Oats. Foods 2021, 10, 2591. [Google Scholar] [CrossRef] [PubMed]
  4. Lentini, G.; Nigro, F.; Cante, R.; Passannanti, F.; Gallo, M.; Budelli, A.; Nigro, R. Functional Properties of an Oat-Based Postbiotic Aimed at a Potential Cosmetic Formulation. Fermentation 2022, 8, 632. [Google Scholar] [CrossRef]
  5. Djorgbenoo, R.; Hu, J.; Hu, C.; Sang, S. Fermented Oats as a Novel Functional Food. Nutrients 2023, 15, 3521. [Google Scholar] [CrossRef] [PubMed]
  6. Salminen, S.; Collado, M.C.; Endo, A.; Hill, C.; Lebeer, S.; Quigley, E.M.M.; Sanders, M.E.; Shamir, R.; Swann, J.R.; Szajewska, H.; et al. The International Scientific Association of Probiotics and Prebiotics (ISAPP) Consensus Statement on the Definition and Scope of Postbiotics. Nat. Rev. Gastroenterol. Hepatol. 2021, 18, 649–667. [Google Scholar] [CrossRef] [PubMed]
  7. Colucci Cante, R.; Nigro, F.; Passannanti, F.; Lentini, G.; Gallo, M.; Nigro, R.; Budelli, A.L. Gut Health Benefits and Associated Systemic Effects Provided by Functional Components from the Fermentation of Natural Matrices. Compr. Rev. Food Sci. Food Saf. 2024, 23, e13356. [Google Scholar] [CrossRef] [PubMed]
  8. Taverniti, V.; Guglielmetti, S. The Immunomodulatory Properties of Probiotic Microorganisms beyond Their Viability (Ghost Probiotics: Proposal of Paraprobiotic Concept). Genes Nutr. 2011, 6, 261–274. [Google Scholar] [CrossRef] [PubMed]
  9. Luan, X.; Campanucci, V.A.; Nair, M.; Yilmaz, O.; Belev, G.; Machen, T.E.; Chapman, D.; Ianowski, J.P. Pseudomonas Aeruginosa Triggers CFTR-Mediated Airway Surface Liquid Secretion in Swine Trachea. Proc. Natl. Acad. Sci. USA 2014, 111, 12930–12935. [Google Scholar] [CrossRef] [PubMed]
  10. Braido, F.; Tarantini, F.; Ghiglione, V.; Melioli, G.; Canonica, G.W. Bacterial Lysate in the Prevention of Acute Exacerbation of COPD and in Respiratory Recurrent Infections. Int. J. Chron. Obstruct Pulmon Dis. 2007, 2, 335–345. [Google Scholar] [PubMed]
  11. Żółkiewicz, J.; Marzec, A.; Ruszczyński, M.; Feleszko, W. Postbiotics-A Step Beyond Pre- and Probiotics. Nutrients 2020, 12, 2189. [Google Scholar] [CrossRef] [PubMed]
  12. Ahlawat, A.; Basak, S.; Ananthanarayan, L. Formulation of a Probiotic Buttermilk Powder Using Cell Protectants by Spray Drying and Estimation of Its Shelf-Stability. Int. Dairy J. 2023, 141, 105616. [Google Scholar] [CrossRef]
  13. Sharma, R.; Rashidinejad, A.; Jafari, S.M. Application of Spray Dried Encapsulated Probiotics in Functional Food Formulations. Food Bioprocess Technol. 2022, 15, 2135–2154. [Google Scholar] [CrossRef]
  14. Singh, D.; Chand, K.; Sahal, A.; Kumar, S.; Hussain, A. Optimization of Fermentation Parameters and Their Impact on the Final Properties of the Cereal-Legume-Based Fermented Product. J. Stored Prod. Res. 2024, 106, 102302. [Google Scholar] [CrossRef]
  15. Yang, Y.; Lan, G.; Tian, X.; He, L.; Li, C.; Zeng, X.; Wang, X. Effect of Fermentation Parameters on Natto and Its Thrombolytic Property. Foods 2021, 10, 2547. [Google Scholar] [CrossRef] [PubMed]
  16. Trontel, A.; Baršić, V.; Slavica, A.; Šantek, B.; Novak, S. Modelling the Effect of Different Substrates and Temperature on the Growth and Lactic Acid Production by Lactobacillus Amylovorus DSM 20531T in Batch Process. Food Technol. Biotechnol. 2010, 48, 352–361. [Google Scholar]
  17. Lv, X.; Yu, B.; Tian, X.; Chen, Y.; Wang, Z.; Zhuang, Y.; Wang, Y. Effect of PH, Glucoamylase, Pullulanase and Invertase Addition on the Degradation of Residual Sugar in L-Lactic Acid Fermentation by Bacillus Coagulans HL-5 with Corn Flour Hydrolysate. J. Taiwan. Inst. Chem. Eng. 2016, 61, 124–131. [Google Scholar] [CrossRef]
  18. Aguilar, C.; Klotz, B. Effect of the Temperature on the Antagonistic Activity of Lactic Acid Bacteria against Escherichia Coli and Listeria Monocytogenes. J. Food Saf. 2010, 30, 996–1015. [Google Scholar] [CrossRef]
  19. Gallo, M.; Nigro, F.; Passannanti, F.; Nanayakkara, M.; Lania, G.; Parisi, F.; Salameh, D.; Budelli, A.; Barone, M.V.; Nigro, R. Effect of PH Control during Rice Fermentation in Preventing a Gliadin P31-43 Entrance in Epithelial Cells. Int. J. Food Sci. Nutr. 2019, 70, 950–958. [Google Scholar] [CrossRef] [PubMed]
  20. Shishir, M.R.I.; Chen, W. Trends of Spray Drying: A Critical Review on Drying of Fruit and Vegetable Juices. Trends Food Sci. Technol. 2017, 65, 49–67. [Google Scholar] [CrossRef]
  21. Truong, V.; Bhandari, B.R.; Howes, T. Optimization of Cocurrent Spray Drying Process for Sugar-Rich Foods. Part II—Optimization of Spray Drying Process Based on Glass Transition Concept. J. Food Eng. 2005, 71, 66–72. [Google Scholar] [CrossRef]
  22. Sobulska, M.; Zbicinski, I. Advances in Spray Drying of Sugar-Rich Products. Dry. Technol. 2021, 39, 1774–1799. [Google Scholar] [CrossRef]
  23. Yousefi, S.; Emam-Djomeh, Z.; Mousavi, S.M. Effect of Carrier Type and Spray Drying on the Physicochemical Properties of Powdered and Reconstituted Pomegranate Juice (Punica granatum L.). J. Food Sci. Technol. 2011, 48, 677–684. [Google Scholar] [CrossRef] [PubMed]
  24. Roggero, P.; Liotto, N.; Pozzi, C.; Braga, D.; Troisi, J.; Menis, C.; Giannì, M.L.; Berni Canani, R.; Paparo, L.; Nocerino, R.; et al. Analysis of Immune, Microbiota and Metabolome Maturation in Infants in a Clinical Trial of Lactobacillus paracasei CBA L74-Fermented Formula. Nat. Commun. 2020, 11, 2703. [Google Scholar] [CrossRef] [PubMed]
  25. Corsello, G.; Carta, M.; Marinello, R.; Picca, M.; De Marco, G.; Micillo, M.; Ferrara, D.; Vigneri, P.; Cecere, G.; Ferri, P.; et al. Preventive Effect of Cow’s Milk Fermented with Lactobacillus paracasei CBA L74 on Common Infectious Diseases in Children: A Multicenter Randomized Controlled Trial. Nutrients 2017, 9, 669. [Google Scholar] [CrossRef] [PubMed]
  26. Nocerino, R.; Paparo, L.; Terrin, G.; Pezzella, V.; Amoroso, A.; Cosenza, L.; Cecere, G.; De Marco, G.; Micillo, M.; Albano, F.; et al. Cow’s Milk and Rice Fermented with Lactobacillus paracasei CBA L74 Prevent Infectious Diseases in Children: A Randomized Controlled Trial. Clin. Nutr. 2017, 36, 118–125. [Google Scholar] [CrossRef] [PubMed]
  27. Sarno, M.; Lania, G.; Cuomo, M.; Nigro, F.; Passannanti, F.; Budelli, A.; Fasano, F.; Troncone, R.; Auricchio, S.; Barone, M.V.; et al. Lactobacillus paracasei CBA L74 Interferes with Gliadin Peptides Entrance in Caco-2 Cells. Int. J. Food Sci. Nutr. 2014, 65, 953–959. [Google Scholar] [CrossRef] [PubMed]
  28. Ghosh, S.; Chakraborty, R.; Raychaudhuri, U. Determination of PH-Dependent Antioxidant Activity of Palm (Borassus Flabellifer) Polyphenol Compounds by Photoluminol and DPPH Methods: A Comparison of Redox Reaction Sensitivity. 3 Biotech 2015, 5, 633–640. [Google Scholar] [CrossRef] [PubMed]
  29. Gallo, M.; Passannanti, F.; Schioppa, C.; Montella, S.; Colucci Cante, R.; Nigro, F.; Budelli, A.; Nigro, R. Enzymatic Pretreatment and Lactic Fermentation of Wheat Flour Suspension at a High Solid Content. J. Food Process Preserv. 2021, 45, e15299. [Google Scholar] [CrossRef]
  30. Aikpokpodion, P.; Dongo, L. Effect of Fermentation Intensity on Polyphenols and Antioxidant Capacity of Cocoa Beans. Int. J. Sustain. Crop Prod. 2010, 5, 66–70. [Google Scholar]
  31. Colucci Cante, R.; Gallo, M.; Nigro, F.; Vitelli, C.; Passannanti, F.; Budelli, A.L.; Nigro, R. Optimization of Mixing Conditions for Improving Lactobacillus paracasei Cba L74’ S Growth During Lactic Fermentation of Cooked Navy Beans and Functional Characterization of the Fermented Products. Chem. Eng. Trans. 2022, 93, 313–318. [Google Scholar] [CrossRef]
  32. Colucci Cante, R.; Recupero, A.; Prata, T.; Nigro, F.; Passannanti, F.; Gallo, M.; Lentini, G.; Nigro, R.; Budelli, A.L. Valorisation through Lactic Fermentation of Industrial Wastewaters from a Bean Blanching Treatment. Fermentation 2023, 9, 350. [Google Scholar] [CrossRef]
  33. Thaipong, K.; Boonprakob, U.; Crosby, K.; Cisneros-Zevallos, L.; Hawkins Byrne, D. Comparison of ABTS, DPPH, FRAP, and ORAC Assays for Estimating Antioxidant Activity from Guava Fruit Extracts. J. Food Compos. Anal. 2006, 19, 669–675. [Google Scholar] [CrossRef]
  34. Maier, R.M. Bacterial Growth. In Environmental Microbiology; Academic Press: Cambridge, MA, USA, 2009; pp. 37–54. [Google Scholar] [CrossRef]
  35. Guyot, J.P.; Calderon, M.; Morlon-Guyot, J. Effect of PH Control on Lactic Acid Fermentation of Starch by Lactobacillus Manihotivorans LMG 18010(T). J. Appl. Microbiol. 2000, 88, 176–182. [Google Scholar] [CrossRef] [PubMed]
  36. Mussatto, S.I.; Fernandes, M.; Mancilha, I.M.; Roberto, I.C. Effects of Medium Supplementation and PH Control on Lactic Acid Production from Brewer’s Spent Grain. Biochem. Eng. J. 2008, 40, 437–444. [Google Scholar] [CrossRef]
  37. Hongo, M.; Nomura, Y.; Iwahara, M. Novel Method of Lactic Acid Production by Electrodialysis Fermentation. Appl. Environ. Microbiol. 1986, 52, 314–319. [Google Scholar] [CrossRef] [PubMed]
  38. Giraud, E.; Brauman, A.; Keleke, S. Isolation and physiological study of an amylolytic strain of Lactobacillus plantarum. Appl. Microbiol. Biotechnol. 1991, 36, 379–383. [Google Scholar] [CrossRef]
  39. Yan, S.-Q.; Shi, Y.-Y.; Yang, R.; Li, R.; Hang, F.; Zhang, H. Boosting Probiotic Biomass of Lactobacillus acidophilus CCFM137 Through pH-Stat Morphological Control and Medium Optimization. Fermentation 2025, 11, 564. [Google Scholar] [CrossRef]
  40. James, S.; Nwabueze, T.; Ndife, J.; Onwuka, G.; Ata’Anda Usman, M. Influence of Fermentation and Germination on Some Bioactive Components of Selected Lesser Legumes Indigenous to Nigeria. J. Agric. Food Res. 2020, 2, 100086. [Google Scholar] [CrossRef]
  41. Gan, R.; Lui, W.; Wu, K.; Corke, H. Thermal Treatments Affect the Polyphenol Profile and Increase Antioxidant Capacity in Five Varieties of Edible Bean Milks. Int. J. Food Sci. Technol. 2016, 51, 954–961. [Google Scholar] [CrossRef]
  42. Călinoiu, L.; Vodnar, D. Thermal Processing for the Release of Phenolic Compounds from Wheat and Oat Bran. Biomolecules 2019, 10, 21. [Google Scholar] [CrossRef] [PubMed]
  43. Haile, M.; Kang, W.H. Antioxidant Activity, Total Polyphenol, Flavonoid and Tannin Contents of Fermented Green Coffee Beans with Selected Yeasts. Fermentation 2019, 5, 29. [Google Scholar] [CrossRef]
  44. Friedman, M.; Jürgens, H.S. Effect of PH on the Stability of Plant Phenolic Compounds. J. Agric. Food Chem. 2000, 48, 2101–2110. [Google Scholar] [CrossRef] [PubMed]
  45. Jin, B.; Yin, P.; Ma, Y.; Zhao, L. Production of Lactic Acid and Fungal Biomass by Rhizopus Fungi from Food Processing Waste Streams. J. Ind. Microbiol. Biotechnol. 2005, 32, 678–686. [Google Scholar] [CrossRef] [PubMed]
  46. Moon, S.K.; Wee, Y.J.; Choi, G.W. A Novel Lactic Acid Bacterium for the Production of High Purity L-Lactic Acid, Lactobacillus paracasei Subsp. Paracasei CHB2121. J. Biosci. Bioeng. 2012, 114, 155–159. [Google Scholar] [CrossRef] [PubMed]
  47. Li, Z.; Han, L.; Ji, Y.; Wang, X.; Tan, T. Fermentative production of L-lactic acid from hydrolysate of wheat bran by Lactobacillus rhamnosus. Biochem. Eng. J. 2010, 49, 138–142. [Google Scholar] [CrossRef]
  48. Colucci Cante, R.; Gallo, M.; Nigro, F.; Passannanti, F.; Budelli, A.; Nigro, R. Mathematical Modeling of Lactobacillus paracasei CBA L74 Growth during Rice Flour Fermentation Performed with and without PH Control. Appl. Sci. 2021, 11, 2921. [Google Scholar] [CrossRef]
  49. Goula, A.M.; Adamopoulos, K.G. Effect of Maltodextrin Addition during Spray Drying of Tomato Pulp in Dehumidified Air: II. Powder Properties. Dry. Technol. 2008, 26, 726–737. [Google Scholar] [CrossRef]
  50. Gül, O.; Atalar, İ.; Törnük, F.; Akgün, A. Process Optimization of a Cereal-Based Fermented Beverage (Boza) Powder and Investigating Upscaling Conditions. J. Food Process Eng. 2023, 46, e14248. [Google Scholar] [CrossRef]
Figure 1. The layout of the experimental campaign shown in the present work.
Applsci 16 06107 g001
Figure 2. Bacterial growth (CFU/mL) curves observed during the fermentations carried out with and without pH control. Each result is the mean value of a triplicate, and the error bars represent the corresponding standard deviations (n = 3).
Applsci 16 06107 g002
Figure 3. Lactic acid (g/L) and pH values measured during fermentations carried out with and without pH control. Solid lines represent lactic acid, while dotted lines represent the pH trend. Each test was carried out in triplicate. Error bars represent standard deviations (n = 3).
Applsci 16 06107 g003
Figure 4. Glucose content (g/L) observed during the fermentations carried out with and without pH control. Each test was carried out in triplicate. Error bars represent standard deviations (n = 3).
Applsci 16 06107 g004
Table 1. Description of the tested sample formulations and operating conditions (Qfeed, volumetric flow rate of the feed solution; Qair-IN, volumetric flow rate of the inlet air; Patomization, atomization pressure; Tair-IN, inlet air temperature into the drying chamber).
PhaseTestFormulationOperating Parameters
(1)1Postbiotic suspensionQfeed = 5 [mL/min];
Qair-IN = 50 [L/min];
Patomization = 3.2 [bar];
Tair-IN = 200 °C
2Postbiotic suspension diluted (1:1) with water
3Postbiotic suspension diluted (1:2) with water
4Postbiotic suspension diluted (1:3) with water
5Postbiotic suspension diluted (1:4) with water
6Postbiotic suspension diluted (1:4) with water + (1:0.5) maltodextrins
7Postbiotic suspension diluted (1:4) with water + (1:1) maltodextrins
(2)8Best formulation obtained from the phase (1)Qfeed = 5 [mL/min];
Qair-IN = 50 [L/min];
Patomization = 3.2 [bar];
Tair-IN = 200 °C
9Best formulation obtained from the phase (1)Qfeed = 5 [mL/min];
Qair-IN = 50 [L/min];
Patomization = 4 [bar];
Tair-IN = 160 °C
10Best formulation obtained from the phase (1)Qfeed 5 = [mL/min];
Qair-IN = 50 [L/min];
Patomization = 4.5 [bar];
Tair-IN = 140 °C
Table 2. Total polyphenol content (TPC), total flavonoid content (TFC), and antioxidant activity (AA) evaluated at the beginning (T0) and after 24 h (T24) of the fermentations carried out without and with pH control. The same lowercase letters in the same columns indicate non-statistically significant differences (p > 0.05). GAE: gallic acid equivalents; QE: quercetin equivalents; TE: Trolox equivalents.
Oat FermentedFermentation
Time
TPC
mgGAE/g
TFC
mgQE/g
AA
µmolTE/g
w/o pH controlT02.52 ± 0.13 a0.19 ± 0.02 b9.05 ± 1.20 c
T242.29 ± 0.10 a0.16 ± 0.03 b8.59 ± 0.90 c
with pH controlT02.55 ± 0.15 a0.20± 0.03 b9.10 ± 1.18 c
T242.16 ± 0.14 a0.17 ± 0.04 b8.67 ± 0.88 c
Table 3. Cell (Ycell) and product (Ymetabolite) yields, calculated during fermentation with and without pH control. Same lowercase letters in the same row indicate non-statistically significant differences.
w/o pH Controlwith pH Control
Ycells
[mg cells/g glucose]
0.22 ± 0.09 a0.28 ± 0.10 a
Ymetabolite
[g lactic acid/g glucose]
1.44 ± 0.04 b1.28 ± 0.17 b
Table 4. Bacterial growth parameters: generation numbers (n), doubling times (td), and constant growth rates (k) calculated during the exponential growth phases of oat fermentation processes carried out with and without pH control.
Fermented Oat
(24 h)
ntd
(h)
k
(h−1)
w/o pH control6.22 ± 0.432.47 ± 0.850.44 ± 0.17
with pH control6.89 ± 0.502.04 ± 0.140.49 ± 0.04
Table 5. Spray-drying yield and relative humidity of the dried product obtained during the first spray-drying optimization phase, based on testing different sample formulations, at fixed operating conditions (Qfeed, volumetric flow rate of the feed solution; Qair-IN, volumetric flow rate of the inlet air; Patomization, atomization pressure; Tair-IN, inlet air temperature into the drying chamber). Also, Tair-out is reported. Each result is expressed as the mean value ± standard deviation (n = 3).
TestFormulationOperating ParametersTair-out (°C)Yield (%)Relative Humidity (%)
1Postbiotic suspensionQfeed = 5 [mL/min];
Qair-IN = 50 [L/min];
Patomization = 3.2 [bar];
Tair-IN = 200 °C
UNDETECTEDUNDETECTEDUNDETECTED
2Postbiotic suspension
diluted (1:1) with water
UNDETECTED21.7 ± 0. 42%4.44 ± 0.23%
3Postbiotic suspension
diluted (1:2) with water
9340.0 ± 1.41%5.11 ± 0.13%
4Postbiotic suspension
diluted (1:3) with water
9552.0 ± 2.83%5.87 ± 0.47%
5Postbiotic suspension
diluted (1:4) with water
9756.5 ± 0.71%8.16 ± 0.22%
6Postbiotic suspension
diluted (1:4) with water + (1:0.5) maltodextrins
9856.25 ± 0.35%7.42 ± 0.59%
7Postbiotic suspension diluted (1:4) with water
+ (1:1) maltodextrins
9657.40 ± 0.57%3.9 ± 0.14%
Table 6. Spray-drying yield and relative humidity of the dried product obtained during the second spray-drying optimization phase, based on testing different operating conditions (Qfeed, volumetric flow rate of the feed solution; Qair-IN, volumetric flow rate of the inlet air; Patomization, atomization pressure; Tair-IN, inlet air temperature into the drying chamber) to treat a postbiotic suspension diluted (1:4) with water and (1:1) with maltodextrins. Also, T air-out is reported. Each result is expressed as the mean value ± standard deviation (n = 3).
TestFormulationOperating ParametersTair-out (°C)Yield (%)Relative Humidity (%)
7Postbiotic suspension diluted (1:4) with water + (1:1) maltodextrinsQfeed = 5 [mL/min];
Qair-IN = 50 [L/min];
Patomization = 3.2 [bar];
Tair-IN = 200 °C
9657.40 ± 0.57%3.9 ± 0.14%
8Qfeed = 5 [mL/min];
Qair-IN = 50 [L/min];
Patomization = 4 [bar];
Tair-IN = 160 °C
81.453.25 ± 0.35%7.47 ± 0.47%
9Qfeed = 5 [mL/min];
Qair-IN = 50 [L/min];
Patomization = 4.5 [bar];
Tair-IN = 140 °C
7851.50 ± 0.71%7.05 ± 0.35%
Disclaimer/Publisher’s Note: The statements, opinions and data contained in all publications are solely those of the individual author(s) and contributor(s) and not of MDPI and/or the editor(s). MDPI and/or the editor(s) disclaim responsibility for any injury to people or property resulting from any ideas, methods, instructions or products referred to in the content.