Article

Analysis on Time-Dependent Yield Stress Behavior and Influencing Factors in Basalt Fiber-Reinforced Gangue Cemented Slurry


1
College of Energy Engineering, Xi’an University of Science and Technology, Xi’an 710054, China
2
Key Laboratory of Western Mine Exploitation and Hazard Prevention Ministry of Education, Xi’an 710054, China
3
Shaanxi Key Laboratory of Ground Control, Xi’an 710054, China
4
Energy School, Xi’an University of Science and Technology, Xi’an 710054, China
*
Authors to whom correspondence should be addressed.
Appl. Sci. 2026, 16(11), 5720; https://doi.org/10.3390/app16115720
Submission received: 8 March 2026 / Revised: 9 May 2026 / Accepted: 25 May 2026 / Published: 5 June 2026
(This article belongs to the Section Energy Science and Technology)

Abstract

Due to the tendency of backfill slurry to stagnate within pipelines during transportation, a time-dependent rheological model for basalt fiber-reinforced gangue cemented slurry was developed based on the H-B rheological model and flocculation structure theory to ensure unimpeded slurry flow within pipelines over specified time periods. Experiments were conducted to investigate the time-dependent yield stress evolution of 9 mm fiber-reinforced gangue cemented slurry over time under varying conditions, specifically examining the effects of adding 9 mm fiber-reinforced (accounting for 0.5% of the total mass of the slurry) gangue cemented slurry under varying conditions. Significant effects of mass concentration, sucrose admixture content, and fly ash concentration on the yield stress of the slurry under different standing times were investigated. Research findings indicate that the yield stress of the paste increases with rising mass concentration and also rises with extended standing time. For slurries with mass concentrations ranging from 76% to 82%, the yield stress after 120 min of standing increased by 81.03%, 80%, 82%, and 97.48%, respectively, compared to freshly mixed slurries. The yield stress decreases with increasing sucrose dosage. Below 0.5% sucrose dosage, the rate of yield stress increase with standing time is relatively slow; above 0.5%, the rate increases more rapidly. After 120 min of standing, the yield stress of slurries with a sucrose dosage ranging from 0.25% to 1.00% increased by 48.66%, 54.42%, 32.90%, and 33.70%, respectively, compared to freshly mixed slurry. Yield stress decreased with increasing fly ash content and exhibited an overall steady upward trend with standing time. Based on the fitting surfaces depicting the variation in yield stress in filling materials over time under different influencing factors, fitting expressions were derived. Analysis of variance revealed that the time-dependent behavior of filling materials is primarily influenced by mass concentration, followed by retarder dosage and fly ash proportion.

1. Introduction

Coal, serving as China’s primary energy source, holds the critical function of ensuring energy security and supporting the development of new energy. Despite generating significant economic benefits, the extensive mining of coal resources has also severely damaged the ecological environment, groundwater resources, and structures within mining areas. Adverse environmental impacts have emerged in areas such as abandoned mine voids, subsidence zones, and coal gangue accumulation sites [1]. Gangue cemented slurry filling mining, an eco-protective mining technique, addresses solid waste accumulation problems at the source while minimizing ecological disturbance to extract coal resources [2]. Pipeline transportation technology, a key method for slurry filling, has garnered significant attention in recent years. Research indicates that incorporating additives, multi-stage crushing and screening, and rheological design can transform coal gangue into a high-solid-content slurry suitable for long-distance pipeline conveyance [3]. During pipeline transportation, multiple pumping operations at extended intervals cause slurry to remain stagnant within the pipeline. Consequently, analyzing the rheological properties of the slurry within the pipeline becomes particularly crucial. Rheological parameters, serving as key indicators for evaluating rheological characteristics, are influenced not only by factors such as slurry mass concentration and additive concentration but also by standing time. Many scholars have conducted extensive research on aspects such as gradation optimization, setting properties, and filling body strength. Some scholars have also investigated the migration patterns of filling slurry during pipeline transportation [4,5,6,7,8]. To date, extensive research has been conducted on the effects of mass concentration, fly ash concentration, chemical additives, and physical additives on the rheological properties of slurries. Zhai Yonggang [9] employed the Herschel–Bulkley model regression to derive a rheological model for total tailings slurry under shear rates at 0–120 s−1. The results indicate that slurries with mass fractions between 69% and 81% exhibit a yield-pseudoplastic fluid, while those with a mass fraction of 81% demonstrate Bingham plastic fluid. Research by Ren Ang [10] indicates that, with cement, coal gangue dosage, and paste concentration held constant, increasing fly ash content leads to reduced paste rheological properties, enhanced cohesion, and decreased bleeding rate. The findings of Su Fengbo [11] indicate that borax, barium chloride, and sucrose all enhance the flowability of the slurry, with sucrose demonstrating the most significant improvement. As the sucrose dosage increased from 0% to 2.0%, the flowability improved by 2.91%, 8.14%, 11.63%, and 15.70%, respectively. Research by Zhao Bingchao et al. [12] indicates that fibers enhance the stability of the network structure within the slurry, increase friction and collisions between particles, and amplify internal friction and viscous forces. At a fiber content of 0.5% and fiber length of 9 mm, the slurry exhibits increased yield stress and maintains flow deformation more readily, meeting the requirements for long-distance pipeline transportation. Li Shuai et al. [13] developed a time-dependent rheological model for ultrafine total tailings slurries based on the H-B rheological model and floc network structure theory. They investigated the time-dependent characteristics of ultrafine paste-like total tailings during gravity-fed long-distance pipeline transport and derived corresponding pipeline resistance calculation formulas. Results indicate that ultrafine total tailings paste exhibits time-dependent shear thinning behavior across varying shear rates. Higher shear rates accelerate the time to equilibrium and reduce viscosity values. It can thus be seen that the rheological properties of cemented backfill slurry are affected by three important factors: mass concentration, fly ash content, and additives. However, while considering these three factors, the impact of standing time on the rheological properties of the slurry during pipeline transportation should also be taken into account. In this study, by investigating the effects of different mass concentrations, fly ash proportions, and additive dosages on the rheological parameters of gangue cemented backfill slurry under different standing times, the variation laws under different conditions were analyzed and their underlying mechanisms were explored. The significance ranking of the three factors on pipeline transportation, which is caused by different standing times during backfill slurry pipeline transportation, was proposed. A predictive model for the temporal variation law of rheological parameters was established. Compared with existing studies, this study considers the condition of basalt fiber addition in backfill slurry, laying the foundation for the analysis of restart resistance in pipeline transportation.

2. Test

2.1. Test Materials

The materials prepared for rheological testing include coal gangue particles produced by secondary crushing at a Shaanxi mine, fly ash from a coal-fired power plant in Yulin, Shaanxi, China, Yaobai, P.O 42.5 ordinary Portland cement, and municipal tap water. Using coal gangue as an aggregate and cement with fly ash as binding materials, analysis by X-ray fluorescence spectrometry indicates that the primary chemical constituents of the cement used in the test are CaO, SiO2, Al2O3, SO3, etc., while the main chemical components of fly ash are SiO2, Al2O3, Fe2O3, and CaO. The primary chemical constituents of the gangue are SiO2, Al2O3, and SO3. The components are detailed in Table 1. Based on Talbot’s theory, the particle size distribution of gangue particles is shown in Table 2 [14,15]. Among them, gangue particles with a particle size of less than 0.5 mm account for 21% of the total mass of gangue, those with a particle size of 0.5~1 mm account for 16%, those with a size of 1~2 mm account for 17%, those with a size of 2~4 mm account for 24%, and those with a size of 4~8 mm account for 22%.

2.2. Experimental Design and Methods

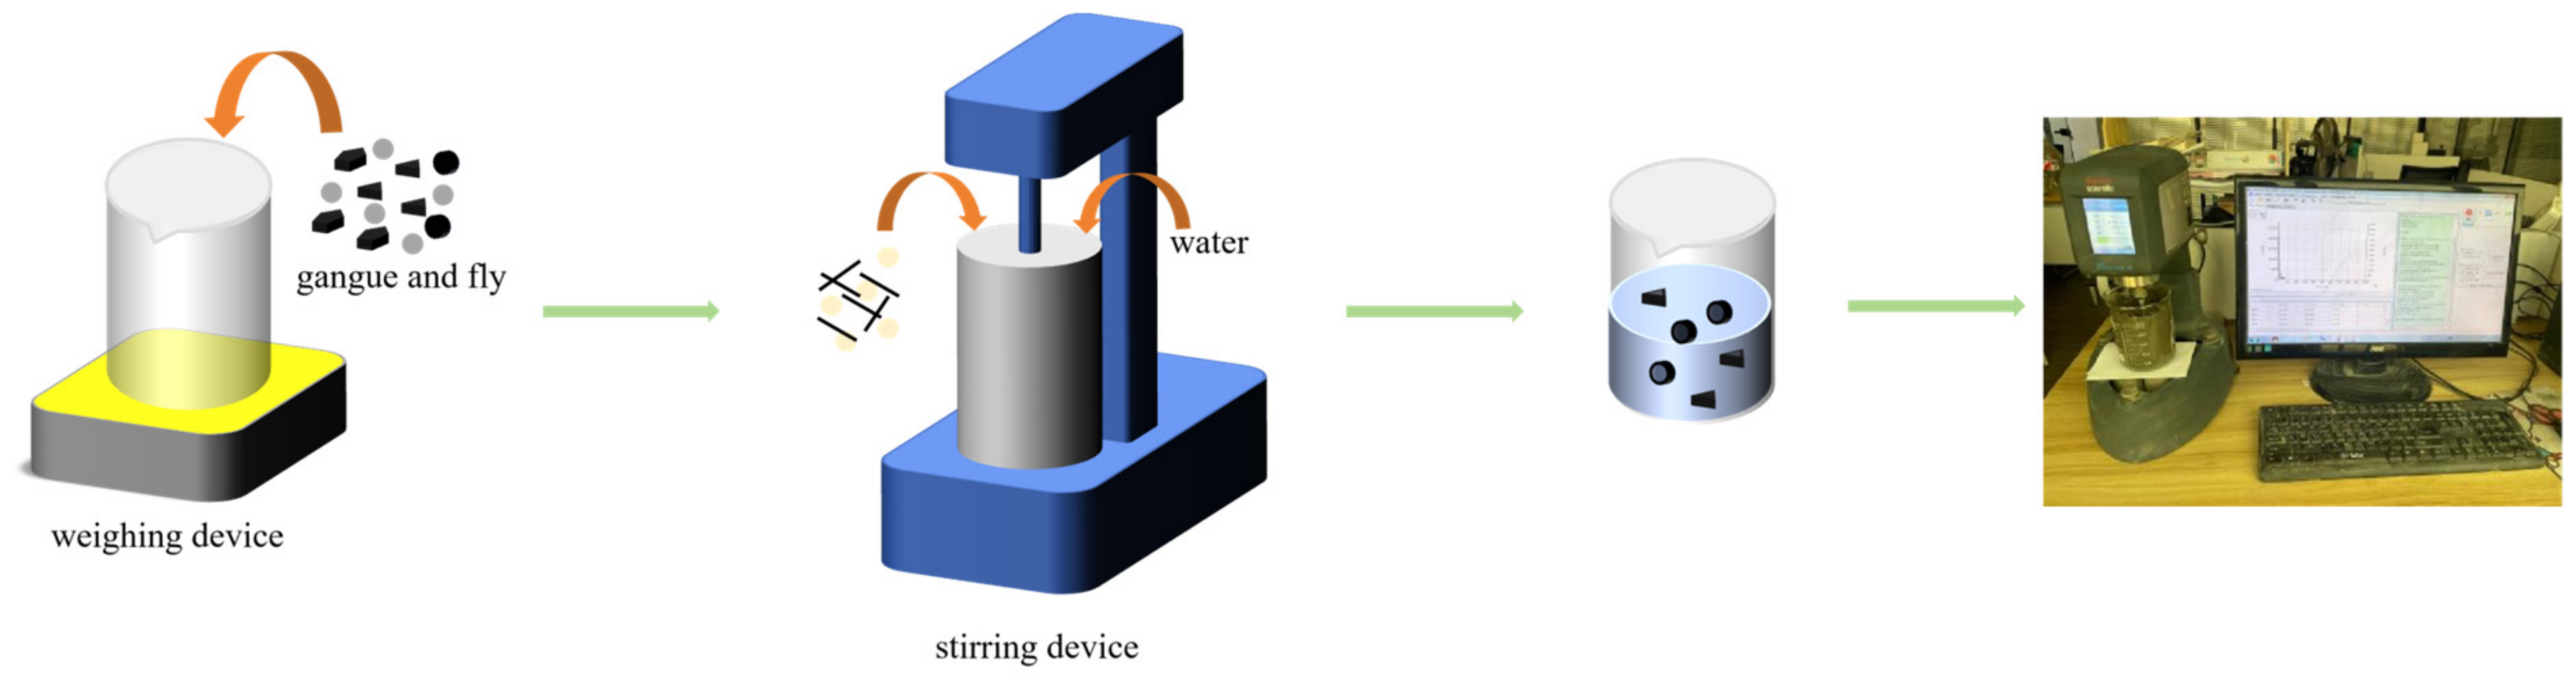
The time-dependent variation in slurry rheological parameters correlates with the flocculent network products generated by its internal hydration. Fiber additives are physical admixtures that scarcely participate in the slurry hydration process, while fiber addition aims to prevent gangue sedimentation. Based on existing research, the optimal fiber parameters are determined to be 9 mm and 0.5% [12]. By varying the mass concentration, fly ash proportion, and sucrose dosage as primary parameters while keeping the standing time constant, the changes in slurry rheological properties are simulated. This approach models the time-dependent variations in rheological parameters during pump restart conditions following a shutdown. A total of 12 experimental designs were established, as shown in Table 3, selecting mass concentrations of 76%, 78%, 80%, and 82%, sucrose concentrations of 0.25%, 0.50%, 0.75%, and 1.00%, and fly ash proportions of 20%, 25%, 30%, and 35%. Each mixture was allowed to stand for 0 min, 30 min, 60 min, 90 min, and 120 min. When investigating the relationship between mass concentration and sucrose dosage, the mass ratio of cement, fly ash, and gangue particle aggregate was set at 1:3:6. We weighed raw materials such as gangue and fly ash according to the specified ratio, poured them into a container, and mixed thoroughly. We added fibers and sucrose, and then incorporated water using a JJ-5 cement slurry mixer. We poured the slurry into a 500 mL beaker, covered it with plastic wrap, and let it stand for the designated duration. Subsequently, we tested the sample using a HAAKE Viscotester IQ air rheometer (Kanagawa, Japan). As shown in Figure 1, to maintain the sample in a state consistent with its pre-experiment condition, the slurry was first subjected to 60 s of pre-shearing using a rheometer rotor followed by 10 s of static rest. Subsequently, a 100 s variable shear rate test was conducted according to the program to determine the corresponding shear stress. For subsequent experiments, each group will be replicated five times. The maximum and minimum values will be excluded, and the average of the remaining three sets of data will be calculated.

3. Results and Discussion

3.1. Rheological Model

The rheological properties of gangue cemented filling slurry do not follow Newtonian internal friction laws (shear stress is not proportional to shear rate, and viscosity is not a constant value). In this study, the solid content of gangue particles and cementing agents in the slurry exceeds 70%. Significant interactions exist between particles, including mechanical friction, van der Waals forces, and electrostatic attraction. These interactions form a complex spatial network structure, classifying the material as a typical non-Newtonian fluid. The viscosity curve can be calculated using multiple methods, with the Herschel–Bulkley model (H-B model) commonly employed for rheological curve fitting. Compared to the two-parameter Bingham model, the three-parameter H-B model fully accounts for the time-dependent characteristics during slurry shear processing. By incorporating shear thinning and shear thickening into shear stress calculations, the H-B model achieves higher accuracy and broader applicability. This model can be simplified to the primary expression (1) describing the relationship between apparent shear rate and shear stress [16].
τ = τ 0 + μ γ n
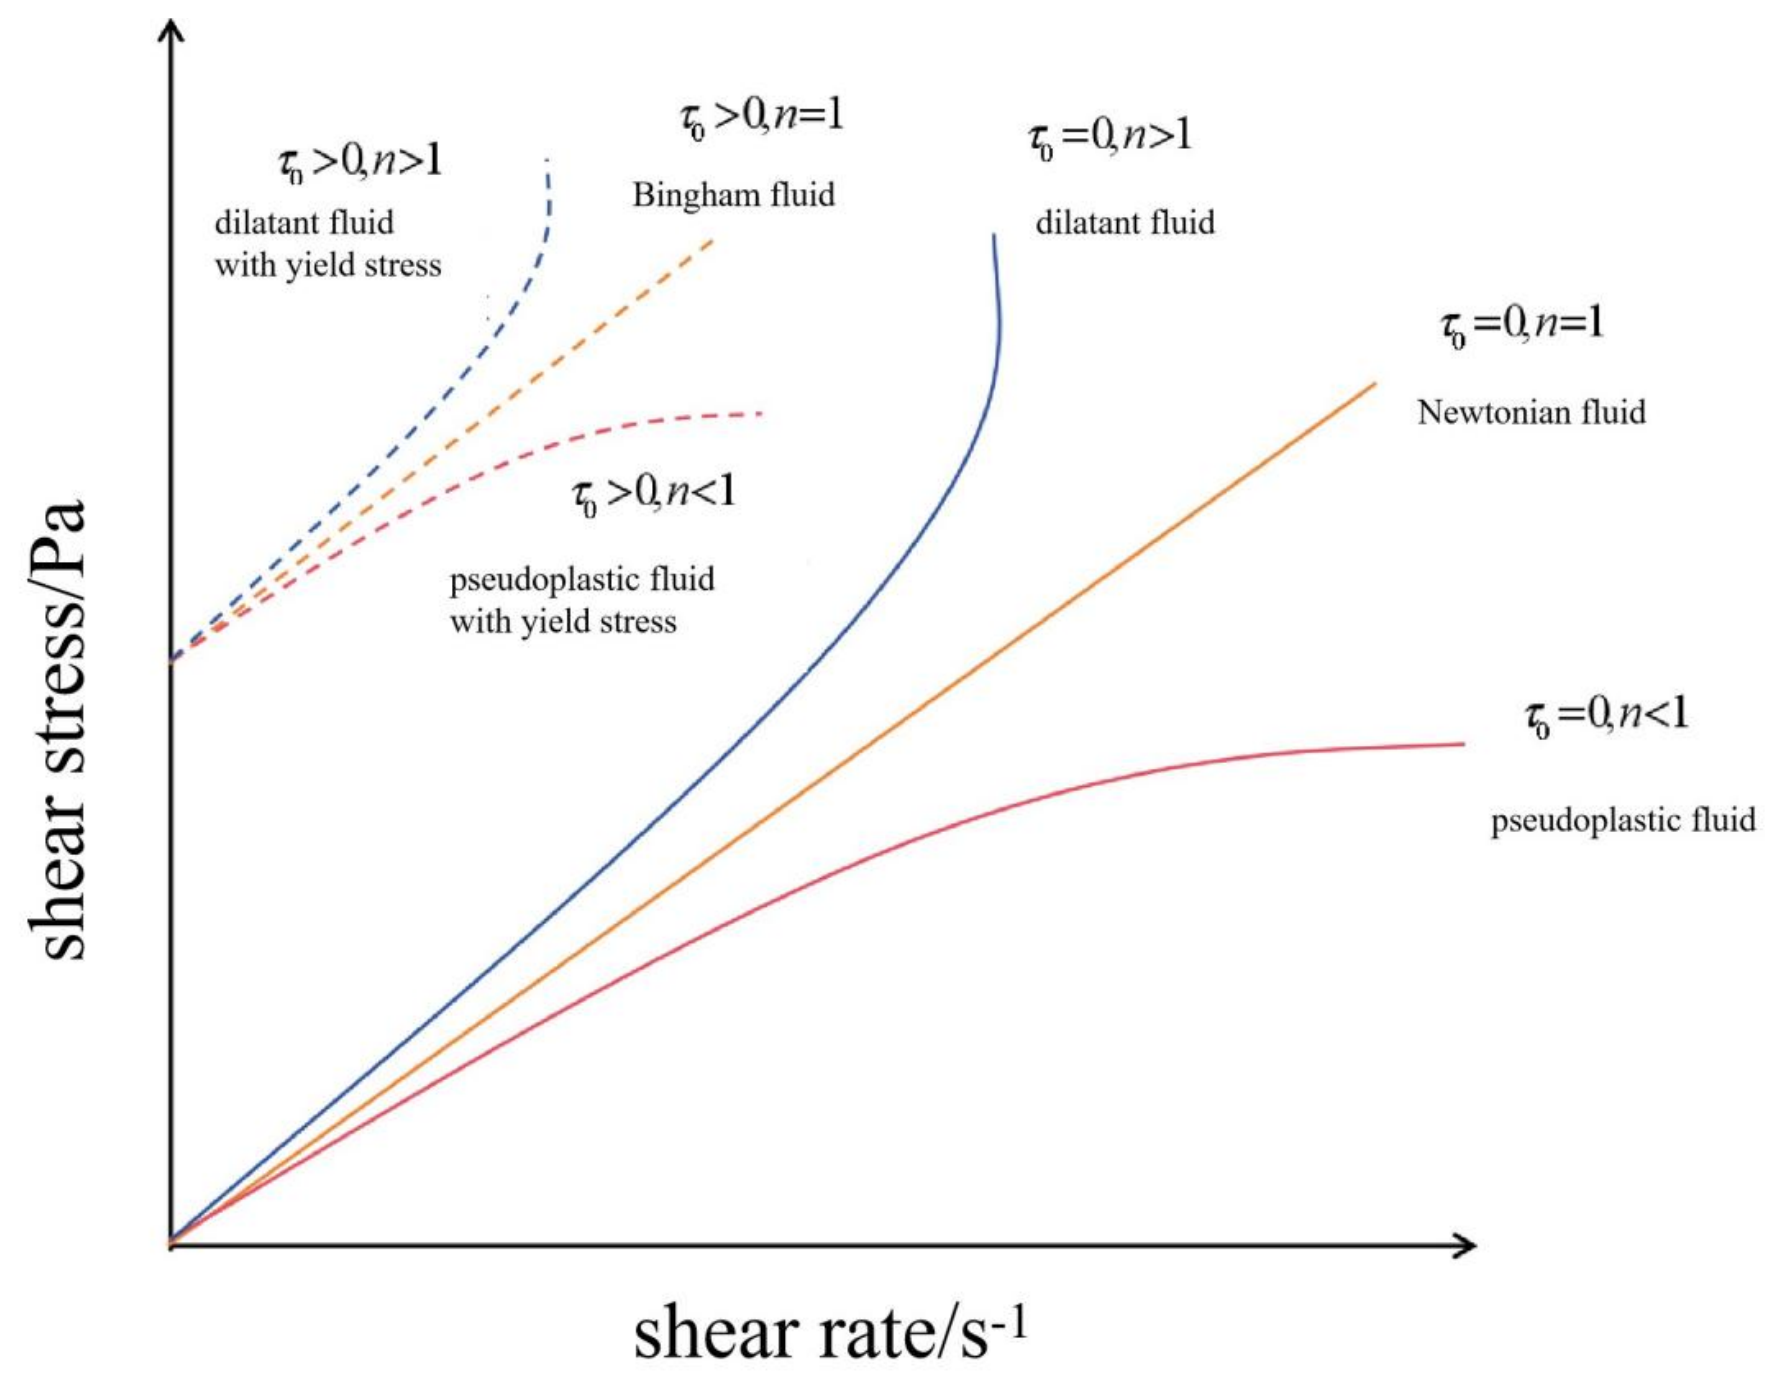
where τ denotes shear stress, Pa; γ denotes shear rate, s−1; μ denotes apparent viscosity, Pa·s; τ 0 denotes yield stress, Pa; and n denotes the flow behavior index. The rheological characteristic curves for different fluids are shown in the figure. Among them, Bingham fluids differ from Newtonian fluids in that they possess a minimum shear stress (yield stress τ 0 ), with corresponding rheological parameters being τ 0 > 0 and n = 1 ; the stress–strain curve of an expanding fluid with yield stress exhibits a convex upward bend characterized by a nonlinear surge in shear stress with shear rate. The corresponding rheological parameters are τ 0 > 0 and n > 1 ; pseudoplastic fluids with yield stress exhibit a nonlinear relationship between shear stress and shear rate, with viscosity decreasing as the shear rate increases. Their stress–strain curve is characterized by a concave downward bend centered on a sharp nonlinear decrease in shear stress with increasing shear rate. The corresponding rheological parameters are τ 0 > 0 and n < 1 . To further clarify the physical meaning and time-dependent mechanism of the H-B rheological model, this paper provides a more in-depth physical interpretation of the model’s parameters. The yield stress τ 0 reflects the formation strength of the flocculent structure inside the slurry and the total interparticle forces, which directly determines the restarting resistance of the pipeline after pump shutdown. The plastic viscosity μ characterizes the internal particle friction and the viscous effect of hydration products, which is directly related to the transportation energy consumption. The flow behavior index n reflects the degree of structural breakdown and reconstitution under shearing; n > 1 indicates shear thickening, corresponding to the gradual strengthening of the internal structure with the increase in standing time.
During the pipeline pumping of high-concentration slurry, the “ball bearing effect” of fly ash reduces interparticle friction, resulting in insufficient yield strength of the slurry to support the settling of gangue particles. To maintain particle suspension, it is necessary to determine the relationship between gangue particle size and slurry yield stress [17]:
d max = 3 π τ B 2 ( ρ s ρ m ) g
where dmax denotes the critical maximum non-settling particle size, m; τB represents the yield stress of a single particle, Pa; ρs indicates the density of gangue particles, kg/m3; and ρm denotes the density of the solid–liquid two-phase carrier, kg/m3.
The density of gangue used in the experiment was 2440 kg/m3, and the density of the backfill slurry was 1644.95 kg/m3. As shown in Table 3, the maximum particle size of gangue is 8 mm. According to Equation (2), the yield stress of a single particle is positively correlated with its particle size. Thus, if gangue particles of 8 mm diameter do not settle, all particles within the slurry will remain suspended without settling. Therefore, the critical yield stress of the slurry at which gangue particles cease settling must be determined, as follows [12]:
τ critical   =   τ B   +   τ B mechanical   =   ( 1   +   k ) τ B   =   11 τ B
where k is an empirical value, typically ranging from 6 to 10. To ensure the safety of long-distance pipeline transportation of slurry, the maximum value of k (10) is adopted to guarantee that the slurry provides sufficient drag force, preventing solid particles from settling under the maximum critical yield stress of the slurry. Calculations based on the above equation yield a single-particle critical non-settling stress τ B of 7.73 Pa and a critical non-settling yield stress for the filling slurry of 85.03 Pa.

3.2. Influence of Mass Concentration on Rheological Parameters

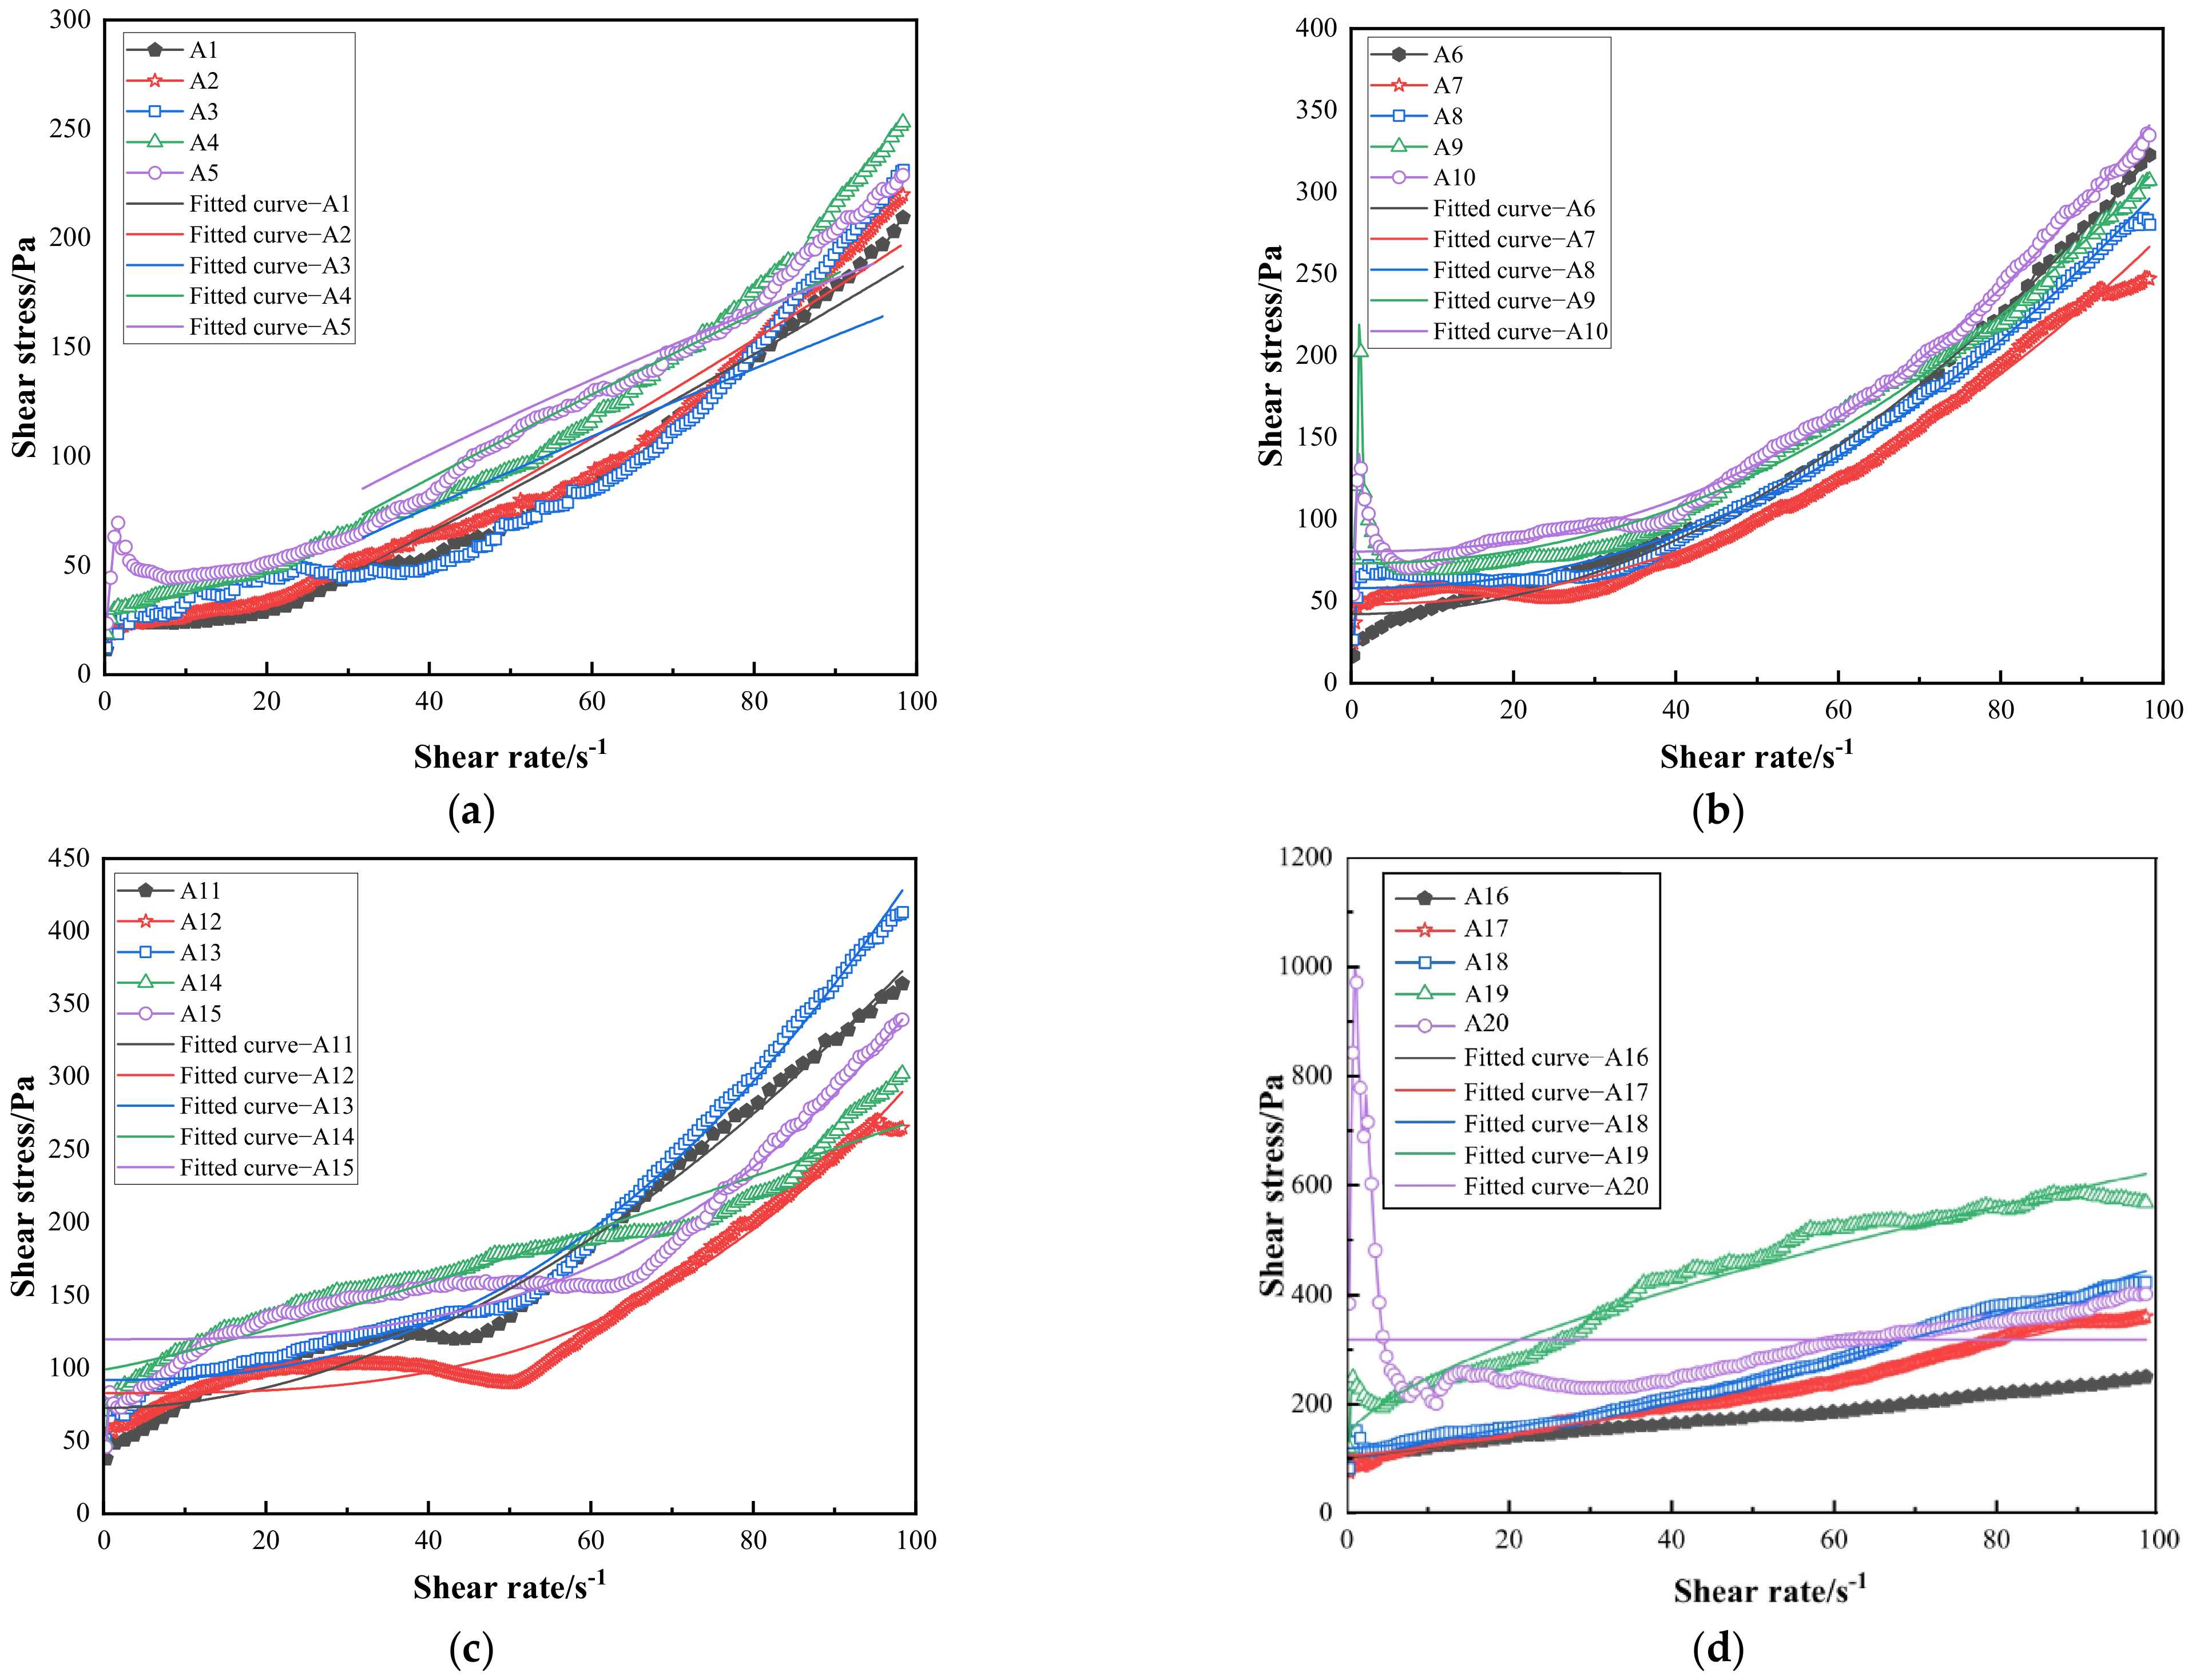
Figure 2 shows the rheological curves of filling slurries at different mass concentrations after standing for varying durations. For slurries with mass concentrations ranging from 76% to 82%, shear stress increases with increasing shear rate. Upon reaching a critical shear rate, the slope of the curve steepens as shear rate increases, leading to a rise in plastic viscosity and exhibiting shear thickening behavior [17]. At initial stages, slurries with mass concentrations ranging from 76% to 80% exhibit shear thinning behavior, demonstrating pseudoplasticity. The sudden disruption of the flocculent network structure in the slurry during this phase causes this phenomenon. As the shear rate increases, the properties of the slurry gradually stabilize, with shear stress exhibiting an approximate linear relationship with shear rate—a characteristic consistent with Bingham fluid behavior. As the shear rate continues to increase, the yield stress rises at an accelerated rate, at which point the slurry exhibits characteristics of an expanding fluid. For a slurry with a mass concentration of 82%, a pronounced stress overshoot peak forms during the initial stage due to structural breakdown. In the intermediate stage, stress rises gradually as the shear rate increases, ultimately tending toward Bingham fluid behavior at high shear rates. The 82% mass concentration slurry exhibited a pronounced “stress overshoot” phenomenon after 120 min of settling [18]. The high-density slurry contains a large number of solid particles. As the mass concentration increases, the internal floc network structure becomes denser, enhancing resistance to deformation. This leads to increased internal friction between solid particles, as well as between solid particles and the cemented slurry, where static friction becomes significantly greater than fluid friction. To maintain the preset shear rate, the equipment must initiate operation with greater shear force, resulting in extremely high shear stress. At this point, the rheological curve intersects the y-axis at 396.02 Pa, with the maximum stress reaching 1000 Pa.
As shown in Figure 3, due to the disruption of the internal structure of the filling slurry during the initial shearing phase, the rheological curve data exhibiting pronounced “stress overshoot” were relatively scattered. When the mass concentration is below 76%: The solid content of the slurry is too low for solid particles to form a continuous and stable flocculent network structure, and the yield stress approaches zero. At this point, the slurry exhibits Newtonian fluid behavior, and the Herschel–Bulkley model is no longer applicable. Meanwhile, low-concentration slurries are prone to severe particle sedimentation and stratification, which cannot meet the stability requirements for long-distance pipeline transportation. Therefore, the rheological curves after stable flow were fitted. The fitting results for the rheological parameters of filling materials at different mass concentrations under various standing times are shown in Table 4.
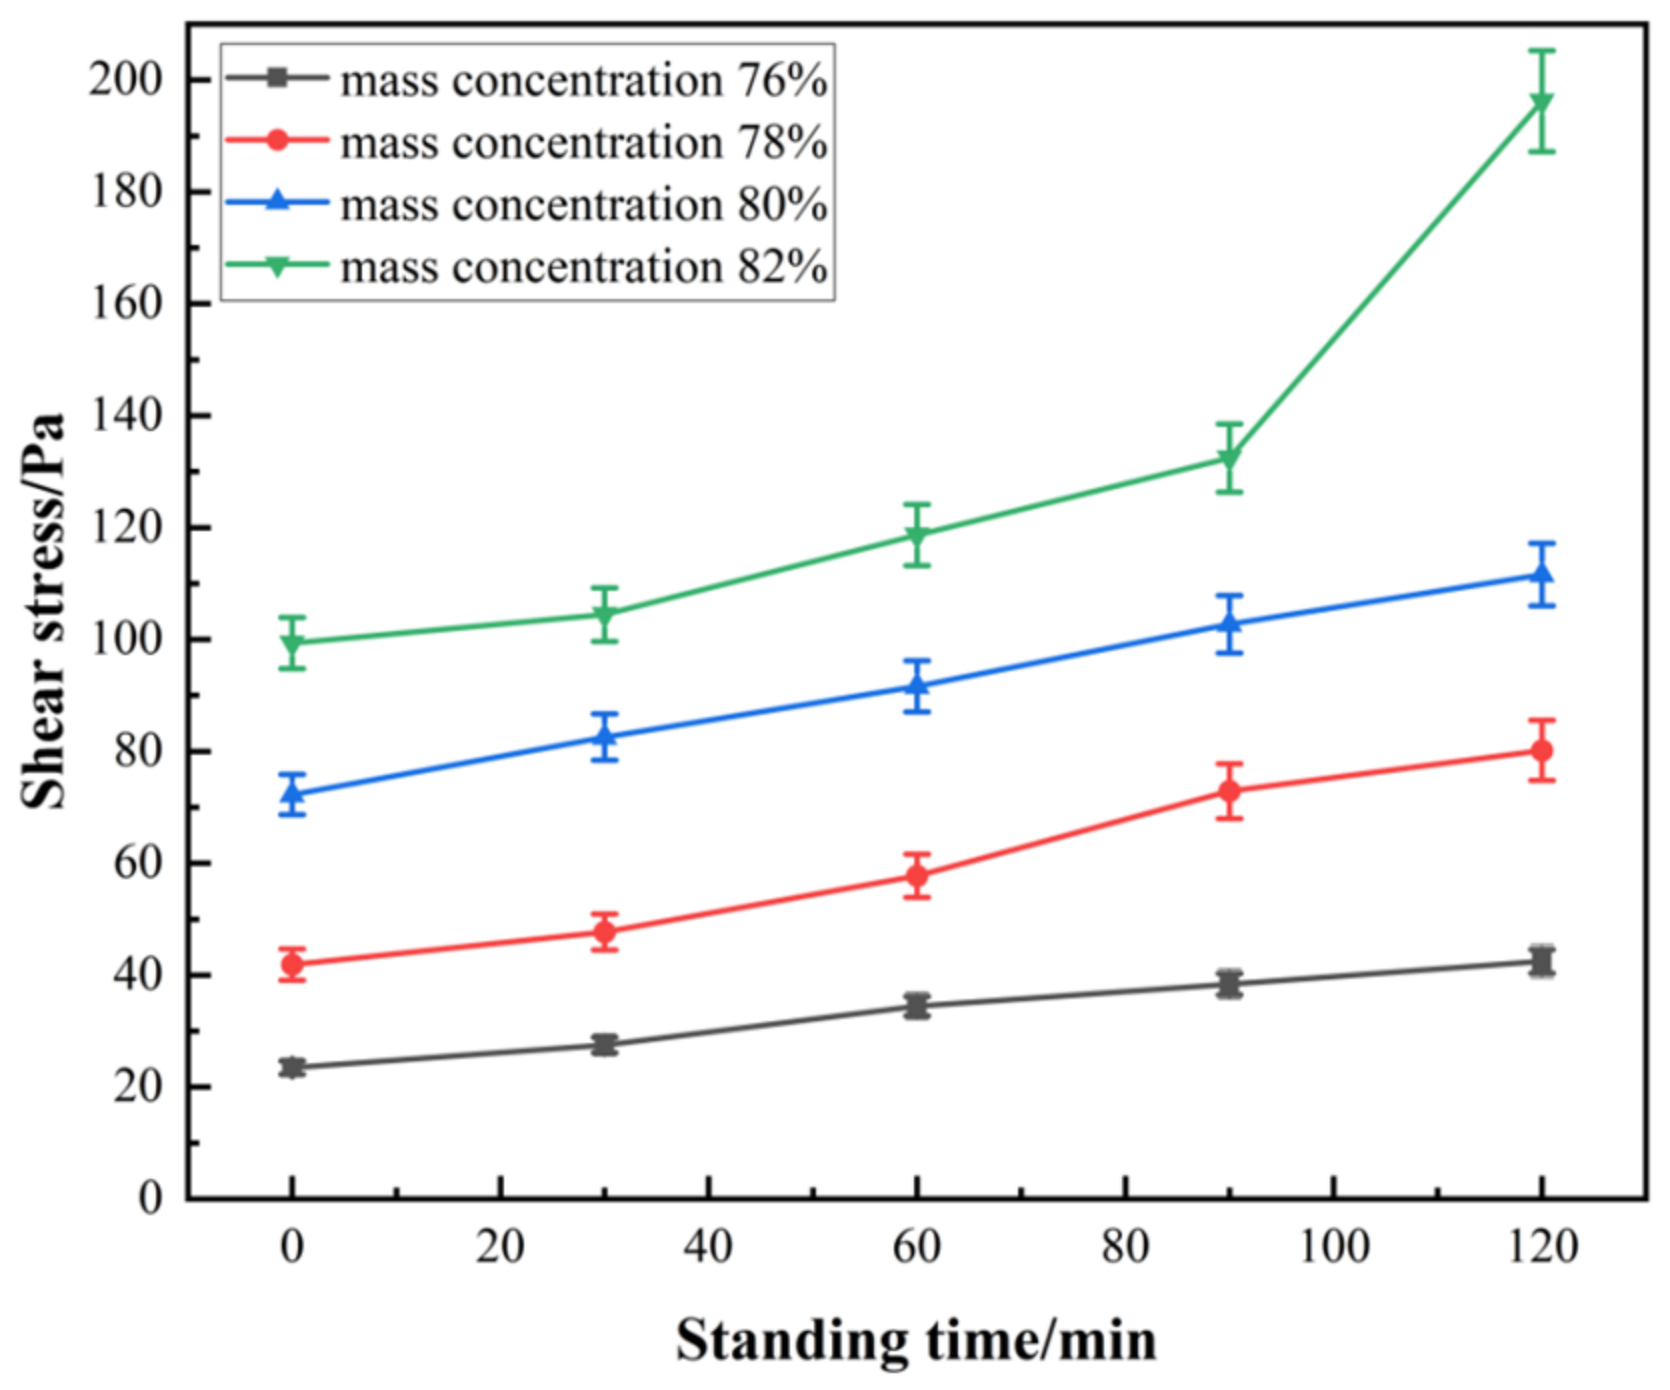
Table 4 shows that R2 (coefficient of determination) values exceed 0.9; experiments with the same mass concentration were repeated three times, and the average value of their yield stress was taken, indicating acceptable fitting results. The yield stresses of 76% mass concentration slurry at different standing times are 27.52 Pa, 34.45 Pa, 38.38 Pa, and 42.47 Pa, representing increases of 17.31%, 46.84%, 63.60%, and 81.03%, respectively, compared to the slurry with 0 min standing time. The yield stresses of 78% mass concentration slurry at different standing times are 47.73 Pa, 57.77 Pa, 72.89 Pa, and 80.17 Pa, representing increases of 13.94%, 37.91%, 74.00%, and 91.38%, respectively, compared to freshly mixed slurry. The yield stresses of 80% mass concentration slurry at different standing times are 82.56 Pa, 91.64 Pa, 102.73 Pa, and 111.62 Pa, representing increases of 14.22%, 26.78%, 42.13%, and 54.42%, respectively, compared to freshly mixed slurry. The yield stresses of 82% mass concentration slurry at different standing times are 104.44 Pa, 118.68 Pa, 132.43 Pa, and 196.22 Pa, representing increases of 5.11%, 19.44%, 33.28%, and 97.48%, respectively, compared to freshly mixed slurry. When the mass concentration does not exceed 78%, the yield stress of the slurry remains below 85.03 Pa throughout the 120 min pumping period. However, gangue particles tend to settle during pumping, leading to pipe blockages. At a mass concentration of 82%, although the slurry yield stress meets the non-settling condition for gangue, the excessively high yield stress causes pumping difficulties and hinders slurry conveyance. Combined with the fitting data in the table, when the mass concentration is controlled between 76% and 82%, the slurry can not only meet the fluidity requirements for pipeline transportation but also avoid particle sedimentation through the supporting effect of fibers, which also confirms the rationality of selecting this concentration range in the experiment. At present, in most pipeline transportation processes, the stagnation time of slurry inside the pipeline does not exceed 120 min; therefore, the rheological properties within 120 min were investigated.
The overall trend of yield stress in filling slurry at different standing times is shown in Figure 4. At the same standing time, the yield stress of slurry increases with the increase in slurry mass fraction. Furthermore, as the standing time increases, the curve from low-mass-concentration slurry to high-mass-concentration slurry gradually evolves from linear to nonlinear. The standard deviation of each data point was normalized to obtain its coefficient of variation (CV: expressed as a percentage of the average value), as shown in Table 5. The coefficient of variation fluctuated around 5.0%, indicating that the experimental results are reliable.

3.3. Effect of Sucrose Concentration on Rheological Parameters at Different Standing Times

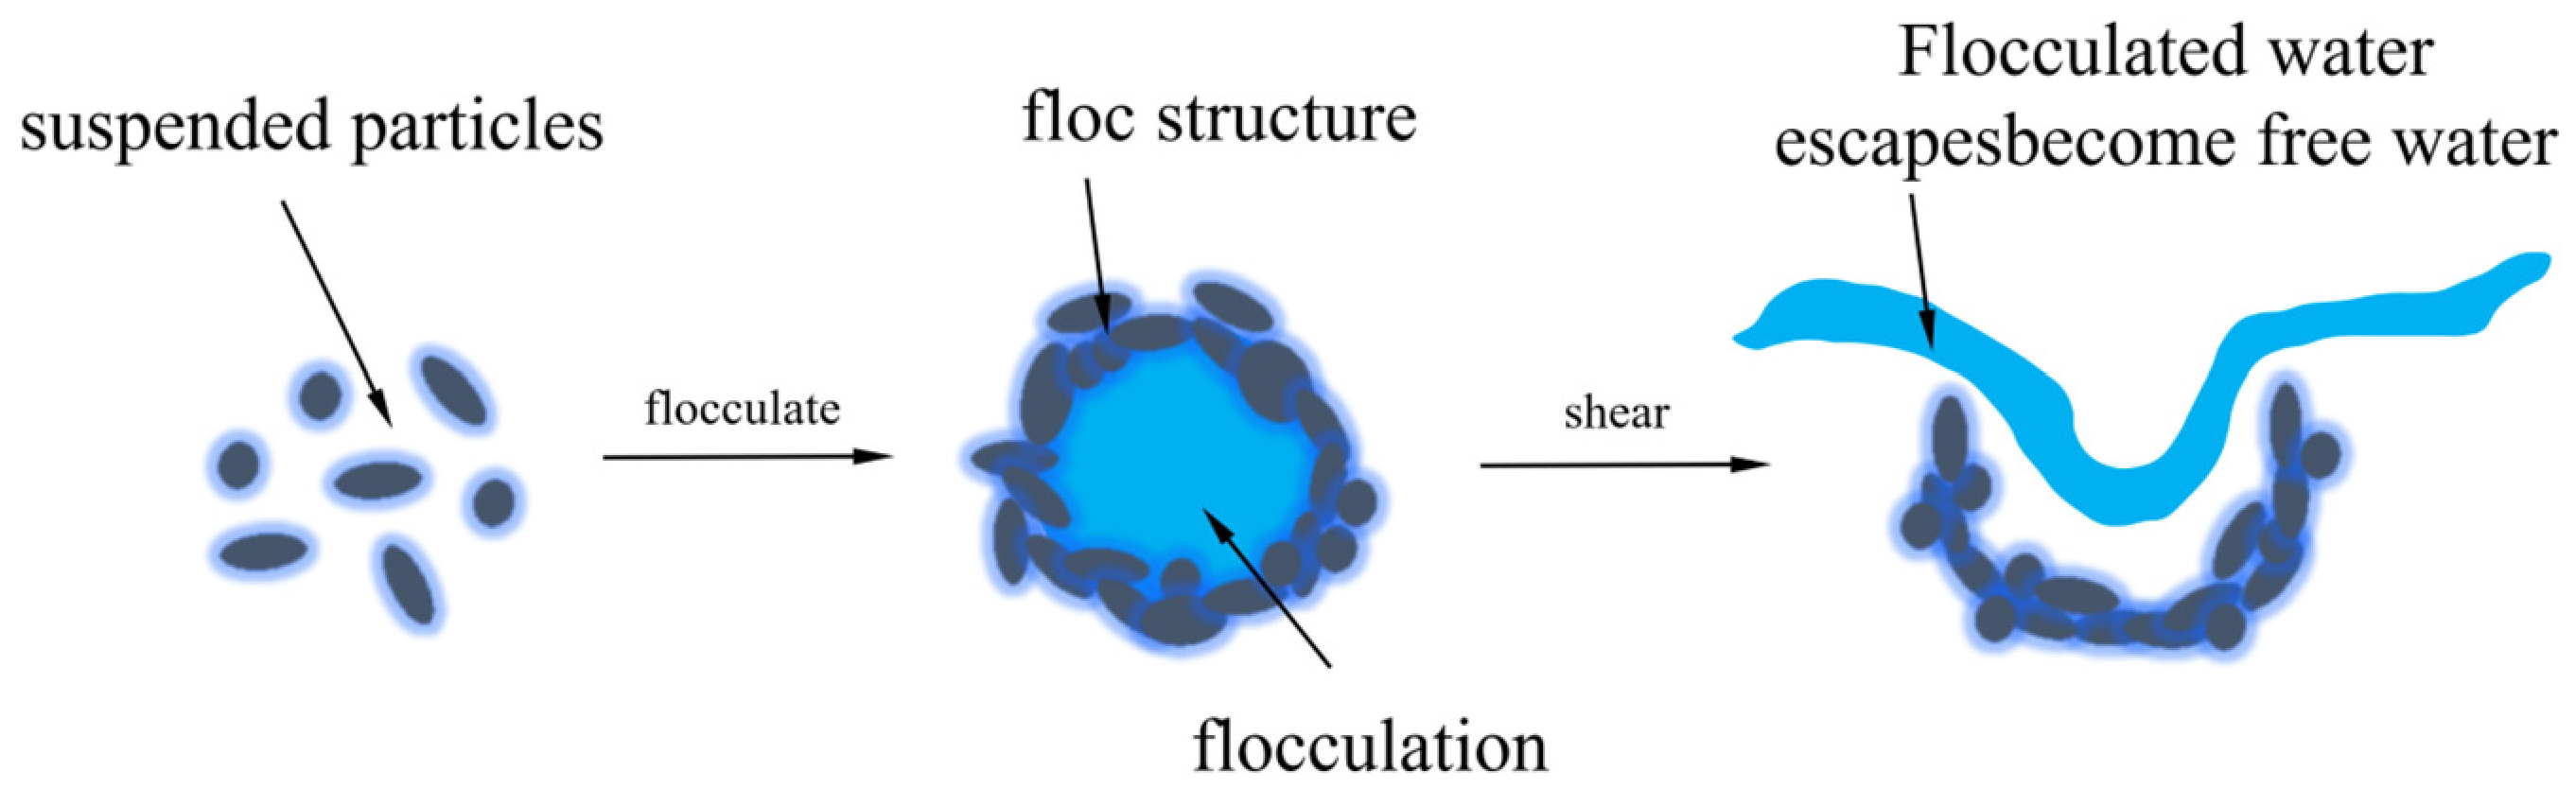
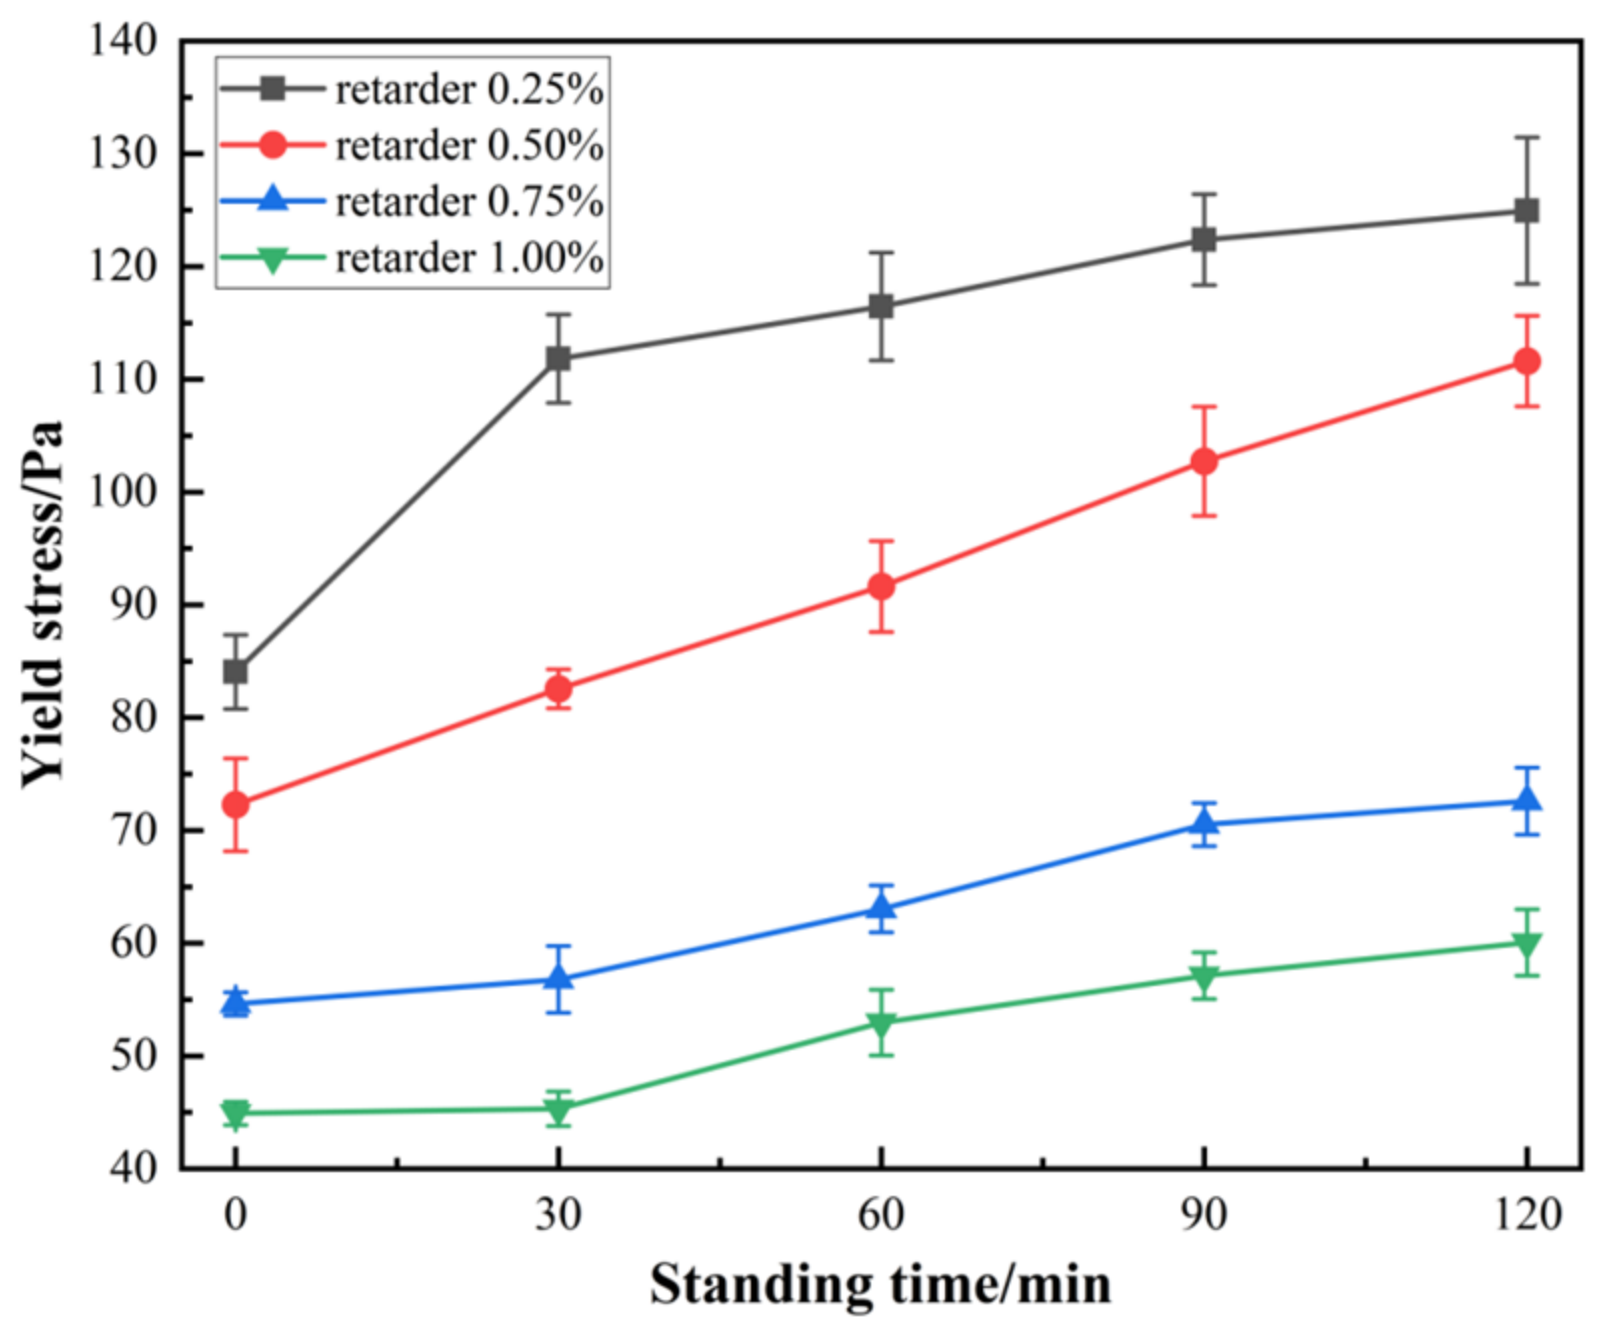
When external shear stress is applied, fluid drag force acts directly on the skeleton of the flocculation structure. When the shear stress reaches or exceeds the critical threshold of the weak interparticle forces inside the flocculation structure, the connection bonds between particles are gradually torn and broken, leading to irreversible or partially reversible damage to the flocculation structure, which effectively improves the rheological properties of the slurry. As shown in Figure 5 [19,20,21,22]. Figure 6 shows the variation in yield stress of the filling material with standing time under different sucrose dosages. For freshly mixed specimens, yield stress decreased significantly with increasing sucrose dosage, recording values of 84.06 Pa, 72.28 Pa, 54.62 Pa, and 44.92 Pa, respectively. Suspended particles flocculate and aggregate through the synergistic effect of weak interactions such as van der Waals forces, and disperse particles are “bridged” together through the connection of molecular chains to form flocs, ultimately constructing a network structure. However, the flocculation structure inside the suspension is easily damaged by shear stress.
The variation in yield stress of filling slurry with shear rate at different standing times shows that as the shear rate increases, the slurry initially exhibits pseudoplastic fluid behavior. Once the shear rate exceeds the critical rate, the yield stress growth gradually stabilizes, revealing Bingham fluid characteristics.
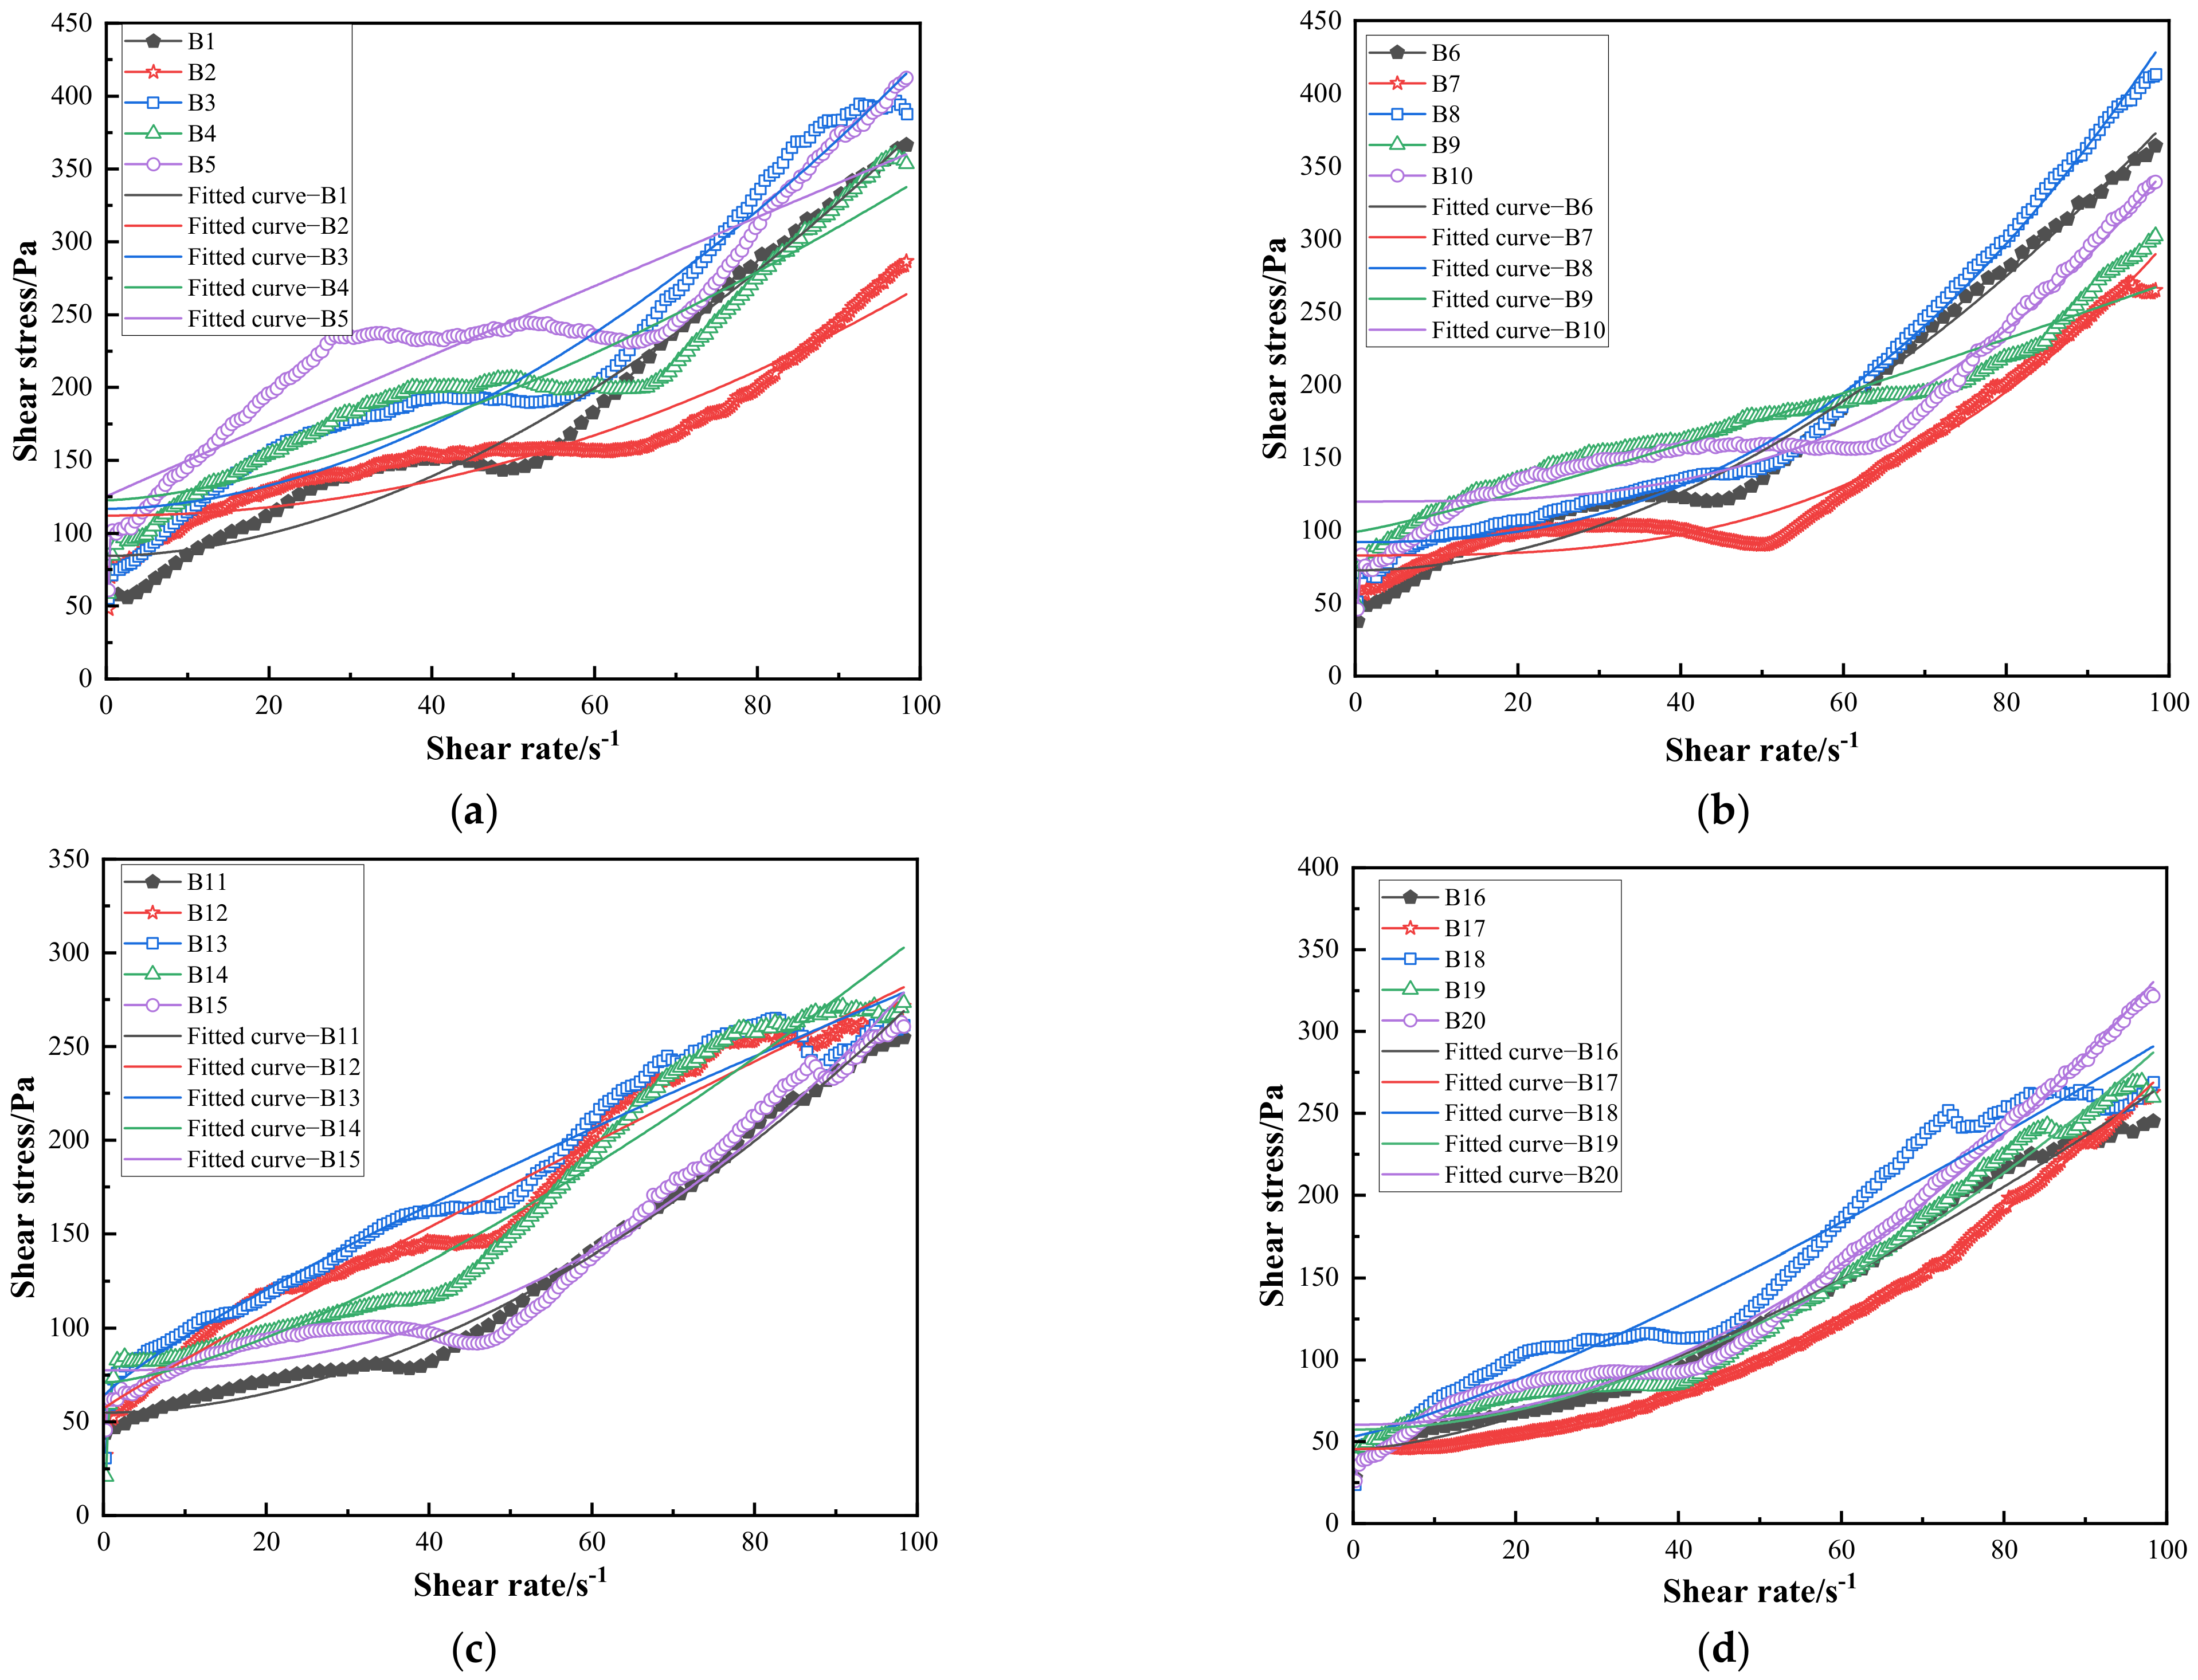
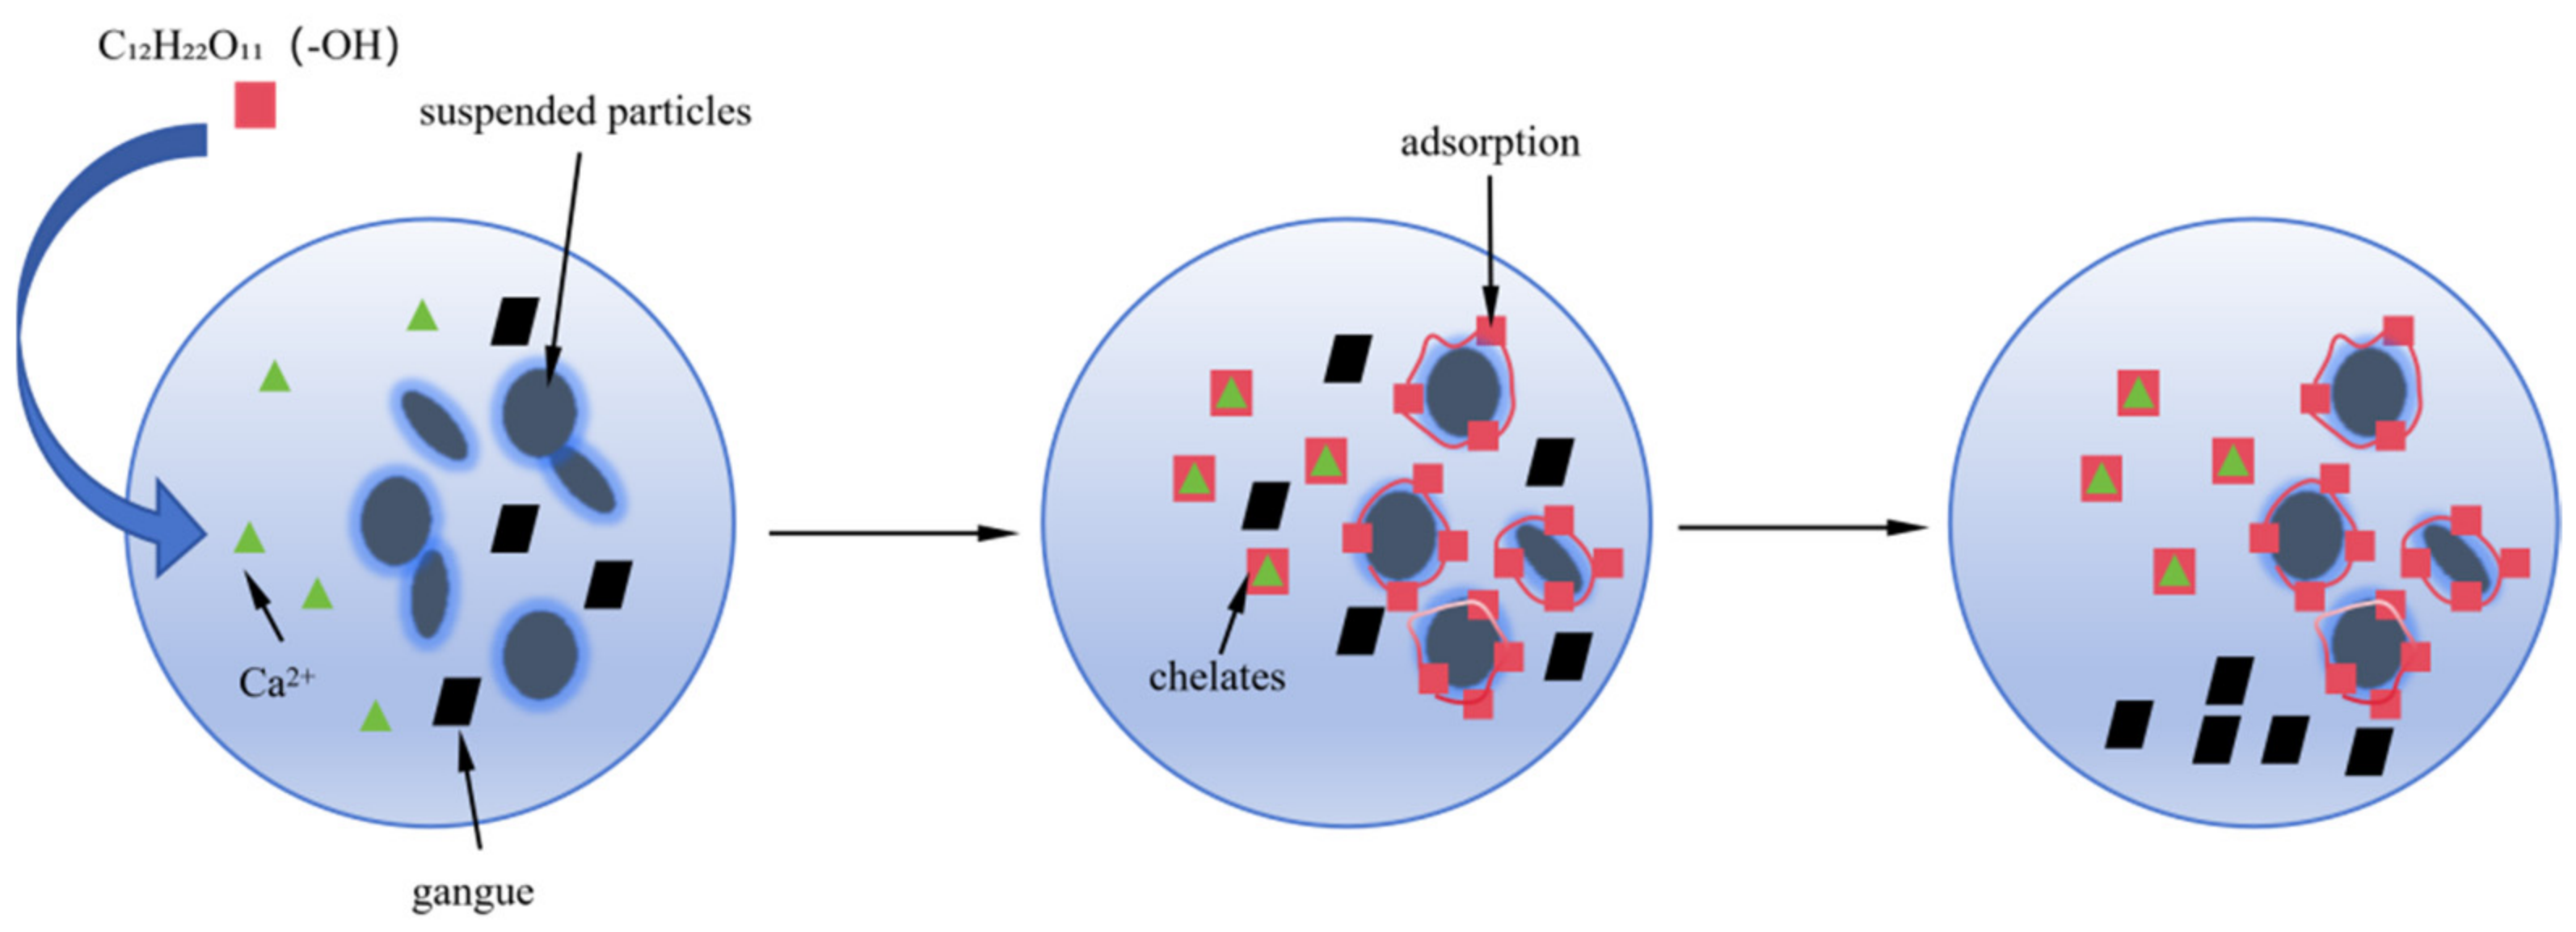
As shown in Table 6, with a sucrose dosage of 0.25%, the yield stresses of slurry at different standing times are 111.83 Pa, 116.46 Pa, 122.38 Pa, and 124.96 Pa, representing increases of 33.03%, 38.54%, 45.59%, and 48.66%, respectively, compared to the slurry with 0 min standing time; with a sucrose dosage of 0.50%, the yield stresses of slurry at different standing times are 82.56 Pa, 91.64 Pa, 102.73 Pa, and 111.62 Pa, representing increases of 14.22%, 26.78%, 42.13%, and 54.42% compared to slurry with zero standing time; with a sucrose dosage of 0.75%, the yield stresses of slurry at different standing times are 56.79 Pa, 63.04 Pa, 70.52 Pa, and 72.59 Pa, representing increases of 3.97%, 15.42%, 29.11%, and 32.90%, respectively, compared to slurry with zero standing time; and with a sucrose dosage of 1.0%, the yield stresses of slurry at different standing times are 45.32 Pa, 52.96 Pa, 57.12 Pa and 60.06 Pa, representing increases of 0.89%, 17.90%, 27.16% and 33.70%, respectively, compared to slurry with zero standing time. As shown in Figure 6, it can be observed that the yield stress of slurries with a sucrose dosage of 0.75% and above decreases significantly. This is attributed to the higher dosage of retarder, where the polyhydroxy groups of sucrose molecules react with Ca2+ to form soluble chelates. This process significantly consumes the free Ca2+ in the system, changes the dissolution–precipitation equilibrium of Ca2+, delays the formation and growth of calcium hydroxide (Ca(OH)2) crystal nuclei, and further inhibits the hydration reaction of core components such as tricalcium silicate (C3S) and dicalcium silicate (C2S) in the system. In addition, the surface adsorption of sucrose molecules can further enhance the retarding effect. These chelates interfere with the strength development of the cement slurry, leading to the tendency of coarse gangue particles to settle [23,24]; its mechanism is shown in Figure 7.
The flocculation structure within the suspension is susceptible to disruption by shear stress; hence, the accelerated rate of shear stress is slowed. For slurries with a 0.50% sucrose dosage, coarse gangue particles exhibit negligible sedimentation under the combined action of basalt fibers and the slurry matrix, with their yield stress increasing uniformly as the standing time prolongs. For slurries with a 0.25% sucrose dosage, during the 0–30 min period, the cemented filling slurry undergoes intense early stage hydration reactions, leading to a rapid increase in flocculent network products. However, with sucrose present at a relatively low concentration as a retarder, the retardation effect is insignificant, resulting in a rapid rise in yield stress. Subsequently, the rate of floc formation slows down, and the increase in yield stress decelerates. The overall trend of yield stress in filling slurry as a function of sucrose content at different standing times is shown in Figure 8. At the same standing time, the yield stress of slurry decreases as the sucrose dosage increases. Furthermore, as the standing time increases, the curve from low-sucrose-dosage slurry to high-sucrose-dosage slurry gradually evolves from nonlinear to linear. It should be noted that when the sucrose concentration exceeds 1.00%, the retarding effect becomes excessively strong, which not only leads to an excessive reduction in the initial yield stress (even below the critical anti-settling value in some cases), but also affects the later strength development of the filling body, which is detrimental to the stability of the filling layer. Therefore, considering the anti-settling performance, fluidity and later strength of the slurry comprehensively, the optimal sucrose concentration range is determined to be 0.50–0.75%. This concentration range can not only effectively reduce the yield stress and improve the fluidity of the slurry, but also ensure that the yield stress remains above the critical value within 120 min of standing, avoiding particle settlement and guaranteeing the safety of pipeline transportation. The standard deviation of each data point was normalized to obtain its CV, as shown in Table 7. The CV fluctuated around 5.0%, indicating that the experimental results are reliable.

3.4. Effect of Fly Ash Concentration on Rheological Parameters at Different Standing Times

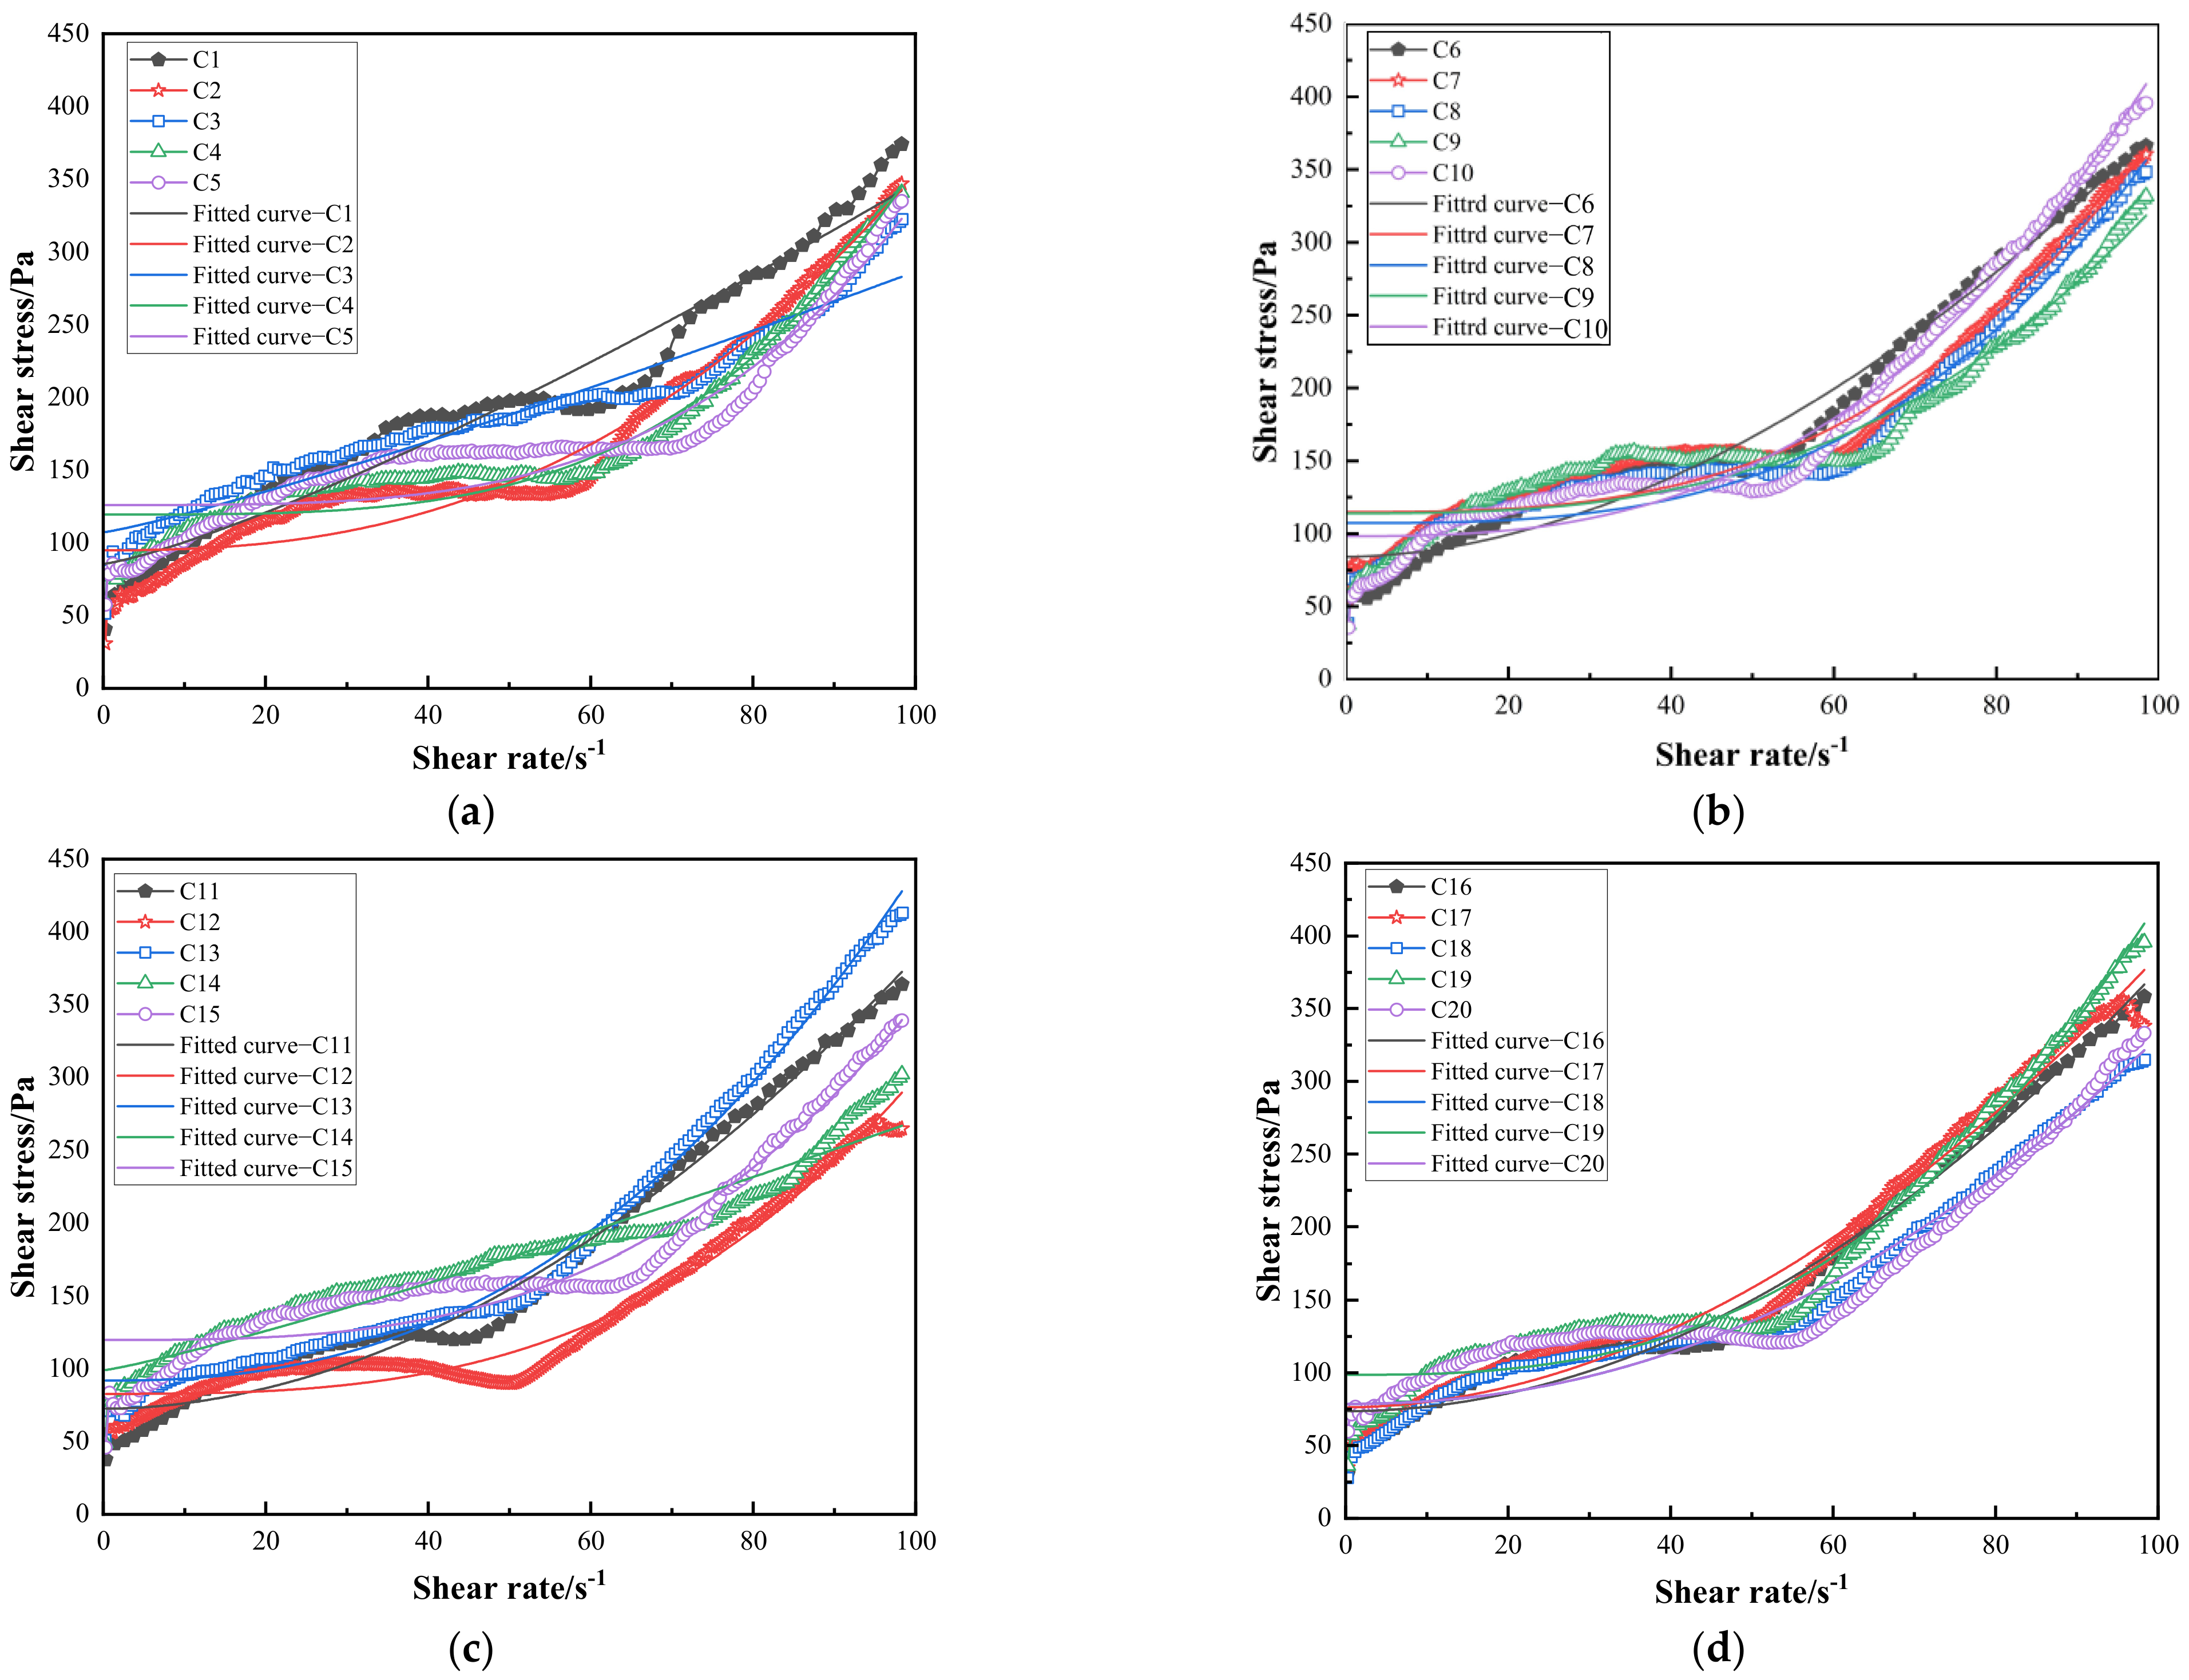
According to the rheological test protocol, slurries were prepared for experimentation. Rheological data were exported for analysis, yielding rheological curves for filling slurries with varying fly ash content ratios under different standing times, as shown in Figure 9. Altering the fly ash dosage did not change the rheological curve of the slurry. The filling slurry exhibited a change in flow state at a shear rate of approximately 50 s−1. At shear rates between 50 and 100 s−1, the shear stress of the slurry increased uniformly with increasing shear rate.
We selected the H-B model based on the curve type to fit the rheological curve and obtain rheological parameters. Table 8 presents the fitting results for rheological curve changes in filling material with varying fly ash contents under different standing times.
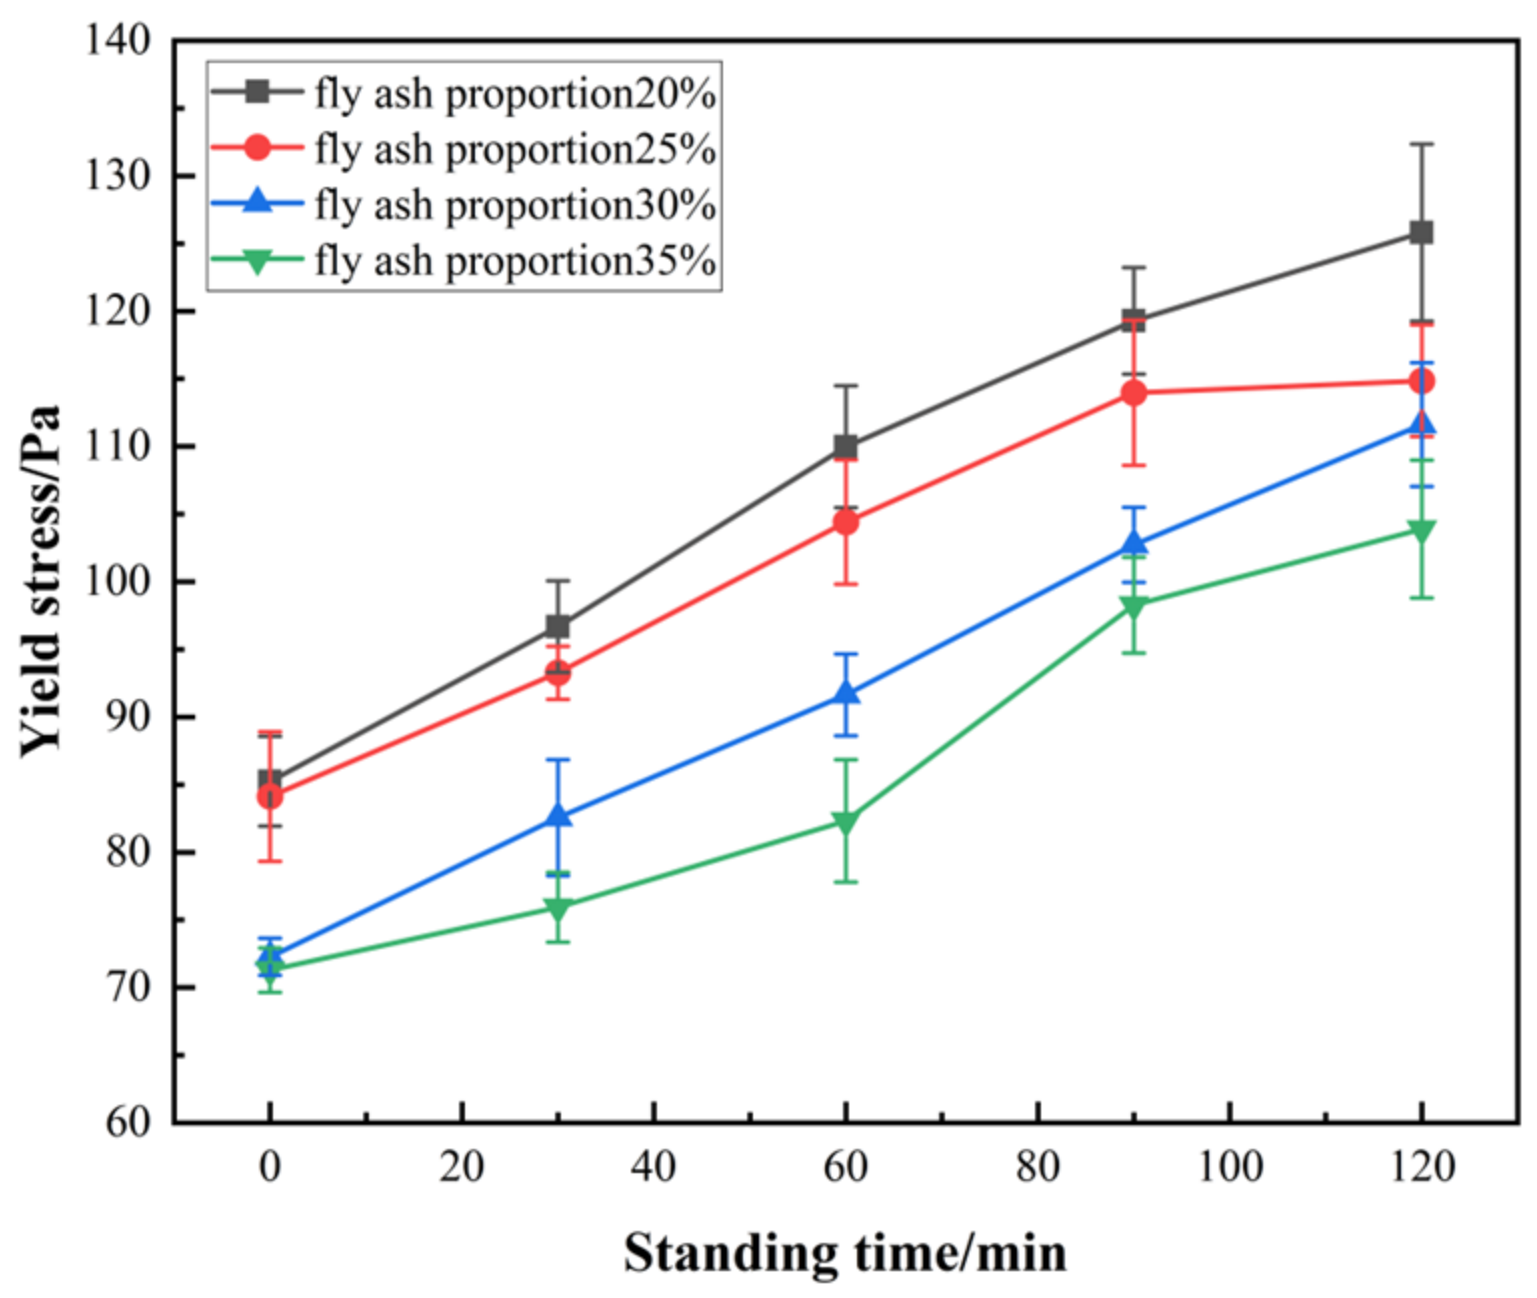
As shown in Figure 9, altering the fly ash content causes almost no change in the rheological curve of the slurry. The filling slurry undergoes a change in flow state at a shear rate of approximately 50 s−1. At shear rates between 50 and 100 s−1, the shear stress of the slurry increases uniformly with increasing shear rate. However, as the fly ash content increases, the yield stress of the slurry decreases significantly, with yield stresses of 85.25 Pa, 84.12 Pa, 72.28 Pa, and 71.29 Pa for slurries containing 20%, 25%, 30%, and 35% fly ash, respectively—a maximum decrease of 16.37%. This reduction stems from the lubricating effect of fly ash particles, where fine particles fill voids between coarse aggregates, thereby decreasing interlayer friction and lowering yield stress. Compared to slurries with 0 min of standing time, those containing 20% fly ash exhibited yield stress increases of 13.41–47.57% after 30–120 min of standing; those containing 25% fly ash showed increases of 10.88–36.54%; slurries with 30% fly ash showed increases of 14.22–54.43%; and those with 35% fly ash exhibited increases of 6.52–45.74%. The variation in yield stress over time for filling slurries with different fly ash content ratios is shown in Figure 10. As the standing time increases, the rate of yield stress increase gradually slows down. This is because the fine particle size of fly ash displaces free water in the channels, enhancing interparticle attraction. With the reduction in free water, increased contact and friction between fine particles lead to a gradual rise in internal friction within the material, progressively weakening the flowability of the slurry [25]. The yield stress of slurries with varying fly ash concentrations generally exhibits a steady upward trend as standing time increases. The proportion of fly ash has no significant effect on the flow characteristics of the slurry at different standing times. The standard deviation of each data point was normalized to obtain its CV, as shown in Table 9. The CV fluctuated around 5.0%, indicating that the experimental results are reliable; FSP is fly ash proportion.

4. Time-Dependent Yield Stress Model

4.1. Correlation Analysis

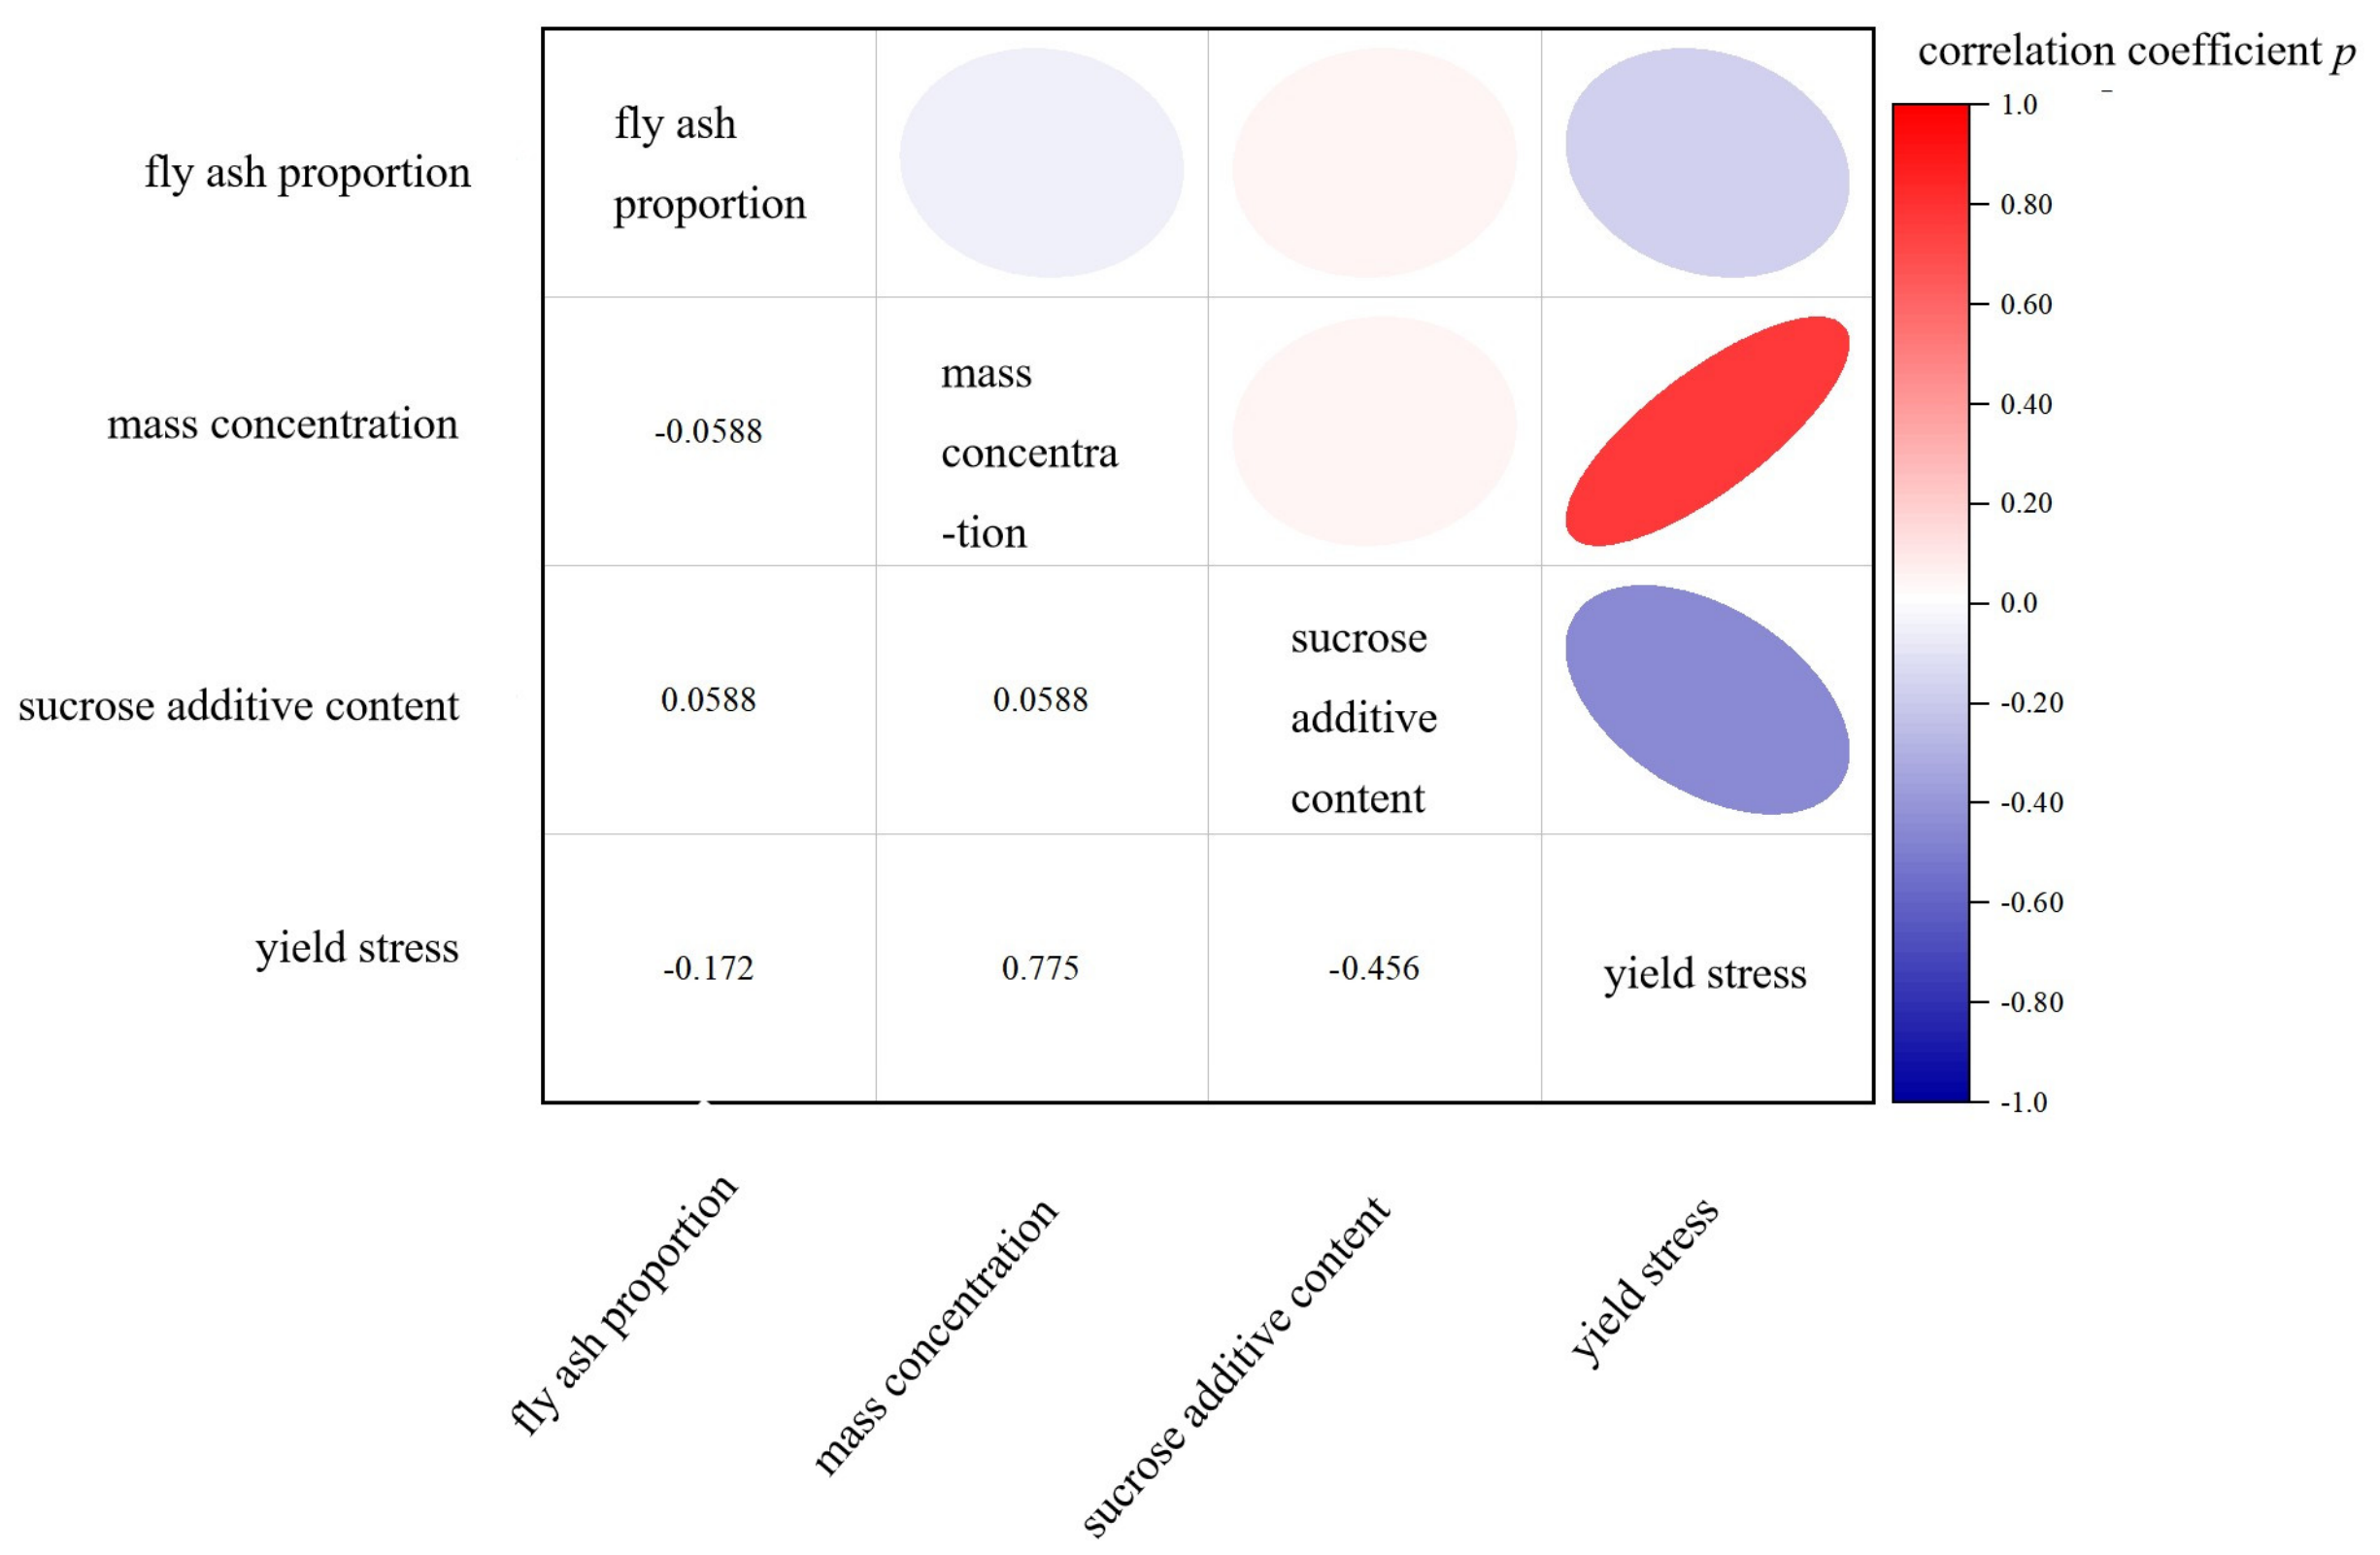
Figure 11 presents a visualization matrix analyzing the correlations between key physicochemical and mechanical properties of mine filling slurry. The horizontal and vertical axes represent the fly ash content, mass concentration, and sucrose additive content of the filling slurry. The numerical values and color scales within the intersection areas (red indicates a positive correlation and blue indicates negative correlation) visually represent the strength of associations between these properties. The figure shows a strong positive correlation between the yield stress of the slurry and its mass concentration (correlation coefficient of 0.775). According to the Bingham fluid rheological model, the yield stress and plastic viscosity of the filling slurry increase with rising mass concentration: as mass concentration increases, the proportion of solid particles in the slurry rises, leading to a simultaneous increase in particle contact probability and internal friction resistance. This corresponds to an increase in free pressure (which characterizes the effective stress during slurry shear), providing a critical basis for matching slurry parameters in mine filling. Although high-concentration slurries enhance the early load-bearing capacity of the filling material, the increased rheological resistance tends to elevate pipeline transportation energy consumption. Therefore, the mass concentration parameter should be optimized in conjunction with the free pressure threshold. Sucrose content exhibits a moderate negative correlation with yield stress (correlation coefficient of −0.456). Essentially, sucrose weakens the internal structural strength of the slurry through dispersion and retarding effects. The polyhydroxyl groups in sucrose molecules physically adsorb onto the surfaces of solid particles in the filling slurry (e.g., fly ash, cementitious particles), altering surface potentials and increasing electrostatic repulsion between particles; meanwhile, sucrose molecules adsorbed onto particle surfaces form steric hindrance layers that impede close contact and agglomeration between particles, dispersing aggregated particles into finer units. As the dispersion of solid particles increases, the mechanical interlocking and internal friction resistance between particles significantly decrease. This loosens the “particle network structure” within the slurry, correspondingly reducing the yield stress. Moreover, the higher the sucrose content, the more pronounced this dispersion effect becomes, and the stronger the inhibition of particle agglomeration. Additionally, sucrose can bind to calcium ions generated during the early hydration of cemented materials through complexation, thereby retarding the crystallization and growth processes of hydration products such as calcium silicate hydrate gel and calcium aluminate hydrate. The early yield stress of filling slurry partially originates from the “micro-cemented structure” formed by hydration products. The retarding effect of sucrose reduces the development of such early microstructures, weakening the internal bonding strength within the slurry, and consequently lowering the internal stress required to overcome slurry flow. The yield stress of the slurry exhibits a weak negative correlation with fly ash content (correlation coefficient of −0.172), primarily due to the particle characteristics of fly ash and its regulatory effect on the solid-phase system of slurry.

4.2. Time-Dependent Model

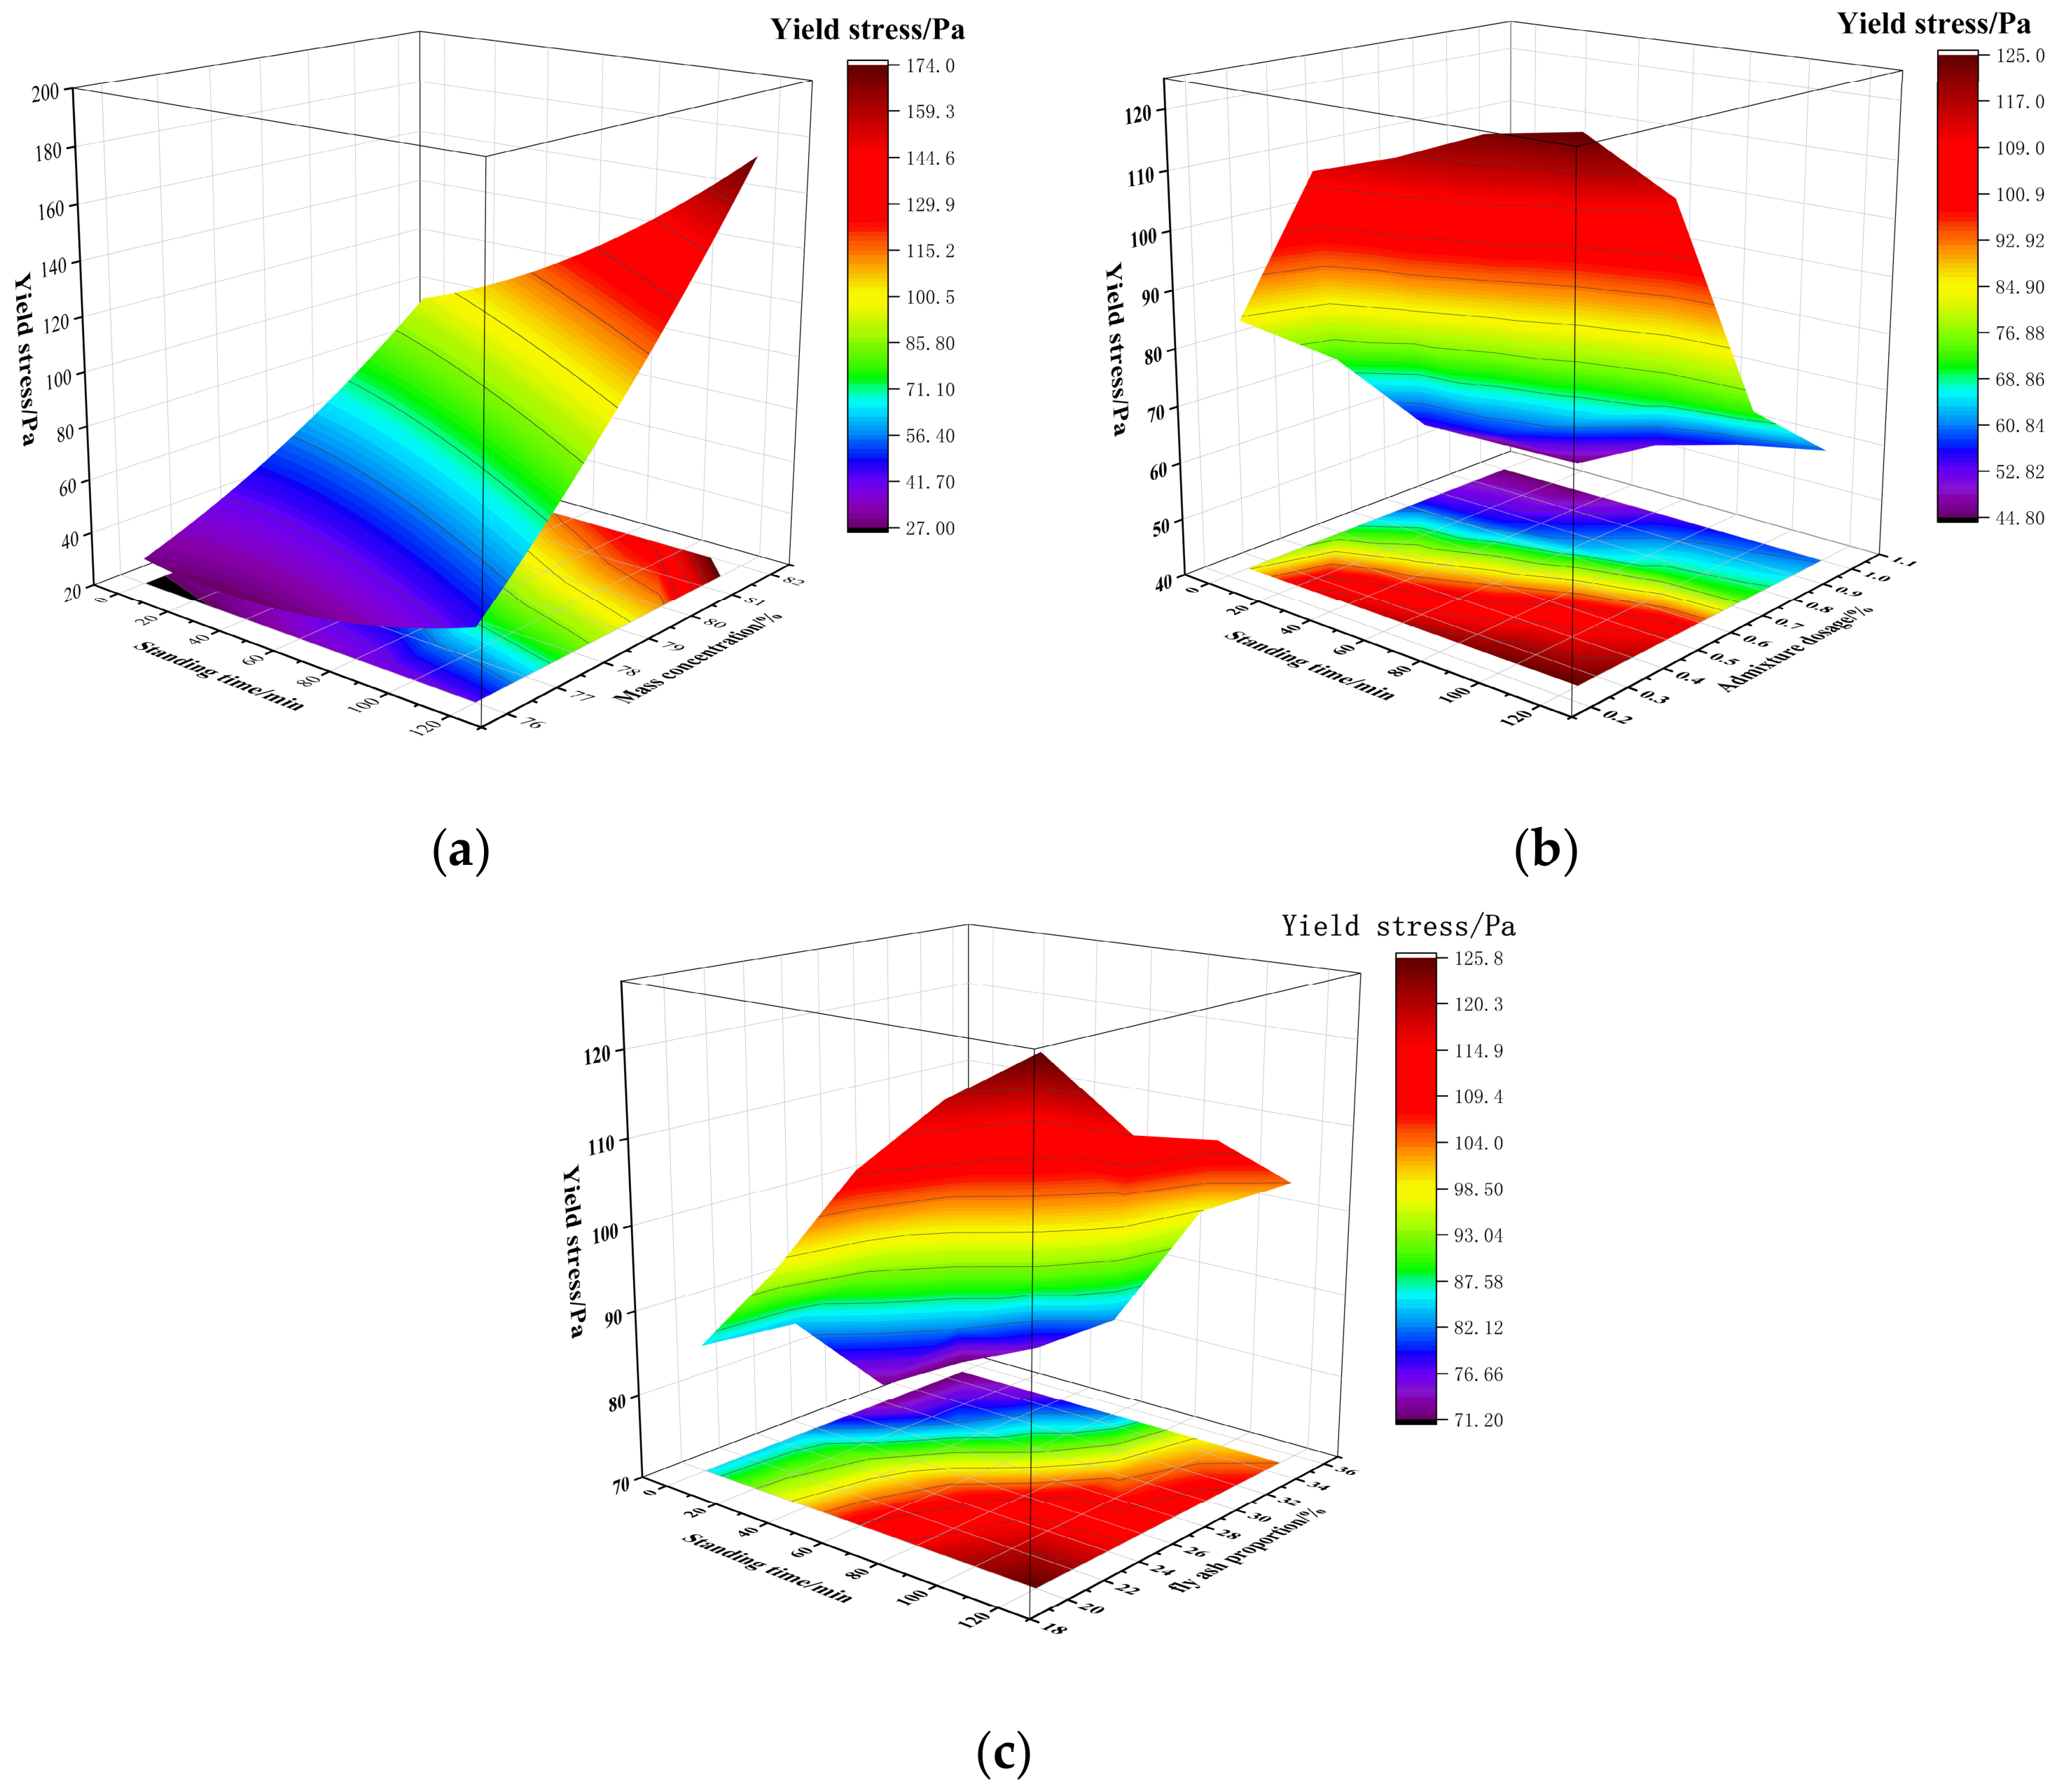
Based on experimental data, a three-dimensional surface model of the yield stress of filling material over time, considering material proportions, has been constructed. This model is crucial for analyzing the yield stress when restarting the pump after stopping the filling slurry under different conditions. After obtaining the yield stress at different times based on the Herschel–Bulkley model, a two-dimensional polynomial was used to construct a time-dependent prediction model for yield stress. The selection of this mathematical form is not a purely empirical fitting, but highly consistent with the internal physical structure evolution and hydration kinetic characteristics of basalt fiber–gangue cemented backfill slurry, with a clear physical basis. The temporal variation in the yield stress of basalt fiber–gangue cemented backfill slurry is essentially jointly controlled by four physical processes: flocculent structure formation, free water consumption, hydration product growth, and enhanced interparticle friction. These processes exhibit the characteristics of a rapid initial increase followed by a slowdown and nonlinear increment within 0–120 min of standing, which is highly consistent with the function form of a quadratic polynomial: the first-order term reflects the rapid construction of flocculent networks in the early stage of hydration and the approximately linear growth of yield stress; the second-order term reflects the saturation trend where the structure tends to be stable and the growth rate gradually slows down. Compared with linear models, exponential models, and traditional phenomenological models, the polynomial does not require the introduction of additional assumptions, can achieve high-precision fitting while ensuring physical significance, and is more suitable for rapid prediction in engineering sites.
Figure 12a shows the fitting surface of the yield stress of the filling material as a function of static time at different mass concentrations. A two-dimensional polynomial was selected for fitting based on the surface, yielding the fitting expression in Equation (4) with a fitting coefficient R2 of 0.964. Figure 12b shows the fitting surface of the yield stress of the filling material as a function of standing time under different retarder dosages. A two-dimensional polynomial was selected for fitting based on the surface, yielding the fitting expression in Equation (5) with a coefficient of determination R2 of 0.969. Figure 12c shows the fitting surface of the yield stress of the filling material as a function of standing time for different fly ash contents. A two-dimensional polynomial was selected based on the surface for fitting, yielding the fitting expression in Equation (6) with a fitting coefficient R2 of 0.966.
Z 1 = 3566.58 6.68 a + 99.86 b + 0.7 b 2 + 0.09 ab
Z 2 = 116.57 + 0.51 a 108.98 c 29.47 a 2 + 33.4 c 2 0.27 ac
Z 3 = 110.37 + 0.43 a 1.03 d 0.05 d 2
To analyze the significance of each factor’s influence on yield stress, a three-factor analysis of variance was conducted on the rheological data. Mass concentration, fly ash content, and retarder dosage were set as grouping variables, with curing time as a covariate and the yield stress value of the filling slurry as the dependent variable. The analysis results are shown in Table 10.
According to the results of the analysis of variance, the significant probability values P for all three factors were less than 0.001, indicating reliable analysis results. Combined with the F-value analysis, the time-dependent behavior of the filling material is primarily influenced by mass concentration, followed by the proportion of retarder and fly ash. These findings provide a reference for overcoming restart resistance during slurry pump stoppage in long-distance pipeline transportation.

5. Conclusions

This paper takes basalt fiber-reinforced gangue cemented slurry as the research object. Using the Herschel–Bulkley rheological model, rheological tests were carried out to investigate the influences of mass concentration, sucrose dosage, fly ash ratio, and standing time on the time-varying law of yield stress. A time-dependent prediction model for yield stress was established accordingly. Within the experimental range (mass concentration 76–82%, sucrose dosage 0.25–1.00%, fly ash ratio 20–35%, standing time 0–120 min), the experimentally verifiable conclusions are as follows:
(1) Under the test conditions, the rheological behavior of basalt fiber-reinforced gangue cemented slurry can be well described by the Herschel–Bulkley model, with all coefficients of determination R2 > 0.90. The yield stress shows an overall upward trend with the extension of standing time. The yield stress of fresh slurry increases with the rise in mass concentration, while it decreases with the increase in sucrose dosage and fly ash ratio.
(2) Within the experimental mixing ratios, mass concentration exerts the most significant effect on the time-varying law of yield stress, followed by sucrose dosage, and fly ash ratio has a relatively weak influence. After 120 min of standing, the yield stress of slurry with mass concentration from 76% to 82% increases by 81.03%, 91.38%, 54.42%, and 97.48%, respectively, compared with fresh slurry; the slurry with 82% mass concentration presents the largest increment in yield stress at 120 min of standing.
(3) Sucrose exhibits an obvious inhibitory effect on yield stress, and the retarding effect becomes more prominent when the dosage exceeds 0.5%. For slurry with a sucrose dosage from 0.25% to 1.00%, the yield stress increases by 48.66%, 54.42%, 32.90%, and 33.70%, respectively, after 120 min of standing, and the time-dependent increment of yield stress is lower at high dosages.
When the fly ash ratio increases from 20% to 35%, the yield stress of fresh slurry shows a downward trend with a maximum decrease of approximately 16.37%. Within the standing time of 0–120 min, the yield stress rises steadily without drastic fluctuations.
(4) The quadratic polynomial time-varying model established based on experimental data achieves a goodness of fit R2 > 0.96, and can predict the time-varying law of yield stress within the experimental scope of this study. Each empirical coefficient of the model is related to physical processes, such as the initial structure, hydration rate, and interparticle interaction of the slurry, rather than a purely empirical mathematical fitting.
(5) Under the experimental conditions of this paper, the mixing ratio combination of mass concentration 78–82% and sucrose dosage ≥ 0.75% enables the slurry yield stress to meet the particle suspension requirement and maintain a relatively stable time-dependent growth characteristic, which can provide a reference for the restart of long-distance pipeline transportation after pump shutdown.

Author Contributions

Conceptualization, B.Z.; Methodology, B.Z.; Software, S.C.; Validation, S.C. and P.C.; Formal analysis, B.Z. and S.C.; Investigation, D.Z., P.C. and J.W.; Resources, P.C. and J.W.; Data curation, D.Z. and J.W.; Writing—original draft, S.C.; Writing—review & editing, S.C.; Visualization, S.C.; Supervision, D.Z. and P.C.; Project administration, B.Z., D.Z., P.C. and J.W.; Funding acquisition, B.Z. All authors have read and agreed to the published version of the manuscript.

Funding

This research was funded by [Two Chains’ Integration Key Projects—Joint Key Projects of Enterprise Institutes—Industrial Field Program] grant number [2023-LL-QY-02] and [National Natural Science Foundation of China] grant number [No. 52074208].

Institutional Review Board Statement

Not applicable.

Informed Consent Statement

Not applicable.

Data Availability Statement

The original contributions presented in the study are included in the article, further inquiries can be directed to the corresponding authors.

Conflicts of Interest

The authors declare that there is no conflict of interest concerning the publication of this paper.

References

  1. Kang, H.; Li, Q.; Zhang, Y.; Guo, J.; Liu, P. Development status and prospect of greenmining and ecological restoration technology of coal mines in China. J. Green Mine 2023, 1, 1–24. [Google Scholar]
  2. Zhang, J.; Zhang, Q.; Zhou, N.; Li, M.; Huang, P.; Li, B. Research progress and prospect of coal based solid waste backfilling mining technology. J. China Coal Soc. 2022, 47, 4167–4181. [Google Scholar] [CrossRef]
  3. Zhuang, D.; Liu, L.; Yin, S. Long-distance pipeline transportation of gangue slurry: An integrated technical framework for synergistic optimization of equipment, materials, and processes. J. Cent. South Univ. (Sci. Technol.) 2025, 56, 2924–2941. [Google Scholar]
  4. Zhang, X.; Qiao, P. Simulation and experiment of pipeline transportation of high density filling slurry with coarse aggregates. Chin. J. Nonferrous Met. 2015, 25, 258–266. [Google Scholar] [CrossRef]
  5. Wang, X.; Yan, Q.; Wang, H.; Yin, S.; Cha, Q.; Xiong, Y. Rheological properties and pipe resistance prediction of tailing paste containing coarse aggregate in long-distance transportation. J. Harbin Eng. Univ. 2024, 45, 535–542. [Google Scholar]
  6. Zhao, B.; Liu, Y. The Effects of Basalt Fiber Parameter on the Fluidity of the Cement Mortar. J. Wuhan Univ. Technol. 2009, 31, 5–8. [Google Scholar] [CrossRef]
  7. Cheng, H. Rheological Parameters and Pipeline Resistance Characteristics of Paste Under Time-Temperature Effect. Ph.D. Thesis, University of Science and Technology Beijing, Beijing, China, 2018. [Google Scholar]
  8. Hao, Y.; Huang, Y.; Li, Y.; Zhu, N.; Lin, H. Influencing factors of critical flow Nonferrous Metalsrate of gangue paste-like filler slurry. Coal Eng. 2022, 54, 128–133. [Google Scholar]
  9. Zhai, Y.G.; Wu, A.X.; Wang, H.; Chen, Q.; Xiao, Y.; Shou, Z. Threshold mass fraction of unclassified-tailings paste for backfill mining. Chin. J. Eng. 2011, 33, 795–799. [Google Scholar] [CrossRef]
  10. Ren, A.; Feng, G.; Guo, Y. Influence on performance of coal mine filling paste with fly ash. J. China Coal Soc. 2014, 39, 2374–2380. [Google Scholar] [CrossRef]
  11. Su, F.; Liu, S.; Liu, P. Study on the Influence of Different Retarders on the Properties of Paste Backfill Slurry. Min. Technol. 2024, 24, 247–254. [Google Scholar] [CrossRef]
  12. Zhao, B.; Wen, J.; Zhai, D. Study on Rheological Properties of Basalt Fiber Gangue Filling Material. Nonferrous Met. 2025, 15, 668–678. [Google Scholar] [CrossRef]
  13. Li, S.; Wang, X.; Zhang, Q. Time-Varying Characteristic of Paste-like Super-Fine Unclassified Tailings in Long Self-Flowing Transportation. J. Northeast. Univ. (Nat. Sci.) 2016, 37, 1045–1049+1060. [Google Scholar] [CrossRef]
  14. Wu, J.; Feng, M.; Ni, X.; Mao, X.; Chen, Z.; Han, G. Aggregate gradation effects on dilatancy behavior and acoustic characteristic of cemented rockfill. Ultrasonics 2019, 92, 79–92. [Google Scholar] [CrossRef] [PubMed]
  15. Zhao, B.C.; Chen, P.; Zhai, D.; Zhang, J.; Wei, Q. Influence of particle gradation and timeliness on rheological properties of filling slurry. Saf. Coal Mines 2023, 54, 117–127. [Google Scholar] [CrossRef]
  16. Wallevik, J.E. Rheological properties of cement paste: Thixotropic behavior and structural breakdown. Cem. Concr. Res. 2009, 39, 14–29. [Google Scholar] [CrossRef]
  17. Lin, Y.; Su, S.; Zhao, M. Experimental Study on Rheological Properties of Coal Gangue-Fly Ash Filling Slurry. Coal Geol. China 2021, 33, 13–17+41. [Google Scholar]
  18. Wang, Y.; Zhan, Q.; Zou, R. A preliminary study on the stress overshoot characteristics of viscous debris flow and the formation mechanism of surging flow. Chin.J.Geol. Hazards Control. 2000, 3, 56–60. [Google Scholar] [CrossRef]
  19. Ruan, Z.; Wu, A.; Wang, J. Flocculation and settling behavior of unclassified tailings based on measurement of flocchord length. Chin. J. Eng. 2020, 42, 980–987. [Google Scholar] [CrossRef]
  20. Song, S.; Fan, Y.; Ma, X. Study on structural characteristics and influence mechanism of coal slurry flocs by mechanical shearing. Coal Sci. Technol. 2020, 48, 214–219. [Google Scholar] [CrossRef]
  21. Li, Q.; Wang, Q.; Hou, J.; Yang, Z.; Zhang, J. Application of interparticle potential and eDLVO theory in coal water slurry. J. Cent. South Univ. (Sci. Technol.) 2021, 52, 3728–3740. [Google Scholar]
  22. Liu, L.; Gao, W.; Wang, Z. Influencing factors of particle aggregation behavior in coagulation process and its numerical simulation method. Coal Chem. Ind. 2023, 46, 101–105+109. [Google Scholar] [CrossRef]
  23. Shen, W.; Zhou, M. Influence Mechanism of Sucrose on Hydration Process of Portland Cement. J. Build. Mater. 2007, 10, 566–572. [Google Scholar]
  24. Pang, X. Research on the Influence of Setting Regulators on the Induction Period of Cement Hydration. Ph.D. Thesis, Beijing University of Technology, Beijing, China, 2017. [Google Scholar]
  25. Guan, W.; Dan, M.; Yu, H. Rheological Properties of Fly Ash-Cement Slurry. J. Build. Mater. 2001, 4, 339–345. [Google Scholar]
Figure 1. Rheological test.
Applsci 16 05720 g001
Figure 2. Rheological curves of different types of fluids.
Applsci 16 05720 g002
Figure 3. Rheological time variation curves of filling slurry at different mass concentrations. (a) Mass concentration 76%. (b) Mass concentration 78%. (c) Mass concentration 80%. (d) Mass concentration 82%.
Applsci 16 05720 g003
Figure 4. Time−dependent yield stress of filling slurry at different mass concentrations.
Applsci 16 05720 g004
Figure 5. Figure of formation and destruction mechanism of flocculent structure.
Applsci 16 05720 g005
Figure 6. Rheological time variation curves of filling slurry at different sucrose dosages. (a) Sucrose dosage 0.25%. (b) Sucrose dosage 0.50%. (c) Sucrose dosage 0.75%. (d) Sucrose dosage 1.00%.
Applsci 16 05720 g006
Figure 7. Figure of retarding mechanism of sucrose.
Applsci 16 05720 g007
Figure 8. Time-dependent yield stress of filling slurry at different sucrose dosages.
Applsci 16 05720 g008
Figure 9. Rheological time variation curves of filling slurry with different fly ash contents. (a) Fly ash content of 20%. (b) Fly ash content of 25%. (c) Fly ash content of 30%. (d) Fly ash content of 35%.
Applsci 16 05720 g009
Figure 10. Time-dependent yield stress variation in filling slurries with different fly ash content ratios.
Applsci 16 05720 g010
Figure 11. Visualization matrix of correlation between core physicochemical and mechanical properties of slurry.
Applsci 16 05720 g011
Figure 12. Surface plot of yield stress vs. standing time under different factors. (a) Surface plot of yield stress versus standing time at various mass concentrations; (b) Surface relationship between yield stress and standing time under various sucrose concentrations; (c) Surface relationship between yield stress and standing time under various fly ash proportions.
Applsci 16 05720 g012
Table 1. Mass proportion of main chemical composition of cement, fly ash, and gangue (%).
CompositionSiO2Al2O3CaOSO3K2OFe2O3Other
Materials
Cement18.876.0863.843.651.244.082.24
Fly ash50.7729.884.011.233.027.423.67
Gangue50.1629.60.488.641.517.262.35
Table 2. Gangue particle size gradation and mass fraction.
SampleParticle Size/mmProportion/%
1<0.521
20.5–116
31–217
42–424
54–822
Table 3. Rheological experiment scheme.
NoMass Concentration/%Sucrose Concentration/%Fly Ash Proportion/%Standing Time/min
A1–A5760.50300–120
A6–A10780.50300–120
A11–A15800.50300–120
A16–A20820.50300–120
B1–B5800.25300–120
B6–B10800.50300–120
B11–B15800.75300–120
B16–B20801.00300–120
C1–C5800.50200–120
C6–C10800.50250–120
C11–C15800.50300–120
C16–C20800.50350–120
Table 4. Fitting results of rheological parameters for filling materials at different mass concentrations under various standing times.
NoTime/minFitting EquationYield Stress τ 0Plastic Viscosity μ Consistency Coefficient nR2
A10 τ = 23.46 + 0.016 γ 2.04 23.460.0162.040.99
A230 τ = 27.52 + 0.013 γ 2.08 27.520.0132.080.99
A360 τ = 34.45 + 6.962 × 10 4 γ 2.73 34.456.962 × 10−42.730.99
A490 τ = 38.38 + 0.039 γ 1.88 38.380.0391.880.99
A5120 τ = 42.47 + 0.089 γ 1.66 42.470.0891.660.99
A60 τ = 41.89 + 0.026 γ 2.02 41.890.0262.020.99
A730 τ = 47.73 + 0.012 γ 2.13 47.730.0122.130.99
A860 τ = 57.77 + 0.010 γ 2.19 57.770.0102.190.99
A990 τ = 72.89 + 0.012 γ 2.15 72.890.0122.150.96
A10120 τ = 80 . 17 + 0.006 γ 2.34 80.170.0062.340.99
A110 τ = 72.28 + 0.045 γ 1.92 72.280.0451.920.98
A1230 τ = 82.56 + 2.654 × 10 4 γ 2.96 82.562.654 × 10−42.960.96
A1360 τ = 91.64 + 0.005 γ 2.40 91.640.0052.400.99
A1490 τ = 102.73 + 0.876 γ 1.15 102.730.8761.150.94
A15120 τ = 111.62 + 2.219 × 10 4 γ 3.01 111.622.219 × 10−43.010.93
A160 τ = 99.36 + 2.495 γ 0.88 99.362.4950.880.99
A1730 τ = 104.44 + 1.063 γ 1.20 104.441.0631.200.98
A1860 τ = 118.68 + 0.609 γ 1.36 118.680.6091.360.99
A1990 τ = 132.43 + 27.000 γ 0.63 132.4327.0000.630.96
A20120 τ = 196.22 + 0.058 γ 1.76 196.220.0581.760.95
Table 5. CV of time-dependent yield stress of filling slurry at different mass concentrations.
Mc
CV/%
Time
0306090120
76%4.45.13.75.42.8
78%2.74.73.12.92.6
80%5.44.91.93.52.8
82%4.45.32.93.33.9
Table 6. The fitting results of rheological curves for filling materials with different sucrose dosages as a function of standing time.
NoTime/minFitting EquationYield Stress τ 0Plastic Viscosity μ Consistency Coefficient nR2
B10 τ = 84.06 + 0.062 γ 1.84 84.060.0621.840.97
B230 τ = 111.83 + 0.012 γ 2.05 111.830.0122.050.90
B360 τ = 116.46 + 0.065 γ 1.83 116.460.0651.830.95
B490 τ = 122.38 + 0.191 γ 1.53 122.380.1911.530.90
B5120 τ = 124.96 + 2.561 γ 0.98 124.962.560.980.85
B60 τ = 72.28 + 0.045 γ 1.92 72.280.0451.920.98
B730 τ = 82.56 + 2.654 × 10 4 γ 2.96 82.562.654 × 10−42.960.96
B860 τ = 91.64 + 0.005 γ 2.40 91.640.0052.400.99
B990 τ = 102.73 + 0.876 γ 1.15 102.730.8761.150.94
B10120 τ = 111.62 + 2.219 × 10 4 γ 3.01 111.622.219 × 10−43.010.93
B110 τ = 54.62 + 0.035 γ 1.90 54.620.0351.900.99
B1230 τ = 56.79 + 3.003 γ 0.94 56.793.0030.940.97
B1360 τ = 63.04 + 4.730 γ 0.83 63.044.7300.830.96
B1490 τ = 70.52 + 0.347 γ 1.42 70.520.3471.420.96
B15120 τ = 72.59 + 0.004 γ 2.34 72.590.0042.340.97
B160 τ = 44.92 + 0.226 γ 1.49 44.920.2261.490.99
B1730 τ = 45.32 + 0.014 γ 2.11 45.320.0142.110.99
B1860 τ = 52.96 + 0.897 γ 1.22 52.960.8971.220.95
B1990 τ = 57 . 12 + 0.043 γ 1.86 57.120.0431.860.98
B20120 τ = 60.06 + 0.022 γ 2.04 60.060.0222.040.99
Table 7. CV of time-dependent yield stress of filling slurry at different sucrose dosages.
SD
CV/%
Time
0306090120
0.25%3.93.54.13.35.2
0.50%5.72.14.44.73.6
0.75%1.95.23.32.74.1
1.00%2.33.45.53.64.9
Table 8. Fitting results of rheological parameters for filling materials with different fly ash contents.
NoTime/minFitting EquationYield Stress τ Plastic Viscosity μ Consistency Coefficient nR2
C10 τ = 85.25 + 0.847 γ 1.25 85.250.8471.250.95
C230 τ = 96.68 + 0.003 γ 2.48 96.680.0032.480.95
C360 τ = 109.98 + 0.891 γ 1.51 109.980.8911.510.94
C490 τ = 119.28 + 1.810 × 10 5 γ 3.56 119.281.810 × 10−53.560.95
C5120 τ = 125.80 + 1.731 × 10 5 γ 3.54 125.801.731 × 10−53.540.87
C60 τ = 84.12 + 0.062 γ 1.84 84.120.0621.840.97
C730 τ = 93.27 + 0.001 γ 2.72 93.273.5682.930.95
C860 τ = 104.41 + 2.23 × 10 4 γ 3.02 104.412.23 × 10−43.020.95
C990 τ = 113 . 97 + 5.062 × 10 4 γ 2.81 113.975.062 × 10−42.810.90
C10120 τ = 114 . 86 + 3.568 × 10 4 γ 2.93 114.860.0012.720.97
C110 τ = 72.28 + 0.045 γ 1.92 72.280.0451.920.98
C1230 τ = 82.56 + 2.654 × 10 4 γ 2.96 82.562.654 × 10−42.960.96
C1360 τ = 91.64 + 0.005 γ 2.40 91.640.0052.400.99
C1490 τ = 102.73 + 0.876 γ 1.15 102.730.8761.150.94
C15120 τ = 111.62 + 2.219 × 10 4 γ 3.01 111.622.219 × 10−43.010.93
C160 τ = 71.29 + 0.031 γ 1.99 71.290.0311.990.98
C1730 τ = 75.94 + 0.045 γ 1.92 75.940.0451.920.97
C1860 τ = 82.32 + 0.012 γ 2.14 82.320.0122.140.97
C1990 τ = 98.27 + 0.001 γ 2.71 98.270.0012.710.97
C20120 τ = 103.90 + 6.449 × 10 5 γ 3.29 103.906.449 × 10−53.290.96
Table 9. CV of time-dependent yield stress of filling slurry at different fly ash content ratios.
FSP
CV/%
Time
0306090120
20%3.93.54.13.35.2
25%5.72.14.44.73.6
30%1.95.23.32.74.1
35%2.33.45.53.64.9
Table 10. Three-way ANOVA.
TermSum of SquaresDegrees of FreedomMean SquareFP
Mass Concentration56,842.08318,947.36238.49<0.001
Fly Ash Content2745.703915.2411.52<0.001
Retarder Dosage14,338.0134779.3560.16<0.001
Disclaimer/Publisher’s Note: The statements, opinions and data contained in all publications are solely those of the individual author(s) and contributor(s) and not of MDPI and/or the editor(s). MDPI and/or the editor(s) disclaim responsibility for any injury to people or property resulting from any ideas, methods, instructions or products referred to in the content.