Article

VLM-MCPDD: An Interpretable Vision Language Model for Multi-Crop Pests and Disease Diagnosis

College of Electrical Engineering, Henan University of Technology, Zhengzhou 450001, China
*
Author to whom correspondence should be addressed.
Appl. Sci. 2026, 16(11), 5719; https://doi.org/10.3390/app16115719
Submission received: 28 April 2026 / Revised: 25 May 2026 / Accepted: 1 June 2026 / Published: 5 June 2026

Abstract

Deep convolutional neural networks have made substantial progress in automated crop disease diagnosis. However, their practical application remains constrained by limited interpretability and insufficient structured reasoning, as these models largely operate as black boxes. Although they are effective in extracting visual features, they often fail to provide semantically grounded explanations, which may reduce their reliability in complex and open agricultural environments. To address these issues, this study constructs a Vision Language Model for Multi-Crop Pest and Disease Diagnosis (VLM-MCPDD). Specifically, the LLaVA-1.5 model is fine-tuned using low-rank adaptation (LoRA) to better align visual symptom representations with domain-specific agricultural knowledge. In addition, a Pests and Diseases Semantic Dataset (PDSD) is constructed to support multimodal learning. Based on PDSD, a chain-of-thought (CoT) mechanism is introduced to simulate the diagnostic workflow of agronomists, covering symptom observation, causal analysis, and final decision-making. The experimental results show that compared with comparative models such as Swin Transformer and ConvNeXt, VLM-MCPDD performs better in overall performance and can provide some reference for disease and pest diagnosis in intelligent agriculture.

1. Introduction

Rapid population growth and escalating climate variability are placing unprecedented strain on global food security. Projections indicate that agricultural production must rise by approximately 70% to meet future demand [1]. However, this critical productivity is severely bottlenecked by biotic stressors, particularly crop pests and diseases, which directly reduce yield and compromise overall crop quality. Field diagnosis of these threats is inherently challenging because symptoms often overlap across different pathogens, and distinct morphological markers are frequently absent during the early stages of infection. Conventional manual scouting is labor-intensive, highly subjective, and fundamentally unscalable, making it inadequate for the rigorous demands of modern precision agriculture.
Deep learning, particularly through the extraction of discriminative visual features, has substantially advanced automated disease diagnosis [2,3]. Convolutional neural networks (CNNs) have achieved remarkable success in a wide range of visual classification tasks, including plant disease and pest detection. However, these models often lack the reasoning and intelligence required for practical deployment: they rely on large-scale datasets with limited semantic annotation, and their black-box nature may lead to misinterpretation, reducing their reliability in complex and dynamic agricultural environments. In contrast, vision-language models (VLMs) offer a promising alternative by jointly processing visual and textual information. By integrating visual features with structured domain knowledge, VLMs can go beyond mere image recognition, enabling interpretable and human-readable disease diagnosis.
Accordingly, this paper constructs a Vision Language Model for Multi-Crop Pest and Disease Diagnosis(VLM-MCPDD). The model adopts Low-Rank Adaptation (LoRA) for parameter-efficient fine-tuning. By introducing the chain-of-thought mechanism, the model can effectively utilize visual symptom information and provide support for distinguishing pests and diseases with similar visual features.
The primary contributions of this work are summarized as follows:
  • This paper constructs a Vision Language Model for Multi-Crop Pest and Disease Diagnosis (VLM-MCPDD). By adopting the LoRA method, the parameters of the existing LLaVA-1.5 model were fine-tuned. This model can effectively identify crop pest and disease images and provide corresponding diagnostic descriptions.
  • The Pests and Diseases Semantic Dataset (PDSD) is constructed to support multi-crop pest and disease diagnosis tasks. This dataset consists of pest and disease images and their corresponding textual descriptions, providing a data foundation for the training and evaluation of VLMs in the field of agricultural diagnosis.
  • The CoT reasoning mechanism is introduced into the crop pest and disease diagnosis process. Enhancing the model’s logical analysis ability for pest and disease symptoms, it improves the accuracy of pest and disease classification.
The remainder of this paper is organized as follows. Section 2 reviews related work in vision-based disease diagnosis and vision-language modeling. Section 3 details the methodology of the proposed VLM-MCPDD framework. Section 4 presents the experimental setup, results, and comparative analysis. Finally, Section 5 concludes the paper with implications for intelligent agriculture and directions for future research.

2. Related Work

2.1. Visual Perception Mechanisms in Crop Disease Diagnosis

The landscape of automated crop disease diagnosis has evolved significantly, transitioning from traditional handcrafted feature engineering to advanced deep-learning-based visual recognition. Early methodologies primarily relied on manually designed descriptors, such as color histograms and texture patterns, coupled with classical machine learning classifiers like Support Vector Machines (SVM) and Random Forests. While pioneering studies by Khan et al. [4] and Ni et al. [5] demonstrated the feasibility of these methods under controlled laboratory conditions, their performance often degraded precipitously in unconstrained field environments. This vulnerability stems from complex variations in illumination, background clutter, leaf occlusion, and diverse symptom appearances. Consequently, the rigid, low-level feature representations inherent to these early models lacked the generalization capacity required for robust, real-world agricultural deployment.
The emergence of CNNs marked an important turning point in agricultural image analysis, enabling end-to-end learning of complex hierarchical visual features. Deep architectures such as [6], DenseNet [7], and EfficientNet [8] have substantially improved the accuracy of disease classification. Subsequently, attention-based methods further enhanced this discriminative capability and successfully localized subtle pathological regions in crops such as maize and wheat [9,10]. Despite these promising experimental results, CNN-based methods still have certain limitations. They typically map visual inputs directly to disease labels, providing limited diagnostic justification. Moreover, they have difficulty effectively incorporating domain knowledge, which constrains their ability to distinguish symptoms that appear visually similar but arise from different causes.

2.2. Vision-Language Reasoning for Agricultural Diagnostics

LLMs have demonstrated an unprecedented proficiency in processing unstructured domain knowledge. Foundational architectures, including the LLaMA and GPT series, exhibit robust natural language understanding and generation capabilities, prompting extensive efforts to adapt them for specialized agricultural applications. For instance, Yang et al. [11] introduced PLLaMa by fine-tuning LLaMA-2 on comprehensive plant science corpora to address specialized agronomic queries, while Peng et al. [12] integrated LLMs with embedding-based retrieval systems to extract actionable insights from agricultural literature. Nevertheless, these text-centric models are inherently incapable of directly processing visual symptoms, fundamentally limiting their utility in field diagnostics where visual evidence remains the primary modality for disease identification.
Beyond conventional LLM applications, retrieval-augmented and knowledge-driven LLM frameworks have also been explored in recent years to improve factual grounding and reasoning reliability. For example, TrumorGPT combines graph-based retrieval-augmented generation with semantic health knowledge graphs for fact-checking health-related claims [13]. Similarly, Contextual RAG guides retrieval using candidate answers and contextual information to enhance domain-specific reasoning in O-RAN question answering [14]. These studies indicate that external knowledge retrieval can improve the reliability and adaptability of LLMs. However, such approaches mainly focus on text-based question answering or fact-checking tasks, whereas agricultural pest and disease diagnosis requires effective alignment between visual symptoms and domain knowledge.
VLMs have effectively bridged this critical modality gap by combining powerful visual encoders with the advanced reasoning capabilities of LLMs [15]. This multimodal integration enables the simultaneous interpretation of visual abnormalities and their corresponding textual descriptions. In an early attempt, Cao et al. [16] proposed the ITLMLP framework, which successfully integrated image, text, and label embeddings for cucumber disease recognition. Recent studies also include the Wheat Disease Language Model developed by Zhang et al. [17], the LLMI-CDP framework proposed by Wang et al. [18], and the Agro-LLaVA-Next framework introduced by Xu et al. [19]. These models all fall within the category of vision-language models and adopt LoRA-based fine-tuning strategies to effectively align visual symptom representations with linguistic diagnostic knowledge.
Despite these advances, existing agricultural VLMs still have certain limitations. Specifically, they often map multimodal inputs directly to the final disease labels, lack an explicit diagnostic analysis process, or mainly focus on single-crop scenarios, which limits their application in complex agricultural environments. To address these issues, this paper constructs VLM-MCPDD for multi-crop pest and disease diagnosis, aiming to enhance the model’s ability to analyze visual symptom information and improve the classification accuracy across different crop pest and disease categories.

3. Methodology

3.1. Overall Architecture

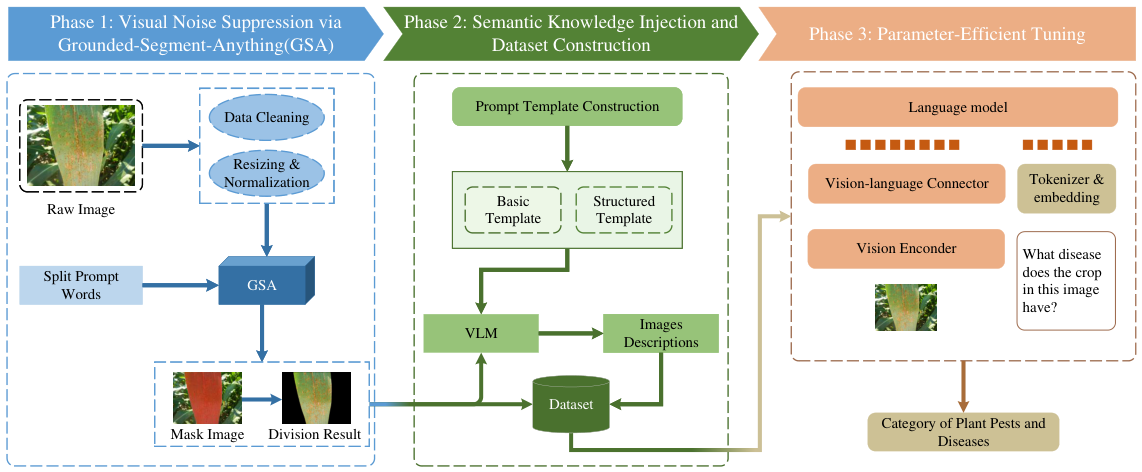
The proposed VLM-MCPDD framework consists of three core stages: Visual Noise Suppression, Semantic Knowledge Injection, and Parameter-Efficient Instruction Tuning (Figure 1). In the first stage, the original images are cleaned and resized, followed by image segmentation using GSA to remove complex backgrounds while preserving key visual features related to pests and diseases. In the second stage, prompt templates are constructed and jointly input into the VLM with the segmented images to generate corresponding textual descriptions, thereby forming an image–text dataset. In the third stage, the constructed dataset is used to fine-tune and evaluate the open-source LLaVA-1.5 model.

3.2. Visual Data Preprocessing

Before multimodal integration, the raw agricultural images were first standardized through preprocessing. All images were resized while preserving their aspect ratios, with the longer side set to 336 pixels and the shorter side adjusted accordingly, thereby reducing the influence of scale variation on image structure. Meanwhile, perceptual hashing was used to remove duplicate images, preventing data leakage and ensuring sample independence.
Based on the standardized inputs, a semantic-aware region extraction module was introduced to reduce interference from complex field backgrounds. Real agricultural images often contain background elements such as soil, weeds, and non-target vegetation, which may weaken the extraction of disease-related features and cross-modal alignment in VLMs. Therefore, GSA was adopted for image segmentation. By using semantic prompts such as “Corn Leaf” or “Insect Pest,” the model can locate pest- and disease-related regions and retain key visual features.

3.3. Image–Text Pair Construction

To train and evaluate VLM-MCPDD, this study constructs the PDSD multimodal corpus. By feeding segmented images and customized instruction templates into the Qwen model, the dataset generates textual descriptions corresponding to the image content, thereby forming aligned image–text pairs that capture the relationship between visual symptom manifestations and diagnostic interpretations.
Based on this design, two prompt templates are developed. The basic template is used to obtain pest and disease categories together with concise explanations (Table 1), whereas the structured template incorporates the CoT mechanism to enhance the model’s reasoning capability. Specifically, the structured template decomposes the diagnostic task into several logical steps: identifying the pest or disease type, describing the salient visual features that support the identification, analyzing potential causal factors, and providing prevention and control recommendations. In this way, the diagnostic process is extended beyond simple classification to include symptom interpretation, causal analysis, and management recommendations (Table 2 and Table 3).

3.4. Chain-of-Thought Reasoning Mechanism

The CoT framework embedded in VLM-MCPDD introduces a structured, vision-guided reasoning paradigm that transcends conventional end-to-end classification. Rather than mapping visual inputs directly to diagnostic labels, this mechanism decomposes the diagnostic task into a sequence of logical, progressive steps. This approach enables the model to systematically evaluate multiple dimensions of visual evidence, including overall plant condition, lesion morphology, spatial distribution, and pest-specific attributes.
Table 1. Basic prompt templates.
Applsci 16 05719 i001
Prompt:
What disease does the crop in this image have?
Answer:
Corn Common Rust.
Prompt:
As a plant pest and disease expert, analyze the provided image of Corn Common Rust. Describe the apparent visual characteristics in the image, provide a diagnostic category, and briefly explain how these characteristics are linked to this diagnostic category. Keep the response concise and omit irrelevant comments. Think step by step.
Answer:
The image shows numerous small, reddish-brown pustules distributed across the corn leaf surface. The pustules are mostly round or oval in shape, irregularly scattered, and partially fused in some areas.
Diagnosis: Corn Common Rust.
Explanation: Visual features such as reddish-brown, round or oval pustules are typical of Corn Common Rust. This disease can lead to premature leaf senescence, reduced photosynthetic efficiency, and yield loss.
Applsci 16 05719 i002
Prompt:
What is the pest in the image?
Answer:
Corn Borer.
Prompt:
As a plant pest and disease expert, analyze the provided image of the Corn Borer. Describe the apparent visual characteristics in the image, provide a diagnostic category, and briefly explain how these characteristics are linked to this diagnostic category. Keep the response concise and omit irrelevant comments. Think step by step.
Answer:
The image shows a yellowish-brown moth with the forewings folded, forming a nearly triangular outline. The wing surface exhibits brown, wavy transverse bands. The head bears compound eyes, and the antennae are slender.
Diagnosis: Corn Borer.
Explanation: The yellowish-brown coloration and the presence of wavy transverse bands are typical visual characteristics of the adult Corn Borer. The Corn Borer is an important pest of maize, and the adult stage primarily functions in mating and oviposition.
Table 2. Structured prompt templates.
Applsci 16 05719 i003
Prompt:
Act as a plant pest and disease expert. Analyze the provided image, which belongs to one of the following categories: Corn Common Rust, Corn Gray Leaf Spot, Corn Northern Leaf Blight, Healthy Corn, Rice Bacterial Leaf Blight, Rice Brown Spot, Rice Leaf Blast, Healthy Rice, Wheat Leaf Rust, Wheat Powdery Mildew, Wheat Yellow Rust, Healthy Wheat, Rice Water Weevil, Rice Leaf Roller, Red Spider, Penthaleus major, Armyworm, Corn Borer. The image category is Corn Common Rust. Describe the specific features visible in the image.
Explanation: Briefly explain how these features correlate with the diagnosed category.
Requirements: Ensure the analysis is concise and focused. Do not include any irrelevant content. Think step by step.
Answer:
The image shows that the corn leaf exhibits typical characteristics of Corn Common Rust, as detailed below:
1. Reddish-brown pustules: Reddish-brown, round or oval pustules are visible on the leaves.
2. Distribution pattern: The pustules are randomly distributed and partially fused in some areas.
3. Leaf tissue: Infected leaf tissue shows chlorosis and dryness.
Relevance: Corn Common Rust is caused by the fungus Puccinia sorghi. The reddish-brown pustules are a key diagnostic feature, distinguishing it from Corn Gray Leaf Spot (elongated rectangular lesions) and Corn Northern Leaf Blight (spindle-shaped lesions). The disease is primarily wind-dispersed and tends to break out in cool, humid conditions.
Applsci 16 05719 i004
Prompt:
Act as a plant pest and disease expert. Analyze the provided image, which belongs to one of the following categories: Corn Common Rust, Corn Gray Leaf Spot, Corn Northern Leaf Blight, Healthy Corn, Rice Bacterial Leaf Blight, Rice Brown Spot, Rice Leaf Blast, Healthy Rice, Wheat Leaf Rust, Wheat Powdery Mildew, Wheat Yellow Rust, Healthy Wheat, Rice Water Weevil, Rice Leaf Roller, Red Spider, Penthaleus major, Armyworm, Corn Borer. The image category is Corn Borer. Describe the specific features visible in the image.
Explanation: Briefly explain how these features correlate with the diagnosed category.
Requirements: Ensure the analysis is concise and focused. Do not include any irrelevant content. Think step by step.
Answer:
The image depicts an adult Corn Borer with the following characteristics:
1. Overall Morphology: The adult is overall yellowish-brown, with the forewings folded into a triangular shape.
2. Wing Surface Pattern: The wing surface displays evenly distributed brown, wavy transverse bands.
3. Head Characteristics: Prominent compound eyes are present, and the antennae are slender.
Relevance: The wavy transverse bands are one of the characteristic features of the adult Corn Borer. This species is a major stem-boring pest of maize, with the larval stage causing severe damage to stalks and ears. Adults exhibit positive phototaxis and nocturnal activity and serve as the reproductive stage responsible for mating and oviposition, playing a critical role in pest dispersal.
Table 3. Structured control templates.
Applsci 16 05719 i005
Prompt:
As a plant pests and diseases expert. Diagnose an image of corn affected by Common Rust and provide detailed, actionable treatment solutions.
Requirements: Ensure the response is clear and concise, and follows a step-by-step explanation.
Answer:
Diagnosis: Corn Common Rust.
Control Methods:
1. Agricultural Control:
Resistant Varieties: Select corn hybrids with strong resistance to common rust.
Residue Management: Remove or shred crop residues after harvest to reduce overwintering inoculum.
Crop Rotation: Rotate with non-host crops such as legumes or peanuts.
2. Chemical Control:
Application Timing: Focus spray applications from the bell stage to early tasseling when early symptoms appear.
Recommended Fungicides: Use effective agents including difenoconazole, tebuconazole, azoxystrobin, or trifloxystrobin + tebuconazole.
Precautions: Rotate fungicides with different modes of action to minimize resistance risk.
3. Monitoring and Early Warning:
Field Inspections: Conduct regular field checks during susceptible growth stages to detect early symptoms.
Weather Monitoring: Stay alert for cool and humid conditions that promote disease development and spread.
Applsci 16 05719 i006
Prompt:
As a plant pest and disease expert. Diagnose an image of Corn Borer and provide detailed, actionable control measures.
Requirements: Ensure the response is clear and concise, and follows a step-by-step explanation.
Answer:
Diagnosis: Corn Borer.
Control Methods:
1. Cultural Control:
Straw Shredding and Incorporation: Shred and deeply incorporate crop residues to eliminate overwintering larvae.
Resistant Cultivars: Plant corn varieties resistant to corn borer to reduce damage.
2. Biological Control:
Release of Trichogramma Wasps: Release during the egg-laying period to parasitize corn borer eggs.
Application of Biopesticides: Use Bacillus thuringiensis (Bt) or viral formulations to control larvae.
3. Chemical Control:
Key Control Period: Apply treatments at the large-whorl stage; supplementary control may be applied at early silking.
Chemical Control: Apply chlorantraniliprole granules to the whorl or spray chlorantraniliprole or emamectin benzoate; rotate insecticides to delay resistance.
4. Physical Control:
Light Trapping: Use black-light or insecticidal lamps to trap adults.
Pheromone Trapping: Deploy sex pheromone lures to disrupt mating and reduce oviposition.
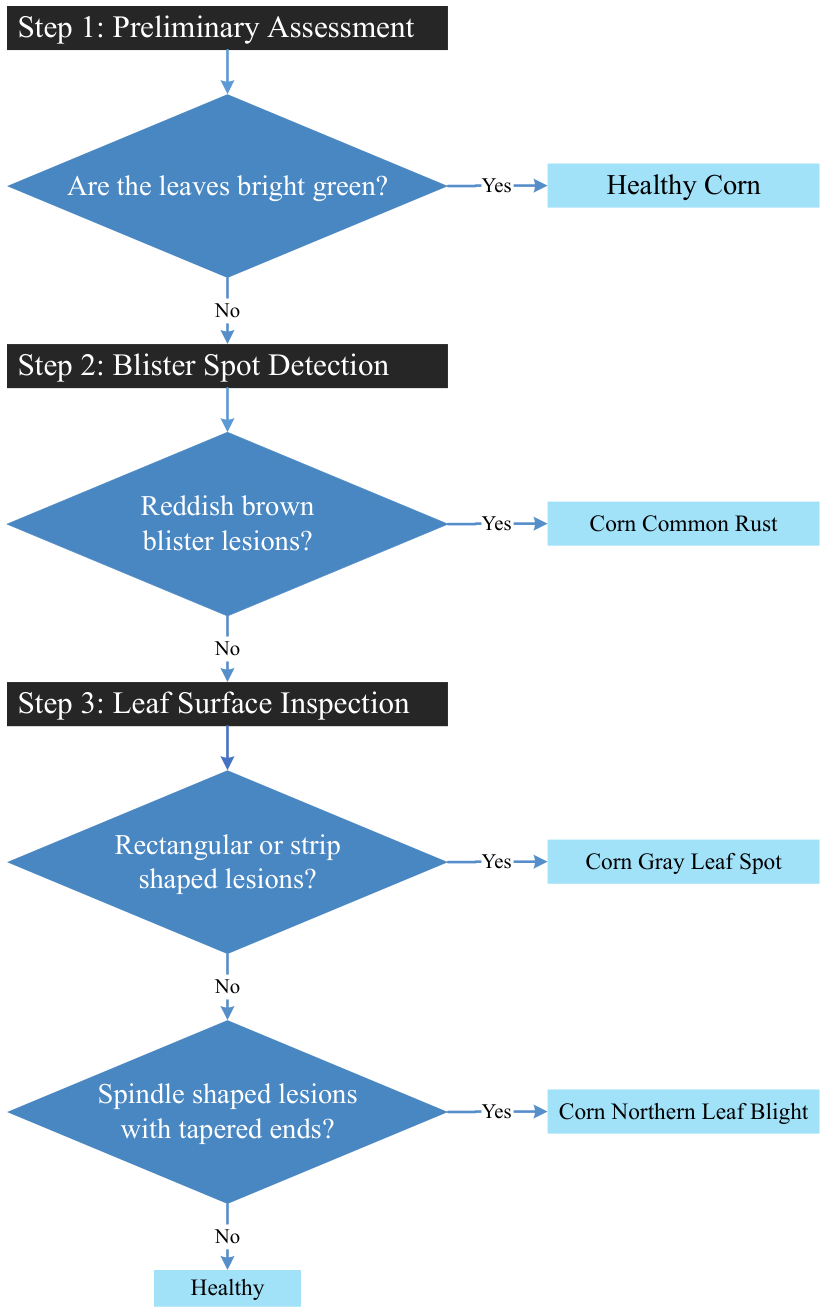
By explicitly modeling the inferential path, the CoT framework aligns the model’s analytical process with the diagnostic workflow of expert agronomists. As illustrated in Figure 2 using a corn disease scenario, the reasoning chain proceeds through distinct stages: an initial assessment of the plant’s general appearance, a detailed examination of lesion characteristics (e.g., color, shape, and texture), and the integration of these observations into a well-substantiated diagnosis. Each stage builds upon previously accumulated evidence, generating a coherent reasoning chain that human users can easily inspect and validate.
This structured approach offers two main advantages. First, it helps the model perform diagnosis in complex cases where symptoms overlap or visual cues are subtle. Second, by presenting intermediate reasoning steps, it makes the model’s decision outcomes more transparent and easier to interpret.

3.5. Parameter-Efficient Fine-Tuning via Low-Rank Adaptation

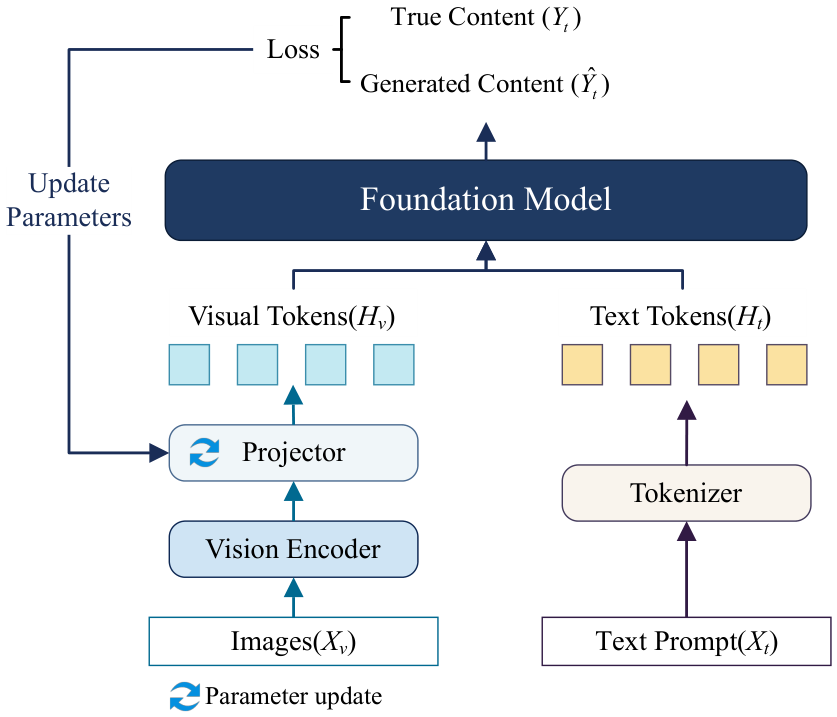
Large-scale foundation models typically contain billions of parameters, resulting in substantial memory consumption and prolonged training time, which makes full-parameter fine-tuning computationally expensive. To address this issue, LLaVA-1.5 is adopted as the base model, and LoRA is employed for parameter-efficient fine-tuning. The overarching procedure is illustrated in Figure 3 and formalized by the following objective function:
L ( θ ) = L VLM f v ( x v ; ϕ ) , f t ( x t ; ψ ) ; θ
where x v and x t denote the visual and textual inputs, respectively; f v and f t represent the embedding functions of the vision encoder and the text tokenizer; and θ encapsulates the trainable parameters of VLM.
Unlike conventional full fine-tuning paradigms that redundantly update all model parameters, LoRA strategically integrates trainable low-rank decomposition matrices into the Transformer linear layers while keeping the massive pre-trained weights strictly frozen. This optimization strategy achieves high-fidelity task-specific adaptation with substantially reduced computational and memory overhead. For a given linear transformation with an original pre-trained weight matrix W 0 R d × k , the LoRA-augmented forward pass is formulated as
h = W 0 x + Δ W x = W 0 x + B A x
where the weight update Δ W is factorized as
Δ W = B A
with A R r × k and B R d × r denoting the trainable low-rank matrices. Here, r min ( d , k ) dictates the rank hyperparameter, and a scaling factor (typically α / r ) is applied to the low-rank update to stabilize the learning process.
Within the Transformer architecture, LoRA modules are seamlessly integrated into both the multi-head self-attention mechanisms and the feed-forward networks. Specifically, for the self-attention module, the query (Q), key (K), and value (V) projections are mathematically modified as follows:
Q = W Q h + B Q A Q h
K = W K h + B K A K h
V = W V h + B V A V h
where h signifies the input token hidden state; W Q , W K , W V are the frozen pre-trained projection matrices; and the products B Q A Q , B K A K , B V A V represent their respective low-rank adaptation terms. The resulting attention output then seamlessly follows the standard scaled dot-product formulation
Attention ( Q , K , V ) = softmax Q K d k V
where d k represents the dimensionality of the key vectors.

4. Experiments

4.1. Dataset Collection

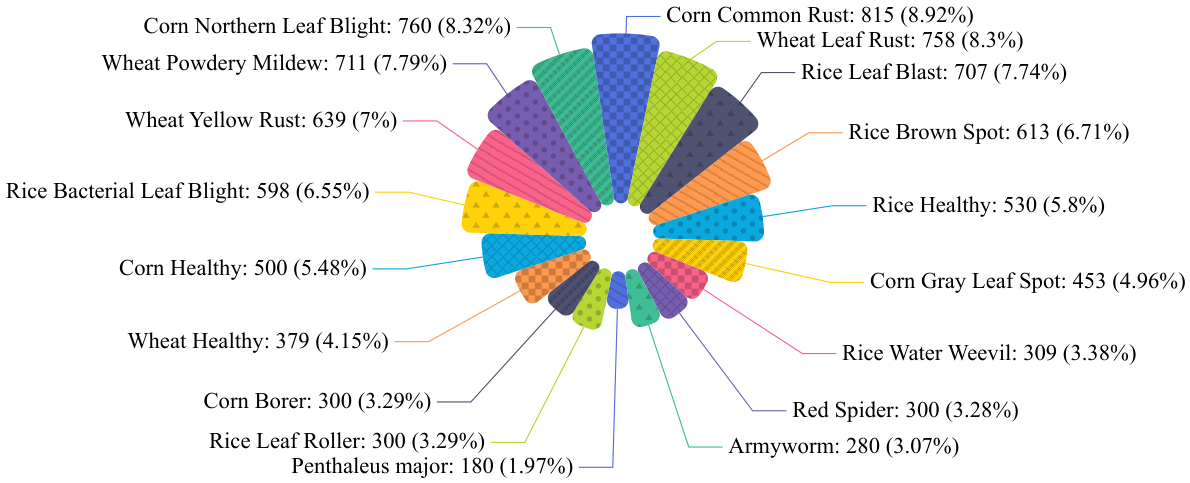
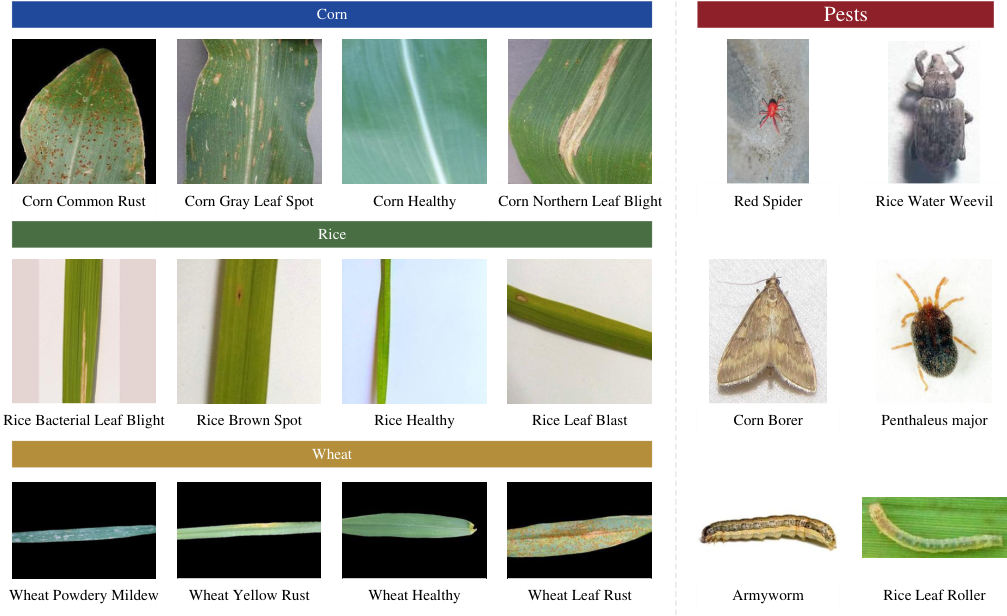
The experimental dataset constructed in this study includes disease images of three major cereal crops, namely corn [20,21], rice [22,23,24], and wheat [25,26,27,28,29], as well as pest images [30]. Figure 4 shows the image distribution across categories, Figure 5 presents representative samples, and Table 4 summarizes the number of samples in each category. The dataset was split at a ratio of 8:2, with 80% used for model training and 20% used for model evaluation.

4.2. Segmentation Results Analysis

Table 5 presents the segmentation results of GSA. The results show that GSA can reliably separate diseased leaf regions and pest bodies from complex field backgrounds while preserving key visual features such as lesion morphology, color variation, and texture details. Specifically, for Corn Common Rust and Wheat Yellow Rust samples, using “Corn Leaf” and “Wheat Leaf” as semantic prompts enables the localization of target leaf regions; for Rice Leaf Roller samples, using “Insect Pest” as the prompt helps isolate the pest body. By suppressing irrelevant background information, GSA provides more effective visual inputs for subsequent feature extraction and VLM-based diagnostic reasoning.

4.3. Evaluation Metrics

To comprehensively assess the proposed model’s classification capability and its inferential stability across diverse pathological and entomological categories, we employ four widely adopted standard metrics: Accuracy, Precision, Recall, and F1-score. Let K denote the total number of diagnostic categories. For the k-th category, the aggregate numbers of true positives, false positives, and false negatives are mathematically denoted as T P k , F P k , and F N k , respectively.
To ensure a rigorously fair evaluation under inherently class-imbalanced conditions, a macro-averaging strategy is adopted, wherein each category contributes equally to the final aggregated metric. The macro-averaged Precision, Recall, and F1-score are formally defined as follows:
P r e c i s i o n m a c r o = 1 K k = 1 K T P k T P k + F P k
R e c a l l m a c r o = 1 K k = 1 K T P k T P k + F N k
F 1 m a c r o = 1 K k = 1 K 2 × P r e c i s i o n k × R e c a l l k P r e c i s i o n k + R e c a l l k
Furthermore, the overall classification Accuracy across the entire dataset is computed as
A c c u r a c y = 1 N k = 1 K T P k
where N denotes the total number of evaluated samples.

4.4. Experimental Settings

The parameter settings of VLM-MCPDD are presented in Table 6. LoRA was used for parameter-efficient fine-tuning, in which only a small number of trainable parameters were updated, thereby reducing computational overhead and memory requirements while preserving the pre-trained capabilities of the base model. The experiments were conducted in an environment with 48 GB of GPU memory.

4.5. Model Comparison

To rigorously evaluate the efficacy of the proposed VLM-MCPDD, we conduct a comprehensive comparative analysis against nine representative vision models spanning diverse architectural paradigms:
  • EfficientNet: Implements compound scaling to harmonize network depth, width, and resolution, thereby optimizing the trade-off between representational capacity and computational efficiency.
  • MobileNetV2: Employs inverted residuals with linear bottlenecks and depthwise separable convolutions for highly lightweight feature extraction.
  • ConvNeXtV2: Augments the standard ConvNeXt framework with Global Response Normalization (GRN) and fully convolutional masked autoencoder pre-training to significantly enhance feature diversity.
  • SE-ResNeXt: Integrates channel-wise squeeze-and-excitation attention mechanisms into ResNeXt’s grouped convolutions for adaptive feature recalibration.
  • ResNet50: Leverages deep residual connections to effectively mitigate gradient degradation phenomena in exceptionally deep networks.
  • Twins: Unifies local window attention with global subsampled attention within a Transformer architecture, striking an optimal balance between computational cost and long-range dependency modeling.
  • Vision Transformer (ViT): Encodes images as discrete patch sequences and models global spatial dependencies exclusively through stacked Transformer encoder layers.
  • Swin Transformer: Introduces a hierarchical, shifted-window attention mechanism for multi-scale feature aggregation while maintaining linear computational complexity.
  • LLaVA-1.5: Aligns visual features with linguistic embeddings via cross-modal projection layers to enable joint visual perception and language understanding; evaluated here in a zero-shot setting to establish a rigorous baseline for its out-of-the-box generalization capabilities.
The classification results are summarized in Table 7. The proposed VLM-MCPDD framework demonstrates strong performance across all evaluation metrics, achieving an accuracy of 93.77%, a precision of 95.36%, a recall of 95.11%, and an F1-score of 95.13%. Compared with nine baseline models, VLM-MCPDD achieves consistent improvements across most metrics, indicating its effectiveness in capturing and representing highly discriminative features of crop pests and diseases.
Further analysis shows that VLM-MCPDD outperforms the best-performing unimodal baseline, Swin Transformer (91.15%), with an overall accuracy improvement of 2.62%. In terms of accuracy, it improves upon ConvNeXtV2 (90.44%) and Twins (90.33%) by 3.33% and 3.44%, respectively. Moreover, compared with models of different architectural types, such as ViT (60.27%), ResNet50 (77.76%), and zero-shot LLaVA (31.31%), VLM-MCPDD also shows some advantages. Notably, its F1-score reaches 95.13%, indicating that the model can effectively alleviate the impact of class imbalance and achieve relatively balanced recognition across different disease and pest categories.

4.6. Comparative Analysis of Confusion Matrices

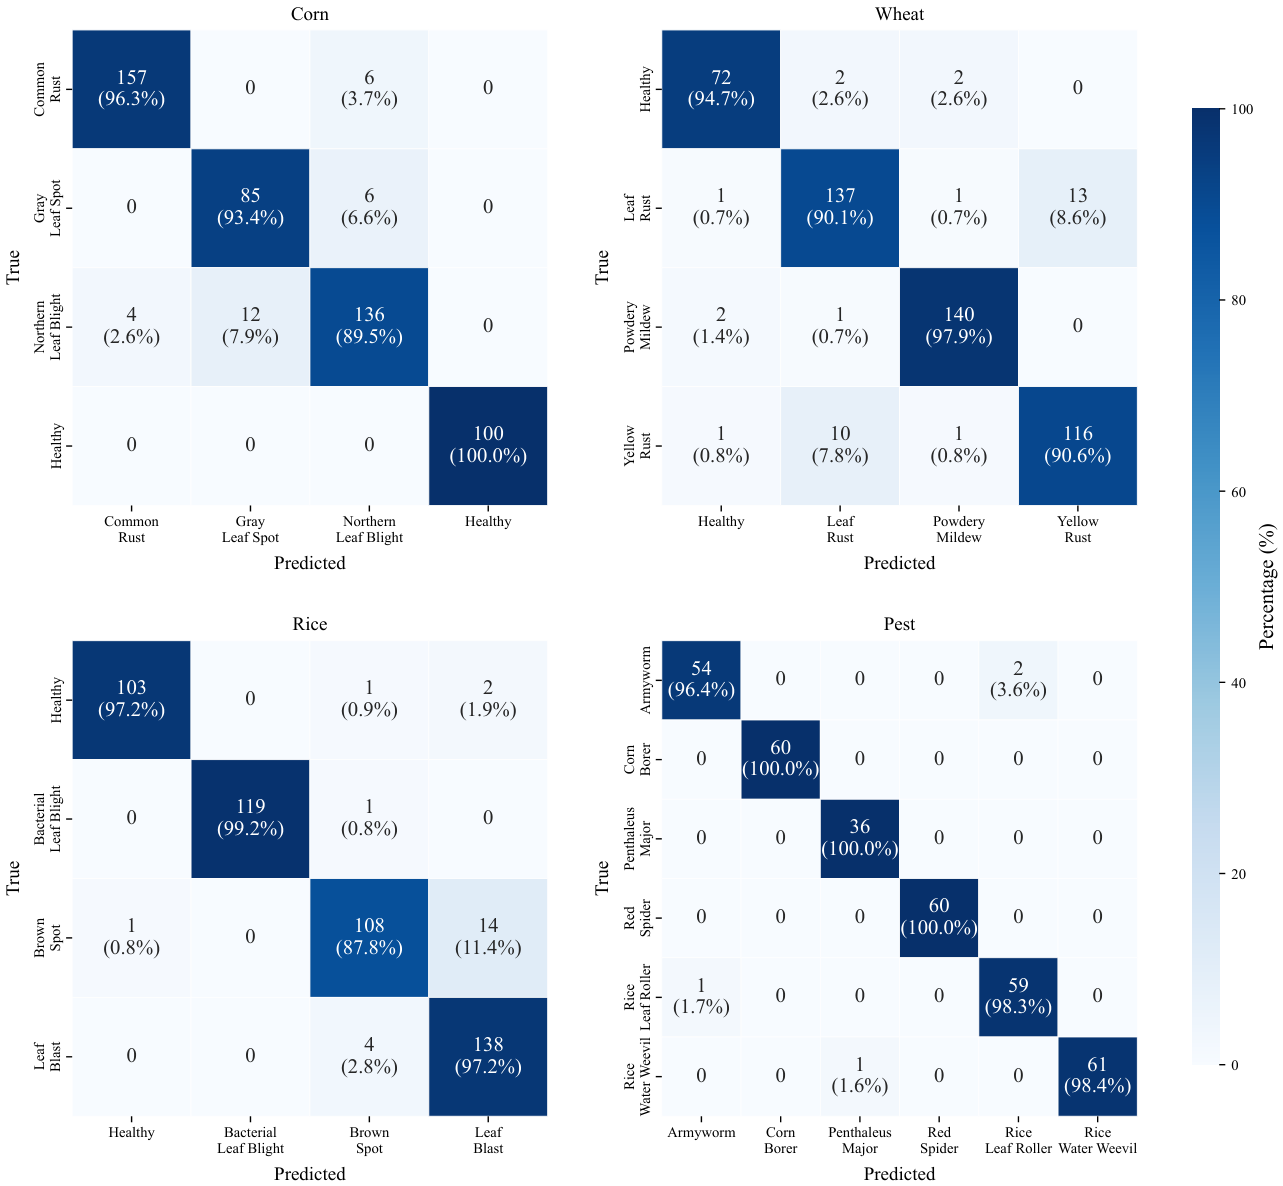
Figure 6 shows the normalized confusion matrices of the models trained separately on different crop or pest subsets. Since the class space is smaller under separate training, the models achieve high recognition accuracy for most categories, generally exceeding 90%. This indicates that the models can effectively learn discriminative visual features in specific subtasks and perform relatively accurate classification.
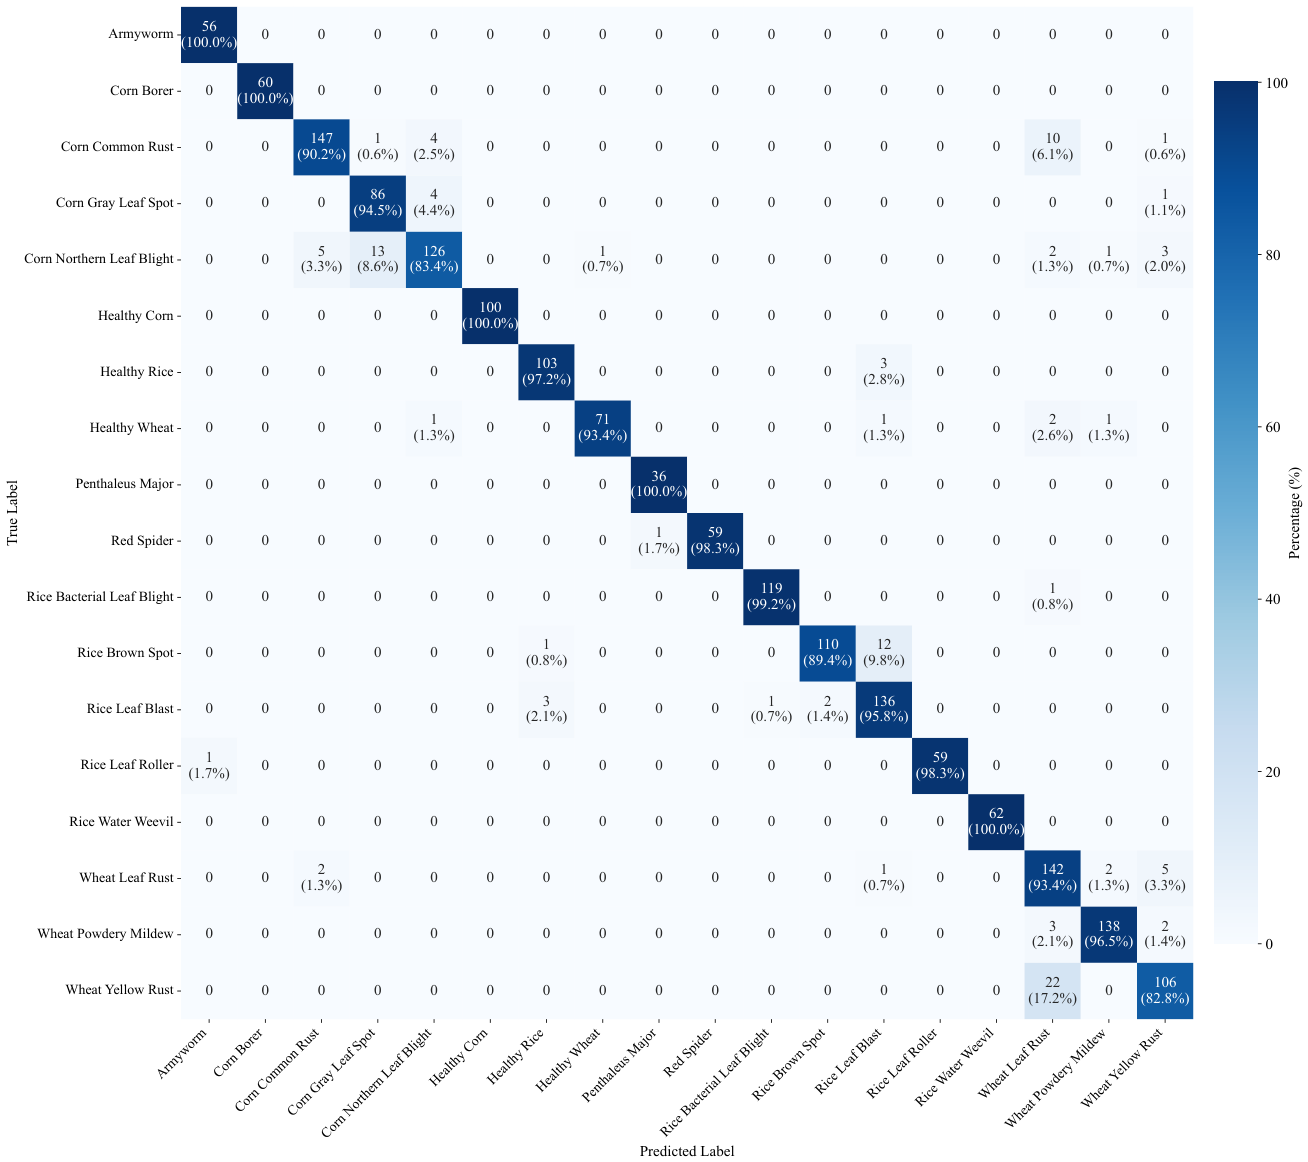
In contrast, Figure 7 presents the confusion matrix of the jointly trained VLM-MCPDD model. This model performs unified recognition on heterogeneous data consisting of multiple crops, diseases, and pest categories. Compared with the separately trained baseline models, joint training substantially expands the class space and increases the task complexity. Nevertheless, the recognition accuracy of most categories remains at or above 90%, suggesting that the proposed framework still maintains strong discriminative capability in complex multi-class tasks.
For some disease categories, a small number of misclassifications still occur under the joint training setting. These errors mainly appear between diseases with highly similar visual symptoms. For example, slight confusion is observed between corn northern leaf blight and corn gray leaf spot, as well as between rice brown spot and rice leaf blight. This may be attributed to the similarity of these diseases in lesion morphology, color patterns, and spatial distribution on the leaf surface. Because these visual features are relatively close, the model still faces certain challenges in distinguishing fine-grained disease categories.
Overall, although the jointly trained VLM-MCPDD model addresses a more complex recognition task involving multiple crops and diverse pest and disease categories, it still maintains relatively high recognition accuracy for most classes. These results indicate that the proposed framework can effectively support unified multi-crop pest and disease recognition and exhibits a certain degree of cross-crop generalization. Meanwhile, the observed misclassifications also suggest that the model still faces challenges in distinguishing fine-grained disease categories with highly similar visual symptoms. Further optimization is therefore needed to enhance its discriminative ability for visually similar lesion patterns.

4.7. Ablation Experiment

Table 8 presents the effects of GSA and CoT on model performance. Compared with the Original Image–Text Dataset (OITD), VLM-MCPDD achieves improvements in accuracy, precision, recall, and F1-score, with accuracy increasing from 92.02% to 93.77%. This indicates that GSA can reduce background interference and enable the model to focus more effectively on diagnostically relevant pest and disease features.
After incorporating CoT, both OITD-CoT and VLM-MCPDD-CoT show further performance improvements. Among them, VLM-MCPDD-CoT achieves the best results, with an accuracy of 94.26% and an F1-score of 95.52%. These results suggest that both GSA and CoT contribute to improving the diagnostic performance of the model to a certain extent.

4.8. Interpretability of Crop Pest and Disease Diagnosis

Table 9 presents representative examples of VLM-MCPDD in multi-turn question-answering diagnosis. These examples show that the model can identify pest and disease categories while generating explanations based on key visual features in the images, and can also provide prevention and control suggestions. In the first example, the model correctly identifies Corn Common Rust and further describes diagnostic evidence such as lesion color and morphology. In the second example, the model identifies an adult Corn Borer and provides an explanation related to its morphological characteristics. These results indicate that VLM-MCPDD can combine classification outputs with natural-language explanations, thereby improving the readability and transparency of diagnostic outputs and providing useful decision support for agricultural pest and disease management.

5. Conclusions and Future Work

This paper constructs a vision-language model for multi-crop pest and disease diagnosis (VLM-MCPDD). By integrating visual noise suppression, semantic knowledge construction, and parameter-efficient fine-tuning, this model provides a feasible idea for improving the effectiveness of pest and disease recognition and generating readable diagnostic explanations.
A central contribution of this work is the construction and curation of the PDSD. Through rigorous data cleaning and unified semantic reconstruction across multiple heterogeneous public data sources, PDSD establishes image–text correspondences that provide a solid foundation for supervised fine-tuning of the base vision-language model. Furthermore, the integration of a CoT mechanism within the prompt templates enhances the model’s reasoning capabilities.
The experimental evaluation demonstrates the effectiveness of the VLM-MCPDD framework. Compared with nine baseline models, the proposed architecture achieves higher performance across all evaluation metrics. The ablation study further indicates that the introduction of the CoT mechanism provides a certain improvement in model accuracy.
Future research may focus on several directions. First, model compression and deployment optimization should be pursued to enable efficient implementation on resource-constrained agricultural edge devices. Furthermore, deployment in real farm environments may still be affected by factors such as illumination variations, partial occlusions, low-resolution mobile-phone images, mixed infections, and subtle early-stage symptoms.Therefore, future work will further expand the PDSD dataset by incorporating more field-collected images acquired under diverse environmental and imaging conditions, as well as covering a broader range of crop types. In addition, considering the potential dataset bias caused by data sources, image acquisition conditions, and class distribution, external validation on independent datasets and real-field data will be conducted to more comprehensively evaluate the robustness and generalization capability of the proposed model.Finally, more advanced reasoning architectures could be explored, such as multi-step reasoning dynamically guided by agricultural domain knowledge graphs, to further improve diagnostic accuracy and interpretability. Future work may also investigate the integration of VLM-MCPDD with external agricultural knowledge bases, expert-validated disease manuals, or RAG-based retrieval systems to enhance the timeliness and reliability of diagnostic explanations and management recommendations.

Author Contributions

Conceptualization, L.Z.; methodology, M.L.; validation, X.R.; formal analysis, Y.C.; investigation, Z.H.; data curation, M.L.; writing—original draft preparation, M.L.; writing—review and editing, L.Z.; funding acquisition, L.Z. All authors have read and agreed to the published version of the manuscript.

Funding

This research was funded by the National Natural Science Foundation of China (Grant No. 61473114), the Key Scientific Research Projects of Higher Education Institutions in Henan Province (Grant No. 24B520006), and the Open Fund of Key Laboratory of Grain Information Processing and Control (Henan University of Technology), Ministry of Education (Grant No. KFJJ2024013).

Institutional Review Board Statement

Not applicable.

Informed Consent Statement

Not applicable.

Data Availability Statement

The datasets used in this study are publicly available and have been properly cited in this paper.

Conflicts of Interest

The authors declare no conflicts of interest.

References

  1. Ahirwar, S.; Swarnkar, R.; Bhukya, S.; Namwade, G. Application of drone in agriculture. Int. J. Curr. Microbiol. Appl. Sci. 2019, 8, 2500–2505. [Google Scholar] [CrossRef]
  2. Bashir, K.; Rehman, M.; Bari, M. Detection and classification of rice diseases: An automated approach using textural features. Mehran Univ. Res. J. Eng. Technol. 2019, 38, 239–250. [Google Scholar] [CrossRef]
  3. Deng, R.; Tao, M.; Xing, H.; Yang, X.; Liu, C.; Liao, K.; Qi, L. Automatic diagnosis of rice diseases using deep learning. Front. Plant Sci. 2021, 12, 701038. [Google Scholar] [CrossRef] [PubMed]
  4. Khan, I.H.; Liu, H.; Li, W.; Cao, A.; Wang, X.; Liu, H.; Cheng, T.; Tian, Y.; Zhu, Y.; Cao, W.; et al. Early detection of powdery mildew disease and accurate quantification of its severity using hyperspectral images in wheat. Remote Sens. 2021, 13, 3612. [Google Scholar] [CrossRef]
  5. Ni, Q.; Zuo, Y.; Zhi, Z.; Shi, Y.; Liu, G.; Ou, Q. Diagnosis of corn leaf diseases by FTIR spectroscopy combined with machine learning. Vib. Spectrosc. 2024, 135, 103744. [Google Scholar] [CrossRef]
  6. Xu, W.; Li, W.; Wang, L.; Pompelli, M.F. Enhancing corn pest and disease recognition through deep learning: A comprehensive analysis. Agronomy 2023, 13, 2242. [Google Scholar] [CrossRef]
  7. Li, E.; Wang, L.; Xie, Q.; Gao, R.; Su, Z.; Li, Y. A novel deep learning method for maize disease identification based on small sample-size and complex background datasets. Ecol. Inform. 2023, 75, 102011. [Google Scholar] [CrossRef]
  8. Wen, X.; Maimaiti, M.; Liu, Q.; Yu, F.; Gao, H.; Li, G.; Chen, J. MnasNet-SimAM: An improved deep learning model for the identification of common wheat diseases in complex real-field environments. Plants 2024, 13, 2334. [Google Scholar] [CrossRef]
  9. Guan, H.; Fu, C.; Zhang, G.; Li, K.; Wang, P.; Zhu, Z. A lightweight model for efficient identification of plant diseases and pests based on deep learning. Front. Plant Sci. 2023, 14, 1227011. [Google Scholar] [CrossRef] [PubMed]
  10. Yang, X.; Gao, J.; Xue, W.; Alexandersson, E. Pllama: An open-source large language model for plant science. arXiv 2024, arXiv:2401.01600. [Google Scholar]
  11. Peng, R.; Liu, K.; Yang, P.; Yuan, Z.; Li, S. Embedding-based retrieval with LLM for effective agriculture information extracting from unstructured data. arXiv 2023, arXiv:2308.03107. [Google Scholar] [CrossRef]
  12. Yin, S.; Fu, C.; Zhao, S.; Li, K.; Sun, X.; Xu, T.; Chen, E. A survey on multimodal large language models. Natl. Sci. Rev. 2024, 11, nwae403. [Google Scholar] [CrossRef]
  13. Hang, C.N.; Yu, P.D.; Tan, C.W. TrumorGPT: Graph-based retrieval-augmented large language model for fact-checking. IEEE Trans. Artif. Intell. 2025, 6, 3148–3162. [Google Scholar] [CrossRef]
  14. Conger, N.; Scollar, N.; Davaslioglu, K.; Sagduyu, Y.E.; Kompella, S. How to discover knowledge for FutureG: Contextual RAG and LLM prompting for O-RAN. In Proceedings of the 2026 IEEE 23rd Consumer Communications & Networking Conference (CCNC); IEEE: Piscataway, NJ, USA, 2026; pp. 1–6. [Google Scholar]
  15. Cao, Y.; Chen, L.; Yuan, Y.; Sun, G. Cucumber disease recognition with small samples using image-text-label-based multi-modal language model. Comput. Electron. Agric. 2023, 211, 107993. [Google Scholar] [CrossRef]
  16. Zhang, K.; Ma, L.; Cui, B.; Li, X.; Zhang, B.; Xie, N. Visual large language model for wheat disease diagnosis in the wild. Comput. Electron. Agric. 2024, 227, 109587. [Google Scholar] [CrossRef]
  17. Wang, Y.; Wang, F.; Chen, W.; Lv, B.; Liu, M.; Kong, X.; Zhao, C.; Pan, Z. A large language model for multimodal identification of crop diseases and pests. Sci. Rep. 2025, 15, 21959. [Google Scholar] [CrossRef]
  18. Liu, H.; Li, C.; Li, Y.; Lee, Y.J. Improved baselines with visual instruction tuning. In Proceedings of the IEEE/CVF Conference on Computer Vision and Pattern Recognition, Seattle, WA, USA, 16–22 June 2024; pp. 26296–26306. [Google Scholar]
  19. Xu, G.; Zhao, W.; Bie, Y.; Ge, M.; Cui, Z.; Wang, Y. Agro-LLaVA-Next: A large multimodal model for plant diseases recognization. In Proceedings of the International Conference on Intelligent Computing; Springer: Singapore, 2025; pp. 291–302. [Google Scholar]
  20. Singh, D.; Jain, N.; Jain, P.; Kayal, P.; Kumawat, S.; Batra, N. PlantDoc: A dataset for visual plant disease detection. In Proceedings of the 7th ACM IKDD CoDS and 25th COMAD, Hyderabad, India, 5–7 January 2020; pp. 249–253. [Google Scholar]
  21. P, J.; Gopal, G. Data for identification of plant leaf diseases using a 9-layer deep convolutional neural network. Mendeley Data 2019, 1, 2019. [Google Scholar]
  22. Ade, F. Rice Leaf Diseases Dataset. Available online: https://www.kaggle.com/datasets/adefiqri12/riceleafsv3 (accessed on 21 August 2025).
  23. Jisan, M.K. Rice Leafs Disease Dataset. Available online: https://www.kaggle.com/datasets/maimunulkjisan/rice-leaf-dataset-from-mendeley-data (accessed on 10 September 2025).
  24. Do, H.M. Rice Diseases Image Dataset. Available online: https://www.kaggle.com/datasets/minhhuy2810/rice-diseases-image-dataset (accessed on 12 September 2025).
  25. Agarwal, K.; Yadav, V.; Suthar, T. Wheat Plant Diseases Dataset. Available online: https://www.kaggle.com/datasets/kushagra3204/wheat-plant-diseases (accessed on 1 October 2025).
  26. Goyal, L.; Sharma, C.M.; Singh, A.; Singh, P.K. Leaf and spike wheat disease detection & classification using an improved deep convolutional architecture. Inform. Med. Unlocked 2021, 25, 100642. [Google Scholar]
  27. Genaev, M.A.; Skolotneva, E.S.; Gultyaeva, E.I.; Fominykh, A.A.; Solovyev, A.A. Image-based wheat fungi diseases identification by deep learning. Plants 2021, 10, 1500. [Google Scholar] [CrossRef] [PubMed]
  28. Mao, R.; Zhang, Y.; Wang, Z.; Hao, X.; Zhu, T.; Gao, S.; Hu, X. DAE-Mask: A novel deep-learning-based automatic detection model for in-field wheat diseases. Precis. Agric. 2024, 25, 785–810. [Google Scholar] [CrossRef]
  29. Long, M.; Hartley, M.; Morris, R.J.; Brown, J.K.M. Classification of wheat diseases using deep learning networks with field and glasshouse images. Plant Pathol. 2023, 72, 536–547. [Google Scholar] [CrossRef]
  30. Wu, X.; Zhan, C.; Lai, Y.K.; Cheng, M.M.; Yang, J. IP102: A large-scale benchmark dataset for insect pest recognition. In Proceedings of the IEEE/CVF Conference on Computer Vision and Pattern Recognition, Long Beach, CA, USA, 15–20 June 2019; pp. 8787–8796. [Google Scholar]
Figure 1. Overall architecture of the VLM-MCPDD framework.
Applsci 16 05719 g001
Figure 2. Reasoning chain for corn disease diagnosis.
Applsci 16 05719 g002
Figure 3. Fine-tuning workflow of the model.
Applsci 16 05719 g003
Figure 4. Class distribution of the PDSD dataset.
Applsci 16 05719 g004
Figure 5. Representative samples from the dataset.
Applsci 16 05719 g005
Figure 6. Confusion matrices for separately trained models.
Applsci 16 05719 g006
Figure 7. Confusion matrices for the jointly trained model.
Applsci 16 05719 g007
Table 4. Dataset category distribution.
TypeNumber of CategoriesTotal Samples
Corn42528
Rice42448
Wheat42487
Pests61669
Table 5. Visualization of GSA segmentation results.
CategoryOriginal ImageSegmented WordGenerated MaskSegmented Output
Corn Common RustApplsci 16 05719 i009Corn LeafApplsci 16 05719 i008Applsci 16 05719 i011
Wheat Yellow RustApplsci 16 05719 i010Wheat LeafApplsci 16 05719 i013Applsci 16 05719 i012
Rice Leaf RollerApplsci 16 05719 i015Insect PestApplsci 16 05719 i014Applsci 16 05719 i007
Table 6. Model fine-tuning parameter settings.
ParameterValue
OptimizerAdamW
Epochs3
Batch size4
Learning rate 5 × 10 5
LoRA rank16
LoRA alpha32
Table 7. Classification results of compared models.
ModelAccuracyPrecisionRecallF1-Score
EfficientNet0.89780.91600.91370.9128
MobileNetV20.85300.87300.87170.8707
ConvNeXtV20.90440.91940.92080.9172
SE-ResNeXt0.86560.88250.87710.8772
ResNet500.77760.82090.79480.7944
Twins0.90330.92290.91520.9163
ViT0.60270.66150.59090.5782
Swin0.91150.92580.92350.9233
LLaVA-1.50.31310.34400.28580.1989
VLM-MCPDD0.93770.95360.95110.9513
Table 8. Comparison with and without the reasoning chain.
ModelAccuracyPrecisionRecallF1-Score
OITD0.92020.93480.93720.9333
OITD-CoT0.93220.94920.94610.9463
VLM-MCPDD0.93770.95360.95110.9513
VLM-MCPDD-CoT0.94260.95840.95420.9552
Table 9. Examples of interactive question-answering for interpretable pest and disease Diagnosis.
Applsci 16 05719 i016
Question: What disease does the crop in this image have?
Applsci 16 05719 i017
Question: What is the pest in the image?
VLM-MCPDD: Corn Common Rust.VLM-MCPDD: Corn Borer.
Question: Describe the specific features in the image, and what causes this disease.
VLM-MCPDD: The features in the image clearly indicate Corn Common Rust, a disease caused by the pathogen Puccinia sorghi. The specific characteristics are as follows:
1. Reddish-brown pustules: Reddish-brown pustules are distributed across the leaf surface.
2. Pustule characteristics: Pustules are raised, powdery in texture, and partially ruptured.
3. Distribution pattern: Pustules are irregularly distributed across the leaf surface, with partial coalescence observed.
Question:Provide several simple control methods.
VLM-MCPDD:
1. Resistant Varieties: Select corn varieties that are more resistant to Common Rust.
2. Proper Crop Rotation: Rotate with non-grass crops such as legumes and peanuts.
3. Chemical Control: Use fungicides like propiconazole and tebuconazole during the disease onset stage, ensuring to rotate them to reduce the risk of resistance.
Question: Analyze the morphological characteristics of the pest in theimage.
VLM-MCPDD: Based on the provided image, the adult moth of the corn borer has the following characteristics:
1. Overall Morphology: The specimen displays a characteristic yellow-brown coloration.
2. Wing Structure: When at rest, the forewings form a distinct triangular shape.
3. Body Size: The insect possesses a relatively diminutive overall body size typical of this adult species.
Question:Provide several simple control methods.
VLM-MCPDD:
1. Overall Shape: It is yellow-brown in color, with triangular-shaped forewings when closed, and a small body size.
2. Common Pesticides: Pesticides such as chlorantraniliprole, high-efficiency chlorfluazuron, and emamectin benzoate can be used, which are highly effective and low in toxicity.
3. Adult Monitoring: Set up pheromone traps to monitor the peak emergence period of adult moths.
Disclaimer/Publisher’s Note: The statements, opinions and data contained in all publications are solely those of the individual author(s) and contributor(s) and not of MDPI and/or the editor(s). MDPI and/or the editor(s) disclaim responsibility for any injury to people or property resulting from any ideas, methods, instructions or products referred to in the content.