Article

Stabilization of Gymnema lactiferum Extract Using Liposomes and Chitosomes for Functional Food Applications

1
School of Food Technology and Natural Sciences, Massey University, Private Bag 11 222, Palmerston North 4442, New Zealand
2
Riddet Institute, Massey University, Private Bag 11 222, Palmerston North 4442, New Zealand
*
Author to whom correspondence should be addressed.
Appl. Sci. 2026, 16(11), 5594; https://doi.org/10.3390/app16115594
Submission received: 22 April 2026 / Revised: 27 May 2026 / Accepted: 1 June 2026 / Published: 3 June 2026
(This article belongs to the Special Issue Hydrocolloids: Characteristics and Applications)

Abstract

Gymnema lactiferum (G. lactiferum) is a medicinal plant that contains potent bioactive phytochemicals, which are prone to degradation during processing and digestion. In this study, G. lactiferum extract was prepared and encapsulated into soy lecithin primary liposomes (PL) and then coated with chitosan to form secondary liposomes (chitosomes, CS) to enhance stability. Physicochemical characteristics, morphology, thermal behavior, and storage stability were evaluated. Extract loading significantly (p < 0.05) increased the mean diameter of PL from 128.6 nm to 146.3 nm and of CS from 359.1 nm to 408.9 nm compared with unloaded liposomes. Both liposomal systems exhibited homogeneous size distributions and good colloidal stability, with zeta potentials of −39.4 mV for PL and +35.8 mV for CS and low polydispersity indices (<0.25) for both systems. Transmission electron microscopy demonstrated predominantly spherical morphologies in both systems. Chitosan coating significantly (p < 0.05) improved both encapsulation efficiency (77.3%) and encapsulation yield (82.4%) compared with PL (73.7% and 79.1%, respectively). HPLC-based quantification using rutin as a reference analyte further indicated EE-R% values of 59.8% for PL-GE and 70.3% for CS-GE, supporting improved extract retention following chitosan coating. Fourier transform infrared spectroscopy confirmed successful encapsulation without apparent chemical alterations or reactions. Differential scanning calorimetry indicated that chitosan coating modified the thermal transition behavior of the liposomal membrane, consistent with altered bilayer packing and increased membrane fluidity, while incorporation of the extract partially restored thermal order within the coated system. Overall, chitosan coating effectively enhanced the encapsulation efficiency, stability, and yield of G. lactiferum extract-loaded liposomes towards their incorporation into functional food formulations.

1. Introduction

Plant extracts are complex mixtures [1] containing bioactive phytochemicals such as polyphenols, anthocyanins, flavonoids, and carotenoids. Raw plant extracts can be inherently unstable and highly susceptible to environmental stressors encountered during food processing, storage, and digestion due to light, heat, oxygen, and pH-induced oxidation of phenolics by food components (proteins, metal ions) [2,3,4]. These stressors may result in undesirable odors, flavors, and colors (e.g., due to Maillard reactions) and food safety issues [5]. Polyphenols can produce unwanted interactions with food matrix compounds, such as binding to proteins (altering structure/amino acid availability), forming complexes with polysaccharides (reducing solubility/stability), affecting enzyme sensitivity to pH, and poor release during digestion.
Bioactive ingredients can be encapsulated within a protective carrier material to improve delivery within food matrices or living cells [6] and to protect polyphenols from degradation during storage [7]. These methods include extrusion, coacervation, liposomal entrapping, spray chilling and cooling, spray drying, molecular inclusion and complexation, co-crystallization, and fluidized bed coating [8,9]. Liposomal encapsulation is an effective method in food, pharmaceutical, and cell culture applications, as liposomes are biocompatible, biodegradable, and adaptable for delivering a wide range of substances, including enzymes, drugs, and other bioactive ingredients.
Gymnema lactiferum is an herbal plant used in traditional Ayurvedic, Siddha, and Unani medicinal practices for maintaining blood glucose levels [10,11,12,13], with previous studies documenting the presence of diverse phytochemicals in this plant (Supplementary Table S1). However, the bioactive phytochemicals in G. lactiferum are vulnerable to degradation during processing and storage and may exhibit limited stability under gastrointestinal conditions, which can reduce their functional efficacy. Encapsulation in lipid-based carriers is therefore a promising strategy to protect these compounds and improve their physicochemical stability and delivery. Accordingly, the current research aimed to encapsulate G. lactiferum extract within soy lecithin phospholipids to form primary liposomes (PL). Secondary liposomes were then developed through electrostatic deposition of chitosan onto the primary liposomes to form chitosomes (CS), aiming to enhance vesicle integrity and dispersion stability through surface charge modification and the formation of a protective biopolymer layer. The objectives were to (i) formulate extract-loaded PL and CS, (ii) quantify particle size distribution (mean diameter and PDI) and ζ-potential as indicators of colloidal stability, (iii) determine encapsulation efficiency (in terms of total phenolic content (TPC) and high-performance liquid chromatography (HPLC)) and encapsulation yield, (iv) examine liposome morphology, and (v) assess heat and storage stability of both systems, thereby validating the suitability of these two liposomal carriers for delivery. This study provides a practical basis for designing more stable, plant-extract delivery systems with potential application in functional foods and nutraceutical formulations.

2. Materials and Methods

2.1. Materials and Chemicals

G. lactiferum plant leaves were collected on the same day from eight randomly selected home gardens in Kottawa, Sri Lanka (latitude 6.841165° N, longitude 79.96543° E) in August 2024. The plant was identified by Mr. Pushpa Jeewandara (Scientific Officer, Pharmacognosy), and a voucher specimen was deposited at the Bandaranaike Memorial Ayurveda Research Institute, Navinna, Maharagama, Sri Lanka, under accession number 3564.
Liquid soy lecithin (food-grade, Fearn Natural Foods, Santa Cruz, CA, USA) was used for liposomal formulation. Chitosan (75–85% deacetylated, low molecular weight 50,000–190,000 Da based on viscosity 20–300 mPa.s in 1% w/v acetic acid; Sigma-Aldrich, Inc., Shanghai, China) and sodium acetate (Sigma-Aldrich, Inc., Auckland, New Zealand) were used to prepare a stock solution in 1% acetic acid (pH 2.8). Gallic acid was obtained from Sigma-Aldrich, Inc. (Darmstadt, Germany). Folin–Ciocâlteu reagent was purchased from Merck (Darmstadt, Germany). Sodium carbonate, ethanol (analytical grade), Triton X-100 (Sigma-Aldrich, Inc., St. Louis, MO, USA), and acetic acid were purchased from Thermo Fisher Scientific (Auckland, New Zealand). All other chemicals and solvents were of the highest analytical grade.

2.2. Preparation of Extracts and Freeze Drying

The plant leaves were dried using a heat pump (ORION RDF350B, Orion Machinery Co., Ltd., Suzaka City, Nagano, Japan) at 50 °C for 8 h, ground using a spice grinder (Breville BCG200BSS, Botany, Australia). The ground material was then sieved through a 250 µm stainless-steel mesh to obtain a uniform particle size distribution and stored at −20 °C in the dark. The powder material was extracted three times using water (1:40 solid: liquid ratio) at 60 °C for 60 min. Following extraction, the mixture was allowed to cool to room temperature and centrifuged using a benchtop centrifuge (Beckman Coulter Avanti JXN-26, Brea, CA, USA) at 4000× g for 10 min. The collected filtrate was filtered using a syringe-driven microfilters (0.45 μm pore size, Merck Millipore, Carrigtwohill, Ireland), volume adjusted and stored at −20 °C until further use. For freeze-drying, the pre-frozen aqueous G. lactiferum extract solution was loaded into the lyophilizer (Cuddon FD18, Blenheim, New Zealand). The condenser temperature was maintained at −40 °C, while drying was carried out under a vacuum of approximately 1 mbar. The shelf temperature then increased to 20 °C to promote sublimation. Each freeze-drying cycle lasted approximately 72 h. The lyophilized extract (24.53% w/w yield) was stored at −20 °C until further use.

2.3. Liposome Preparation

2.3.1. Primary Liposomes (PL)

The PL were prepared using a published method [14], with minor modifications to the soy lecithin concentration and with the use of microfluidization to achieve a narrower liposome size distribution with more consistent reproducibility. In brief, an acetate buffer (0.25 M) was prepared using sodium acetate and acetic acid in Milli-Q water, and the pH was adjusted to 3.8. Subsequently, 20 mL of previously prepared acetate buffer was used to soak soy lecithin (1.5% w/v in the final system) overnight to enhance its hydration and dispersibility. G. lactiferum freeze-dried extract (final concentration 0.5% w/v) was separately dissolved in 20 mL acetate buffer and added to the soaked soy lecithin mixture, and the volume was adjusted to 100 mL to form loaded phospholipid liposomes (PL-GE). A control sample without the extract was prepared following the same procedure to obtain unloaded liposomes (PL-B). The resulting mixtures were stirred using a magnetic multi-stirrer (VELP Scientifica F203A0179 MULTISTIRRER, Milan, Italy) at 300 rpm for 60 min, and the resulting suspensions were coarsely dispersed using a high-pressure benchtop homogenizer (Ultra-Turrax T 25, IKA-Werke GmbH & Co. KG, Staufen, Germany) at 24,000 rpm for 7 min with 1 min bursts in between. Then, the dispersions were passed three times through a high-pressure microfluidizer (M-110P, Microfluidics International Corporation, Westwood, MA, USA) (200 MPa, 25 °C) to achieve a more uniform dispersion. The microfluidizer tubing was submerged in an ice bath to maintain this temperature. A portion from each liposome suspension (PL-GE and PL-B) was subsequently used for secondary liposomal preparation.

2.3.2. Secondary Liposomes (CS)

A secondary coating was applied via electrostatic deposition of chitosan [15] onto the surface of the PL. Chitosan forms stable, thin coatings only within a narrow concentration range; lower concentrations result in incomplete coverage, leading to liposome breakdown [15], whereas excessive concentrations lead to depletion flocculation [16,17]. Therefore, a chitosan concentration for optimal particle size, ζ-potential, and polydispersity index (PDI) was determined in a preliminary screening using a range of concentrations (0.1%, 0.15%, 0.2%, 0.25%, 0.3%, 0.35%); 0.25% w/v was selected, yielding size (321 nm), PDI (<0.25), and ζ-potential greater in magnitude than +35 mV to avoid liposome aggregation.
Each PL suspension was added dropwise (2 mL/min) using a peristaltic pump (LabV1, Baoding Shenchen Precision Pump Co., Ltd., Baoding, China) into a 0.25% chitosan solution of the same volume while stirring (400 rpm, 1 h) at room temperature to prepare chitosan-coated liposomes (CS-B and CS-GE) [18]. The four liposomal suspensions, PL and CS (both loaded with GE or unloaded as controls), were stored at 4 °C overnight before the initial analysis and then maintained at 4 °C, with analyses carried out weekly for size, ζ-potential, and PDI over 8 weeks.

2.4. Liposome Characteristics

Size, ζ-potential, and PDI of liposomal suspensions were determined by means of dynamic light scattering using a Zetasizer Nano ZS (Malvern Panalytical, Worcestershire, UK) [18]. Samples were diluted (1:20) in 0.25 M acetate buffer (pH 3.8), vortexed, and analyzed at 25 °C with a scattering angle of 173.25° and a refractive index of 1.45. Measurements were the average of triplicate readings in three independent batches. Data acquisition and analysis were carried out using ZS XPLORER software, version 4.0.0.683 (Malvern Panalytical Ltd., Malvern, Worcestershire, UK).
The storage stability of the liposomes was assessed by measuring mean diameter, PDI, and ζ-potential over 8 weeks at 4 °C. The particle size variation was calculated according to the following Equation (1):
Particle   size   variation   ( % )   =   ( Dt     D 0 )   ×   100   D 0
where D0 represents the initial mean diameter, and Dt corresponds to the diameter measured at each storage time point.

2.5. Liposome Morphology

Transmission electron microscopy (TEM) was employed to observe the morphology of the liposomes [19]. A carbon-coated 200 copper grid (Electron Microscopy Science, Hatfield, PA, USA) was placed into contact with the liposome suspension for 4 min, then briefly rinsed in Milli-Q water for 30 s. The grid was then negatively stained with 2% (w/v) uranyl acetate for 4 min, excess stain was blotted from the edge of the mesh with filter paper, and the grid was rinsed for 30 s with MilliQ water and air-dried. TEM (Tecnai, FEI Company, Hillsboro, OR, USA) was carried out at an accelerating voltage of 120 kV, and micrographs were captured using an in-built camera (VELETA, Hamburg, Germany) at 43,000× magnification. Three grids were observed for each sample across three independent batches.

2.6. Encapsulation Efficiency and Yield Based on Total Phenolic Content (TPC)

Encapsulation efficiency in terms of TPC (EE-TPC%) of the liposomes was analyzed for both PL and CS liposomes [20] with minor modifications to the volumes used. EE% is defined as the ratio of encapsulated total phenolic compounds (TPC) relative to the total TPC content in the liposome mixture. Unencapsulated free GE was separated from both formulations using ultrafiltration filter tubes (Amicon®, MWCO 50 kDa, Merck Millipore, Burlington, MA, USA). After pre-rinsing the filter membrane with acetate buffer (0.25 M, pH 3.8), each liposomal dispersion (5 mL) was loaded into the filter unit and centrifuged (8490× g, 10 min, 25 °C). The initial TPC content in the dispersion (C1) and the TPC content in the filtrate (C0) were analyzed using the Folin–Ciocâlteu method [21]. PL/chitosan interference was corrected with matrix-matched blanks. A standard calibration curve of gallic acid (0.78 to 400 µg/mL; R2 = 0.99) was used to determine TPC.
EE% was calculated using Equation (2) below:
EE - TPC % =   ( C 1     C 0 )   ×   100     C 1
PL and CS samples were lyophilized to a constant final weight, and the encapsulation yield (EY%) was calculated as the percentage weight ratio of the initial total material (Wt) to the liposomes recovered (Wlip) [14] using the following Equation (3):
EY %   =   Wlip   ×   100     W t

2.7. High-Performance Liquid Chromatography (HPLC) for Rutin Quantification

2.7.1. Purification and Disruption of Liposomes

For HPLC analysis, liposomes from each formulation were purified via gel filtration using the method described by Rashidinejad, Birch, Sun-Waterhouse and Everett [14]. This step was performed to separate the non-encapsulated free extract compounds from the liposome suspension. Briefly, a Sephadex gel column was prepared using pre-soaked, swollen Sephadex G-50 (5% w/w) in MilliQ water. Approximately 5 mL of Sephadex slurry was loaded into a 6 mL syringe (fitted with glass wool at the base) and gently agitated to expel excess liquid until the volume was reduced to approximately 3 mL. Then, 1.5 mL of acetate buffer (0.25 M, pH 3.8) was placed above the gel, and the syringe was inserted into a 50 mL centrifuge tube in an upright position and centrifuged at 1207× g at 25 °C for 10 min using a benchtop centrifuge (Beckman Coulter Avanti JXN-26, Brea, CA, USA) to obtain the equilibrated, compacted gel column. Following centrifugation, the syringes were transferred into new, labelled centrifuge tubes, and approximately 2 mL aliquots of each liposome formulation (primary lecithin liposomes, PL, and chitosan-coated liposomes, CS) were applied to the respective columns. The same centrifugation conditions were then applied to elute the purified liposomal fraction, which was collected as the early opalescent fraction at the bottom of the centrifuge tubes.
To release the encapsulated compounds from the purified liposomes, 1 mL aliquots of each purified liposome fraction were combined with 1 mL of preheated ethanol (70 °C) and vortexed for 2 min to disrupt the vesicle membranes. The samples were subsequently cooled to room temperature and centrifuged to pellet lipid and chitosan debris. The resulting supernatant was filtered through a 0.22 µm syringe filter and used for HPLC analysis.

2.7.2. HPLC Analysis Method

A Dionex Ultimate 3000 high-performance liquid chromatography (HPLC) system fitted with a UV–Vis detector and a Luna C18 reverse-phase column (100 Å, 5 µm particle size, 250 mm × 4.6 mm; Phenomenex, Torrance, CA, USA) was employed for the quantification of rutin at 210 nm, adapted from Wang et al. [22]. Data acquisition and chromatographic processing were carried out using Chromeleon software (version 7.2.10 ES, Thermo Fisher Scientific, Waltham, MA, USA). The mobile phase consisted of 0.1% formic acid in Milli-Q water (solvent A) and acetonitrile (solvent B). The gradient program was as follows: 5% B (0–5 min), increased to 10% B (5–19 min), increased to 20% B (19–34 min), increased to 30% B (34–40 min), maintained at 30% B until 57 min, then returned to 5% B and equilibrated until 60 min. The flow rate was 0.7 mL/min, the injection volume was 10 µL, and the column temperature was maintained at 25 °C. A calibration curve of rutin (5 to 250 µg/mL; R2 = 0.99; LOD = 0.0037 mg/mL; LOQ = 0.011 mg/mL) was constructed by plotting peak area against drug concentration (see the Supplementary Figure S1). The initially introduced rutin content into the system (RWS) and the rutin content in the disrupted purified liposomal solutions (RWlip) were calculated. The encapsulation efficiency in terms of rutin (EE-R%) in each liposomal formulation was calculated using the following Equation (4):
EE - R %   =     RW lip   ×   100     RW S

2.8. Fourier Transform-Infrared Spectroscopy (FTIR) of Liposomes

FTIR was used to study the physicochemical characterizations of PL and CS liposomes. Lyophilized liposomal samples were analyzed via FTIR measurements to reduce the molecular mobility of the encapsulated extracts, minimize water absorption, and remove the hydrogen-bonding network amongst water molecules in the liposome system [23]. The FTIR spectra of each sample were obtained using a spectrometer (NICOLET iS5, Thermo Fisher Scientific, Waltham, MA, USA), equipped with an Attenuated Total Reflectance (ATR) accessory (iD7 ATR Diamond, Thermo Fisher Scientific) at room temperature. ATR correction was carried out after each spectrum collection. The scanning was done from 650–4000 cm−1 with 32 scans collected for each sample after background subtraction. Spectral resolution analysis was carried out using OMNIC, version 9.9.535 (Thermo Fisher Scientific) software. The bandwidth was measured at 80% of the peak height.

2.9. Thermal Stability of Liposomes

The thermal stability of liposomes was determined using differential scanning calorimetry (DSC) [24]. Each lyophilized sample (10–12 mg) was transferred into aluminium pans (Tzero, TA Instruments, Zurich, Switzerland) and hermetically sealed. The pan was placed in the heating chamber of the calorimeter (DSC Q2000, TA Instruments Inc., New Castle, DE, USA), equipped with a liquid-nitrogen cooling accessory (nitrogen gas pressure 120 kPa, purge rate 20 mL/min). Samples were scanned at a heating rate of 5 °C/minute between 25 °C and 240 °C (heat flow 1.732 mW). Data acquisition was controlled and analyzed using TRIOS Explorer and TA Universal Analysis software, version 4.5A build 4.5.0.5 (TA Instruments). Onset temperature (To), peak temperature (Tm), and enthalpy change (ΔH) were determined.

2.10. Statistical Analysis

Experiments were performed in triplicate using three independent batches, and results are reported as mean ± standard deviation. Statistical analyses were conducted using one-way analysis of variance (ANOVA), followed by Tukey’s post hoc test for multiple comparisons at α = 0.05, using Minitab (https://www.minitab.com/en-us/, Minitab Inc., State College, PA, USA).

3. Results and Discussion

3.1. Physical Characterization of Liposomes

Liposome sizes ranged from 128.6 to 409.8 nm. PL-B showed a mean diameter of 128.6 ± 0.8 nm, which increased significantly (p < 0.05) in PL-GE up to 146.3 ± 0.5 nm upon loading with the extract (Table 1), consistent with the incorporation of plant compounds into vesicles in other studies [14,25,26]. This phenomenon might occur due to the compound localization within the core material of lipid bilayers [27]. Chitosan coating further enlarged the liposomes to 359.1 ± 0.9 nm (CS-B) and 408.9 ± 1.0 nm (CS-GE).
The ζ-potentials were higher than ±30 mV (Table 1), suggesting colloidal stability by electrostatic repulsion [28], although stability is also affected by attractive potentials. PL-B (−47.8 ± 0.3 mV) became less negative after extract loading (−39.4 ± 0.3 mV). This decrease in the magnitude of the negative ζ-potential likely reflects partial adsorption of relatively less anionic or neutral constituents of the G. lactiferum extract (such as phenolic acids, flavonoids, and triterpenoid saponins commonly reported for this species) onto the liposomal surface, which can partially screen or mask the negative phosphate headgroup charges of the phospholipids. The surface shear ζ-potential reversed to positive values after coating with positively charged chitosan. The ζ-potential of CS-B (40.6 ± 0.3 mV) significantly decreased (p < 0.05) upon loading (35.8 ± 0.9 mV). This reduction in the positive shear potential, accompanied by an increase in particle size, aligns with literature findings on the encapsulation of Elsholtzia splendens extract [29]. Although the chitosan coating reversed the surface potential to positive values, the ζ-potential of CS-B (40.6 ± 0.3 mV) significantly decreased (p < 0.05) to 35.8 ± 0.9 mV upon loading G. lactiferum. This phenomenon consists of electrostatic adsorption of partially anionic or neutral extract constituents (e.g., polyphenols and other polar phytochemicals) onto the cationic chitosan corona, which partially neutralizes the protonated amino groups and lowers the apparent surface charge density while still maintaining sufficiently high positive charge for colloidal stability (|ζ| > 30 mV). Lecithin enhances emulsification, while chitosan provides mucoadhesion and antimicrobial properties [30], making it further suitable for functional beverages.
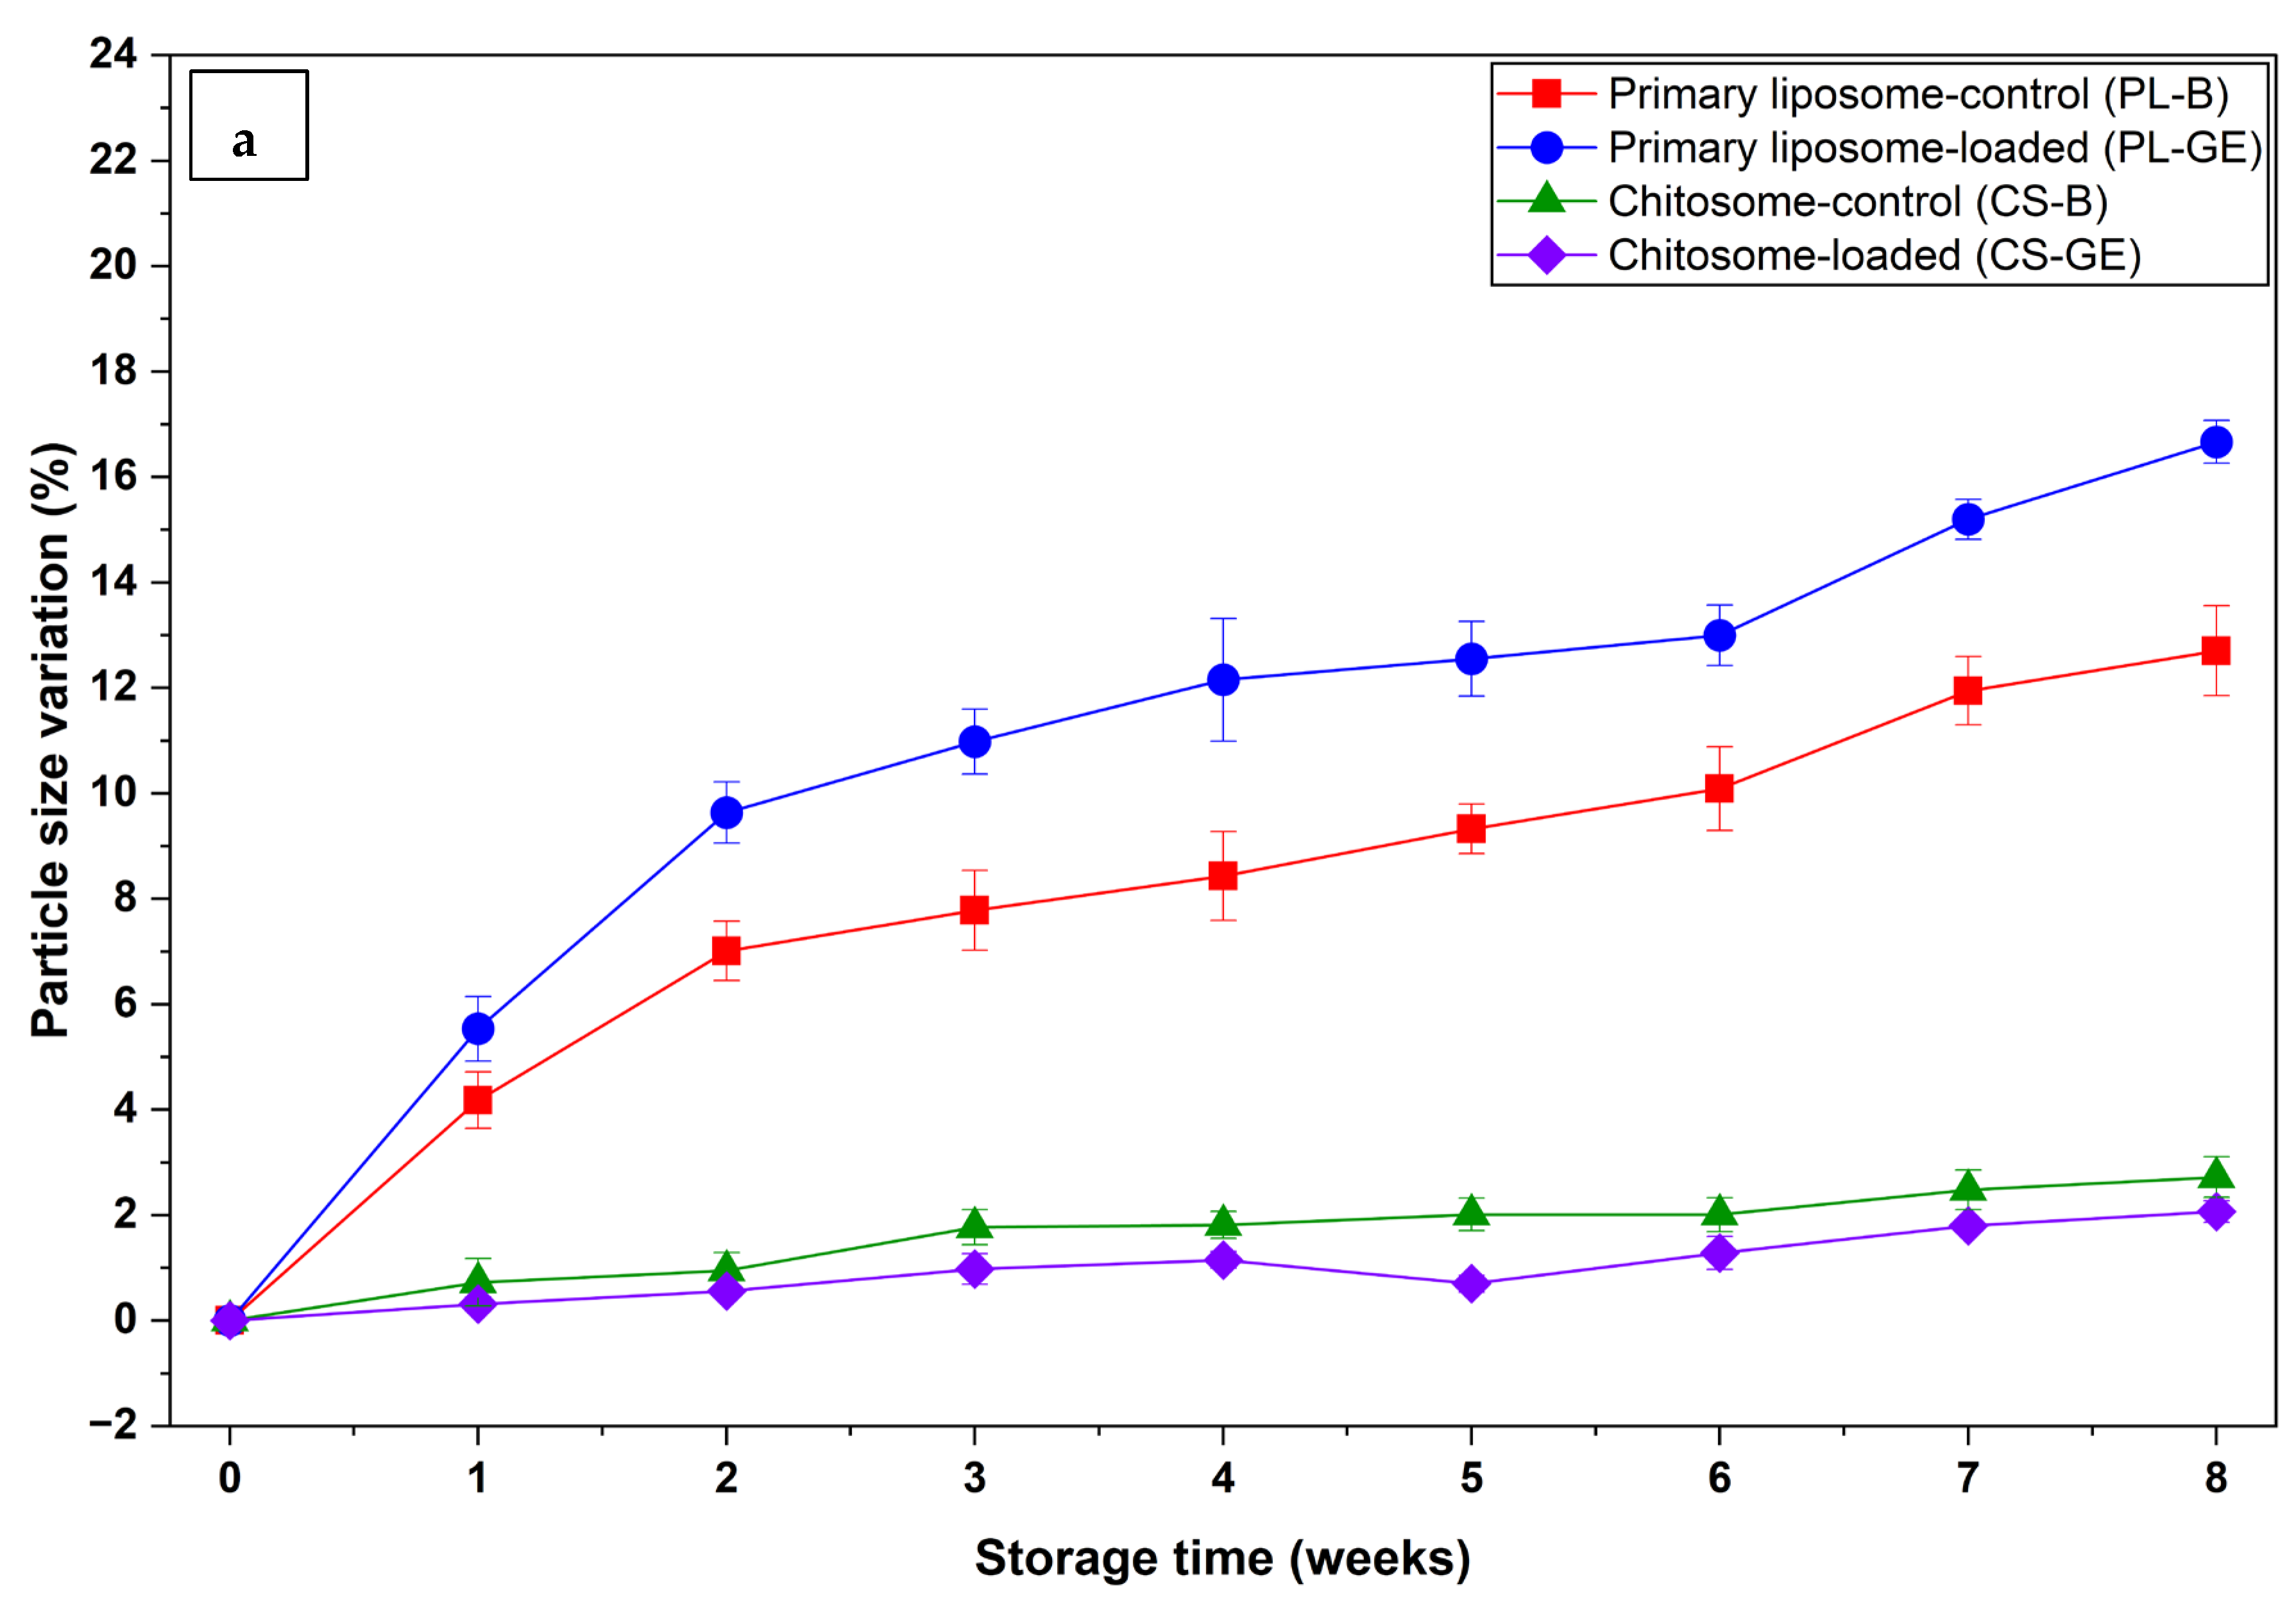
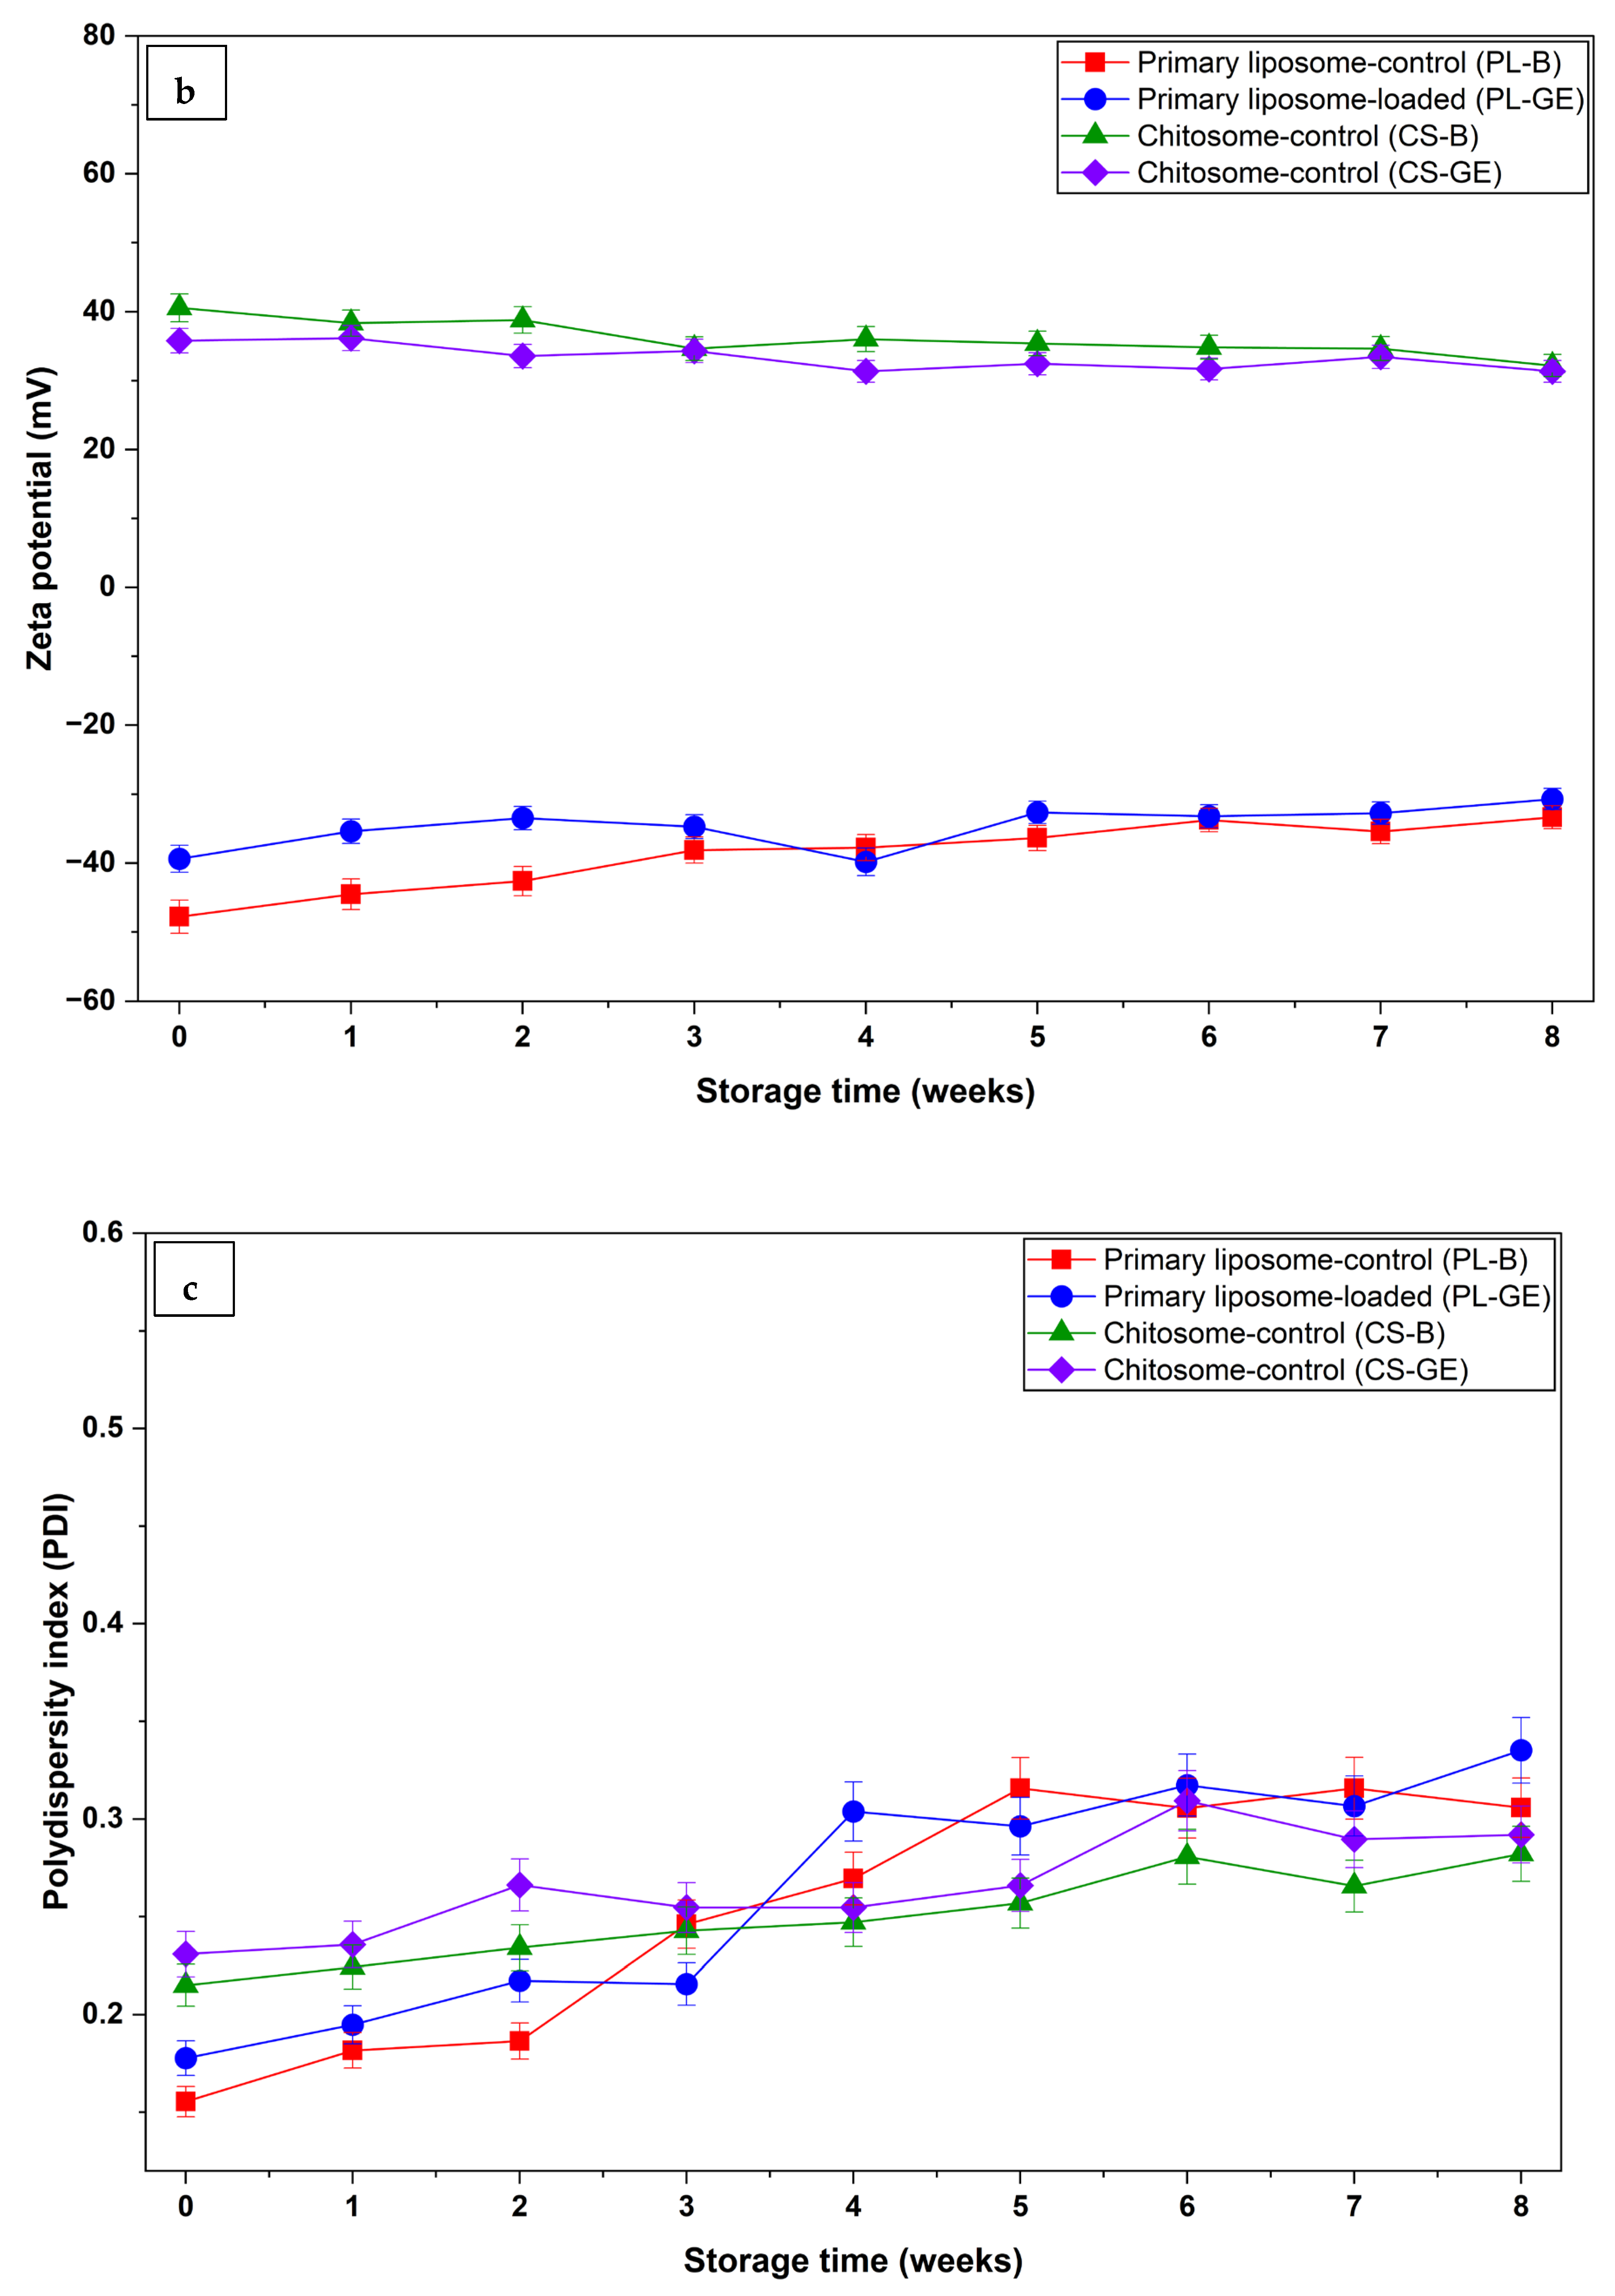
The storage stability of the liposomes was assessed by measuring mean diameter, PDI, and ζ-potential over 8 weeks at 4 °C (Figure 1, Table 2). Relative liposome size (measured using Equation (3), PDI, and the ζ-potential dictate stability and homogeneity, which directly affect compound release profiles, efficiency, and bioaccessibility [25,31].
The diameter of PL-B showed a gradual increase by 13.5% and PL-GE showed a significant (p < 0.05) rise of 16.5% at the end of the 8 weeks, suggesting partial aggregation driven by extract-lipid interactions, including hydrogen bonding between phytochemicals and phosphatidylcholine headgroups and other non-covalent interactions within the phospholipid bilayer, which can promote inter-vesicle adhesion, flocculation, or vesicle fusion at the lipid interface [32]. Concurrently, the surface potential shifted from −47.8 mV to −33.4 mV (PL-B) and from −39.4 mV to −30.7 mV (PL-GE), which showed a significant (p < 0.05) difference, remaining above the threshold for adequate electrostatic repulsive (±30 mV) between vehicles. The observed increase in hydrodynamic diameter of PL-B during storage, without notable changes in PDI or zeta potential, may reflect gradual vesicle growth associated with bilayer rearrangement or an Ostwald-ripening-type process. Such mechanisms can promote relatively uniform size enlargement while maintaining colloidal homogeneity and surface charge stability, rather than indicating extensive aggregation or major population destabilization.
In the chitosan-coated system, the size increased by 2.7% and 2.1% for CS-B and CS-GE, respectively, due to a protective positive electrostatic repulsion and steric hindrance from long, flexible polysaccharide chains of the chitosan outer layer [17]. Overall, chitosan coating has been shown to provide greater stability during storage. The mechanism behind this can be the formation of a hydrated polymer shell by the adsorbed chitosan chains, which increases electrostatic repulsion (via protonated amino groups) and provides steric hindrance between vesicles, thereby reducing aggregation, fusion, and leakage [33], while interactions with phospholipid headgroups tighten the bilayer [34].
Beyond physicochemical characteristics, the pH sensitivity of the chitosan coating is an important consideration for the practical application of these formulations in functional food systems. In the present study, chitosan-coated liposomes were prepared in acetate buffer at pH 3.8 to promote protonation of the chitosan amino groups and thereby enable electrostatic interaction with the negatively charged phospholipid surface [35,36]. Many potential functional food applications, such as dairy products and neutral beverages, have pH values closer to 6.5–7.0 [37]. At such neutral pH values, chitosan progressively loses its positive charge as the pH approaches its pKa (~6.5) [38] and a reduction in ζ-potential would therefore be expected. However, previous work on chitosan- and polysaccharide-coated liposomes indicates that the polymer layer can still provide steric stabilization and improved structural integrity under near-neutral conditions, particularly when combined with secondary coatings such as alginate [39]. Accordingly, the present chitosome formulation may be considered a promising acidic-prepared delivery system, although its stability in neutral food matrices requires further experimental validation before direct application.

3.2. Encapsulation Efficiency and Yield

EE-TPC% for both liposome systems indicated > 70% capacity to entrap GE (Table 3). CS-GE showed significantly (p < 0.05) higher EE% and EY% values than PL- GE. This pattern of results is consistent with previous studies. The chitosan coating increased the EE% of carotenoids in the secondary colloidal system compared to the primary lecithin liposomes [40]. Similarly, Altin et al. [41] reported that a cacao hull phenolic extract encapsulated in fine-disperse lecithin liposomes showed an encapsulation efficiency of 73.6%, and that chitosan-coated secondary liposomes maintained a higher total phenolic content and improved stability compared with the primary liposomes, indicating better retention of phenolics after coating. Chitosan–lipid interactions have been reported to decrease bilayer fluidity and permeability, thereby reducing leakage of entrapped compounds and contributing to the higher EE% and EY% [42,43].
In this study, encapsulation efficiency and yield were calculated based on the values obtained from total phenolic content analysis as a rapid global index of the encapsulated phenolic fraction, frequently used in encapsulation studies of plant extracts [14,44]. Further, HPLC analysis of rutin was used as a marker to track the encapsulation behavior of a representative phenolic compound, providing additional confirmation of the EE-TPC% results.
EE-R% was obtained from the percentage ratio between the rutin content retained in the liposomal dispersion after separation of non-encapsulated rutin. EE-R% values of 59.8 ± 1.3% (PL-GE) and 70.3 ± 1.4% (CS-GE) were obtained, which supported the same trend observed with EE-TPC%. CS-GE showed a significantly higher (p < 0.05) rutin retention than PL-GE. However, a comparatively lower EE% than EE-TPC% is expected in a complex extract, as individual phenolic compounds differ in polarity, molecular size, and affinity for the phospholipid bilayer; rutin, a relatively hydrophilic glycoside, may partition less efficiently into the lipid bilayer than the average phenolic mixture [45,46]. The observation that both EE-TPC% and EE-R% increased after chitosan coating supports that the chitosan layer lowers membrane permeability and improves entrapment. Even though this approach does not directly quantify triterpene saponins, which are the major non-phenolic constituents of G. lactiferum, polyphenols constitute an important and quantifiable fraction of the extract and are highly relevant to its overall properties. Therefore, TPC-based calculations do not directly quantify the encapsulation behavior of triterpene saponins and should not be interpreted as representing the encapsulation efficiency of the entire phytochemical profile of G. lactiferum.
Although this approach provides useful information on the encapsulated phenolic fraction, further work is needed to evaluate the release behavior of the encapsulated extract under gastrointestinal conditions to confirm the bioaccessibility of the encapsulated constituents, which would provide a more complete understanding of the functional performance of the liposomal systems after ingestion and help clarify their potential as food-grade delivery carriers.

3.3. Physicochemical Characterization of Liposomes

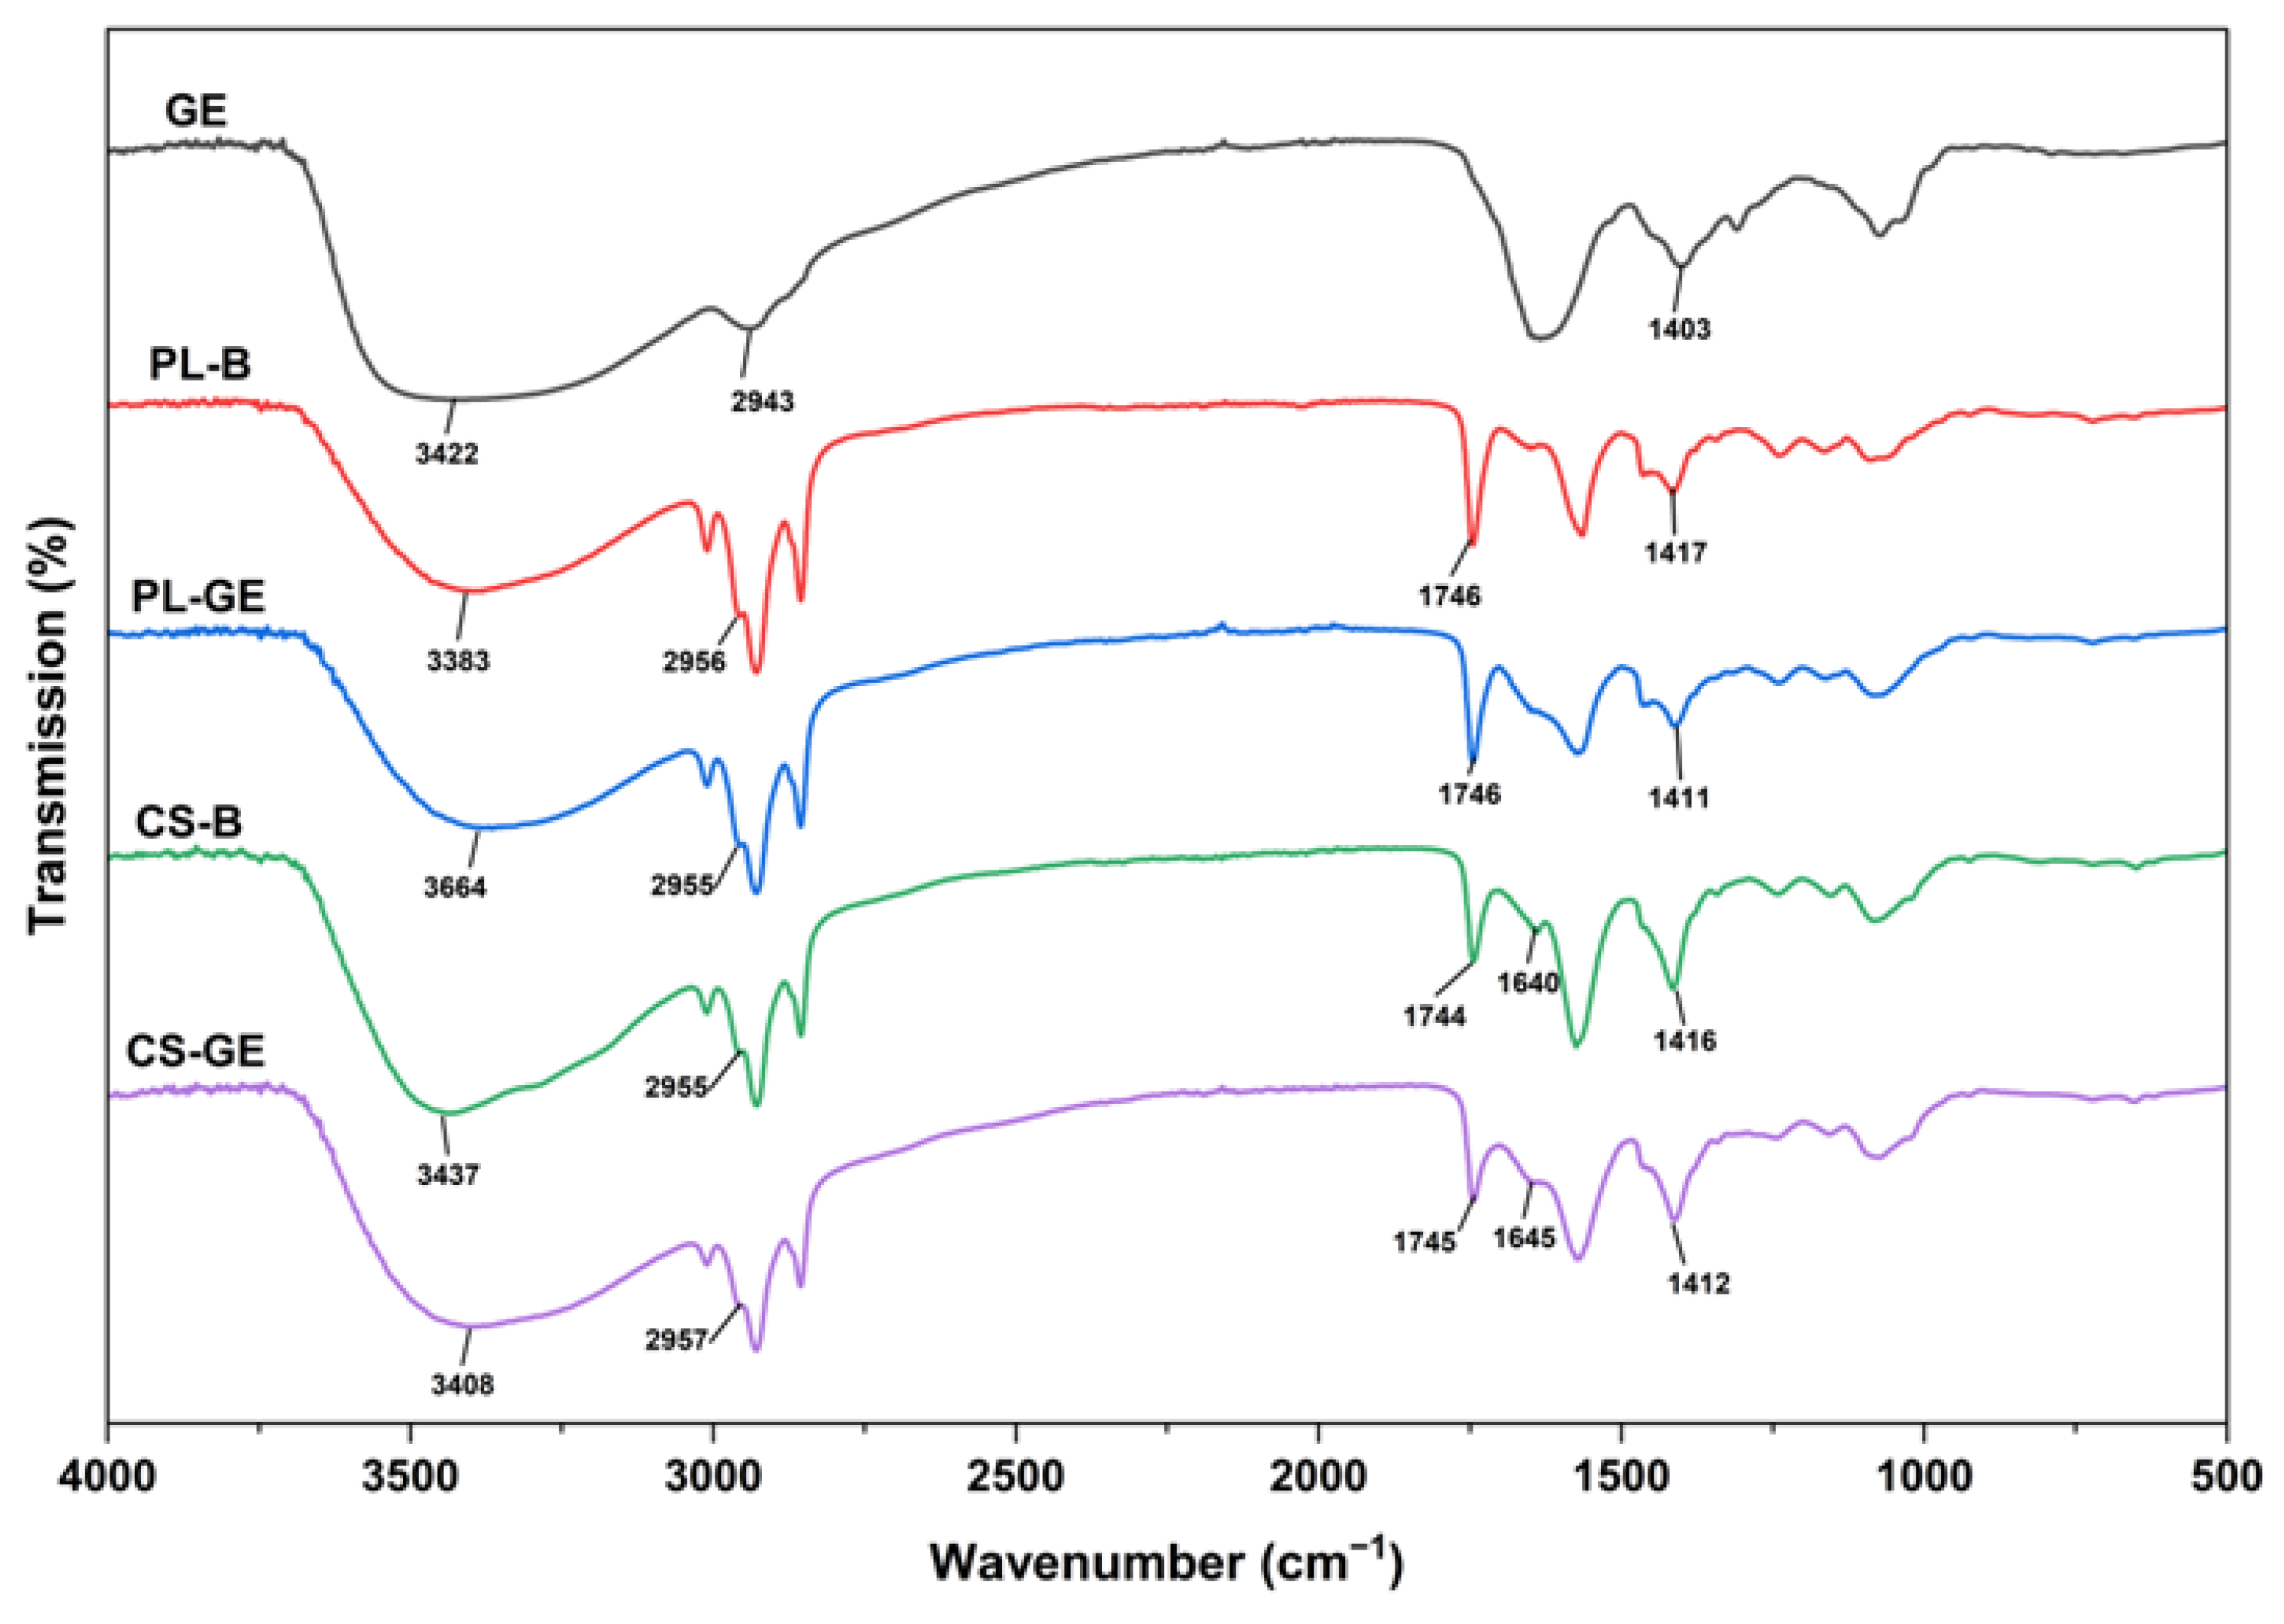
Fourier transform infrared (FTIR) spectroscopy can be used to identify the functional groups of a substance through characteristic peak analysis, and to determine if there are interactions between substances through changes in peak intensities. FTIR spectra and key band shifts for G. lactiferum extract and two liposomal systems are shown in Figure 2 and Table 4.
GE exhibited a characteristic O–H stretching band at 3422 cm−1, indicative of phenolic hydroxyl groups, and a C–O stretching band at 1073 cm−1, consistent with phenolic and aromatic ether vibrations. Upon encapsulation in liposomes (PL-GE), a downward shift in O–H stretching from 3422 to 3364 cm−1 was observed, which suggests stronger hydrogen bonding between GE hydroxyl groups and the polar headgroups of the phospholipids and is consistent with GE interacting at or near the bilayer interface [47]. Additionally, the slight shift of C–H bands at ~2943 cm−1 upon incorporation and chitosan coating supports the presence of interactions in the liposomal systems. The shift from 1403 cm−1 in GE to ~1411–1417 cm−1 in the liposomal formulations is compatible with changes in the local lipid environment and may be a possible indication of incorporation of GE into the lipid acyl-chain region [48]. The lecithin ester C=O band at ~1746 cm−1 remained essentially unchanged across all formulations, suggesting that the phospholipid ester groups and overall bilayer structure were preserved even after GE loading and chitosan coating. In the chitosan-coated formulations (CS-B and CS-GE), new bands appeared at ~1640 cm−1 (amide I C=O) and ~1574 cm−1 (amide II/N–H bending), which were absent in the uncoated liposomes, supporting the presence of chitosan on the vesicle surface [42]. The further downward shift of the O–H stretching band in CS-GE (3408 cm−1) compared to CS-B (3437 cm−1) suggests additional hydrogen-bonding interactions between GE phenolics and chitosan amino groups in the loaded coated system. Collectively, these spectral features provide supportive evidence for interactions among GE, phospholipids, and chitosan, and when considered together with the DLS, zeta-potential, encapsulation efficiency, and TEM results, are consistent with successful formation of the liposomal systems.

3.4. Thermal Behavior and Stability Analysis of Liposomes

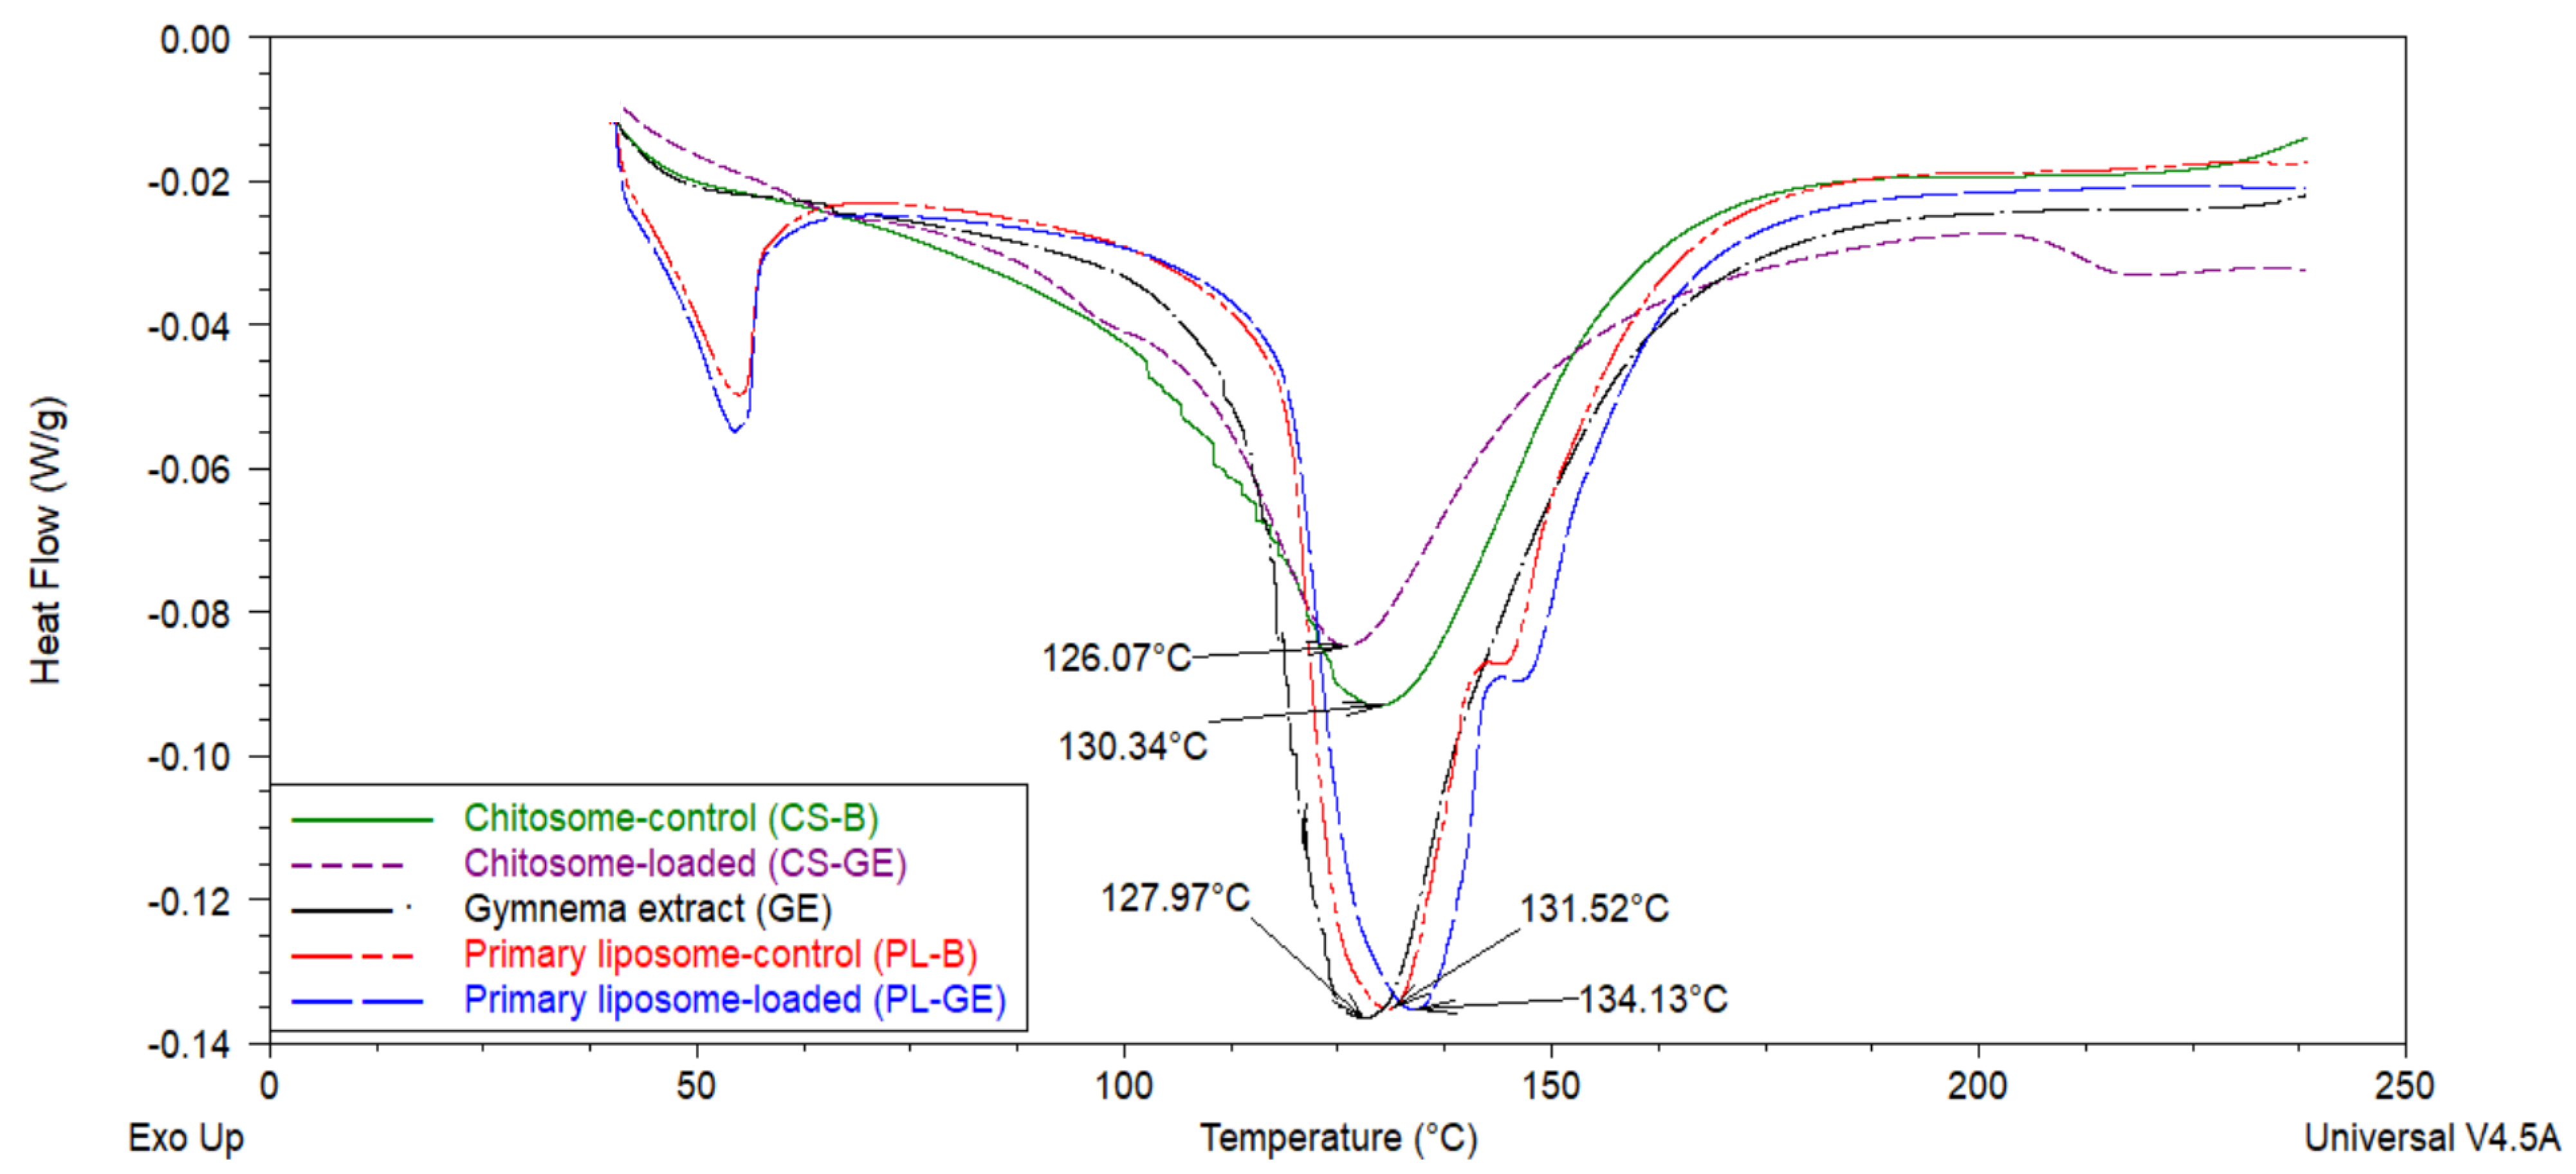
Figure 3 shows the DSC thermograms of GE, PL (unloaded and extract-loaded), and CS (unloaded and extract-loaded).
Freeze-dried GE was used as a reference to compare the DSC thermograms, which show a relatively sharp endothermic peak (Tm = 127.97 °C, To = 113.84 °C, and ΔH = 42.47 J/g), indicating melting of a relatively ordered crystalline structure in the extract [49,50]. The PL carrier graphs show a small pre-endothermic feature at lower temperatures (around 50–60 °C), which could be a pre-transition peak due to the loss of loosely bound water or relaxation of minor amorphous contents from impurities [17,51,52]. This feature is absent from the chitosan carrier system. When chitosan coats the vesicle, it may interact with the membrane surface and form a stabilizing layer, which could reduce the mobility of the phospholipid headgroups and dampen hydration-related changes, thereby contributing to suppression of the small pre-transition peak. Similar pretransition behavior has been reported for soy phosphatidylcholine and other phospholipid systems, where the small endothermic peak is sensitive to membrane composition and disappears upon coating or compositional modification [53].
The PL carriers demonstrated comparatively broad endothermic transitions (Tm = 131.52 °C and 134.13 °C; To = 117.89 °C and 118.04 °C; ΔH = 37.38 and 37.79 J/g for blank and extract-loaded liposomes, respectively) compared to the extract. These values are consistent with the development of a well-organized phospholipid bilayer exhibiting a typical gel-to-liquid-crystalline phase transition [54]. In loaded liposomes, there was a slight increase in Tm (by 2.61 °C) without a substantial change in To or enthalpy, which is consistent with intercalation of GE phytoconstituents into the lipid bilayer of liposomes and a possible strengthening of membrane rigidity while preserving normal lipid phase behavior, in agreement with previous reports on amphiphilic drugs (quercetin and rutin) and flavonoids inserted into phospholipid bilayers [55,56]. Furthermore, the absence of a characteristic Gymnema peak in the loaded liposome is consistent with the extract constituents no longer being present as a separate crystalline phase (as in the pure extract) but instead being molecularly dispersed within the lecithin bilayer system of PL [57].
In contrast, chitosan coating appeared to broaden the main phase-transition peak, reduce the onset temperature and enthalpy, and decrease the cooperativity of the transition due to the lipids melting more gradually rather than all at once, consistent with previous reports [58,59,60]. This downward shift in the transition temperature and reduced enthalpy suggest increased membrane fluidity and reduced packing order induced by the chitosan coating. Chitosan–phospholipid headgroup interactions may partially disrupt bilayer packing and decrease the fraction of phospholipids that participate in highly cooperative domains, thereby diminishing the overall cooperativity of the transition.
In the loaded CS, a slight increase is observed in the onset temperature (from 103.98 °C to 105.32 °C) and in the enthalpy (from 25.9 J/g to 31.55 J/g). These changes in peak position and increased enthalpy suggest interactions among GE constituents, phospholipids, and the chitosan layer. However, there was a reduction in the Tm (from 130.34 °C to 126.07 °C). The lower Tm relative to PL carriers suggests a more fluid membrane state overall. However, the increase in onset temperature and enthalpy compared with blank CS suggests that the encapsulated GE constituents partially restore bilayer packing and thermal stability through interactions among GE phytoconstituents, phospholipids, and the chitosan layer. This pattern is consistent with molecular dispersion of the extract within the phospholipid–polymer system [57,61]. Similar thermotropic shifts have been reported for polymer-stabilized liposomes containing phenolic compounds, in which interfacial interactions modify membrane order without compromising vesicle stability [62]. Overall, DSC showed the potential of both systems to form organized bilayer systems capable of accommodating the extract. However, PL exhibited higher thermal stability and transition cooperativity, while chitosan coating modified the thermal transition behavior of the liposomal membrane, consistent with altered bilayer packing and increased membrane fluidity, while incorporation of the extract partially restored thermal order within the coated system.

3.5. Morphology of Liposomes

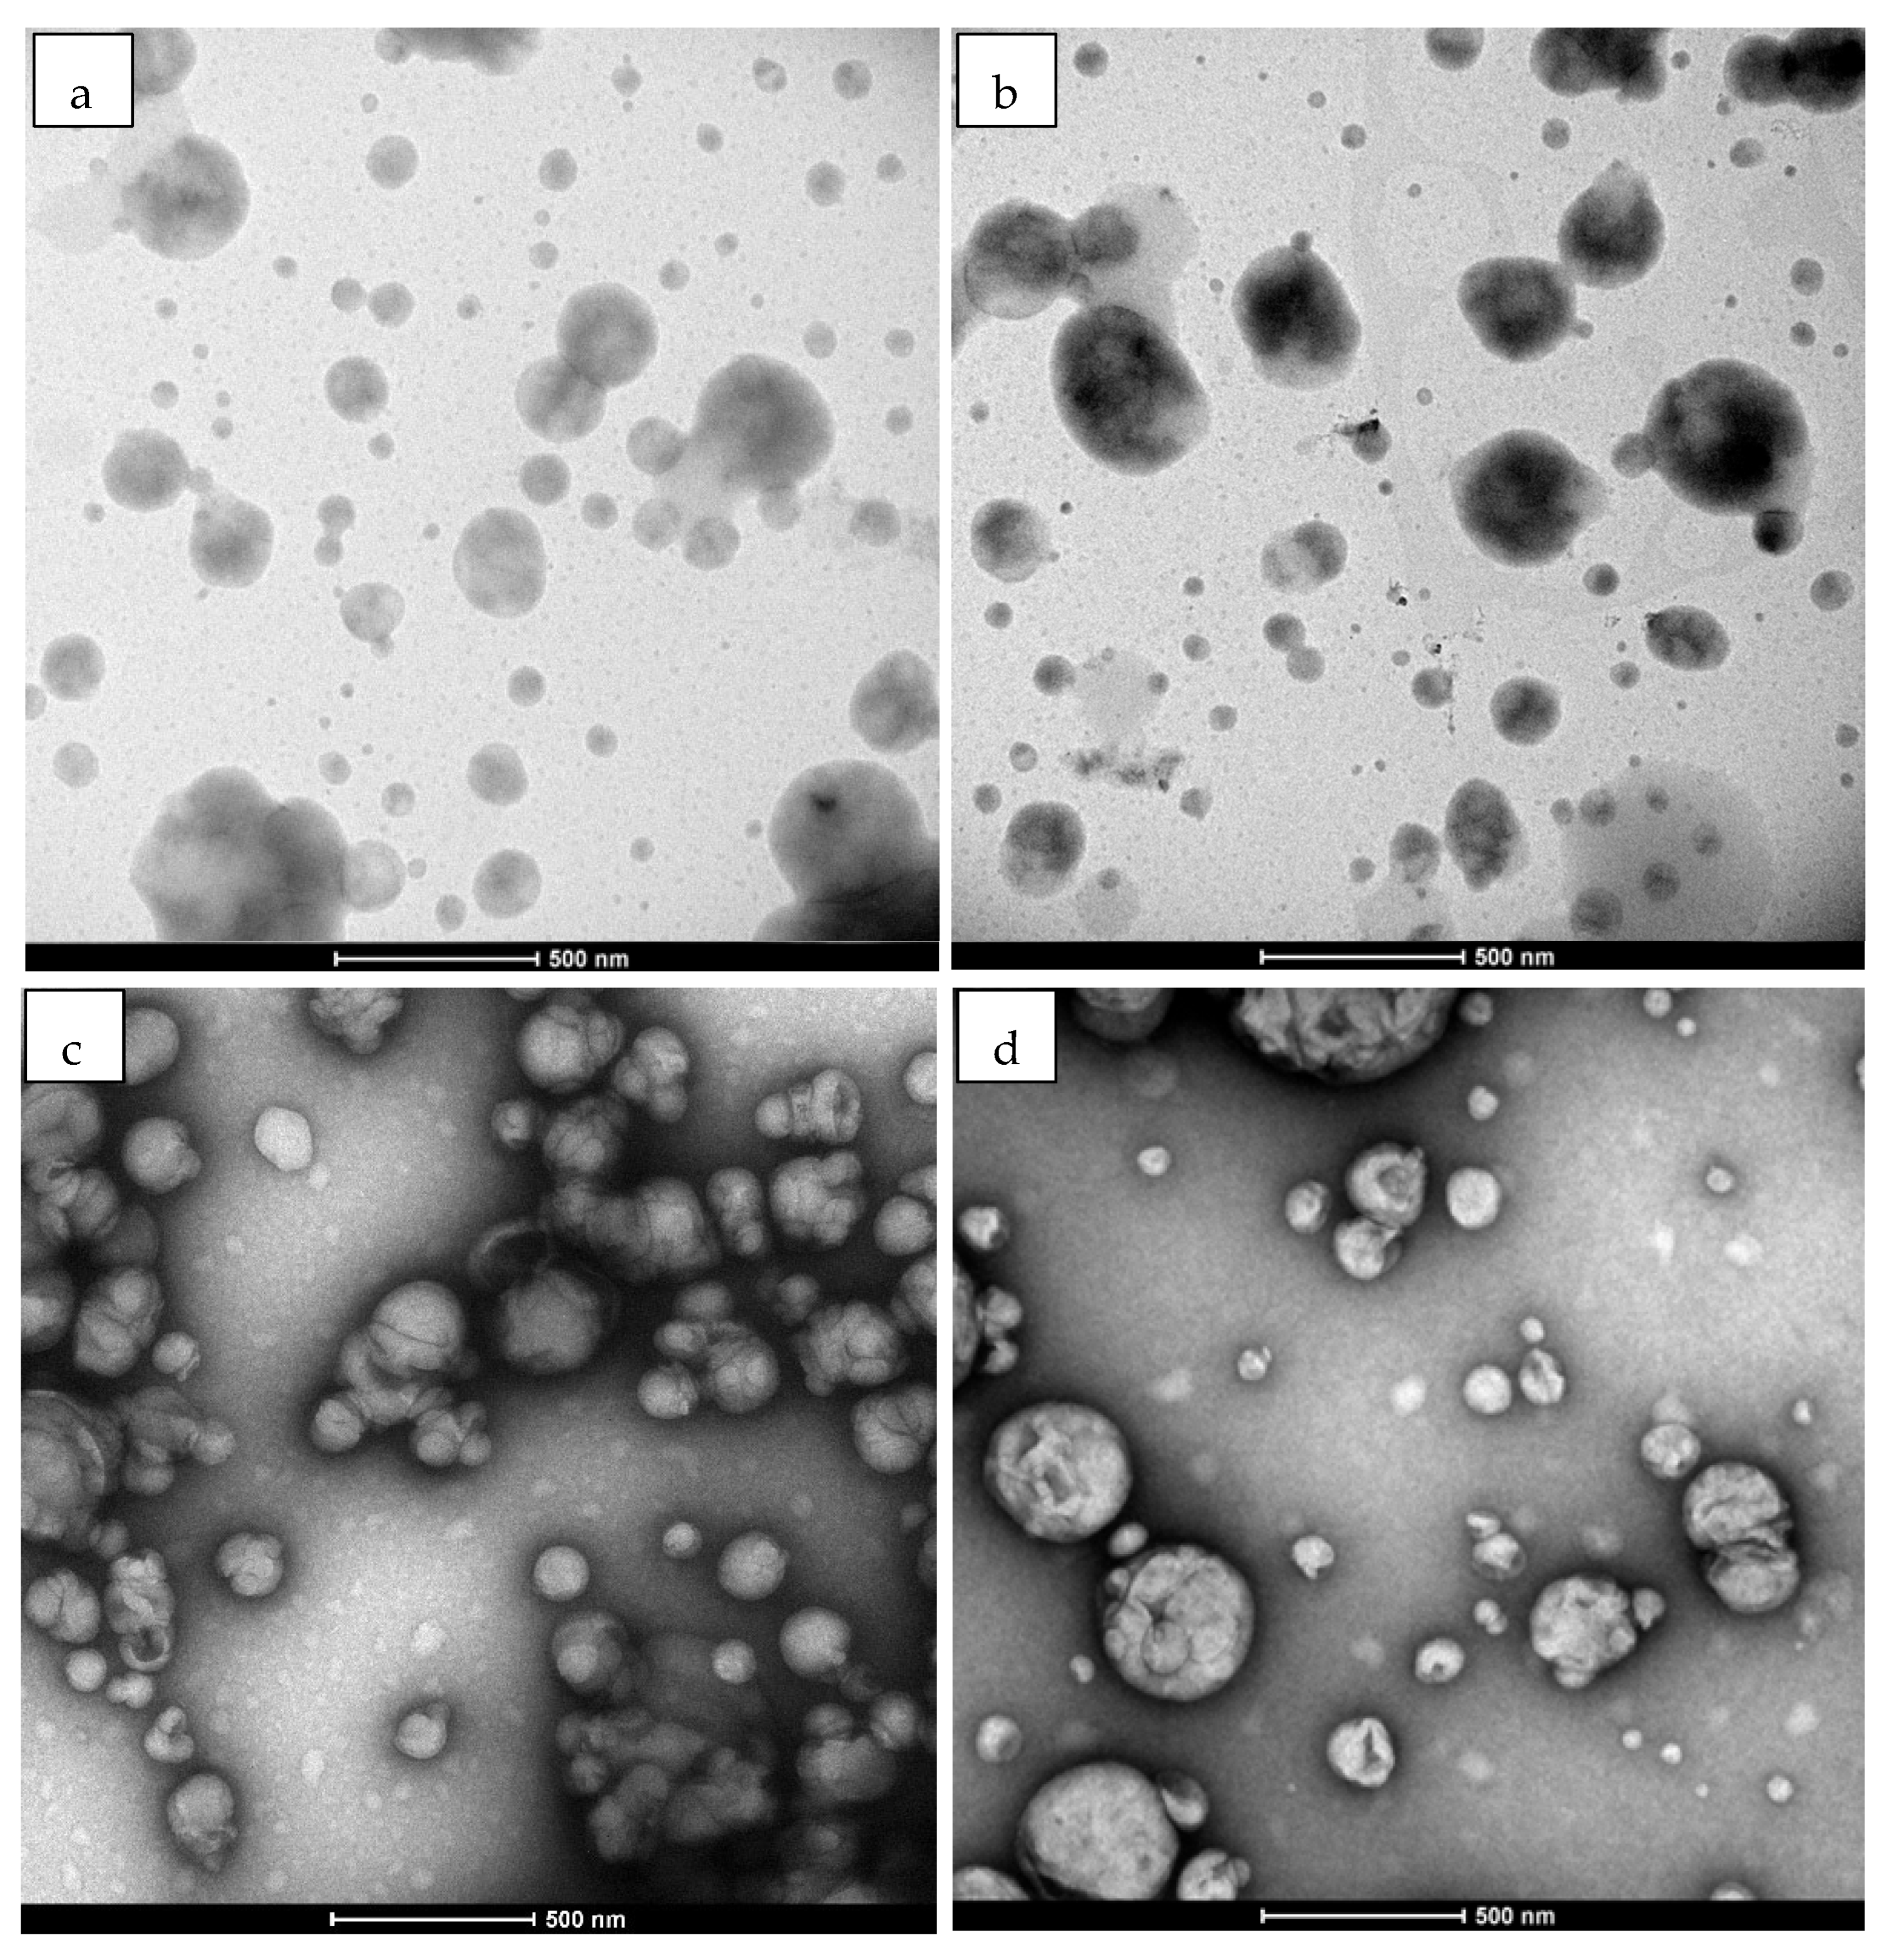
TEM micrographs (negatively stained with uranyl acetate, scale bars: 500 nm; Figure 4) confirmed that all four formulations appeared predominantly as spherical vesicles in the nanometer range. PL-B showed low-contrast structures with relatively smooth, clearly defined edges. In contrast, PL-GE showed an internal electron-dense core and apparent enlargement in size of some vesicles, suggesting successful encapsulation of GE. Upon chitosan coating, vesicles were more electron-dense with rougher, blunt peripheries and a tendency to form small clusters. These features are consistent with the adsorption of chitosan corona, a polymeric shell confirmed via TEM as a rough, electron-dense layer [63]. Notably, extract-loaded CS displayed compact, spherical particles with a corrugated surface and relatively uniform sizes, indicating that chitosan coating preserved vesicle integrity and likely contributed to additional structural strength to the loaded liposomes [34,64]. However, some apparent clustering in the TEM micrographs may partly reflect drying and negative-staining artifacts during sample preparation; therefore, TEM served primarily as qualitative morphological confirmation in this study, with DLS-derived hydrodynamic diameters reported as the primary quantitative size data.

4. Conclusions

G. lactiferum extract was encapsulated in soy lecithin primary liposomes, and the performance was further improved by a secondary chitosan coating. This additional coating increased encapsulation efficiency, as assessed using both total phenolic content-based (EE-TPC%) and HPLC rutin quantification-based (EE-R%) methods, and enhanced colloidal stability compared with primary liposomes, collectively indicating improved extract retention following chitosan coating. Comprehensive characterization by means of dynamic light scattering, FTIR, DSC, and TEM provided supportive evidence for the formation of uniform, predominantly spherical vesicles with relatively low polydispersity and distinct ζ-potential. Differential scanning calorimetry indicated that chitosan coating modified the thermal transition behavior of the liposomal membrane, consistent with altered bilayer packing and increased membrane fluidity, while incorporation of the extract partially restored thermal order within the coated system. Storage stability results demonstrated that chitosomes were more resistant to aggregation during extended storage at 4 °C than the primary phospholipid system. Overall, chitosan coating reduced extract-induced destabilization by providing combined steric and electrostatic stabilization, highlighting its utility for nanoencapsulation of plant bioactives. Collectively, these findings support the use of chitosomes as a promising platform for stabilizing phytochemical-rich extracts in functional food and nutraceutical formulations. Future studies should investigate digestion and release profiles under simulated gastrointestinal conditions to determine whether chitosan coating provides more controlled bioactive release than uncoated liposomes with targeted quantitative analysis of triterpene saponin. Additionally, incorporating these liposomal nanoparticles into solid food matrices (e.g., cheese) and testing the resulting digesta in relevant cell culture models will be important to assess their stability, performance, and actual biological activity.

Supplementary Materials

The following supporting information can be downloaded at: https://www.mdpi.com/article/10.3390/app16115594/s1. Table S1: Reported bioactive compound/ mineral/ vitamin content of Gymnema lactiferum in different studies.; Figure S1: HPLC analysis of rutin standard used for quantification of rutin content in Gymnema lactiferum extract and liposomal formulations to determine encapsulation efficiency. (A) Calibration curve for rutin (concentration 5–250 µg/mL) showing the relationship between rutin concentration (µg/mL) and peak area (mUA). A linear regression model (y = a + bx) was fitted to the data points, yielding an intercept of −0.369 ± 0.550 and a slope of 0.496 ± 0.004, R2 = 0.9986. (B) Representative HPLC chromatogram of the rutin standard (retention time = 39.390 min) confirming peak identity and separation. The chromatogram was directly extracted from the instrument-generated report produced by Chromeleon software (version 7.2.10 ES, Thermo Fisher Scientific, USA).; Figure S2: Representative size distribution by intensity and zeta potential distribution profiles of (A) PL-B, (B) PL-GE, (C) CS-B, and (D) CS-GE. Measurements were performed using a Zetasizer Pro (Malvern Panalytical, Malvern, UK); profiles were directly extracted from reports generated by ZS XPLORER software (Malvern Panalytical). References [65,66,67,68,69,70,71] are cited in the Supplementary Materials.

Author Contributions

Conceptualization, K.W., L.B., D.W.E. and A.R.; Methodology, K.W., L.B., D.W.E. and A.R.; Software, K.W. and A.R.; Validation, L.B., D.W.E. and A.R.; Formal analysis, K.W.; Investigation, K.W.; Resources, A.R.; Data curation, K.W.; Writing—original draft, K.W.; Writing—review and editing, L.B., D.W.E. and A.R.; Visualization, K.W. and A.R.; Supervision, L.B., D.W.E. and A.R.; Project administration, K.W. and A.R.; Funding acquisition, A.R. All authors have read and agreed to the published version of the manuscript.

Funding

This research received no external funding.

Institutional Review Board Statement

Not applicable.

Informed Consent Statement

Not applicable.

Data Availability Statement

The original data presented in the study are included in the article; further inquiries can be directed to the corresponding author.

Acknowledgments

The first author acknowledges Massey University (Palmerston North, New Zealand) for the financial support received through the Massey University Doctoral Scholarship Program.

Conflicts of Interest

The authors declare that there are no conflicts of interest.

References

  1. Armendáriz-Barragán, B.; Zafar, N.; Badri, W.; Galindo-Rodríguez, S.A.; Kabbaj, D.; Fessi, H.; Elaissari, A. Plant extracts: From encapsulation to application. Expert Opin. Drug Deliv. 2016, 13, 1165–1175. [Google Scholar] [CrossRef]
  2. Hashim, M.A.; Huang, X.; Nadtochii, L.A.; Baranenko, D.A.; Boulkrane, M.S.; El-Messery, T.M. Encapsulation of bioactive compounds extracted from date palm seeds (Phoenix dactylifera L.) and their use in functional food. Front. Nutr. 2022, 9, 1051050. [Google Scholar] [CrossRef] [PubMed]
  3. Rahim, M.A.; Zahran, H.A.; Jaffar, H.M.; Ambreen, S.; Ramadan, M.F.; Al-Asmari, F.; Castro-Muñoz, R.; Zongo, E. Liposomal encapsulation in food systems: A review of formulation, processing, and applications. Food Sci. Nutr. 2025, 13, e70587. [Google Scholar] [CrossRef] [PubMed]
  4. Rezagholizade-Shirvan, A.; Soltani, M.; Shokri, S.; Radfar, R.; Arab, M.; Shamloo, E. Bioactive compound encapsulation: Characteristics, applications in food systems, and implications for human health. Food Chem. X 2024, 24, 101953. [Google Scholar] [CrossRef] [PubMed]
  5. Balasubramaniam, V.G.; Ramakrishnan, S.R.; Antony, U. Opportunities and challenges of plant extracts in food industry. In Plant Extracts: Applications in the Food Industry; Academic Press: Cambridge, MA, USA, 2022; pp. 295–315. [Google Scholar]
  6. Nedovic, V.; Kalusevic, A.; Manojlovic, V.; Levic, S.; Bugarski, B. An overview of encapsulation technologies for food applications. Procedia Food Sci. 2011, 1, 1806–1815. [Google Scholar] [CrossRef]
  7. Aizpurua-Olaizola, O.; Navarro, P.; Vallejo, A.; Olivares, M.; Etxebarria, N.; Usobiaga, A. Microencapsulation and storage stability of polyphenols from Vitis vinifera grape wastes. Food Chem. 2016, 190, 614–621. [Google Scholar] [CrossRef]
  8. Abd El-Kader, A.; Abu Hashish, H. Encapsulation techniques of food bioproduct. Egypt. J. Chem. 2020, 63, 1881–1909. [Google Scholar] [CrossRef]
  9. Risch, S.J. Encapsulation: Overview of uses and techniques. In Encapsulation and Controlled Release of Food Ingredients; ACS Publications: Washington, DC, USA, 1995. [Google Scholar]
  10. Bandara, T.; Begum, R.; Sagarika, E.; Liaqua, A.; Errol, J.R. Effects of Gymnema lactiferum leaf on serum glucose and cholesterol levels of streptozotocin induced diabetic rats. Int. J. Biol. Chem. Sci. 2010, 4, 815–819. [Google Scholar] [CrossRef][Green Version]
  11. Karthigesu, K.; Sivapalan, S.; Rajendra, S.; Navaratinaraja, T.S.; Kesavan, V.; Premakumara, S. Effect of Gymnema lactiferum tea brew on Type 2 diabetes mellitus: A double-blind, randomised active-controlled phase III clinical trial. Clin. Tradit. Med. Pharmacol. 2024, 5, 200164. [Google Scholar] [CrossRef]
  12. Thabrew, M.I.; Senaratna, L.; Samarawickrema, N.; Munasinghe, C. Antioxidant potential of two polyherbal. Preparations used in Ayurveda for the treatment of rheumatoid arthritis. J. Ethnopharmacol. 2001, 76, 285–291. [Google Scholar] [CrossRef]
  13. Wasana, K.G.P.; Attanayake, A.P.; Jayatilaka, K.A.P.W.; Weerarathna, T.P. Antidiabetic activity of widely used medicinal plants in the Sri Lankan traditional healthcare system: New insight to medicinal flora in Sri Lanka. Evid.-Based Complement. Altern. Med. 2021, 2021, 6644004. [Google Scholar] [CrossRef]
  14. Rashidinejad, A.; Birch, E.J.; Sun-Waterhouse, D.; Everett, D.W. Delivery of green tea catechin and epigallocatechin gallate in liposomes incorporated into low-fat hard cheese. Food Chem. 2014, 156, 176–183. [Google Scholar] [CrossRef]
  15. Laye, C.; McClements, D.; Weiss, J. Formation of biopolymer-coated liposomes by electrostatic deposition of chitosan. J. Food Sci. 2008, 73, N7–N15. [Google Scholar] [CrossRef]
  16. Guzey, D.; McClements, D.J. Characterization of β-lactoglobulin–chitosan interactions in aqueous solutions: A calorimetry, light scattering, electrophoretic mobility and solubility study. Food Hydrocoll. 2006, 20, 124–131. [Google Scholar] [CrossRef]
  17. Zhuang, J.; Ping, Q.; Song, Y.; Qi, J.; Cui, Z. Effects of chitosan coating on physical properties and pharmacokinetic behavior of mitoxantrone liposomes. Int. J. Nanomed. 2010, 5, 407–416. [Google Scholar] [CrossRef]
  18. Gil-Gonzalo, R.; Durante-Salmerón, D.A.; Pouri, S.; Doncel-Pérez, E.; Alcántara, A.R.; Aranaz, I.; Acosta, N. Chitosan-Coated Liposome Formulations for Encapsulation of Ciprofloxacin and Etoposide. Pharmaceutics 2024, 16, 1036. [Google Scholar] [CrossRef]
  19. De Carlo, S.; Harris, J.R. Negative staining and cryo-negative staining of macromolecules and viruses for TEM. Micron 2011, 42, 117–131. [Google Scholar] [CrossRef] [PubMed]
  20. Barekat, S.; Nasirpour, A.; Keramat, J.; Dinari, M.; Claeys, M.; Sedaghat Doost, A.; Van der Meeren, P. Formulation, characterization, and physical stability of encapsulated walnut green husk (Juglans regia L.) extract in phosphatidylcholine liposomes. J. Dispers. Sci. Technol. 2024, 45, 2180–2193. [Google Scholar] [CrossRef]
  21. Isabelle, M.; Lee, B.L.; Ong, C.N.; Liu, X.; Huang, D. Peroxyl radical scavenging capacity, polyphenolics, and lipophilic antioxidant profiles of mulberry fruits cultivated in southern China. J. Agric. Food Chem. 2008, 56, 9410–9416. [Google Scholar] [CrossRef]
  22. Wang, Y.; Li, S.; Han, D.; Meng, K.; Wang, M.; Zhao, C. Simultaneous determination of rutin, luteolin, quercetin, and betulinic acid in the extract of Disporopsis pernyi (Hua) Diels by UPLC. J. Anal. Methods Chem. 2015, 2015, 130873. [Google Scholar] [CrossRef]
  23. Zhang, L.; Song, X.; Qi, Q.; Liu, W. Interaction of DPPC liposomes with cholesterol and food protein during in vitro digestion using Dynamic Light Scattering and FTIR spectroscopy analysis. Food Chem. 2022, 375, 131893. [Google Scholar] [CrossRef]
  24. Demetzos, C. Differential scanning calorimetry (DSC): A tool to study the thermal behavior of lipid bilayers and liposomal stability. J. Liposome Res. 2008, 18, 159–173. [Google Scholar] [CrossRef]
  25. Sarabandi, K.; Jafari, S.M.; Mohammadi, M.; Akbarbaglu, Z.; Pezeshki, A.; Heshmati, M.K. Production of reconstitutable nanoliposomes loaded with flaxseed protein hydrolysates: Stability and characterization. Food Hydrocoll. 2019, 96, 442–450. [Google Scholar] [CrossRef]
  26. Azari, A.; Ghaboos, S.H.H.; Moghadam, V.E.; Jafari, S.M. Influence of chitosan coating on the physicochemical and antioxidant properties of phycocyanin-loaded nanoliposomes. Algal Res. 2023, 72, 103120. [Google Scholar] [CrossRef]
  27. Malekar, S.A.; Sarode, A.L.; Bach, A.C.; Worthen, D.R. The localization of phenolic compounds in liposomal bilayers and their effects on surface characteristics and colloidal stability. AAPS PharmSciTech 2016, 17, 1468–1476. [Google Scholar] [CrossRef]
  28. Montes, C.; Villaseñor, M.J.; Rios, A. Analytical control of nanodelivery lipid-based systems for encapsulation of nutraceuticals: Achievements and challenges. Trends Food Sci. Technol. 2019, 90, 47–62. [Google Scholar] [CrossRef]
  29. Lee, J.-S.; Kim, G.-H.; Lee, H.G. Characteristics and antioxidant activity of Elsholtzia splendens extract-loaded nanoparticles. J. Agric. Food Chem. 2010, 58, 3316–3321. [Google Scholar] [CrossRef] [PubMed]
  30. Dammak, I.; do Amaral Sobral, P.J. Investigation into the physicochemical stability and rheological properties of rutin emulsions stabilized by chitosan and lecithin. J. Food Eng. 2018, 229, 12–20. [Google Scholar] [CrossRef]
  31. Danaei, M.; Dehghankhold, M.; Ataei, S.; Hasanzadeh Davarani, F.; Javanmard, R.; Dokhani, A.; Khorasani, S.; Mozafari, M.R. Impact of particle size and polydispersity index on the clinical applications of lipidic nanocarrier systems. Pharmaceutics 2018, 10, 57. [Google Scholar] [CrossRef]
  32. Olfati, A.; Karimi, N.; Arkan, E.; Zhaleh, M.; Mozafari, M. Enhancing Bioavailability and Stability of Plant Secondary Metabolites: Formulation and Characterization of Nanophytosomes Encapsulating Red Bryony and Horned Poppy Extracts. J. Funct. Biomater. 2025, 16, 194. [Google Scholar] [CrossRef] [PubMed]
  33. Zhang, X.; Wu, Z.; Zhang, W.; Wang, L.; Zhao, P.; Lv, X.; Guo, P.; Chen, J. Surface modification by chitosan for improving stability and antioxidative activity of astaxanthin-loaded liposomes. LWT 2024, 198, 116033. [Google Scholar] [CrossRef]
  34. Mady, M.M.; Darwish, M.M. Effect of chitosan coating on the characteristics of DPPC liposomes. J. Adv. Res. 2010, 1, 187–191. [Google Scholar] [CrossRef]
  35. Jhaveri, J.; Raichura, Z.; Khan, T.; Momin, M.; Omri, A. Chitosan nanoparticles-insight into properties, functionalization and applications in drug delivery and theranostics. Molecules 2021, 26, 272. [Google Scholar] [CrossRef]
  36. Pasarin, D.; Ghizdareanu, A.-I.; Enascuta, C.E.; Matei, C.B.; Bilbie, C.; Paraschiv-Palada, L.; Veres, P.-A. Coating materials to increase the stability of liposomes. Polymers 2023, 15, 782. [Google Scholar] [CrossRef] [PubMed]
  37. Sharma, S.; Singh, A.; Sharma, S.; Kant, A.; Sevda, S.; Taherzadeh, M.J.; Garlapati, V.K. Functional foods as a formulation ingredients in beverages: Technological advancements and constraints. Bioengineered 2021, 12, 11055–11075. [Google Scholar] [CrossRef]
  38. Lee, D.W.; Lim, C.; Israelachvili, J.N.; Hwang, D.S. Strong adhesion and cohesion of chitosan in aqueous solutions. Langmuir 2013, 29, 14222–14229. [Google Scholar] [CrossRef]
  39. Liu, W.; Liu, J.; Liu, W.; Li, T.; Liu, C. Improved physical and in vitro digestion stability of a polyelectrolyte delivery system based on layer-by-layer self-assembly alginate–chitosan-coated nanoliposomes. J. Agric. Food Chem. 2013, 61, 4133–4144. [Google Scholar] [CrossRef]
  40. Tan, C.; Feng, B.; Zhang, X.; Xia, W.; Xia, S. Biopolymer-coated liposomes by electrostatic adsorption of chitosan (chitosomes) as novel delivery systems for carotenoids. Food Hydrocoll. 2016, 52, 774–784. [Google Scholar] [CrossRef]
  41. Altin, G.; Gültekin-Özgüven, M.; Ozcelik, B. Chitosan coated liposome dispersions loaded with cacao hull waste extract: Effect of spray drying on physico-chemical stability and in vitro bioaccessibility. J. Food Eng. 2018, 223, 91–98. [Google Scholar] [CrossRef]
  42. Hasan, M.; Messaoud, G.B.; Michaux, F.; Tamayol, A.; Kahn, C.J.; Belhaj, N.; Linder, M.; Arab-Tehrany, E. Chitosan-coated liposomes encapsulating curcumin: Study of lipid–polysaccharide interactions and nanovesicle behavior. RSC Adv. 2016, 6, 45290–45304. [Google Scholar] [CrossRef]
  43. Kang, B.R.; Park, J.S.; Ryu, G.R.; Jung, W.-J.; Choi, J.-S.; Shin, H.-M. Effect of chitosan coating for efficient encapsulation and improved stability under loading preparation and storage conditions of bacillus lipopeptides. Nanomaterials 2022, 12, 4189. [Google Scholar] [CrossRef]
  44. Jara-Quijada, E.; Pérez-Won, M.; Tabilo-Munizaga, G.; Lemus-Mondaca, R.; González-Cavieres, L.; Palma-Acevedo, A.; Herrera-Lavados, C. Liposomes loaded with green tea polyphenols—Optimization, characterization, and release kinetics under conventional heating and pulsed electric fields. Food Bioprocess Technol. 2024, 17, 396–408. [Google Scholar] [CrossRef]
  45. Nawaz, H.; Shad, M.A.; Rehman, N.; Andaleeb, H.; Ullah, N. Effect of solvent polarity on extraction yield and antioxidant properties of phytochemicals from bean (Phaseolus vulgaris) seeds. Braz. J. Pharm. Sci. 2020, 56, e17129. [Google Scholar] [CrossRef]
  46. Pan, C.; Yang, Y.; Duan, X.; Li, H. Remotely Rutin-Loaded into Liposomes for Efficient Encapsulation and Enhancement of Bioavailability and Brain Targeting in vivo. Int. J. Pharmacol. 2023, 19, 367–380. [Google Scholar] [CrossRef]
  47. Alabrahim, O.A.A.; Abdeldayem, A.M.; Azzazy, H.M.E.-S. Enhanced Cytotoxic Activity of Moringa oleifera–Loaded Pharmacosomes against Neuroblastoma. Nanoscale Adv. 2026, 8, 1851–1870. [Google Scholar] [CrossRef]
  48. Ahmadi, N.; Ahranjani, P.J.; Rashidi, L. Encapsulation of green tea extract (GTE) in nanoliposome and assessment of its characterization and in vitro release study of GTE. Food Sci. Nutr. 2025, 13, e70781. [Google Scholar] [CrossRef]
  49. Gill, P.; Moghadam, T.T.; Ranjbar, B. Differential scanning calorimetry techniques: Applications in biology and nanoscience. J. Biomol. Tech. JBT 2010, 21, 167. [Google Scholar] [PubMed]
  50. Montenegro, I.; Pérez, C.; González, B.; Domínguez, Á.; Gómez, E. Thermal characterization and heat capacities of seven polyphenols. Molecules 2025, 30, 199. [Google Scholar] [CrossRef]
  51. Chiu, M.H.; Prenner, E.J. Differential scanning calorimetry: An invaluable tool for a detailed thermodynamic characterization of macromolecules and their interactions. J. Pharm. Bioallied Sci. 2011, 3, 39–59. [Google Scholar] [CrossRef] [PubMed]
  52. Lewis, B.; Das Gupta, S.; Griffin, R. Solid-state NMR studies of the molecular dynamics and phase behavior of mixed-chain phosphatidylcholines. Biochemistry 1984, 23, 1988–1993. [Google Scholar] [CrossRef]
  53. Liu, Y.; Liu, D.; Zhu, L.; Gan, Q.; Le, X. Temperature-dependent structure stability and in vitro release of chitosan-coated curcumin liposome. Food Res. Int. 2015, 74, 97–105. [Google Scholar] [CrossRef] [PubMed]
  54. Velez-Saboyá, C.; Guzmán-Sepúlveda, J.; Ruiz-Suárez, J. Phase transitions of liposomes: When light meets heat. J. Phys. Condens. Matter 2022, 34, 124002. [Google Scholar] [CrossRef]
  55. Mavromoustakos, T.; Chatzigeorgiou, P.; Koukoulitsa, C.; Durdagi, S. Partial interdigitation of lipid bilayers. Int. J. Quantum Chem. 2011, 111, 1172–1183. [Google Scholar] [CrossRef]
  56. Sanver, D.; Sadeghpour, A.; Rappolt, M.; Di Meo, F.; Trouillas, P. Structure and dynamics of dioleoyl-phosphatidylcholine bilayers under the influence of quercetin and rutin. Langmuir 2020, 36, 11776–11786. [Google Scholar] [CrossRef]
  57. Javadi, B.; Farahmand, A.; Soltani-Gorde-Faramarzi, S.; Hesarinejad, M.A. Chitosan-coated nanoliposome: An approach for simultaneous encapsulation of caffeine and roselle-anthocyanin in beverages. Int. J. Biol. Macromol. 2024, 275, 133469. [Google Scholar] [CrossRef]
  58. Fang, N.; Chan, V.; Mao, H.-Q.; Leong, K.W. Interactions of phospholipid bilayer with chitosan: Effect of molecular weight and pH. Biomacromolecules 2001, 2, 1161–1168. [Google Scholar] [CrossRef]
  59. Grohmann, F.; Szógyi, M.; Csempesz, F. Interaction of lipid membranes and neutral polymers by differential scanning calorimetry (DSC). Acta Pharm. Hung. 1997, 67, 267–272. [Google Scholar]
  60. Matsuki, H.; Goto, M.; Tada, K.; Tamai, N. Thermotropic and barotropic phase behavior of phosphatidylcholine bilayers. Int. J. Mol. Sci. 2013, 14, 2282–2302. [Google Scholar] [CrossRef]
  61. Caddeo, C.; Díez-Sales, O.; Pons, R.; Carbone, C.; Ennas, G.; Puglisi, G.; Fadda, A.M.; Manconi, M. Cross-linked chitosan/liposome hybrid system for the intestinal delivery of quercetin. J. Colloid Interface Sci. 2016, 461, 69–78. [Google Scholar] [CrossRef]
  62. Katouzian, I.; Taheri, R.A. Preparation, characterization and release behavior of chitosan-coated nanoliposomes (chitosomes) containing olive leaf extract optimized by response surface methodology. J. Food Sci. Technol. 2021, 58, 3430–3443. [Google Scholar] [CrossRef] [PubMed]
  63. Alcantara, K.P.; Pajimna, R.M.B.; Aliga, P.J.S.; Malabanan, J.W.T.; Tangwongsiri, C.; Haworth, I.S.; Rojsitthisak, P.; Rojsitthisak, P. Review of chitosan-coated nanoscale liposomes for enhanced drug delivery. ACS Appl. Nano Mater. 2025, 8, 21125–21147. [Google Scholar] [CrossRef]
  64. Alshraim, M.O.; Sangi, S.; Harisa, G.I.; Alomrani, A.H.; Yusuf, O.; Badran, M.M. Chitosan-Coated Flexible Liposomes Magnify the Anticancer Activity and Bioavailability of Docetaxel: Impact on Composition. Molecules 2019, 24, 250. [Google Scholar] [CrossRef]
  65. Kathirgamanathar; Geethika, C.; Premakumar, G.; Ranasinghe, P.; Balasubramaniam, K.; Sotheeswaran, S. Comparative study of Antioxidant Activity of Sri Lankan Gymnema Species. Chem. Sri Lanka 2013, 26, 22. [Google Scholar]
  66. Chandrika, U.G.; Basnayake, B.M.L.B.; Athukorala, I.; Colombagama, P.W.N.M.; Goonetilleke, A. Carotenoid content and in vitro bioaccessibility of lutein in some leafy vegetables popular in Sri Lanka. J. Nutr. Sci. Vitaminol. 2010, 56, 203–207. [Google Scholar] [CrossRef]
  67. Gunathilake, K.; Ranaweera, K.; Rupasinghe, H. Analysis of rutin, β-carotene, and lutein content and evaluation of antioxidant activities of six edible leaves on free radicals and reactive oxygen species. J. Food Biochem. 2018, 42, e12579. [Google Scholar] [CrossRef]
  68. Gunathilake, K.P.P.; Ranaweera, K. Antioxidative properties of 34 green leafy vegetables. J. Funct. Foods 2016, 26, 176–186. [Google Scholar] [CrossRef]
  69. Prabodini, M.; Wansapala, J. Proximate analysis and bioactive compounds analysis of Gymnema lactiferum. Int. J. Food Sci. Nutr. 2018, 3, 291–294. [Google Scholar]
  70. Dahanayake, D.; Ekanayake, S. Iron and Vitamin C Content in Green Leafy Vegetables. In Proceedings of the 13th International Research Conference General Sir John Kotelawala Defence University, Ratmalana, Sri Lanka, 15–16 October 2020; pp. 30–35. [Google Scholar]
  71. Deyalage, S.T.; Wickramasinghe, I.; Amarasinghe, N.; Thilakarathna, G. Influence of Cooking Methods on Antioxidant Activities of Selected Leafy Vegetables Gymnema lactiferum, Wattakaka volubilis, and Argyreia populifolia in Sri Lanka. Int. J. Food Sci. 2021, 2021, 1–8. [Google Scholar] [CrossRef]
Figure 1. Storage stability of liposomal formulations over 56 days at 4 °C. (a) Relative change in particle size (%); (b) ζ-potential; and (c) PDI. GE; PLs-B; PL-GE GE; CS-B; CS-GE. Data represent mean ± SD (n = 3).
Applsci 16 05594 g001aApplsci 16 05594 g001b
Figure 2. Fourier transform infrared (FTIR) spectra of GE, PL-B, PL-GE, CS-B, and CS-GE. Spectra are vertically offset for clarity. Key bands are indicated: O–H stretching (3422 → 3408 cm−1), C–H stretching of alkanes (2943–2957 cm−1), amide I C=O (1640–1645 cm−1), and CH2 scissoring/COO symmetric stretching (1403 → 1412 cm−1). Note: the unchanged ester C=O bands (~1745 cm−1) indicate phospholipid bilayer integrity.
Applsci 16 05594 g002
Figure 3. Differential scanning calorimetry thermograms of GE; PL-B; PL-GE; CS-B; CS-GE. Recorded under a nitrogen purge (20 mL/min), heating rate of 5 °C/min (40–240 °C). Note: the onset and peak temperature shifts indicate extract incorporation.
Applsci 16 05594 g003
Figure 4. Transmission electron micrographs of liposomes. (a) PL-B; (b) PL-GE; (c) CS-B; and (d) CS-GE. Scale bar = 500 nm.
Applsci 16 05594 g004
Table 1. Mean diameter, ζ-potential, and polydispersity index of primary liposomes (control and loaded) and chitosomes (control and loaded with G. lactiferum extract) immediately after preparation (week 0).
Liposome SampleMean Diameter (nm)ζ-Potential (mV)Polydispersity Index
PL-B128.6 ± 0.8 d−47.8 ± 0.3 d0.16 ± 0.01 d
PL-GE146.3 ± 0.5 c−39.4 ± 0.3 c0.178 ± 0.003 c
CS-B359.1 ± 0.9 b40.6 ± 0.3 a0.22 ± 0.01 b
CS-GE408.9 ± 1.0 a35.8 ± 0.9 b0.23 ± 0.01 a
PL-B: liposome-control (unloaded); PL-GE: liposomes loaded with the Gymnema extract; CS-B: control chitosomes (unloaded); CS-GE: chitosomes loaded with the Gymnema extract. Values are expressed as mean ± standard deviation. Different superscript letters (a–d) within the same column indicate statistically significant differences (p < 0.05) among samples according to one-way ANOVA followed by Tukey’s post hoc test.
Table 2. Mean diameter of primary liposomes (control and loaded) and chitosomes (control and loaded with G. lactiferum extract) over 8 weeks.
WeekPL-BPL-GECS-BCS-GE
0128.6 ± 0.8 g146.3 ± 0.5 g359.1 ± 0.8 d408.9 ± 1.0 f
1134.4 ± 0.4 f154.3 ± 1.0 f361.5 ± 0.9 c409.2 ± 1.0 ef
2138.5 ± 1.1 e160.3 ± 0.7 e362.3 ± 1.1 c410.5 ± 0.5 de
3139.4 ± 0.6 de162.3 ± 1.5 d365.3 ± 0.5 b412.2 ± 0.9 cd
4140.1 ± 0.8 cd163.9 ± 1.7 cd365.4 ± 0.7 b412.9 ± 0.5 bc
5141.3 ± 0.3 bc164.6 ± 1.0 c366.1 ± 0.6 b411.1 ± 1.0 b
6142.2 ± 1.0 b165.2 ± 0.7 c366.1 ± 0.7 b413.5 ± 1.0 b
7144.8 ± 1.1 a168.5 ± 1.0 b367.8 ± 0.9 a415.6 ± 0.6 a
8145.7 ± 1.4 a170.6 ± 0.6 a368.7 ± 1.0 a416.7 ± 1.0 a
PL-B: liposome-control (unloaded); PL-GE: liposomes loaded with the Gymnema extract; CS-B: control chitosomes (unloaded); CS-GE: chitosomes loaded with the Gymnema extract. Values are expressed as mean ± standard deviation. Different superscript letters (a–g) within the same column indicate statistically significant differences (p < 0.05) among samples according to one-way ANOVA followed by Tukey’s post hoc test.
Table 3. Encapsulation efficiency and encapsulation yield of primary liposomes and chitosomes loaded with G. lactiferum extract immediately after preparation (week 0).
SampleEE-TPC%EYEE-R%
PL-GE73.7 ± 0.5 b79.1 ± 0.6 b59.8 ± 1.3 b
CS-GE77.3 ± 0.9 a82.4 ± 0.6 a70.3 ± 1.4 b
EE-TPC%: encapsulation efficiency in terms of TPC; EE-R%: Encapsulation efficiency in terms of rutin content; PL-GE: liposomes loaded with the Gymnema extract; CS-GE: chitosomes loaded with the Gymnema extract. Means within a column followed by different letters are significantly different at p < 0.05.
Table 4. FTIR absorption bands of G. lactiferum extract, primary liposomes (control and loaded), and chitosomes (control and loaded) at week 0 (immediately after preparation), showing key spectral shifts associated with molecular interactions and encapsulation of bioactive compounds.
Functional Region (cm−1)GEPL-BPL-GECS-BCS-GEInterpretation
O-H stretching of phenols34223383336434373408Downward shift and peak broadening indicate H-bonding between GE phenolic OH and phospholipid headgroups; further shift in CS-GE (3408 cm−1) reflects additional interaction with chitosan amines
C-H stretching (alkanes)29432850–29562856–29552855–29552856–2957Slight shift of C–H bands upon primary encapsulation and coating suggests successful incorporation of GE in both liposomal systems
C=O (aldehydes/esters) 1746174617441745Unchanged ester C=O bands in all liposomal formulations confirm that phospholipid bilayer structural integrity is maintained
C=O (amide) 16401645Indicate the presence of the chitosan amide I group, indicating successful surface coating
CH2 scissoring/COO symmetric stretching14031417141114161412Shift from GE (1403 cm−1) to liposomal samples (~1411–1417 cm−1) reflects incorporation of GE into the lipid acyl-chain environment
N-H bending 15741575Bands appear exclusively in CS-B and CS-GE, confirming chitosan amide II, indicating a successful surface coating
GE: Gymnema extract; PL-B: control liposomes (unloaded); PL-GE: liposomes loaded with the Gymnema extract; CS-B: chitosomes-control (unloaded); CS-GE: chitosomes-loaded with the Gymnema extract. Wavelength numbers are reported in cm−1.
Disclaimer/Publisher’s Note: The statements, opinions and data contained in all publications are solely those of the individual author(s) and contributor(s) and not of MDPI and/or the editor(s). MDPI and/or the editor(s) disclaim responsibility for any injury to people or property resulting from any ideas, methods, instructions or products referred to in the content.