Systematic Review

The Association Between the TUG Test and Different Stages of Mild Cognitive Impairment and Alzheimer’s Disease: An Updated Systematic Review with Meta-Analysis of Cross-Sectional Studies

1
Biomedical Engineering Doctoral Program, Boise State University, Boise, ID 83725, USA
2
School of Public and Population Health, Boise State University, Boise, ID 83725, USA
3
School of Kinesiology, Boise State University, Boise, ID 83725, USA
*
Author to whom correspondence should be addressed.
Appl. Sci. 2026, 16(11), 5395; https://doi.org/10.3390/app16115395
Submission received: 25 April 2026 / Revised: 17 May 2026 / Accepted: 20 May 2026 / Published: 28 May 2026

Featured Application

These findings suggest very low-certainty evidence that the timed up-and-go (TUG) test is associated with mild cognitive impairment and Alzheimer’s disease.

Abstract

The purpose of this study was to determine the association between the Timed Up and Go (TUG) test and mild cognitive impairment (MCI) and Alzheimer’s disease (AD). Cross-sectional studies were identified by searching five electronic databases and cross-referencing. Effect sizes were pooled using the inverse variance heterogeneity (IVhet) model, and certainty of evidence was evaluated using the Grading of Recommendations Assessment, Development and Evaluation (GRADE) instrument. Twenty-eight studies representing 1340 MCI, 1752 AD, and 37,561 healthy controls (HC) were included. Significantly greater completion time, in seconds, was observed for the MCI versus HC groups ( X ¯ ,   0.87, 95% CI, 0.38 to 1.37, p = 0.001; Q = 85.5, p < 0.001; I2 = 77.8%, 95% CI, 41.9 to 88.4%; 95% PI, −0.84 to 2.59) and AD versus HC groups when one major outlier was deleted from the model ( X ¯ ,   3.82, 95% CI, 2.57 to 5.07, p < 0.001; Q = 187.5, p < 0.001; I2 = 89.3%, 95% CI, 74.5 to 94.2.4%; 95% PI, −1.29 to 8.93). Based on GRADE, the overall certainty of evidence was considered very low. The current findings suggest very low-certainty evidence that the TUG test may be associated with MCI and AD when compared to HC. Additional, well-designed studies are needed before any level of conclusiveness can be established.

1. Introduction

Alzheimer’s disease (AD) is the leading neurodegenerative disorder in the United States (US) and is expected to increase in the future. Based on population data, the number of Americans aged 65 and older with clinical AD was estimated to be 6.07 million in 2020, with an expected increase to 13.85 million by the year 2060 [1]. For those with mild cognitive impairment (MCI), estimates were reported to be 12.23 million in 2020, with an expected increase to 21.55 million in 2060 [1]. Additionally, the prevalence of global young-onset dementia has been estimated to be 119 per 100,000 individuals ages 30–64 years [2]. Alzheimer’s disease is significantly more prevalent in women than in men, with nearly two-thirds comprising women [1]. Not surprisingly, the direct medical expenses associated with AD patients in the US are high, with estimates placed at $345 billion in 2023 [3]. Moreover, people with AD in the US received approximately 18 billion hours of care, equating to ~$339.5 billion in costs of unpaid healthcare from family members, friends and other unpaid caregivers in 2022 [3]. Caregivers of AD patients also face increased emotional, financial, and physical burdens compared to those caring for individuals without AD [4,5]. Unfortunately, despite extensive research, no cure or substantial symptom-relieving treatment is available for AD [6]. Consequently, AD is a significant contributor to mortality in the US [7,8], ranking as the sixth leading cause of death, equivalent to more than 121,499 people in 2019 alone [3]. In addition, epidemiological studies reported that individuals aged 65 years and older have a life expectancy of only 4–8 years post-diagnosis [8,9]. As can be seen, the deleterious impact of AD is significant today, and given the predictions for the future, it represents an enormous challenge for any society, including the US’s aging society.
The AD continuum starts with preclinical AD and MCI and ends with clinical AD, with each part of the continuum lasting 5–15 years [10,11]. Influencing factors include age, genetics, gender, and other factors [10,11]. In addition to this continuum, clinical AD includes three different stages: “mild”, “moderate”, and “severe”. Initiating treatment at the clinical diagnosis stage, whether via anti-amyloid agents, cholinergic medications, putative disease-modifying therapies, or physical interventions, may prove suboptimal or ineffective due to the advanced neurodegenerative state at that point [12,13]. Effective interventions depend on proper timing. Starting as early as possible may offer the best chance of therapeutic success because the intervention would target less established and extensive pathological processes that are potentially reversible [14]. However, biomarkers via either tau cerebrospinal fluid or amyloid β positron emission tomography scans, which are used in the criteria for early-stage Alzheimer’s disease [14,15], are invasive, expensive, and time-consuming [11,16,17]. Importantly, previous research has reported that clinical AD and MCI are characterized by motor behavior deficits [18]. To address this issue, scientists and industries have begun to develop wearable/mobile applications to diagnose and categorize different stages of AD, including detecting and monitoring AD progression according to digital biomarkers from motor behavior [19,20,21]. However, one of the main questions that emerges with the use of such devices is whether the disease-related digital biomarkers from motor behavior can allow for an objective and continuous clinical assessment of the user [19].
A previous systematic review with meta-analysis that included 18 cross-sectional studies representing 2973 participants concluded that functional mobility during the single-task timed up and go (TUG) was associated with the different stages of AD, with the mean difference in the completion time of the TUG increasing from MCI to AD when compared to healthy controls [22]. While the results of this study are promising, they were based on studies published up to the year 2018, approximately six years ago at the time the current study was conceived [22]. Based on the above information, the authors used the decision framework of Garner et al. to conclude that an updated systematic review with meta-analysis was needed on the association between the TUG test and the different stages of MCI and AD [23].

Objective

The primary objective of this study was to conduct an updated aggregate data systematic review with meta-analysis to determine the association between the TUG test and different stages of MCI and AD.

2. Materials and Methods

2.1. Overview

This study followed the reporting guidelines from the 2020 Preferred Reporting Items for Systematic Reviews and Meta-Analyses (PRISMA) statement (Table S1) [24]. In addition, the a priori protocol for this report followed the guidelines from the Preferred Reporting Items for Systematic Reviews and Meta-Analysis Protocols (PRISMA-P) statement [25]. The protocol was pre-registered in Open Science Framework on 6 October 2024 at https://osf.io/. Any changes to the a priori protocol, including reasons for those changes, are noted throughout the Methods that follow. The protocol was not published in a peer-reviewed journal.

2.2. Eligibility Criteria

The Population, Exposure, Comparison, Outcome, and Study Design (PECOS) eligibility criteria for the current study was as follows: Population—studies in adult humans with a mean group age of 60 years and older; Exposure—patients diagnosed with MCI and/or AD or their subtypes; Comparison—at least two distinct groups compared (healthy older adults compared to patients diagnosed with MCI and/or AD or their subtypes) without physical impairment and/or neurodegenerative comorbidities; Outcome—single-task TUG test, assuming data was available for such; Study Design—cross-sectional studies published in any language, assuming an English-language abstract was available, from 2002 forward. Studies (n = 18) from the previous systematic review with meta-analysis by Silva et al. were included [22]. The inclusion criteria in terms of study design, participants, and outcomes were consistent with the previous systematic review with meta-analysis by Silva et al. [22]. The criteria for diagnosis and staging of MCI and AD or their subtypes were considered according to the Alzheimer’s Association workgroup and National Institutes of Health workgroup (NINCDS-ADRDA guideline) [26] or the National Institute on Aging and Alzheimer’s Association (NIA-AA guideline) [27]. The decision to limit the primary outcome to the TUG test versus also including the get up and go (GUG) and/or 8-foot up-and-go test was based on the previous meta-analysis by Silva et al., in which only eligible studies that assessed functional mobility using the TUG test were included [22]. Studies from the current investigators’ own independent searching were limited to published articles, dissertations, and master’s theses, with planned small-study effects (publication bias, etc.) examined when limited to published articles in peer-reviewed journals. The authors searched from July 2018 forward based on the cutoff day of the previous searches conducted by Silva et al. [22]. A priori, any studies from non-English language sources were to be translated into English using the freely available DeepL translator (version 26.3.1) [28].

2.3. Information Sources

The search for potentially eligible studies spanned the period from the inception of each database up to 31 March 2025. This included (1) searches previously conducted by the authors of the initial meta-analysis from database inception up to 20 July 2018 [22], (2) the current investigators’ first updated search from 1 July 2018 to 7 November 2024, and (3) a second updated search by the current investigators, limited to PubMed, from 8 November 2024 to 31 March 2025. For the initial updated search, five electronic databases were searched by both authors for potentially eligible studies published in any language from 1 July 2018 to 7 November 2024: (1) PubMed, (2) Web of Science, (3) Scopus, (4) PsycINFO, and (5) ProQuest Theses and Dissertations. In addition, a second updated search from 8 November 2024 to 31 March 2025 was conducted in PubMed. This latter search was limited to PubMed because all published journal articles included prior to this search were indexed in PubMed. In addition to database searches, cross-referencing from retrieved studies that underwent full-text review was conducted.

2.4. Search Strategy

The search strategy was developed by both authors (JP and GAK) using text words as well as medical subject headings (MeSH) associated with the ability of the TUG test to predict the different stages of MCI and AD. The advantage of using MeSH headings in the search strategy allowed us to help refine all searches [29]. With oversight from the second author (GAK), the first author (JP) conducted all electronic database searches. A list of all databases searched, including search strategies, can be found in Figure S1.

2.5. Study Records

2.5.1. Study Selection

All studies to be screened were imported by the first author into EndNote (V19.0, New York, NY, USA), and duplicates were removed both electronically and manually by the first author (JP). In line with PRISMA 2020 guidelines, the first author (JP) selected all studies independent of the second author (GAK). The a priori protocol was to have the second author (GAK) randomly select 30% of the studies and check for agreement. However, to increase accuracy, a post hoc decision was made to have the second author (GAK) review all study decisions by the first author (JP) for agreement. Any disagreements were resolved by consensus. For all titles and abstracts that met the inclusion criteria or where there was any uncertainty, the full text of each article was obtained. When dealing with multiple reports of the same study, the study that reported the largest amount of information specific to the systematic review with meta-analysis was included. Neither author was blinded to the journal titles, study authors or institutions from where the work was derived. Reasons for exclusion were coded according to the PECOS criteria: (1) inappropriate population (P), (2) inappropriate exposure (E), inappropriate comparison (C), inappropriate outcome (O), inappropriate study design (S). After identifying the final number of studies to be included, the overall precision of the searches was calculated by dividing the number of studies included by the total number of studies screened after removing duplicates [30]. The number needed to read (NNR) was then calculated as the inverse of the precision [30].

2.5.2. Data Abstraction

Prior to the abstraction of data, a codebook was developed by both authors (JP and GAK) using Microsoft Excel (Microsoft, Redmond, WA, USA). The major categories of variables coded included: (1) study characteristics (author, country, journal, year, sources of funding, impact factor, etc.), (2) participant characteristics (age, height, body mass, gender, pseudodementia staging or clinical dementia rating, Mini-Mental State Examination scores, etc.), (3) task paradigms, and (4) outcome characteristics for completion time of the TUG test for each group (sample sizes, means, standard deviations, etc.). One-year impact factor data based on the year each study was published were retrieved using the Journal Citation Reports website in Clarivate. The decision to use one versus five-year impact factors was made to more accurately reflect the year the study was published. Upon completion of codebook development and in line with PRISMA 2020 guidelines, the first (JP) and second (GAK) authors followed the same post hoc approach as for study selection when coding studies. Missing data was not requested from the original study authors.

2.6. Outcomes and Prioritization

The primary outcome for this study was completion time for the TUG test, in seconds.

2.7. Risk of Bias Assessment in Individual Studies

The a priori plan was to assess for risk of bias from each study using the MethodologicAl STandards for Epidemiological Research (MASTER) scale [31,32], an instrument that allows for the assessment of bias across multiple different study designs. However, a post hoc decision was made to use the Joanna Briggs Institute (JBI) Critical Appraisal Checklist for Analytical Cross-Sectional Studies, an instrument that is specific to analytical cross-sectional studies [33]. This 8-item instrument assesses bias across four major domains: (1) sampling, (2) measurement, (3) confounding, and (4) analysis. Each item is scored for adequacy as “yes”, “no”, “unclear”, or “not applicable”. Based on previous research, no study was excluded based on the results of the risk of bias assessment [34]. The first (JP) and second (GAK) authors assessed risk of bias independent of each other. Any disagreements were resolved by consensus.

2.8. Data Synthesis

2.8.1. Calculation of Effect Sizes

As a measure of functional mobility, the primary outcome for this study was differences in TUG test results between cognitively impaired groups and healthy controls (HC) using the original metric (mean difference in seconds). The typical single-task TUG test assesses the time (in seconds) it takes for a person to stand from a chair, walk 3 m, turn around, walk back, and sit down. The original metric versus a metric such as the standardized mean difference was chosen as the effect size because all eligible TUG instruments assess functional mobility using this metric, and it is easier to interpret clinically. This was calculated by subtracting the TUG score difference in the cognitively impaired group from the TUG score difference in HC. Variances were computed using the pooled standard deviations of TUG difference scores in the cognitively impaired and HC. Studies with multiple cognitively impaired groups were analyzed separately as well as pooled so that only one effect size represented each study. If median versus mean data were reported, these were converted to means and variances based on recommendations from the Cochrane Collaboration [35].

2.8.2. Pooled Estimates for Changes in Outcomes

The weighted mean difference (WMD) in TUG scores was pooled using the inverse heterogeneity (IVhet) model, not to be confused with inverse-variance weighting [36]. The IVhet model was chosen over other models because it has been shown to be more robust when compared to the original random-effects, method-of-moments model of Dersimonian and Laird (DL) [36,37], the most common random-effects model used to pool aggregate data meta-analytic results [37], and the same one used in the Silva et al. meta-analysis [22]. Specifically, simulation studies have shown that the IVhet model retains correct coverage probabilities as well as a lower observed variance than the DL random-effects model, regardless of heterogeneity [36]. Two-tailed z-alpha values <0.05 as well as non-overlapping 95% confidence intervals (CIs) were considered statistically significant. In addition, 95% prediction intervals (PIs) were calculated. Ninety-five percent of PIs provide an estimate of what result one might expect if they conducted their own study, as well as providing a better estimate of heterogeneity and inconsistency than the Q and I2 statistics because it is based on an absolute measure of between-study heterogeneity (tau) [38]. Consistent with the previous systematic review with meta-analysis by Silva et al., on which this update is based [22], separate meta-analyses were conducted for differences in TUG scores for MCI and AD groups. Individual study results were reported using forest plots.
Heterogeneity and inconsistency for TUG score differences were estimated using the Q [39] and I2 [40] statistics, respectively, as well as the previously mentioned 95% PIs. An alpha level of ≤ 0.10 for Q is considered to represent statistically significant heterogeneity. While somewhat arbitrary, inconsistency based on I2, a relative measure, was categorized as very low (<25%), low (25% to <50%), moderate (50% to <75%) or large (≥75%) [40]. For I2, both the point estimate and the corresponding 95% CIs were calculated.
Influence analysis, i.e., leave-one-out analysis, was conducted with each study deleted from the model once to examine the effect of each study on the overall results, i.e., TUG score differences. In addition, outlier analysis was conducted by deleting the results from those studies in which their 95% CIs did not fall within the pooled 95% CI. Finally, cumulative meta-analysis, ranked by year, was used to examine the accumulation of TUG results over time.

2.8.3. Meta-Biases

Small-study effects (publication bias, etc.) were assessed qualitatively using the Doi plot, a normal quantile plot [41]. The Doi plot was chosen over the often-used funnel plot because the former has been suggested to be more intuitive than the latter [41]. In addition, the LFK index was used as a quantitative measure for small-study effects [41]. The decision to use the LFK index over something like the frequently used Egger’s regression-intercept test was based on previous research suggesting the former to be more robust than the latter, including when the number of studies analyzed is small (5 versus 10) [41]. The closer the LFK index value is to zero, the more symmetrical the Doi plot, suggesting no small-study effects [42]. Based on previous recommendations, LFK results were categorized as no asymmetry (LFK index within ±1), minor asymmetry (LFK index exceeds ±1 but within ±2), and major asymmetry (LFK index exceeds ±2) [41].

2.8.4. Subgroup and Meta-Regression Analyses

Consistent with the previous systematic review and meta-analysis of Silva et al. [22], subgroup differences between TUG scores in MCI and HC were examined when partitioned according to no amnestic MCI (naMCI), amnestic MCI (aMCI) impairment, and very mild AD, defined as mild cognitive impairment (MCI) for the current study. In addition, subgroup differences between TUG scores in AD and HC were examined according to mild, mild to moderate, and mild to severe AD. Differences between subgroups were considered statistically significant if the 95% CIs between the groups did not overlap and overall between-group (Qb) differences were not statistically significant at a two-tailed z-alpha (p) value ≤ 0.05. Post hoc, a decision was made to conduct simple meta-regression analyses between changes in TUG scores and age, sex, comorbidities, medication use, and setting if there were at least 10 effect sizes for the association of interest [35]. Meta-regression was conducted based on the IVhet model, an approach that includes a built-in multiplicative component of residual heterogeneity. Based on study weights from the IVhet model and to calculate matching error variances, robust Huber–Eicker–White sandwich error variances were used to account for the underestimated variance in the regression model. Such standard errors are intended to generate correct standard errors for heterogeneous data that is usually heteroskedastic [43]. Meta-regression was reported as the slope coefficient (b1), standard error (SE) and 95% CI. A two-tailed t-value ≤ 0.05 was considered statistically significant.

2.8.5. Software for Statistical Analysis and Those Responsible for Analysis

All statistical analyses were conducted using Meta XL (version 5.3), Stata SE (version 16.1), the user-written routine ‘admetan’ in Stata, as well as the user-written routine ‘lfk’ in Stata. The first author (JP) initially conducted all statistical analyses except the post hoc meta-regression analyses, the latter of which were conducted by the second author (GAK). The second author (GAK) then replicated all analyses initially conducted by the first author (JP). Any differences were resolved by consensus regarding which analysis was correct.

2.8.6. Confidence in Cumulative Evidence

The certainty of findings for the outcome of interest, mean differences in the TUG test, was evaluated using the Grading of Recommendations Assessment, Development and Evaluation (GRADE) instrument for meta-analysis [44]. The strength/certainty of evidence was assessed across the domains of risk of bias, consistency, directness, precision, and publication bias. Certainty was judged as high (further research is very unlikely to change one’s confidence in the estimate of effect), moderate (further research is likely to have an important impact on one’s confidence in the estimate of effect and may change the estimate), low (further research is very likely to have an important impact on one’s confidence in the estimate of effect and is likely to change the estimate), and very low (very uncertain about the estimate of effect). GRADE assessment was conducted using the same process as risk of bias assessment.

3. Results

3.1. Search Results

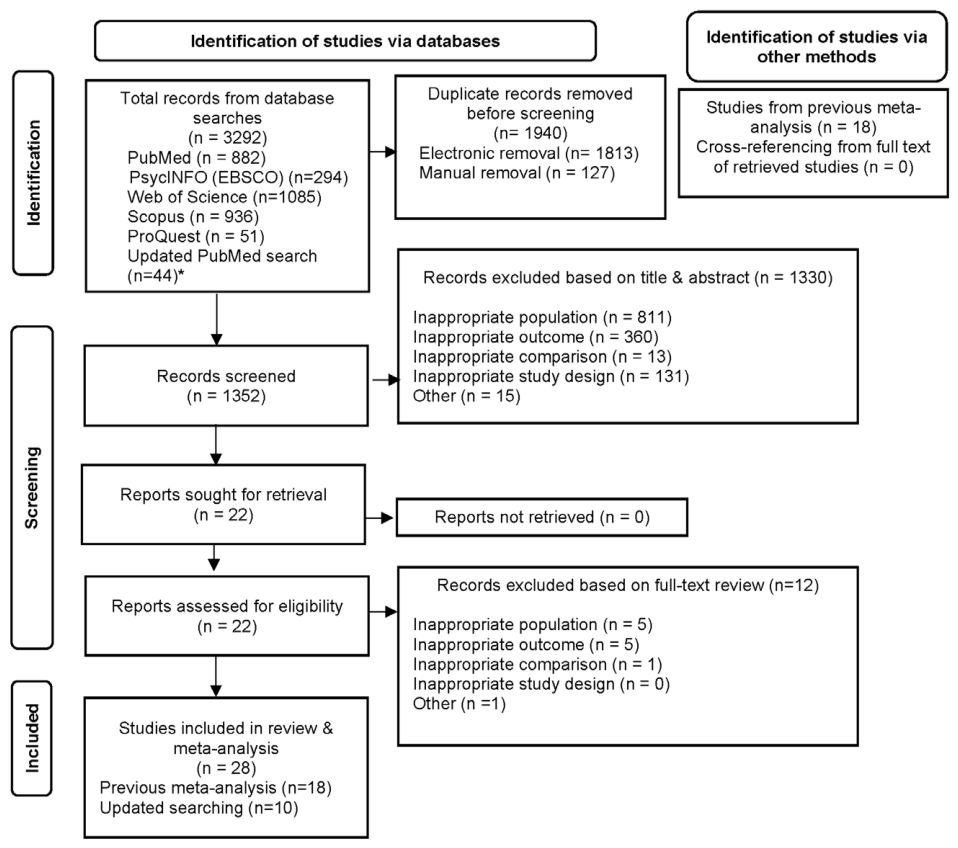
A flow diagram of the search process for potentially eligible studies is shown in Figure 1.
A total of 3292 references were initially screened. After removal of 1940 duplicates electronically (n = 1813) and manually (n = 127), a total of 1352 references remained. Of these, 1330 (98.4%) were excluded based on the title and abstract. The specific reasons for exclusion were as follows: (1) inappropriate population (60.8%), (2) inappropriate comparison (1.0%), (3) inappropriate outcome (27.2%), (4) inappropriate study design (9.8%), and (5) other (1.2%). Of the 22 references that underwent full-text review, 12 were excluded due to either inappropriate population (n = 5) [45,46,47,48,49], inappropriate comparison (n = 1) [50], inappropriate outcome (n = 5) [21,51,52,53,54], or other (n = 1) [55]. A reference list of the 12 studies that underwent full-text review but were excluded, including the reasons for exclusion, can be found in Table S2. Thus, a total of 28 studies were included [56,57,58,59,60,61,62,63,64,65,66,67,68,69,70,71,72,73,74,75,76,77,78,79,80,81,82,83], 18 from Silva et al.’s systematic review and meta-analysis [66,67,68,69,70,71,72,73,74,75,76,77,78,79,80,81,82,83], and 10 from the author’s updated searching [56,57,58,59,60,61,62,63,64,65]. The NNR was 135.

3.2. Study Characteristics

Table S3 provides a detailed description of the study and participant characteristics. All included studies were published in English-language peer-reviewed journals [56,57,58,59,60,61,62,63,64,65,66,67,68,69,70,71,72,73,74,75,76,77,78,79,80,81,82,83]. Thus, no translations were necessary. Timed up-and-go data were available from 27 studies (96.4%) [56,57,58,59,60,61,62,63,64,65,66,67,68,69,70,71,72,73,74,75,76,77,78,80,81,82,83], while data from one study were abstracted from the meta-analysis by Silva et al. [79]. Studies were published in 25 different journals with one-year impact factors ranging from 1.50 to 8.00 ( X ¯ ± S D , 3.32 ± 1.59, Median = 3.25) for the 26 studies (92.9%) in which impact factor data were available [56,57,58,59,60,61,62,63,64,65,66,67,68,69,70,71,72,73,74,75,76,77,78,79,80,81,82,83]. Studies were conducted in 14 different countries, six in the United States [60,70,73,74,76,78], four each in either Sweden [57,66,67,71] or Brazil [62,75,79,82], two each in Japan [80,81], Belgium [64,68], or Poland [58,83], and one each in either Canada [69], Australia [72], Taiwan [77], Israel [73], UK [59], Singapore [61], South Korea [63], or France [65]. With respect to types of conditions, 11 studies (39.29%) included more than one cognitively impaired group [57,58,64,67,68,70,75,78,79,80,81,83]. Specifically, and as defined by the original study authors, 7 of 19 (36.84%) included a mild AD group [58,66,68,75,79,80,82], 4 of 19 (21.05%) included a mild to moderate AD group [58,60,72,80], and 19 of 28 studies (67.86%) included a mild to severe AD group [57,58,59,60,63,64,65,66,67,68,69,70,71,72,75,77,79,80,82]. In addition, 18 of 28 studies (64.29%) included an MCI group [56,57,58,61,62,64,67,68,70,73,74,75,76,78,79,80,81,83], of which 4 of 18 (22.22%) were considered to be an aMCI group [74,78,80,83], and 2 of 18 (11.11%) a naMCI group [78,83]. For the control groups, 5 studies (17.86%) reported using matching procedures according to age and gender [64,66,71,72,76]. With respect to funding, 23 studies (82.14%) reported receiving funding from government, university, or private sources [56,57,58,59,60,61,64,65,67,69,70,71,72,73,74,75,76,77,78,79,80,81,82].

3.3. Participant Characteristics

The included studies represented up to 3092 patients and 37,561 healthy controls [56,57,58,59,60,61,62,63,64,65,66,67,68,69,70,71,72,73,74,75,76,77,78,79,80,81,82,83]. The number of females was larger than the number of males in both experimental (female vs. male, 1755 vs. 1239) and control (female vs. male, 19,246 vs. 18,176) groups, although three studies did not report information for gender [58,68,82]. The average age for the experimental and healthy control groups was 74.10 ± 8.08 yrs and 70.95 ± 7.62 yrs, respectively. However, because of a lack of data, age could not be calculated for 4 studies [58,59,63,68]. With respect to subtypes of patients who completed the TUG task, the number of those with AD was 1752 (mild AD = 420, mild to moderate AD = 377, and mild to severe AD = 969) [57,58,59,60,63,64,65,66,67,68,69,70,71,72,75,77,79,80,82]. In addition, there were 825 participants with MCI [56,57,58,61,62,64,67,68,70,73,75,76,79,81], 390 with aMCI [74,78,80,83] and 125 with naMCI [78,83]. Five studies (17.86%) included participants younger than 60 years [60,65,67,74,77], although the mean group ages in each study exceeded 60 years. Eight of 28 studies (28.57%) reported that one or more participants were taking some types of medication for other diseases: depression, diabetes mellitus, arthritis, osteoporosis, hypertension, congestive heart failure, pulmonary disease, coronary artery disease, thyroid disease, lung disease, liver disease, kidney disease [61,63,67,70,72,78,80,83].

3.4. Risk of Bias Assessment

Study and item-level risk of bias assessment using the JBI Critical Appraisal Tool are shown in Table S4. As shown, greater than 60% of the studies were at moderate to high risk of bias; (1) 4 of 28 studies (14.29%) presented sampling weaknesses [65,73,77,81], (2) 18 of 28 studies (64.29%) had confounding weaknesses [58,60,63,64,65,66,67,68,69,71,72,73,74,75,76,77,79,82], and (3) 1 of 18 studies (5.56%) had weaknesses in the analysis of their data [77].

3.5. TUG Test Results

3.5.1. MCI vs. HC

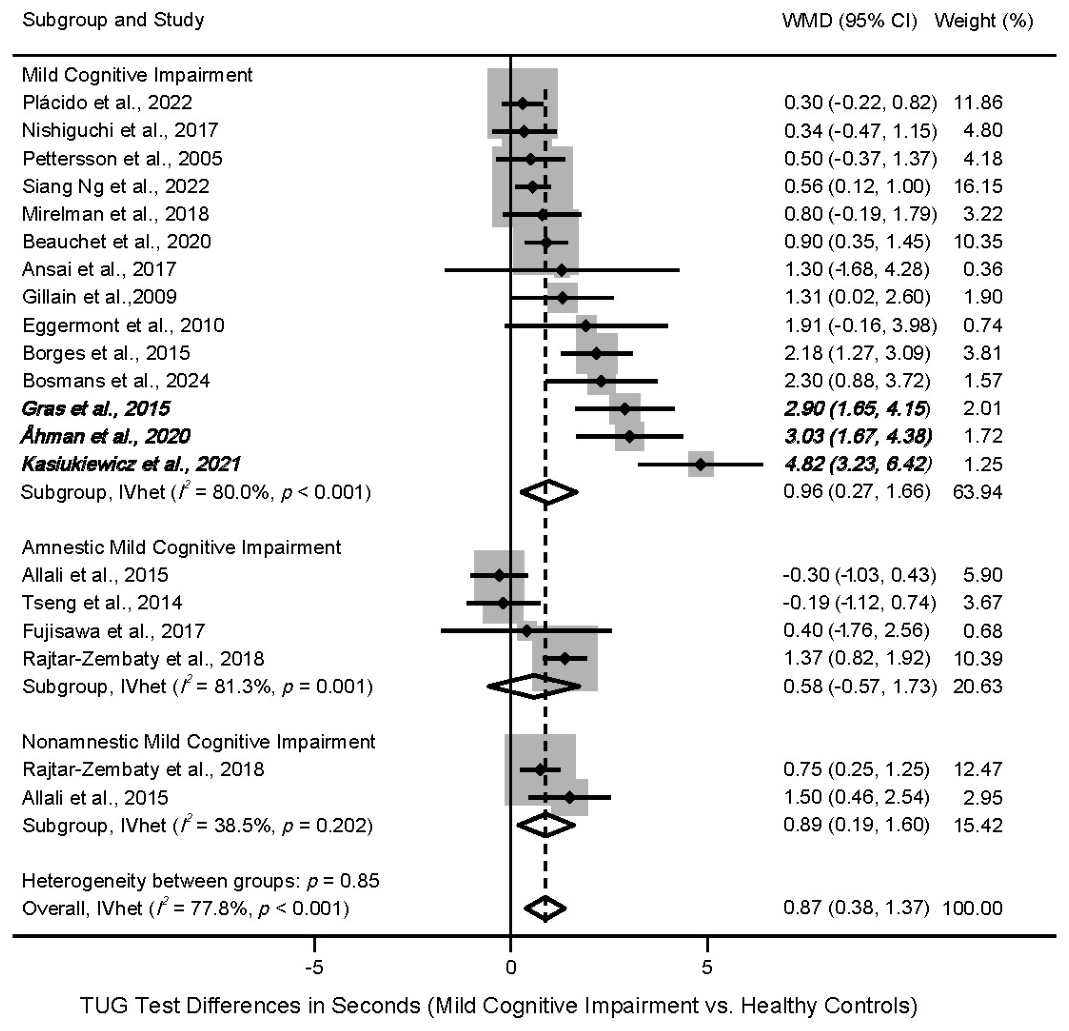
The overall results for differences in TUG test completion time between MCI and HC are shown in Table 1 and Figure 2. No differences in the statistical analysis of results occurred between the first and second authors.
A total of 20 studies representing 3420 participants were included (1340 with MCI and 2080 HC) [56,57,58,61,62,64,67,68,70,73,74,75,76,78,79,80,81,83]. The TUG scores ranged from 6.30 to 17.50 s in the MCI groups ( X ¯ ± SD = 9.71 ± 2.46) and 5.20 to 13.10 ( X ¯ ± SD = 8.51 ± 2.34) in HC. Across all groups, a significantly greater completion time, equivalent to a relative increase of 9.0% (95% CI, 3.9, 14.1%), was observed in the MCI versus HC groups. Statistically significant heterogeneity based on the Q statistic, as well as a large amount of inconsistency and a wide 95% CI based on I2 were found. The 95% PI included the null, although the majority of the interval was on the side of increased completion time for the MCI groups. At the individual study level, results ranged from a low of −0.30 (95% CI, −1.03, 0.43) to a high of 4.82 (95% CI, 3.23, 6.42) seconds. The Doi plot for small-study effects was suggestive of major asymmetry (LFK index = 2.51), possibly as a result of publication bias (Figure S2). With each result deleted from the model once, results remained statistically significant across all deletions, ranging from 0.76 (95% CI 0.28, 1.23) to 0.92 (95% CI, 0.44, 1.40) (Figure S3). With three outliers deleted from the model [57,58,76], all from the MCI group, results remained statistically significant, equivalent to a relative increase of 8.2% (95% CI, 4.3, 12.1%), across all groups. Statistically significant heterogeneity as well as moderate inconsistency, but a wide 95% CI for I2 were found. The 95% PI included the null, although barely. Across all studies, cumulative meta-analysis, ranked by year, showed that results have been statistically significant and relatively stable since the year 2017 (Figure S4).
Results for subgroup analyses partitioned according to MCI, aMCI, and naMCI groups are shown in Table 1 and Figure 2. With all studies included, significantly increased completion time, in seconds, was found for the MCI and naMCI groups but not the aMCI group. Based on the Q statistic, statistically significant heterogeneity was observed for the MCI and aMCI groups, but not the naMCI group. Large inconsistency based on I2, as well as a wide 95% CI, were observed for the MCI and aMCI groups, while a low amount of inconsistency but a wide 95% CI were observed for the naMCI group. The 95% PI included the null for both the MCI and aMCI groups, while the PI could not be calculated for the naMCI group because of the small number of effect sizes. Overlapping 95% CI was observed between all three groups with no statistically significant between-group differences found (Qb = 0.31, p = 0.85). Meta-regression was limited to age for MCI compared to HC, with no statistically significant association observed (b1 = 0.06, SE = 0.6, 95% CI, −0.06, 0.18, t = 1.10, p = 0.29).
Results for subgroup analyses with three outliers deleted from the model, all from the MCI group [57,58,76], are shown in Table 1. Statistically significant increased completion time, in seconds, continued to be observed for the MCI group, as well as statistically significant heterogeneity. Relative inconsistency based on I2 was reduced from high to moderate, but the 95% CI continued to be wide. In addition, the 95% PI continued to include the null. Given that no outliers were found for the aMCI and naMCI groups, the results were the same as when all studies for these subgroups were included. Similarly to the overall findings, overlapping 95% CI were observed between all three groups while no statistically significant between-group differences were observed (Qb = 0.22, p = 0.89).
The certainty of evidence for the TUG test in MCI versus HC is shown in Table S5. Based on GRADE, the certainty of evidence was considered very low both overall and for all subgroups.

3.5.2. AD vs. HC

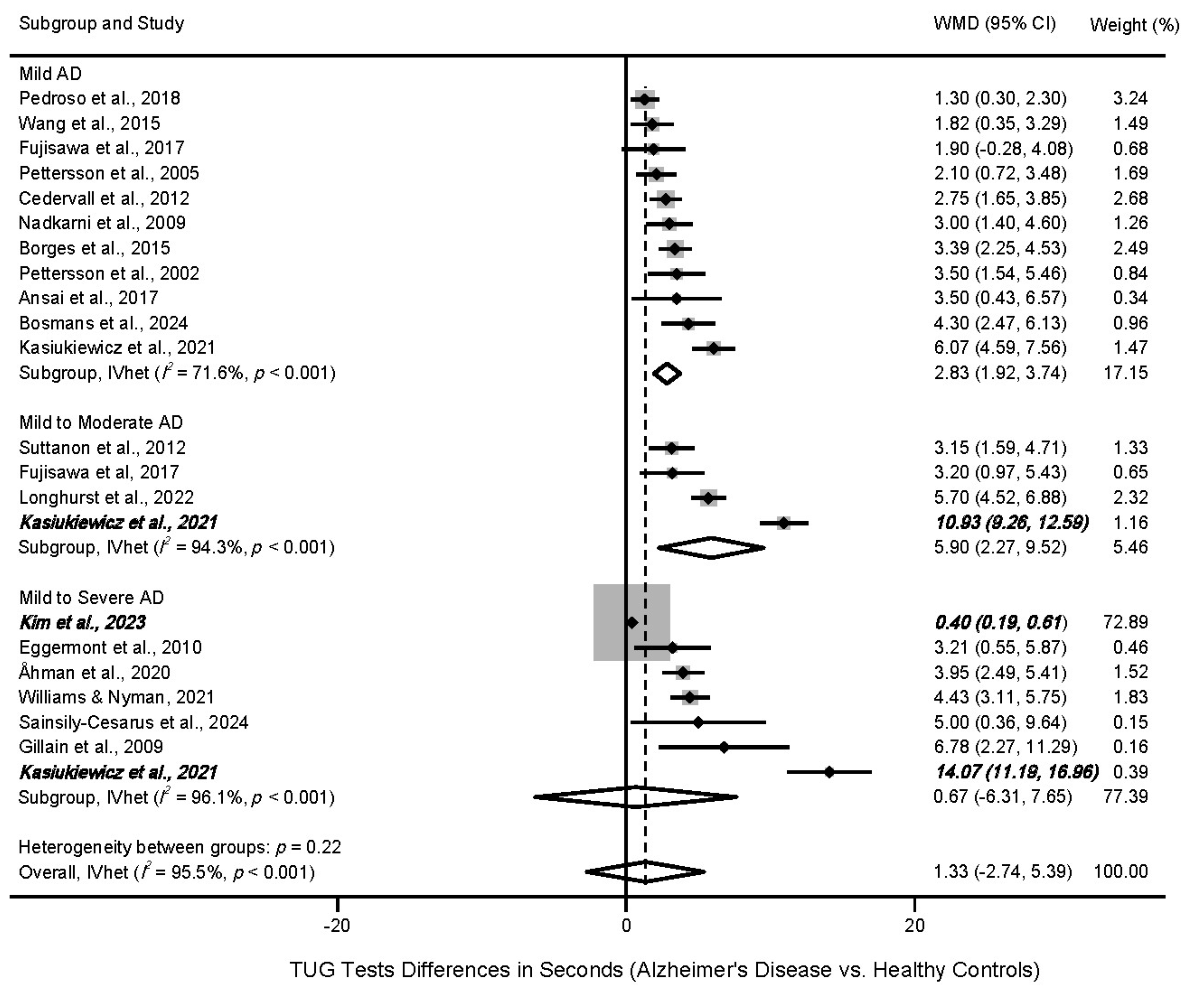
The overall results for differences in TUG test completion time between AD and HC are shown in Table 2 and Figure 3. A total of 22 studies representing 35,612 participants were included (1752 with AD and 33,860 HC) [57,58,59,60,63,64,65,66,67,68,69,70,71,72,75,77,79,80,82]. Scores for the TUG test ranged from 8.40 to 26.75 s in the AD groups ( X ¯ ± SD = 13.04 ± 11.39) and 7.10 to 14.36 ( X   ¯ ± SD = 10.17 ± 2.38) in HC. Across all groups, greater completion time equivalent to a relative increase of 10.2% (95% CI, −21.0, 41.4%) was observed in the AD versus HC groups. The overall pooled result was not statistically significant. Statistically significant heterogeneity based on the Q statistic, as well as a large amount of inconsistency, was observed. The 95% PI included the null and was wide. At the individual study level, all results except one did not include the null (0), ranging from a point-estimate low of 0.40 (95% CI, 0.19, 0.61) to a high of 14.07 (95% CI, 11.19, 16.96) seconds. The Doi plot for small-study effects was suggestive of major asymmetry (LFK index = 5.50), possibly attributed to publication bias (Figure S5). With each study deleted from the model once, results did not reach statistical significance except when the Kim et al. study was deleted from the model (Figure S6) [63].
Further examination revealed that this study contributed an inordinate amount of weight (72.9%) to the overall pooled result given its large and disproportionate sample size of 33,895 participants (694 AD, 33,185 HC), equivalent to 95.2% of the total number of participants pooled in the meta-analysis. With this study from the mild to severe AD subgroup deleted from the model, and despite its non-overlapping 95% CI (0.19, 0.61) and statistically significant result, statistically significant increases in TUG test time (z = 5.98, p < 0.001), equivalent to 28.2% (95% CI, 18.9, 37.4%), were observed in the AD versus HC groups. However, statistically significant heterogeneity (Q = 187.5, p < 0.001) and a large amount of inconsistency (I2 = 89.3%, 95% CI, 74.50, 94.22%) remained. The 95% PI included the null (−1.29, 8.93). Across all studies, cumulative meta-analysis, ranked by year, showed that results have been statistically significant since 2023 (Figure S7).
With the Kim et al. study [63], as well as two other outlier groups from the same study deleted from the model, one from the mild to moderate AD group and one from the mild to severe AD group [58], statistically significant increases in TUG test time equivalent to 25.5% (95% CI, 19.9, 31.2%) were observed in the AD versus HC groups. Statistically significant heterogeneity as well as a moderate amount of inconsistency with a wide 95% CI were observed. The 95% PI did not include the null.
Results for subgroup analyses partitioned according to mild, mild to moderate, and mild to severe AD are shown in Table 2 and Figure 3. With all studies included, significantly increased completion time, in seconds, was found for the mild and mild to moderate AD versus HC but not the mild to severe AD groups. Based on the Q statistic, statistically significant heterogeneity was observed for all three subgroups. Large inconsistency based on I2 was observed for the mild to moderate and mild to severe AD groups, while a moderate amount of inconsistency was found for the mild group. The 95% PI included the null for all three groups. Overlapping 95% CI was observed between all three groups with no statistically significant between-group differences found (Qb = 3.01, p = 0.22).
Results for subgroup analyses with the Kim et al. study [63], as well as two outlier groups from the same study deleted [58], are shown in Table 2. When compared to HC, statistically significant increased completion time, in seconds, was observed for all three groups. Statistically significant heterogeneity based on Q was observed for the mild and mild to moderate groups but not the mild to severe group. Relative inconsistency based on I2 was considered moderate for all three groups, but the 95% CI continued to be wide for the mild and mild-to-moderate groups. The 95% PI included the null for the mild group and mild to moderate groups, although the interval only slightly included the null for the mild group. In contrast, the PI did not include the null for the mild-to-severe group. Overlapping 95% CI was observed across all three groups, while no statistically significant between-group differences were observed, although there was a trend for such (Qb = 5.51, p = 0.06). Meta-regression was limited to age for Mild AD compared to HC, with no statistically significant association observed (b1 = 0.04, SE = 0.09, 95% CI, −0.18, 0.21, t = 0.21, p = 0.84).
The certainty of evidence for the TUG test in MCI versus HC is shown in Table S6. Based on GRADE, the certainty of evidence was considered very low both overall and for all subgroups.

4. Discussion

4.1. Overall Findings

The primary purpose of the current updated aggregate data systematic review with meta-analysis was to investigate the association between the TUG test and different types/stages of MCI and AD. The overall findings suggest very low certainty of evidence that the TUG test is associated with MCI and AD when compared to HC. For MCI, support for these findings are given by: (1) an increased completion time of 9.0% across all groups compared to HC, (2) continued existence of a statistically significant effect between all groups and HC when each result was deleted from the analysis once, (3) an increased completion time in MCI and naMCI groups compared to HC in subgroup analysis, and (4) similar findings across all groups and subgroups when outliers were deleted [57,58,76].
For the different stages of AD, evidence for increased TUG time in this group is supported by: (1) an increased completion time of 25.5% across all groups compared to HC when the Kim et al. study [63] and outliers [58] were deleted, (2) an increased completion time in mild AD and mild-to-moderate AD groups compared to HC in subgroup analysis, and (3) an increased completion time in all three AD groups compared to HC in subgroup analysis with outliers deleted.
For AD versus HC analyses, the Kim et al. [63] study contributed an inordinate amount of weight (72.89%) based on what the authors considered to be an odd sample size and distribution of 33,895 participants (694 AD, 33,185 HC). This comprised 95.2% of the total number of participants in the meta-analysis, creating dominance over the other included trials. Notably, the study itself reported a statistically significant increase in the AD versus HC group (0.40 s, 95% CI of 0.19, 0.61), but when pooled with the other studies, the overall results were not statistically significant. With its deletion, a statistically significant increased completion time for the TUG test in AD versus HC participants was found.
While the current findings are noteworthy, the certainty of evidence based on the GRADE assessment was considered very low for all MCI and AD analyses. These results suggest that the true effect in the current meta-analysis is likely to be substantially different from the actual estimate of effect, although the direction of that effect is not known. Collectively, factors related to this rating may include, but are not necessarily limited to, the following: (1) cross-sectional study design, (2) heterogeneity and inconsistency observed, (3) imprecision based on 95% PI, (4) potential publication bias, and (5) lack of accounting for potential confounders (age, etc.).
The quantitative findings of the current updated meta-analysis are generally similar to those of the original meta-analysis of Silva et al. [22], from which the current update derived. Specifically, with the Kim et al. study deleted from the analysis [63], seven of the eight pooled analyses (87.5%) were similar to those of Silva et al. [22]. However, one exception was the overall results for the naMCI subgroup analysis. This appears to be the possible result of a minor error in which Silva et al. [22] included the results for the aMCI versus naMCI group and the naMCI versus aMCI group from the study by Allali et al. [78]. In addition, based on the GRADE assessments, something the meta-analysis by Silva et al. did not report [22], the overall certainty of evidence was considered to be very low.
In addition to the previous systematic review and meta-analysis by Silva et al., in which the current update is based on [22], another very recent systematic review with meta-analysis on the association between the TUG test in those with MCI and AD was conducted by Orozco et al. [84]. Based on 25 studies of varying study designs, 15 of which were included in meta-analyses, the authors concluded that the TUG test could be used for early screening for older adults at risk of MCI and AD in both clinical and community settings [84]. However, several methodological differences exist compared to the current review. These include (1) pooling data for different study designs (cross-sectional, prospective cohort, case–control, quasi-experimental, randomized controlled) in the previous meta-analysis versus limiting to cross-sectional designs, (2) pooling results using a traditional random-effects model versus the IVhet model used in the current study [85], (3) calculation of 95% PI in the current meta-analysis, a statistic that provides one with a better estimate of true between-study heterogeneity and, thus, a better estimate of what results one might expect if they conducted their own study on this topic [38], (4) use of outlier analysis in the current meta-analysis, and (5) an assessment of the certainty of evidence based on GRADE in the current meta-analysis [84].

4.2. Implications for Research

The current findings suggest several areas to consider for future research on the association between the TUG and the different types/stages of MCI and AD. First, there appears to be a need for greater representation of aMCI and naMCI patients since only four studies included patients with aMCI [74,78,80,83] while two included patients with naMCI [78,83]. The same is true for those with mild to moderate AD. Second, future studies should consider concentrating on pre-clinical AD patients, as this information is critical for the development of clinical diagnostic tools aimed at determining the early onset of AD. This is especially important because effective interventions depend on proper timing; therefore, starting as early as possible may offer the best chance of therapeutic success [14]. Third, the need to combine those with mild to moderate AD as well as those with mild to severe AD for meta-analyses suggests future studies either focus on one subtype or conduct and report subgroup analyses according to subtype. Doing so will allow for more accurate analyses and precision-based screening recommendations. Fourth, since more than half of the studies were at moderate to high risk of bias with respect to confounding weaknesses, future studies should adopt more rigorous designs and statistical approaches to control for potential confounders. This includes, but is not necessarily limited to, studies that are adequately powered, i.e., avoiding both under and over-powered studies. Fifth, while the single-task TUG test is the most common type used, future original studies focused on the dual and/or triple-task TUG test may provide for stronger associations between MCI and AD when compared to HC. Finally, future research should consider patients younger than 60 years since early-onset AD tends to progress more aggressively and faster than the more common late-onset AD [2].

4.3. Implications for Practice

The very low certainty of evidence found in the current meta-analysis prevents us from making any strong, practice-based recommendations regarding the use of the TUG test in screening for MCI and AD. Given the former, further well-designed studies on this topic are needed before any level of certainty can be reached. Until such time, it appears plausible to suggest that clinicians and others adhere to recent guidelines, such as the 2025 Alzheimer’s Association clinical practice guideline for the diagnostic evaluation, testing, counseling, and disclosure of suspected Alzheimer’s disease and related disorders for determining MCI and AD [86].

4.4. Strengths and Potential Limitations

From the authors’ perspective, there are several strengths to the current meta-analysis. These include (1) an updated systematic review with meta-analysis on an important topic based on the most recently available studies and a rigorous design, (2) use of more robust statistical methods not previously used (IVhet model for pooling, Doi plot and LFK index for small-study effects, 95% PIs), (3) use of additional statistical methods not previously used to help establish the sensitivity of findings (outlier analysis), and (4) use of GRADE to determine the certainty of evidence.
In addition to strengths, several limitations should be mentioned. First, like any systematic review, with or without meta-analysis, the current study inherited the weaknesses of the original studies included (lack of control for potential confounders, etc.). Second, based on the small-study effects analysis, publication bias may have influenced the pooled results, as studies with statistically significant outcomes may have been more likely to be published. Third, some of the subgroups analyzed (aMCI, naMCI, mild to moderate AD) consisted of a small number of studies, thereby limiting the ability to derive any strong conclusions for these groups. Fourth, there was a large amount of heterogeneity and inconsistency for most analyses, something that is common in meta-analysis. Fifth, there was, overall, a large amount of imprecision as judged by 95% PIs that tended to be wide and include the null. Sixth, and derived from the above five limitations, the certainty of evidence, as previously mentioned, was considered very low for all analyses, suggesting extreme caution in drawing any strong conclusions from the current findings. Seventh, the results observed may not be generalizable to patients not included in the current meta-analysis, for example, patients younger than 60 years of age. Eighth, based on differential reporting, the authors were unable to examine the association between TUG score differences and age for selected cognitive subgroups, as well as sex, comorbidities, the impact of different medications used in individual patient groups on disease progression, and setting for all cognitive subgroups. However, it is important to realize that most subgroup, moderator, and regression analyses are considered exploratory in an aggregate data meta-analysis, and thus, hypothesis generating rather than causal. In addition, it is well established that most examinations for heterogeneity in meta-analyses do little to reduce it. Ninth, and as previously mentioned, the current study was limited to the most commonly used TUG test (single task). However, a focus on dual and/or triple-task TUG tests may have yielded greater associations between MCI and AD groups when compared to HCs. However, only seven studies in the current meta-analysis also included the dual-task TUG test [57,58,60,67,71,72,75], while one included a triple-task TUG test [75]. Tenth, while all included studies were identified in PubMed, there is the possibility that the most recent search, limited to PubMed over approximately 5 months, may have missed studies listed in other databases but not indexed in PubMed. Finally, like any aggregate data meta-analysis, the potential for ecological fallacy exists.

5. Conclusions

There is very low-certainty evidence that TUG completion time is associated with MCI and AD when compared to HC, suggesting that the true effects are likely to be substantially different from the estimates observed, although the direction of that effect is not known. Additional, well-designed studies are needed before any level of certainty can be established.

Supplementary Materials

The following supporting information can be downloaded at: https://www.mdpi.com/article/10.3390/app16115395/s1, Table S1: PRISMA 2020 checklist, Figure S1: Electronic Database Searches, Table S2: References that underwent full-text review, but were excluded, including reasons for exclusion, Table S3: Description of study and participants characteristics from each study that met the inclusion criteria, Table S4: Study-level risk of bias results using the Joanna Briggs Institute Critical Appraisal Tool, Figure S2: Doi plot of small-study effects for timed up and go (TUG) test differences between mild cognitive impairment (MCI) and healthy controls (HC), Figure S3: Influence analysis, i.e., leave-one-out analysis, for timed up and go (TUG) test differences between mild cognitive impairment (MCI) and healthy controls (HC), Figure S4: Cumulative meta-analysis, ranked by year, for timed up and go (TUG) test differences between mild cognitive impairment (MCI) and healthy controls (HC), Table S5: GRADE results for timed up and go (TUG) test differences between mild cognitive impairment (MCI) and healthy controls (HC), Figure S5: Doi plot of small-study effects for timed up and go (TUG) test differences between Alzheimer’s disease (AD) and healthy controls (HC), Figure S6: Influence analysis, i.e., leave-one-out analysis, for timed up and go (TUG) test differences between Alzheimer’s disease (AD) and healthy controls (HC), Figure S7: Cumulative meta-analysis, ranked by year, for timed up and go (TUG) test differences between Alzheimer’s disease AD) and healthy controls (HC), Table S6: GRADE Results for timed up and go (TUG) test differences between Alzheimer’s disease (AD) and healthy controls (HC).

Author Contributions

J.P. was responsible for the conception and design, acquisition of data, analysis and interpretation of data, drafting the initial manuscript and revising it critically for important intellectual content. G.A.K. was responsible for the conception and design, acquisition of data, analysis and interpretation of data, and reviewing the initial manuscript for important intellectual content. G.A.K. is the guarantor of the review. All authors have read and agreed to the published version of the manuscript.

Funding

This research received no external funding.

Institutional Review Board Statement

Not applicable. No Institutional Review Board approval was needed since this was an aggregate data systematic review with meta-analysis of summary data from previously published studies.

Informed Consent Statement

Not applicable. This was an aggregate data systematic review with meta-analysis of summary data from previously published studies.

Data Availability Statement

All data are available from the corresponding author upon reasonable request.

Conflicts of Interest

The authors declare no conflicts of interest associated with this project.

Abbreviations

The following abbreviations are used in this manuscript:
TUGTimed Up and Go
MCIMild cognitive impairment
naMCINo amnestic Mild cognitive impairment
aMCIAmnestic Mild cognitive impairment
ADAlzheimer’s disease
HCHealthy controls
PRISMAPreferred Reporting Items for Systematic Reviews and Meta-Analyses
PRISMA-PPreferred Reporting Items for Systematic Reviews and Meta-Analysis Protocols
NNRNumber of needed-to-read
MASTERMethodologicAl STandards for Epidemiological Research
JBIJoanna Briggs Institute
NINCDS-ADRDAAlzheimer’s Association workgroup and National Institutes of Health workgroup
NIA-AANational Institute on Aging and Alzheimer’s Association
GUGGet up and go
IVhetInverse variance heterogeneity
WMDWeighted mean difference
DLDersimonian and Laird
CIConfidence interval
PIPrediction interval
b1Slope coefficient
SEStandard error
SDStandard deviation
GRADEGrading of Recommendations Assessment, Development and Evaluation

References

  1. Rajan, K.B.; Weuve, J.; Barnes, L.L.; McAninch, E.A.; Wilson, R.S.; Evans, D.A. Population estimate of people with clinical Alzheimer’s disease and mild cognitive impairment in the United States (2020–2060). Alzheimer’s Dement. 2021, 17, 1966–1975. [Google Scholar] [CrossRef]
  2. Hendriks, S.; Peetoom, K.; Bakker, C.; van der Flier, W.M.; Papma, J.M.; Koopmans, R.; Verhey, F.R.J.; de Vugt, M.; Köhler, S.; Young-Onset Dementia Epidemiology Study Group; et al. Global prevalence of young-onset dementia: A systematic review and meta-analysis. JAMA Neurol. 2021, 78, 1080–1090. [Google Scholar] [CrossRef]
  3. Alzheimer’s Association. 2023 Alzheimer’s disease facts and figures. Alzheimer’s Dement. 2023, 19, 1598–1695. [Google Scholar] [CrossRef]
  4. Chi, W.; Graf, E.; Hughes, L.; Hastie, J.; Khatutsky, G.; Shuman, S.; Lamont, H. Community-Dwelling Older Adults with Dementia and Their Caregivers: Key Indicators from the National Health and Aging Trends Study; Office of the Assistant Secretary for Planning and Evaluation: Washington, DC, USA, 2019. Available online: https://aspe.hhs.gov/reports/community-dwelling-older-adults-dementia-their-caregivers-key-indicators-national-health-aging-0 (accessed on 1 October 2024).
  5. Spillman, B.C.; Wolff, J.; Freedman, V.A.; Kasper, J.D. Informal Caregiving for Older Americans: An Analysis of the 2011 National Study of Caregiving; Office of the Assistant Secretary for Planning and Evaluation: Washington, DC, USA, 2014. Available online: https://aspe.hhs.gov/reports/informal-caregiving-older-americans-analysis-2011-national-study-caregiving (accessed on 1 October 2024).
  6. Cummings, J.L.; Morstorf, T.; Zhong, K. Alzheimer’s disease drug-development pipeline: Few candidates, frequent failures. Alzheimer’s Res. Ther. 2014, 6, 37. [Google Scholar] [CrossRef]
  7. Byard, R.W.; Langlois, N.E. Wandering dementia—A syndrome with forensic implications. J. Forensic Sci. 2019, 64, 443–445. [Google Scholar] [CrossRef] [PubMed]
  8. Ganguli, M.; Dodge, H.H.; Shen, C.; Pandav, R.S.; DeKosky, S.T. Alzheimer disease and mortality: A 15-year epidemiological study. Arch. Neurol. 2005, 62, 779–784. [Google Scholar] [CrossRef] [PubMed]
  9. Tom, S.E.; Hubbard, R.A.; Crane, P.K.; Haneuse, S.J.; Bowen, J.; McCormick, W.C.; McCurry, S.; Larson, E.B. Characterization of dementia and Alzheimer’s disease in an older population: Updated incidence and life expectancy with and without dementia. Am. J. Public Health 2015, 105, 408–413. [Google Scholar] [CrossRef]
  10. Vermunt, L.; Sikkes, S.A.; Van Den Hout, A.; Handels, R.; Bos, I.; Van Der Flier, W.M.; Kern, S.; Ousset, P.-J.; Maruff, P.; Skoog, I.; et al. Duration of preclinical, prodromal, and dementia stages of Alzheimer’s disease in relation to age, sex, and APOE genotype. Alzheimer’s Dement. 2019, 15, 888–898. [Google Scholar] [CrossRef]
  11. Goldman, D.; Malzbender, K.; Lavin-Mena, L. Key Barriers for Clinical Trials for Alzheimer’s Disease; USC Schaeffer Center White Paper; USC Schaeffer Institute for Public Policy & Government Service: Washington, DC, USA, 2020; Volume 17, Available online: https://schaeffer.usc.edu/research/key-barriers-for-clinical-trials-for-alzheimers-disease/ (accessed on 1 October 2024).
  12. Klafki, H.-W.; Staufenbiel, M.; Kornhuber, J.; Wiltfang, J. Therapeutic approaches to Alzheimer’s disease. Brain 2006, 129, 2840–2855. [Google Scholar] [CrossRef]
  13. Pardo-Moreno, T.; González-Acedo, A.; Rivas-Domínguez, A.; García-Morales, V.; García-Cozar, F.J.; Ramos-Rodríguez, J.J.; Melguizo-Rodríguez, L. Therapeutic approach to Alzheimer’s disease: Current treatments and new perspectives. Pharmaceutics 2022, 14, 1117. [Google Scholar] [CrossRef]
  14. Dubois, B.; Hampel, H.; Feldman, H.H.; Scheltens, P.; Aisen, P.; Andrieu, S.; Bakardjian, H.; Benali, H.; Bertram, L.; Blennow, K. Preclinical Alzheimer’s disease: Definition, natural history, and diagnostic criteria. Alzheimer’s Dement. 2016, 12, 292–323. [Google Scholar] [CrossRef]
  15. Hansson, O. Biomarkers for neurodegenerative diseases. Nat. Med. 2021, 27, 954–963. [Google Scholar] [CrossRef]
  16. Wittenberg, R.; Knapp, M.; Karagiannidou, M.; Dickson, J.; Schott, J.M. Economic impacts of introducing diagnostics for mild cognitive impairment Alzheimer’s disease patients. Alzheimer’s Dement. Transl. Res. Clin. Interv. 2019, 5, 382–387. [Google Scholar] [CrossRef]
  17. Mattke, S.; Cho, S.K.; Bittner, T.; Hlávka, J.; Hanson, M. Blood-based biomarkers for Alzheimer’s pathology and the diagnostic process for a disease-modifying treatment: Projecting the impact on the cost and wait times. Alzheimer’s Dement. Diagn. Assess. Dis. Monit. 2020, 12, e12081. [Google Scholar] [CrossRef]
  18. Albers, M.W.; Gilmore, G.C.; Kaye, J.; Murphy, C.; Wingfield, A.; Bennett, D.A.; Boxer, A.L.; Buchman, A.S.; Cruickshanks, K.J.; Devanand, D.P. At the interface of sensory and motor dysfunctions and Alzheimer’s disease. Alzheimer’s Dement. 2015, 11, 70–98. [Google Scholar] [CrossRef]
  19. Kourtis, L.C.; Regele, O.B.; Wright, J.M.; Jones, G.B. Digital biomarkers for Alzheimer’s disease: The mobile/wearable devices opportunity. npj Digit. Med. 2019, 2, 9. [Google Scholar] [CrossRef] [PubMed]
  20. Jeon, Y.; Kang, J.; Kim, B.C.; Lee, K.H.; Song, J.-I.; Gwak, J. Early Alzheimer’s disease diagnosis using wearable sensors and multilevel gait assessment: A machine learning ensemble approach. IEEE Sens. J. 2023, 23, 10041–10053. [Google Scholar] [CrossRef]
  21. Serra-Añó, P.; Pedrero-Sánchez, J.F.; Hurtado-Abellán, J.; Inglés, M.; Espí-López, G.V.; López-Pascual, J. Mobility assessment in people with Alzheimer disease using smartphone sensors. J. Neuroeng. Rehabil. 2019, 16, 103. [Google Scholar] [CrossRef]
  22. de Oliveira Silva, F.; Ferreira, J.V.; Placido, J.; Chagas, D.; Praxedes, J.; Guimaraes, C.; Batista, L.A.; Marinho, V.; Laks, J.; Deslandes, A.C. Stages of mild cognitive impairment and Alzheimer’s disease can be differentiated by declines in timed up and go test: A systematic review and meta-analysis. Arch. Gerontol. Geriatr. 2019, 85, 103941. [Google Scholar] [CrossRef] [PubMed]
  23. Garner, P.; Hopewell, S.; Chandler, J.; MacLehose, H.; Schünemann, H.J.; Akl, E.A.; Beyene, J.; Chang, S.; Churchill, R.; Dearness, K.; et al. When and how to update systematic reviews: Consensus and checklist. BMJ 2016, 354, i3507. [Google Scholar] [CrossRef]
  24. Page, M.J.; Moher, D.; Bossuyt, P.M.; Boutron, I.; Hoffmann, T.C.; Mulrow, C.D.; Shamseer, L.; Tetzlaff, J.M.; Akl, E.A.; Brennan, S.E.; et al. PRISMA 2020 explanation and elaboration: Updated guidance and exemplars for reporting systematic reviews. BMJ 2021, 372, n160. [Google Scholar] [CrossRef]
  25. Moher, D.; Shamseer, L.; Clarke, M.; Ghersi, D.; Liberati, A.; Petticrew, M.; Shekelle, P.; Stewart, L.A.; PRISMA-P Group. Preferred reporting items for systematic review and meta-analysis protocols (PRISMA-P) 2015 statement. Syst. Rev. 2015, 4, 1. [Google Scholar] [CrossRef]
  26. McKhann, G.; Drachman, D.; Folstein, M.; Katzman, R.; Price, D.; Stadlan, E.M. Clinical diagnosis of Alzheimer’s disease: Report of the NINCDS-ADRDA Work Group under the auspices of Department of Health and Human Services Task Force on Alzheimer’s Disease. Neurology 1984, 34, 939. [Google Scholar] [CrossRef] [PubMed]
  27. Hyman, B.T.; Phelps, C.H.; Beach, T.G.; Bigio, E.H.; Cairns, N.J.; Carrillo, M.C.; Dickson, D.W.; Duyckaerts, C.; Frosch, M.P.; Masliah, E.; et al. National Institute on Aging–Alzheimer’s Association guidelines for the neuropathologic assessment of Alzheimer’s disease. Alzheimer’s Dement. 2012, 8, 1–13. [Google Scholar] [CrossRef] [PubMed]
  28. Polakova, P.; Klimova, B. Using DeepL translator in learning English as an applied foreign language– An empirical pilot study. Heliyon 2023, 9, e18595. [Google Scholar] [CrossRef]
  29. Huang, M.; Névéol, A.; Lu, Z. Recommending MeSH terms for annotating biomedical articles. J. Am. Med. Inform. Assoc. 2011, 18, 660–667. [Google Scholar] [CrossRef]
  30. Lee, E.; Dobbins, M.; DeCorby, K.; McRae, L.; Tirilis, D.; Husson, H. An optimal search filter for retrieving systematic reviews and meta-analyses. BMC Med. Res. Methodol. 2012, 12, 51. [Google Scholar] [CrossRef] [PubMed]
  31. Stone, J.C.; Glass, K.; Clark, J.; Ritskes-Hoitinga, M.; Munn, Z.; Tugwell, P.; Doi, S.A. The MethodologicAl STandards for Epidemiological Research (MASTER) scale demonstrated a unified framework for bias assessment. J. Clin. Epidemiol. 2021, 134, 52–64. [Google Scholar] [CrossRef] [PubMed]
  32. Ahmed, A.I.; Kaleem, M.Z.; Elshoeibi, A.M.; Elsayed, A.M.; Mahmoud, E.; Khamis, Y.A.; Furuya-Kanamori, L.; Stone, J.C.; Doi, S.A. MASTER scale for methodological quality assessment: Reliability assessment and update. J. Evid.-Based Med. 2024, 17, 263–266. [Google Scholar] [CrossRef]
  33. Moola, S.; Munn, Z.; Tufanaru, C.; Aromataris, E.; Sears, K.; Sfetcu, R.; Currie, M.; Qureshi, R.; Mattis, P.; Lisy, K. Systematic reviews of etiology and risk. JBI Man. Evid. Synth. 2020, 1, 217–269. [Google Scholar] [CrossRef]
  34. Ahn, S.; Becker, B.J. Incorporating quality scores in meta-analysis. J. Educ. Behav. Stat. 2011, 36, 555–585. [Google Scholar] [CrossRef]
  35. Higgins, J.; Thomas, J.; Chandler, J.; Cumpston, M.; Li, T.; Page, M.; Welch, V. Cochrane Handbook for Systematic Reviews of Interventions; Version 6.5; Cochrane: London, UK, 2024; Available online: https://www.cochrane.org/authors/handbooks-and-manuals/handbook/current (accessed on 16 February 2025).
  36. Doi, S.A.; Barendregt, J.J.; Khan, S.; Thalib, L.; Williams, G.M. Advances in the meta-analysis of heterogeneous clinical trials I: The inverse variance heterogeneity model. Contemp. Clin. Trials 2015, 45, 130–138. [Google Scholar] [CrossRef]
  37. DerSimonian, R.; Laird, N. Meta-analysis in clinical trials revisited. Contemp. Clin. Trials 2015, 45, 139–145. [Google Scholar] [CrossRef]
  38. IntHout, J.; Ioannidis, J.P.; Rovers, M.M.; Goeman, J.J. Plea for routinely presenting prediction intervals in meta-analysis. BMJ Open 2016, 6, e010247. [Google Scholar] [CrossRef] [PubMed]
  39. Cochran, W.G. The combination of estimates from different experiments. Biometrics 1954, 10, 101–129. [Google Scholar] [CrossRef]
  40. Higgins, J.P.; Thompson, S.G.; Deeks, J.J.; Altman, D.G. Measuring inconsistency in meta-analyses. BMJ 2003, 327, 557–560. [Google Scholar] [CrossRef] [PubMed]
  41. Furuya-Kanamori, L.; Barendregt, J.J.; Doi, S.A. A new improved graphical and quantitative method for detecting bias in meta-analysis. JBI Evid. Implement. 2018, 16, 195–203. [Google Scholar] [CrossRef]
  42. Furuya-Kanamori, L. LFK: Stata Module to Compute LFK Index and Doi Plot for Detection of Publication Bias in Meta-Analysis. 2021. Available online: https://econpapers.repec.org/software/bocbocode/s458762.htm (accessed on 3 January 2019).
  43. Thompson, S.G.; Sharp, S.J. Explaining heterogeneity in meta-analysis: A comparison of methods. Stat. Med. 1999, 18, 2693–2708. [Google Scholar] [CrossRef]
  44. Guyatt, G.; Oxman, A.D.; Akl, E.A.; Kunz, R.; Vist, G.; Brozek, J.; Norris, S.; Falck-Ytter, Y.; Glasziou, P.; DeBeer, H.; et al. GRADE guidelines: 1. Introduction—GRADE evidence profiles and summary of findings tables. J. Clin. Epidemiol. 2011, 64, 383–394. [Google Scholar] [CrossRef]
  45. Rajtar-Zembaty, A.; Rajtar-Zembaty, J.; Sałakowski, A.; Starowicz-Filip, A.; Skalska, A. Executive functions and working memory in motor control: Does the type of MCI matter? Appl. Neuropsychol. Adult 2020, 27, 580–588. [Google Scholar] [CrossRef]
  46. Borda, M.G.; Ferreira, D.; Selnes, P.; Tovar-Rios, D.A.; Jaramillo-Jiménez, A.; Kirsebom, B.-E.; Garcia-Cifuentes, E.; Dalaker, T.O.; Oppedal, K.; Sønnesyn, H.; et al. Timed Up and Go in people with subjective cognitive decline is associated with faster cognitive deterioration and cortical thickness. Dement. Geriatr. Cogn. Disord. 2022, 51, 63–72. [Google Scholar] [CrossRef]
  47. Boquete-Pumar, C.; Álvarez-Salvago, F.; Martínez-Amat, A.; Molina-García, C.; De Diego-Moreno, M.; Jiménez-García, J.D. Influence of Nutritional Status and Physical Fitness on Cognitive Domains Among Older Adults: A Cross-Sectional Study. Healthcare 2023, 11, 2963. [Google Scholar] [CrossRef]
  48. Jiménez-García, J.D.; Ortega-Gómez, S.; Martínez-Amat, A.; Alvarez-Salvago, F. Associations of balance, strength, and gait speed with cognitive function in older individuals over 60 years: A cross-sectional study. Appl. Sci. 2024, 14, 1500. [Google Scholar] [CrossRef]
  49. Kocyigit, S.E.; Ates Bulut, E.; Aydin, A.E.; Dost, F.S.; Kaya, D.; Isik, A.T. The relationship between cognitive frailty, physical frailty and malnutrition in Turkish older adults. Nutrition 2024, 126, 112504. [Google Scholar] [CrossRef]
  50. Clemmensen, F.K.; Hoffmann, K.; Siersma, V.; Sobol, N.; Beyer, N.; Andersen, B.B.; Vogel, A.; Lolk, A.; Gottrup, H.; Høgh, P.; et al. The role of physical and cognitive function in performance of activities of daily living in patients with mild-to-moderate Alzheimer’s disease—A cross-sectional study. BMC Geriatr. 2020, 20, 513. [Google Scholar] [CrossRef]
  51. Knapstad, M.K.; Steihaug, O.M.; Aaslund, M.K.; Nakling, A.; Naterstad, I.F.; Fladby, T.; Aarsland, D.; Giil, L.M. Reduced Walking Speed in Subjective and Mild Cognitive Impairment: A Cross-Sectional Study. J. Geriatr. Phys. Ther. 2019, 42, E122–E128. [Google Scholar] [CrossRef] [PubMed]
  52. Plácido, J.; Ferreira, J.V.; de Oliveira, F.; Sant’Anna, P.; Monteiro-Junior, R.S.; Laks, J.; Deslandes, A.C. Association among 2-min step test, functional level and diagnosis of dementia. Dement. Neuropsychol. 2019, 13, 97–103. [Google Scholar] [CrossRef] [PubMed]
  53. Du, S.; Ma, X.; Wang, J.; Mi, Y.; Zhang, J.; Du, C.; Li, X.; Tan, H.; Liang, C.; Yang, T.; et al. Spatiotemporal gait parameter fluctuations in older adults affected by mild cognitive impairment: Comparisons among three cognitive dual-task tests. BMC Geriatr. 2023, 23, 603. [Google Scholar] [CrossRef]
  54. Qaisar, R.; Karim, A.; Iqbal, M.S.; Ahmad, F.; Shaikh, A.; Kamli, H.; Khamjan, N.A. A leaky gut contributes to postural dysfunction in patients with Alzheimer’s disease. Heliyon 2023, 9, e19485. [Google Scholar] [CrossRef]
  55. de Oliveira Silva, F.; Ferreira, J.V.; Plácido, J.; Chagas, D.; Praxedes, J.; Guimarães, C.; Batista, L.A.; Laks, J.; Deslandes, A.C. Gait analysis with videogrammetry can differentiate healthy elderly, mild cognitive impairment, and Alzheimer’s disease: A cross-sectional study. Exp. Gerontol. 2020, 131, 110816. [Google Scholar] [CrossRef] [PubMed]
  56. Beauchet, O.; Montembeault, M.; Allali, G. Brain gray matter volume associations with abnormal gait imagery in patients with mild cognitive impairment: Results of a cross-sectional study. Front. Aging Neurosci. 2019, 11, 364. [Google Scholar] [CrossRef]
  57. Åhman, H.B.; Cedervall, Y.; Kilander, L.; Giedraitis, V.; Berglund, L.; McKee, K.J.; Rosendahl, E.; Ingelsson, M.; Åberg, A.C. Dual-task tests discriminate between dementia, mild cognitive impairment, subjective cognitive impairment, and healthy controls—A cross-sectional cohort study. BMC Geriatr. 2020, 20, 258. [Google Scholar] [CrossRef]
  58. Kasiukiewicz, A.; Magnuszewski, L.; Swietek, M.; Wojszel, Z.B. The Performance of Dual-Task Tests Can Be a Combined Neuro-Psychological and Motor Marker of Mild Cognitive Impairment, Depression and Dementia in Geriatric Patients-A Cross-Sectional Study. J. Clin. Med. 2021, 10, 5358. [Google Scholar] [CrossRef]
  59. Williams, J.M.; Nyman, S.R. Age moderates differences in performance on the instrumented timed up and go test between people with dementia and their informal caregivers. J. Geriatr. Phys. Ther. 2021, 44, E150–E157. [Google Scholar] [CrossRef]
  60. Longhurst, J.K.; Rider, J.V.; Cummings, J.L.; John, S.E.; Poston, B.; Bradford, E.C.H.; Landers, M.R. A Novel Way of Measuring Dual-Task Interference: The Reliability and Construct Validity of the Dual-Task Effect Battery in Neurodegenerative Disease. Neurorehabil. Neural Repair 2022, 36, 346–359. [Google Scholar] [CrossRef]
  61. Ng, T.K.S.; Han, M.F.Y.; Loh, P.Y.; Kua, E.H.; Yu, J.; Best, J.R.; Mahendran, R. Differential associations between simple physical performance tests with global and specific cognitive functions in cognitively normal and mild cognitive impairment: A cross-sectional cohort study of Asian community-dwelling older adults. BMC Geriatr. 2022, 22, 798. [Google Scholar] [CrossRef]
  62. Plácido, J.; Ferreira, J.V.; Silva, F.O.; Ferreira, R.B.; Guimarães, C.; de Carvalho, A.N.; Laks, J.; Deslandes, A.C. Relationship Between Aerobic Capacity, Mobility, and Spatial Navigation in Healthy Individuals and Older Adults with Mild Cognitive Impairment: A Cross-Sectional Study. J. Aging Phys. Act. 2022, 30, 872–879. [Google Scholar] [CrossRef] [PubMed]
  63. Kim, S.J.; Kim, H.D. Association between serum lipid levels and lower-extremity functions in older adults with and without Alzheimer’s dementia in South Korea: A cross-sectional analysis. Arch. Gerontol. Geriatr. 2023, 115, 105116. [Google Scholar] [CrossRef] [PubMed]
  64. Bosmans, J.; Gommeren, H.; Gilles, A.; Mertens, G.; Van Ombergen, A.; Cras, P.; Engelborghs, S.; Vereeck, L.; Lammers, M.J.W.; Van Rompaey, V. Evidence of Vestibular and Balance Dysfunction in Patients with Mild Cognitive Impairment and Alzheimer’s Disease. Ear Hear. 2024, 45, 53–61. [Google Scholar] [CrossRef]
  65. Sainsily-Cesarus, A.; Schmitt, E.; Landre, L.; Botzung, A.; Rauch, L.; Demuynck, C.; Philippi, N.; de Sousa, P.L.; Mutter, C.; Cretin, B.; et al. Dementia with Lewy bodies and gait neural basis: A cross-sectional study. Alzheimer’s Res. Ther. 2024, 16, 170. [Google Scholar] [CrossRef] [PubMed]
  66. Pettersson, A.F.; Engardt, M.; Wahlund, L.O. Activity level and balance in subjects with mild Alzheimer’s disease. Dement. Geriatr. Cogn. Disord. 2002, 13, 213–216. [Google Scholar] [CrossRef] [PubMed]
  67. Pettersson, A.F.; Olsson, E.; Wahlund, L.O. Motor function in subjects with mild cognitive impairment and early Alzheimer’s disease. Dement. Geriatr. Cogn. Disord. 2005, 19, 299–304. [Google Scholar] [CrossRef]
  68. Gillain, S.; Warzee, E.; Lekeu, F.; Wojtasik, V.; Maquet, D.; Croisier, J.L.; Salmon, E.; Petermans, J. The value of instrumental gait analysis in elderly healthy, MCI or Alzheimer’s disease subjects and a comparison with other clinical tests used in single and dual-task conditions. Ann. Phys. Rehabil. Med. 2009, 52, 453–474. [Google Scholar] [CrossRef] [PubMed]
  69. Nadkarni, N.K.; Mawji, E.; McIlroy, W.E.; Black, S.E. Spatial and temporal gait parameters in Alzheimer’s disease and aging. Gait Posture 2009, 30, 452–454. [Google Scholar] [CrossRef][Green Version]
  70. Eggermont, L.H.; Gavett, B.E.; Volkers, K.M.; Blankevoort, C.G.; Scherder, E.J.; Jefferson, A.L.; Steinberg, E.; Nair, A.; Green, R.C.; Stern, R.A. Lower-extremity function in cognitively healthy aging, mild cognitive impairment, and Alzheimer’s disease. Arch. Phys. Med. Rehabil. 2010, 91, 584–588. [Google Scholar] [CrossRef]
  71. Cedervall, Y.; Kilander, L.; Aberg, A.C. Declining physical capacity but maintained aerobic activity in early Alzheimer’s disease. Am. J. Alzheimer’s Dis. Other Demen. 2012, 27, 180–187. [Google Scholar] [CrossRef]
  72. Suttanon, P.; Hill, K.D.; Said, C.M.; Logiudice, D.; Lautenschlager, N.T.; Dodd, K.J. Balance and mobility dysfunction and falls risk in older people with mild to moderate Alzheimer disease. Am. J. Phys. Med. Rehabil. 2012, 91, 12–23. [Google Scholar] [CrossRef]
  73. Mirelman, A.; Weiss, A.; Buchman, A.S.; Bennett, D.A.; Giladi, N.; Hausdorff, J.M. Association between performance on Timed Up and Go subtasks and mild cognitive impairment: Further insights into the links between cognitive and motor function. J. Am. Geriatr. Soc. 2014, 62, 673–678. [Google Scholar] [CrossRef] [PubMed]
  74. Tseng, B.Y.; Cullum, C.M.; Zhang, R. Older adults with amnestic mild cognitive impairment exhibit exacerbated gait slowing under dual-task challenges. Curr. Alzheimer Res. 2014, 11, 494–500. [Google Scholar] [CrossRef]
  75. Borges Sde, M.; Radanovic, M.; Forlenza, O.V. Functional mobility in a divided attention task in older adults with cognitive impairment. J. Mot. Behav. 2015, 47, 378–385. [Google Scholar] [CrossRef]
  76. Gras, L.Z.; Kanaan, S.F.; McDowd, J.M.; Colgrove, Y.M.; Burns, J.; Pohl, P.S. Balance and gait of adults with very mild Alzheimer disease. J. Geriatr. Phys. Ther. 2015, 38, 1–7. [Google Scholar] [CrossRef]
  77. Wang, W.-H.; Chung, P.-C.; Yang, G.-L.; Lin, C.-W.; Hsu, Y.-L.; Pai, M.-C. An inertial sensor based balance and gait analysis system. In Proceedings of the 2015 IEEE International Symposium on Circuits and Systems (ISCAS), Lisbon, Portugal, 24–27 May 2015; pp. 2636–2639. [Google Scholar] [CrossRef]
  78. Allali, G.; Annweiler, C.; Predovan, D.; Bherer, L.; Beauchet, O. Brain volume changes in gait control in patients with mild cognitive impairment compared to cognitively healthy individuals; GAIT study results. Exp. Gerontol. 2016, 76, 72–79. [Google Scholar] [CrossRef]
  79. Ansai, J.H.; Andrade, L.P.; Nakagawa, T.H.; Vale, F.A.C.; Caetano, M.J.D.; Lord, S.R.; Rebelatto, J.R. Cognitive correlates of timed up and go subtasks in older people with preserved cognition, mild cognitive impairment, and Alzheimer’s disease. Am. J. Phys. Med. Rehabil. 2017, 96, 700–705. [Google Scholar] [CrossRef] [PubMed]
  80. Fujisawa, C.; Umegaki, H.; Okamoto, K.; Nakashima, H.; Kuzuya, M.; Toba, K.; Sakurai, T. Physical function differences between the stages from normal cognition to moderate alzheimer disease. J. Am. Med. Dir. Assoc. 2017, 18, 368.e9–368.e15. [Google Scholar] [CrossRef] [PubMed]
  81. Nishiguchi, S.; Yorozu, A.; Adachi, D.; Takahashi, M.; Aoyama, T. Association between mild cognitive impairment and trajectory-based spatial parameters during timed up and go test using a laser range sensor. J. Neuroeng. Rehabil. 2017, 14, 78. [Google Scholar] [CrossRef] [PubMed]
  82. Pedroso, R.V.; Corazza, D.I.; Andreatto, C.A.A.; da Silva, T.M.V.; Costa, J.L.R.; Santos-Galduróz, R.F. Cognitive, functional and physical activity impairment in elderly with Alzheimer’s disease. Dement. Neuropsychol. 2018, 12, 28–34. [Google Scholar] [CrossRef]
  83. Rajtar-Zembaty, A.; Sałakowski, A.; Rajtar-Zembaty, J.; Starowicz-Filip, A.; Skalska, A. Slow gait as a motor marker of mild cognitive impairment? the relationships between functional mobility and mild cognitive impairment. Neuropsychol. Dev. Cogn. B Aging Neuropsychol. Cogn. 2019, 26, 521–530. [Google Scholar] [CrossRef]
  84. Serna Orozco, M.F.; Reinosa Rivera, H.; Jaramillo-Losada, J.; Payan-Salcedo, H.A.; Escudero, M.M. Association of the timed up and go test with Alzheimer’s disease: Systematic review and meta-analysis. J. Appl. Gerontol. 2025. Online ahead of print. [CrossRef]
  85. Kelley, G.A.; Kelley, K.S. Evolution of statistical models for meta-analysis and implications for best practice. Curr. Opin. Epidemiol. Public Health 2023, 2, 39–44. [Google Scholar] [CrossRef]
  86. Atri, A.; Dickerson, B.C.; Clevenger, C.; Karlawish, J.; Knopman, D.; Lin, P.J.; Norman, M.; Onyike, C.; Sano, M.; Scanland, S.; et al. The Alzheimer’s Association clinical practice guideline for the diagnostic evaluation, testing, counseling, and disclosure of suspected Alzheimer’s disease and related disorders (DETeCD-ADRD): Validated clinical assessment instruments. Alzheimer’s Dement. 2025, 21, e14335. [Google Scholar] [CrossRef]
Figure 1. PRISMA flow diagram. *, studies identified from updated search.
Applsci 16 05395 g001
Figure 2. TUG test differences in seconds (Mild cognitive impairment vs. Healthy controls) [56,57,58,61,62,64,67,68,70,73,74,75,76,78,79,80,81,83]. The dashed vertical line represents the overall pooled effect size for TUG score differences, in seconds, across all studies, while the solid vertical line represents the zero (0) point (null effect). The left and right sides of the hollowed diamonds represent the lower and upper 95% confidence intervals, while the middle of the hollow diamonds represents the pooled mean change for TUG score differences for the three subgroups as well as pooled across all groups. The left and right sides of the solid horizontal lines represent the lower and upper 95% confidence intervals, while the solid diamonds represent the pooled mean change for TUG score differences, in seconds, for each study. The gray shading for each study-level result represents the weight applied to that study. WMD, weighted mean difference. CI, confidence interval. IVhet, Inverse variance heterogeneity model. Three outlier studies [57,58,76] shown in bold and italics.
Applsci 16 05395 g002
Figure 3. TUG test differences in seconds (Alzheimer’s Disease vs. Healthy controls) [57,58,59,60,63,64,65,66,67,68,69,70,71,72,75,77,79,80,82]. The dashed vertical line represents the overall pooled effect size for TUG score differences, in seconds, across all studies, while the solid vertical line represents the zero (0) point (null effect). The left and right sides of the hollowed diamonds represent the lower and upper 95% confidence intervals, while the middle of the hollow diamonds represents the pooled mean change for TUG score differences for the three subgroups as well as pooled across all groups. The left and right sides of the solid horizontal lines represent the lower and upper 95% confidence intervals, while the solid diamonds represent the pooled mean change for TUG score differences, in seconds, for each study. The gray shading for each study-level result represents the weight applied to that study. WMD, weighted mean difference. CI, confidence interval. IVhet, Inverse variance heterogeneity model. Heavily weighted Kim et al. study [63] and two outlier groups from another study are shown in bold and italics.
Applsci 16 05395 g003
Table 1. TUG test results for MCI participants versus healthy controls.
VariableES (#)N (#) X ¯ (95% CI)z (p)Q (p)I2 (95% CI)95% PI
MCI
-All Groups2034200.87 (0.38, 1.37)3.48 (0.001) *85.5 (<0.001) **77.8% (41.9, 88.4)−0.84, 2.59
-MCI1420980.96 (0.27, 1.66)2.71 (0.007) *65.1 (<0.001) **80.0% (27.6, 90.8)−1.12, 3.04
-aMCI48300.58 (−0.57, 1.73)0.99 (0.32)16.1 (0.001) **81.3% (0, 94.6)−4.07, 5.24
-naMCI24920.89 (0.19, 1.59)2.50 (0.01) *1.6 (0.20)38.5% (0, 87.8)nac
MCI (Outliers Deleted) a
-All Groups 1731390.74 (0.39, 1.1)4.15 (<0.001) *40.1 (0.001) **60.1% (0.0, 79.1)0.0, 1.84
-MCI1118170.75 (0.34, 1.17)3.53 (<0.001) *21.3 (0.02) **53.1% (0.0, 78.4)−0.34, 1.85
-aMCI48300.58 (−0.57, 1.73)0.99 (0.32)16.1 (0.001) **81.3% (0.0, 94.6)−4.07, 5.24
-naMCI24920.89 (0.19, 1.59)2.49 (0.01) *1.6 (0.20)38.5% (0.0, 87.8)nac
Notes: a, Results with three outlier studies deleted; TUG, timed up-and-go test; MCI, mild cognitive impairment; aMCI, amnestic mild cognitive impairment; naMCi, non-amnestic mild cognitive impairment; ES (#), number of effect sizes; N (#), total number of participants; CI, confidence interval; Q, Cochran Q statistic for heterogeneity; PI, prediction interval; *, statistically significant (p ≤ 0.05); **, statistically significant, p ≤ 0.10; nac, not able to calculate (<3 effect sizes).
Table 2. TUG test results for AD participants versus healthy controls.
VariableES (#)N (#) X ¯ z (p)Q (p)I2 (95% CI)95% PI
AD
-All Groups2235,6121.33 (−2.74, 5.39)0.64 (0.52)463.57 (<0.001) **95.5% (70.5, 98.3)−5.98, 8.64
-Mild117192.83 (1.92, 3.74)6.11 (<0.001) *35.21 (<0.001) **71.6% (3.0, 86.7)−0.14, 5.71
-Mild-Moderate45435.90 (2.27, 9.52)3.19 (0.001) *52.81 (<0.001) **94.3% (0.8, 98.3) −10.39, 22.19
-Mild-Severe734,3500.67 (−6.31, 7.65)0.19 (0.85)153.44 (<0.001) **96.1% (0, 98.3)−12.67, 14.01
AD (Outliers Deleted) a
-All1916673.34 (2.59, 4.10)8.68 (<0.001) *61.99 (<0.001) **71.0% (30.4, 84.2)0.70, 6.16
-Mild117192.83 (1.92, 3.74)6.11 (<0.001) *35.21 (<0.001) **71.6% (3, 86.7)−0.04, 5.71
-Mild-Moderate35064.54 (2.54, 6.53)4.46 (<0.001) *8.17 (0.02) **75.5% (0.0, 93.6)−17.74, 26.81
-Mild-Severe54424.23 (3.34, 5.11)9.37 (<0.001) *2.13 (0.71)0.0% (0.0, 44.5)2.79, 5.67
Notes: a, results with two outlier studies and one overrepresented study deleted; TUG, timed up-and-go test; AD, Alzheimer’s disease; ES (#), number of effect sizes; N (#), total number of participants; CI, confidence interval; Q, Cochran Q statistic for heterogeneity; PI, prediction interval; *, statistically significant (p ≤ 0.05); **, statistically significant, p ≤ 0.10.
Disclaimer/Publisher’s Note: The statements, opinions and data contained in all publications are solely those of the individual author(s) and contributor(s) and not of MDPI and/or the editor(s). MDPI and/or the editor(s) disclaim responsibility for any injury to people or property resulting from any ideas, methods, instructions or products referred to in the content.