Article

Wearable-Derived Physiological Features Associated with Caregiver Burden: A Fitbit-Based Observational Study Toward Remote Monitoring of Caregiver Health Risk

1
Department of Computer Engineering, Sun Moon University, Asan 31460, Republic of Korea
2
Department of Psychiatry, Seoul National University College of Medicine, Seoul 07061, Republic of Korea
3
Division of Computer Science and Engineering, Sun Moon University, Asan 31460, Republic of Korea
*
Author to whom correspondence should be addressed.
Appl. Sci. 2026, 16(11), 5382; https://doi.org/10.3390/app16115382
Submission received: 30 April 2026 / Revised: 24 May 2026 / Accepted: 25 May 2026 / Published: 28 May 2026

Featured Application

The proposed wearable-based framework supports objective and continuous assessment of caregiver burden using multimodal physiological signals from consumer-grade devices. By integrating sleep variability, heart rate dynamics, and activity patterns, it captures real-world physiological responses beyond self-reported measures. This approach is well-suited for digital health monitoring, remote caregiver support, and personalized intervention systems, providing a scalable foundation for real-time stress detection and wearable-based healthcare analytics.

Abstract

Caregiver burden is a critical public health issue among individuals providing long-term care for family members with cognitive impairment and is closely associated with physiological stress. However, conventional assessments primarily rely on self-reported measures, which provide limited insight into underlying physiological processes and temporal dynamics. To address this limitation, we investigate the use of wearable-derived physiological and behavioral signals for the objective assessment of caregiver burden. We analyzed multimodal data collected from 78 informal caregivers using Fitbit devices, including heart rate, activity patterns, sleep architecture, and variability-based features aggregated over a 7-day window. Associations with caregiver burden, measured by the Zarit Burden Interview (ZBI), were evaluated using Spearman correlation with false discovery rate correction and multivariable regression models adjusted for demographic and clinical covariates. Variability in REM sleep duration showed an exploratory negative association with caregiver burden (ρ = −0.32, p = 0.004), with similar but weaker nominal patterns observed for light and total sleep variability. In multivariable analysis, maximum daily heart rate was positively associated with caregiver burden (β = 2.59, p = 0.005), although overall model performance was modest (R2 = 0.32, adjusted R2 = 0.08) and the full model did not reach statistical significance. These findings demonstrate that multimodal wearable signals may provide complementary objective insights into caregiver burden and support the evaluation of sleep variability and heart rate measures as candidate indicators.

1. Introduction

Caregiver burden is increasingly being recognized as a significant public health concern, particularly among individuals providing long-term care for family members with cognitive impairment. These caregivers experience persistent emotional, physical, and social challenges that adversely affect overall well-being [1]. Dementia caregiving is associated with substantial psychological and physical strain, driven by progressive cognitive decline, behavioral changes, and increasing care demands over time [2,3]. As a result, higher caregiver burden is associated with a range of adverse health outcomes including cognitive decline, elevated psychological stress, and poorer physical health. Additionally, increased burden is linked to significant sleep disturbances, which may further exacerbate fatigue and overall health risk [4,5,6].
Concurrently, global population aging has led to a steady increase in dementia prevalence, which is expected to significantly expand the population of informal caregivers worldwide [7]. This growing demand highlights the need for objective and scalable approaches to quantify and monitor caregiver burden. Recent advances in consumer-grade wearables, such as Fitbit devices, enable passive and continuous monitoring in real-world settings. These devices are increasingly being adopted in health research to capture longitudinal physiological and behavioral patterns and are becoming more widely accessible [8,9]. Wearable sensors provide multimodal data streams, including sleep-related features (e.g., sleep stages and architecture), cardiovascular signals (e.g., continuous heart rate), and activity-derived metrics (e.g., step count and active minutes), enabling the assessment of sleep quality, stress-related physiological responses, and daily functional status [10,11,12,13].
Despite advances in wearable technology, caregiver burden research remains largely dependent on self-reported questionnaires [14,15]. While these instruments capture subjective perceptions of stress, they provide limited insight into the underlying physiological burden of caregiving. Prior studies on caregiver sleep have similarly focused on isolated metrics, such as total sleep duration or summary sleep quality scores, rather than modeling interactions across physiological systems over time [16]. This limited scope constrains a comprehensive understanding of the biological mechanisms underlying caregiver burden.
The Zarit Burden Interview (ZBI), a widely used and validated self-report instrument, is one of the most common tools for quantifying caregiver burden [17,18,19] and has been validated across diverse populations and cultural contexts, demonstrating strong reliability and supporting cross-study comparability [20]. While the ZBI captures the perceived psychological, physical, and social impact of caregiving, its relationship with objective physiological signals remains poorly understood [15]. In particular, the association between ZBI scores and wearable-derived features, such as heart rate dynamics and sleep architecture from Fitbit devices, has not been well characterized [21]. Emerging studies have begun to link caregiver burden to disturbances in circadian physiology, moving beyond subjective fatigue measures. Notably, circadian heart rate rhythms have been proposed as a potential objective biomarker of physiological stability, with evidence suggesting increased vulnerability under chronic caregiving stress [22]. Recent studies using wearable-derived circadian and physiological data further support the relevance of digital health approaches in clinical populations [23,24].
The biological basis for expecting wearable-derived variability features to reflect caregiver burden lies in the overlap between chronic stress physiology and sleep–circadian regulation. Chronic caregiving stress can activate the hypothalamic–pituitary–adrenal (HPA) axis and sympathetic nervous system, contributing to elevated nocturnal cortisol and catecholamine activity, which may disrupt REM sleep and fragment sleep architecture [4,5]. Day-to-day instability in REM sleep duration may therefore reflect cumulative disruption of sleep homeostasis under persistent stress load. Circadian dysregulation—manifested as irregular sleep timing, reduced amplitude of the heart rate circadian rhythm, and blunted diurnal activity patterns—has been documented in dementia caregivers and linked to heightened burden [22]. Autonomic stress responses, including elevated resting and peak heart rate, may reflect sympathetic hyperactivation associated with sustained psychological and physical caregiving demands [23]. Together, these mechanisms support the use of sleep-stage variability and heart rate dynamics as theoretically grounded candidate indicators of caregiver physiological burden.
Building on these findings, this study systematically investigates the association between wearable-derived physiological data and caregiver burden quantified using the ZBI. Specifically, we analyze multimodal data from Fitbit devices, including heart rate, activity patterns, sleep features, and variability-based measures, as objective indicators of caregiving-related physiological stress. (H1) Caregiver burden is hypothesized to be associated with wearable-derived features across sleep, heart rate, and activity domains. (H2) Variability-based physiological features are hypothesized to be more strongly associated with caregiver burden than mean-based counterparts. (H3) These associations are hypothesized to remain significant after adjusting for relevant clinical and demographic covariates.
It is important to emphasize that this study is exploratory and hypothesis-generating. The observed associations should not be interpreted as definitive predictors of caregiver burden but as candidate signals requiring replication in larger, longitudinal samples.

2. Materials and Methods

2.1. Study Design and Participants

This observational study was conducted using clinical and wearable data derived from a previously established cohort of spousal caregivers (SCGs) of individuals with cognitive impairment, originally recruited from the geriatric psychiatry clinic at Chungnam National University Hospital between May 2020 and August 2023 [22]. The original cohort consisted of 104 caregivers who underwent comprehensive clinical assessments, including demographic, cognitive, and psychological evaluations.
The inclusion criteria for the cohort were as follows: (1) age between 55 and 90 years; (2) serving as the primary caregiver for a spouse; (3) ability to perform independent daily functioning; and (4) no diagnosis of dementia. All participants lived with the care recipient at the time of enrollment and completed standardized clinical assessments, including the Zarit Burden Interview (ZBI) and Pittsburgh Sleep Quality Index (PSQI).
A subset of participants voluntarily agreed to wear a Fitbit device for continuous physiological monitoring. Participants were instructed to wear the device daily for up to 14 consecutive days, during which multimodal physiological and behavioral data—including heart rate, physical activity, and sleep-related metrics—were collected. Among the original cohort, participants with at least one full day of valid wearable data and a completed ZBI assessment were included in the present analysis (n = 78).
Care-recipient cognitive status was classified into three categories—cognitively normal (CN), mild cognitive impairment (MCI), and dementia—based on standardized clinical assessments conducted at the geriatric psychiatry clinic, including the Mini-Mental State Examination (MMSE), clinical history, and clinical judgment by a board-certified geriatric psychiatrist. CN was defined as no objective cognitive impairment and a Clinical Dementia Rating (CDR) score of 0; MCI was defined as subjective or objective cognitive decline without functional impairment (CDR 0.5); and dementia was defined as cognitive impairment with functional decline (CDR ≥ 1). This classification was available for all 78 participants and was used as a covariate in sensitivity analyses (see Section 2.6).
This study represents a secondary analysis of the cohort, focusing on the association between wearable-derived physiological features and caregiver burden. The study protocol was approved by the Institutional Review Board of Chungnam National University Hospital, and all participants provided written informed consent prior to participation.

2.2. Fitbit Data Acquisition and Preprocessing

2.2.1. Data Access and Acquisition

Fitbit data were retrieved for each participant via the Fitbit Web API using the OAuth 2.0 Authorization Code flow. Each participant was linked to a personal Fitbit account. A study-specific application was registered to enable secure data access. Participants authorized access to activity, heart rate, sleep, and profile data. Data were collected on a daily basis across the monitoring period. All participants used Fitbit Charge 5 (model FB421; firmware version 57.20001.188.58; Fitbit Inc., San Francisco, CA, USA) throughout the monitoring period. Intraday step counts were obtained at 15-min resolution. Heart rate data were retrieved at 1-min resolution, along with daily summaries including resting, minimum, and maximum daily heart rate. Activity intensity data were recorded at 1-min resolution, with each epoch classified into sedentary, lightly active, fairly active, or very active categories. Sleep data were retrieved at both the session and stage levels using the Fitbit sleep API, providing information on sleep duration, sleep efficiency, time in bed, minutes asleep and awake, and stage-specific durations (deep, light, REM, and wake minutes).
Regarding device adherence, participants in this elderly caregiver cohort (mean age 72.4 years) were supported throughout the monitoring period by research staff who provided device orientation sessions and responded to technical queries. In the parent cohort (N = 104), 26 participants did not contribute usable wearable data, primarily due to early device return, difficulties with charging, or discomfort with continuous wear [22]. Among the 78 participants included in the present analysis, near-complete data capture was achieved (mean valid days = 7.0, range = 7–8), suggesting acceptable adherence among those who continued. The relatively high non-participation rate (25%) in the broader cohort reflects the known challenges of wearable adoption in older populations and should be considered a potential source of selection bias.

2.2.2. Data Preprocessing and Aggregation

Raw Fitbit data were preprocessed and aggregated to derive daily-level features for each participant. Intraday data were aligned on a daily basis and aggregated to hourly summaries where applicable. Sleep features were derived from the primary sleep session for each day. Heart rate features, including average, minimum, and maximum daily heart rate, were derived from aggregated hourly records. Activity features, including total steps, active hours, average steps per hour, and time spent across activity intensity levels, were derived from hourly summaries. The final dataset consisted of 20 daily features per participant-day. These daily features were further aggregated into 7-day windows, from which both mean-based and variability-based features were derived for subsequent analyses (see Section 2.3).

2.2.3. Participant Selection and Alignment of Wearable Data

To ensure temporal alignment between physiological data and caregiver burden assessment, a 7-day analysis window was defined for each participant as the seven consecutive days of Fitbit data closest to the ZBI administration date within the monitoring period. The timing of ZBI administration was recorded for all participants: 45 completed the ZBI prior to monitoring, 10 during the monitoring period, 7 on the first day, and 15 after the monitoring period.
The 7-day window was selected for three reasons: it aligns with established practice in wearable research for capturing stable physiological estimates [22,23]; it produced more stable inter-day standard deviation estimates than shorter windows, reducing the influence of single outlier days; and it was the longest window for which near-complete data could be guaranteed across all 78 participants within the 14-day monitoring protocol.
Participants were included in the final analysis (n = 78) if they provided at least one full day of valid wearable data alongside a valid ZBI score. The remaining 26 participants from the original cohort (N = 104) were excluded due to insufficient wearable data (fewer than one full valid day), missing ZBI assessments, or absence of clinical records. Data capture completeness within the 7-day window was verified for all included participants to ensure the stability of the derived mean and variability features.

2.2.4. Fitbit Measurement Validity

The validity of Fitbit-derived measurements has been evaluated in prior studies. For sleep, Fitbit-derived metrics have demonstrated acceptable sensitivity for detecting sleep epochs and moderate agreement with polysomnography for sleep stage classification under real-world conditions, although performance varies by device model and sleep stage [25,26]. For heart rate, optical heart rate estimates from Fitbit devices have shown strong correlations with ECG-derived measurements at rest and during moderate-intensity activity, with mean absolute percentage errors generally below 10% in free-living conditions [26]. Accuracy decreases during high-intensity physical activity, a known limitation of wearable heart rate sensors [27].

2.3. Regularity and Variability Features

To capture behavioral and physiological stability, variability-based features were derived from Fitbit data. Day-to-day variability was derived using the standard deviation of daily measures, including sleep duration, sleep stage composition (deep, light, and REM sleep), activity levels, and heart rate. The coefficient of variation (CV) was additionally derived for selected features to represent relative variability across days.
The use of daily mean heart rate as a central tendency measure is consistent with the circadian mesor framework, in which the mean level of a physiological signal over a defined period serves as a marker of baseline physiological load; the inter-day standard deviation of this mesor has similarly been employed as an index of day-to-day physiological stability in wearable-based digital health research [23].
Sleep fragmentation was approximated as the ratio of awake time to total time spent in bed. Heart rate dynamics were characterized using the daily heart rate range, defined as the difference between maximum and minimum heart rate values. Activity intensity balance was represented by moderate-to-vigorous physical activity (MVPA) minutes and the proportion of MVPA relative to total activity time. In addition, weekend–weekday differences were derived for sleep, activity, and heart rate features to capture shifts in behavioral patterns across the week. These features collectively reflect circadian and behavioral regularity, which are theoretically associated with caregiver stress-related physiological dysregulation in caregivers.

2.4. Missing Data Handling

Missing data were addressed using a two-stage approach applied across all Fitbit-derived features. In the first stage, short gaps in continuous time-series data (e.g., heart rate, step count, and sleep duration) were imputed using linear interpolation prior to aggregation while non-wear periods and extended gaps were excluded. In the second stage, residual missingness was handled using Multiple Imputation by Chained Equations (MICE), implemented via the Iterative Imputer with Bayesian Ridge regression and five imputed datasets [28]. Estimates were pooled across imputations according to Rubin’s rules [29]. This approach avoids the well-documented underestimation of standard errors that occur when missing values are replaced by a single point estimate, as in mean substitution or single imputation. The missing-at-random (MAR) assumption underlying MICE is considered reasonable for wearable-device data, where missingness most commonly arises from device non-wear charging, bathing, or forgetting rather than from a systematic relationship between unobserved physiological values and missingness [30].

2.5. Caregiver Burden Assessment

Caregiver burden was assessed using the Zarit Burden Interview (ZBI), a validated and widely used self-report measure of perceived caregiver strain [31]. The ZBI consists of 22 items evaluating the impact of caregiving on physical health, psychological well-being, financial status, and social life. Total scores range from 0 to 88, with higher scores indicating greater caregiver burden. Based on established thresholds, scores of 0–20 indicate little to no burden, 21–40 mild to moderate burden, 41–60 moderate to severe burden, and 61–88 severe burden [32].

2.6. Statistical Analysis

Participant characteristics and Fitbit-derived features were summarized using standard descriptive statistics. The distributions of wearable-derived variables were assessed, and Spearman rank correlation was used to evaluate associations due to the non-normality and non-linearity commonly observed in physiological data [33]. Correlation coefficients are reported with corresponding p-values. To account for multiple comparisons, false discovery rate (FDR) correction was applied using the Benjamini–Hochberg procedure [34]. FDR correction was conducted both across all features and within a pre-specified subset of regularity-based features. A Spearman correlation matrix across all wearable-derived features and ZBI was computed to illustrate interfeature relationships and potential multicollinearity (Figure S1 in the Supplementary Materials).
To ensure analytical symmetry across feature types, both mean-based and variability-based features were evaluated using the same three-step framework. First, Spearman correlation screening was applied to assess bivariate associations with ZBI. Second, each feature type was entered into a separate full multivariable model to estimate joint associations. Third, each feature was evaluated individually in adjusted regression models to obtain stable effect estimates. Mean-based and variability-based features were analyzed in separate models throughout these steps to avoid confounding their distinct contributions and to reduce additional multicollinearity that could arise if feature types were entered simultaneously.
Two regression strategies were used to examine associations between wearable-derived features and caregiver burden. In Strategy A, all candidate features were entered simultaneously into a multivariable model to estimate adjusted associations. This approach captures the overall multivariate structure of associations but is sensitive to collinearity among features. To assess the extent of multicollinearity, variance inflation factors (VIFs) were computed for all predictors in Strategy A. VIF values below 5 were considered acceptable, values between 5 and 10 indicated moderate concern, and values above 10 indicated problematic collinearity. Given the strong intercorrelations observed among sleep time variables (sleep duration in hours, minutes asleep, and minutes awake; r > 0.76), a revised parsimonious Strategy A model was additionally estimated, retaining only sleep efficiency as the representative sleep time variable. This approach reduces collinearity while preserving the key sleep quality dimension in the multivariable model. Results from both the full and parsimonious models are reported for transparency. Strategy A (full multivariable regression model) is defined as follows:
ZBI = β0 + β1PSQI + β2Age + ΣβkFeaturek + ε
where ZBI denotes the dependent variable representing caregiver burden, Age indicates the participant’s age in years, and Featurek denotes the k-th wearable-derived physiological or behavioral feature. PSQI is included as a covariate rather than a feature of interest to adjust for baseline subjective sleep quality and to isolate the independent contribution of objective wearable-derived features. This adjustment was intended to reduce confounding between self-reported sleep quality and objectively measured wearable-derived sleep and physiological features.
In Strategy B, each feature was evaluated in a separate regression model adjusted for demographic and clinical covariates to obtain stable effect estimates. Strategy B (feature-by-feature adjusted regression model) is defined as follows:
ZBI = β0 + β1Age + β2Sex + β3Feature + ε
where Sex represents the biological sex of the participant and Feature denotes an individual wearable-derived feature evaluated in each model.
As a sensitivity analysis, the feature-by-feature adjusted model for REM sleep duration variability was re-estimated after additionally adjusting for (1) care-recipient cognitive status, entered as a categorical variable with CN as the reference category (dummy-coded MCI and dementia), and (2) Fitbit-derived mean total sleep time, calculated as the 7-day average of daily sleep duration in hours. Sleep fragmentation, operationalized as the ratio of awake minutes to total time in bed, was examined as an additional feature in Spearman correlation screening to evaluate its association with caregiver burden. As a sensitivity analysis, the feature-by-feature adjusted model for REM sleep duration variability was re-estimated after additionally adjusting for (1) care-recipient cognitive status, entered as a categorical variable with CN as the reference category (dummy-coded MCI and dementia); (2) Fitbit-derived mean total sleep time, calculated as the 7-day average of daily sleep duration in hours; and (3) a Vascular Risk Score (VRS), calculated as the sum of five binary vascular risk factors—hypertension (HTN), diabetes mellitus (DM), dyslipidemia, coronary artery disease (CAD), and stroke (each scored 0 = absent, 1 = present; range 0–5)—derived from clinical records collected at study enrollment. These analyses were conducted to evaluate alternative explanations for the observed association, including potential confounding by overall sleep duration (i.e., a floor-effect hypothesis) underlying care-recipient disease severity, and general cardiovascular health.
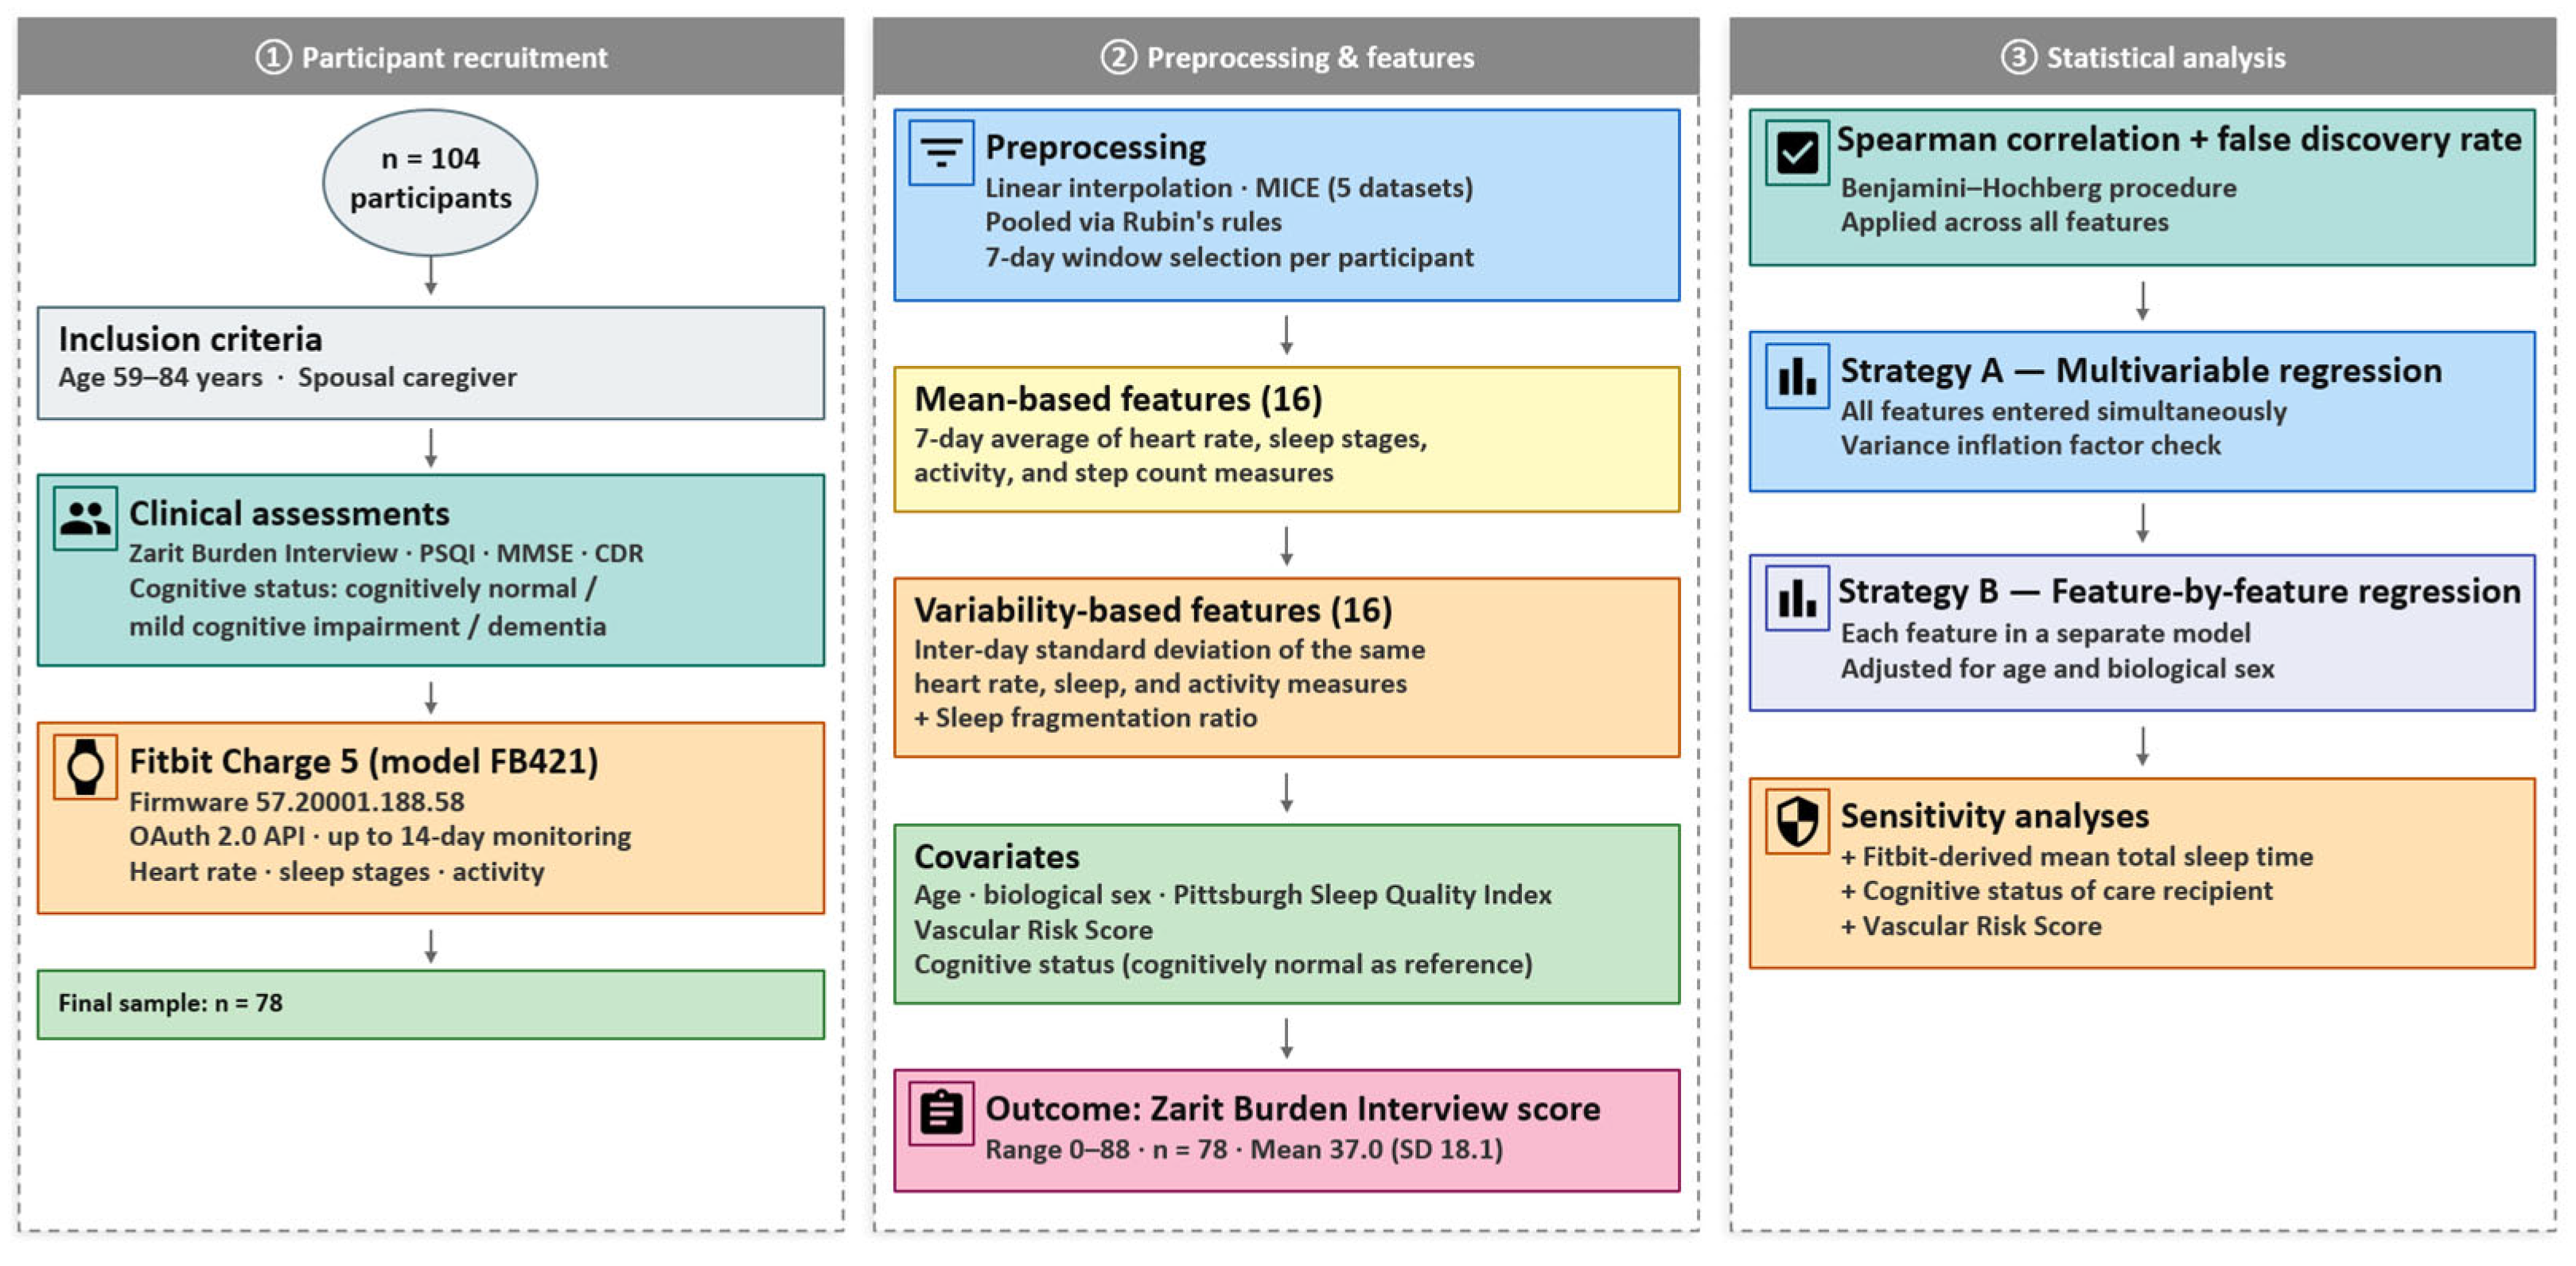
The primary analysis window was selected based on a comparison of candidate aggregation periods and applied in all subsequent analyses (see Section 3 for details). Statistical analyses were conducted using SAS OnDemand for Academics (SAS Institute Inc., Cary, NC, USA; SAS release 9.04.01M8P02222023, Enterprise Edition 3.82, platform Linux LIN X64) and Python 3.12.3 (Python Software Foundation) executed via Google Colaboratory. Python packages used included pandas (v2.2), NumPy (v1.26), SciPy (v1.13), and scikit-learn (v1.5) for multiple imputation via IterativeImputer, with statistical significance defined as p < 0.05 (two-tailed). The overall analysis pipeline is summarized in Figure 1.

3. Results

3.1. Participant Characteristics

A total of 78 participants were included in the analysis. The mean age was 72.4 years (SD = 5.9; range, 59–84), and 59.7% were male while 40.3% were female. The mean Zarit Burden Interview (ZBI) score was 37.0 (SD = 18.1; range, 2–70), indicating a moderate level of caregiver burden in the sample. Sleep quality, assessed using the Pittsburgh Sleep Quality Index (PSQI), had a mean score of 8.2 (SD = 3.3), suggesting mild to moderate sleep disturbance. Based on ZBI burden categories, 22.1% of participants reported little to no burden, 31.2% mild to moderate burden, 36.4% moderate to severe burden, and 10.4% severe burden (Table 1).
Regarding vascular risk factors, 50.0% of participants had hypertension, 23.1% had diabetes mellitus, 43.6% had dyslipidemia, 3.8% had coronary artery disease, and 3.8% had a history of stroke. The mean VRS was 1.26 (SD = 0.95; range 0–4), with 23.1% of participants scoring 0 (no vascular risk factors), 37.2% scoring 1, and 39.7% scoring 2 or higher. Among the 78 included participants, the mean number of valid Fitbit recording days within the 7-day analysis window was 7.0 (median = 7.0; range = 7–8), indicating near-complete wearable data capture across all participants.

3.2. Feature Screening: Correlation Analysis

Table 2 presents Spearman correlation results for mean-based features, defined as the 7-day average of daily physiological measures (e.g., mean daily maximum heart rate and mean daily sleep duration in hours). None of the mean-based features reached nominal significance (all p > 0.05, all FDR q > 0.90). Effect sizes were uniformly small across heart rate, sleep, and activity domains. In contrast, several variability-based features showed larger exploratory associations, including REM sleep variability (ρ = −0.32, p = 0.004, q = 0.051). These results suggest that day-to-day variation may be more informative than mean-level features in relation to caregiver burden.
Table 3 presents results from the initial correlation-based feature screening, which evaluated variability-based features defined as the day-to-day standard deviation of each physiological measure across the 7-day window (e.g., standard deviation of daily REM sleep duration, daily step count, or daily heart rate). These features capture the degree of fluctuation in each signal over time, rather than its average level. REM sleep variability showed the largest observed correlation with caregiver burden in this exploratory screening (ρ = −0.32, p = 0.004, q = 0.051), narrowly missing the conventional FDR threshold. In contrast to the mean-based results, variability-based features showed larger associations overall, suggesting that day-to-day variation may be more sensitive to caregiver burden, while requiring confirmation in larger samples.
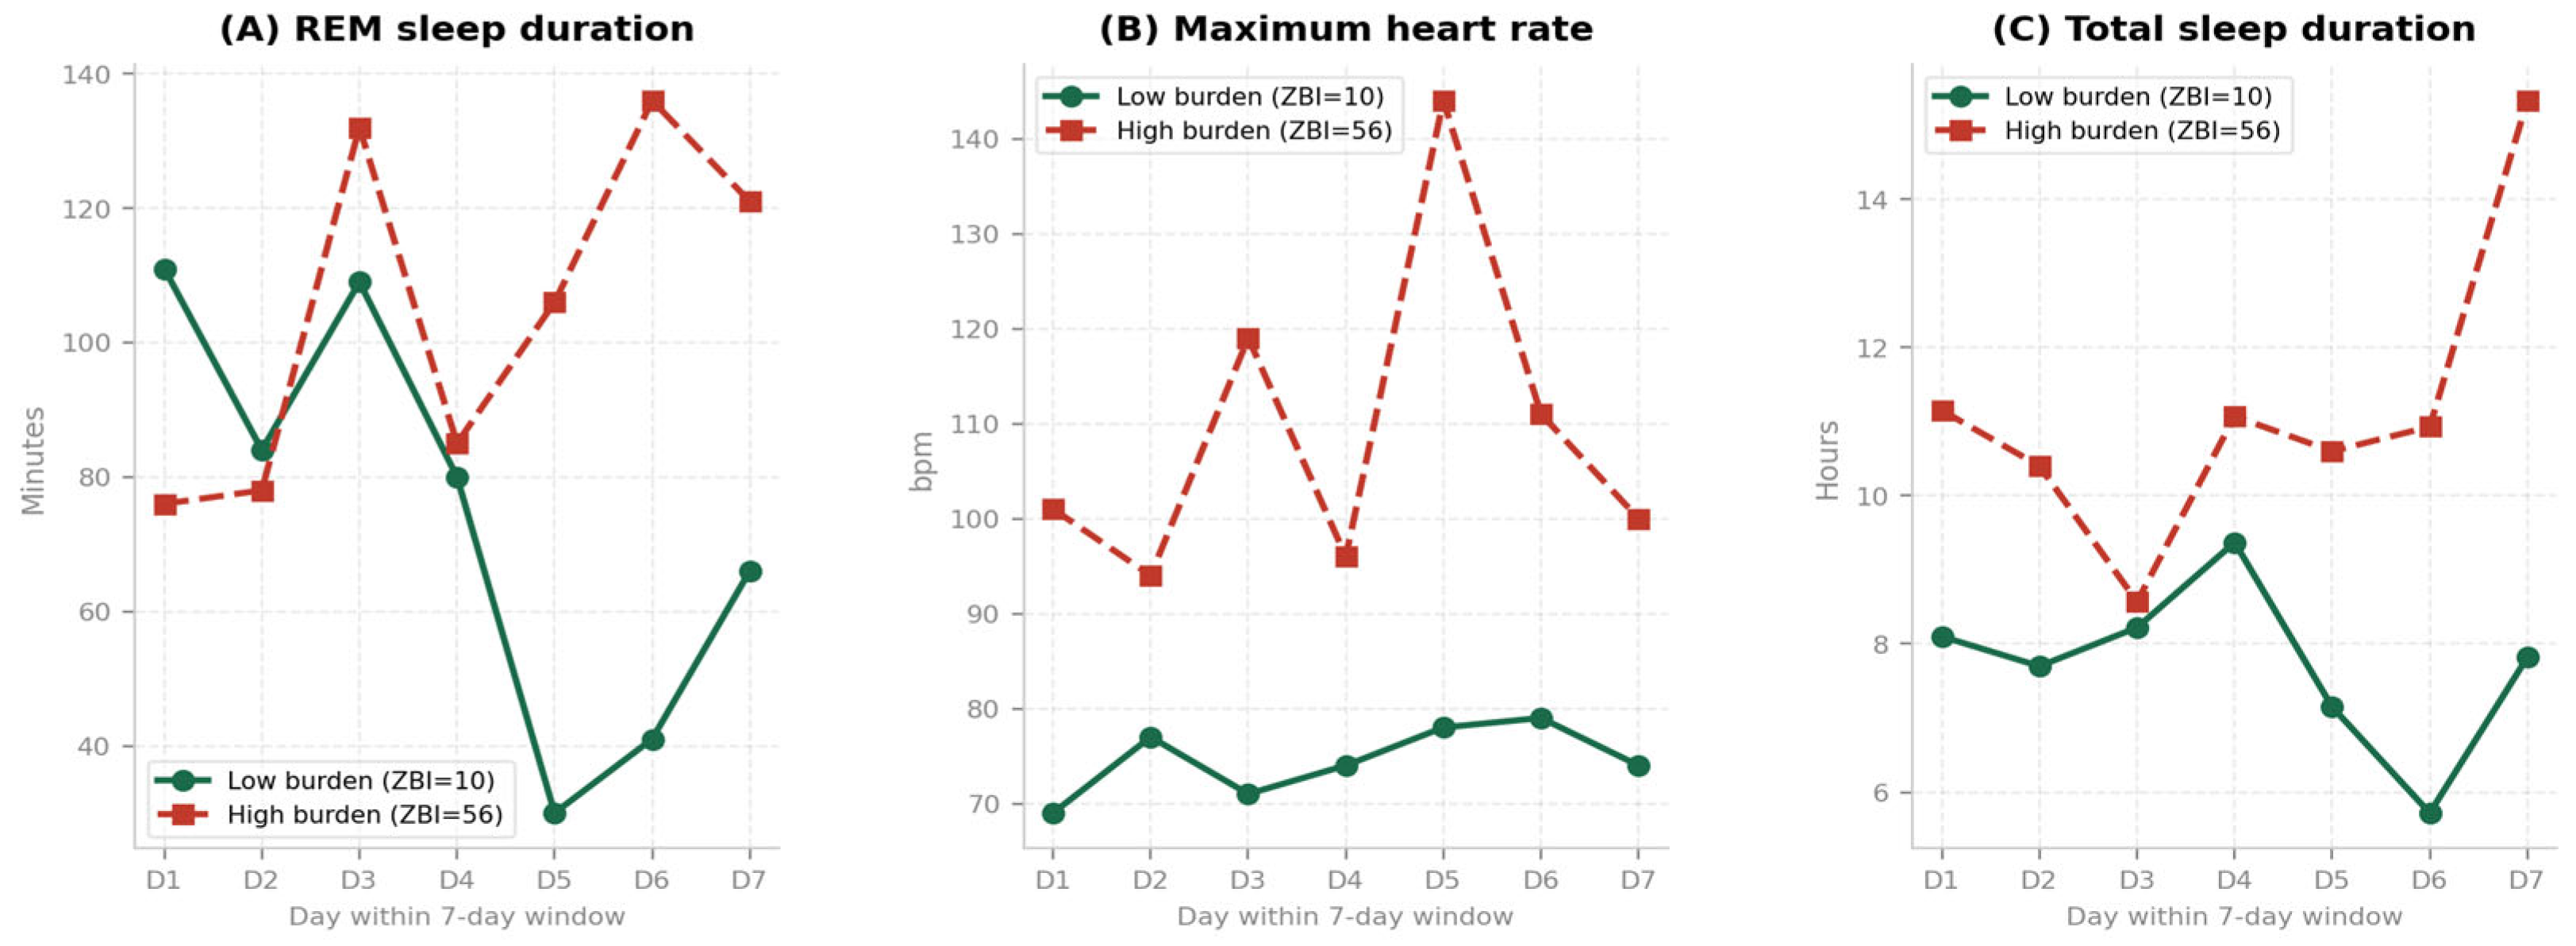
To illustrate the temporal patterns underlying these group-level associations, we generated representative 7-day wearable signal profiles for participants with low and high caregiver burden. Participants were first stratified into low- and high-burden groups based on ZBI tertiles, and one participant from each group was selected whose REM sleep variability value was closest to the median within the corresponding tertile. The selected low-burden participant had a ZBI score of 10, whereas the selected high-burden participant had a ZBI score of 56. Figure 2 presents daily REM sleep duration, maximum daily heart rate, and total sleep duration across the 7-day monitoring window. The high-burden participant exhibited reduced day-to-day variation in REM sleep duration and consistently higher maximum daily heart rate, while total sleep duration showed relatively modest differences across the monitoring period.
An additional exploratory analysis examined sleep fragmentation (ratio of awake minutes to total time in bed) as a candidate feature. The mean daily fragmentation ratio was 0.146 (SD = 0.022). Neither mean fragmentation (ρ = 0.070, p = 0.545) nor its day-to-day variability (ρ = −0.026, p = 0.822) was significantly associated with caregiver burden, suggesting that this aggregate proxy of sleep disruption did not capture meaningful variance in ZBI scores in this sample.

3.3. Strategy A: Multivariable Regression Results

Table 4 presents the results of Strategy A, a full multivariable model including mean-based features (7-day averages). The overall model was not statistically significant (F-test p = 0.208; R2 = 0.320; adjusted R2 = 0.077). Maximum daily heart rate showed a positive adjusted association with caregiver burden (β = 2.592, p = 0.005), although this should be interpreted cautiously given the non-significant overall model and modest explanatory power. Average daily heart rate showed a trend-level negative association (β = −3.450, p = 0.085). Sleep duration, minutes asleep, and minutes awake were also significant (all p = 0.021), but these estimates may be influenced by collinearity among overlapping sleep variables. All other predictors were not significant (all p > 0.18).
Table 5 presents the corresponding model for variability-based features. The overall model was not significant (F-test p = 0.295; R2 = 0.225; adjusted R2 = 0.038), and no individual feature reached statistical significance (all p > 0.05).
To address potential multicollinearity among sleep time variables, as illustrated in the Spearman correlation matrix (Figure S1 in the Supplementary Materials), a revised parsimonious model was estimated retaining only sleep efficiency as the representative sleep variable alongside remaining predictors. In this parsimonious model, maximum daily heart rate retained its positive adjusted association with caregiver burden (β = 2.44, p = 0.012), and the overall pattern of results was consistent with the full model, supporting the robustness of the heart rate finding to removal of collinear sleep time variables. Sleep efficiency was not significantly associated with ZBI in the parsimonious model (p > 0.05).

3.4. Strategy B: Feature-by-Feature Adjusted Models

Mean-based features were also examined using Strategy B (feature-by-feature adjusted regression). Because no mean-based feature reached nominal significance in the adjusted models (all p > 0.34; all FDR q > 0.88), only the variability-based results are presented in Table 6. Within the 7-day window, Strategy B evaluated each variability-based feature in a separate adjusted model.
At the nominal p < 0.05 level, REM sleep variability was negatively associated with caregiver burden (β = −0.394, p = 0.038), and light sleep variability showed a similar negative association (β = −0.226, p = 0.044). Sleep duration variability showed a marginal association with caregiver burden (β = −0.130, p = 0.065). These findings did not remain significant after FDR correction (REM sleep variability q = 0.259; light sleep variability q = 0.260; sleep duration variability q = 0.260). No other variability features, including activity and heart rate measures, were significantly associated with caregiver burden in the adjusted models (all p > 0.05).

3.5. Sensitivity Analysis

In sensitivity analyses conducted to evaluate alternative explanations (Table 7), the association between REM sleep duration variability and ZBI was attenuated after additional adjustment for care-recipient cognitive status (β = −0.281, SE = 0.189, 95% CI [−0.657, 0.095], p = 0.140), suggesting that the observed negative association may partly reflect underlying care-recipient disease severity. After additional adjustment for Fitbit-derived mean total sleep time, the association remained directionally consistent and of similar magnitude (β = −0.388, SE = 0.203, 95% CI [−0.792, 0.017], p = 0.060), and mean total sleep time was not independently associated with ZBI (β = 0.493, p = 0.773), suggesting that the association is unlikely to be fully explained by overall sleep duration, although REM-specific truncation or floor effects cannot be completely ruled out. Taken together, these results indicate that the association remains largely consistent after adjustment for overall sleep duration, while it is attenuated after accounting for care-recipient cognitive status. This pattern indicates that the observed relationship may be partially influenced by underlying disease severity and should be interpreted as exploratory.
An additional sensitivity analysis incorporating the Vascular Risk Score as a covariate showed that VRS was not significantly associated with ZBI in either the REM variability model (β = −1.877, SE = 2.225, p = 0.402) or the maximum heart rate model (β = −1.464, SE = 2.276, p = 0.522). The direction and magnitude of the REM sleep variability association remained essentially unchanged after VRS adjustment (β = −0.394, SE = 0.196, 95% CI [−0.783, −0.004], p = 0.048), indicating that general cardiovascular health does not confound the primary wearable-derived findings.

4. Discussion

4.1. Hypothesis Testing

H1. 
Caregiver burden is hypothesized to be associated with wearable-derived features across sleep, heart rate, and activity domains.
Supported. Feature screening identified several wearable-derived variables showing exploratory associations with caregiver burden, and the most consistent candidate signals were observed for sleep variability and heart rate measures. In particular, REM sleep variability showed the largest observed correlation in the screening analysis (ρ = −0.32, p = 0.004, q = 0.051), although it narrowly missed the conventional FDF threshold. Light and total sleep variability demonstrated moderate associations at the nominal level (p < 0.05), but these did not remain significant after FDR correction. Maximum daily heart rate also showed a positive adjusted association with caregiver burden in the multivariable model (β = 2.59, p = 0.005). Notably, maximum daily heart rate did not show a significant association in the bivariate correlation analysis but was associated with ZBI after adjustment for other variables; this finding should be interpreted in the context of the non-significant overall model test and modest adjusted R2. This pattern suggests that certain physiological signals may become informative only after accounting for shared variance with other features, highlighting the importance of cautious multivariate interpretation when analyzing wearable-derived data.
These exploratory associations were observed across both correlation-based screening and regression analyses. Rather than indicating a single dominant predictor, the results suggest that caregiver burden may be reflected across multiple physiological domains, including sleep patterns and heart rate responses. This convergence across analytical approaches supports the interpretation that wearable-derived signals may capture meaningful but incomplete aspects of caregiving-related stress, although the strength and consistency of these associations vary across features.
H2. 
Variability-based physiological features are hypothesized to be more strongly associated with caregiver burden than mean-based counterparts.
Partially supported. A contrast was observed between mean-based and variability-based features. None of the mean-based features showed significant associations across either correlation screening or adjusted regression analyses, whereas variability-based features—particularly sleep-related measures—showed more consistent exploratory associations with caregiver burden. REM sleep variability showed the most consistent candidate pattern across analyses, while light sleep variability showed a similar nominal pattern and total sleep variability showed a marginal association. In contrast, most activity- and heart rate-related variability features were not significantly associated with caregiver burden. Taken together, these findings suggest that temporal fluctuations in sleep may be more informative than average physiological levels in capturing caregiving-related burden. However, this pattern was not uniform across all variability measures, and the FDR-adjusted results indicate that these sleep variability findings should be treated as exploratory candidate signals.
H3. 
These associations are hypothesized to remain significant after adjusting for relevant clinical and demographic covariates.
Supported for select features. In the fully adjusted multivariable model, maximum daily heart rate showed a positive adjusted association with caregiver burden (β = 2.59, p = 0.005), indicating that peak heart rate responses may be associated with higher burden levels. The contrast between Strategy A and Strategy B further highlights the impact of feature interdependence. Several variability-based features that were not significant in the full model became nominally significant when evaluated individually, suggesting that collinearity among related measures may obscure their effects in simultaneous models. In feature-by-feature adjusted models, REM sleep variability also showed a nominal association (β = −0.39, p = 0.038), with light sleep variability showing a similar nominal association and total sleep variability showing a marginal effect; however, these individual-feature findings did not remain significant after FDR correction.
However, not all associations persisted after adjustment. The modest explanatory performance of the multivariable model (adjusted R2 = 0.08) indicates that wearable-derived features capture only a portion of the variance in caregiver burden. This is consistent with the multifactorial nature of caregiver burden, which is influenced by psychological, social, and contextual factors beyond physiological signals.

4.2. Clinical and Practical Implications for Wearable-Based Monitoring

The present findings provide preliminary evidence that wearable-derived signals, particularly sleep variability and heart rate, may serve as candidate objective indicators of caregiver burden. Maximum daily heart rate showed a positive adjusted association with burden in the multivariable model (β = 2.59, p = 0.005) and may reflect periods of elevated physiological stress. Because heart rate can be continuously and passively collected, these signals may support real-time monitoring of caregiver state as a complement to self-report.
The observed effect sizes should be interpreted cautiously. Although maximum daily heart rate was positively associated with caregiver burden in the adjusted model (β = 2.59, p = 0.005), the overall explanatory performance was modest (adjusted R2 = 0.08), and the magnitude of this association is unlikely to support direct clinical classification of caregiver burden from heart rate alone. The association between REM sleep variability and ZBI was also modest and exploratory (ρ = −0.32; β = −0.394) and did not survive FDR correction. These effect sizes therefore support the potential value of wearable-derived features such as low-burden, continuously collected candidate indicators but highlight the need for longitudinal validation before these measures can inform clinical decision-making.
These findings support intervention strategies aimed at regulating heart rate and reducing stress-related physiological load. Approaches such as mindfulness-based stress reduction (MBSR) and slow-paced breathing have shown effectiveness in reducing perceived stress and stabilizing heart rate responses in caregivers [35,36]. In addition, structured respite care may help reduce repeated high-stress episodes by providing periodic relief from caregiving demands.
Several sleep time measures, including sleep duration, minutes asleep, and minutes awake, were also significant in the multivariable model, although these findings should be interpreted cautiously because of potential overlap among related sleep variables.
Findings related to sleep variability also provide important but exploratory insights. REM sleep variability showed a nominal negative association with caregiver burden after adjustment (β = −0.39, p = 0.038), with similar patterns observed for light sleep variability. One possible interpretation is that some degree of sleep timing or stage variability may reflect flexibility in adapting to irregular caregiving demands. However, this interpretation should be considered cautiously because the association did not survive FDR correction and alternative mechanisms may also explain the observed pattern.
A clinically plausible alternative explanation is REM truncation or a floor effect rather than adaptive flexibility. REM sleep tends to occur more prominently in the latter part of the sleep period; therefore, caregivers with high burden who experience chronically shortened or interrupted sleep may have fewer opportunities to enter or sustain REM sleep. Under this scenario, lower day-to-day REM variability could arise because REM duration is already constrained near a lower range, producing a statistical floor effect. The negative association may also reflect stress-related REM suppression, irregular awakenings related to nighttime caregiving, or unmeasured medication effects. Accordingly, REM sleep variability should be interpreted as a candidate signal with multiple plausible mechanisms rather than as direct evidence of adaptive sleep flexibility.
Sensitivity analyses provided further context for interpreting the primary findings. The REM sleep variability association was robust to adjustment for mean total sleep time (β = −0.388, p = 0.060), arguing against a floor-effect explanation, and remained directionally consistent after adjustment for the Vascular Risk Score (β = −0.394, p = 0.048), indicating that general cardiovascular health does not confound this finding. However, the association was attenuated after adjustment for care-recipient cognitive status (β = −0.281, p = 0.140), suggesting that disease severity of the care recipient may partly contribute to the observed pattern. Sleep fragmentation, operationalized as the ratio of awake minutes to total time in bed, was not significantly associated with caregiver burden (ρ = 0.070, p = 0.545), suggesting that this aggregate proxy does not capture the same dimension of sleep disruption as REM stage variability.
From a clinical and practical perspective, the continuous and passive nature of wearable data enables real-time monitoring and timely intervention in caregiving contexts. Heart rate signals, in particular, can be used to identify periods of elevated stress and provide immediate support. For example, wearable-based systems could deliver just-in-time interventions (e.g., breathing guidance or stress alerts) when signals exceed predefined thresholds [37]. Integrating such functionality into digital caregiver support platforms offers a scalable and low-burden approach to personalized care, enabling proactive support without requiring users to explicitly report distress.
The present study relied on inter-day mean and standard deviation of daily heart rate summaries, rather than intra-day heart rate variability (HRV). This choice was driven by the resolution of data available through the Fitbit Web API, which does not provide beat-to-beat RR interval data required for standard HRV metrics (e.g., RMSSD, SDNN). The inter-day mean of daily heart rate is analogous to the circadian mesor used in prior wearable research to characterize physiological load [23], and its inter-day variability captures temporal fluctuations in cardiovascular state across days—a distinct construct from intra-day autonomic regulation. While intra-day HRV over 24-h or 5-min epochs is a more established and sensitive measure of autonomic stress responses, the inter-day approach used here is appropriate for the available data resolution and provides a complementary perspective on sustained physiological burden over multi-day windows. Future work should investigate intra-day HRV—ideally derived from chest-worn ECG or validated optical HRV sensors—as a more direct measure of caregiver autonomic load, as it may provide stronger and more mechanistically interpretable associations with caregiver burden than the daily summary metrics used here [37].
Unlike prior wearable-based caregiver studies that examined isolated sleep metrics in small samples [16,21], the present work simultaneously analyzed multimodal Fitbit data across sleep stage architecture, heart rate dynamics, and activity patterns, with a focus on inter-day variability and rigorous sensitivity analyses adjusting for clinical covariates. These methodological advances, combined with the passive and continuous nature of consumer-grade wearables, position this framework as a scalable foundation for objective caregiver burden monitoring, early detection of physiological stress, and real-time support in caregiving contexts.

4.3. Limitations

Several limitations should be considered when interpreting these findings. In particular, not all wearable-derived signals were equally informative, as most activity-related and heart rate variability features showed weak or non-significant associations across analyses. First, the cross-sectional design allows identification of associations but does not support causal inference. It remains to be determined whether sleep variability plays a protective role against caregiver burden, whether caregivers with lower burden are better able to maintain flexible sleep patterns, or whether the observed REM variability pattern reflects sleep curtailment or other unmeasured factors. Longitudinal studies will be required to clarify this directionality.
Second, the sample size (n = 78), while adequate for exploratory analysis, limits statistical power. A post hoc power analysis indicated that the full multivariable model (k = 10 predictors, n = 78) achieved a power of 0.99 to detect the observed large effect size (f2 = 0.47; Cohen’s large threshold for a large effect), suggesting adequate power to detect effects of this magnitude. However, the feature-by-feature adjusted models for individual variability features had more modest statistical power (estimated power ≈ 0.57 for REM sleep variability), indicating that some true small-to-medium associations may have gone undetected. A sample of approximately 150–200 participants would be required to achieve 80% power to detect medium-sized individual feature effects (f2 ≈ 0.10) in the adjusted models. The modest explanatory performance of the multivariable model (adjusted R2 = 0.08) should be interpreted in this context. Caregiver burden is a complex and multifactorial phenomenon, and it is unlikely that any single wearable-derived signal can fully explain its variance. Consistent with this, the overall model was not statistically significant (F-test p = 0.208), indicating that while individual features carry meaningful information, wearable data alone does not constitute a complete model of caregiver burden. Rather, this reflects the high dimensionality and interdependence of physiological and behavioral signals captured in real-world settings.
Third, several sleep-related variables included in the multivariable model represent overlapping constructs (e.g., total sleep duration, minutes asleep, and minutes awake), which showed near-perfect intercorrelations (r > 0.76) and may introduce multicollinearity, leading to unstable or opposing coefficient estimates. A revised parsimonious model retaining only sleep efficiency produced consistent results for the heart rate finding, supporting its robustness. Future work may benefit from feature selection or dimensionality reduction approaches to address redundancy among closely related variables.
A further limitation concerns the heterogeneous timing of ZBI administration relative to the wearable monitoring period: 45 participants completed the ZBI prior to monitoring, 15 after the monitoring period, and 17 during or on the first day of monitoring. Although the 7-day window selection strategy was designed to maximize temporal proximity, some temporal misalignment between physiological data and burden assessment may have remained. Because a formal sensitivity analysis across timing subgroups was not feasible with the available data, future studies should administer burden assessments concurrently with wearable monitoring to strengthen temporal validity.
Specific medication data, including beta-blockers, antiarrhythmics, and other heart-rate-modifying drugs, were not collected in this study. Such medications may systematically alter average and maximum heart rate values measured by photoplethysmography-based wearables, and conditions such as atrial fibrillation are known to reduce the accuracy of optical heart rate estimation in consumer devices. While our sensitivity analysis using the Vascular Risk Score suggests that general cardiovascular health does not confound the primary findings (VRS p > 0.40 in all models), this approach addresses only aggregate cardiovascular risk rather than specific pharmacological effects. Future studies should prospectively collect detailed medication logs to more precisely account for pharmacological influences on wearable-derived heart rate features.
Consumer-grade wearable devices carry inherent measurement limitations under free-living conditions. Optical PPG-based heart rate estimation is susceptible to motion artifacts and reduced accuracy during high-intensity activity or in participants with arrhythmias [27]. Fitbit-derived sleep stage classifications show only moderate agreement with polysomnography, particularly for brief awakenings and REM detection [25,26], and may systematically underestimate REM duration in participants with fragmented sleep—potentially biasing the REM variability features central to this study. These limitations reinforce the exploratory nature of the present findings and the need for replication using laboratory-validated measures.
Sleep timing and polyphasic sleep patterns were not fully captured in the present analysis. The Fitbit API provided daily aggregated sleep session data, which does not allow identification of separate daytime napping bouts or precise sleep onset and offset times. A sleep fragmentation proxy (ratio of awake minutes to total time in bed) was examined but showed no significant association with caregiver burden (ρ = 0.070, p = 0.545). Future studies should utilize raw intraday Fitbit data or actigraphy-based algorithms capable of detecting polyphasic sleep, daytime napping, and phase-shifted sleep patterns, which may be particularly relevant in caregiver populations experiencing nocturnal disruptions due to care demands.
In addition, the negative association observed for REM sleep variability, while evident in exploratory analyses, should be interpreted cautiously and should not be taken as evidence that lower REM variability is inherently adaptive. Because REM sleep is concentrated in the latter portion of the sleep period, chronic sleep curtailment in highly burdened caregivers could truncate REM episodes, reduce the observable range of REM duration, and produce a floor-effect pattern in which the standard deviation of REM sleep is mechanically lower. Stress-related REM suppression and unmeasured clinical factors may also contribute. Medication use was not included as an adjustment variable in the present analysis, although antidepressants, hypnotics, sedatives, and other sleep or neuropsychiatric medications can affect REM sleep and sleep-stage architecture. Future studies should collect and adjust for medication exposure to distinguish caregiving-related physiological patterns from pharmacological or sleep-duration-driven effects.
In addition, although PSQI was included only as a covariate rather than a feature of interest, its use introduces a degree of circularity because PSQI is itself a self-reported measure of sleep quality. Therefore, the adjusted models should be interpreted as estimating the association between wearable-derived features and caregiver burden after accounting for baseline subjective sleep quality, rather than as fully objective wearable-only models. Future studies should evaluate models relying exclusively on objective wearable-derived features to assess their standalone predictive value.
Sensitivity analyses showed that the REM sleep variability association remained largely consistent after adjustment for mean total sleep time (β = −0.388, p = 0.060), suggesting that the association is unlikely to be fully explained by overall sleep duration, although REM-specific truncation or floor effects cannot be completely ruled out. However, the association was attenuated after adjustment for care-recipient cognitive status (β = −0.281, p = 0.140), suggesting that underlying disease severity may partly contribute to the observed pattern. Medication use, which was not accounted for in the current analyses, represents an important covariate to be addressed in future work.
Finally, the study sample consisted of informal caregivers, which may limit generalizability to other caregiving populations, such as professional caregivers or different care settings. Despite these limitations, the findings provide a useful foundation for future work and highlight the potential of wearable-derived data as a complementary tool for understanding caregiver burden in real-world environments.


5. Conclusions

This exploratory study suggests that selected wearable-derived signals, particularly heart rate and sleep variability, may be associated with caregiver burden in informal caregivers. Using multimodal Fitbit data, convergent but modest patterns were observed across correlation and regression analyses.
Among the examined features, maximum daily heart rate showed a positive adjusted association with caregiver burden, while REM sleep variability showed an exploratory negative association, with similar nominal patterns observed for light sleep variability. These associations were observed across both feature screening and regression models, but they should be interpreted cautiously given the modest adjusted R2, the non-significant full-model F-test, and the borderline FDR-adjusted result for REM sleep variability. These results identify specific dimensions of wearable-derived signals as candidate indicators, rather than definitive or robust predictors, of caregiver burden.
In addition, variability-based sleep features showed candidate associations across analyses, suggesting that day-to-day fluctuations in sleep may capture aspects of caregiver burden that are not fully reflected by average-level measures alone. These associations remained nominally evident after adjusting for demographic factors, indicating that wearable-derived features may provide information beyond basic participant characteristics, while requiring replication and sensitivity analyses with additional covariates.
These signals can be continuously and passively collected using consumer-grade wearable devices, enabling scalable monitoring without increasing user burden. Looking ahead, the candidate indicators identified in this study, particularly sleep stage variability and peak heart rate, could serve as input signals for digital caregiver support platforms incorporating early-warning systems. For example, a sustained elevation in maximum daily heart rate combined with reduced REM sleep variability over a multi-day window could trigger automated alerts prompting caregivers or clinicians to initiate support interventions such as respite care referrals or stress management resources. Such systems could operate passively without requiring caregivers to self-report, reducing monitoring burden on already-strained individuals. Integration with telehealth platforms and electronic health records would further enable longitudinal tracking of physiological burden trajectories, supporting proactive and personalized caregiver health management. While the present findings should be viewed as hypothesis-generating and require longitudinal validation before clinical deployment, they provide a practical and scalable foundation for the development of wearable-based caregiver monitoring systems.

Supplementary Materials

The following supporting information can be downloaded at: https://www.mdpi.com/article/10.3390/app16115382/s1, Figure S1: Spearman correlation matrix of wearable-derived features and Zarit Burden Interview (ZBI) score (n = 78). Values represent Spearman ρ. Red shading indicates positive correlations; blue shading indicates negative correlations. Features include inter-day standard deviation (variability) and 7-day average (mean) measures of heart rate, sleep, and activity. ZBI = Zarit Burden Interview total score.

Author Contributions

Conceptualization, S.M. and J.-B.L.; methodology, S.M.; software, S.M.; validation, S.M., J.-B.L. and S.Y.J.; formal analysis, S.M.; investigation, S.M., J.-D.K. and T.L.; resources, S.M. and S.Y.J.; data curation, S.M., J.-D.K. and S.Y.J.; writing—original draft preparation, S.M.; writing—review and editing, S.M., T.L. and J.-B.L.; visualization, S.M. and J.-B.L.; supervision, J.-B.L.; project administration, S.Y.J.; funding acquisition, J.-B.L. All authors have read and agreed to the published version of the manuscript.

Funding

This work was supported by the Sun Moon University Research Grant of 2023.

Institutional Review Board Statement

The study was conducted in accordance with the Declaration of Helsinki and approved by the Institutional Review Board of Chungnam National University Hospital (reference number 2020-05-002; approved date: 20 May 2020).

Informed Consent Statement

Informed consent was obtained from all subjects involved in the study.

Data Availability Statement

The data presented in this study are not publicly available due to privacy and ethical restrictions but are available from the corresponding author upon reasonable request.

Conflicts of Interest

The authors declare no conflicts of interest.

Abbreviations

The following abbreviations are used in this manuscript:
ZBIZarit Burden Interview
PSQIPittsburgh Sleep Quality Index
MVPAModerate-to-Vigorous Physical Activity
FDRFalse Discovery Rate
RMSERoot Mean Squared Error
ECGElectrocardiogram

References

  1. Adelman, R.D.; Tmanova, L.L.; Delgado, D.; Dion, S.; Lachs, M.S. Caregiver burden: A clinical review. JAMA 2014, 311, 1052–1060. [Google Scholar] [CrossRef]
  2. Chiao, C.Y.; Wu, H.S.; Hsiao, C.Y. Caregiver burden for informal caregivers of patients with dementia: A systematic review. Int. Nurs. Rev. 2015, 62, 340–350. [Google Scholar] [CrossRef]
  3. Yamaguchi, Y.; Greiner, C.; Nakamura, M.; Kabaya, S. Caregiver burden and psychological status and their associations with sleep quality among family caregivers living with older people with dementia: A mixed method study. Geriatr. Nurs. 2024, 60, 504–510. [Google Scholar] [CrossRef]
  4. Koren, T.; Fisher, E.; Webster, L.; Livingston, G.; Rapaport, P. Prevalence of sleep disturbances in people with dementia living in the community: A systematic review and meta-analysis. Ageing Res. Rev. 2023, 83, 101782. [Google Scholar] [CrossRef] [PubMed]
  5. Sheehan, O.C.; Haley, W.E.; Howard, V.J.; Huang, J.; Rhodes, J.D.; Roth, D.L. Stress, burden, and well-being in dementia and nondementia caregivers: Insights from the caregiving transitions study. Gerontologist 2021, 61, 670–679. [Google Scholar] [CrossRef]
  6. Toleuov, Y.; Inoue, K.; Akkuzinova, K.; Moldagaliyev, T.; Seksenbayev, N. Caregiver burden and psychological distress among informal caregivers for individuals with dementia in the Republic of Kazakhstan: A cross-sectional study. Healthcare 2024, 13, 2633. [Google Scholar] [CrossRef] [PubMed]
  7. Abdelhalim, D.S.; Ahmed, M.M.; Hussein, H.A.; Khalaf, O.O.; Sarhan, M.D. Burden of care, depression, and anxiety among family caregivers of people with dementia. J. Prim. Care Community Health 2024, 15, 21501319241288029. [Google Scholar] [CrossRef]
  8. Dobson, R.; Stowell, M.; Warren, J.; Tane, T.; Ni, L.; Gu, Y.; McCool, J.; Whittaker, R. Use of consumer wearables in health research: Issues and considerations. J. Med. Internet Res. 2023, 25, e52444. [Google Scholar] [CrossRef]
  9. Hickey, A. The rise of wearables: From innovation to implementation. In Wearable Technology in Medicine and Health Care; Elsevier: Amsterdam, The Netherlands, 2020; pp. 1–16. [Google Scholar] [CrossRef]
  10. GBD 2019 Dementia Forecasting Collaborators. Estimation of the global prevalence of dementia in 2019 and forecasted prevalence in 2050: An analysis for the Global Burden of Disease Study 2019. Lancet Public Health 2022, 7, e105–e125. [Google Scholar] [CrossRef] [PubMed]
  11. Monteiro, J.; Hosseini, C.; Regueiras, B.; Fernandes, J.; Meireles, W.; Vila-Chã, N.; Maia, L.F. Wearable sensors for sleep monitoring in free-living environments: A scoping review on Parkinson’s disease. Biosensors 2025, 15, 212. [Google Scholar] [CrossRef]
  12. Rashid, Z.; Folarin, A.A.; Zhang, Y.; Ranjan, Y.; Conde, P.; Sankesara, H.; Sun, S.; Stewart, C.; Laiou, P.; Dobson, R.J.B. Digital phenotyping of mental and physical conditions: Remote monitoring of patients through RADAR-base platform. JMIR Ment. Health 2024, 11, e51259. [Google Scholar] [CrossRef]
  13. Stucky, B.; Clark, I.; Azza, Y.; Karlen, W.; Achermann, P.; Landolt, H.-P.; Gilgen-Ammann, R. Validation of Fitbit Charge 2 sleep and heart rate estimates against polysomnography measures in shift workers: Naturalistic Study. JMIR Mhealth Uhealth 2021, 9, e26476. [Google Scholar] [CrossRef]
  14. Le Toullec, E.; Le Gagne, A.; Leblong, E.; Somat, A.; Piette, P. Assessment of burden and needs of family caregivers for the elderly: A scoping review. Front. Aging 2025, 6, 1578911. [Google Scholar] [CrossRef] [PubMed]
  15. Mattos, M.K.; Bernacchi, V.; Shaffer, K.M.; Gallagher, V.; Seo, S.; Jepson, L.; Manning, C. Sleep and caregiver burden among caregivers of persons living with dementia: A scoping review. Innov. Aging 2024, 8, igae005. [Google Scholar] [CrossRef]
  16. Ahn, S.; Chung, M.L.; Logan, J.G. Sleep deficiency by caregiving status: Findings from nationally representative data. West. J. Nurs. Res. 2023, 45, 1120–1129. [Google Scholar] [CrossRef]
  17. Domínguez-Vergara, J.; Santa-Cruz-Espinoza, H.; Chávez-Ventura, G. Zarit Caregiver Burden Interview: Psychometric properties in family caregivers of people with intellectual disabilities. Eur. J. Investig. Health Psychol. Educ. 2023, 13, 391–402. [Google Scholar] [CrossRef]
  18. Boluarte-Carbajal, A.; Paredes-Angeles, R.; Tafur-Mendoza, A.A. Psychometric Properties of the Zarit Burden Interview in Informal Caregivers of Persons with Intellectual Disabilities. Front. Psychol. 2022, 13, 792805. [Google Scholar] [CrossRef] [PubMed]
  19. Yu, Y.; Liu, Z.-W.; Li, T.-X.; Zhou, W.; Xi, S.-J.; Xiao, S.-Y.; Tebes, J.K. A comparison of psychometric properties of two common measures of caregiving burden: The family burden interview schedule (FBIS-24) and the Zarit caregiver burden interview (ZBI-22). Health Qual. Life Outcomes 2020, 18, 94. [Google Scholar] [CrossRef]
  20. Bachner, Y.G.; O’Rourke, N. Reliability generalization of responses by care providers to the Zarit Burden Interview. Aging Ment. Health 2007, 11, 678–685. [Google Scholar] [CrossRef]
  21. Sadeghi, R.; Banerjee, T.; Hughes, J.C.; Lawhorne, L.W. Sleep quality prediction in caregivers using physiological signals. Comput. Biol. Med. 2019, 110, 276–288. [Google Scholar] [CrossRef] [PubMed]
  22. Park, S.Y.; Lee, J.B.; Lee, T.; Jeong, H.Y.; Kim, S.Y.; Jeon, S.Y. Relationship between caregiving burden and alterations in circadian rhythms among spousal caregivers of individuals with cognitive impairment. BMC Geriatr. 2025, 25, 652. [Google Scholar] [CrossRef] [PubMed]
  23. Seo, M.; Park, S.; Jeong, J.; Nam, Y.; Lee, E.; Lee, Y.; Yeom, J.W.; Cho, C.-H.; Kim, L.; Lee, J.-B.; et al. The circadian rhythm for sleep digital therapeutic for insomnia: Conceptual background and single-arm feasibility study. Digit. Health 2026, 12, 20552076261430230. [Google Scholar] [CrossRef] [PubMed]
  24. Lee, D.Y.; Lee, J.-B.; Jung, I.; Park, S.Y.; Yu, J.H.; Seo, J.A.; Lee, H.-J.; Kim, N.H. Association of daytime circadian-aligned activity with glycemic control in type 2 diabetes: Insights from continuous glucose monitoring and wearable data. Metabolism 2026, 179, e156570. [Google Scholar] [CrossRef]
  25. Schyvens, A.M.; Van Oost, N.C.; Aerts, J.M.; Masci, F.; Peters, B.; Neven, A.; Dirix, H.; Wets, G.; Ross, V.; Verbraecken, J. Accuracy of Fitbit Charge 4, Garmin Vivosmart 4, and WHOOP versus polysomnography: Systematic review. JMIR Mhealth Uhealth 2024, 12, e52192. [Google Scholar] [CrossRef]
  26. Higuchi, D.; Takahashi, Y.; Tanaka, S.; Tomita, Y. Validation of heart rate measured by the consumer-level wearable device Fitbit: A cross-sectional observational study. J. Phys. Ther. Sci. 2025, 37, 561–566. [Google Scholar] [CrossRef]
  27. Gagnon, J.; Khau, M.; Lavoie-Hudon, L.; Vachon, F.; Drapeau, V.; Tremblay, S. Comparing a Fitbit wearable to an electrocardiogram gold standard as a measure of heart rate under psychological stress: A validation study. JMIR Form. Res. 2022, 6, e37885. [Google Scholar] [CrossRef]
  28. van Buuren, S.; Groothuis-Oudshoorn, K. Mice: Multivariate imputation by chained equations in R. J. Stat. Softw. 2011, 45, 1–67. [Google Scholar] [CrossRef]
  29. Rubin, D.B. Multiple Imputation for Nonresponse in Surveys; Wiley: Hoboken, NJ, USA, 1987. [Google Scholar]
  30. Tackney, M.S.; Cook, D.G.; Stahl, D.; Ismail, K.; Williamson, E.; Carpenter, J. A framework for handling missing accelerometer outcome data in trials. Trials 2021, 22, 379. [Google Scholar] [CrossRef] [PubMed]
  31. Zarit, S.H.; Reever, K.E.; Bach-Peterson, J. Relatives of the impaired elderly: Correlates of feelings of burden. Gerontologist 1980, 20, 649–655. [Google Scholar] [CrossRef]
  32. Ruiz-Lozano, R.E.; Herrera-Rodriguez, M.I.; Mendoza-Pallares, J.A.; Reyes-Godinez, N.; Tamez-Tamez, V.E.; Ramos-Dávila, E.M.; Villagomez-Valdez, L.G.; Garza-Garza, L.A.; Quiroga-Garza, M.E.; Khodor, A.; et al. Validation of the Zarit Burden Interview in informal caregivers of patients with severe visual impairment and blindness. Ophthalmol. Ther. 2025, 14, 55–71. [Google Scholar] [CrossRef]
  33. Bishara, A.J.; Hittner, J.B. Testing the significance of a correlation with nonnormal data: Comparison of Pearson, Spearman, transformation, and resampling approaches. Psychol. Methods 2012, 17, 399–417. [Google Scholar] [CrossRef] [PubMed]
  34. Benjamini, Y.; Hochberg, Y. Controlling the false discovery rate: A practical and powerful approach to multiple testing. J. R. Stat. Soc. B 1995, 57, 289–300. [Google Scholar] [CrossRef]
  35. Whitebird, R.R.; Kreitzer, M.; Crain, A.L.; Lewis, B.A.; Hanson, L.R.; Enstad, C.J. Mindfulness-based stress reduction for family caregivers: A randomized controlled trial. Gerontologist 2013, 53, 676–686. [Google Scholar] [CrossRef]
  36. Laborde, S.; Allen, M.S.; Borges, U.; Iskra, M.; Zammit, N.; You, M.; Hosang, T.; Mosley, E.; Dosseville, F. Psychophysiological effects of slow-paced breathing at six cycles per minute with or without heart rate variability biofeedback. Psychophysiology 2022, 59, e13952. [Google Scholar] [CrossRef]
  37. Li, K.; Cardoso, C.; Moctezuma-Ramirez, A.; Elgalad, A.; Perin, E. Heart rate variability measurement through a smart wearable device: Another breakthrough for personal health monitoring? Int. J. Environ. Res. Public Health 2023, 20, 7146. [Google Scholar] [CrossRef] [PubMed]
Figure 1. Study workflow diagram illustrating the six-stage analysis pipeline: participant recruitment, Fitbit data acquisition, data preprocessing, feature extraction, statistical analysis, and hypothesis testing.
Applsci 16 05382 g001
Figure 2. Representative 7-day wearable signal profiles in participants with low and high caregiver burden.
Applsci 16 05382 g002
Table 1. Participant Characteristics (N = 78).
CharacteristicMean (SD) or n (%)Range
Age, years72.4 (5.9)59–84
Female sex, n (%)31 (40.3%)
Male sex, n (%)47 (59.7%)
ZBI total score37.0 (18.1)2–70
PSQI global score8.2 (3.3)0–16
No to mild (0–20)17 (22.1%)
Mild to moderate (21–40)24 (31.2%)
Moderate to severe (41–60)28 (36.4%)
Severe (61–88)8 (10.4%)
Hypertension, n (%)39 (50.0%)
Diabetes mellitus, n (%)18 (23.1%)
Dyslipidemia, n (%)34 (43.6%)
Coronary artery disease, n (%)3 (3.8%)
Stroke history, n (%)3 (3.8%)
VRS, mean (SD)1.26 (0.95)0–4
Valid Fitbit days, mean (SD)7.0 (0.1)7–8
Note. VRS = Vascular Risk Score (sum of HTN, DM, dyslipidemia, CAD, stroke; range 0–5).
Table 2. Feature Screening: Spearman Correlation Results—Mean-Based Features (n = 78).
Fitbit DataFeatureSpearman ρp-ValueFDR q-Value
SleepDeep Sleep Duration0.1150.3160.911
Sleep Efficiency−0.0920.4240.911
Minutes Awake0.0840.4620.911
Minutes Asleep−0.0520.6540.911
Sleep Duration in Hours−0.0410.7240.911
REM Sleep Duration0.0280.8070.938
Light Sleep Duration−0.0210.8540.911
ActivityMVPA Minutes−0.0940.4111.000
Lightly Active Minutes0.0830.4681.000
Sedentary Minutes−0.0310.7861.000
Active Hours−0.0300.7961.000
Total Steps0.0090.9380.938
Heart RateMaximum Daily Heart Rate0.0750.5140.911
Average Daily Heart Rate0.0360.7530.911
Minimum Daily Heart Rate0.0240.8350.911
Resting Heart Rate0.0320.7830.911
Note. MVPA = Moderate-to-Vigorous Physical Activity.
Table 3. Feature Screening: Spearman Correlation Results—Variability-Based Features (n = 78).
Fitbit DataFeatureSpearman ρp-ValueFDR q-Value
SleepREM Sleep Duration−0.320.0040.051
Light Sleep Duration−0.230.0380.153
Sleep Duration in Hours−0.200.0750.225
Sleep Efficiency−0.110.3110.746
Minutes Asleep−0.020.8200.906
Minutes Awake−0.020.8320.906
Deep Sleep Duration0.0050.9660.966
ActivityMVPA Minutes−0.090.4160.832
Total Steps−0.060.5640.906
Lightly Active Minutes0.0540.6390.982
Sedentary Minutes0.0140.9010.906
Active Hours0.0100.9110.906
Heart RateMaximum Daily Heart Rate−0.0410.7240.906
Resting Heart Rate−0.0270.8170.906
Average Daily Heart Rate−0.0140.9060.906
Minimum Daily Heart Rate−0.0100.9120.982
Table 4. Full Multivariable Regression Results—Mean-Based Features (n = 78).
PredictorBetaSE95% CIp-Value
Maximum daily heart rate2.5920.888[0.840, 4.34]0.005
Minutes awake−80.29333.731[−146.406, −14.179]0.021
Sleep Duration in Hours4830.2272031.074[849.322, 8811.132]0.021
Minutes asleep−80.62233.879[−147.025, −14.219]0.021
Average daily heart rate−3.4501.965[−7.301, 0.401]0.085
Lightly Active Minutes0.3890.288[−0.175, 0.954]0.182
Sedentary Minutes0.3610.315[−0.258, 0.980]0.257
Active hours−1.0141.239[−3.442, 1.414]0.416
Resting heart rate0.8161.075[−1.291, 2.923]0.451
REM Sleep Duration0.600.144[−0.197, 0.371]0.550
Age0.2060.467[−0.710, 1.122]0.662
Sleep Efficiency−0.233.421[−7.50, 5.91]0.817
Light Sleep Duration0.020.130[−0.251, 0.256]0.983
Table 5. Full Multivariable Regression Results—Variability-Based Features (n = 78).
PredictorBetaSE95% CIp-Value
Light Sleep Duration−0.2730.149[−0.572, 0.025]0.072
REM Sleep Duration−0.3750.228[−0.832, 0.081]0.105
Sleep Efficiency−3.9902.470[−8.927, 0.946]0.111
Minutes Awake0.5760.406[−0.236, 1.388]0.161
Lightly Active Minutes0.1570.188[−0.220, 0.534]0.408
Age0.3280.469[−0.603, 1.260]0.487
Sedentary Minutes−0.0890.187[−0.462, 0.284]0.636
Minutes Asleep0.1990.429[−0.658, 1.056]0.644
Active Hours−0.0010.002[−0.006, 0.004]0.695
Sleep Duration in Hours−2.0246.024[−14.065, 10.017]0.738
Maximum Daily Heart Rate0.1290.880[−1.630, 1.889]0.884
Resting Heart Rate−0.1421.806[−3.753, 3.469]0.938
Average Daily Heart Rate−0.1592.083[−4.323, 4.004]0.939
Table 6. Feature-by-Feature Adjusted Regression Results—Variability-Based Features (n = 78).
Fitbit DataFeatureBetaSE95% CIp-ValueFDR q
SleepREM Sleep Duration−0.3940.187[−0.767, −0.021]0.0380.259
Light Sleep Duration−0.2260.111[−0.445, −0.006]0.0440.260
Sleep Duration in Hours−0.1300.070[−0.269, 0.008]0.0650.260
Deep Sleep Duration−5.6103.624[−12.830, 1.610]0.1250.377
Minutes Asleep−120.581235.237[−589.309, 348.147]0.6100.813
Sleep Efficiency−0.8792.084[−5.029, 3.271]0.6730.388
Minutes Awake−0.0560.285[−0.624, 0.512]0.8440.920
ActivityMVPA Minutes−0.1270.105[−0.336, 0.081]0.2280.454
Total Steps−0.0010.001[−0.004, 0.001]0.3580.613
Lightly Active Minutes0.0320.069[−0.106, 0.170]0.6450.957
Sedentary Minutes−0.0110.059[−0.129, 0.106]0.8510.920
Active Hours−0.0100.082[−0.171, 0.151]0.8920.920
Heart RateAverage Daily Heart Rate−0.7811.379[−3.529, 1.966]0.5730.813
Maximum Daily Heart Rate−0.2090.624[−1.452, 1.035]0.7390.958
Resting Heart Rate0.0471.788[−3.516, 3.610]0.9790.979
Minimum Daily Heart Rate−0.3020.775[−1.821, 1.217]0.9800.981
Note. Models adjusted for age and sex.
Table 7. Sensitivity analysis results.
ModelAdditional CovariateBetaSE95% CIp-ValueAdj. R2
Base modelAge + Sex−0.3700.192[−0.753, 0.013]0.0580.064
Sensitivity model-1+Mean total sleep time−0.3880.203[−0.792, 0.017]0.0600.052
Sensitivity model-2+Cognitive status−0.2810.189[−0.657, 0.095]0.1400.145
Sensitivity model-3+Vascular Risk Score (VRS)−0.3940.196[−0.783, −0.004]0.0480.063
Note. All models adjusted for age and sex. Cognitive status: Cognitive status: cognitively normal (CN) = reference category; mild cognitive impairment (MCI) and dementia dummy-coded. Mean total sleep time: Fitbit-derived 7-day average of daily sleep duration in hours. Beta values are for REM sleep duration variability. Base model p-value differs slightly from Table 6 (p = 0.038) due to MICE imputation in the primary analysis.
Disclaimer/Publisher’s Note: The statements, opinions and data contained in all publications are solely those of the individual author(s) and contributor(s) and not of MDPI and/or the editor(s). MDPI and/or the editor(s) disclaim responsibility for any injury to people or property resulting from any ideas, methods, instructions or products referred to in the content.