Article

Effects of High-Temperature Cycling on Dynamic Splitting Tensile Properties and Fragmentation Energy Dissipation Behavior of Sandstone


1
Huaibei Mining Holdings Co., Ltd., Huaibei 235000, China
2
School of Civil Engineering and Architecture, Anhui University of Science and Technology, Huainan 232001, China
*
Author to whom correspondence should be addressed.
Appl. Sci. 2026, 16(11), 5370; https://doi.org/10.3390/app16115370
Submission received: 19 April 2026 / Revised: 18 May 2026 / Accepted: 20 May 2026 / Published: 27 May 2026

Abstract

Dust and coal mine gas in deep mines are highly prone to causing fires, and the cyclic high temperatures generated by such fires are one of the key factors contributing to the instability of deep rock structures. To research the dynamic splitting tensile mechanical properties of sandstone subjected to high-temperature cycling, impact splitting tensile tests were performed on sandstone specimens under normal temperature and after high-temperature cycling treatments ranging from 250 °C to 900 °C using a split Hopkinson pressure bar (SHPB) with increasing cyclic temperature. The average dynamic tensile strength of sandstone specimens declines following a quadratic function, dropping from 18.07 MPa at T = 150 °C to a minimum value of 3.08 MPa, representing a maximum reduction of 82.96%. The dynamic strain and average strain rate exhibit increasing trends following exponential and logarithmic functions, respectively, while the dynamic elastic modulus exhibits a logarithmic declining trend. As the cyclic temperature grows, the degree of fragmentation of the specimens intensifies, transitioning from axial splitting failure to pulverization failure, with fragment size decreasing and fractal dimension exhibiting increasing trends. For temperatures between 450 °C and 600 °C, the dynamic tensile strength, dynamic strain, average strain rate, dynamic elastic modulus, average particle size, and fractal dimension all show a distinct interval behavior. As the cyclic temperature rises, the incident, reflected, and transmitted energies gradually decline. A higher fragmentation energy density corresponds to more severe specimen fragmentation, and the average fragment size follows a negative quadratic relationship with fragmentation energy density, which effectively quantifies the dynamic splitting tensile fragmentation behavior of rock. The findings of this study regarding the dynamic behavior and damage evolution of sandstone under cyclic high-temperature conditions can serve as a reference for assessing rock mass stability in high-temperature applications such as underground engineering and resource development.

1. Introduction

The extraction of mineral resources and the utilization of geothermal resources hold significant strategic importance for national development. As the depth of resource extraction continues to increase, the surrounding rock in deep, high-geothermal environments will remain under prolonged high-temperature conditions [1]. Additionally, the tunnel surrounding rock is often subjected to dynamic disturbances such as blasting vibrations or rock bursts. The issue of ‘three highs and one disturbance’ has become a critical factor constraining the safe production of rock engineering. Mine dust and coal mine gas are highly susceptible to fire, which can further raise the temperature of the surrounding rock [2]. Particularly in engineering contexts such as geothermal extraction, deep mining operations, and tunnel fires, the maximum temperature can reach up to 1000 °C. In some deep rock engineering practices, temperatures as high as 1200 °C have even been recorded [3]. Such high-temperature environments cause uneven thermal expansion among various mineral components within the rock or generate non-uniform temperature fields, leading to thermal cracking. Therefore, studying the effects of high-temperature cycling on the dynamic mechanical properties of rock is of great significance for the stability assessment of deep rock engineering and for disaster prevention and mitigation design.
The static and quasi-static mechanical behavior of rocks under thermal cycling has been extensively investigated. High-temperature cycling progressively deteriorates pore structure [4,5], leading to reductions in compressive strength, tensile strength, and elastic modulus with an increasing number of cycles [6,7,8]. Fragmentation behavior is similarly affected by cyclic temperature exposure [9,10]. Furthermore, Zhang et al. [11] conducted uniaxial compression tests on granite subjected to high-temperature and water-cooling cycles to investigate the relationship between the number of cycles and the compressive strength of specimens. Using Brazilian splitting tests on granite subjected to different temperature-cooling cycles, Li et al. [12] established correlations between thermal cycle count and P-wave velocity/tensile strength. Separately, the split Hopkinson pressure bar (SHPB) system has been widely employed to investigate the effects of elevated temperature on the dynamic mechanical properties of rocks. Regarding dynamic mechanical behavior, many researchers have found that the dynamic compressive strength and dynamic tensile strength of rock specimens first increase briefly and then gradually decrease with rising temperature, with a temperature threshold beyond which dynamic mechanical properties deteriorate sharply [13,14]. When high-temperature rocks are cooled in a water fluid medium, the temperature gradient inside the rock induces thermal shock stress, promoting thermal cracking [15]. Moreover, the initiation and propagation of thermal cracks reduce the fragment size of rock under dynamic loading and may increase the proportion of shear fractures [16]. In addition, strain rate and temperature gradient also influence the dynamic mechanical properties of high-temperature rocks. For example, Li et al. [17] conducted uniaxial impact compression tests on sandstone after exposure to 800 °C using a high-temperature furnace and an SHPB system, analyzing the variation patterns of dynamic mechanical properties of sandstone under different strain rates. Gu et al. [18] performed impact tests on red sandstone after exposure to 25, 400, and 800 °C using an SHPB system and analyzed the fracture morphology characteristics. The above research findings are mainly focused on the static mechanical properties and dynamic compressive behavior of rocks under high temperature or after high-temperature cycling, while relatively few studies have addressed the dynamic splitting tensile mechanical properties of rocks after high-temperature cycling.
Based on this, the present study aims to conduct high-temperature cycling tests on coal mine sandstone specimens using a box-type resistance furnace at temperatures of 150 °C, 300 °C, 450 °C, 600 °C, 750 °C, and 900 °C, with an additional control group tested at room temperature (25 °C). Impact splitting tensile tests under identical loading conditions will be performed on specimens subjected to different high-temperature cycles using a SHPB test apparatus. The study will investigate the effects of high-temperature cycling on dynamic mechanical parameters such as dynamic tensile strength, dynamic modulus of elasticity, and dynamic strain. Sieve analysis will be conducted on the impact-fragmented specimens to quantitatively evaluate the degree of fragmentation. SEM and XRD tests will be performed to analyze the influence of high-temperature treatment on the microstructure of sandstone. Finally, the influence of high-temperature cycling on the energy dissipation characteristics of sandstone during dynamic splitting tensile failure will be analyzed from an energy dissipation perspective.

2. Preparation of Specimens and SHPB Dynamic Splitting Tensile Tests

2.1. Sampling and Processing of Rock Specimens

The specimens were derived from a block of intact sandstone collected from Zhangji Coal Mine in Huainan City, China. In accordance with the methods prescribed by the International Society for Rock Mechanics (ISRM) [19], the rock block was cored, cut, and ground into cylindrical specimens measuring φ50 mm × 25 mm. The deviation of the end surface perpendicular to the specimen axis was less than 0.25°, and the end surface unevenness was ensured to be less than 0.05 mm, meeting the test requirements. Under room temperature conditions, the longitudinal wave velocity was 3232 m/s, and the density of the sandstone specimens was measured to be 2.528 g/cm3.
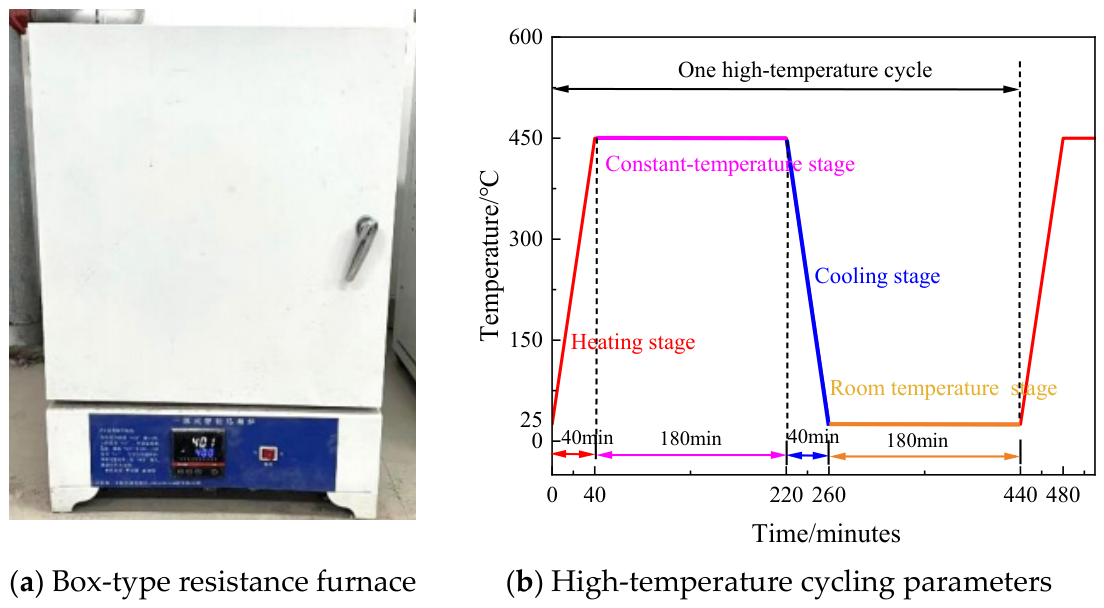
High-temperature cycling was carried out using a box-type resistance furnace, as displayed in Figure 1a. The furnace was equipped with an intelligent temperature control system featuring constant temperature control and timing functions. The specimens were uniformly set inside the furnace chamber for heating. The setpoint temperature can be set to one of six levels: 150, 300, 450, 600, 750, and 900 °C. The heating rate was set at 10 °C/min to ensure slow heating and avoid significant thermal damage to the specimens caused by excessively rapid temperature rise [20]. Maintain the temperature at the set value for 3 h to ensure an even temperature distribution throughout each specimen. The specimens were then removed and allowed to cool naturally to 25 °C. Preliminary experiments revealed that the maximum number of high-temperature cycles the sandstone could withstand at a target temperature of 900 °C was five cycles. Therefore, five repeated high-temperature cycles were performed to complete the preparation of specimens subjected to different high-temperature cycling conditions. During the high-temperature cycling process, the furnace temperature was recorded in real time, along with the time required to reach the target temperature and the time for the specimens to cool naturally to room temperature. Based on the relationship between temperature and time, a high-temperature cycling parameter diagram was plotted. Taking 450 °C as an example, the diagram is displayed in Figure 1b.

2.2. SHPB Dynamic Splitting Tensile Test

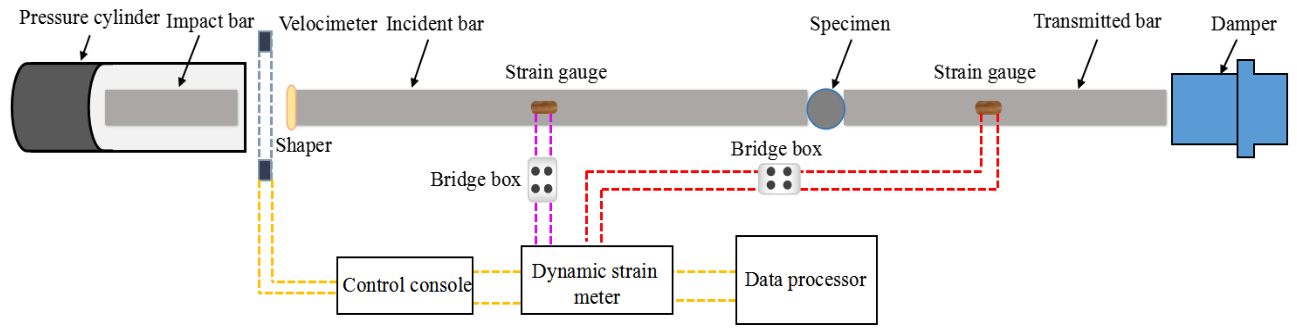
The SHPB impact test apparatus is presented in Figure 2. The apparatus mainly consists of a high-pressure gas chamber, an incident bar, an impact bar, a transmission bar, an absorption bar, a velocity measurement device, a buffer device, and a data processing system. Among these components, incident bar, the impact bar, absorption bar, and transmission bar are all elastic steel bars with a diameter of 0.05 m. The density of the steel bars is 7880 kg/m3, and the elastic modulus is 206 GPa. The lengths of the incident bar and transmission bar are 2.5 m and 2 m, respectively. Prior to the test, a copper disc was placed at the free end of the incident bar as a pulse shaper to mitigate the adverse effects of pulse oscillation and wave dispersion, thereby improving the accuracy of the test.
The signal wave data obtained by the strain gauges are processed using the “three-wave method” equation to acquire the dynamic stress, dynamic strain, and strain rate of the sandstone specimen, according to the one-dimensional stress wave propagation theory. The “three-wave method” formula for dynamic splitting tensile tests is shown in Equation (1) [21]:
σ d ( t ) = E 0 A 0 π D s L s ε I ( t ) + ε R ( t ) + ε T ( t ) ε d ( t ) = C 0 D s 0 τ ε I ( t ) ε R ( t ) ε T ( t ) d t ε ˙ d ( t ) = C 0 D s ε I ( t ) ε R ( t ) ε T ( t )
In the above equations, C 0 , E 0 , and A 0 represent the wave velocity (m/s), elastic modulus (N/mm2), and cross-sectional area (mm2) of the impact bar, incident bar, and transmission bar, respectively; t is the duration of the stress wave (μs); ε I ( t ) , ε R ( t ) and ε T ( t ) are the electrical signals of thereflected wave, incident wave, and transmitted wave measured on the incident bar and transmission bar at time, respectively; D s and L s are the diameter (mm) and thickness (mm) of the disc specimen, respectively.
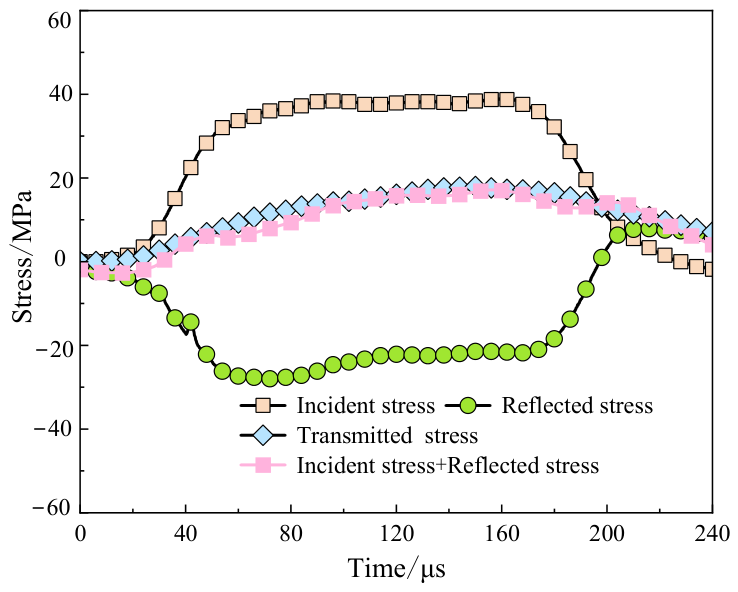
Figure 3 presents the dynamic stress balance verification for a typical specimen. It can be obtained from Figure 3 that the sum of the reflected and incident waves coincides well with the transmitted wave, indicating that stress equilibrium has been achieved in the sandstone specimen and that the test data are valid [22].

3. Test Results and Analysis

3.1. Dynamic Mechanical Properties Test Results

Sandstone specimens were subjected to target temperatures of 25 °C, 150 °C, 300 °C, 450 °C, 600 °C, 750 °C, and 900 °C to investigate the dynamic disturbance and failure of deep rock masses caused by in situ geothermal gradients and high-temperature cycling associated with blasting and mechanical excavation. The number of high-temperature cycles was set to five, and the impact pressure was fixed at 0.2 MPa. Dynamic splitting tensile tests were conducted on sandstone specimens subjected to five high-temperature cycles at different temperatures under the same impact pressure to investigate the variation patterns of various dynamic property indicators.
Dynamic splitting tests were performed on sandstone specimens after high-temperature cycling from 25 °C to 900 °C. The experimental data of relevant dynamic mechanical properties, including dynamic strain rate, dynamic strain, dynamic elastic modulus, and dynamic tensile strength, are presented in Table 1.

3.2. Dynamic Tensile Stress–Strain Curves

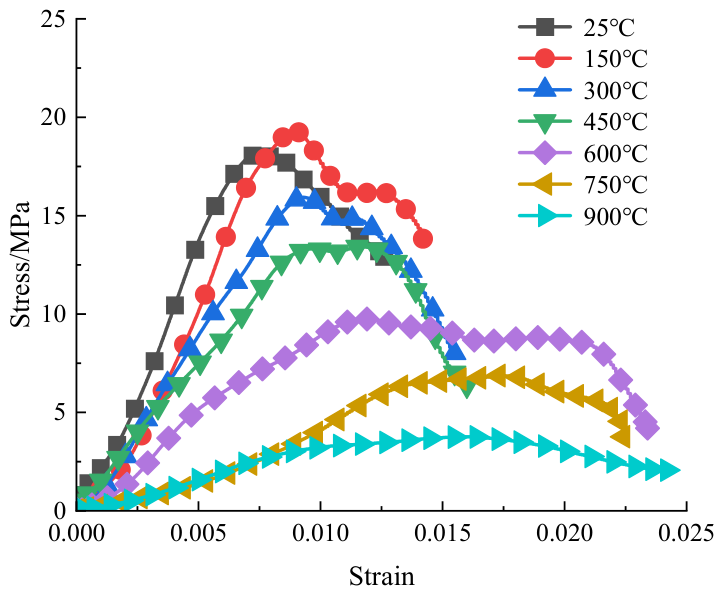
The dynamic splitting tensile stress–strain curves of sandstone specimens after five high-temperature cycles from 25 °C to 900 °C are presented in Figure 4. As can be displayed from Figure 4, with increasing temperature, the dynamic splitting tensile stress–strain curves of sandstone exhibit the following evolution law: the slope of the elastic stage gradually declines; the peak stress first rises slightly and then declines significantly; the peak strain gradually increases; and the rate of post-peak stress decline gradually transitions from a sharp drop to a slow decrease. It is worth observing that when the temperature rises from 450 °C to 600 °C, a distinct “plateau” feature appears in the post-peak stage of the curve, indicating that the initiation and propagation of thermal-induced microcracks consume part of the energy, thereby delaying the unstable failure.

3.3. Dynamic Tensile Strength

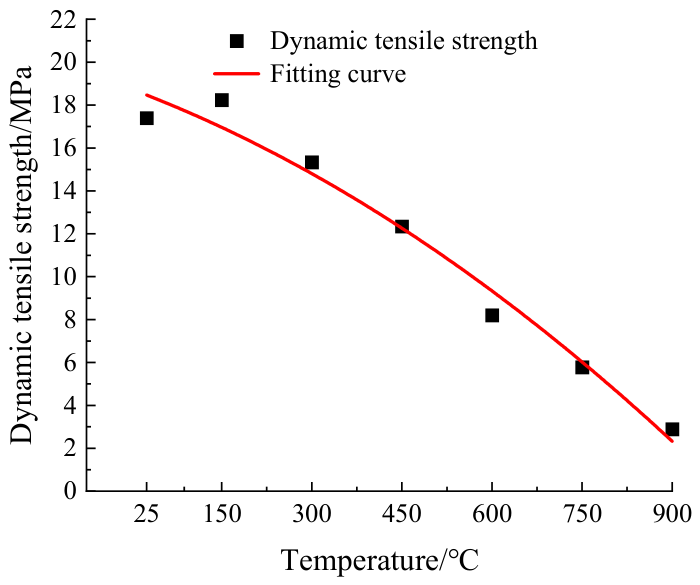
After five high-temperature cycles from 25 °C to 900 °C, the average dynamic tensile strength σ d of sandstone specimens varies with temperature, as displayed in Figure 5. A quadratic polynomial function well describes this relationship, indicating a pronounced temperature effect. The fitted equation is expressed as follows:
σ d = 19.138 0.013 T 6.077 × 10 6 T 2     R 2 = 0.987
Structural thermal stress damage leads to a steady decline in dynamic tensile strength with increasing temperature (150–900 °C), as shown in Figure 5. The strength decreases from 18.07 MPa at 150 °C to 15.12, 12.79, 8.67, 5.86, and 3.08 MPa, corresponding to reductions of 16.33%, 29.22%, 52.02%, 67.57%, and 82.96%, respectively. The reduction rate of dynamic tensile strength decreases with rising temperature, and this declining trend becomes more pronounced when the temperature surpasses 450 °C. This is because the quartz within the rock undergoes an α-β phase transition at temperatures around 500 °C, leading to differential expansion between the quartz grains and other minerals. As a result, microcracks in the specimen increase and expand [23]. With the growing number of microcracks, the thermal stress damages the internal structure of the rock exacerbates the reduction in tensile strength.

3.4. Variation Pattern of Dynamic Tensile Strain

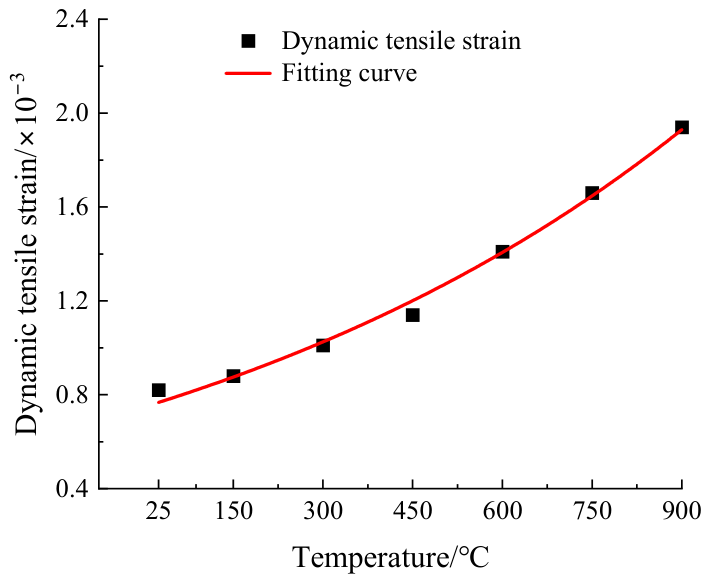
Strain, as one of the key indicators for evaluating rock deformation parameters, holds significant reference value. Since the differences in the thermal expansion and contraction coefficients of the constituent mineral particles within the rock, thermal deformation becomes inconsistent during cyclic heating and cooling processes, leading to an increase in deformation with rising temperature. Figure 6 shows the variation in the average dynamic tensile strain of sandstone specimens after five high-temperature cycles from 25 °C to 900 °C with temperature.
An approximately exponential relationship between temperature T and the dynamic tensile strain ε d of sandstone after high-temperature cycling is observed in Figure 6, with the fitting equation given as follows:
ε d = e 0.719 + 0.002 T             R 2 = 0.982
It can also be seen in Figure 6 that compared to the dynamic tensile strain at room temperature (25 °C), the dynamic tensile strains of sandstone after high-temperature cycling from 150 °C to 900 °C increase by 16.22%, 31.08%, 45.95%, 79.73%, 120.27%, and 140.54%, respectively. These increased figures indicate that 450 °C is an approximate transition point for dynamic tensile strain: when the cycling temperature is within the 450 °C range, the increase in dynamic tensile strain of the sandstone specimens is less than 50%. This is because, within this temperature range, the gradual increase in temperature causes thermal expansion of the mineral particles inside the rock due to heating. This thermal expansion induces frictional movement between the mineral particles, leading to mutual compression between the particles. The interparticle pressure causes the closure of existing internal pores and microcracks, making the internal structure more compact. Consequently, no significant increase in dynamic strain occurs. When the cycling temperature exceeds 450 °C, the quartz within the sandstone undergoes an α-β phase transition at around 500 °C, resulting in an increase in the number of cracks. This leads to a sustained and substantial increase in dynamic strain, with increases exceeding 50%. This trend is consistent with the observed variation pattern in tensile strength degradation.

3.5. Variation Pattern of Average Strain Rate

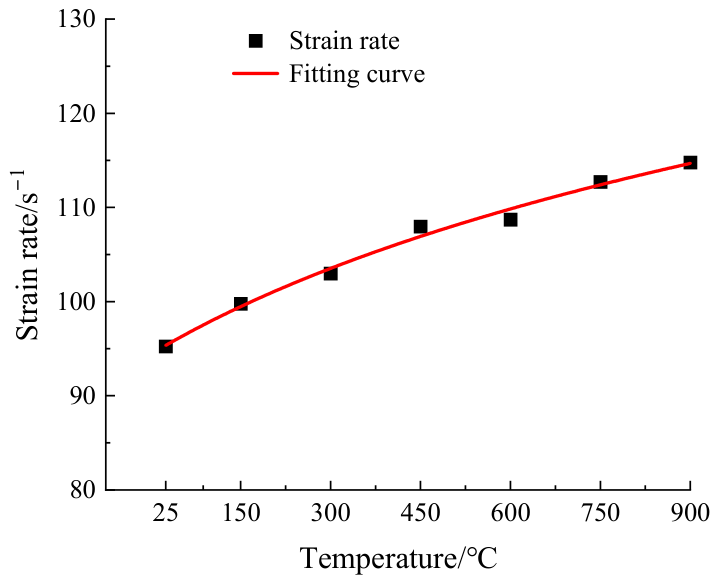
Figure 7 displays the variation in the average strain rate of sandstone specimens after five high-temperature cycles from 25 °C to 900 °C with temperature. As illustrated in Figure 7, the post-cycling average strain rate of sandstone rises with temperature T in an approximately logarithmic manner. The fitting relationship is expressed as follows:
ε ˙ d = 36.777 + 20.814 ln ( T + 546.277 )     R 2 = 0.985
Under high-temperature conditions, weakened interparticle bonding reduces the rock’s resistance, accelerating microcrack initiation and propagation under impact, and rendering it more prone to plastic deformation during dynamic loading. Meanwhile, the strain rate, as a macroscopic characterization of the deformation rate, increases logarithmically with rising temperature. This indicates, to some extent, that sandstone exhibits a significant rate dependence under the coupled effects of impact loading and high-temperature cycling.

3.6. Variation Pattern of Dynamic Elastic Modulus

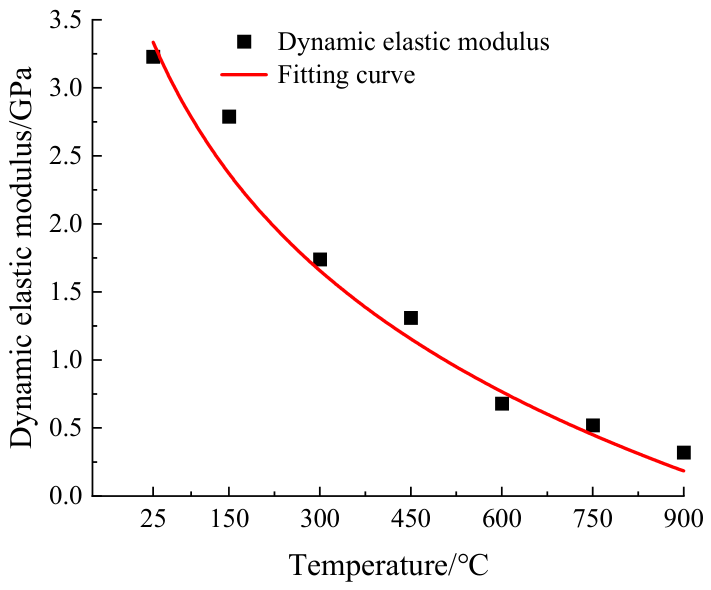
Figure 8 displays the variation in the average dynamic elastic modulus of sandstone specimens after five high-temperature cycles from 25 °C to 900 °C with temperature. It can be observed from Figure 8 that the dynamic elastic modulus of sandstone specimens after different high-temperature cycles decreases with rising temperature. After undergoing high-temperature cycling from 150 °C to 900 °C, the dynamic elastic modulus of the sandstone specimens decreases from 2.52 GPa at room temperature to 2.12, 1.55, 1.13, 0.68, 0.42, and 0.20 GPa, respectively. This is attributed to the intensification of internal thermal damage within the sandstone specimens as the temperature increases during cyclic high-temperature exposure, leading to an increase in microcracks and their gradual development and interconnection into larger fractures, thereby reducing the specimens’ ability to resist deformation. Figure 8 also shows that the dynamic elastic modulus of sandstone after high-temperature cycling follows a logarithmic function of temperature T. The fitted relationship (Equation (5)) yields a correlation coefficient of 0.972, indicating a pronounced temperature effect.
E d = 12.084 1.713 ln ( T + 140.151 )     R 2 = 0.972

4. Fragmentation Fractal and Microstructural Characteristics

4.1. Macroscopic Fragmentation Morphology

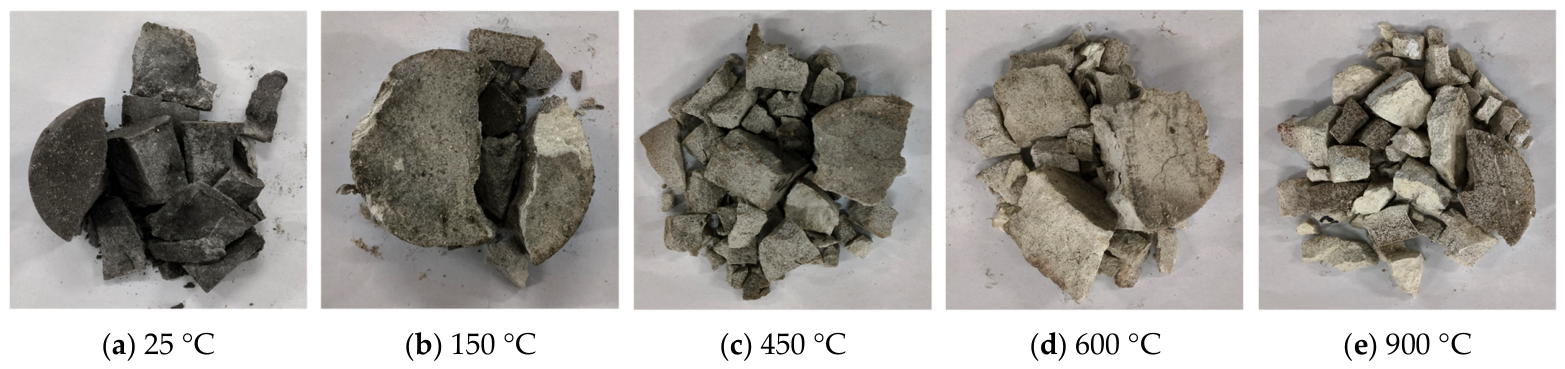
The dynamic splitting tensile failure morphologies of typical sandstone specimens subjected to impact loading after cyclic treatment at 25 °C and at different high temperatures (150 °C, 450 °C, 600 °C, and 900 °C) are summarized in Figure 9. Figure 9 demonstrates a clear temperature dependence of fragmentation severity: below 450 °C, fragmentation is limited and fragments are relatively large, while higher temperatures lead to more severe fragmentation. Each specimen consists of 2 to 4 relatively intact fragments along with some debris. When the temperature exceeds 450 °C, the degree of fragmentation intensifies, and the specimens break into several irregular fragments. The fragment sizes become smaller, and the number of small-sized fragments increases. At 900 °C, the fragments are predominantly small, and the degree of specimen fragmentation is the most severe.

4.2. Fractal Dimension

For a quantitative assessment of the dynamic splitting tensile fragmentation of sandstone specimens following different high-temperature cycles, the average fragment size ds were used as a characterization parameter, as shown in Equation (6).
d s = r i d i r i
In the equation, d i displays the average size of the fragments retained on the sieve with aperture, r i displays the corresponding mass fraction of the fragmented specimens.
A high-frequency vibrating sieve machine (model STSJ-4) was used to sieve the fragments through standard square-hole sand and stone sieves with apertures of 0.15, 0.30, 0.60, 1.18, 2.36, 4.75, 9.50, and 13.2 mm. The mass of the fragmented blocks retained on each sieve aperture was weighed. The resulting fragment size distribution of the specimens containing pores is presented in Table 2.
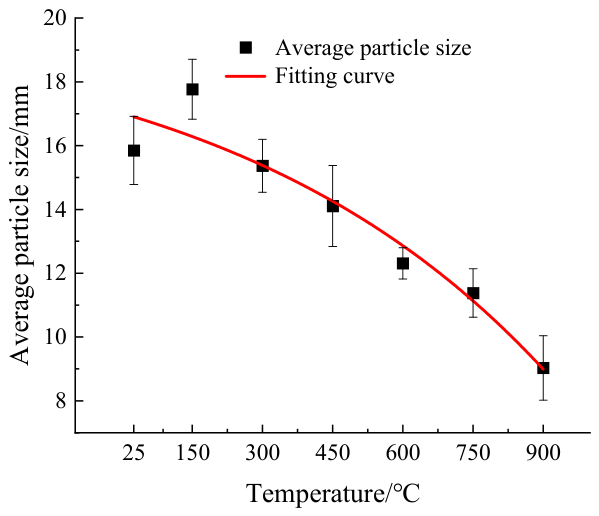
Figure 10 presents the variation trend of the average fragment size of dynamically split tensile fragmented sandstone specimens with cyclic treatment temperature. From Table 2 and Figure 10, it can be inferred that when the temperature is below 450 °C, the average fragment size of the split tensile fragments of sandstone specimens shows relatively little change. After undergoing high-temperature cycling from 450 °C to 900 °C, the average fragment size decreases significantly, from 14.11 mm to 9.03 mm, representing a reduction of up to 36.01%. This is because as the temperature rises, the internal thermal stress damage within the specimens intensifies, cracks gradually develop and interconnect, and the internal structure deteriorates, leading to a decrease in the average fragment size of the sandstone. The relationship between the cyclic treatment temperature and the average fragment size ds of the sandstone specimens can be presented by an exponential function, with a correlation coefficient of 0.972, indicating a significant temperature effect.
d s = 20.722 3.032 e r 695.568
Since the average fragment size can only reflect the degree of dynamic splitting tensile fragmentation of the specimen but cannot intuitively characterize and quantify the distribution characteristics of the sandstone fragment sizes, and since the fragmentation fractal dimension serves as a quantitative indicator of the degree of fragmentation—where a larger fractal dimension indicates more fragments and a correspondingly higher degree of fragmentation—the fractal theory was therefore adopted to establish the relationship between size of rock fragments and the mass. The fractal dimension D was calculated using Equations (8) and (9) [24].
D = 3 b
lg M r / M T = ( 3 D ) lg ( r / r m )
In the equations, Mr is the cumulative mass of fragments with a particle size smaller than r; MT is the total mass of the sandstone specimen; r and rm are the fragment size and the maximum fragment size, respectively; and b is the slope of the fitted straight line.
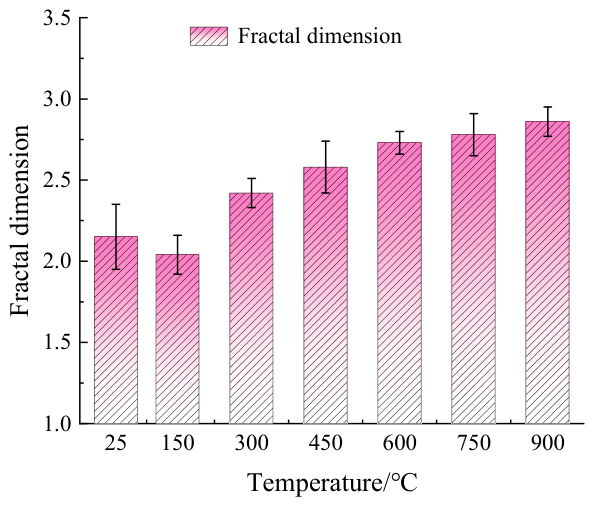
Using the slopes derived from fragment fitting, fractal dimensions for sandstone fragments under different cyclic temperatures were calculated via Equations (8) and (9). The results are displayed in Figure 11. Table 2 and Figure 11 indicate that the fractal dimension does not change significantly when the temperature is below 450 °C. When the temperature ranges from 450 °C to 900 °C, the fractal dimension increases sharply, from 2.06 to 2.76, representing an increase of up to 33.98%. This is because when the temperature is below 450 °C, the average fragment size of the specimens is relatively large, and the fragment size distribution is relatively simple, resulting in a smaller fractal dimension. As the cyclic treatment temperature increases, thermal stress within the specimen structure intensifies, causing a rise in the number of internal cracks and the enlargement of pores. This results in a higher degree of fragmentation of the specimens, and consequently, a significant rise in the fractal dimension.

4.3. Microstructure

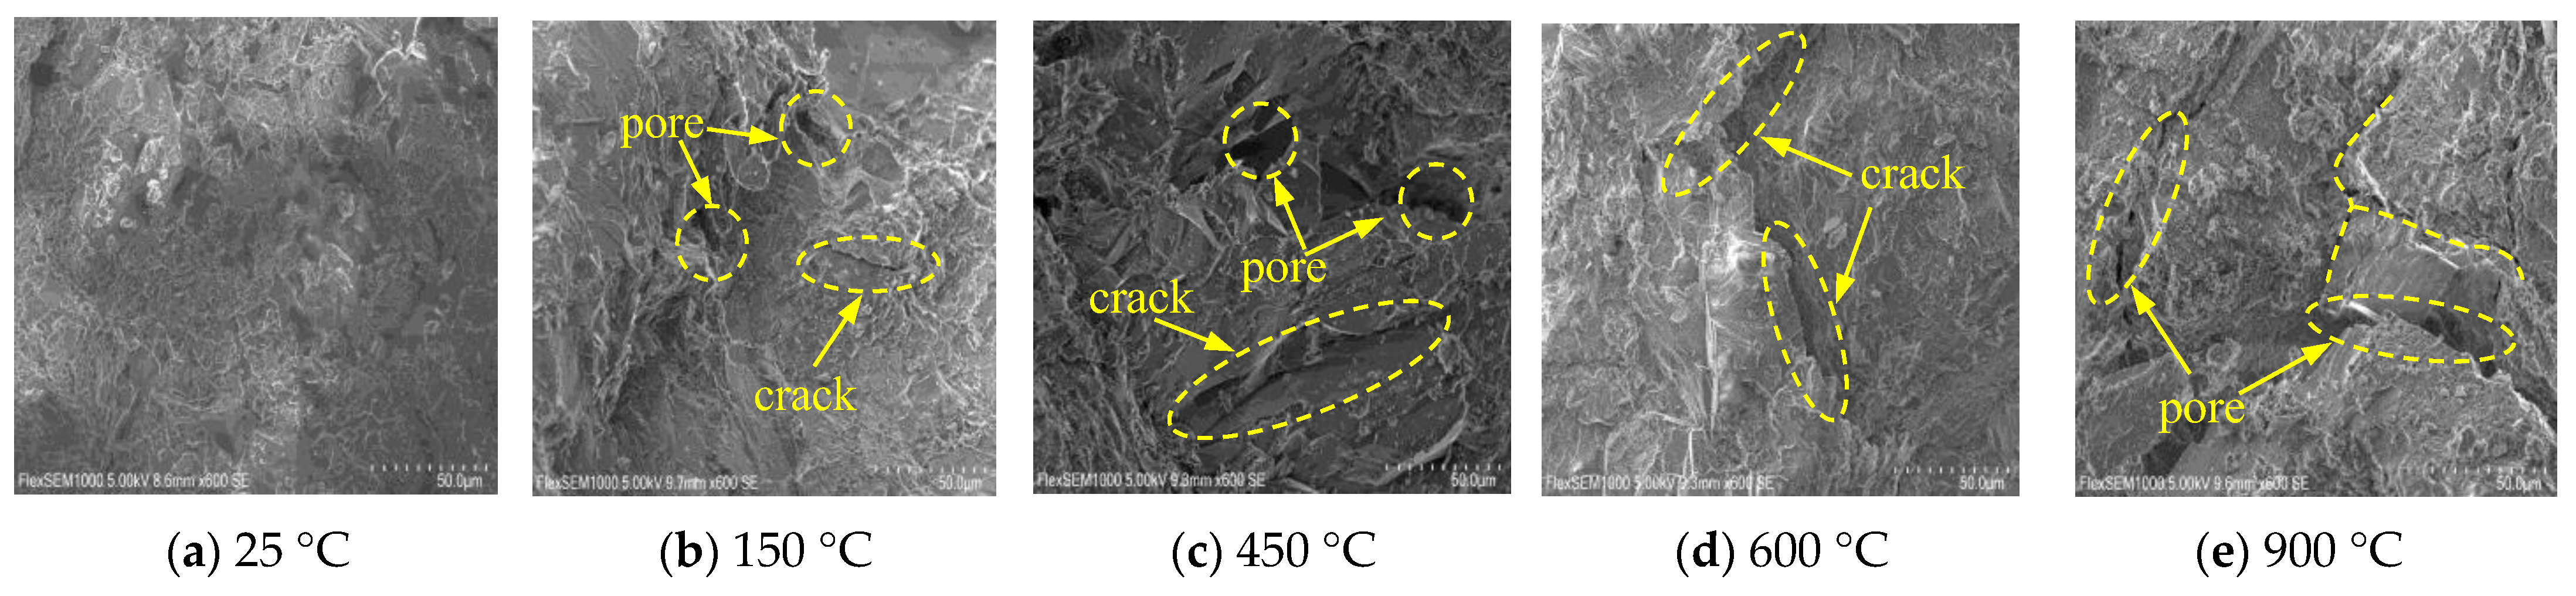
SEM analysis was performed on the fracture surface morphology of rock specimens subjected to temperatures of 25 °C, 150 °C, 450 °C, 600 °C and 900 °C to determine the microstructural damage characteristics of sandstone specimens under typical high-temperature cycling conditions, as displayed in Figure 12. The distribution of microcracks within the sandstone specimen, as can be seen in Figure 12, is uneven, and the connectivity between microcracks is poor. After high-temperature cycling at 150 °C, the free water inside the rock evaporates, the mineral crystals undergo thermal expansion, the number of microcracks and pores grows, and the thermal cracks remain in a closed state. After high-temperature cycling at 450 °C, dehydration of biotite minerals occurs within the specimen, crystals undergo thermal expansion, and connected fissures appear at weakly cemented interfaces. After high-temperature cycling at 600 °C and 900 °C, the bound water in the sandstone specimen volatilizes, crystals expand, quartz, albite, and calcite minerals undergo thermal decomposition, and connected cracks appear within the mineral crystals. The results indicate that when the high-temperature cycling temperature exceeds 450 °C, the thermal cracks in the sandstone specimens are in a distinctly open state, and the opening scale of the cracks increases with the increase in the high-temperature cycling temperature.
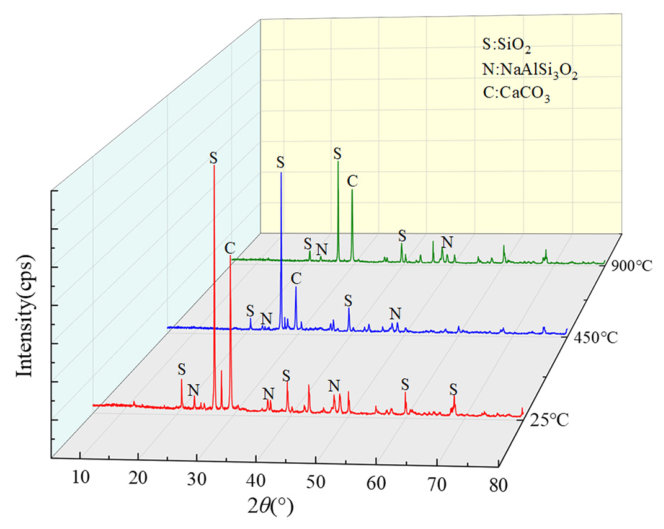
X-ray diffraction (XRD) scans were performed on rock specimens subjected to typical temperatures of 25 °C, 450 °C, and 900 °C, and the typical XRD patterns of sandstone are shown in Figure 13. As can be seen from Figure 13, the main components of natural sandstone are quartz [SiO2], albite [Na(AlSi3O8)], and calcite [CaCO3]. When the cyclic temperature reaches 450 °C and 900 °C, the diffraction intensities of the main components, quartz and albite, decrease. The reduction in the height of their characteristic diffraction peaks indicates a gradual decrease in the main constituents of the sandstone, thereby demonstrating that the strength of the sandstone gradually diminishes as the cycling temperature increases.

5. Energy Dissipation Evolution

5.1. Energy Calculation

The processes of energy accumulation, dissipation, and release accompany external loading on sandstone specimens. Consequently, studying energy dissipation throughout specimen deformation and failure enables analysis of the dynamic mechanical properties of rock.
The electrical signals collected by the strain gauges on the transmission bar and the incident bar were calculated and analyzed to obtain the transmitted energy, reflected energy, incident energy, and absorbed energy. The calculation equations are as follows [25]:
W I = A 0 E 0 c 0 0 t ε I 2 ( t ) d t W R = A 0 E 0 c 0 0 t ε R 2 ( t ) d t W T = A 0 E 0 c 0 0 t ε T 2 ( t ) d t
W D = W I W R W T
H R = W R W I ,   H T = W T W I ,   H D = W D W I
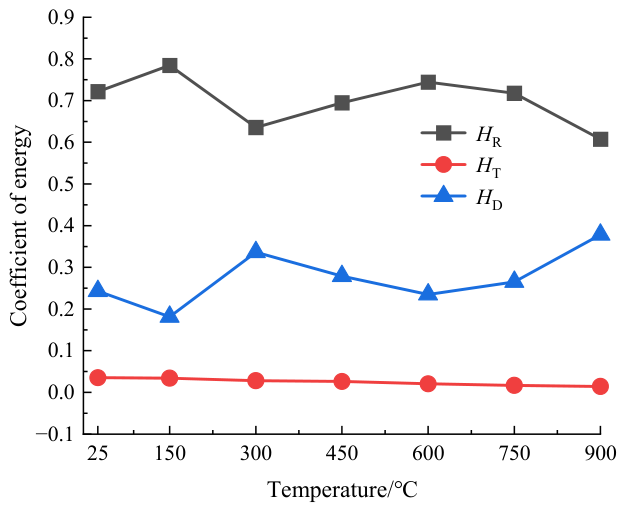
In the equations, WR(t), WI(t), WD(t) and WT(t) denote the reflected energy, incident energy, absorbed energy, and transmitted energy, respectively. HR, HT, HD represent the energy ratios of incident, reflected, and transmitted energy, respectively. The calculated energy results are presented in Table 3.
Figure 14 shows the variation in dynamic energy coefficients of sandstone specimens under different temperature cycles. It can be observed from Figure 14 and Table 3 that as the cyclic treatment temperature increases, the incident energy, reflected energy, transmitted energy, and the proportion of transmitted energy generally exhibit a gradually decreasing trend, while the absorbed energy, the proportion of reflected energy, and the proportion of absorbed energy show fluctuating trends. This indicates that thermal damage leads to a decrease in the wave impedance of the rock and weakens its stress wave propagation capability. When the cyclic treatment temperature reaches 450 °C, the largest decrease occurs. At this temperature, which corresponds to the full development of internal microcracks and the α-β phase transition of quartz in the rock [23], energy absorption is primarily used for crack initiation, propagation, and frictional dissipation. When the temperature becomes higher, the rock structure severely deteriorates, the specimen rapidly fragments under impact, the energy storage capacity significantly decreases, and a large amount of energy is dissipated in the form of reflected waves.

5.2. Fragment Size and Fragmentation Energy Consumption

The proportion of absorbed energy to incident energy remains constant during specimen fragmentation. However, in SHPB tests, the fragmentation energy consumption per unit volume may vary due to differences in specimen dimensions. Therefore, the fragmentation of energy density can be used to describe energy consumption during specimen fragmentation. The calculation formula is as follows:
w d = W D V s
In the equation, wd displays the fragmentation energy density; WD is absorbed energy; and Vs displays the volume of the specimen.
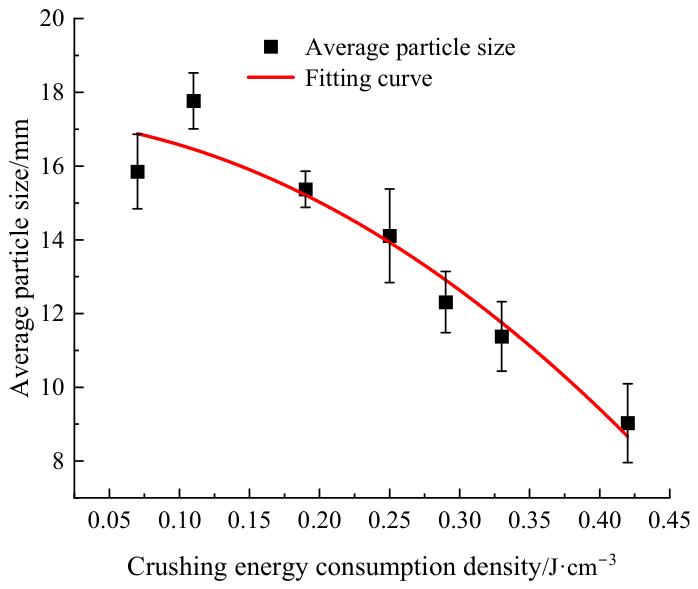
The relationship between the calculated fragmentation energy density and the average particle size is summarized in Figure 15.
As illustrated in Figure 15, the average fragment size of sandstone increases quadratically with decreasing fragmentation energy density, exhibiting a strong negative correlation (correlation coefficient = 0.926). Equation (14) presents the fitting relationship, and the corresponding curve is summarized in Figure 15.
d s = 17.296 3.029 w d 71.402 w d 2
This is because as the cyclic temperature rises, the sandstone specimens absorb more energy, and the energy consumed during their deformation and failure processes correspondingly increases, leading to the formation of more cracks, thereby generating more fracture surfaces and smaller fragments. When the fragment size of the sandstone specimens decreases, the fragmentation surface area per unit volume increases. Correspondingly, the energy consumed during the fragmentation process also increases, resulting in a more severe degree of fragmentation.

6. Conclusions

(1) A quadratic polynomial function well describes the relationship between cycling temperature and dynamic tensile strength of sandstone. Increasing cycling temperature leads to exponential growth in dynamic strain, logarithmic growth in average strain rate, and a logarithmic decrease in dynamic elastic modulus.
(2) With increasing cyclic temperature, the average particle size shows a decreasing trend, whereas the fractal dimension exhibits an increasing trend. Consequently, the failure mode transitions from axial splitting to pulverization failure.
(3) The variation amplitudes of dynamic tensile strength, dynamic strain, average strain rate, dynamic elastic modulus, average particle size, and fractal dimensions of the specimens exhibit a distinct interval behavior within the temperature range of T = 450~600 °C. Moreover, the opening scale of internal cracks in the sandstone increases significantly with the rise in high-temperature cycling.
(4) A gradual decrease in incident, reflected, and transmitted energies is observed as the cycling temperature increases from 25 °C to 900 °C. Additionally, a quadratic function well describes the relationship between the average fragment size of crushed sandstone specimens and the fracture energy density.

Author Contributions

Conceptualization, X.X.; data curation, X.X.; funding acquisition, Q.P.; methodology, Q.P.; software, B.Z.; supervision, X.X., B.Z. and Q.P.; validation, X.X.; visualization, X.X. and B.Z.; writing-original draft, Q.P. and B.Z. All authors have read and agreed to the published version of the manuscript.

Funding

This research was funded by Natural Science Foundation of China grant number [52074005] and [52074006].

Data Availability Statement

The raw data supporting the conclusions of this article will be made available by the authors on request.

Conflicts of Interest

Author Xiao Xuan is employee of the company Huaibei Mining Holdings Co., Ltd. The remaining authors declare that the research was conducted in the absence of any commercial or financial relationships that could be construed as a potential conflict of interest.

References

  1. Li, M.; Wu, Z.; Weng, L.; Zhou, Y.; Liu, Q. Evaluating the pore characteristics of granite in disposal system under thermo-hydro-mechanical (T-H-M) coupling. Int. J. Rock. Mech. Min. Sci. 2022, 160, 105237. [Google Scholar] [CrossRef]
  2. Shi, X.; Li, H.; Liu, Y.; Zhang, H. Experimental study on deterioration law of filling paste by mine. Metal. Mine 2019, 12, 168–172. [Google Scholar]
  3. Li, H.Z.; Guo, G.L.; Zheng, N.S. High-temperature effects of the surrounding rocks around the combustion space area in SMFM-CRIP: A case study in China. Energy Sources Part A Recovery Util. Environ. Eff. 2018, 40, 2021–2036. [Google Scholar]
  4. Gu, Q.; Huang, Z.; Zhong, W.; Li, S.; Wu, Y.; Wu, Y. Study on the variations of pore structure and physico-mechanical properties of granite after high temperature cycling. Chin. J. Rock. Mech. Eng. 2023, 42, 1450–1465. [Google Scholar]
  5. Zhang, B.; Ping, Q. Experimental Study on Dynamic Mechanical Response Characteristics and Damage Mechanisms of Deep Sandstone Under THM Coupling. Rock. Mech. Rock. Eng. 2026. [Google Scholar] [CrossRef]
  6. Yu, L.; Peng, H.; Zhang, Y.; Li, G.; Zhu, H.; Han, Z. Effects of the number of water-heat cycles on the physical and mechanical properties of granite. Sci. Technol. Eng. 2021, 21, 703–713. [Google Scholar]
  7. Sun, Q.; Geng, J.; Zhao, F. Experiment study of physical and mechanical properties of sandstone after variable thermal cycles. Bull. Eng. Geol. Environ. 2020, 79, 3771–3784. [Google Scholar] [CrossRef]
  8. Guo, Y.; Qin, Y.; Xu, N.; Lei, H.; Xu, J.; Zhang, B.; Feng, S.; Chen, L. The Influence of Periodic Temperature on Salt Rock Acoustic Emission, Strength, and Deformation Characteristics. Appl. Sci. 2025, 15, 8848. [Google Scholar] [CrossRef]
  9. Wang, J.; Dai, F.; Liu, Y.; Tan, H.; Zhou, P. Thermophysical-mechanical behaviors of hot dry granite subjected to thermal shock cycles and dynamic loadings. J. Rock. Mech. Geotech. Eng. 2025, 17, 5437–5452. [Google Scholar] [CrossRef]
  10. Dong, Z.; Chen, Y.; Xu, H.; Zhao, Y.; Ren, B.; Chen, H.; Wang, F. Experimental study on mechanical properties of weakly weathered gneiss in high temperature water-rich tunnel. Chin. J. Rock. Mech. Eng. 2025, 44, 128–139. [Google Scholar]
  11. Zhang, B.; Tian, H.; Dou, B.; Zheng, J.; Chen, J.; Zhu, Z.; Liu, H. Macroscopic and microscopic experimental research on granite properties after high-temperature and water-cooling cycles. Geothermics 2021, 93, 102079–102080. [Google Scholar] [CrossRef]
  12. Li, C.; Hu, Y.; Zhang, C.; Zhao, Z.; Jin, P.; Hu, Y.; Zhao, G. Brazilian split characteristics and mechanical property evolution of granite after cyclic cooling at different temperatures. Chin. J. Rock. Mech. Eng. 2020, 39, 1797–1807. [Google Scholar]
  13. Wu, Q.; Weng, L.; Zhao, Y.; Guo, B.; Luo, T. On the tensile mechanical characteristics of fine-grained granite after heating/cooling treatments with different cooling rates. Eng. Geol. 2019, 253, 94–110. [Google Scholar] [CrossRef]
  14. Zhou, T.; Zhang, Y.; Fan, Y.; Chen, J.; Zhou, C.; Xie, H.; Zhu, J. Effect of high-temperature and strain rate on the mechanical and cracking behaviors of flawed sandstone under dynamic impact loading. Theor. Appl. Fract. Mech. 2024, 131, 104405. [Google Scholar] [CrossRef]
  15. Zhang, R.; Jing, L. Analysis on the fragment and energy dissipation of deep sandstone after high/low temperature treatment in SHPB tests. J. China Coal Soc. 2018, 43, 1884–1892. [Google Scholar]
  16. Yin, T.; Men, J.; Lu, J.; Wu, Y.; Guo, W.; Yang, Z.; Ma, J. Study on dynamic mechanical properties and microscopic damage mechanisms of granite after dynamic triaxial compression and thermal treatment. Case Stud. Therm. Eng. 2024, 61, 104910. [Google Scholar] [CrossRef]
  17. Li, M.; Mao, X.B.; Cao, L.L.; Mao, R.R.; Tao, J. Experimental study of mechanical properties on strain rate effect of sandstones after high temperature. Rock. Soil. Mech. 2014, 35, 3479–3488. [Google Scholar]
  18. Gu, C.; Xu, J.; Meng, B.; Wen, M.; Lou, C. Dynamic mechanical behavior and mesoscopic analysis of two layered sandstone after high temperature. J. China Coal Soc. 2019, 44, 2710–2720. [Google Scholar]
  19. Ulusay, R. The ISRM Suggested Methods for Rock Characterization, Testing and Monitoring: 2007–2014; Springer International Publishing: Cham, Switzerland, 2015; pp. 51–68. [Google Scholar]
  20. Zheng, F.; Jiang, A.; Jiang, T.; Jiang, H.; Guo, X. Study on mechanical characteristics and damage model of layered sandstone after high temperature action. Case Stud. Constr. Mater. 2023, 19, e02601. [Google Scholar] [CrossRef]
  21. Chen, J.; Zhou, L.; Zhang, X.; Zeng, X.; Lin, J. Dynamic Tensile Characteristics Analysis and Tensile Constitutive Model of the Rock-Shotcrete Interface Under Different Rock Layers. Rock. Mech. Rock. Eng. 2025, 58, 13113–13132. [Google Scholar] [CrossRef]
  22. Ping, Q.; Li, X. Analysis of the Fracture Characteristics and Crack Propagation Mechanism of Fractured Sandstone under Dynamic Loading. Appl. Sci. 2024, 14, 2042. [Google Scholar] [CrossRef]
  23. Xi, Y.; Wang, H.; Jiang, J.; Fan, L.; Li, J.; Guo, B. Impacts of different cooling methods on the dynamic tensile properties of thermal-treated granite. Int. J. Rock. Mech. Min. Sci. 2023, 169, 105438. [Google Scholar] [CrossRef]
  24. Wang, K.; Feng, G.; Bai, J.; Guo, J.; Shi, X.; Cui, B.; Song, C. Dynamic behaviour and failure mechanism of coal subjected to coupled water-static-dynamic loads. Soil. Dyn. Earthq. Eng. 2022, 153, 107084. [Google Scholar] [CrossRef]
  25. Zhou, Z.; Cai, X.; Li, X.; Cao, W.; Du, X. Dynamic Response and Energy Evolution of Sandstone Under Coupled Static–Dynamic Compression: Insights from Experimental Study into Deep Rock Engineering Applications. Rock. Mech. Rock. Eng. 2020, 53, 1305–1331. [Google Scholar] [CrossRef]
Figure 1. Box-type resistance furnace and high-temperature cycling parameters.
Applsci 16 05370 g001
Figure 2. SHPB diagram.
Applsci 16 05370 g002
Figure 3. Stress equilibrium curve of typical specimen.
Applsci 16 05370 g003
Figure 4. Dynamic splitting tensile stress–strain curves.
Applsci 16 05370 g004
Figure 5. Relationship between dynamic tensile strength and temperature.
Applsci 16 05370 g005
Figure 6. Relationship between temperature dynamic and tensile strain.
Applsci 16 05370 g006
Figure 7. Relationship between average strain rate and temperature.
Applsci 16 05370 g007
Figure 8. The relationship between temperature and dynamic elastic modulus.
Applsci 16 05370 g008
Figure 9. Typical dynamic splitting tensile failure modes of sandstone after normal temperature and high temperature cycles.
Applsci 16 05370 g009
Figure 10. The variation trend of the average particle size of the broken block with the effect of the circulating temperature.
Applsci 16 05370 g010
Figure 11. The variation trend of fractal dimension with cyclic temperature.
Applsci 16 05370 g011
Figure 12. Microstructure of sandstone specimens under different high temperature cycles.
Applsci 16 05370 g012
Figure 13. XRD patterns of sandstone under different high-temperature cycles.
Applsci 16 05370 g013
Figure 14. Changes in dynamic energy coefficient of sandstone specimens under different temperature cycles.
Applsci 16 05370 g014
Figure 15. The relationship between the average particle size and the calculated fragmentation energy density.
Applsci 16 05370 g015
Table 1. Dynamic splitting test data of sandstone under different high temperature cycles.
TemperatureSpecimen NumbersTensile Strength/MPaElastic Modulus/GPaRate/s−1Strain/×10−3Tensile Strength
Standard Deviation/MPa
25 °CGR25-0117.922.1895.880.820.34
GR25-0217.603.3395.240.53
GR25-0317.242.0496.440.86
150 °CGR150-0118.242.0798.660.880.16
GR150-0218.021.9199.780.95
GR150-0317.942.3999.930.75
300 °CGR300-0114.941.47102.341.010.20
GR300-0215.341.54102.980.99
GR300-0315.081.64104.550.92
450 °CGR450-0113.941.21106.341.081.01
GR450-0212.341.06107.981.14
GR450-0312.081.12106.551.02
600 °CGR600-018.740.62109.021.410.42
GR600-028.200.68108.141.34
GR600-039.020.74108.741.23
750 °CGR750-015.840.41111.241.600.09
GR750-025.780.39112.161.66
GR750-035.950.45112.781.63
900 °CGR900-013.420.22114.321.730.29
GR900-022.890.18114.801.68
GR900-032.940.19115.601.94
Table 2. Particle size distribution and fractal dimension of fragmentation under high temperature cycle.
T/°CMass of Fragments on Each Sieve Mesh/gTotal Mass/gAverage Particle Size/mmStandard Deviation/mmFractal DimensionR2
<0.15 mm0.15~0.3 mm0.3~0.6 mm0.6~1.18 mm1.18~2.36 mm2.36~4.75 mm4.75~9.5 mm9.5~13.2 mm>13.2 mm
250.360.672.334.284.7813.9830.9638.6750.68146.7115.851.072.150.98
1500.270.530.963.763.3211.8328.1836.1561.23146.2317.770.942.040.94
3000.420.881.844.845.2613.1829.4239.5145.89141.2415.370.832.420.93
4500.891.132.424.956.7415.4731.0541.3240.23144.2014.111.272.580.96
6001.212.094.215.367.7117.2237.0745.6632.11152.6412.310.492.730.96
7502.444.145.366.428.7218.0239.7948.2429.44162.5711.380.762.780.91
9004.896.097.198.259.5821.2145.1251.9816.72171.039.031.012.860.95
Table 3. Dynamic splitting energy data of sandstone specimens under different high temperature cycles.
TemperatureSpecimen NumbersWI/JWR/JWT/JWD/JStandard Deviation/J
25 °CGR25-0184.2361.022.0421.171.40
GR25-0286.0263.423.0419.56
GR25-0389.2462.864.0422.34
150 °CGR150-0191.0868.882.1720.033.88
GR150-0278.4263.953.9110.56
GR150-0387.4468.752.6916.01
300 °CGR300-0184.1459.212.1722.764.74
GR300-0287.3854.592.4430.35
GR300-0388.0651.222.6834.16
450 °CGR450-0183.8459.082.2122.551.29
GR450-0282.5458.142.1622.24
GR450-0382.4855.722.1424.62
600 °CGR600-0176.1458.441.6116.091.93
GR600-0278.2257.321.5819.32
GR600-0379.4258.231.6419.55
750 °CGR750-0179.8454.621.0124.214.34
GR750-0281.7456.671.3223.75
GR750-0374.9758.531.6514.79
900 °CGR900-0173.7446.421.2226.114.62
GR900-0279.2442.681.1835.38
GR900-0375.9449.940.8925.11
Disclaimer/Publisher’s Note: The statements, opinions and data contained in all publications are solely those of the individual author(s) and contributor(s) and not of MDPI and/or the editor(s). MDPI and/or the editor(s) disclaim responsibility for any injury to people or property resulting from any ideas, methods, instructions or products referred to in the content.