Article

Vibration Comfort Assessment of a Timber Floor System Based on Measurements and Numerical Analysis


by
Sławomir Dudziak
1,*,
Łukasz Czerwiński
1,
Jan Malanowski
1,2 and
Mateusz Politański
1
1
Faculty of Civil Engineering, Warsaw University of Technology, Armii Ludowej Ave. 16, 00-637 Warsaw, Poland
2
PFEIFER Polska Sp. z o.o., Wrocławska St. 68, 55-330 Krępice nr Wrocław, Poland
*
Author to whom correspondence should be addressed.
Appl. Sci. 2026, 16(11), 5369; https://doi.org/10.3390/app16115369
Submission received: 16 April 2026 / Revised: 17 May 2026 / Accepted: 19 May 2026 / Published: 27 May 2026
(This article belongs to the Section Civil Engineering)

Abstract

This paper presents an extended combined experimental and numerical study on the vibration comfort assessment of a modern timber-framed public utility building. The research focuses on a lightweight skeleton floor system, representing a typical high-frequency floor. In situ vibration measurements were conducted under various walking excitations (single and multiple pedestrians) to determine key vibration parameters. Post-processing, which yielded root mean square accelerations and velocities, was performed using a custom-developed code in the Mathematica package. A finite element model was prepared in Dlubal RFEM 6 using shell and beam elements with offsets. The dynamic characteristics obtained from the FE modal analysis showed high consistency with the experimental data, with a relative error of approximately 5 % for the fundamental frequency. The vibration comfort was assessed using two distinct methodologies: the JRC report and the SCI P354 guide. Both approaches positively verified the floor’s vibration comfort, confirming its suitability for the intended use. The study demonstrates that the JRC methodology is more straightforward and unambiguous for engineering practice. Furthermore, the results indicate that simplified FE models provide a reliable basis for predicting vibration modes and calculating mode shape factors, which are essential for the correct interpretation of local measurements in existing buildings.

1. Introduction

Timber structures are becoming increasingly popular in Poland and other European countries due to their sustainability (near-zero carbon footprint) and good structural performance (favourable mass-to-strength ratio) [1,2,3]. On the other hand, their lightweight nature requires structural designers to pay special attention to vibration issues, especially those related to horizontal vibrations of high-rise buildings caused by wind forces and human-induced vertical vibrations of floor systems [4]. Excessive vibrations can also be the outcome of paraseismic excitations caused by, e.g., railway or road traffic [5,6,7,8]. It should be mentioned that even more lightweight solutions are currently being developed [9,10], so the importance of vibration issues cannot be questioned.
Many studies have been devoted to developing models that can reliably and efficiently predict the dynamic response of timber floors, as well as establishing reasonable vibration serviceability criteria for lightweight slabs. Zhang et al. [11] compared vibration comfort assessment criteria among European countries. The comparison was illustrated by three examples involving different types of timber joists (solid, I-beams, and with metal webs) and two spans. Rijal et al. [12] performed an experimental modal analysis of timber beam units, which resulted in the first three natural frequencies, corresponding vibration modes and damping ratios for each mode. Quang Mai et al. [13] conducted an extensive experimental campaign on hybrid CLT-concrete composite floors, consisting of dynamic tests with modal hammers, and subsequent strength tests up to failure. Many contributions related to the topic can be found in the PhD thesis of Muhammad [14], such as a new pedestrian model, an attempt to account for the vibration response induced by multiple pedestrians, or a probability-based assessment framework. Opazo-Vega et al. [15] presented the outcomes of a comparison between laboratory and in situ vibration measurements aimed at determining the damping characteristics of separate and built-in timber panels. To assess the probability of adverse comments, they applied the Vibration Dose Value (VDV) [16]. Hassan et al. [17] compared the design procedure and structural performance, including serviceability vibration criteria, of floors made of cross-laminated timber and concrete. Cheraghi-Shirazi et al. [18] evaluated methods of vibration comfort assessment for long-span steel-timber composite floors. They concluded that for modern advanced flooring systems, simplified assessment methods based on compliance estimation should not be used, and that analyses based on finite element models and in situ measurements should be performed. An even more detailed comparison of various vibration comfort assessment methods is presented by Karampour et al. [19]. Their summary is supplemented by two case studies concerning CLT and cassette floors. Ge et al. [20], using a validated FE model, quantified the influence of various modelling uncertainties on the dynamic response of a timber floor made of glue-laminated beams covered with OSB. Guo et al. [21] experimentally and numerically assessed the vibration comfort of mass timber slabs supported by glulam beams and found that support conditions have a strong influence on the dynamic characteristics of such slabs. They also noted that the analytical formulas proposed in Eurocode 5 can significantly overestimate the fundamental natural frequency. Halilovic [22] conducted in situ measurements of a 6 m span timber-concrete composite slab and compared them with the results of FE calculations.
As seen from this short literature review, the assessment of vibration comfort for long-span timber or hybrid floor systems is a timely problem. Many methods and criteria have been proposed; however, case studies concerning existing structures are rather scarce, with a few exceptions [15,22]. Extensive verification of most methods by different research teams still appears to be needed. One of the most versatile is the One-Step Root Mean Square Method proposed in the JRC report [23] in 2009. In the same year, another methodology was proposed by Steel Construction Institute in the report SCI P354 [24]. It is based on the weighted root mean square acceleration and vibration dose value (VDV). It is worth mentioning that both methodologies [23,24] provide direct instructions for designing new buildings, and do not explain how to assess the vibration comfort of existing buildings in use.
The aim of this paper is to verify and compare both methodologies with respect to high-frequency lightweight timber floor systems, which has not been reported in the literature before. The basis for verification is a recently completed public-utility building in Warsaw, whose main load-bearing structure is almost entirely made of timber. Such a structural solution is rather uncommon in Poland; consequently, the paper delivers data for a new interesting case study. It should be noted that the literature review does not contain a floor of exactly the same typology, and the closest slab solution is analysed in [20]. Another objective is to propose and validate a methodology for the quick assessment of existing structures based on these standards, by combining vibration measurements with FE modal analysis results, which provides a novel assessment methodology in such a scenario.
The paper is organised in a standard manner, with the introduction, methods, results, discussion sections clearly distinguished. First, the analysed building and the specific standard methodologies [23,24] used for assessment are described. The Methods section details the measurement and signal processing methodologies, alongside the assumptions for the FE modal analysis performed using the engineering-purpose finite element code RFEM 6 [25]. The Results section contains, in particular, the outcomes of vibration measurements, natural frequencies and modes determined with FEM, and the analytical assessment according to both methodologies. Finally, the results of the measurements and the analytical assessment according to both methodologies are compared and discussed.

2. Analysed Building and Assessment Methods

2.1. Analysed Building

The analysed building was completed in 2024 and is now used as a library. It has received several architectural awards for its aesthetic appeal and sustainable design. It has a rectangular plan with dimensions of ca. 24.0 × 14.7 m2 and two above-ground storeys. The clear height of the storeys ranges from 3.4 to 4.4 m. The structure is founded on a 0.28 m thick RC raft foundation.
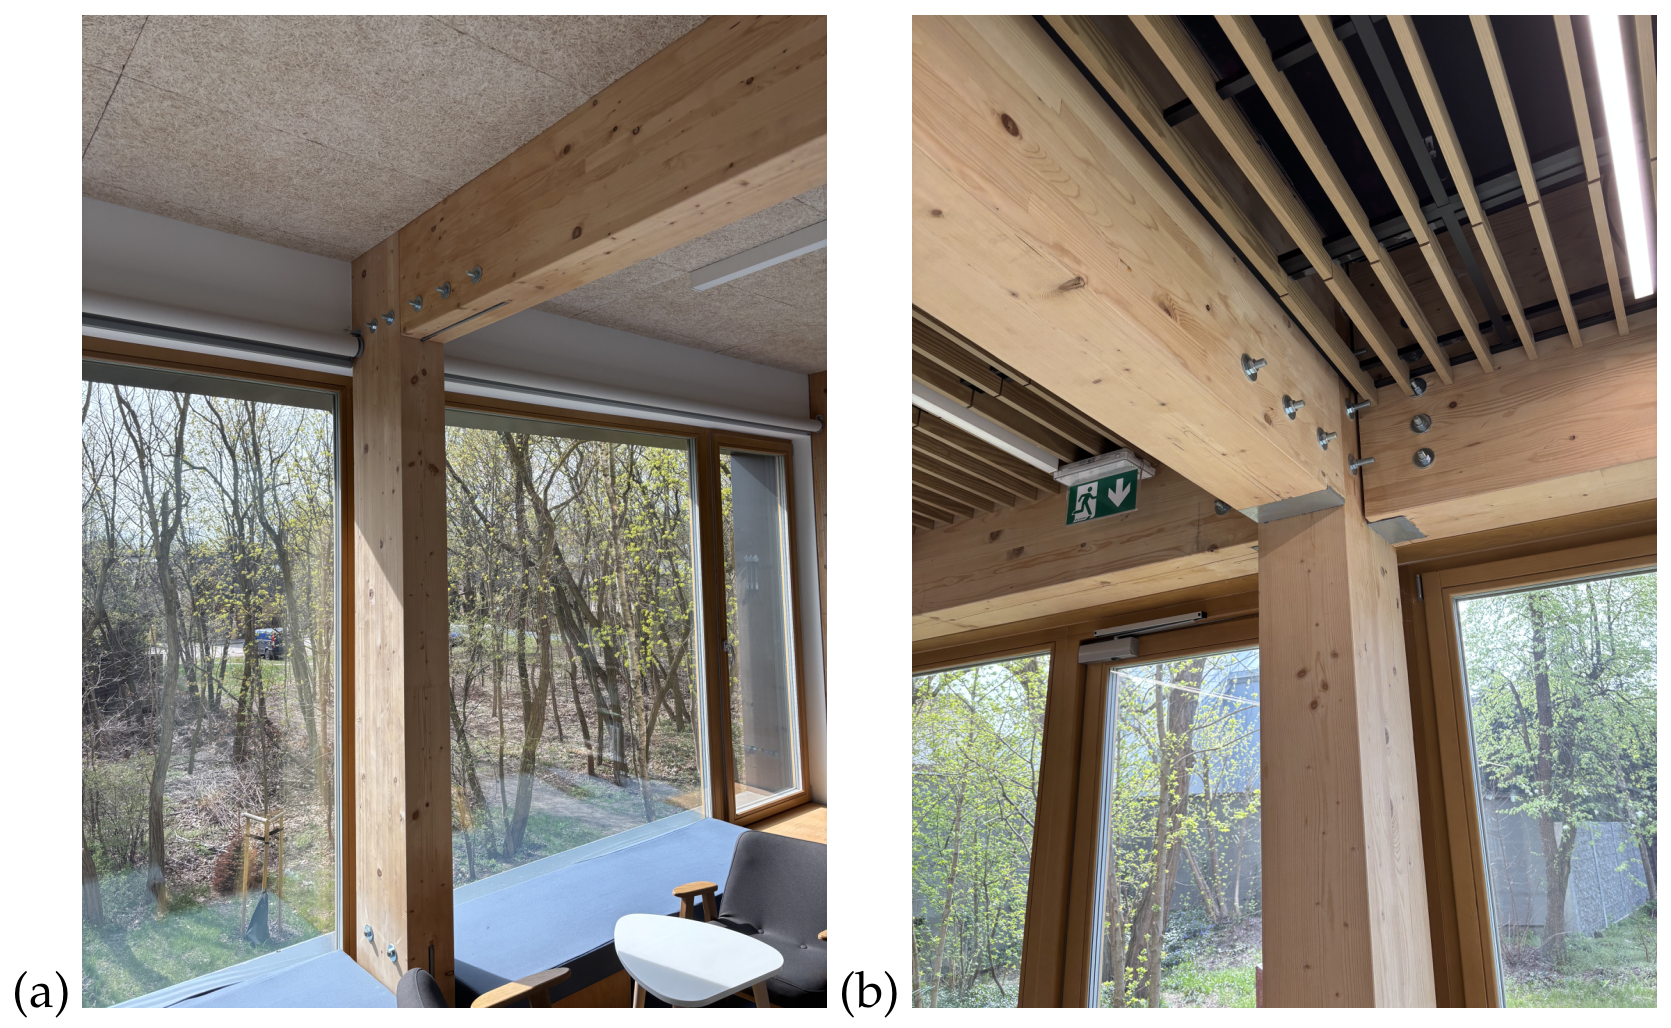
The building’s walls are designed as prefabricated timber frame structures. The wall studs are made of C24-grade finger-jointed structural timber. The wall panels are capped with a top plate and a sill plate. The thermal insulation of the external walls consists of a 20 cm thick wood wool layer, supplemented by 4 cm of mineral wool on the exterior, with a 2 cm ventilation gap. The walls are covered with 1.8 cm thick gypsum fibre boards. The stairwell walls are constructed of precast RC panels, while one of the external walls is made of calcium silicate blocks to meet fire safety requirements. The main columns and beams are made of glue-laminated timber GL24, and their cross-sectional dimensions are 24 × 36 cm2 and 24 × 80 cm2, respectively. The structural connection between the glulam beams and the columns is achieved using concealed steel connectors and high-strength through-bolts with washers; see Figure 1.
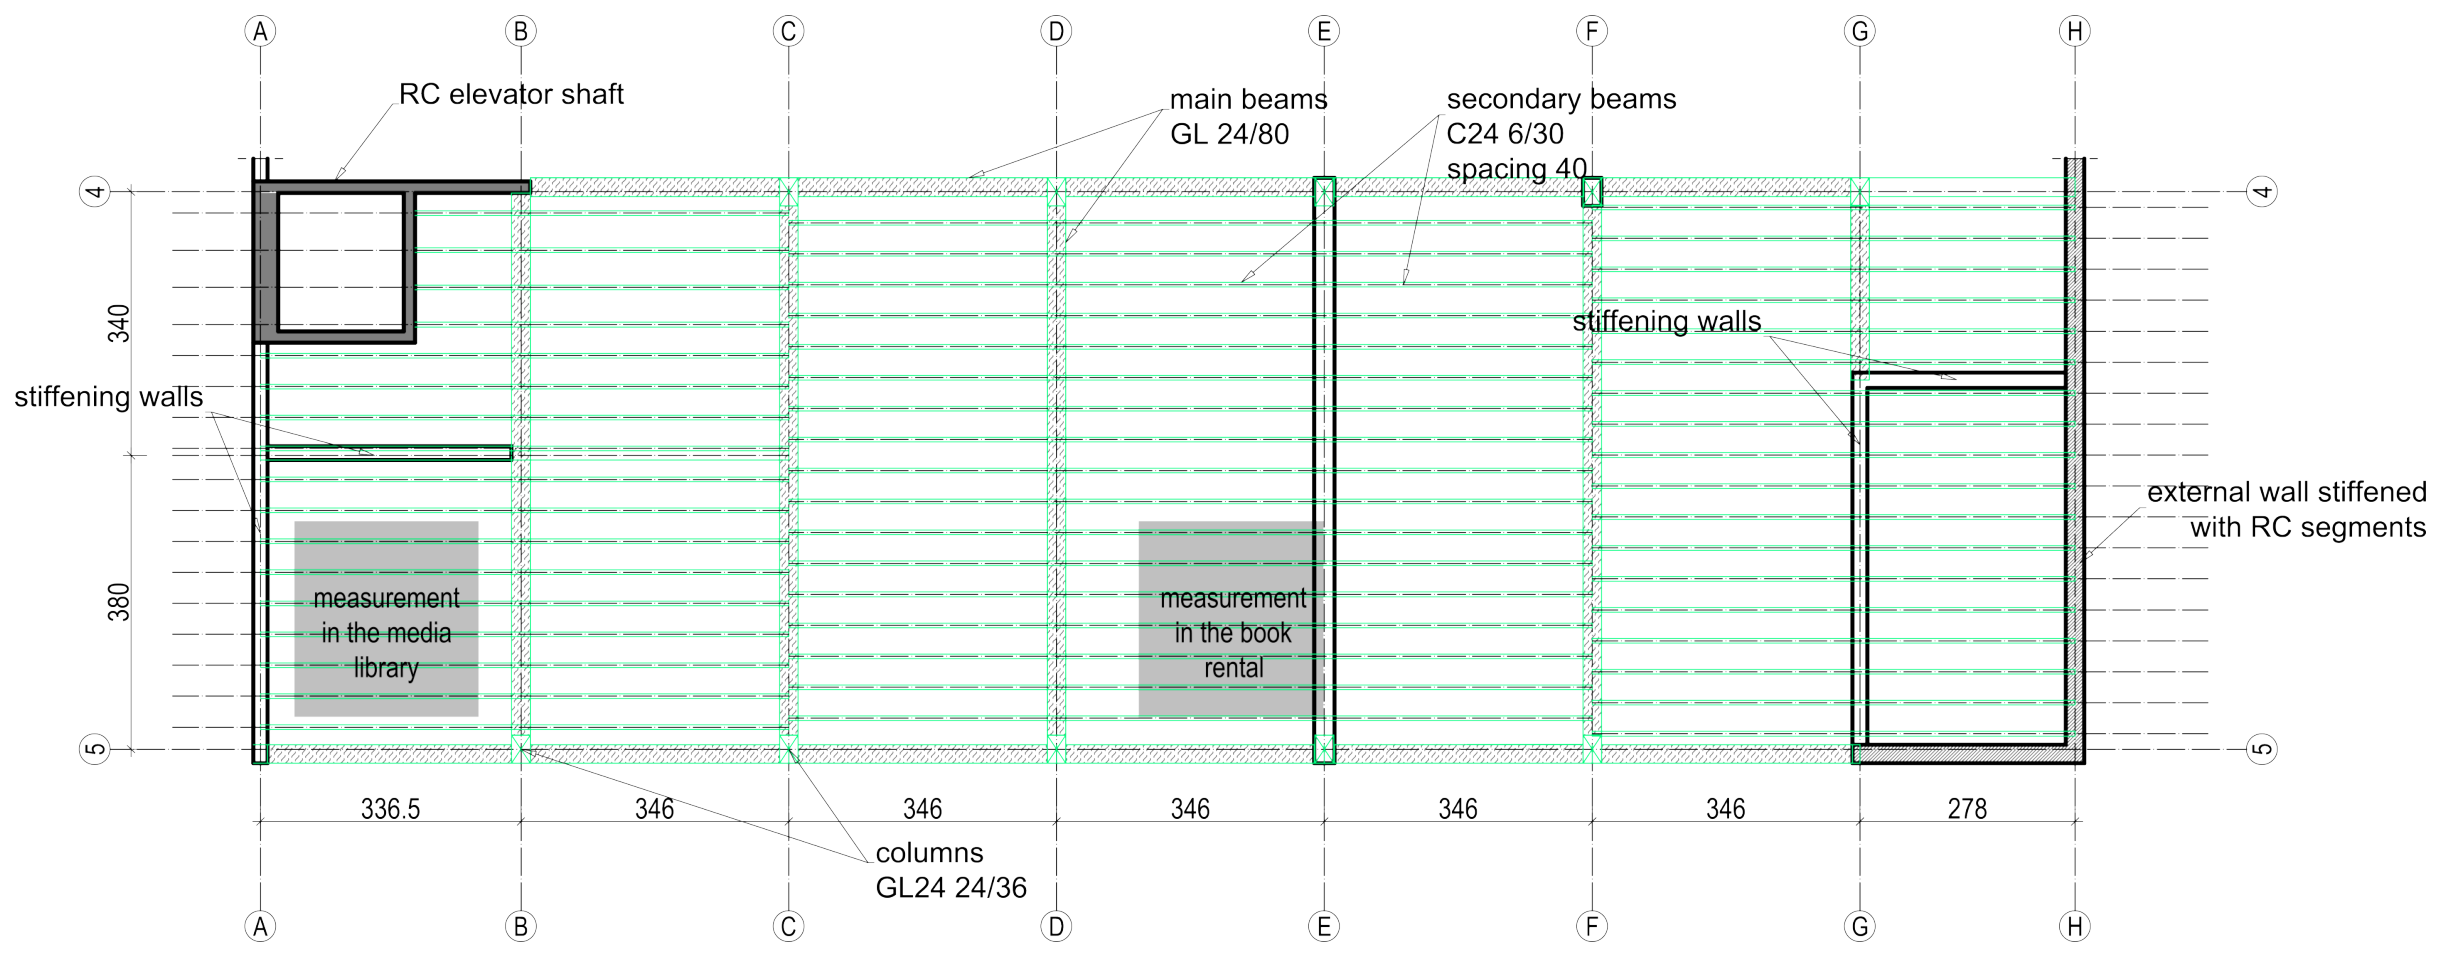
The timber floor system consists of prefabricated panels with C24-grade joists with a cross-section of 6 × 30 cm. The joist spacing is 40 cm or 48 cm. The joists are supported by wall top plates and either timber or steel beams. They are covered from above with 2.2 cm thick OSB-3 or MFP structural boards and from below with 1.2 cm MFP boards. Additionally, a 1.25 cm thick type DF fire-rated gypsum plasterboard was installed on the underside for fire protection. The floor structure includes a vapour barrier beneath the OSB board and thermal insulation made of expanded polystyrene (EPS). A 6 cm thick C25/30 concrete screed with integrated underfloor heating was poured over the EPS. The final flooring consists of 1.5 cm thick natural linoleum, with porcelain tiles used in the sanitary rooms. The floor joists are connected to the timber wall top plates using structural screws. The structural scheme of the analysed floor is shown in Figure 2.

2.2. Assessment Methodology According to JCR Report

A relatively simple methodology for vibration comfort assessment is proposed in the report [23]. Its straightforward formulation makes it easy to implement by practising structural designers. It is based on the outcomes of research performed at the TNO building in Delft [26] involving measurements of 700 persons. Its basic algorithm consists of three main steps:
  • Calculating eigenfrequencies and corresponding modal masses using FEM or analytical models.
  • Calculating the total % of the critical damping value (D) according to the formula:
    D = D 1 + D 2 + D 3
    where D 1 —the structural damping (%), D 2 —the damping due to furniture (%), and D 3 —the damping due to finishings (%).
  • Estimating of O S - R M S 90 values (one-step root mean square velocity value that is larger than 90 % fractile of peoples’ walking steps, unitless) values using the attached design charts.
O S - R M S is calculated from velocity time histories after weighting with the function B ( f ) , which accounts for the frequency-dependent human perception of vibrations. The aforementioned function and quantity are defined as follows:
B ( f ) = 1 v 0 1 1 + ( f f 0 ) 2
O S - R M S = 1 T s t t + T s v B ( τ ) d τ
where v 0 = 1 m s , f 0 = 5.6 Hz , T s —the single step duration (s), and v B —the velocity time history ( m s ) after weighting with function B ( f ) (unitless) obtained from dynamic analysis or measurements. It is worth mentioning that O S - R M S according to this definition is a unitless quantity.
Based on the estimated O S - R M S 90 value, the flooring system can be classified into one of six vibration perception classes (A to F).

2.3. Assessment Methodology According to SCI Report

The second approach is proposed by the SCI report P354 [24]. It distinguishes between two possible durations of vibration: continuous and intermittent. The former can be assessed using the weighted root mean square value of acceleration time histories, whereas for the latter, calculating the vibration dose value (VDV) is recommended. According to the report [24], vibration due to human walking rarely causes continuous vibrations; however, RMS acceleration can be used for a quick estimation of vibration comfort.
According to the report [24], the following weighting function can be used for vertical vibrations.
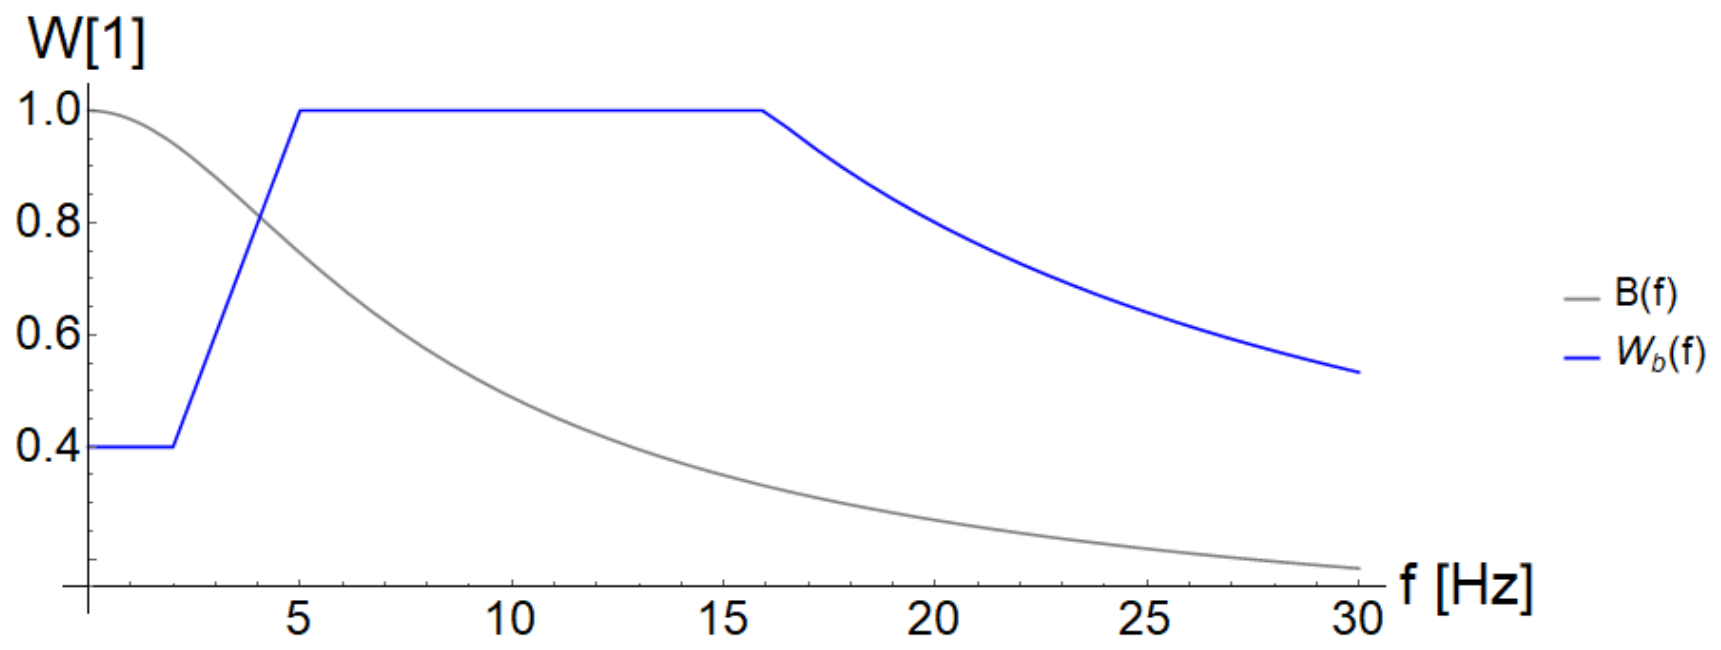
W b ( f ) = 0.4 for 1 Hz < f < 2 Hz f 5 for 2 Hz f < 5 Hz 1.0 for 5 Hz f 16 Hz 16 f for f > 10 Hz
The comparison of W b ( f ) with the filter for velocities B ( f ) defined by Equation (2) is shown in Figure 3.
The report proposes different formulas for the analytical estimation of RMS accelerations for low-frequency (fundamental frequency up to 10 Hz) and high-frequency floors (fundamental frequency above 10 Hz). For high-frequency floors, the following formula can be used:
a w , r m s = 2 π μ e μ r 185 M f 0 0.3 Q 700 1 2 W
where μ e , μ r —the mode shape factors for the point of excitation and the point of response, respectively (both unitless), M—the modal mass (kg), f 0 —the fundamental frequency of the floor (Hz), Q—the static force exerted by an “average person” (with a mass of 76 kg), and W—the weighting factor for human perception of vibrations (unitless).
Once the weighted RMS acceleration is calculated ( a w , r m s expressed in m s 2 ), the response factor (R) can be calculated:
R = a w , r m s 0.005
and then compared to a multiplying factor depending on the intended use of the room. For instance, this factor is equal to 4 for offices or 2 to 4 for residential buildings during the day. If R exceeds the multiplying factor, a further assessment shall be conducted using VDV. To this end, the walking velocity v should be first calculated using the formula:
v = 1.67 f p 2 4.83 f p + 4.50
where 1.7 Hz f p 2.4 Hz—the walking frequency.
It is then used to estimate the duration of activity ( T a in s), and the number of times activity can occur in an exposure period and still correspond to a ’low probability of adverse comment’:
n a = 1 T a V D V l i m i t 0.68 · a w , r m s 4
where V D V l i m i t —the adjusted VDV limit for a low probability of adverse comments taken from Table 8.5 of the SCI report [24] ( m s 1.75 ). Finally, the probability of n a activities should be assessed by the person performing the vibration comfort verification.

2.4. Vibration Measurement Setup

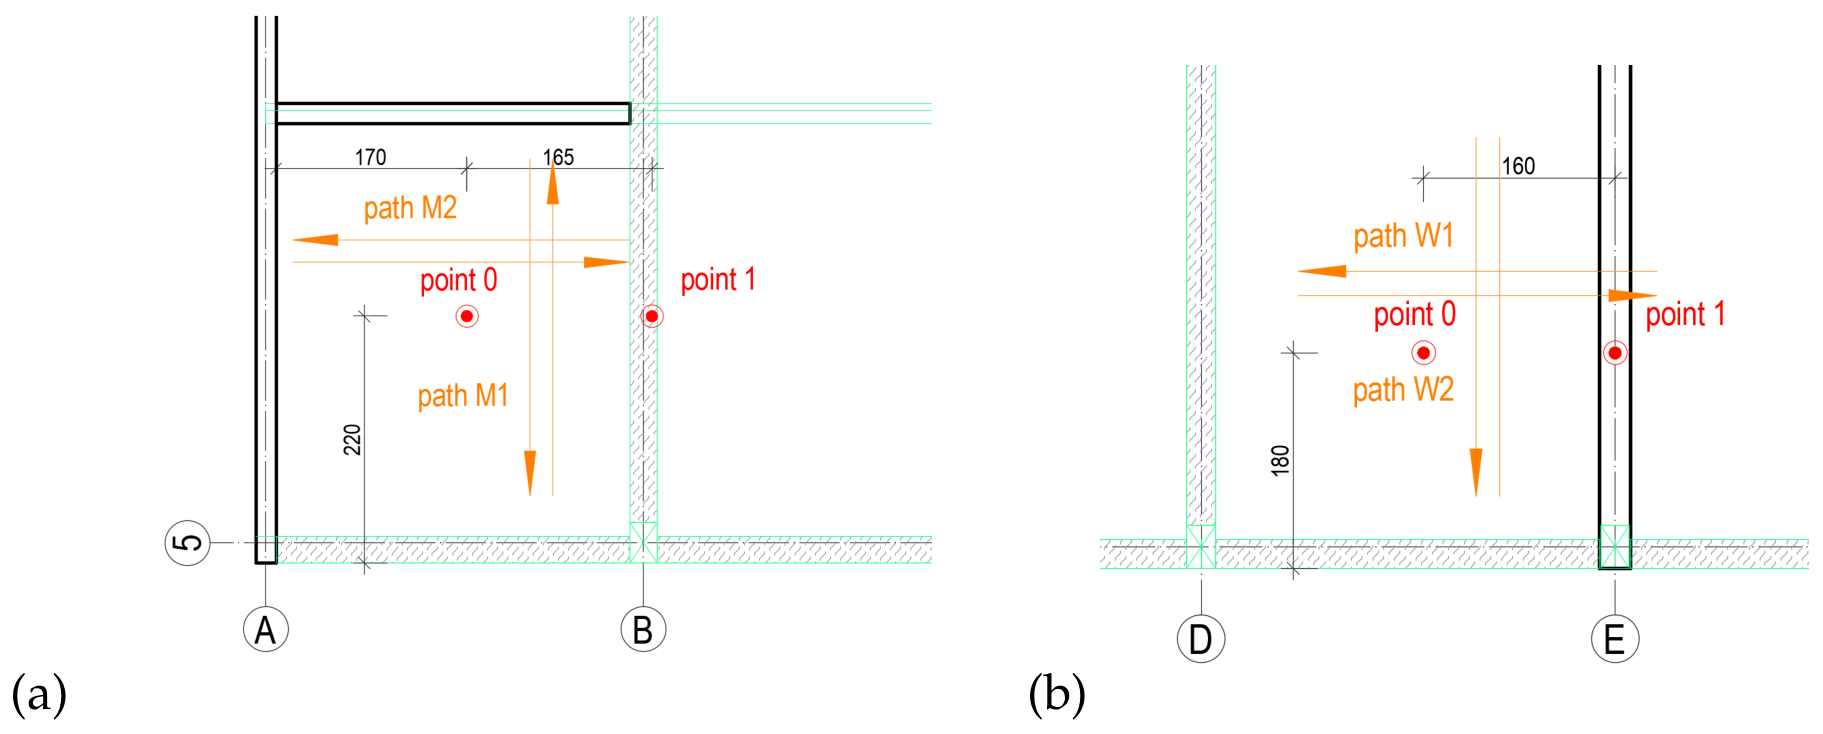
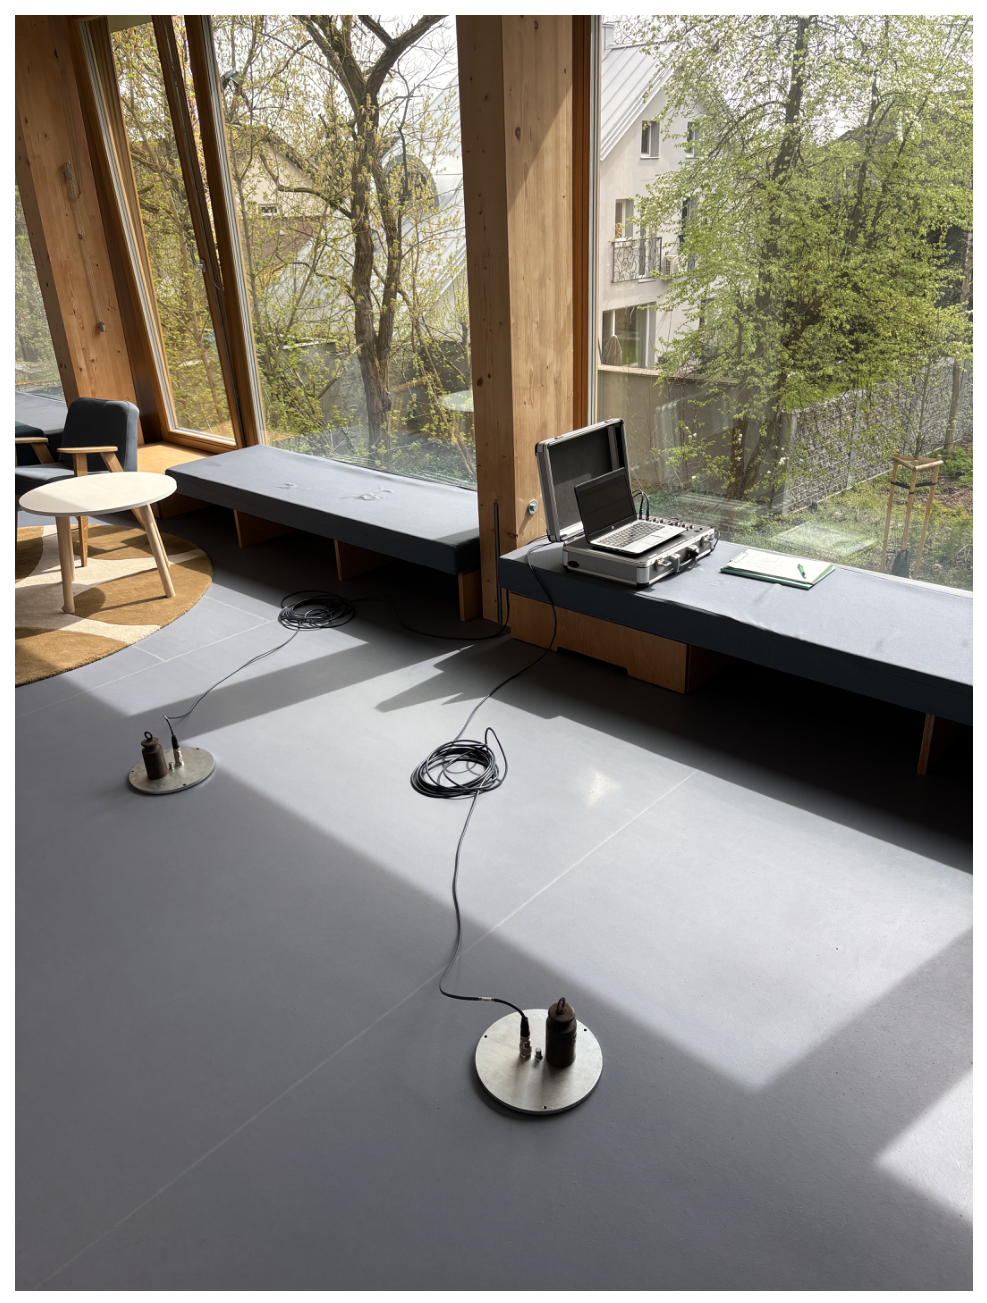
The in situ measurements were conducted in the two locations shown in Figure 2, namely the media library (M) and the children’s book rental (BR). They were chosen in a manner that ensured the library’s routine remained largely unaffected; however, they were located in places with maximal vibration amplitudes expected, as close to the midspan as possible. In each location, vertical accelerations were measured at two points: No 0—in the middle of the joists, and No 1—on the main beam; see Figure 4. Measurements were carried out using the 16-channel data acquisition system KSD 400 and two uniaxial acceleration ICP-101 sensors with a sensitivity of 1 V/g manufactured by the Polish company P.U.P. Sensor. Their measurement range was set to +/−5 g, the nominal frequency range was 0.3 to 4 kHz and the resolution 0.00001 g rms. The data acquisition system was equipped with vibration cards manufactured by the U.S. company National Instruments. The whole set was prepared in 2024 and calibrated by the manufacturer. The acceleration sensors were mounted on the steel plates with additional stabilising masses. The measurement setup in the book rental room is shown in Figure 5. For each location, two walking paths were assumed: parallel to the main beams (M1, W1) and perpendicular (M2, W2) to them. Acceleration time histories were measured for one, two or three walkers with masses of approx. 65–75 kg. They wore shoes with soft soles and walked one after another in a normal, calm way with a step frequency between 1.8–2.0 Hz. The sampling frequency was set to to 1024 Hz, which was above the Nyquist frequency (equal to 200 Hz for the range of interest up to 100 Hz).

2.5. Analysis of the Registered Signals

For further analysis, 15 acceleration time histories registered in situ were selected: 6 from the media library and 9 from the book rental. Their post-processing was conducted in the Mathematica package [27] using a custom-developed code. Velocity time histories were obtained by integrating the accelerations using the trapezoidal rule. For each registered walk, the following vibration parameters were calculated:
  • a p e a k —the peak acceleration,
  • a r m s —the RMS acceleration for a single step,
  • a w , r m s —the RMS acceleration for a single step weighted with the function W b according to Equation (4),
  • v p e a k —the peak velocity,
  • v r m s —the RMS velocity for a single step,
  • O S - R M S —the one-step RMS calculated according to Equation (3).
Initial filtering of the signals was conducted using commands HighpassFilter[.] and LowpassFilter[.]. Then, the signals were transformed into the frequency domain using the command Fourier[.], and the appropriate weighting functions W b ( f ) or B ( f ) were applied. Command InverseFourier[.] was used for returning to the time domain in accordance with [23].
For the purposes of validating the numerical model, the Power Spectral Density PSD (function PeriodogramArray[.]) was determined to identify the dominant frequencies in the registered signals. It can be associated with the natural frequencies [28].

2.6. FE Modelling

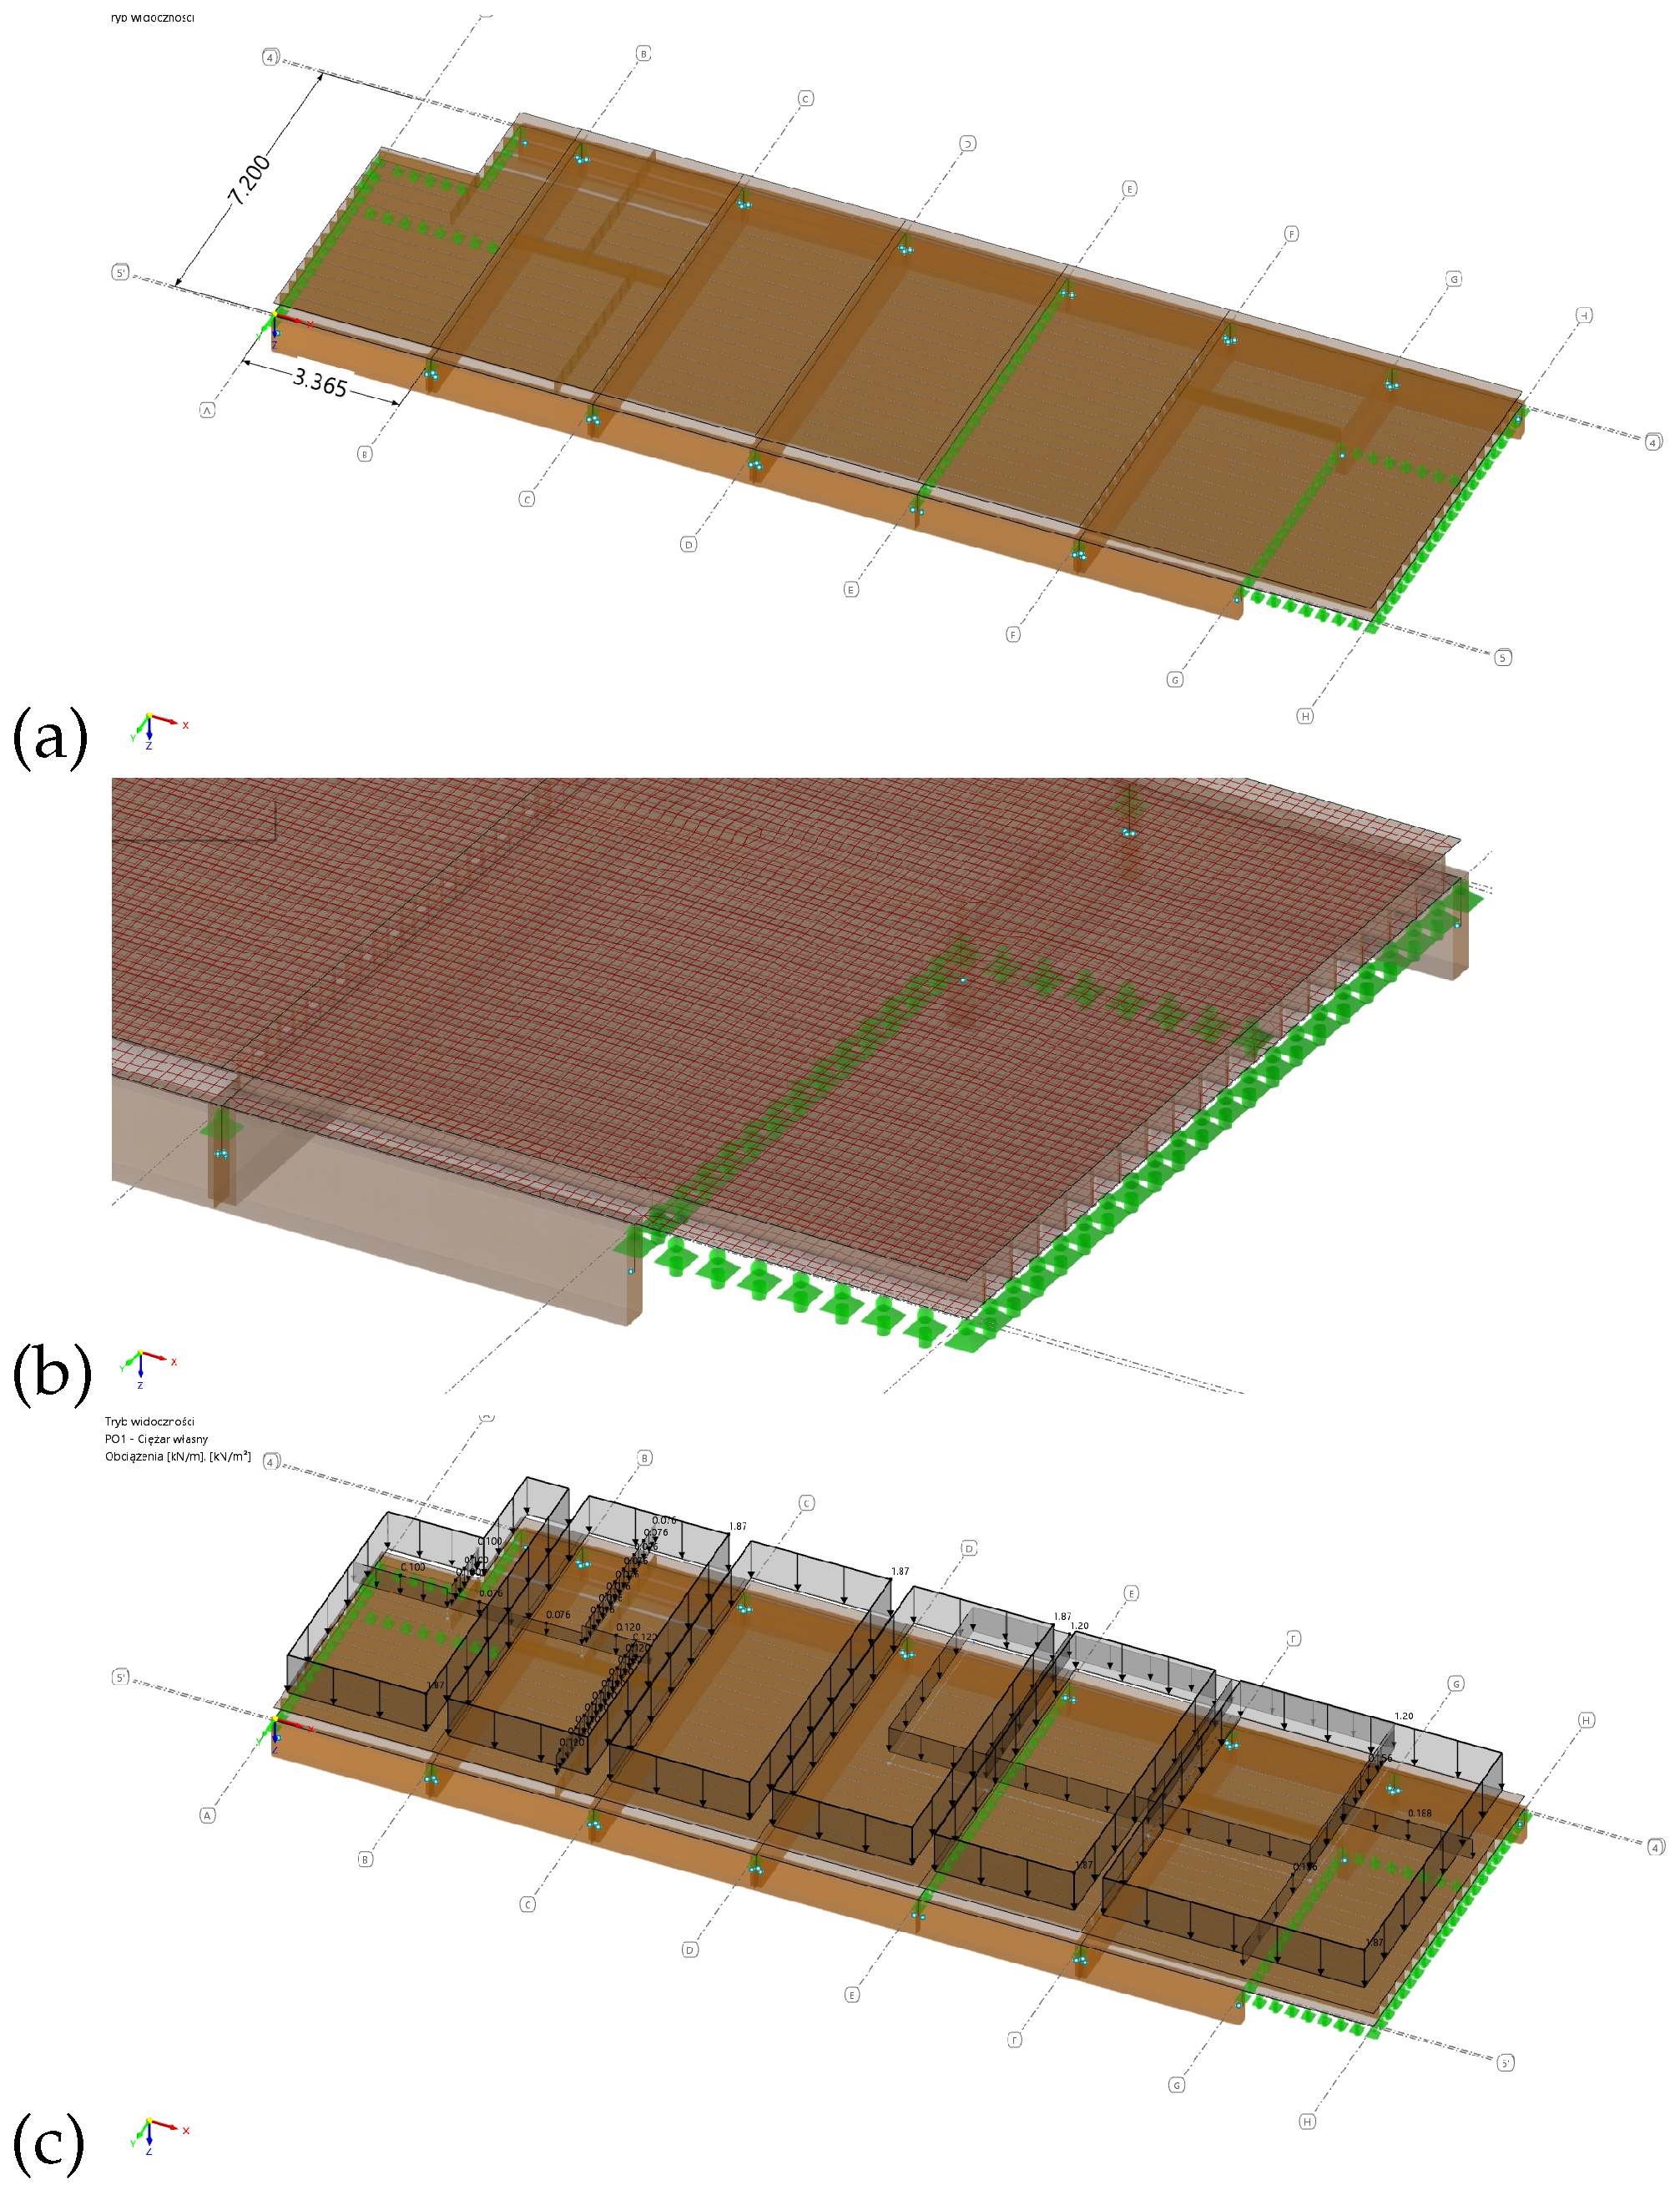
The numerical model was prepared in the RFEM 6 software [25]. The floor system was modelled with beam (main beams and joists) and shell finite elements (covers). The eccentricities between main beams and joists, as well as between joists and covers, were taken into account using offsets [29,30]. The axonometric view of the model is shown in Figure 6a. After initial mesh dependency studies, a default size of 0.1 m for the FE mesh was selected. Point simple supports (only translations blocked) were assumed at the connections with columns, while line simple supports (only translations blocked) were assumed above the stiffening walls. Some details of the numerical model are visible in Figure 6b. Isotropic, linear elastic materials were introduced with effective properties. Consequently, the orthotropic features of timber and timber products were neglected in the global analysis. The experimental outcomes conducted by other research teams [9] explain this assumption since the values of real Young modulus in the longitudinal directions are usually slightly higher than the values applied in this study, whereas in the case of beam elements, the main impact for natural frequencies is their bending stiffness. Moreover, the possibility of precisely determining material properties for existing buildings is limited; therefore, practising engineers usually rely on the recommended values. The following material parameters (E—Young modulus, G—Kirchhoff modulus, and ρ —density) were introduced for the main load-bearing structure based on the relevant standards:
  • Glulam GL24: E = 11 GPa, G = 0.65 GPa, ρ = 420 kg m 3 (beam elements).
  • Solid timber C24: E = 11 GPa, G = 0.69 GPa, ρ = 420 kg m 3 (beam elements).
  • OSB board: E = 3.5 GPa, G = 1.30 GPa, ρ = 700 kg m 3 (shell elements).
  • MFP board: E = 2.6 GPa, G = 1.25 GPa, ρ = 700 kg m 3 (shell elements).
  • Gypsum plasterboard: E = 2.8 GPa, G = 1.0 GPa, ρ = 900 kg m 3 (shell elements).
The dead load of the finishing layers was estimated based on the technical documentation and the in situ inspection at 1.87 kN/m2, whereas the load of the books was taken as 1.20 kN/m2. These values were converted into masses using built-in software features. The eigenfrequencies and the corresponding modes were found using the Lanczos algorithm assuming a consistent mass matrix [31].

3. Results

3.1. Vibration Measurements

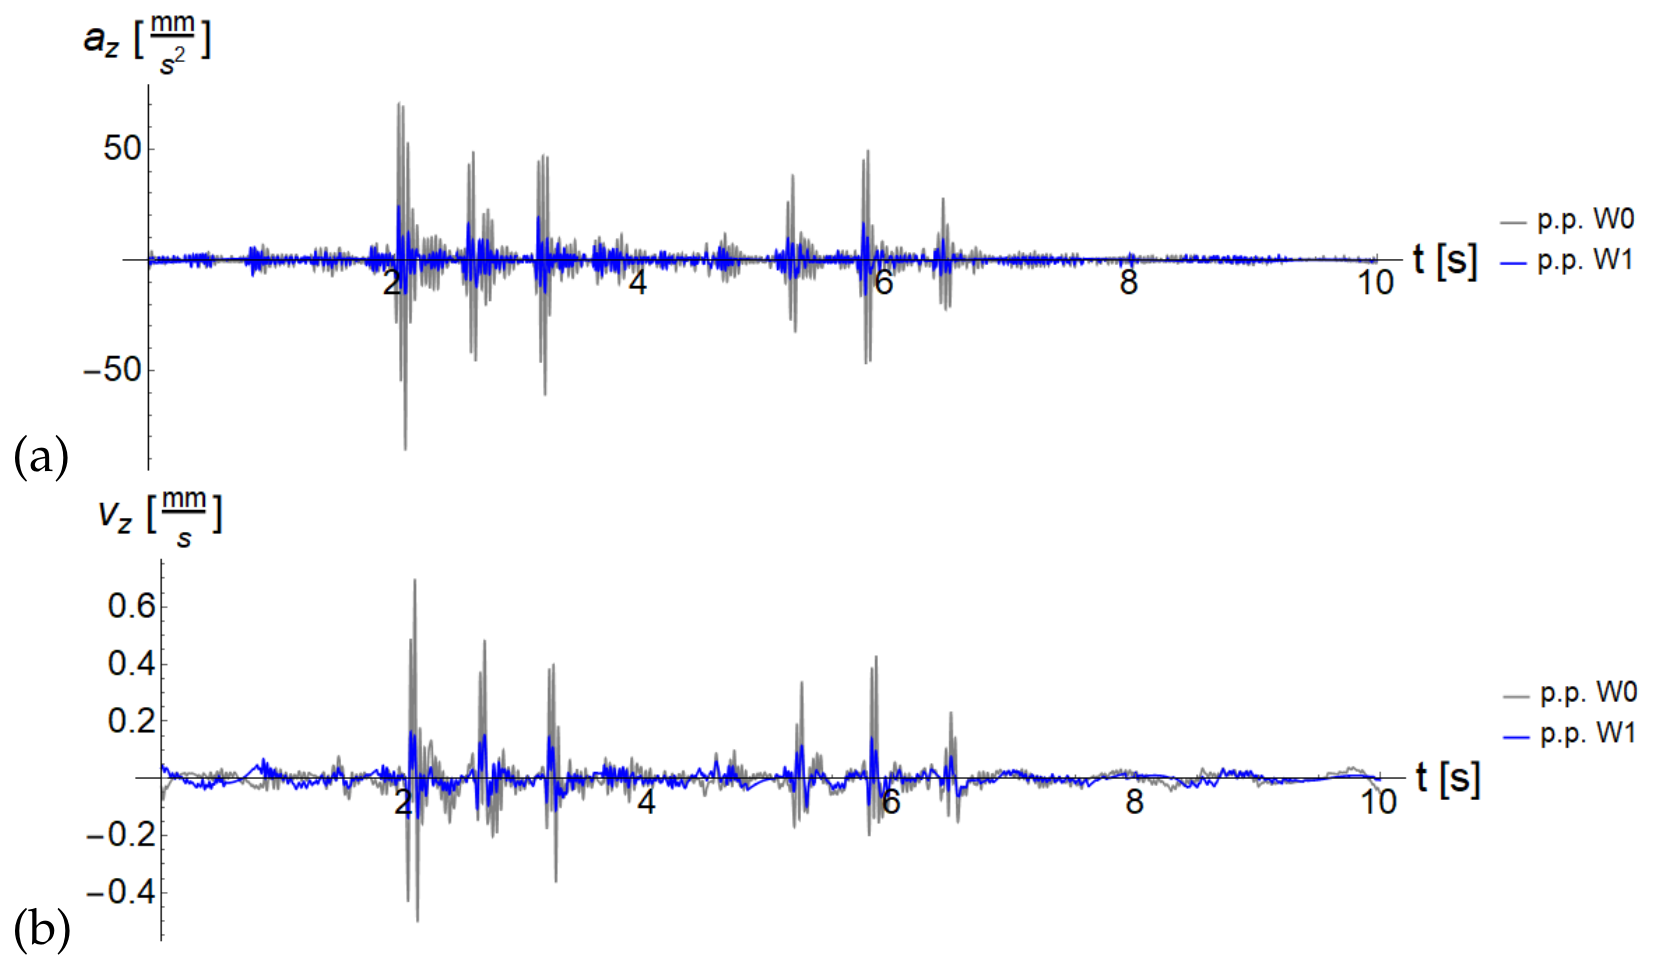
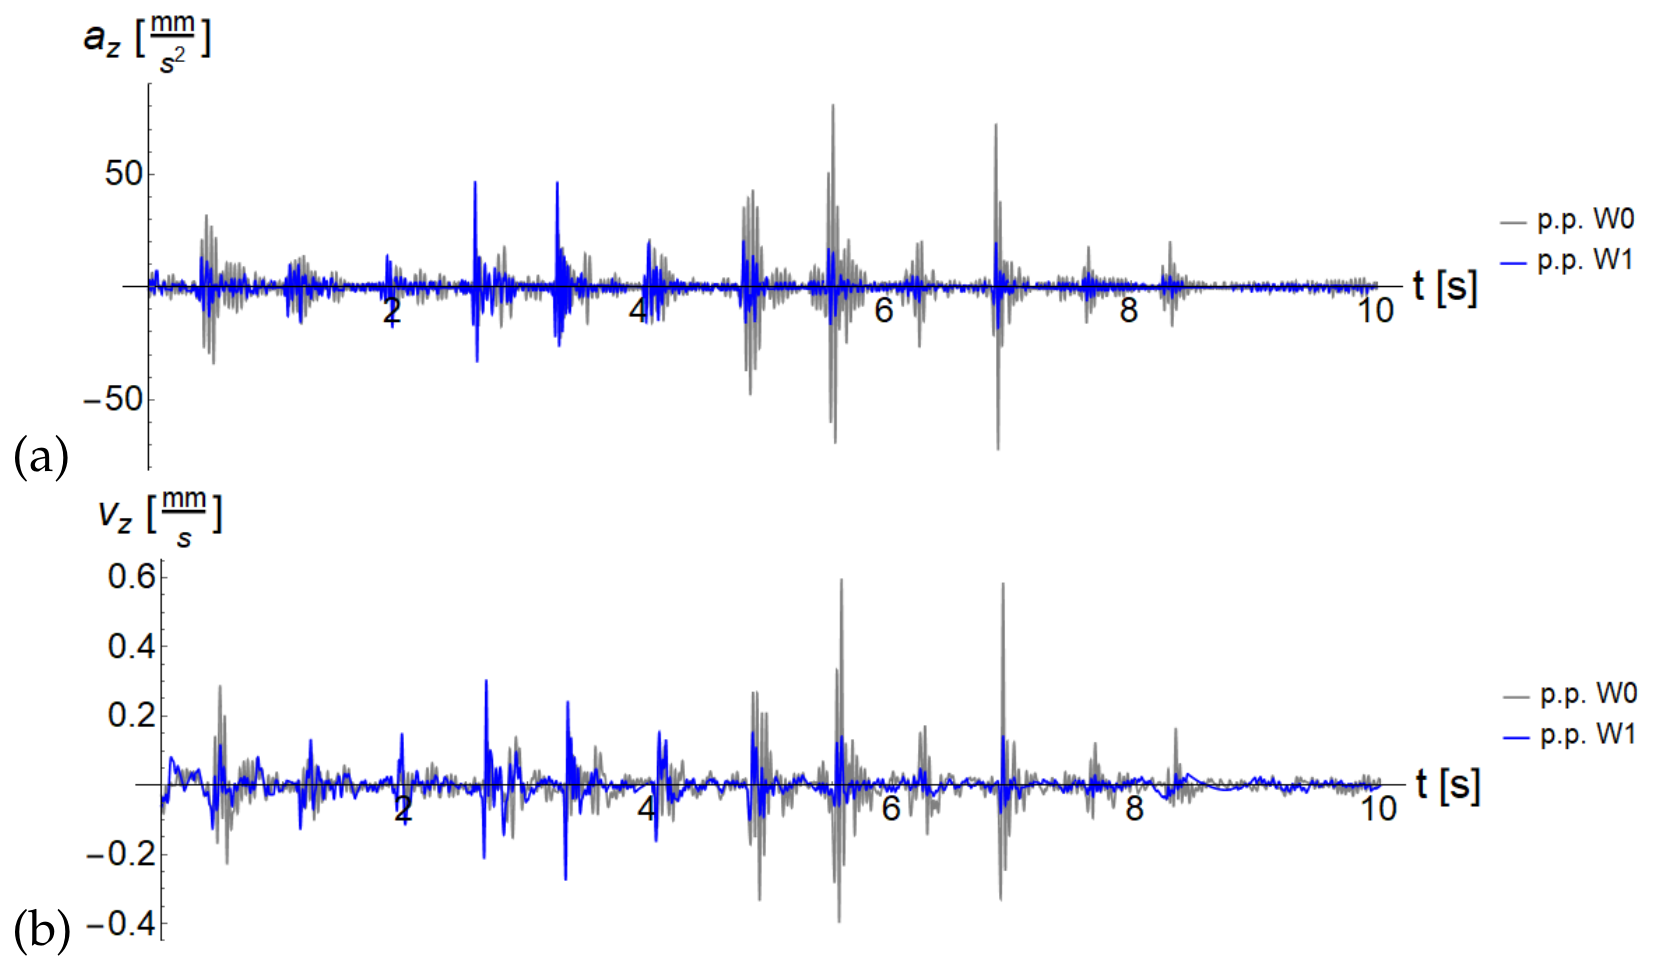
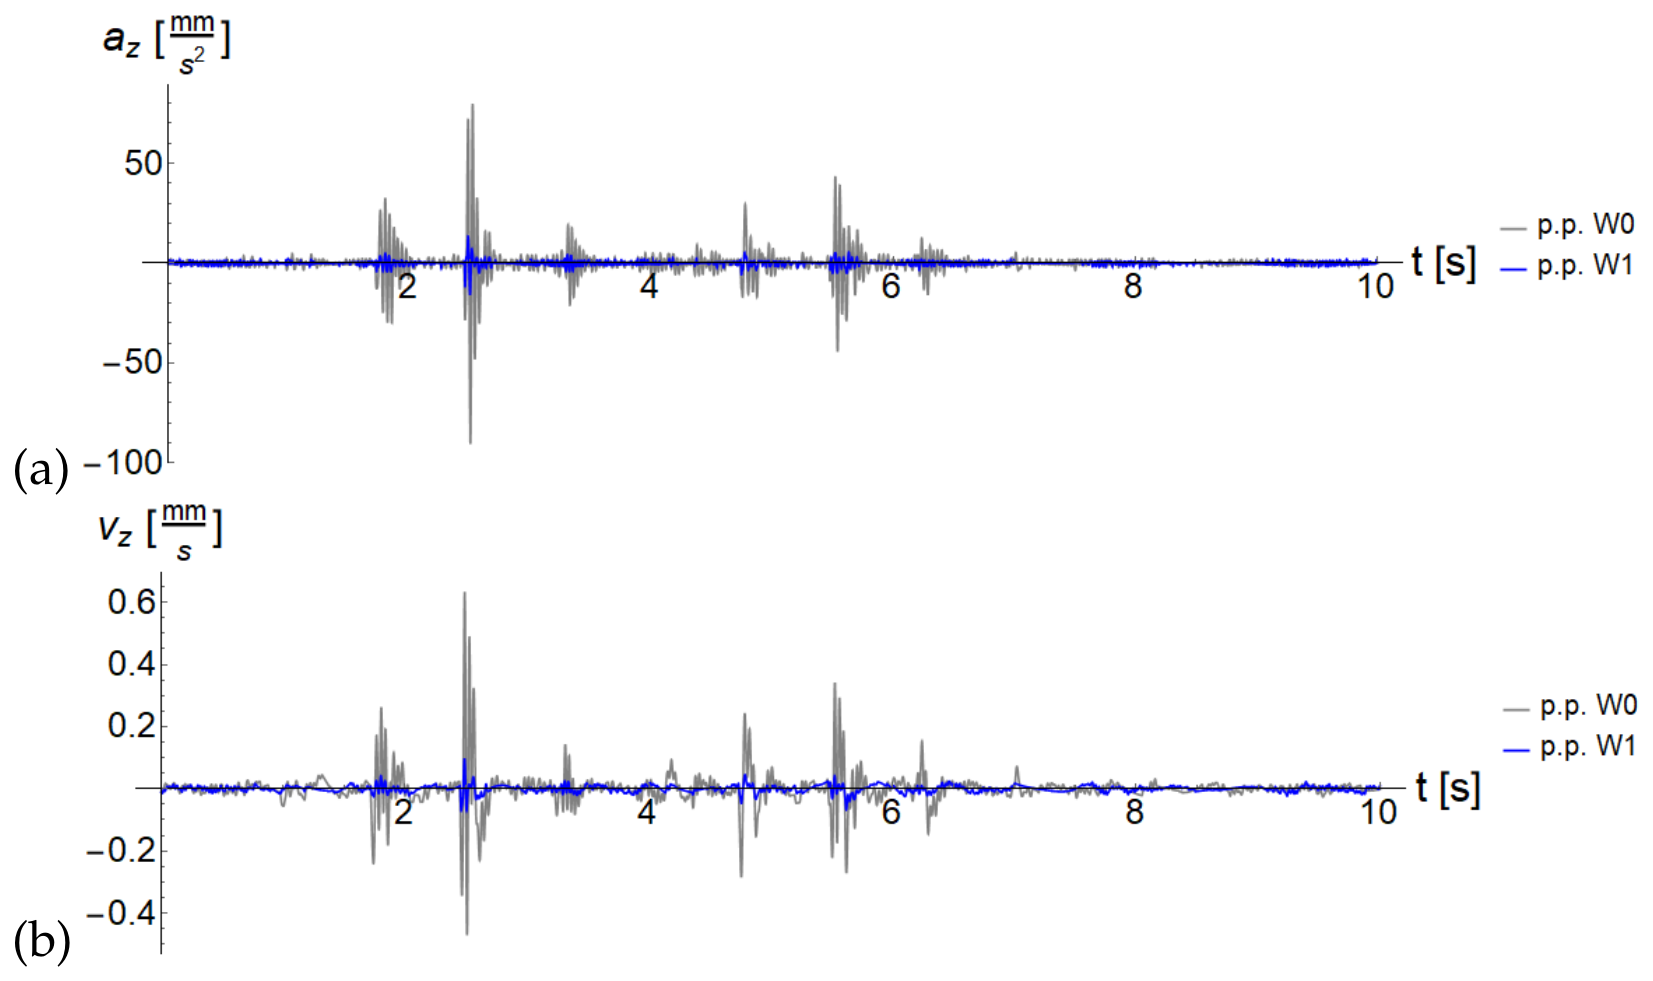
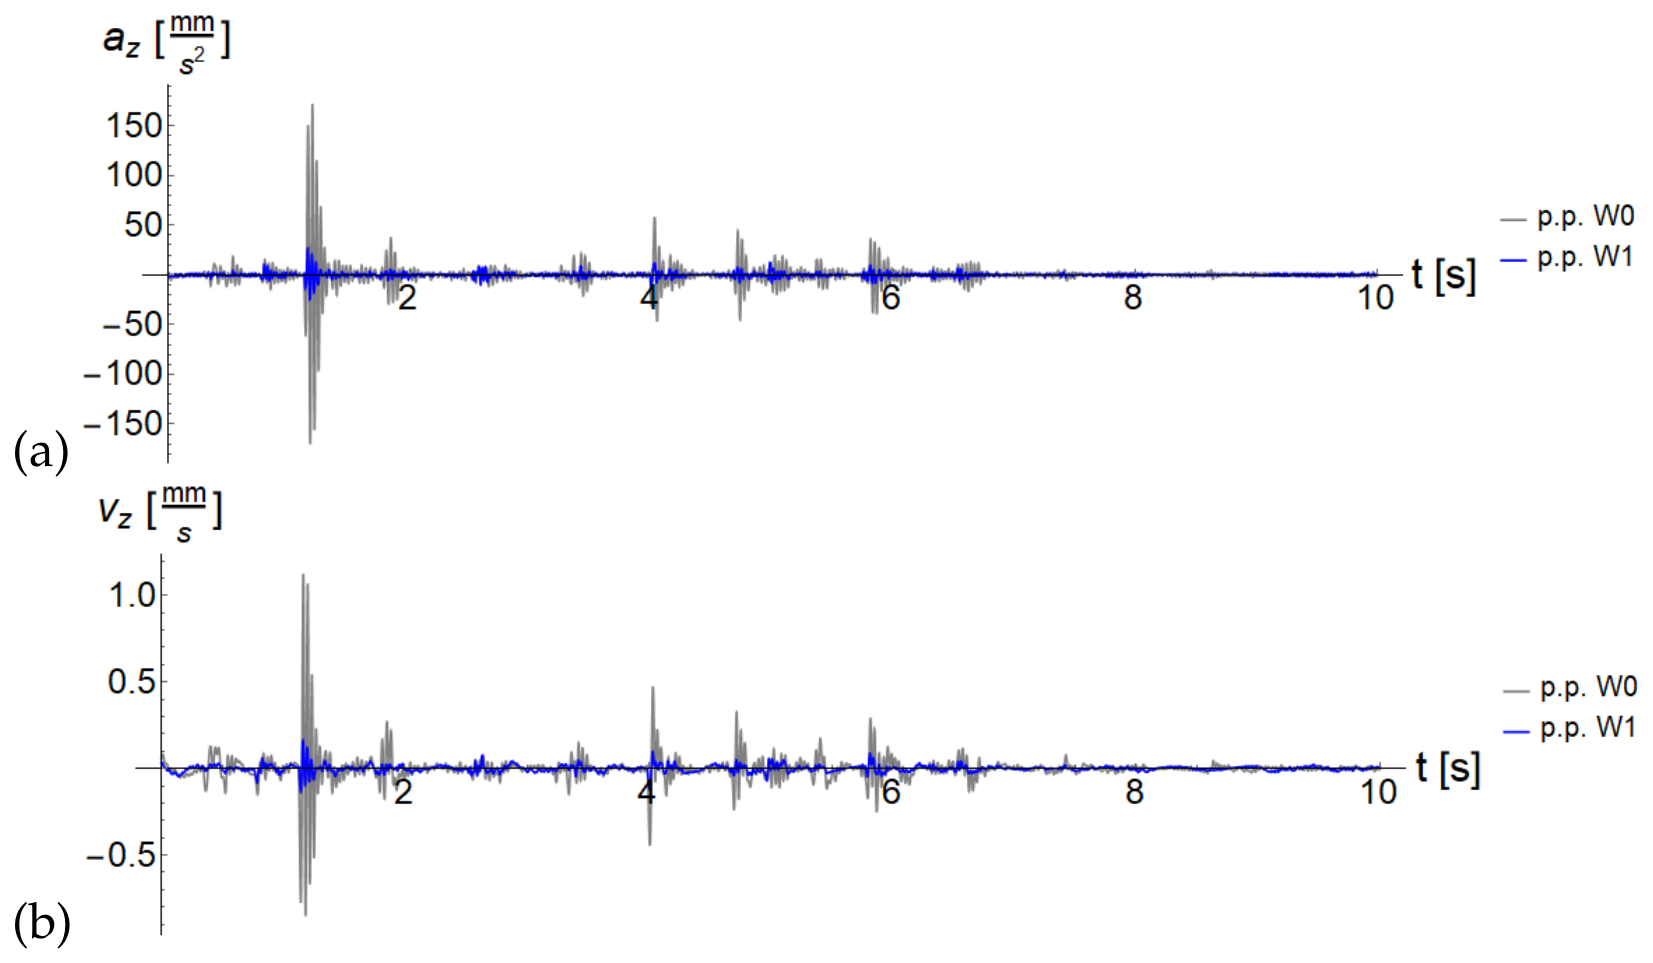
The results of the measurements in terms of accelerations are summarised in Table 1, while the results for velocities are given in Table 2. Significantly higher values were registered for point 0 (in the middle of the joists) than for point 1 (above the main beams) at both locations. Moreover, the general tendency is that two or three walkers cause vibrations with greater amplitudes than a single walker. The weighted RMS values are much smaller (approx. 80 % for acceleration and 65 % for OS-RMS) than the ones without filtering, which indicates that higher frequencies dominate in the analysed spectra. Examples of registered vibration time-histories are shown in Figure 7, Figure 8, Figure 9 and Figure 10.
PSD plots are shown in Figure 11, and the frequencies corresponding to the local maxima can be found in Table 3. In the case of the media library, the first local maximum can be observed at approx. 24 Hz, whereas in the case of the book rental, it occurs at 15 Hz. This suggests that the stiffness of the analysed floor in the second location is much smaller.

3.2. FE Modal Analysis

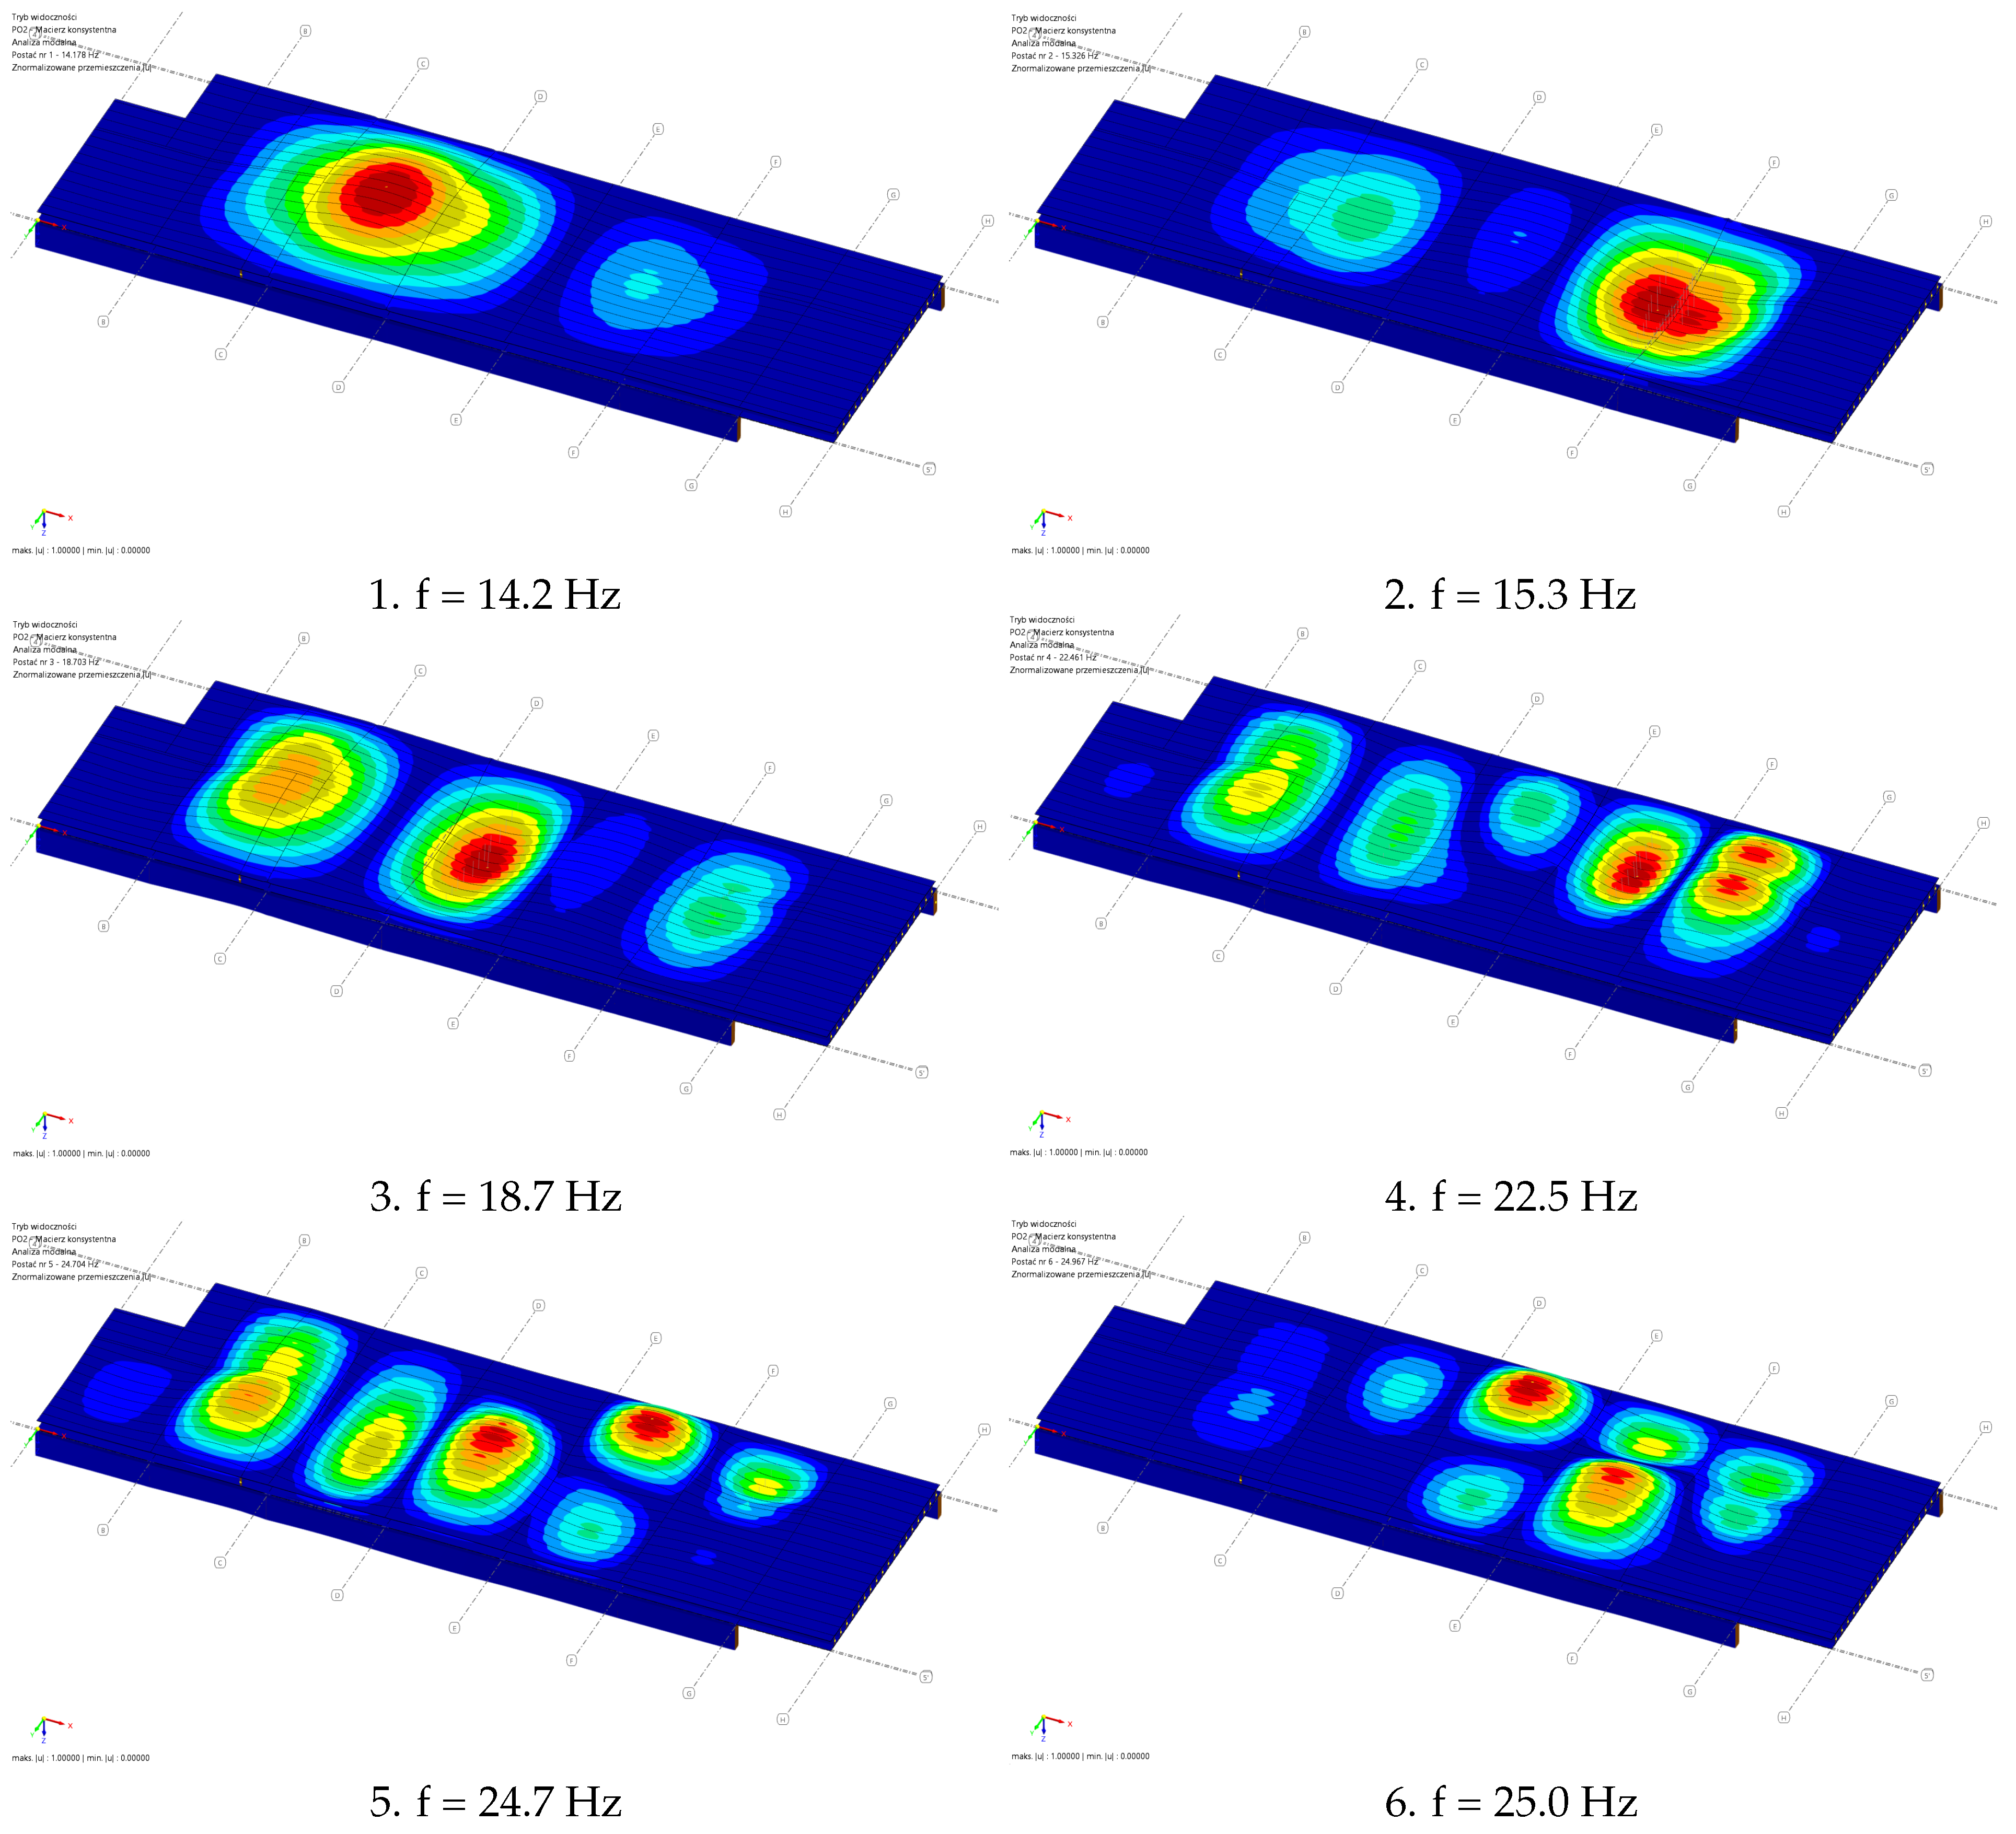
The first 20 eigenfrequencies are summarised in Table 4, whereas the natural modes corresponding to the first six of them are shown in Figure 12. For further calculations, a modal mass of 4025 kg for the first eigenmode was used.

3.3. Assessment According to JRC Report

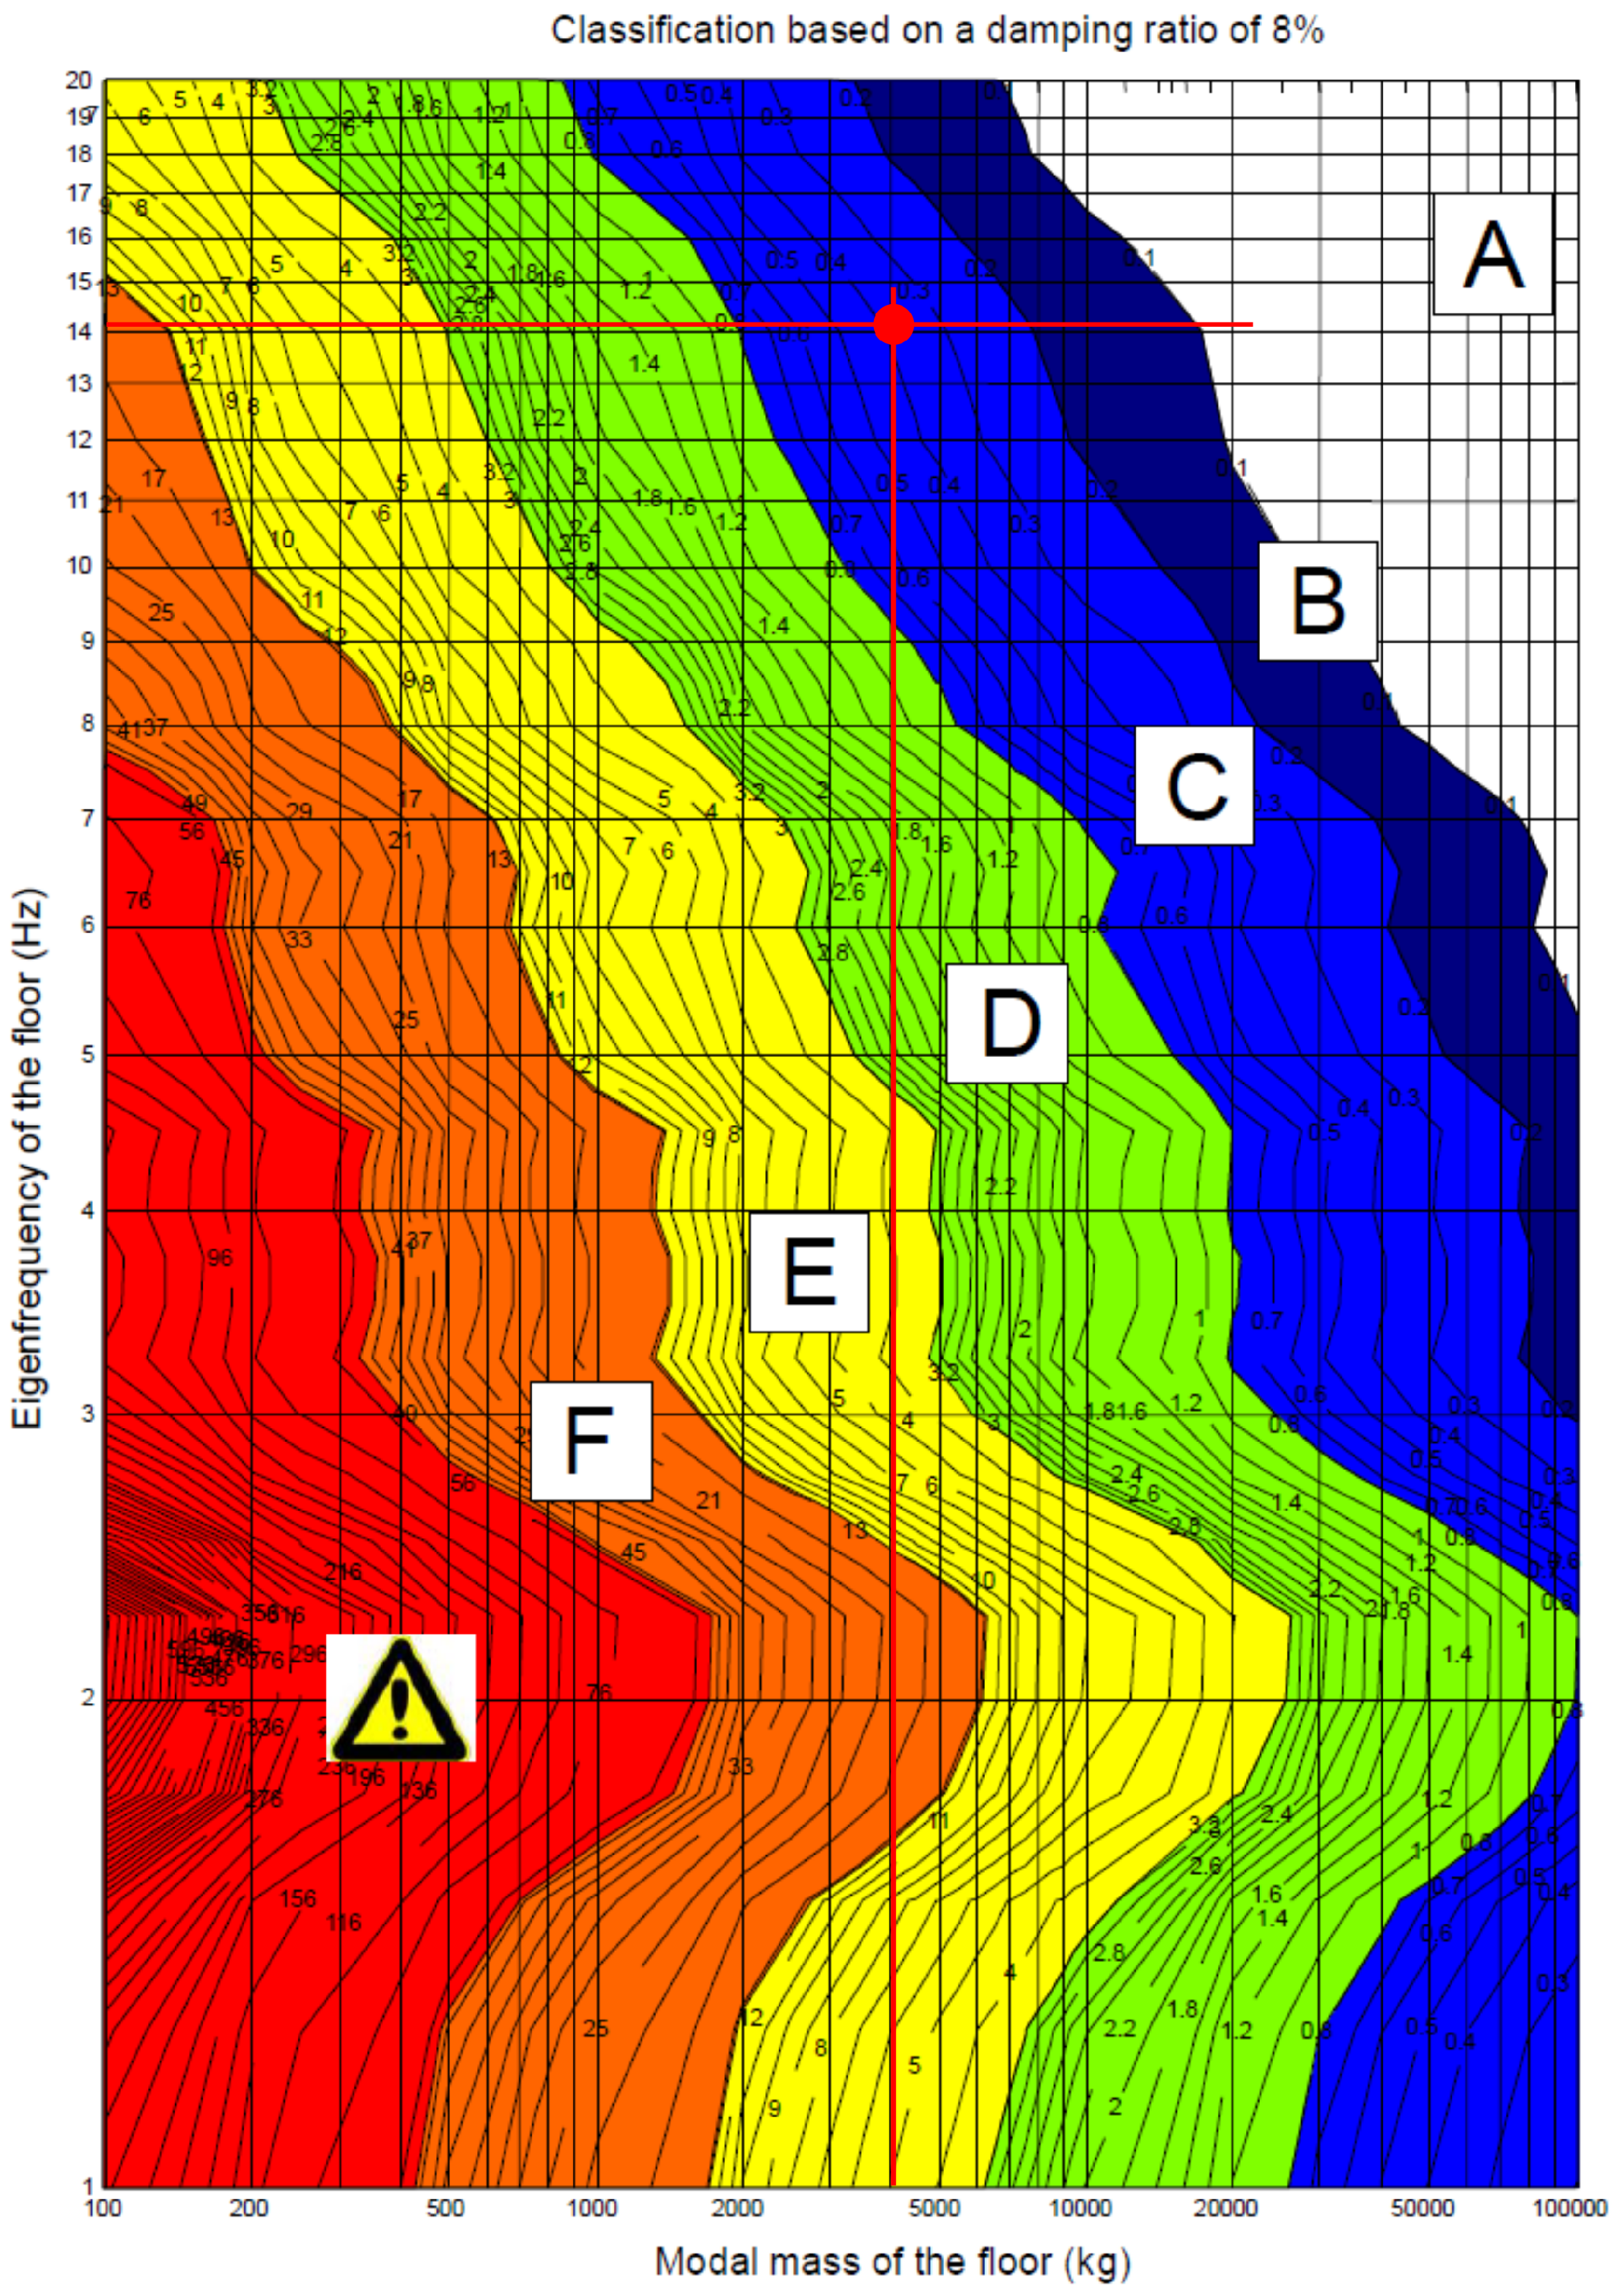
The total damping D = 8 % for the analysed floor system was calculated assuming D 1 = 6 % (timber structure), D 2 = 1 % (library), and D 3 = 1 % (suspended ceiling). The O S - R M S 90 value was estimated using the design chart for 8% damping from the JRC report [23]. For a fundamental frequency equal to 14.2 Hz and a modal mass of 4025 kg, an OS-RMS90 of 0.380 was determined; see Figure 13. This value refers to the highest acceleration value that can be obtained in the middle of the slab, cf. the first natural mode in Figure 12. To compare it with the outcomes of the in situ measurements, one should take into account the mode shape factor ( μ ), which for the position of the measuring point is about 0.3. Consequently, the highest registered value should be divided by μ , which results in 0.103 0.3 = 0.343 . Therefore, the difference between the calculated and measured values is equal to 0.037, representing a relative difference of about 11 % on the safe side. The calculated value corresponds to the class of perception C, which is suitable for libraries.

3.4. Assessment According to SCI Report

The results of the FE modal analysis were substituted into Equation (5):
a w , r m s = 2 π μ e μ r 185 M f 0 0.3 Q 700 1 2 W = 2 π 1.0 · 1.0 185 4025 · 14 . 2 0.3 746 700 1 2 1.0 = 0.0981 m s 2
The reference value obtained from the measurements, corrected by the mode shape factor, is equal to 0.0387 0.3 = 0.129 m s 2 . Consequently, the value predicted by the SCI methodology is underestimated by 0.031 m s 2 , with a relative difference of about 24%.
The response factor is as follows:
R = a w , r m s 0.005 = 0.0981 0.005 = 19.6 .
It exceeds the value of the multiplying factor suitable for libraries (which is 4), so an assessment using VDV should be performed.
The walking velocity (v) and the duration time of a single activity ( T a ) can be calculated as follows, assuming the walking frequency f p 2.2 Hz:
v = 1.67 f p 2 4.83 f p + 4.50 = 1.67 · 2 . 2 2 4.83 · 2.2 + 4.50 = 1.96 m s
T a = L v = 13.8 1.96 = 7.04 s
where L—the length of the longest walking path.
The critical number of activity occurrences that can lead to adverse comments is equal to (assuming an adjusted V D V l i m i t = 1.6   m s 1.75 ):
n a = 1 T a V D V l i m i t 0.68 · a w , r m s 4 = 1 7.04 1.6 0.68 · 0.0981 4 = 47 , 010
Therefore, it can be assumed that the floor meets the comfort criteria, since such a number of walking activities is not probable in this building.

4. Discussion

For the measurements in the media library, the correlation between the number of walkers and their paths is not apparent. On the contrary, some relations can be formulated for the book rental. In this location, two or three walkers usually excited vibrations of greater amplitude than a single walker; however, no dependence on the walking path was found. The measured maximum value of weighted acceleration (38.7 mm s 2 ) exceeds the perceptibility threshold (5 mm s 2 ) defined by most standards [24] almost six times. However, this does not allow for a negative assessment fo the vibration comfort, since studies performed so far indicate that the possibility of complaints occurs for values above 80 mm s 2 [24]. Such a recommendation was formulated on the basis of measurements conducted for 103 light steel framed residential floors in Finland [32]. In the authors’ opinion, during walking, the pedestrian is simultaneously the main source and receiver of vibrations; consequently, less restrictive criteria should be applied in such a situation. Based only on the measurements, with OS-RMS equal to 0.103, the floor system could be assigned to the class of perception B according to the JRC report [23], which represents the second-highest rating. Nevertheless, the measurements were conducted for a limited number of points in possible locations. The analysis of PSD plots shows that in the measured signals, higher frequencies (circa 26 Hz) dominate, indicating that the slab is lightweight and quite stiff and can be classified as a high-frequency floor. The significant difference between weighted and non-weighted velocities and accelerations also confirms this, since human-perception filters mostly cut off higher frequencies.
The FE modal analysis provides a much broader perspective on the dynamic properties of the analysed slab and allows for the correct interpretation of the measurement outcomes. The comparison of the two first calculated natural frequencies (14.2 Hz and 15.3 Hz) with the first local maximum of the PSD for the book rental (15.0 Hz), which can be associated with the measured natural frequency, confirms the reliability of the FE model. Moreover, the absence of these harmonics in the signals registered in the media library is also in line with the outcomes of the numerical modal analysis. This part of the slab is much stiffer due to a smaller span and stiffening walls, and is only slightly involved in the higher natural modes (22.5 Hz and 24.7 Hz). It is worth mentioning that these modes concern mostly joists and covers. Furthermore, the results of the FE analysis serve as a basis for estimating the mode shape factor, which is equal to 0.3 for the selected location of measurements. This point was as close to the middle of the floor as possible, given that there was no possibility to change the furniture arrangement. Summing up, the comparison of calculated and measured dynamic characteristics of the floor showed full consistency, particularly considering that the study deals with a real building in service. The good agreement between modal properties obtained with measurements and with numerical analyses numerically justifies simplifications regarding timber-based claddings or simplified interactions modelling.
Subsequently, using the fundamental frequency and the corresponding modal mass, the assessment of vibration comfort was performed using two different methodologies—JRC [23] and SCI [24]. The former enables the user to assign a vibration perception class. Its outcome is an OS-RMS90 value, which is found using design charts. The calculated value of OS-RMS90 = 0.380 is 11% larger that the one obtained from measurements after correction using the mode shape factor (0.343). Such a discrepancy is easy to explain since the JRC methodology takes into account the uncertainty of walking excitation. This methodology was calibrated for pedestrians of various masses with different paces and walking styles. What is particularly important is that the estimation was “on the safe side”. Both the calculated and measured (after correction) values of OS-RMS correspond to the vibration class of perception C, which is suitable for libraries. Using the FE modal analysis results, or their combination with the measurement outcomes, one obtains a worse class.
The simplified methodology according to [24] consists of two steps: calculation of the weighted RMS acceleration a w , r m s and comparing it with the vibration perception threshold for humans. If this condition is not met, an additional check using the vibration dose value is recommended (VDV). The calculated value of a w , r m s = 0.0981 m s 2 is 24% smaller than the maximum measured value after correction a w , r m s = 0.129 m s 2 . This methodology is more deterministic than the one mentioned earlier and assumes a single walker of average mass (76 kg). If the corrected maximum value registered for a single pedestrian ( 0.0191 0.3 = 0.0636 m s 2 ) is taken, a safe estimation is obtained as well. The response factor was equal to 19.6—such a value usually does not cause an increased probability of complaints related to vibration issues, but demands an additional check. This check revealed an extremely low probability of perceived annoyance. The results of analytical analysis according to both methodologies and measurements are summarised in Table 5.
Some general comments can be formulated after the performed investigation. The JRC methodology [23] is more straightforward and unambiguous. After obtaining the fundamental frequency and the corresponding modal mass, the user will always classify the floor into the same vibration perception class. Due to the distinction of these classes, the floors become easily comparable with each other. Therefore, investors are able to declare and later check the demanded class. The SCI approach [24] is more complex and contains a few steps that can be interpreted differently by different engineers, for instance the mode shape factor, the pedestrian’s weight, or the length of the longest walking paths. In general, this report is more suitable for advanced users with a better understanding of floor dynamics, since it contains various low- and high-fidelity models.

5. Conclusions

In this paper, extensive combined experimental–numerical studies on the vibration comfort verification of a skeleton floor timber system are presented. The assessment is based on two approaches: those proposed by the JRC report [23] and the SCI report [24]. The case study concerns a recently built public utility building in Warsaw, whose structure is almost entirely made of timber. The following general conclusions can be drawn from the research.
  • The vibration comfort of the floor system was positively verified according to both methodologies, which proves that correctly designed lightweight timber floors meet the modern serviceability criteria.
  • It is highly recommended to supplement the assessment of the vibration properties of existing floors with FE analysis, which confirms the conclusions from [18]. Even a simplified 3D model, which neglects the orthotropy of timber and timber-based products or complex interactions between the covers and beams, provides a reliable estimation of the first few natural frequencies and their corresponding modes. Such an analysis can be performed in most engineering-purpose FE codes, like Dlubal RFEM 6 [25] used in this study, and does require significant time. Without the results of such an analysis, it is hard to predict the locations where the highest amplitudes of vibrations may occur. Furthermore, there is not always the possibility of installing sensors in these locations. FE modal analysis enables the calculation of mode shape factors used to correct the estimation of maximum accelerations.
  • The validation of the FE model can be easily performed on two levels. Dominant harmonics in the registered signals from walking excitation, extracted for instance using PSD plots, can be compared with eigenfrequencies from the FE modal analysis. Additionally, the measured vibration properties (expressed by velocities or accelerations) can be evaluated against calculated values. In the analysed case, the measured fundamental frequency was approx. 15.0 Hz, whereas the one found with FEM was 14.2 Hz (relative error of about 5%). The measured and calculated value of OS-RMS was 0.343 and 0.380, respectively (relative error about 11%). Finally, the measured and calculated (using the SCI [24] approach) values of weighted acceleration were 0.129 m s 2 and 0.098 m s 2 (relative error about 24%). Such agreement is fully satisfactory, especially considering that we are dealing with an existing building with many uncertainties hard to quantify (e.g., walking excitation, mass distribution, joints characteristics).
  • The JRC methodology [23] for vibration comfort assessment seems to be more straightforward and versatile than the SCI approach [24]. The assessment algorithm is completely unambiguous and easy to implement. The six-level classification allows for an easy comparison of different structural solutions. Moreover, the uncertainty of vibrations due to walking is taken into account, providing a safe estimation of vibration amplitudes. On the other hand, the SCI report [24] contains various more or less sophisticated methods, and therefore is recommended for more advanced users.
The presented methodology for the combined experimental–numerical assessment of lightweight slab systems assessment can be easily applied in situations where the serviceability performance of an existing building is questioned. Moreover, a general framework for FE dynamic models can be formulated. The conducted analyses confirmed that simplified modelling of material properties and interactions between beams and cladding provides acceptable estimation of the first few natural frequencies crucial for the assessment. The validation of results obtained with simplified methods from the JRC report [23] and SCI [24] shows that a quick, reliable assessment is possible using only modal analysis outcomes. Consequently, the much more time-consuming time history or harmonic analyses can be avoided. The presented research can easily be extended by validating other methodologies, e.g., AISC [33]. Moreover, a parametric analysis concerning, for instance, the degree of connection between the joists and the cover, or a time history analysis, could provide a more in-depth perspective on the analysed case study and are planned for the near future. The experimental part could be extended, for instance, to a more comprehensive identification of modal properties or measurements for rhythmic activities.

Author Contributions

Conceptualisation, S.D.; methodology, S.D.; software, S.D. and Ł.C.; validation, S.D.; formal analysis, S.D. and Ł.C.; investigation, S.D., Ł.C., J.M. and M.P.; resources, S.D.; data curation, S.D., Ł.C., J.M. and M.P.; writing—original draft preparation, S.D.; writing—review and editing, S.D., Ł.C., J.M. and M.P.; visualisation, S.D.; supervision, S.D.; project administration, S.D. and Ł.C.; funding acquisition, S.D. All authors have read and agreed to the published version of the manuscript.

Funding

This paper was co-financed under the research grant of the Warsaw University of Technology supporting the scientific activity in the discipline of Civil Engineering, Geodesy and Transport.

Institutional Review Board Statement

Not applicable.

Informed Consent Statement

Not applicable.

Data Availability Statement

Data are available within the article or from the authors upon request.

Acknowledgments

The FE analysis was performed using RFEM 6 with the academic licence granted by Dlubal Software Sp. Z o.o. During the preparation of this work, the authors used Gemini 3 for language editing.

Conflicts of Interest

Authors Sławomir Dudziak and Jan Malanowski were employed by the company PFEIFER Polska sp. Z o.o. Author Łukasz Czerwiński was employed by the company NDI SA, and Mateusz Politański by the company Hill International sp. Z o.o. They declare that the research was conducted in the absence of any commercial or financial relationships that could be construed as a potential conflict of interest.

References

  1. Bazli, M.; Heitzmann, M.; Ashrafi, H. Long-Span Timber Flooring Systems: A Systematic Review from Structural Performance and Design Considerations to Constructability and Sustainability Aspects. J. Build. Eng. 2022, 48, 103981. [Google Scholar] [CrossRef]
  2. Tupenaite, L.; Kanapeckiene, L.; Naimaviciene, J.; Kaklauskas, A.; Gecys, T. Timber Construction as a Solution to Climate Change: A Systematic Literature Review. Buildings 2023, 13, 976. [Google Scholar] [CrossRef]
  3. Michalak, H.; Michalak, K. Sustainable Mass Timber Structures—Selected Issues in the Structural Shaping of Tall Buildings. Appl. Sci. 2025, 15, 10296. [Google Scholar] [CrossRef]
  4. Aloisio, A.; Pasquale Pasca, D.; De Santis, Y.; Hillberger, T.; Giordano, P.F.; Rosso, M.M.; Roberto Tomasi, R.; Limongelli, M.P.; Bedon, C. Vibration Issues in Timber Structures: A State-of-the-Art Review. J. Build. Eng. 2023, 76, 107098. [Google Scholar] [CrossRef]
  5. Pachla, F.; Tatara, T.; Aldabbik, W. Challenges in Risk Analysis and Assessment of the Railway Transport Vibration on Buildings. Appl. Sci. 2025, 15, 9460. [Google Scholar] [CrossRef]
  6. Dudziak, S.; Kozyra, Z. Selected aspects of numerical modelling in prediction of building vibrations due to traffic. MATEC Web Conf. 2018, 196, 01055. [Google Scholar] [CrossRef]
  7. Zbiciak, A.; Kraśkiwicz, C.; Dudziak, S.; Al-Sabouni-Zawdzka, A.; Pełczyński, J. An accurate method for fast assessment of under slab mats (USM) performance in ballastless track structures. Constr. Build. Mater. 2021, 300, 123953. [Google Scholar] [CrossRef]
  8. Teodorczyk, M.; Gołębiowski, Ł.; Szulc, J. Comprehensive Dynamic Assessment of a Masonry Building. Appl. Sci. 2025, 15, 11699. [Google Scholar] [CrossRef]
  9. Pełczyński, J.; Martyniuk-Sienkiewicz, K.; Al Sabouni-Zawadzka, A. Stiffness control analysis through numerical modelling of a smart sandwich panel with OSB facesheets and a tensegrity lattice core. Eur. J. Wood Wood Prod. 2025, 83, 189. [Google Scholar] [CrossRef]
  10. Yang, H.; Wu, Y.; Shi, B.; Tao, H.; Huang, H. Performance of Deltabeam–CLT Composite Floors Under Human-Induced Vibration. Buildings 2025, 15, 2074. [Google Scholar] [CrossRef]
  11. Zhang, B.; Rasmussen, B.; Jorissen, A.; Harte, A. Comparison of Vibrational Comfort Assessment Criteria for Design of Timber Floors among the European Countries. Eng. Struct. 2013, 52, 592–607. [Google Scholar] [CrossRef]
  12. Rijal, R.; Samali, B.; Shrestha, R.; Crews, K. Experimental and Analytical Study on Dynamic Performance of Timber Floor Modules (Timber Beams). Constr. Build. Mater. 2016, 122, 391–399. [Google Scholar] [CrossRef]
  13. Quang Mai, K.; Park, A.; Nguyen, K.T.; Lee, K. Full-Scale Static and Dynamic Experiments of Hybrid CLT–Concrete Composite Floor. Constr. Build. Mater. 2018, 170, 55–65. [Google Scholar] [CrossRef]
  14. Muhammad, Z.O. Vibration Serviceability of Floors: A Probabilistic Framework. Ph.D. Thesis, University of Exeter, Extrer, UK, 2018. [Google Scholar]
  15. Opazo-Vega, A.; Muñoz-Valdebenito, F.; Oyarzo-Vera, C. Damping Assessment of Lightweight Timber Floors under Human Walking Excitations. Appl. Sci. 2019, 9, 759. [Google Scholar] [CrossRef]
  16. Kowalska-Koczwara, A.; Rizzo, F.; Sabbà, M.F.; Bedon, C. Assessing the Influence of RMS and VDV on Analysis of Human Perception of Vibrations in Buildings Caused by Selected Sources of Traffic. Appl. Sci. 2024, 14, 3688. [Google Scholar] [CrossRef]
  17. Hassan, O.A.B.; Öberg, F.; Gezelius, E. Cross-Laminated Timber Flooring and Concrete Slab Flooring: A Comparative Study of Structural Design, Economic and Environmental Consequences. J. Build. Eng. 2019, 26, 100881. [Google Scholar] [CrossRef]
  18. Cheraghi-Shirazi, N.; Crews, K.; Malek, S. Review of Vibration Assessment Methods for Steel-Timber Composite Floors. Buildings 2022, 12, 2061. [Google Scholar] [CrossRef]
  19. Karampour, H.; Piran, F.; Faircloth, A.; Talebian, N.; Miller, D. Vibration of Timber and Hybrid Floors: A Review of Methods of Measurement, Analysis, and Design. Buildings 2023, 13, 1756. [Google Scholar] [CrossRef]
  20. Ge, Q.; Wang, H.; Chen, J.; Wen, B. Investigation on the Propagation of Uncertainties of a Timber Floor under Human Excitation. Struct. Saf. 2024, 111, 102519. [Google Scholar] [CrossRef]
  21. Guo, C.; Zhang, S.; Zhou, J. Vibration Performance of Mass Timber Slab Floors with Glulam Beam Supports. J. Struct. Eng. 2025, 151, 04025038. [Google Scholar] [CrossRef]
  22. Halilovic, E.; Amaddeo, C.; Derkowski, W.; Bader, T.K. In-Situ Vibration Characteristics of a Prefabricated GLTCC Floor System. In Proceedings of the Experimental Vibration Analysis for Civil Engineering Structures (EVACES 2025); Álvaro, C., Elsa, C., Eds.; Springer Nature: Cham, Switzerland, 2025; pp. 642–652. [Google Scholar] [CrossRef]
  23. Feldmann, M.; Heinemeyer, C.; Butz, C.; Caetano, E.; Cunha, A.; Galanti, F.; Waarts, P. Design of Floor Structures for Human Induced Vibrations. In JRC Scientific and Technical Reports; Publications Office of the European Union: Luxembourg, 2009; Volume 3. [Google Scholar]
  24. Smith, A.; Hicks, S.; Devine, P. SCI P354: Design of Floors for Vibration: A New Apporach; Steel Construction Institute: Bracknell, UK, 2009; Available online: https://www.steelconstruction.info/images/5/5a/SCI_P354.pdf (accessed on 17 May 2026).
  25. Dlubal Software GmbH. RFEM 6 Software Manual; Dlubal Software GmbH: Tiefenbach, Germany, 2024; Available online: https://www.dlubal.com/pl/pliki-do-pobrania-i-informacje/dokumenty/instrukcje-online/rfem-6 (accessed on 17 May 2026).
  26. Innovation, European Commission: Directorate-General for Research; Butz, C.; Sedlacek, G.; Heinemeyer, C. Generalisation of Criteria for Floor Vibrations for Industrial, Office, Residential and Public Building and Gymnastic Halls; Publications Office: Luxembourg, 2006. [Google Scholar]
  27. Wolfram Research, Inc. Mathematica, Version 10.0; Wolfram Research, Inc.: Champaign, IL, USA, 2014.
  28. Górski, P.; Tatara, M.; Stankiewicz, B. Vibration serviceability of all-GFRP cable-stayed footbridge under various service excitations. Meas. J. Int. Meas. Confed. 2021, 183, 109822. [Google Scholar] [CrossRef]
  29. Czumaj, P.; Dudziak, S.; Kacprzyk, Z. Computational models of reinforced concrete ribbed floor. MATEC Web Conf. 2018, 196, 1–8. [Google Scholar] [CrossRef][Green Version]
  30. Czumaj, P.; Dudziak, S.; Kacprzyk, Z. In-Depth Verification of a Numerical Model for an Axisymmetric RC Dome. Symmetry 2021, 13, 2152. [Google Scholar] [CrossRef]
  31. Kacprzyk, Z.; Czumaj, P.; Dudziak, S. Modelowanie Konstrukcji Budowlanych; Oficyna Wydawnicza Politechniki Warszawskiej: Warszawa, Poland, 2021. [Google Scholar]
  32. Talja, A.; Toratti, T.; Jarvinen, E. Classification and Acceptance Limits of Human-Induced Floor Vibrations in Residential Buildings; VTT Technical Research Centre of Finland: Espoo, Finland, 2002. [Google Scholar]
  33. López Cela, J.J.; Martínez Vicente, J.L. Vibration in Floors Induced for Human Walking: Comparison of Two Design Guidelines. Buildings 2024, 14, 3911. [Google Scholar] [CrossRef]
Figure 1. Structural details: (a) main beam; (b) connection of a column with the main beam and two perimeter beams.
Applsci 16 05369 g001
Figure 2. Structural scheme of the analysed skeleton slab with measurement locations depicted.
Applsci 16 05369 g002
Figure 3. Weighting functions for velocities and accelerations.
Applsci 16 05369 g003
Figure 4. Schemes of test setups: (a) in the media library, (b) in the book rental room.
Applsci 16 05369 g004
Figure 5. Field test setup in the book rental.
Applsci 16 05369 g005
Figure 6. FE model: (a) axonometry with basic dimensions, (b) detail of FE mesh and offsets between different parts, and (c) axonometry with assumed loads.
Applsci 16 05369 g006
Figure 7. Vibration time histories for a single walker in the media library: (a) acceleration; (b) velocity.
Applsci 16 05369 g007
Figure 8. Vibration time histories for two walkers in the media library: (a) acceleration; (b) velocity.
Applsci 16 05369 g008
Figure 9. Vibration time histories for a single walker in the book rental room: (a) acceleration; (b) velocity.
Applsci 16 05369 g009
Figure 10. Vibration time histories for two walkers in the book rental room: (a) acceleration; (b) velocity.
Applsci 16 05369 g010
Figure 11. Power density spectrum plots for selected signals registered in: (a) the media library; (b) the book rental room.
Applsci 16 05369 g011
Figure 12. The first 6 natural vibration modes.
Applsci 16 05369 g012
Figure 13. The design chart with eigenfrequencies and modal masses depicted, based on [23].
Applsci 16 05369 g013
Table 1. Summary of the measurements expressed in acceleration.
NoLocationTrackNumber of Walkersapeak Point 0apeak Point 1arms Point 0arms Point 1aw,rms Point 0aw,rms Point 1
(-)( mm s 2 )( mm s 2 )( mm s 2 )( mm s 2 )( mm s 2 )
1MM1170.424.629.47.219.45.1
2MM1119.47.27.42.310.95.1
3MM2144.912.416.54.212.43.5
4MM2281.117.225.95.716.23.7
5MM2255.812.718.64.312.32.6
6MM1135.715.116.65.011.33.4
7BRW1150.55.219.12.412.01.4
8BRW1150.85.718.62.312.01.3
9BRW12170.636.367.412.436.76.4
10BRW12101.518.136.95.623.13.0
11BRW2179.713.528.84.219.12.8
12BRW2154.66.320.52.713.61.7
13BRW2240.74.714.42.110.01.4
14BRW22171.926.564.78.538.75.0
15BRW1388.124.825.56.016.23.9
max171.936.367.412.438.76.4
Table 2. Summary of the measurements expressed in velocities.
NoLocationTrackNumber of Walkersvpeak Point 0vpeak Point 1vrms Point 0vrms Point 1OS-RMS Point 0OS-RMS Point 1
(-)( mm s )( mm s )( mm s )( mm s )(-)(-)
1MM110.6980.1630.1930.0560.0860.029
2MM110.3620.1300.1230.0510.0520.016
3MM210.4780.1660.1320.0410.0840.015
4MM220.5970.3060.1670.0430.0550.018
5MM220.5390.1510.1610.0310.0860.016
6MM110.3770.1550.1050.0380.0380.019
7BRW110.4030.0550.1390.0170.0560.012
8BRW110.3940.7360.1340.0170.0510.010
9BRW120.9740.1990.3680.0650.0830.015
10BRW120.9370.1400.2130.0270.1030.017
11BRW210.6340.0980.2130.0300.0880.012
12BRW210.4370.0560.1520.0230.0590.012
13BRW220.3410.1030.1100.0200.0410.008
14BRW221.1270.1620.3940.0520.1020.015
15BRW130.6930.2230.1740.0500.0590.027
max1.3510.7360.3940.0650.1030.037
Table 3. Dominant harmonic components determined using PSD.
RoomNo 1No 2No 3
(Hz)(Hz)(Hz)
Media library24.226.030.2
Book rental15.022.724.6
Table 4. Eigenfrequencies obtained using FEM.
NoValueNoValue
(Hz) (Hz)
114.21128.8
215.31228.9
318.71330.6
422.51431.3
524.71532.0
625.01632.9
726.21734.0
826.61834.5
928.01935.2
1028.22035.8
Table 5. Eigenfrequencies obtained using FEM.
Vibration ParameterCalculated ValueMeasured ValueRelative Difference
OS-RMS0.3800.343+11%
a w , r m s 0.0981 m s 2 0.129 m s 2 −24%
Disclaimer/Publisher’s Note: The statements, opinions and data contained in all publications are solely those of the individual author(s) and contributor(s) and not of MDPI and/or the editor(s). MDPI and/or the editor(s) disclaim responsibility for any injury to people or property resulting from any ideas, methods, instructions or products referred to in the content.