1. Introduction
The rapid expansion of the petrochemical industry has contributed substantially to plastic pollution, with mismanaged plastic waste fragmenting into microplastics (MPs) in aquatic systems through physical and chemical degradation. MPs are now ubiquitous, detected across marine, freshwater, terrestrial, and even polar environments, as well as in air, food, and human stool samples, raising concerns for ecological and human health [
1,
2,
3,
4,
5,
6,
7,
8]. Despite extensive documentation of MPs occurrence, variability in analytical workflows remains a major source of uncertainty, limiting comparability across studies [
9].
Common detection methods include pyrolysis–GC/MS, micro-Raman (μ-Raman), and micro-Fourier transform infrared (μ-FTIR) spectroscopy. Among these, μ-FTIR and μ-Raman are particularly valued for their non-destructive nature and ability to provide both chemical and spatial information [
10,
11,
12,
13]. However, outcomes vary due to differences in filter materials, sample pretreatment, instrumental settings, and spectral libraries, highlighting the need to evaluate procedural variables that influence MPs quantification.
μ-FTIR can be conducted in Attenuated Total Reflection (ATR), reflection, or transmission modes, each requiring specific filters and tailored spectral libraries [
6,
14]. For example, gold-coated and stainless-steel filters are preferred for reflection, while silicon and aluminum oxide are favored for transmission [
15,
16]. Inconsistent reporting of key parameters—such as filter type, detection mode, flow rates, and recovery experiments—limits reproducibility in existing studies [
17,
18,
19]. In particular, detailed FTIR acquisition parameters (e.g., spectral resolution, number of scans, background correction, and mapping settings) are often insufficiently reported in many microplastic studies, making it difficult to ensure data comparability and methodological reproducibility.
In this study, we focus on μ-FTIR in reflection mode and systematically quantify how filter selection, rinsing procedures, filtration methods, and identification protocols influence recovery efficiency and particle recognition. To address the reproducibility limitations in previous studies, detailed FTIR acquisition parameters—including spectral resolution, number of scans, background correction, and mapping settings—are explicitly reported, as appropriate instrumental configuration is essential for obtaining reliable and comparable spectral data. Polystyrene (PS) microspheres (30 μm and 90 μm; ρ = 1.05 g/cm3) were selected as model microplastics due to their monodispersity, chemical stability, and commercial availability, enabling well-controlled recovery experiments. The use of size-defined and shape-consistent reference particles allows the isolation of procedural effects from material-related variability, thereby minimizing uncertainties associated with polymer heterogeneity. In addition, by comparing particle size distributions before and after treatment, potential physical alterations (e.g., fragmentation or deformation) induced during sample processing can be evaluated. By linking procedural choices to quantitative outcomes, this work provides evidence-based insights to improve analytical accuracy, reproducibility, and inter-study comparability in environmental microplastics analysis.
2. Materials and Methods
2.1. Equipment Pre-Cleaning Procedure
To minimize background contamination from microplastics (MPs), all suspensions were prepared, handled, and stored exclusively in glassware. During sampling and filtration, polypropylene pipette tips and polytetrafluoroethylene (PTFE)/polydimethylsiloxane (PDMS) gaskets were used to prevent leakage and were pre-rinsed thoroughly with deionized (DI) water prior to use. To reduce particle shedding from disposable materials, gloves were avoided whenever possible; instead, sample handling was performed using pre-cleaned glassware and metal tools within a clean glass chamber under aseptic conditions to limit airborne contamination. All glassware was soaked overnight in 20% nitric acid, rinsed three times with DI water, and dried in a clean oven at 105 °C for at least 2 h. Cleaned equipment was stored in a sealed desiccator containing anhydrous silica gel until use.
2.2. Procedural Blank Test
Procedural blank tests were conducted to evaluate potential background contamination introduced during sample handling, filtration, and μ-FTIR analysis. The blank samples were processed using the same filtration setup, pipetting procedure, rinsing solution, sealing components, and analytical workflow as those used in the recovery experiments, but without adding PS microspheres. The filtered blank samples were then analyzed by μ-FTIR under the same acquisition and identification criteria. This procedure was used to assess potential contamination from the laboratory environment, filtration apparatus, PP pipette tips, PTFE/PDMS sealing materials, and other handling steps.
2.3. Preparation of Polystyrene Microsphere Standard Suspensions
Polystyrene (PS) microsphere suspensions (5 mL; Sigma-Aldrich, BCCF6429, Burlington, MA, USA) with nominal diameters of 90 μm (6.24 × 10⁴ particles/mL) and 30 μm (1.3 × 10⁶ particles/mL) were used as model particles to evaluate recovery efficiency. These particle sizes were selected because they are commercially available, monodisperse, and well characterized, thereby ensuring reproducibility and traceability in method evaluation. Importantly, these PS standards were employed as controlled surrogates for workflow optimization rather than as direct analogs of environmentally derived MPs.
To achieve uniform particle distribution over a 10 mm × 10 mm filter area, both suspensions were diluted prior to use. The 90 μm stock was diluted to a final concentration of approximately 88 ± 1 particles/mL, and the 30 μm stock to approximately 5148 ± 1 particles/mL. Homogeneous dispersion was ensured by vortexing each suspension at 1000 rpm for three 30 s intervals. The resulting working suspensions were hereafter referred to as polystyrene standard suspensions (PSS) and were used in all recovery experiments.
2.4. Processing and Analysis of PSS
A procedural blank was conducted to assess potential environmental contamination during PSS preparation. Briefly, 100 μL of DI water was dispensed onto a silicon filter and oven-dried at 90 °C. No particles were detected, indicating effective contamination control throughout the preparation procedure. To systematically evaluate methodological variables influencing MPs recovery and identification, we examined the effects of filter material, rinsing suspension (DI water versus 50% ethanol), filtration mode (direct application versus filtration; pump-assisted), and μ-FTIR software (version 1.7.198, Thermo Fisher Scientific, Waltham, MA, USA) workflows. All experimental conditions are summarized in
Table 1, and detailed procedures are described below. The corresponding theoretical and counted particle numbers for each run are provided in
Table S2.
2.4.1. Direct Titration (Dt)
In the direct titration (DT) approach, defined volumes of PSS were applied directly onto 10 mm × 10 mm filters without filtration. Six filter types were evaluated: stainless steel filter (35 μm; local hardware store, New Taipei, Taiwan), silicon filter (1.0 μm; 005745-W08, SmartMembranes GmbH, Halle, Germany), alumina oxide filter (0.2 μm; No. 6809-6022, Whatman International Ltd., Maidstone, UK), mixed cellulose ester (MCE) filter (0.2 μm; A020A047A, Advantec, Chiba, Japan), polyvinylidene difluoride (PVDF) filter (0.1 μm; 40161507, Merck KGaA, Darmstadt, Germany), and glass fiber filter (0.6 μm; GA-55 No. 70425711, Toyo Roshi Kaisha, Ltd., Tokyo, Japan) (
Figure S1; Table S1).
For 90 μm PS particles, stainless-steel filters were selected because their large pore size minimizes particle retention within the filter matrix while offering mechanical robustness and low cost. A diluted 90 μm PSS (~88 particles/mL) was vortexed and dispensed dropwise (700 μL) onto the filter, followed by sequential rinsing with 50% ethanol to reduce particle loss during transfer. The theoretical deposition was approximately 62 particles per filter (
Table 1, Run 1).
For 30 μm PS particles, silicon filters were initially used to assess potential aggregation effects associated with smaller particle sizes. A diluted 30 μm PSS (~5148 particles/mL) was applied dropwise (10 μL), and pipette tips were rinsed using either DI water or 50% ethanol as part of the workflow comparison. The rinsing step was applied during aliquot sampling and transfer, including pipette-tip rinsing before and after sample deposition, to reduce particle adhesion to the tip surface, temporary aggregation, and local particle-number heterogeneity during transfer. The theoretical deposition was approximately 51 particles per filter. The use of ethanol was evaluated as a practical measure to mitigate particle aggregation and surface adhesion during handling (
Table 1, Runs 2–3).
The same 30 μm protocol was subsequently applied to alumina oxide, MCE, PVDF, and glass fiber filters to enable cross-comparison of filter material performance (
Table 1, Runs 4–7).
2.4.2. Filtration Method with Standard Addition
Because filtration is a routine step in waterborne MPs analysis, this process was simulated using PSS to evaluate potential particle loss during filtration. A custom-built filtration assembly consisting of alternating polydimethylsiloxane (PDMS) and polytetrafluoroethylene (PTFE) gaskets (
Figure S2) was used to securely mount the filters within a glass filtration unit (Schott Duran, Wertheim, Germany).
For filter comparison, stainless-steel and silicon filters were tested using the 90 μm PSS (88 ± 1 particles/mL). Filtration was performed using pump-assisted suction, with the vacuum pressure strictly controlled at 200 mmHg to ensure consistent and reproducible filtration conditions. After filtration, all components in contact with the sample were rinsed three times with 50% ethanol to minimize particle loss. The filters were then transferred to glass Petri dishes and dried at 90 °C for 1 h prior to μ-FTIR analysis (
Table 1, Runs 8–9). To assess the effect of microplastic particle size on recovery, an additional experiment was conducted using 30 μm PSS (5148 ± 1 particles/mL) with silicon filters under otherwise identical conditions (
Table 1, Run 10).
2.5. Identification and Quantification of MPs Using μ-FTIR
Microplastics were analyzed using a micro-Fourier transform infrared (μ-FTIR) spectrometer (Nicolet iN10, Thermo Fisher Scientific, Waltham, MA, USA) equipped with a mercury cadmium telluride (MCT) detector and operated in reflectance mode. Before data acquisition, the instrument energy and signal stability were checked to ensure appropriate focusing and spectral quality. Instrument energy is a unitless, instrument-derived parameter recorded at the beginning of data acquisition and reflects the overall infrared signal level under fixed instrumental conditions, such as interferometer intensity, aperture size, and spectral resolution. It serves as an indicator of instrument status and measurement stability, rather than a direct measure of sample-specific spectral intensity. Instrumental parameters were selected in accordance with previously published μ-FTIR studies to facilitate methodological comparability [
6,
13,
16]. A clean, particle-free region of each filter served as the background reference.
Spectral identification was primarily performed using the Aldrich FTIR library available in OMNIC Picta software (version 1.7.198; driver version 9.9.0.471, Thermo Fisher Scientific, Waltham, MA, USA). The library was used as an installed reference database for spectral matching. When necessary, spectra from the spiked PS standard particles were used as condition-matched comparison spectra to account for spectral variations caused by filter background and measurement conditions. A similarity threshold of 70% was applied for polymer assignment, consistent with commonly adopted criteria in μ-FTIR-based MPs studies [
6]. Microplastics were quantified using both manual and software-assisted approaches. Manual counting was conducted directly under the μ-FTIR microscope (8×–500× magnification), where spherical PS particles were identified based on morphology and confirmed by IR spectra when required. Each confirmed particle was manually outlined and labeled to obtain the final count.
For software-assisted analysis, three workflows were evaluated to assess analytical robustness rather than software performance per se: Analyze Images and Wizard Particles in OMNIC Picta software (version 1.7.198; driver version 9.9.0.471, Thermo Fisher Scientific, Waltham, MA, USA), and ImageJ (version 1.54p, National Institutes of Health, Bethesda, MD, USA). The key mapping and software settings are summarized in Section μ-FTIR Mapping Parameters and Software-Assisted Counting, while detailed stepwise software procedures are provided in the
Supplementary Information.
μ-FTIR Mapping Parameters and Software-Assisted Counting
The μ-FTIR mapping parameters and software-assisted counting procedures were standardized as described below. Spectral maps were acquired in reflectance mode at a spectral resolution of 16 cm
−1. The acquisition time was 0.208 s per pixel for OMNIC Picta mapping and 0.511 s for Wizard Particles analysis. The pixel aperture was set to 29 × 29 μm, which was selected to match the target particle size range of the 30 μm PS microspheres while maintaining practical mapping efficiency. For OMNIC Picta Analyze Images, spectral matching images were generated using the 70% similarity threshold, and particles exceeding this threshold were marked for enumeration. For Wizard Particles, microscopic images and spectral data were integrated using a predefined target particle size range of approximately 29–30 μm for automated identification and spectral matching. For ImageJ analysis, spectral matching images with ≥70% similarity were imported, followed by image-scale calibration, background subtraction, particle outlining, and sequential particle labeling using the built-in particle-counting function. These software-assisted procedures were used to evaluate the consistency of particle recognition and counting under the same μ-FTIR analytical conditions. Detailed stepwise software procedures and representative examples are provided in the
Supplementary Information.
2.6. Calculation of the Recovery Rate for Ps Standard Particles
The recovery rate of PS standard particles was calculated by comparing the number of particles experimentally detected using μ-FTIR with the theoretically expected number, as determined by Equations (1) and (2). The theoretical count was derived from the known concentration of the polystyrene standard suspension (PSS), while the experimental count was obtained through manual enumeration of μ-FTIR images:
where V is the sampling volume (mL), and [PSS] is the PSS concentration (particles/mL).
2.7. Analysis of the River Water Sample
To preliminarily evaluate the applicability of the selected filtration-based MP analysis workflow under real matrix conditions, standard addition experiments using polystyrene standard suspensions (PSS) were conducted in river water matrices. The addition of 30 μm PSS was intended to assess whether the recovery performance achieved in controlled tests could be maintained after undergoing identical pretreatment and filtration procedures in a complex environmental matrix.
Prior to digestion, 30 μm PSS (5148 ± 1 particles/mL) were added to the 20 mL samples (
Table 1, Run 11). Organic matter was then digested by adding 100 μL of 30% H
2O
2, followed by incubation in a water bath at 50 °C for 16 h. After cooling to room temperature, ZnCl
2 was added to adjust the suspension density to 2.0 g/cm
3 for density separation. To prevent ZnO precipitation during this step, 0.01 N HCl was added as needed. The treated sample was transferred to a separatory funnel, and the original sample bottle was rinsed three times with 50% ethanol, with the rinse combined with the sample.
After standing for 5 min, approximately half of the lower layer was drained, and the remaining suspension was subjected to filtration. Prior to filtration, the filtration unit was rinsed with 50% ethanol, and vacuum-assisted filtration was performed with the pressure strictly controlled at 200 mmHg. Excessive vacuum pressure (>200 mmHg) was avoided, as it may induce mechanical stress on filters, leading to potential damage or rupture. In addition, overly strong suction can enhance particle penetration or loss during filtration, thereby compromising recovery efficiency. The sample was filtered dropwise to minimize particle loss and aggregation. Following filtration, the filter was dried at 60 °C and subsequently analyzed by μ-FTIR for MPs identification and enumeration.
This standard addition approach allowed direct evaluation of PSS recovery in river water after full pretreatment, thereby demonstrating the feasibility and practical applicability of the optimized filtration workflow for environmental MPs analysis.
2.8. Replication Strategy and Data Reliability
To evaluate experimental reproducibility and ensure the robustness of the optimized analytical workflow, replicate experiments were performed for selected runs representing key methodological conditions. Replication was not applied uniformly across all screening tests, as the primary objective of the initial phase was broad method optimization. Instead, repeated measurements were conducted for runs identified as optimal or practically relevant.
Specifically, Run 2 (direct titration with optimized rinsing conditions) was replicated four times to assess consistency in recovery under controlled laboratory conditions. Run 10 (pump-assisted filtration with controlled vacuum pressure) was replicated ten times to evaluate the stability and reproducibility of filtration-based recovery, which had been identified as a critical and variable step. In addition, Run 11, involving river water samples with standard addition of 30 μm polystyrene microspheres, was replicated three times to verify method applicability and recovery performance in a real environmental matrix.
Recovery rates from these replicated runs were used to assess reproducibility and are reported as mean ± standard deviation. This replication strategy allowed reliable evaluation of key analytical parameters while balancing experimental feasibility during method development.
3. Results and Discussion
3.1. Results of the Direct Titration (Dt) Method
3.1.1. Blank Test
Procedural blank tests were performed to evaluate potential background contamination introduced during sample handling, filtration, and μ-FTIR analysis. Briefly, 20 mL of deionized water was processed using the same filtration setup, pipetting procedure, sealing components, and μ-FTIR analytical workflow as those used in the recovery experiments, but without the addition of PS microspheres. No visible particles were observed on the silicon filter (
Figure S3a), and μ-FTIR analysis detected no plastic-related signals, including PS, PP, PTFE, or PDMS (
Figure S3b). These results indicate that background contamination from the laboratory environment, filtration apparatus, PP pipette tips, PTFE/PDMS sealing materials, and sample-handling steps was negligible under the tested conditions.
3.1.2. Comparison of Manual and Software-Assisted Particle Counting
During method development, discrepancies were observed between manual and software-assisted particle counts, underscoring the need for calibration using reference standards. Manual counting was therefore adopted as the benchmark for evaluating counting accuracy.
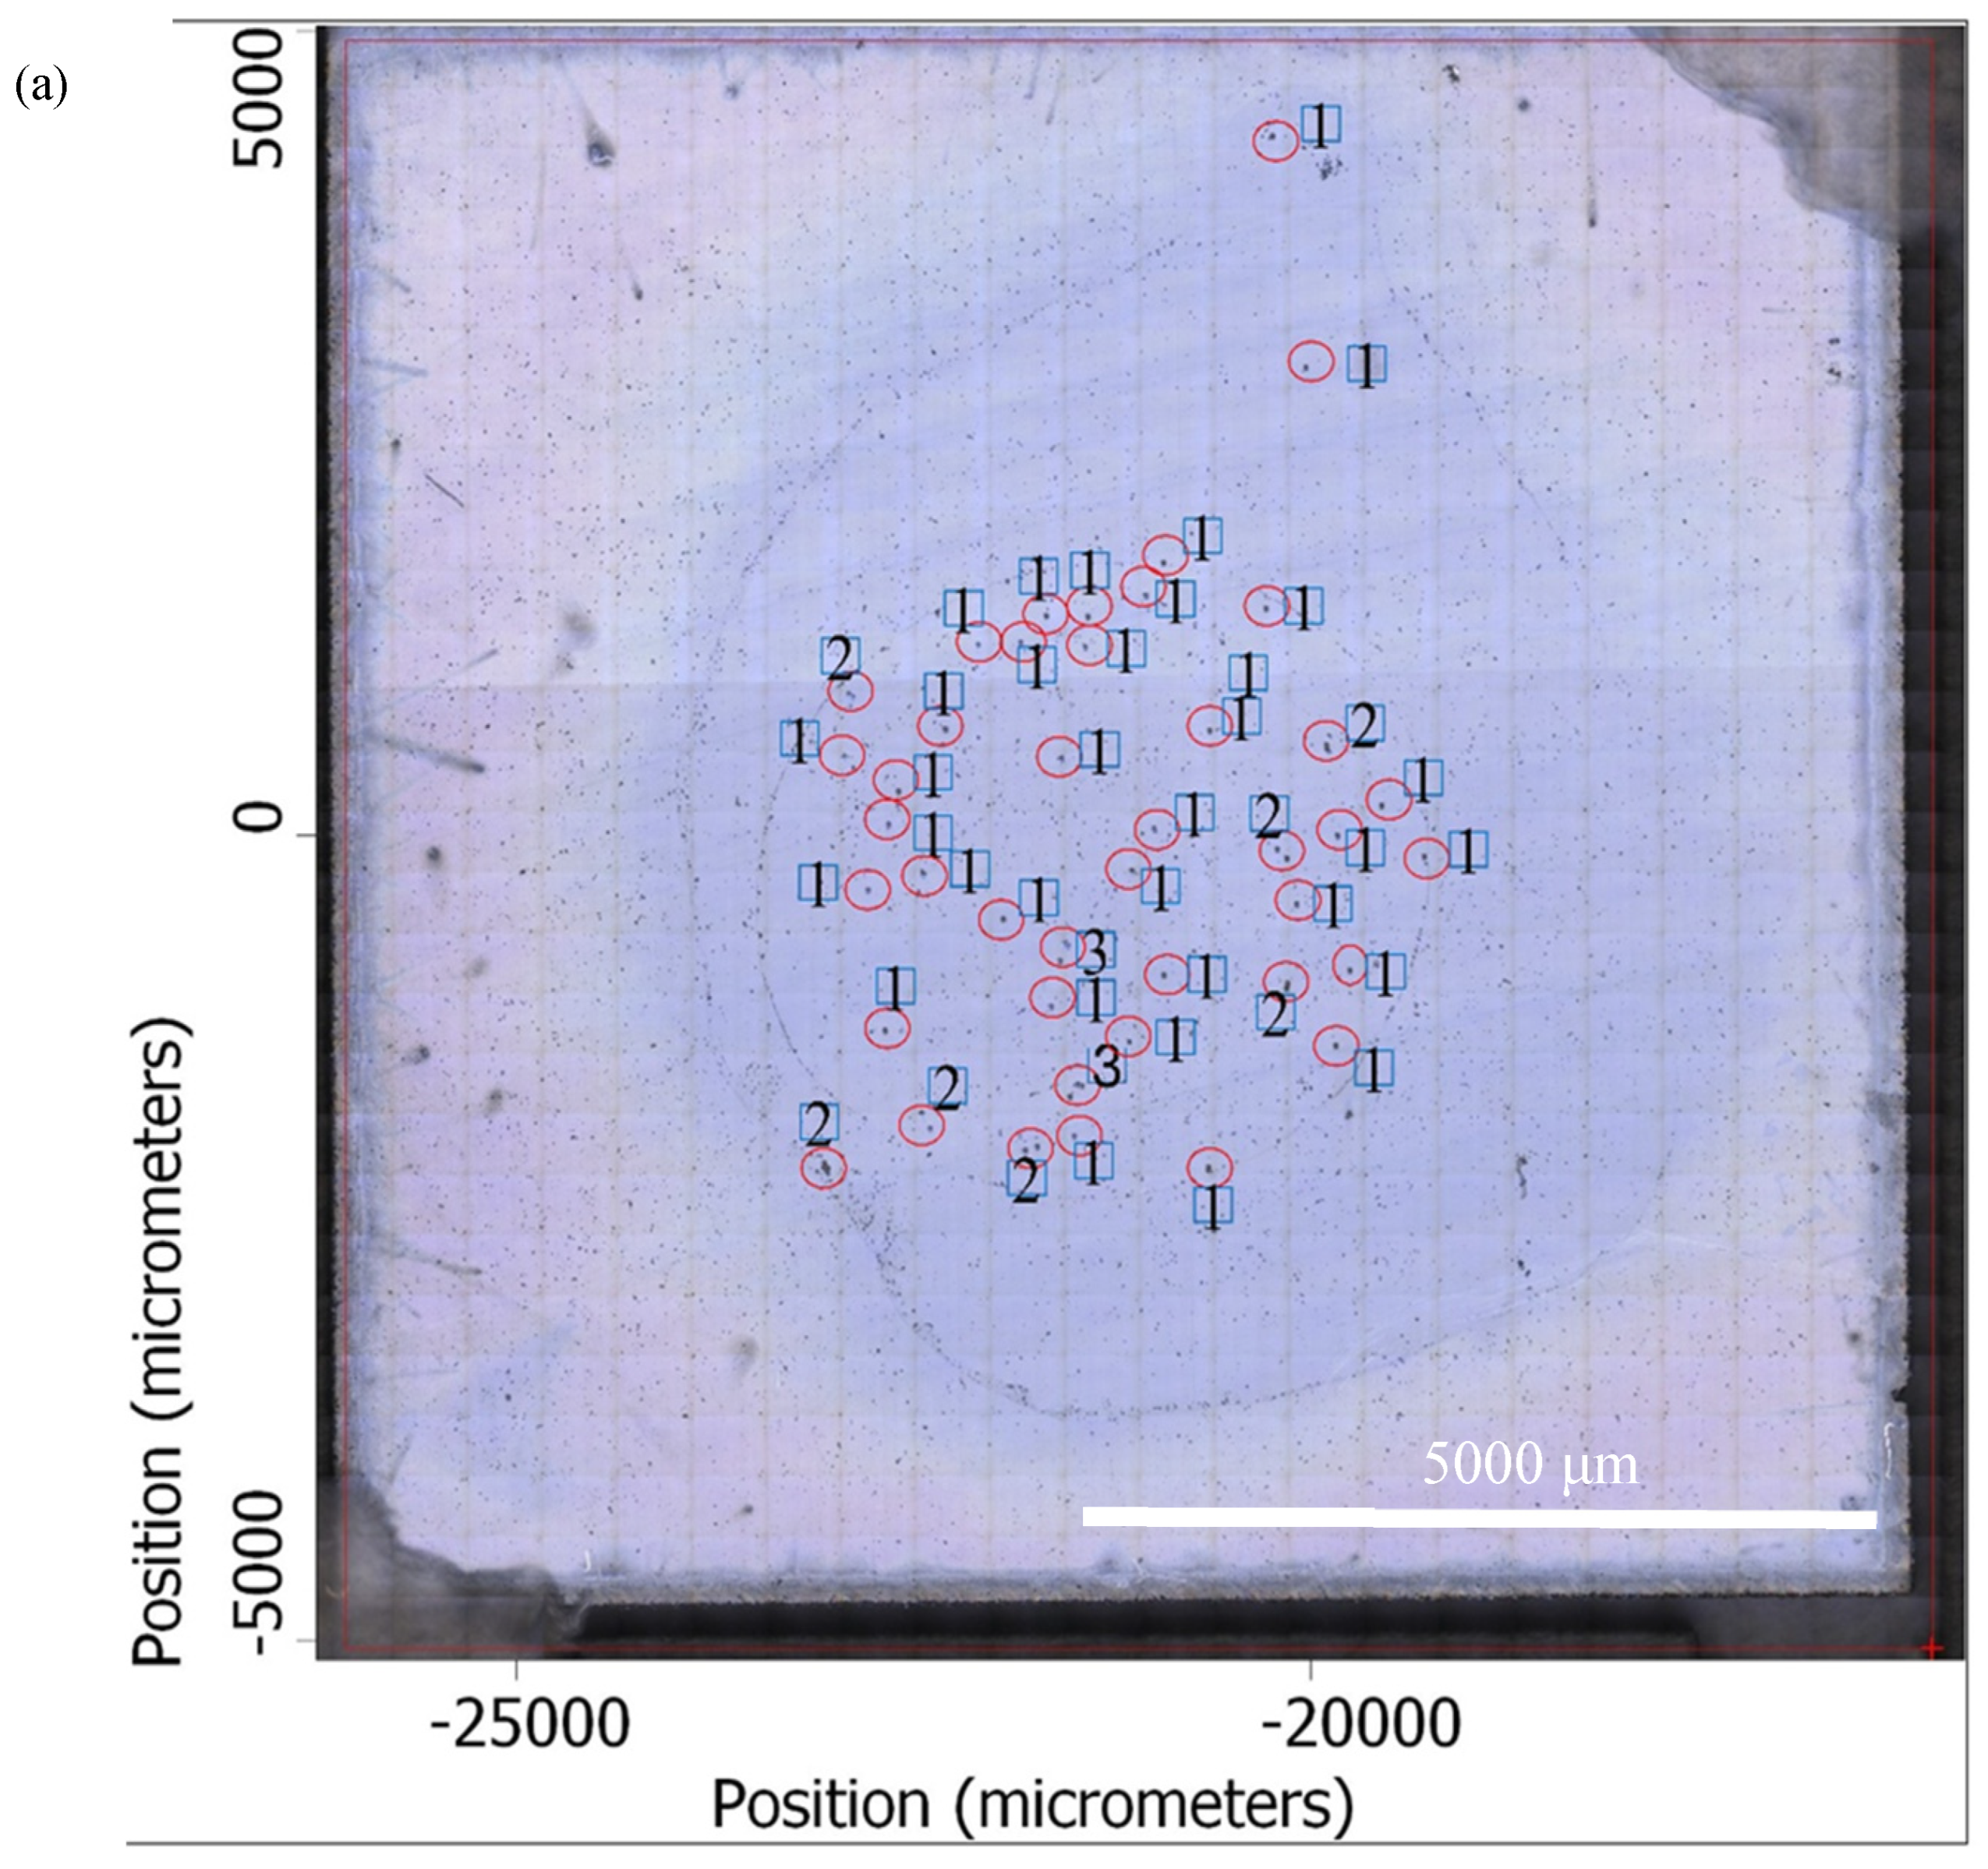
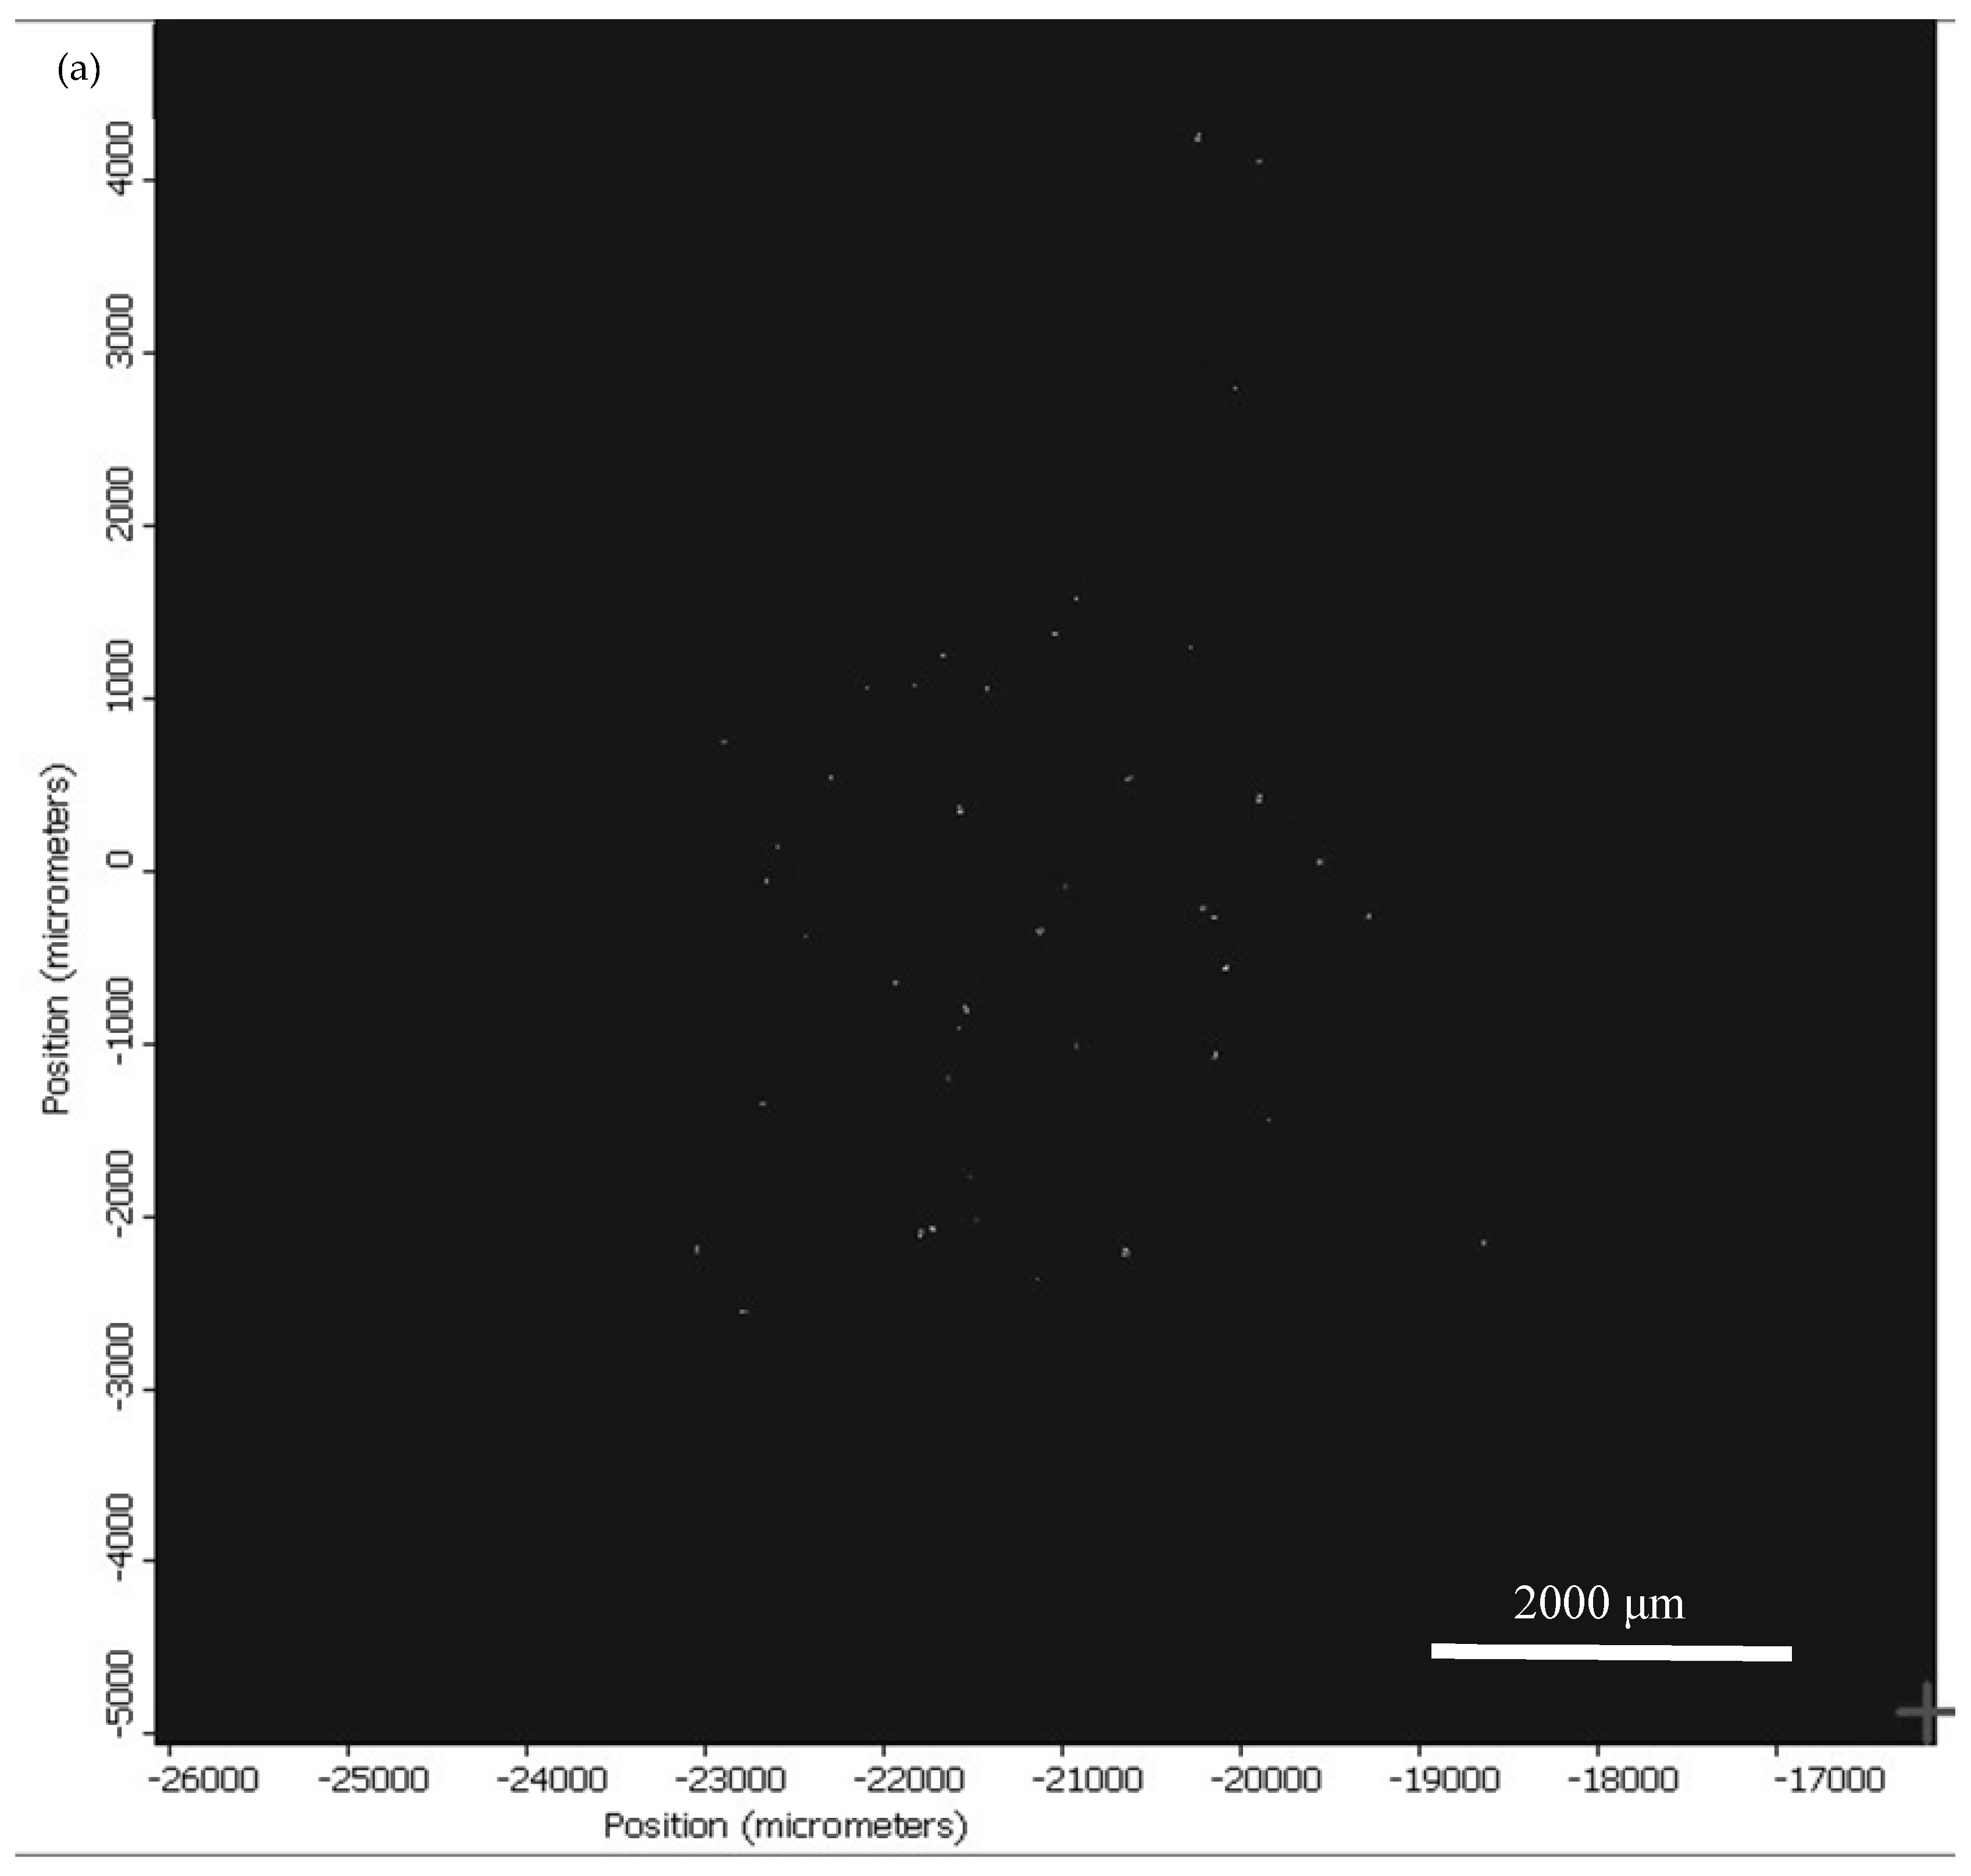
Figure 1a corresponds to Run 2 (
Table 1), for which four replicate experiments were conducted. Manual counting yielded an average of 104 ± 4.03% recovery (n = 4; individual values: 107%, 109%, 103%, and 100%) relative to the theoretical particle number (51 particles), demonstrating good reproducibility. Slight overestimation (>100%) was occasionally observed and is attributed to aggregation of small PS particles during sample handling, which can increase the likelihood of aspirating multiple particles simultaneously. This effect is consistent with known electrostatic interactions among small MPs and highlights the importance of dispersion control during quantitative analysis.
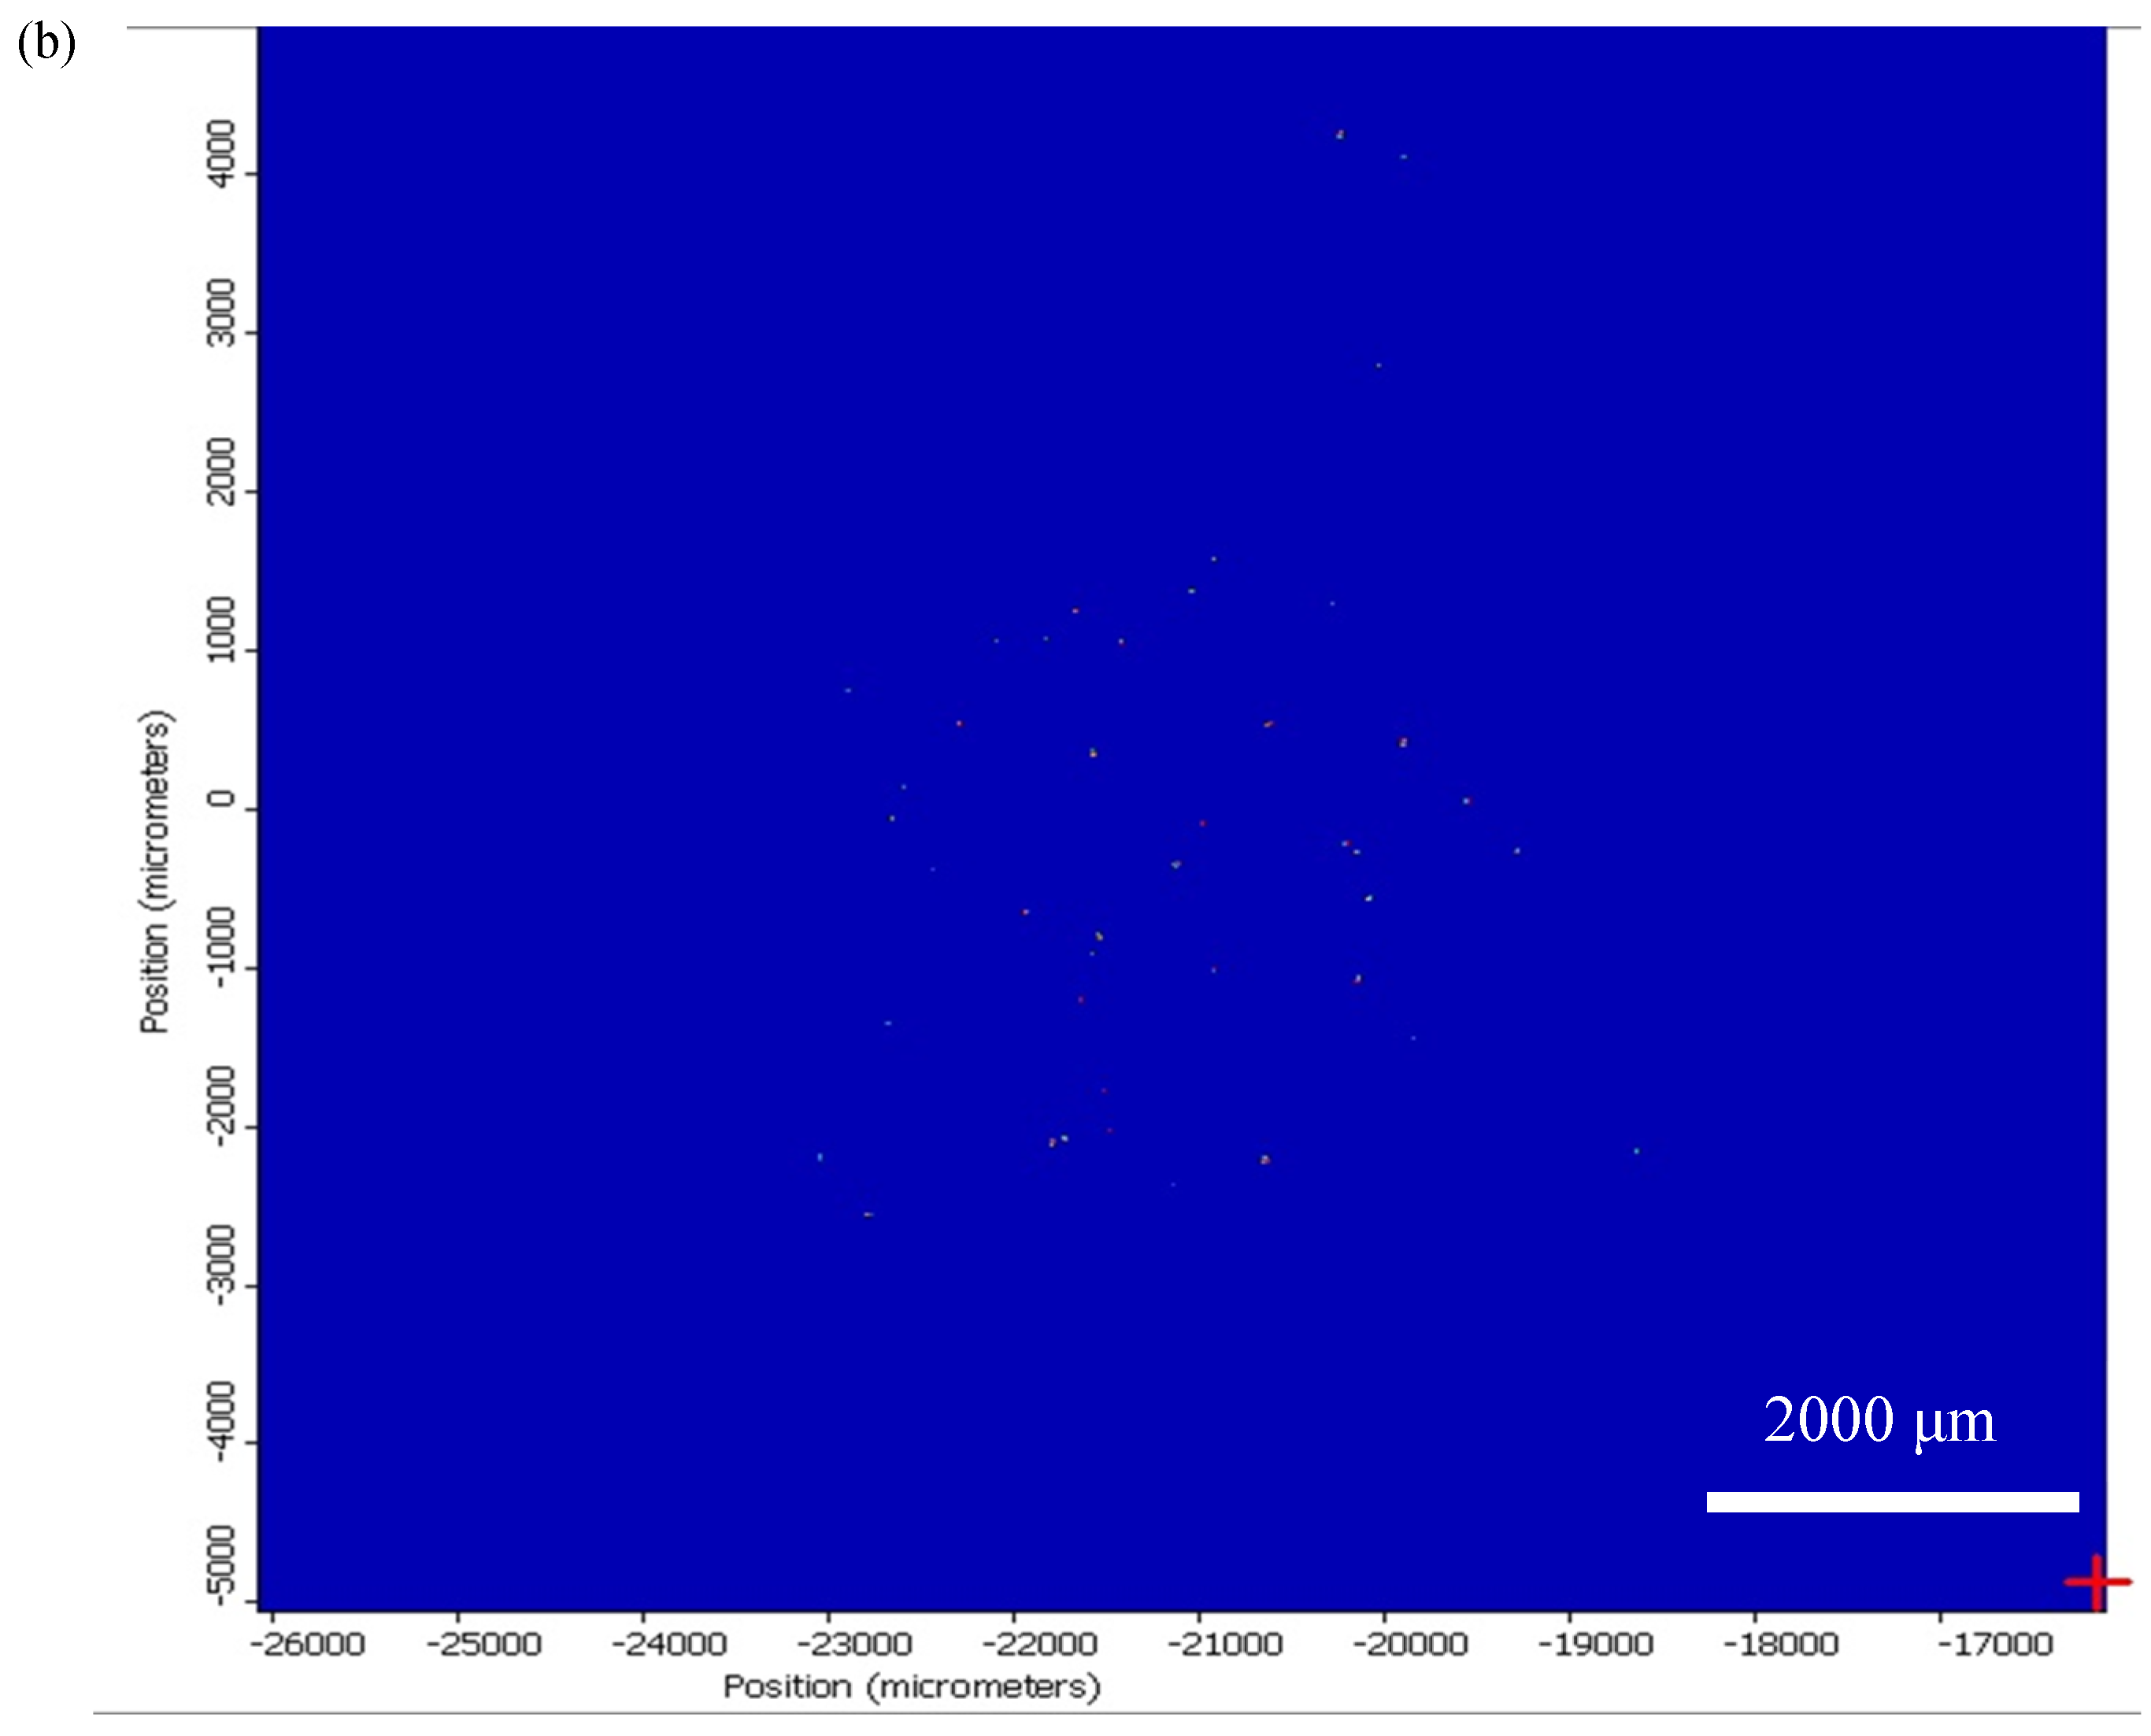
The corresponding spectral map (
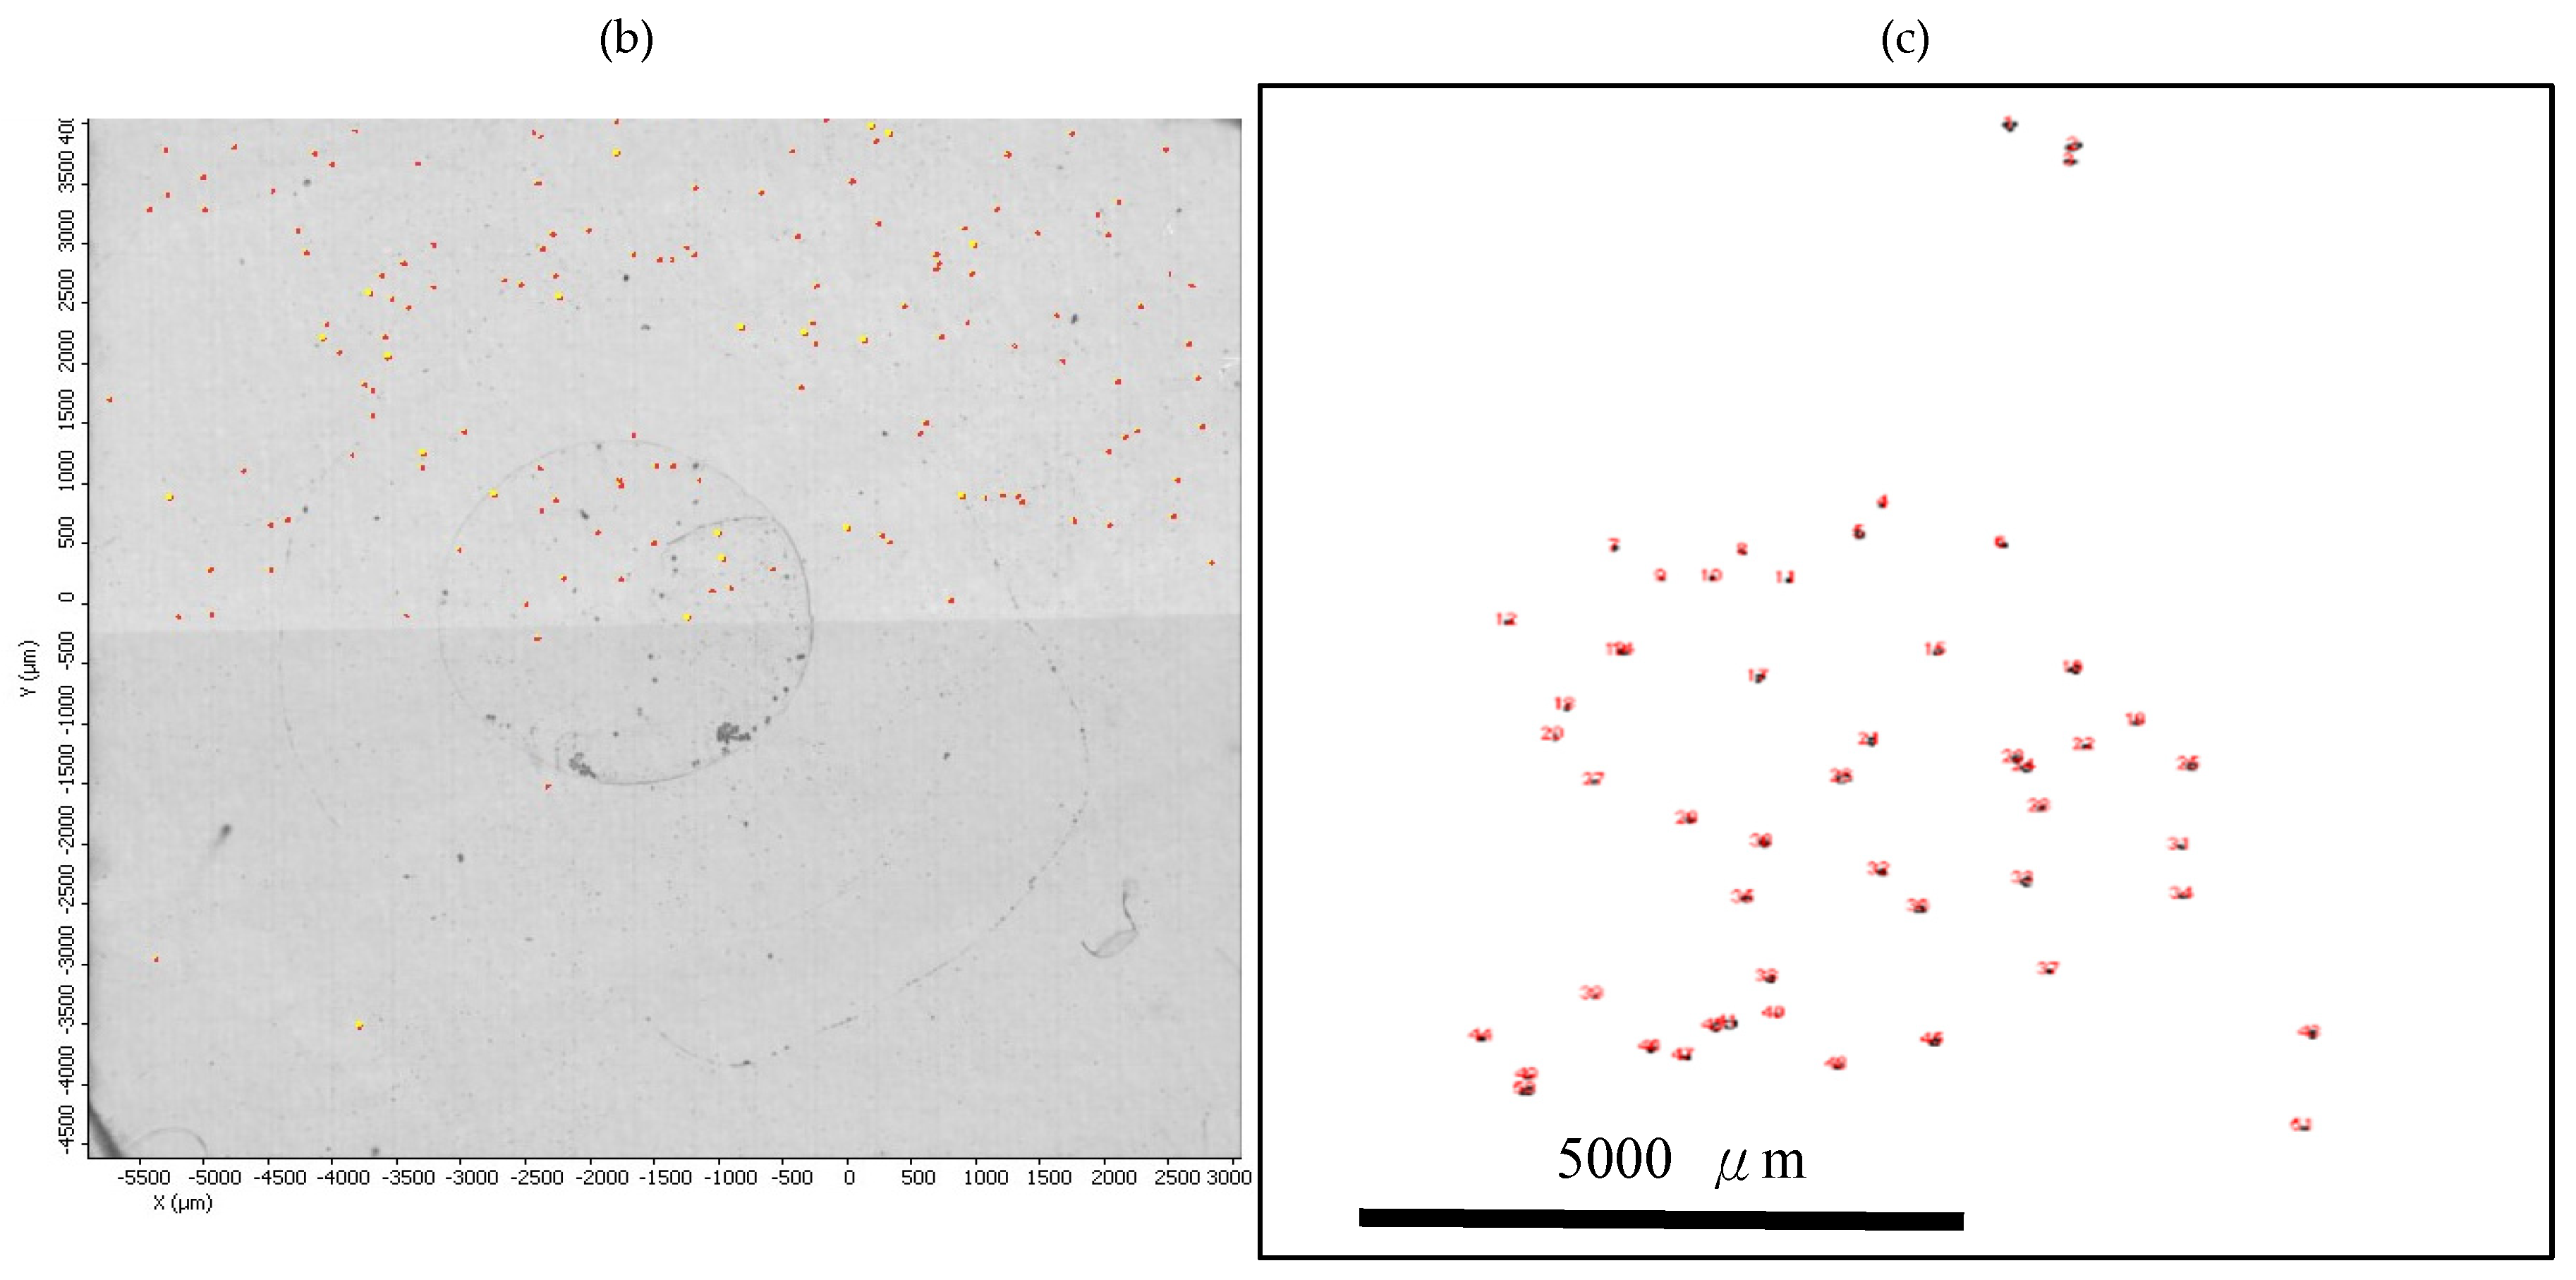
Figure 1b) was subsequently analyzed using three different software tools for comparison. As summarized in
Figure 2, software-assisted particle counting was highly sensitive to parameter settings and analysis logic. Using OMNIC Picta Analyze Images, the initial automated output identified 125 objects. After constraining the expected particle area to approximately 50 μm
2 to remove spurious detections, the count decreased to 57 particles, corresponding to a recovery of 112% (
Figure 2a). This result indicates that without appropriate calibration, this method is prone to overestimation. Analysis using OMNIC Picta Wizard Particles further amplified this issue, identifying more than 200 objects (
Figure 2b). The software failed to reliably distinguish true PS particles from background features, leading to substantial overestimation. By contrast, ImageJ produced particle counts (51 particles;
Figure 2c) that closely matched manual enumeration. This result suggests that ImageJ can provide feasible software-assisted particle counting when microplastics are well dispersed, filtration conditions are controlled, and μ-FTIR spectral identification and image-processing parameters are properly calibrated.
Overall, these results demonstrate that although automated software tools can substantially accelerate μ-FTIR-based MPs analysis, rigorous parameter optimization and validation with standard particles are essential to avoid systematic over- or underestimation. Accordingly, manual counting was adopted as the reference method for calculating recovery rates across experimental conditions (
Table 1). This comparison highlights the importance of calibrating automated counting software using standard particles, which remains a critical but frequently underreported step in previous μ-FTIR-based microplastic studies [
6,
19,
20,
21,
22].
3.1.3. Effectiveness of Rinsing Suspensions
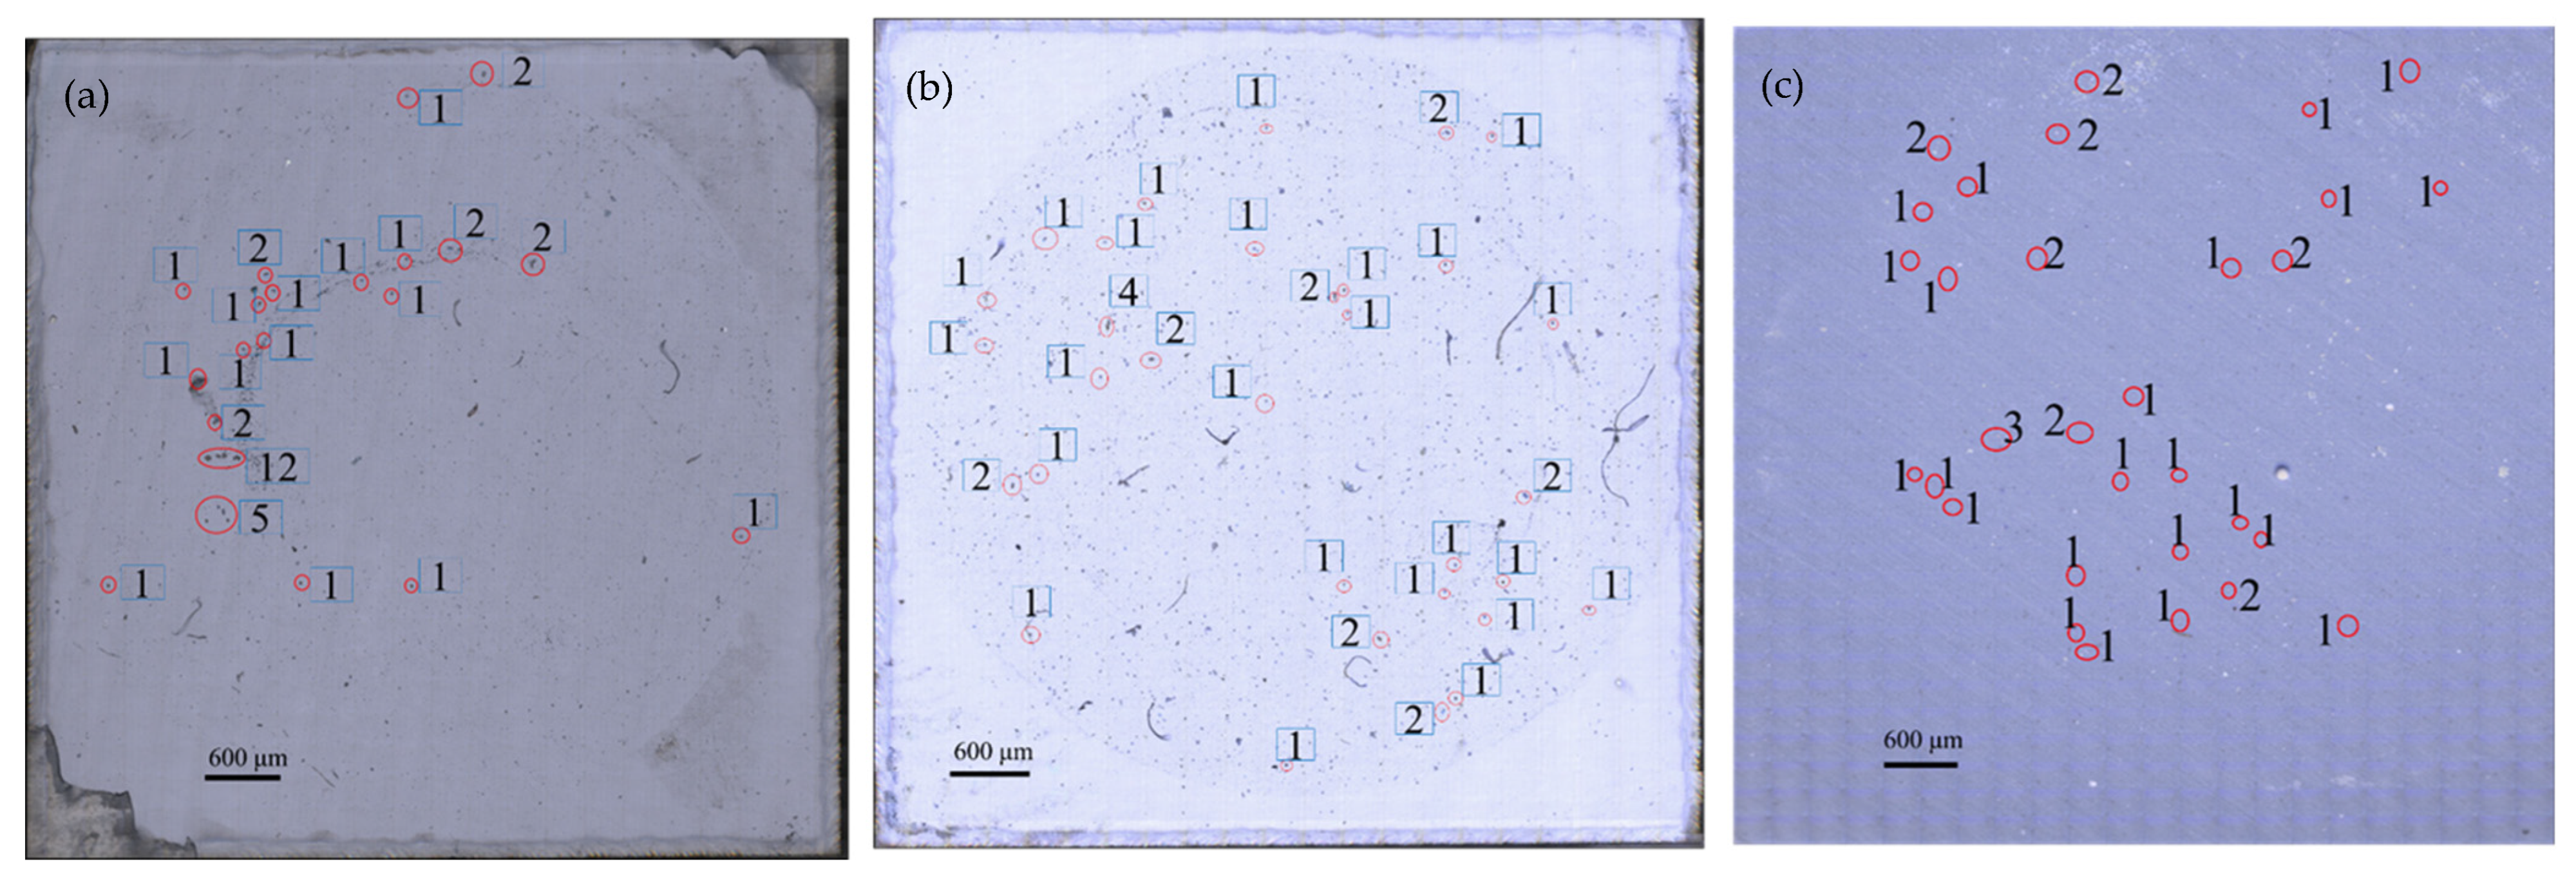
Aggregation of small MPs can bias quantification. Comparison of DI water versus 50% ethanol rinsing (Runs 2–3,
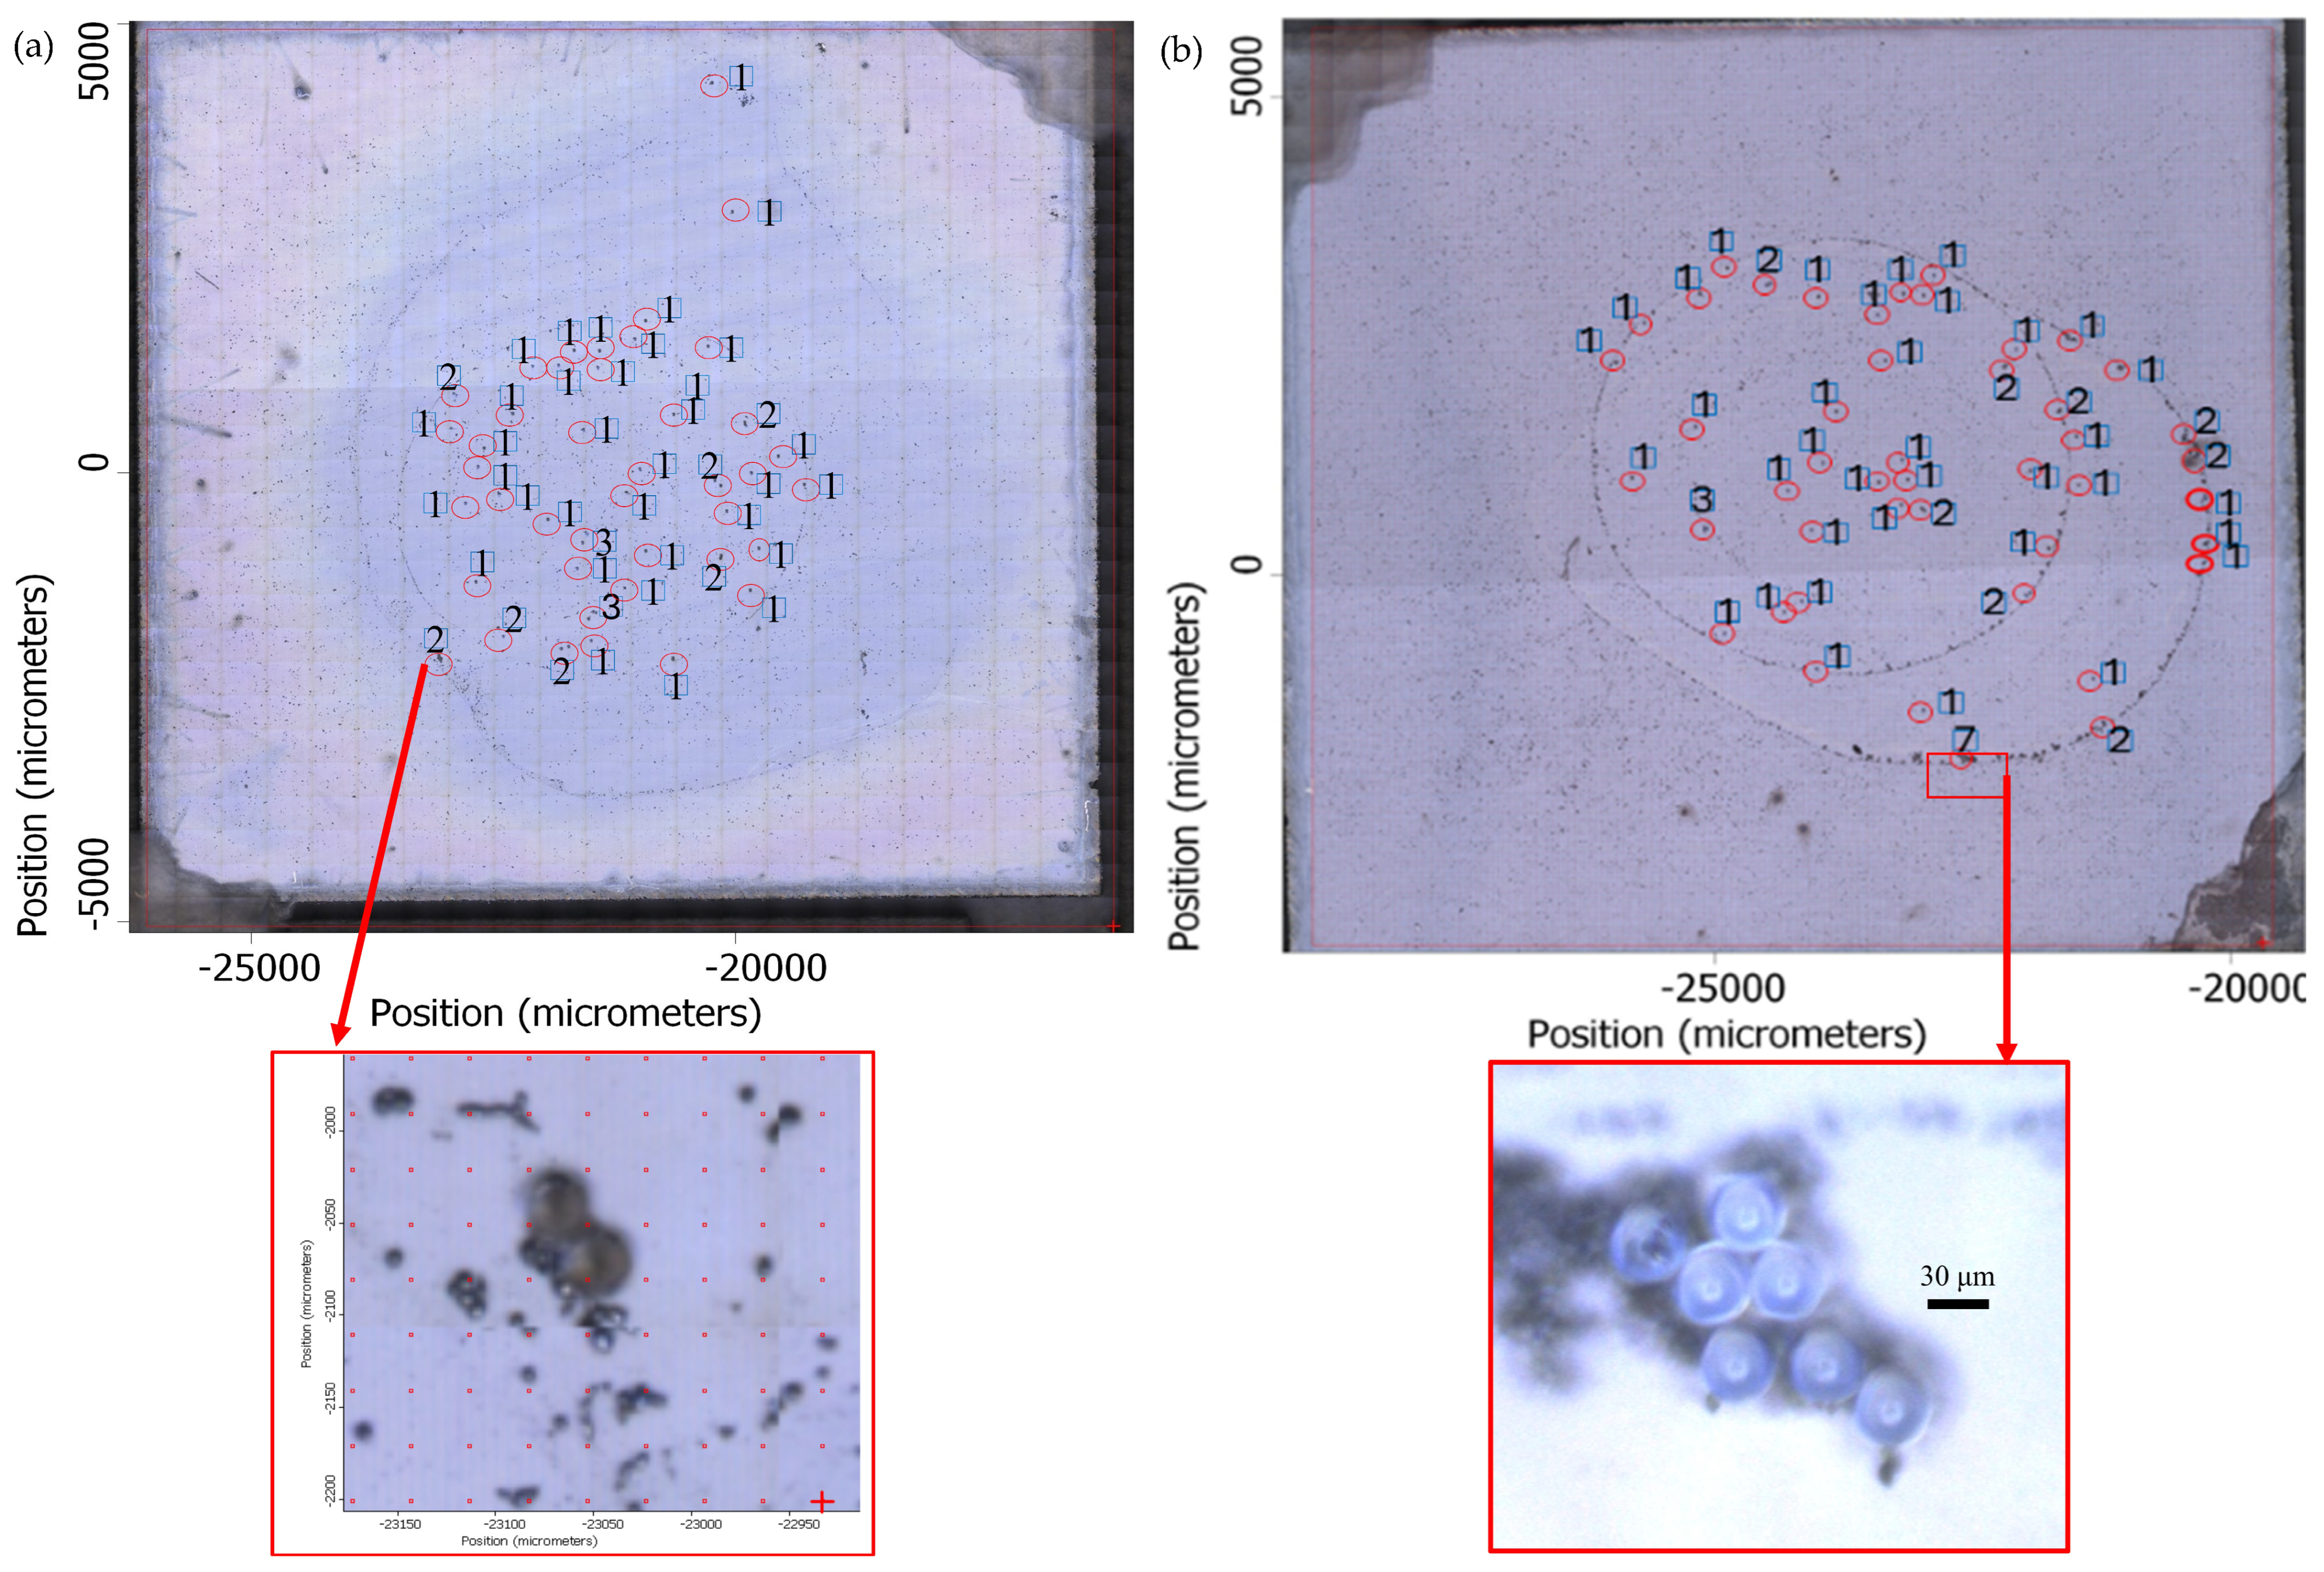
Table 1) revealed clear benefits of ethanol. DI water allowed up to seven particles to aggregate into a single cluster (
Figure 3b), whereas ethanol dispersed particles more effectively (
Figure 3a), yielding more accurate recovery (104 ± 4.03% vs. 121% for DI water). The absolute counted particle numbers used for recovery calculation are provided in
Table S2.
The improved dispersion observed with ethanol is primarily attributed to enhanced wetting of the hydrophobic microplastic surface, rather than electrostatic stabilization. In aqueous systems, insufficient wetting can promote particle–particle adhesion through direct contact, leading to the formation of loosely bound aggregates. The addition of ethanol facilitates solvent penetration into interparticle contact regions, reducing adhesion and promoting the breakup of these aggregates. Therefore, the observed improvement primarily reflects de-agglomeration rather than a true increase in colloidal stability. Notably, this behavior suggests the existence of an optimal co-solvent condition, in which improved wetting and partial electrostatic stabilization are balanced. While ethanol reduces the dielectric constant of the medium and weakens electrostatic repulsion, excessive reduction may instead promote re-aggregation due to dominant van der Waals attraction. The enhanced dispersion at 50% ethanol thus likely arises from this balance, rather than from a single stabilization mechanism. These observations are consistent with prior reports recommending ethanol for small MPs due to its dual hydrophilic/lipophilic properties, without interfering with polymer identification [
16]. This suggests ethanol rinsing can enhance reproducibility in environmental samples, although further validation with diverse polymer types is warranted.
3.1.4. Filter Material Evaluation
Filter choice critically affects recovery, spectral quality, and analytical reliability [
6,
10,
13,
15,
16,
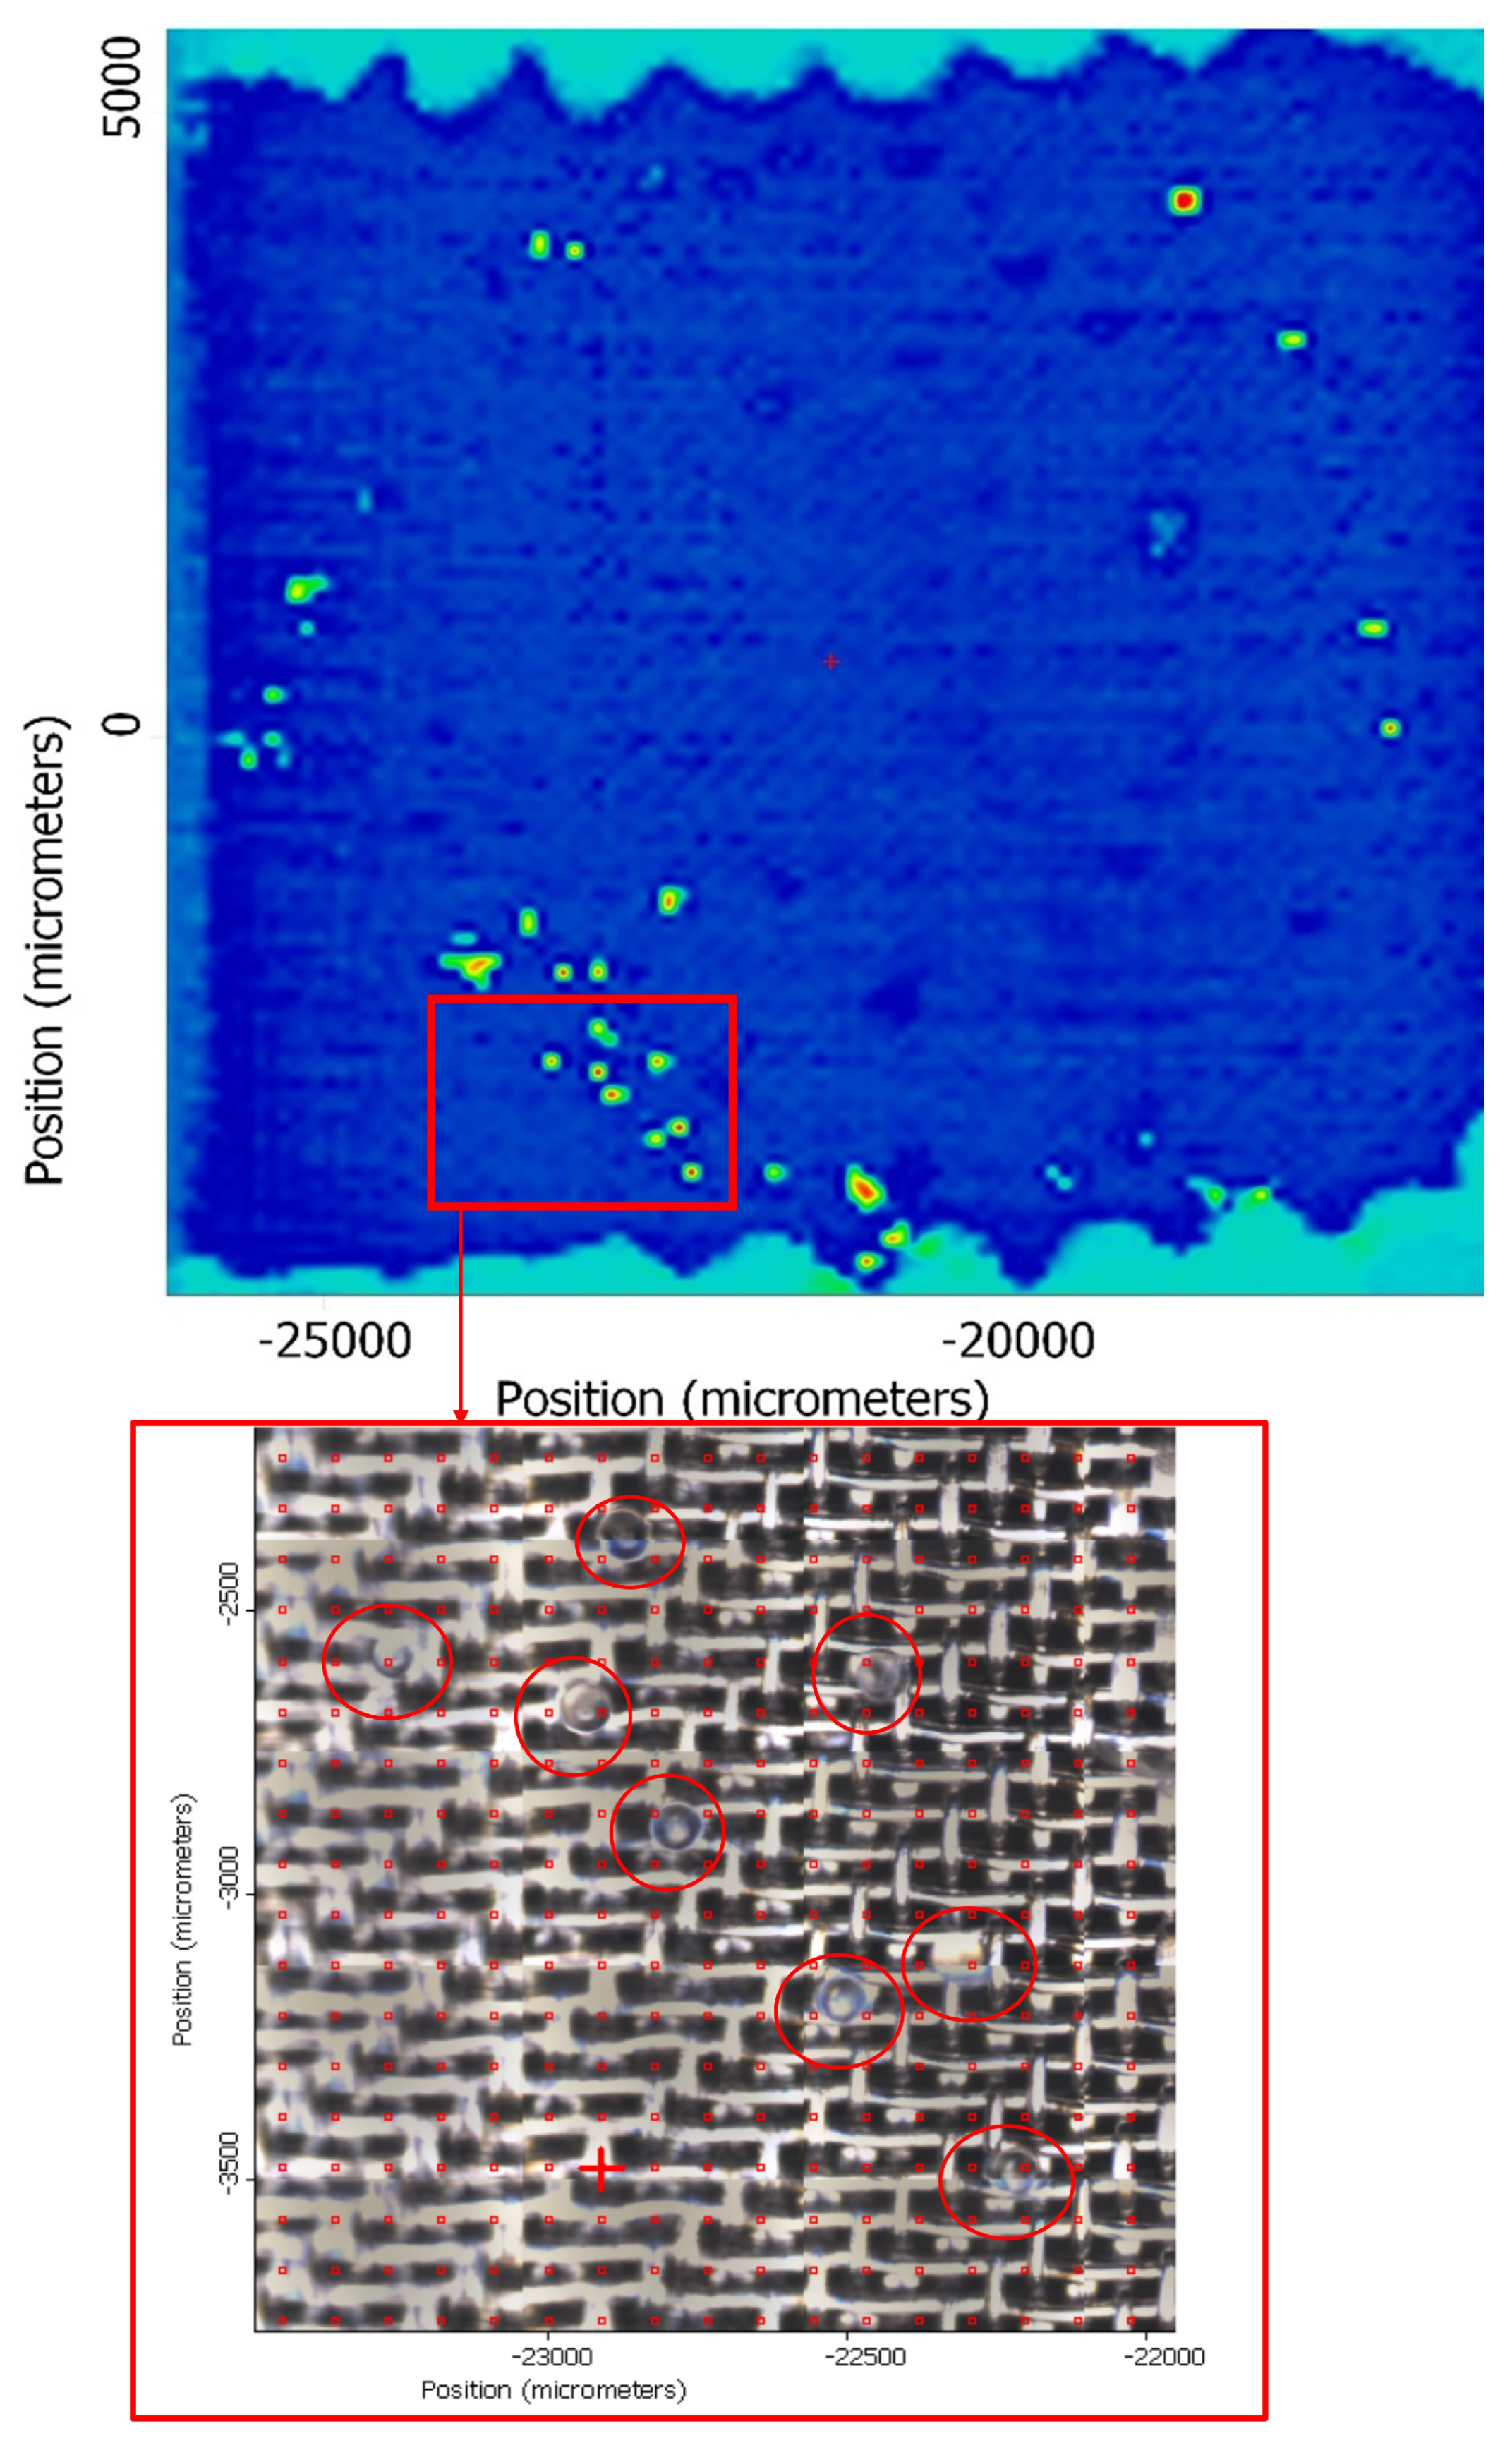
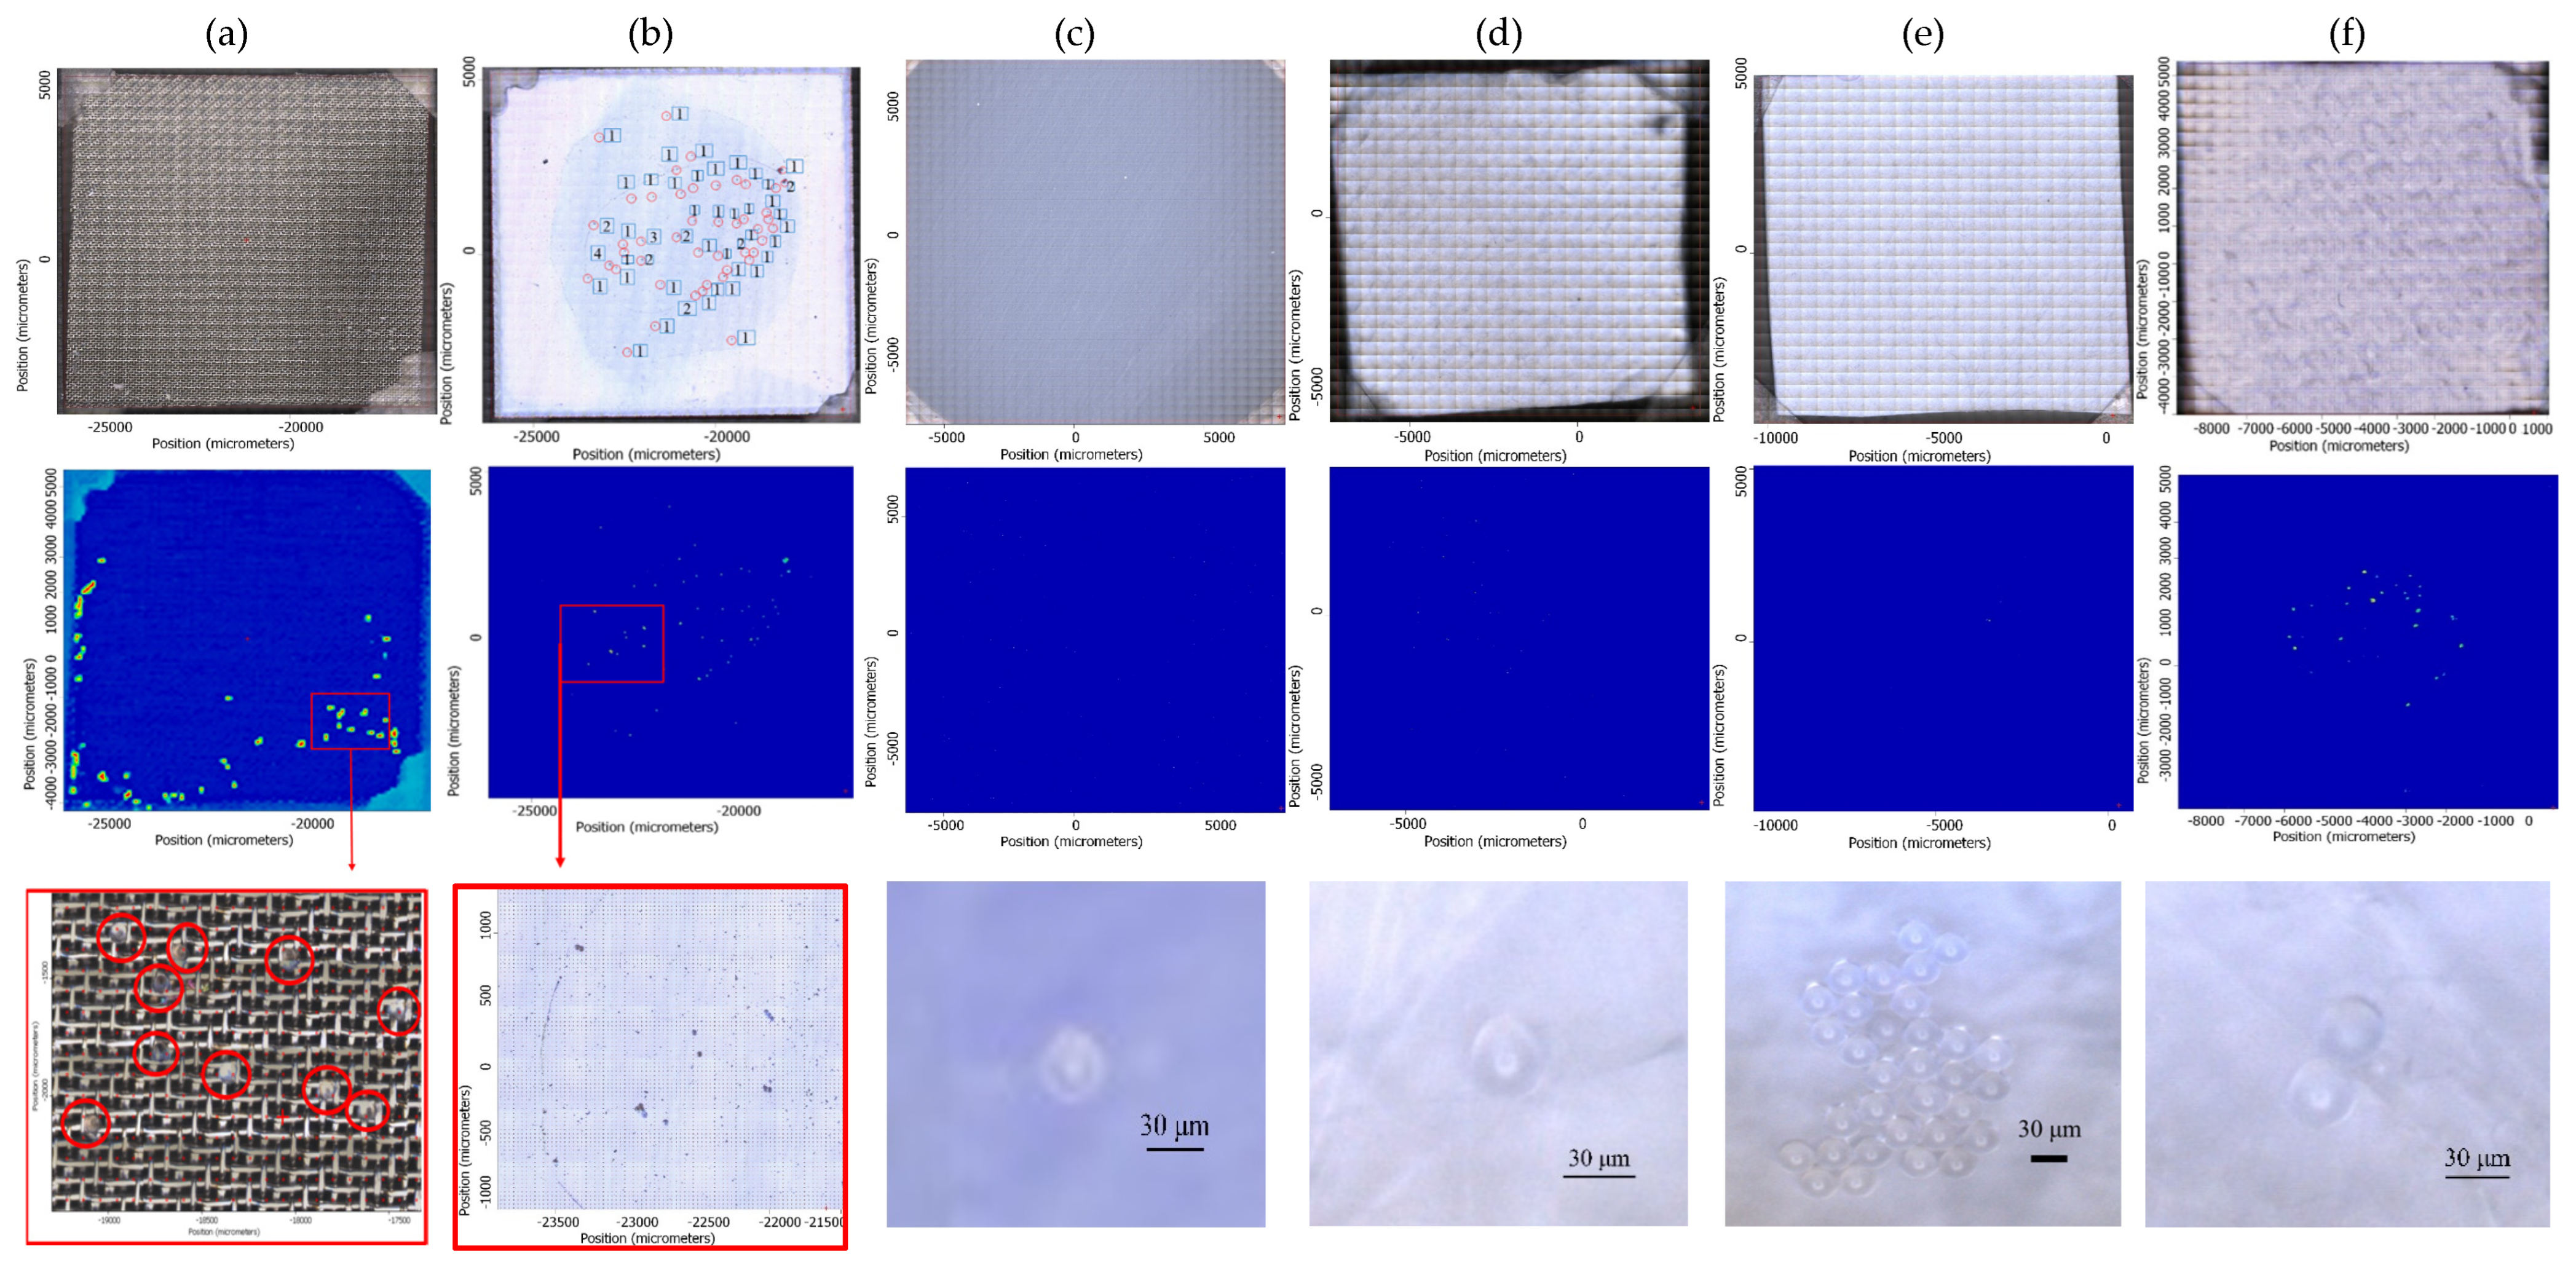
22]. Six filter types were evaluated using PS standards under direct titration (DT) conditions (
Figure 4). Silicon and stainless-steel filters provided sharp visual contrast and high spectral similarity (>70% to PS reference,
Figure S4), supporting accurate manual and software-assisted counting.
Alumina oxide provided moderate spectral performance (74%) but its background color hindered visual identification. MCE, PVDF, and glass fiber filters exhibited rough surfaces, spectral interference, and, in the case of PVDF, promoted particle re-aggregation, which compromised reliable recovery calculation. Therefore, 30 μm PS particles could not be clearly identified on these filters, and the corresponding recovery rates were not reported in
Table 1. These findings align with previous reports noting that metal-coated or silicon-based filters are optimal for reflection-mode μ-FTIR, while some polymeric filters may introduce artifacts [
15,
23].
Our results provide a systematic assessment of filter-material suitability under reflection-mode μ-FTIR conditions, linking recovery evaluation with spectral readability and microscopic particle visibility—an aspect that has rarely been addressed comprehensively in prior studies.
3.2. Results of Filtration Method
Because filtration is a routine step in waterborne microplastics (MPs) analysis, this process was simulated using polystyrene standard suspensions (PSS) to evaluate potential particle loss during filtration. Based on the results in
Section 3.1.4, silicon and stainless-steel filters were identified as the most suitable substrates for PS particle recognition by μ-FTIR. Given the pore size of the stainless-steel filter (35 μm), 90 μm PSS were first used to assess post-filtration recovery on both silicon and stainless-steel filters (
Table 1, Runs 8–9). IR spectral matching result of stainless-steel filter (Run 9) is shown in
Figure 5.
The results showed recovery rates of 87% for the silicon filter and 90% for the stainless-steel filter. These findings underscore the importance of appropriately matching filter material and pore size with particle size, as well as controlling filtration conditions, to achieve reliable μ-FTIR-based microplastic quantification.
To assess the effect of microplastic particle size on recovery, an additional experiment was conducted using 30 μm polystyrene standard suspensions (PSS; 5148 ± 1 particles/mL) with silicon filters under otherwise identical experimental conditions (
Table 1, Run 10). Microscopic images and manual counting results of Run 10 are shown in
Figure 6.
This experiment was repeated ten times to evaluate method reproducibility and the robustness of the optimized filtration conditions. The resulting recovery was 88 ± 7.25% (n = 10; individual values: 80%, 80%, 92%, 96%, 82%, 100%, 92%, 82%, 94%, and 90%), indicating good reproducibility despite the smaller particle size. The observed variability likely reflects increased sensitivity of fine particles to electrostatic interactions and handling losses during filtration. Overall, these results demonstrate that the proposed filtration protocol remains feasible and reproducible for smaller MPs when appropriate filter material and controlled filtration conditions are applied.
3.3. Application to Environmental Samples
To evaluate the applicability of the optimized μ-FTIR workflow to real environmental matrices, a river water sample was spiked with 30 μm polystyrene (PS) microspheres and subjected to oxidative digestion using 30% H
2O
2, following established protocols [
24,
25]. The processed samples were analyzed using the optimized filtration and software-calibrated identification procedure.
When default software parameters were applied, the analysis severely overestimated particle abundance, identifying more than 3000 objects in the river water sample (
Figure S5a).
After calibration using the spiked PS standards, accurate discrimination of PS microspheres was achieved, yielding a mean recovery of 91 ± 14.5% across triplicate experiments (n = 3; individual recoveries: 90%, 78%, and 107%) (
Figure S5b).
Following software calibration, microplastic analysis of the river water sample identified twenty-six PET particles, one PE particle, and two PP particles, with no additional polymer types detected (
Figure S5c–e). These results demonstrate that, although default software settings substantially overestimate particle numbers, calibration with spiked standards effectively corrects misclassification and enables reliable identification and quantification of MPs in complex environmental samples.
Overall, the recovery of spiked PS microspheres and the identification of environmental MPs provide an initial assessment of the proposed workflow under river water matrix conditions. These results also highlight the value of standard-addition recovery experiments for evaluating particle loss and supporting quantitative reliability in μ-FTIR-based MP analysis.
3.4. Scope Boundary
Although environmental microplastics span a wide range of polymer types, shapes, and weathering states, commercially available reference particles suitable for controlled recovery experiments are currently limited, particularly when size-defined, shape-consistent, and well-dispersed particles are required. Under these constraints, spherical PS microspheres were selected as standardized reference particles because they are among the most accessible and stable model materials for quantitative method evaluation. Their use was not intended to represent the full diversity of environmental microplastics, but rather to minimize material-related variability and enable precise isolation of procedural effects on recovery and identification performance. In addition, the applicability of the developed framework was further examined through standard addition experiments in river water samples, providing an initial evaluation under environmentally relevant matrix conditions.
4. Conclusions
This study demonstrates that μ-FTIR-based MPs quantification is highly sensitive to software settings, filter material, rinsing suspensions, and filtration methods. Key findings are as follows:
Silicon and stainless-steel filters were selected for subsequent recovery evaluation because they provided sufficient spectral readability and microscopic particle visibility under the tested reflection-mode μ-FTIR conditions.
Fifty-percent ethanol rinsing reduces aggregation and enhances reproducibility.
Controlled pumping pressure (200 mmHg) achieved much higher recovery (88 ± 7.25%).
The recovery rate of the PS standard in the water samples reached 91 ± 14.5%.
Calibration with standard PS particles improves accuracy in both manual and software-assisted counts.
Our results provide practical insights into factors affecting the transparency and reproducibility of filter-based reflection-mode μ-FTIR analysis under the tested conditions. Future studies should validate this approach across diverse polymers, particle shapes, and environmental matrices to enhance robustness and applicability.