1. Introduction
With rapid urbanization and the resulting increase in mobility demand, subways have become a core mode of mass public transportation in major cities worldwide. Urban railway systems play a crucial role in alleviating traffic congestion and ensuring the reliability of public transit services, owing to their high capacity, punctuality, and energy efficiency. To operate such large-scale railway networks efficiently, it is essential to accurately understand and predict the spatiotemporal variations in passenger demand. In particular, origin–destination (OD) matrix forecasting is recognized as a key problem for transportation operations, demand management, resource allocation, and infrastructure planning, because it enables the simultaneous capture of directional demand between origin and destination stations [
1,
2,
3]. Recent surveys summarizing OD flow research also identify OD prediction, construction, estimation, and forecasting as central problem domains, emphasizing that station-level demand alone is insufficient in public transportation systems such as urban railways, where network-level OD information is critical.
The Seoul metropolitan subway system is not merely a single urban rail network confined to Seoul but rather a large-scale regional railway network connecting Seoul, Incheon, and Gyeonggi Province, formed as a complex system involving multiple operating agencies [
4,
5]. According to Seoul’s TOPIS, Line 1 extends to Suwon, Incheon, and Cheonan, whereas Line 9 operates both express trains and local trains [
4]. Recent statistics also report that the total ridership of Seoul Subway Lines 1–8 reached 2.417 billion passengers in 2024, with a daily average of approximately 6.61 million [
6]. In such an environment characterized by multiple lines, operators, and large-scale demand, station-level boarding and alighting counts alone are insufficient to fully capture directional passenger flows and congestion propagation across the network. Therefore, there is a strong need for full-matrix OD forecasting that simultaneously considers both the origin and destination stations.
Recent OD forecasting studies have evolved from recurrent neural networks and graph-based models to Transformer- and MLP-based architectures [
2,
7,
8,
9,
10,
11,
12,
13,
14,
15,
16,
17,
18,
19]. In parallel, graph attention mechanisms such as GAT and GATv2 have provided adaptive alternatives to fixed graph convolution for spatial relationship modeling [
20,
21]. These approaches have improved the modeling of temporal dependencies, spatial relationships, and OD-pair interactions. However, several limitations remain from the perspective of offline full-matrix metro OD forecasting. First, station-level or selected OD-pair forecasting does not directly reconstruct the complete network-wide OD matrix. Second, online incomplete OD prediction and imputation-oriented models assume different information availability from the offline setting, where complete historical OD matrices are available at prediction time. Third, many recent models rely on complex task-specific structures, such as heterogeneous graphs, hypergraphs, or multi-view designs, which can increase model complexity and reduce the simplicity of an end-to-end forecasting framework.
To address these limitations, this study proposes Metro-GATF. We focus on the offline multi-step OD matrix forecasting problem, where complete historical OD matrices are available at prediction time. The proposed model jointly incorporates static spatial structures learned from actual railway adjacency relationships and dynamic interactions extracted from time-dependent sparse OD graphs. Specifically, the spatial module employs a GATv2-based encoder to adaptively learn the relative influence of neighboring stations from the actual railway topology. The temporal module adopts a non-autoregressive transformer decoder that utilizes node representations derived from historical OD matrix sequences as memory, enabling parallel generation of future multi-step representations. Finally, the prediction module combines origin–destination factorization with sparsity-aware gating to directly reconstruct future OD matrices. Thus, the Metro-GATF provides an end-to-end unified framework tailored for full-matrix OD forecasting in large-scale urban railway networks.
In this study, we evaluated the proposed model on a large-scale metropolitan subway network consisting of 637 stations in the Seoul metropolitan area, using minute-level AFC-based OD data from May 2022. The experiments were conducted under a full-matrix forecasting setting, in which the entire network-level OD matrix was directly predicted. The evaluation examined whether Metro-GATF can achieve competitive predictive performance on large-scale urban railway networks without substantial reliance on complex heuristic feature engineering or multi-stage preprocessing.
The main contributions of this paper are as follows:
- -
We reformulate offline full-matrix metro OD forecasting as a parallel generation problem and propose a non-autoregressive framework that predicts future OD matrices without sequential autoregressive decoding.
- -
We propose Metro-GATF, an end-to-end spatiotemporal architecture that jointly models static railway topology and dynamic sparse OD interactions, while reconstructing future OD matrices through origin–destination factorization and sparsity-aware gating.
- -
We validate the proposed framework on minute-level AFC-based OD data from a 637-station metropolitan subway network and show through extensive experiments and ablation studies that parallel temporal decoding and explicit sparsity modeling are key to competitive full-matrix OD forecasting performance.
The remainder of this paper is organized as follows.
Section 2 reviews related studies on OD forecasting, graph-based metro demand prediction, and Transformer-based time-series forecasting.
Section 3 describes the proposed Metro-GATF framework.
Section 4 presents the experimental setting and comparative results.
Section 5 reports the ablation and sensitivity analyses.
Section 6 discusses the main findings, limitations, and practical implications.
Section 7 concludes the paper.
2. Related Works
2.1. Station Level and Short-Term OD Flow Forecasting
Early research on urban railway demand forecasting primarily focused on station-level inflow/outflow predictions or short-term OD flow forecasting. Han et al. modeled an urban railway network as a graph and employed a spatiotemporal GCN to predict short-term passenger flows at the station level, thereby demonstrating the feasibility of learning spatial correlations across stations [
7]. Cui et al. identified data lag, high dimensionality, and data malformation as key challenges in metro OD prediction and proposed an ST-LSTM framework that integrates multi-source data for short-term OD flow forecasting [
19]. CNN-based approaches have also been explored for short-term metro OD demand prediction by extracting local spatial–temporal patterns from OD-related demand representations [
22]. While these studies provide operationally meaningful short-term insights, they differ fundamentally from the problem of directly reconstructing a full network-wide OD matrix.
2.2. Full OD Matrix Forecasting and Graph-Based Modeling
Research on directly predicting full OD matrices has gradually expanded in public transportation and general OD forecasting literature. Toqué et al. conducted an early study using an LSTM-based recurrent neural network to predict dynamic public transportation OD matrices [
2]. Wang et al. explicitly formulated the OD matrix prediction (ODMP) problem and proposed GEML, which integrates spatial and temporal components [
8]. Subsequently, Hu et al. addressed probabilistic OD matrix forecasting using a dual-stage graph convolutional recurrent neural network [
9], whereas Shi et al. proposed the MPGCN, which jointly leverages dynamic and static graphs [
10]. In the context of urban rail systems, representative studies include MRSTN by Noursalehi et al. [
3], MVPF by Zheng et al. [
11], and the large-scale urban rail GCN-GRU model by Wang et al. [
23]. These approaches combine graph-based structures with time-series models to enable real-time or short-term OD matrix prediction. Beyond metro OD forecasting, attention-based spatio-temporal graph models have also been explored for road traffic prediction. For example, ASTMGCNet integrates GCN and GRU with multi-scale feature extraction and dual attention mechanisms to capture complex spatial dependencies and nonlinear temporal associations in T-CPS-oriented traffic systems [
24]. These studies demonstrate the effectiveness of graph-based spatial encoders for transportation demand forecasting, but many of them still rely on short-term prediction settings or recurrent temporal modeling.
2.3. Composite Structure-Based Metro OD Modeling: Hypergraph, Heterogeneous Graph, and Incomplete OD
Recent metro OD forecasting studies have introduced more sophisticated structures to address the high dimensionality, sparsity, transfer behavior, and complex spatial relationships inherent in metro OD prediction. Liu et al. proposed HIAM, a heterogeneous information aggregation framework designed for online metro systems in which complete historical OD matrices are not immediately available. This model jointly utilizes incomplete OD matrices, unfinished order vectors, and DO matrices to support online OD prediction under limited observability [
12]. Shen et al. proposed ST-DAMHGN, which employs multiple spatiotemporal dynamic attentive hypergraphs to capture high-order relationships among OD pairs [
13]. Tang et al. introduced DT-HGN by leveraging heterogeneous graph structures and separating direct and transfer trips into distinct graphs for public transport OD matrix prediction [
14].
In addition to heterogeneous and hypergraph-based modeling, related studies have explored spatial OD flow imputation using GCNs [
25] and completion- or augmentation-based short-term metro OD forecasting under limited observability [
26]. More recently, ODMixer highlighted the limitations of existing methods that either mix multiple OD pairs from a station-centric perspective or consider only partial OD pairs and proposed fine-grained metro OD modeling from an all-OD-pair perspective [
18]. These studies have significantly advanced the metro OD prediction literature by enriching OD representations through heterogeneous graphs, hypergraphs, incomplete-information modeling, imputation, completion, and all-pair interaction modeling. However, they also increase reliance on problem-specific structural designs, such as multi-view construction, heterogeneous graph separation, hypergraph generation, and incomplete-data completion.
2.4. Transformer-Based OD Forecasting and Positioning of This Work
Transformer-based models have significantly influenced time series forecasting from the perspective of modeling long-term dependencies. Informer introduced ProbSparse self-attention and a generative-style decoder to efficiently handle long sequence time-series forecasting [
15], whereas Autoformer improved the long-term forecasting performance through a decomposition architecture and an auto-correlation mechanism [
16]. This line of research has also been extended to OD matrix prediction, where ODFormer proposed a Transformer-like OD matrix forecasting (ODMF) model incorporating OD attention and PeriodSparse self-attention [
17]. Graph attention mechanisms are also closely related to the spatial modeling component of this study. GAT introduced masked self-attention on graph-structured data, allowing neighboring nodes to be weighted adaptively rather than aggregated only through fixed normalized adjacency [
20]. GATv2 further addressed the static-attention limitation of the original GAT by enabling query-conditioned dynamic attention [
21]. Compared with conventional GCN-based neighborhood aggregation [
27], graph attention-based encoders can provide more flexible modeling of railway-network dependencies by learning the relative importance of neighboring stations. Despite these advances, metro OD forecasting still requires a simple and scalable framework that simultaneously considers static spatial priors derived from railway topology, sparse time-varying OD interactions, and an offline full-matrix forecasting setting where complete historical OD sequences are available. To address this gap, this study proposes Metro-GATF, which integrates static spatial encoding based on a railway adjacency matrix, dynamic interaction modeling using time-dependent sparse OD graphs, a non-autoregressive transformer decoder, and sparsity-aware OD reconstruction. By adopting GATv2 as the spatial encoder, Metro-GATF aims to learn adaptive and query-conditioned neighborhood importance while maintaining a relatively simple structure compared with highly task-specific heterogeneous, hypergraph, or incomplete-information modeling approaches.
Table 1 summarizes the key characteristics of representative OD forecasting studies reviewed above, categorized by output granularity, task setting, spatial encoder type, and structural complexity.
3. Method
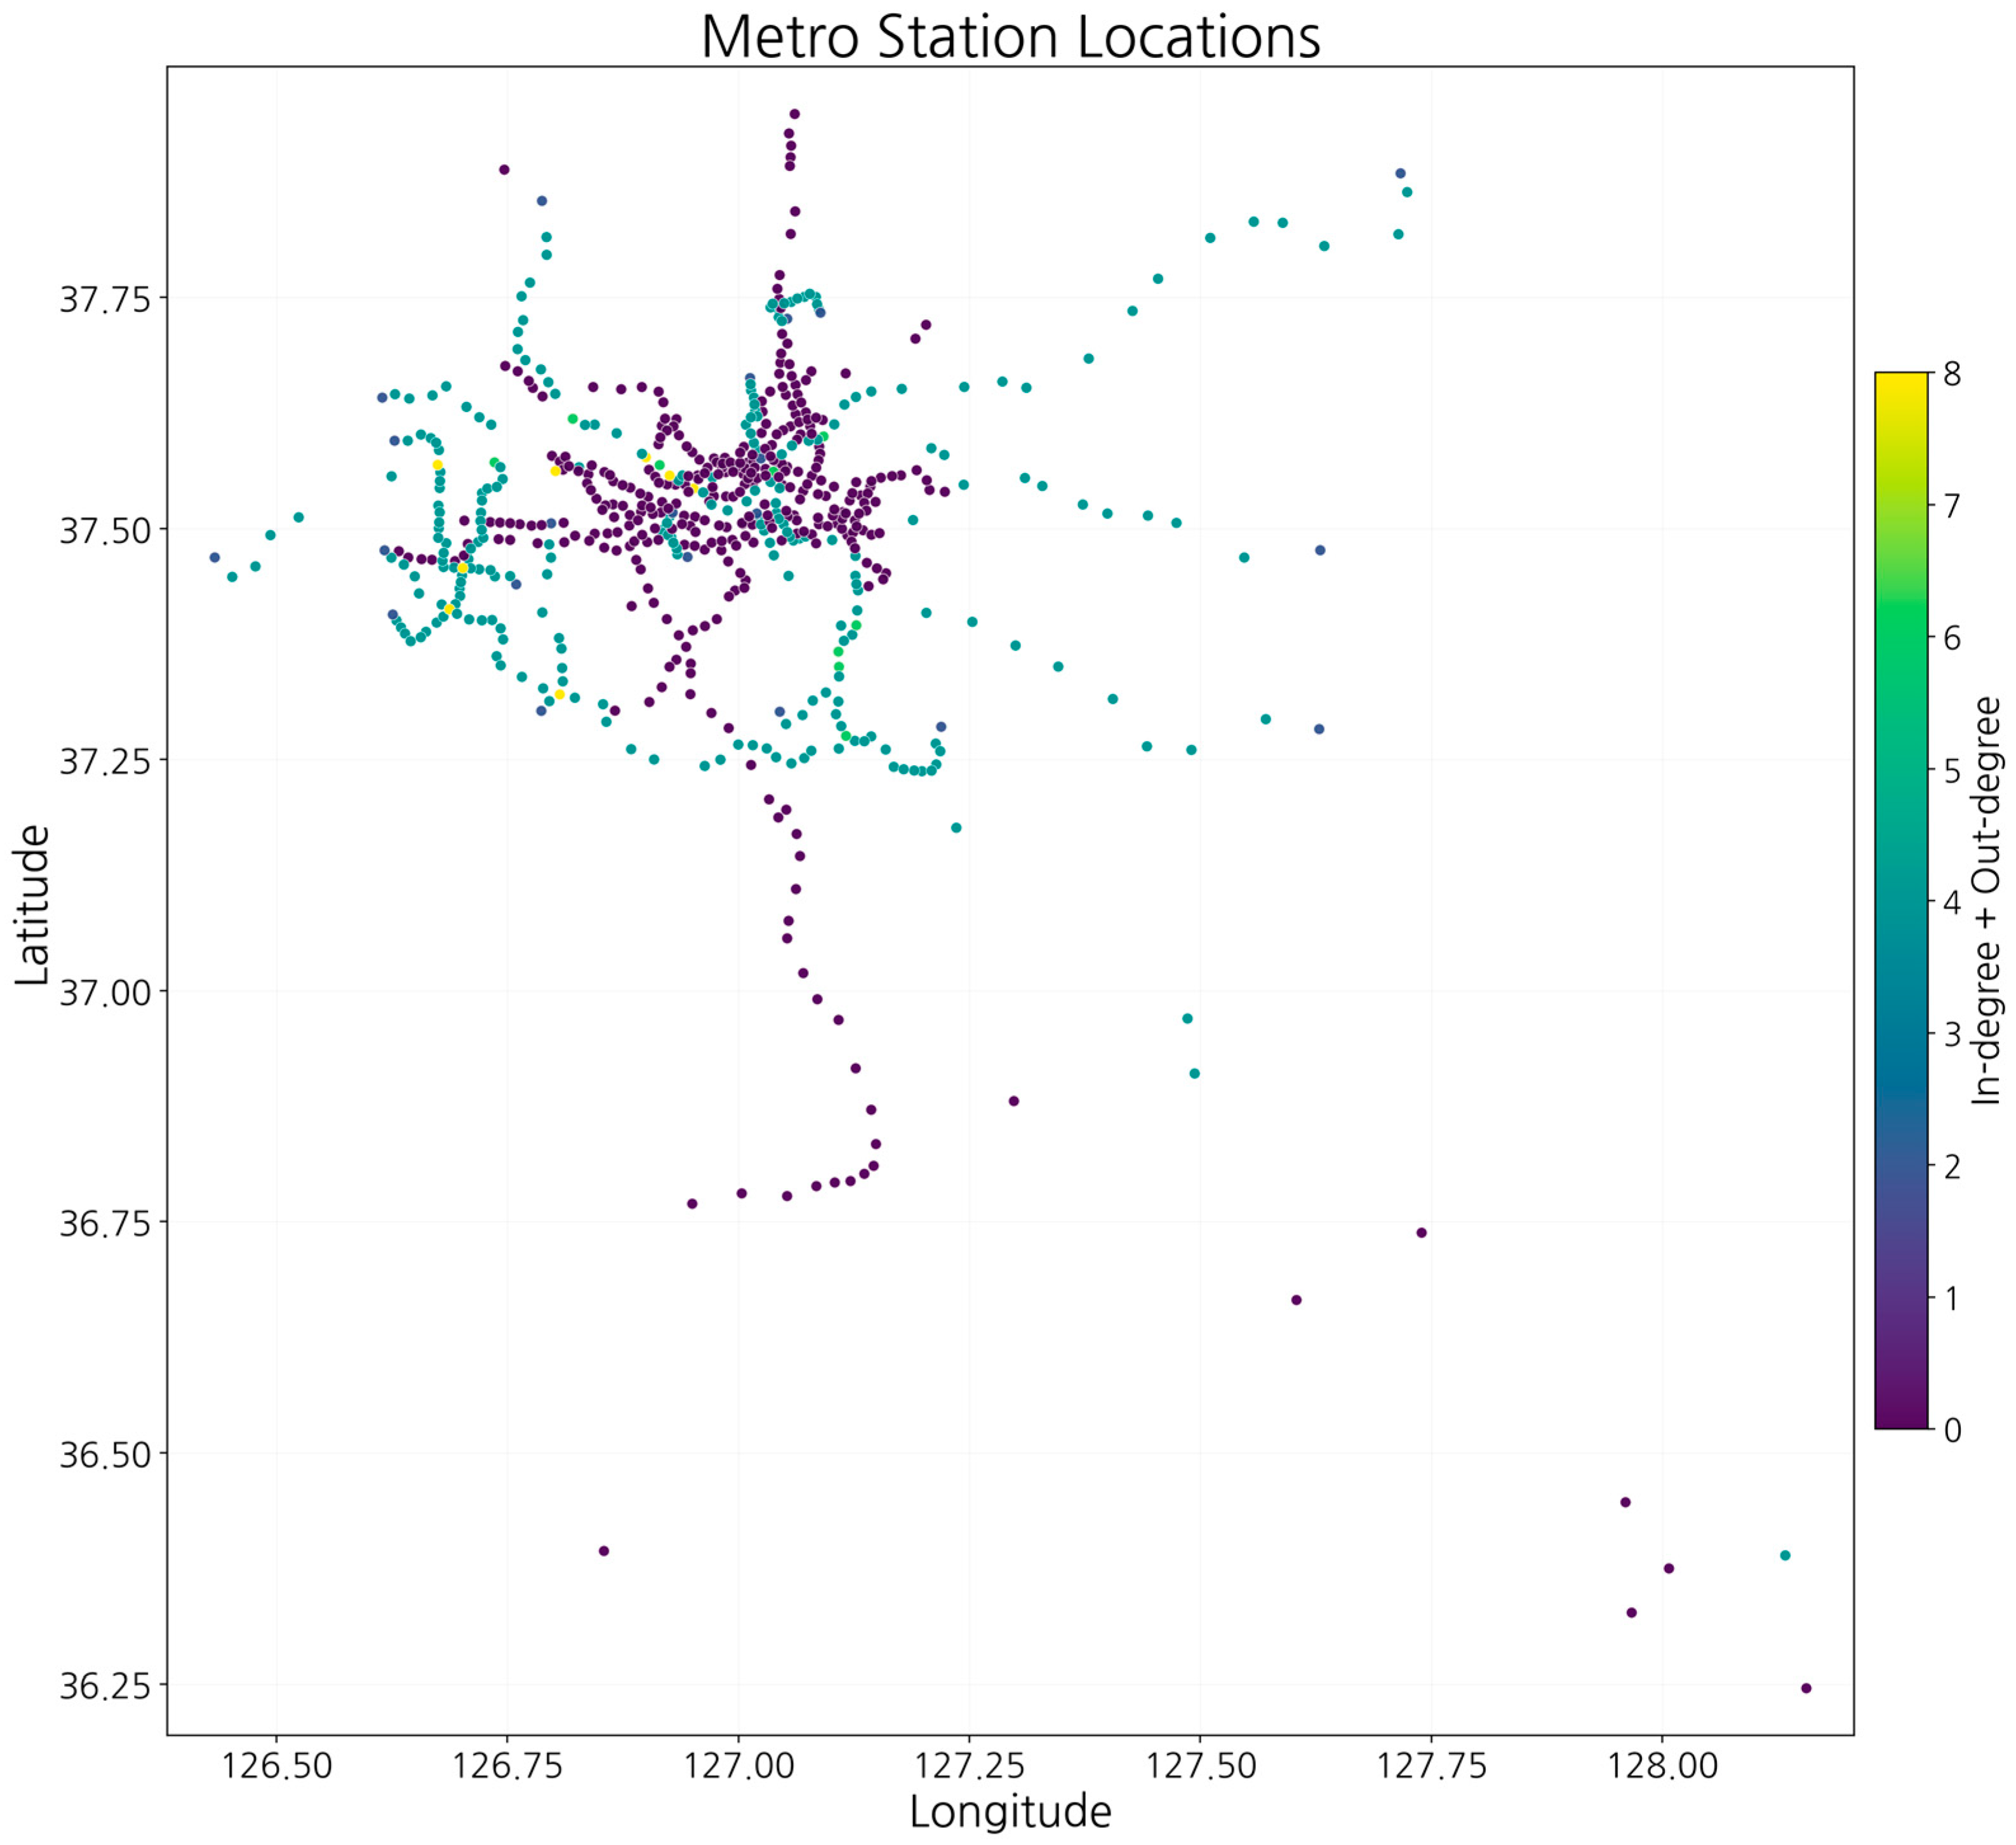
Figure 1 visualizes the geographic distribution of the stations included in the analyzed Seoul metropolitan subway network based on latitude and longitude coordinates. Each point represents one station, and the color indicates the station connectivity degree, computed as the sum of in-degree and out-degree in the railway adjacency graph. To reduce visual distortion, a small number of stations with abnormal coordinate values were excluded only for visualization, while the OD forecasting experiments were conducted using the full 637-station network. Stations with high connectivity degrees are labeled to highlight major network hubs. This visualization illustrates that the OD forecasting network used in this study covers a broad metropolitan spatial structure rather than being limited to a specific corridor or localized area.
3.1. Dataset
In this study, minute-level subway OD demand data from 1 May to 31 May 2022 were used, with each day represented as an OD matrix sequence
. Each sequence consists of 1440 min-level OD matrices for 637 stations, where each element
denotes the number of passengers traveling from origin station
to destination station
at minute
. The stored OD counts are integer-valued, and each day is treated as a continuous minute-level OD matrix sequence. To avoid information leakage from future time periods, the dataset was later divided using a chronological three-way split into training, validation, and independent test sets, as described in
Section 4.
Input samples were generated using a sliding window approach. The default configuration consisted of an input length of 60 min, a prediction horizon of 30 min, and a stride of 10 min. Windows were generated only within the operational time range of 5:30 AM to midnight, reflecting actual service hours [
32]. Recent transportation statistics from Seoul also indicate a pronounced demand immediately after the start of operations and during evening peak hours, supporting the operational validity of minute-level short-term forecasting settings [
6]. Under this configuration, 102 samples were generated per day. To mitigate skewness in the distribution of raw OD counts, a
transformation was applied to both inputs and targets. Temporal information is encoded using sine–cosine positional encoding over a daily period of 1440 min [
22]. Let m denote the minute index within a day, that is,
Day-of-week information is also incorporated as an additional input feature. For graph input construction, each OD matrix at a given time step is converted into a dynamic sparse graph by extracting only non-zero entries. To enhance the stability of message passing, reverse edges are added for each edge, and edge weights are defined as
of the corresponding OD flow at that time step. Additionally, a fixed
static adjacency matrix representing station connectivity is used to construct a static spatial graph. The station latitude and longitude are aligned with node indices, and missing coordinates are imputed using the average coordinates of neighboring stations [
28,
29,
31]. Finally, min–max normalization is applied, and the resulting values are used as the static node positional features. This study assumes an offline multi-step forecasting setting, where complete historical OD matrix sequences are available as inputs at prediction time.
3.2. Overall Architecture
The proposed model is designed as a hybrid spatiotemporal encoder–decoder architecture that jointly captures the static railway network and time-evolving OD flows. The inputs consist of a sequence of OD matrices over past time steps, static station connectivity graph , temporal encodings for both past and future steps, and day-of-week information. Here, each represents the OD demand matrix at time step , and denotes the number of stations. This study assumes an offline forecasting setting, in which complete historical OD matrices are available at prediction time.
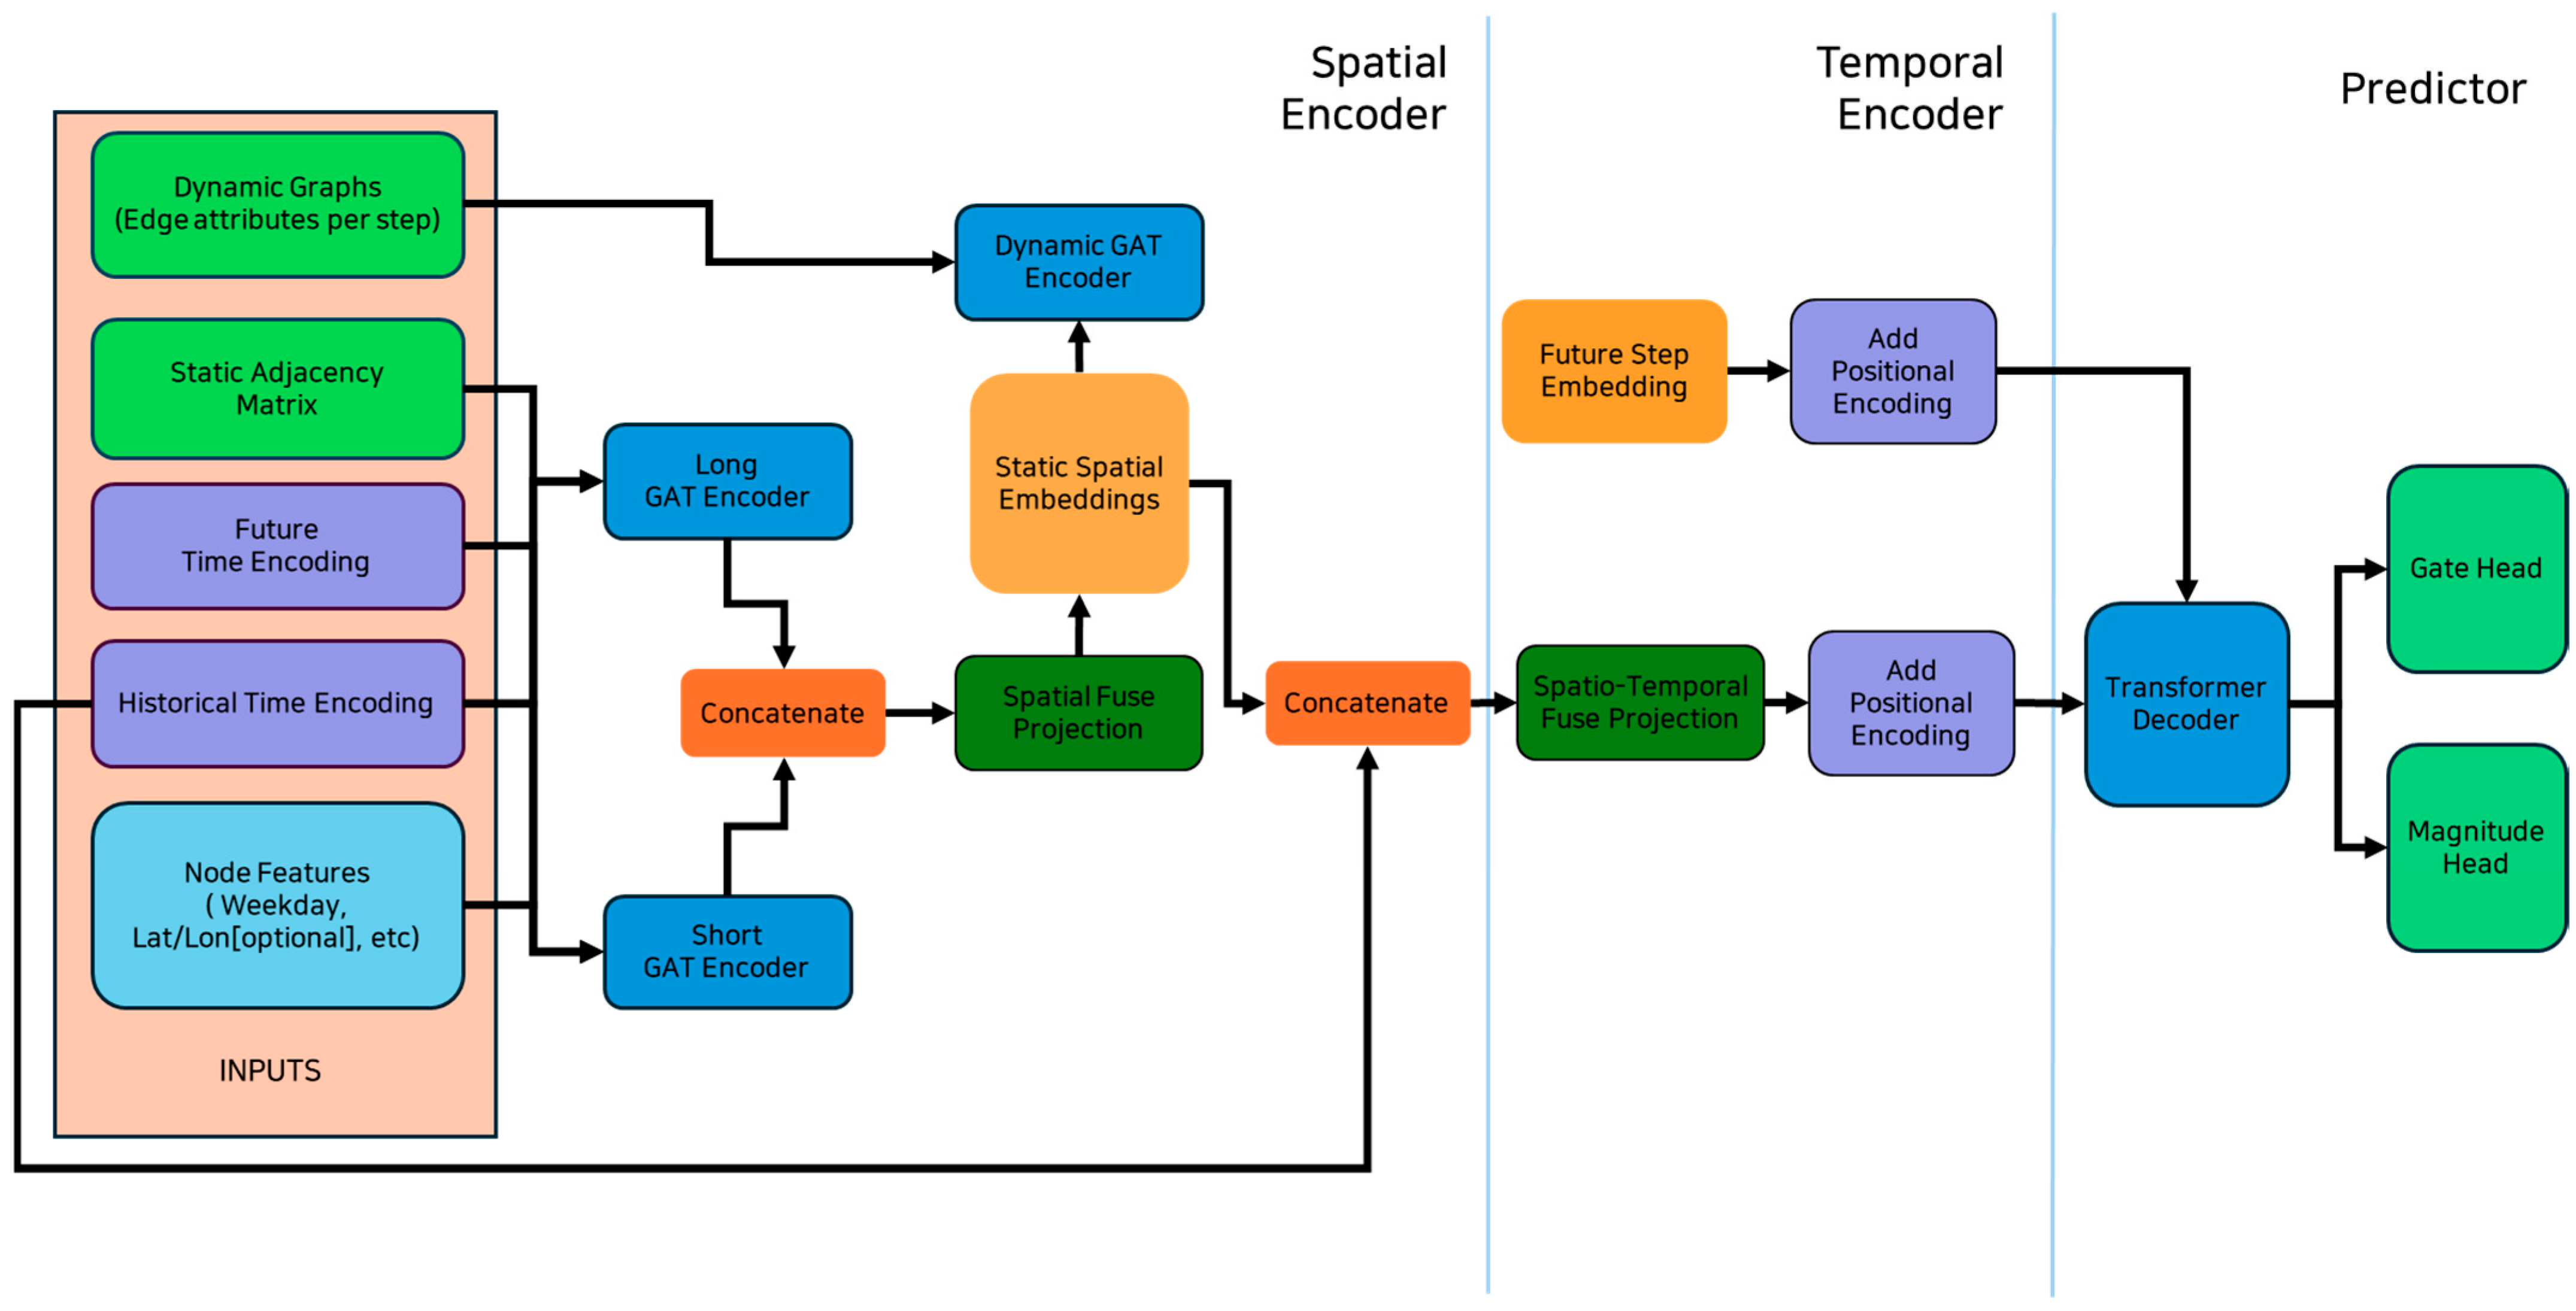
Figure 2 provides an overview of the Metro-GATF architecture. The model takes dynamic sparse OD graphs, a static railway adjacency matrix, temporal encodings, and station-level node features as inputs. The spatial module combines short- and long-range GATv2 encoders for static railway topology with a dynamic GAT encoder for time-varying OD interactions. The fused spatiotemporal representations are used as historical memory, and a non-autoregressive Transformer decoder generates future station-level representations in parallel using future-step embeddings and positional encodings. The final predictor reconstructs future full OD matrices through origin–destination factorization, while the magnitude head estimates flow intensity and the gate head controls sparse zero/non-zero OD activity.
The model first generates static node-level representations for stations and then encodes static spatial structures and dynamic OD interactions based on these representations. The temporal module subsequently uses the sequence of node representations obtained from the past T time steps as memory and estimates the node representations for the next O future steps in parallel. Finally, in each step, the full OD matrix is reconstructed through pairwise interactions between origin-role embeddings and destination-role embeddings. To account for the high sparsity of OD matrices, the model jointly learns a magnitude head for predicting the flow intensity and a gate head to determine whether a given OD pair is non-zero.
From a model-complexity perspective, Metro-GATF avoids assigning independent trainable predictors to all OD pairs. The high-dimensional OD output is produced from shared station-level origin and destination embeddings, and the sparsity gate is applied as an OD-activity decision layer rather than as a separate pair-specific model. Consequently, the main learnable components are concentrated in the station-level spatial encoders, temporal decoder, and shared projection heads, while the final full-matrix reconstruction still preserves directional origin–destination interactions. This design is intended to keep full-matrix prediction tractable for a 637-station network without requiring an independent parameter set for every possible OD pair.
3.3. Node Feature Construction
First, a learnable node embedding
is assigned to each station to model its intrinsic latent characteristics. Second, to incorporate the static positional information of the stations, a normalized latitude–longitude vector
is used. These coordinates were aligned according to the station index order, and missing values were imputed using the average coordinates of the neighboring stations, followed by min–max normalization. Third, the day-of-week information is represented as an embedding
, obtained from an integer weekday index provided at the sample level. This embedding is shared across all the nodes within the same sample. Accordingly, the initial static feature of node
in batch
is defined as
Here, denotes the learnable embedding of station , denotes the normalized latitude–longitude feature of station , and denotes the weekday embedding of sample b. The weekday embedding is shared across all stations within the same sample. Therefore, . When geographic positional information is not used, is omitted, and . It is important to note that the model does not directly use raw OD rows and column vectors as node features. Instead, static node representations were constructed first, and OD flows were later incorporated through the edge structure and edge weights of the dynamic graphs. In other words, the node attributes and time-dependent mobility interactions were modeled in a decoupled manner.
3.4. Spatial Module
The spatial module consists of two stages: a static spatial encoder and a dynamic spatial encoder. First, the static spatial encoder operates on a fixed graph
constructed from the railway adjacency matrix, where V denotes the set of stations (nodes) and
denotes the set of edges representing the physical connectivity between stations. The edges of this graph represent the connectivity between stations and are shared across the entire training period. The static spatial encoder is composed of two parallel Graph Attention Network (GAT) branches: a relatively shallow short branch and a deeper long branch. GAT applies masked self-attention to graph-structured data, enabling the adaptive weighting of neighboring nodes [
20]. Furthermore, GATv2 addresses the limitation of static attention in the original GAT by allowing dynamic attention that varies depending on the query node, thereby providing a more expressive model of neighborhood importance [
21]. Both branches employ GATv2-based spatial encoders implemented with sequential multi-head and single-head GATv2Conv layers. The short branch is designed to capture local connectivity within a small hop range, whereas the long branch captures a broader spatial context through deeper message passing. The outputs from the two branches,
and
, are concatenated and projected linearly to produce a unified static spatial representation
.
Next, the dynamic spatial encoder utilizes a sequence of dynamic OD graphs , constructed for each time step within the historical input window. Each is a sparse graph formed by extracting only the non-zero entries from the OD matrix at time t, with edge weights defined as the -transformed OD flows. In the implementation, reverse edges are added to each edge to enhance the stability of the message passing and capture bidirectional relationships. Importantly, the node inputs to the dynamic graph are not raw traffic features but static spatial representations obtained earlier. In other words, the same station representations are replicated across all past time steps and used as node signals, whereas time-varying information is encoded solely through the edge connectivity structure and edge attributes. This design reflects the assumption that intrinsic station properties remain relatively stable, whereas inter-station interactions vary over time according to OD flows.
The dynamic spatial encoder is implemented as a Dynamic GAT Encoder that incorporates edge attributes and ultimately produces dynamic representations
for each time step and node.
3.5. Temporal Module
The temporal module follows a transformer decoder architecture based on self-attention and cross-attention mechanisms [
33]. Although the original transformer adopts an autoregressive decoding scheme [
33], this study employs a non-autoregressive decoding strategy to generate multiple future steps in parallel. Specifically, the temporal module transforms spatially encoded historical sequences into memory representations that can be referenced by the Transformer decoder and uses future-step queries to simultaneously generate node states for the next O time steps. In practice, no causal masking is applied to the decoder. The proposed model operates in a non-autoregressive setting without causal masking.
Temporal information was represented using sine–cosine encoding with a daily periodicity of 1440 min [
33]. For a given minute index
, the encoding is defined as
which is then projected through a linear transformation into a
-dimensional temporal embedding
. This temporal embedding is shared across all nodes at each time step. The fused representation at time step
for node
is then computed by combining the dynamic spatial representation, static spatial representation, and temporal embedding as follows:
The resulting is used as the historical time-series memory for each node. Each batch–node pair is treated as an independent sequence of time-series tokens. Sinusoidal positional encoding and a learnable positional bias were then added to inject the temporal order information. This memory sequence was subsequently used as the input for the cross-attention mechanism in the transformer decoder.
For future predictions, the query is initialized using a learnable future-step embedding for each . The same positional encoding is applied, and a linearly projected sine–cosine temporal encoding of the corresponding future time step is added. Consequently, the decoder query simultaneously captures both the relative position in the future horizon “which future step” and the actual temporal position in the time series “what time of day.” Importantly, the future query is initialized solely from future-step embedding and known temporal encodings, and the ground-truth future OD values are not used as decoder inputs. All future steps are predicted in parallel in a non-autoregressive setting. As a result, the model generates future node representations in parallel through self-attention across future steps and cross-attention over historical memory, without referencing future ground-truth values.
3.6. Predictor
The predictor reconstructs the full OD matrix from the node representations at each future time step. To this end, instead of using a single node representation directly, two separate linear projections are applied to distinguish the roles of the origin and destination.
At time step
, the flow magnitude for the origin–destination pair
is computed using the inner product of the two embeddings.
A softplus function is applied to this value to obtain the final magnitude prediction.
Unlike the independent regression of each OD pair, the OD matrix is reconstructed in a structured manner through latent interactions between the origin and destination-role embeddings of each station.
Simultaneously, to handle the sparsity of the OD matrix explicitly, the model introduces a separate gate head. The gate head also applies separate linear projections for the origin and destination and computes the logit through an inner product followed by a bias term.
The bias term
is initialized to
to reflect a sparse prior, assuming that most OD pairs are likely to be zero during the early stage of training. After applying a sigmoid function, the probability that a given OD pair is non-zero,
, is obtained. During inference, the magnitude prediction is retained only if
; otherwise, it is forced to zero. The gate threshold
is an inference-time operating point that converts the estimated non-zero probability into a binary OD activity decision, rather than a trainable model parameter. Because full OD matrices are highly sparse, lowering
increases the number of predicted non-zero OD pairs, whereas raising
yields a more conservative prediction by suppressing weakly activated OD pairs. This thresholding process is closely related to the operating-point selection problem in binary classification, where the decision threshold controls the trade-off between positive detection and false alarms [
34]. In imbalanced settings, such threshold-dependent behavior should be examined carefully because aggregate error metrics and detection-oriented metrics may favor different operating points [
35]. Therefore, in this study,
= 0.9 was adopted as the main setting based on a post-training sensitivity analysis over
, as reported in
Section 5. Accordingly, the final prediction is defined as follows:
During training, the targets were used on a
scale. The gate label is defined as
, and the gate head is optimized using a weighted binary cross-entropy (BCE) loss that accounts for the positive/negative imbalance within each batch. In contrast, the magnitude head computes the smooth L1 loss only over non-zero target entries. The final training objective is defined as follows:
Here, is used in the current implementation. This loss design mitigates the issue where the regression loss tends to converge to trivial zero predictions in highly sparse OD matrices while improving the accuracy of magnitude prediction for OD pairs with actual flows.
During the evaluation, the final prediction is reconstructed only for entries that pass the gate threshold, and inverse transformation is performed by clipping the predicted log values to be non-negative before applying the exponential function. In addition, a small is used in the sMAPE calculation to alleviate numerical instability near zero.
4. Experiment
The experiment was designed as a minute-level OD matrix forecasting problem to simulate a short-term demand prediction scenario applicable to real-world urban railway operations. The time-series resolution is maintained at one minute in order to preserve rapid demand fluctuations during peak hours and short-term mobility variations caused by transfers. The input window length of 60 min reflects the recent one-hour demand context, whereas the prediction horizon of 30 min provides a practical short-term forecasting window for operational decision-making without introducing excessive uncertainty in minute-level full-matrix forecasting. In addition, a hop size of 10 min is used to ensure sufficient training samples while mitigating the excessive overlaps between adjacent windows. Windows are generated only within the operational time range of 5:30 AM to midnight, reflecting actual service hours. Official guidance also indicates that subway services generally operate from approximately 5:30 AM to midnight, and thus this setting aligns with both the temporal characteristics of the dataset and the real-world operations [
32].
The dataset was divided using a chronological three-way split to evaluate generalization on unseen future periods without random shuffling. Specifically, data from 1 May to 19 May 2022 were used for training, data from 20 May to 24 May 2022 were used for validation, and data from 25 May to 31 May 2022 were reserved as an independent test set. The validation set was used only for early stopping, hyperparameter selection, and best-checkpoint selection, while the test set was held out exclusively for final evaluation. Under the default sliding-window configuration, 102 samples were generated per day, resulting in 1938 training samples, 510 validation samples, and 714 test samples. All baseline models were evaluated under the same input length, prediction horizon, temporal resolution, and chronological split. The final performance was measured on the independent test set using MAE, RMSE, and sMAPE on the original scale. Both the inputs and targets were transformed using during training, and evaluation was conducted after inverse transformation.
For Metro-GATF, owing to its architecture incorporating gate-based zero handling, the final predictions are reconstructed by first determining whether each OD pair is non-zero according to the inference rule, followed by recovering the magnitude prediction. Specifically, Metro-GATF was trained in the space for both the inputs and targets. The ground-truth non-zero indicator is defined as , which is equivalent to the condition in which the raw OD count is greater than zero. During inference, the gate head outputs a probability , and the magnitude prediction is retained only for entries where , whereas all other OD pairs are set to zero. In this study, is used. The inverse transformation is then applied as and , where predicted log values below zero are clipped to zero prior to the reconstruction in the original scale. Furthermore, sMAPE is computed with a small constant to alleviate denominator instability near zero.
In addition to the main comparison, we conducted a post-training gate-threshold sensitivity analysis for the full Metro-GATF model using the validation set. To isolate the effect of the inference threshold from model training, the best checkpoints of the full Metro-GATF configuration corresponding to S8 in the ablation study were fixed for three random seeds, and only the gate threshold was varied from 0.1 to 0.9. The threshold was selected based on the validation-set sensitivity results and then fixed before evaluating the final model on the independent test set. The sensitivity results were evaluated using the same forecasting metrics as the main experiments, namely MAE, RMSE, and sMAPE, and are reported as the mean and standard deviation across the three seeds. In addition, the predicted non-zero rate was reported as an auxiliary diagnostic statistic to examine how conservatively the gate identifies active OD pairs after thresholding.
Because OD matrices exhibit a sparse structure with frequent zero or near-zero values, this study employed MAE, RMSE, and sMAPE to jointly evaluate the average absolute error, sensitivity to large errors, and relative prediction accuracy. The same three metrics were also used for the gate-threshold sensitivity analysis to maintain consistency with the main forecasting evaluation. The predicted non-zero rate was not used as an error metric but as an auxiliary diagnostic measure for interpreting the sparsity behavior of the gate. This experimental setup ensured that all the models were compared under a consistent operational forecasting protocol.
The comparison models are divided into two groups to ensure fairness in problem setting. The first group consists of full-matrix baselines that directly predict the entire OD matrix, including HA, ARIMA, GCN-LSTM, Autoformer, MPGCN, and ODFormer. The second group includes a pair-level reference baseline, ST-LSTM, trained on individual OD pairs. Because ST-LSTM is not designed for full-matrix prediction but for individual OD pair forecasting, it is not directly compared within the same table as the full-matrix baselines and is instead presented as a separate reference experiment.
The methods discussed in the related works, such as HIAM, DT-HGN, ST-DAMHGN, and ODMixer, are not included in the main comparison. These approaches are often based on different problem assumptions, such as incomplete OD inference, task-specific heterogeneous or hypergraph representations, or pair-centric/local OD modeling. Therefore, they do not align directly with the offline full-matrix forecasting protocol considered in this study, which assumes a fixed station-level railway topology and complete historical OD sequences as inputs to predict the full future OD matrix. Accordingly, the main benchmark in this study is constructed around representative full-matrix baselines that operate under the same input–output protocol.
All learning-based models were tuned using the same time-ordered validation split from 20 May to 24 May 2022, and the optimal checkpoint was selected based on validation RMSE. After checkpoint selection, the selected model was evaluated once on the independent test set from 25 May to 31 May 2022. Training for all learning-based models, including Metro-GATF, was conducted on a Blackwell Max-Q Workstation Edition (96 GB VRAM). The training configuration used a batch size of 2 and 200 epochs, learning rate of , and the Adam optimizer. In contrast, HA and ARIMA were trained using standard estimation procedures. In addition, all neural network-based models were evaluated using three random seeds, and the final performance was reported as the mean and standard deviation.
4.1. Experimental Results
4.1.1. Full-Matrix Baseline Comparison
The full-matrix benchmark in
Table 2 was designed to cover a wide spectrum of models, ranging from simple repetitive-pattern baselines to OD-specific graph-based models. HA represents the simplest baseline, utilizing historical average patterns for each OD entry, and demonstrates how much predictive performance can be achieved using only a strong periodicity. ARIMA is a traditional time-series model based on linear autoregressive structures that represents non-deep-learning statistical baselines. GCN-LSTM is a representative spatiotemporal deep learning baseline that combines graph-based spatial aggregation with recurrent temporal modeling. The Autoformer represents a generic transformer-based time-series model that does not explicitly incorporate railway topology, capturing long-term dependencies through attention mechanisms. The MPGCN, on the other hand, is an OD-specific full-matrix forecasting model that jointly utilizes static and dynamic graphs and serves as a strong graph-based baseline that is closely aligned with the problem setting of this study. Accordingly,
Table 2 is constructed to include simple average-based models, traditional statistical models, general deep learning time-series models, and OD-specific graph-based models, enabling comprehensive evaluation of the proposed method across multiple levels of baselines. Because the ST-LSTM is designed to directly predict the selected OD pairs rather than the full OD matrix, it is not included in
Table 2 and is instead evaluated separately in a pair-level reference experiment.
As shown in
Table 2, Metro-GATF provides balanced forecasting performance across the full-matrix error metrics. Compared with HA, ARIMA, GCN-LSTM, and Autoformer, Metro-GATF reduced MAE by approximately 95.5–97.9%, RMSE by approximately 75.8–95.2%, and sMAPE by approximately 88.8–98.1%. These results suggest that the proposed model more effectively captures the complex spatiotemporal variations in minute-level OD matrices than simple average-based patterns, traditional statistical methods, or generic time-series deep learning approaches alone. A comparison with ODFormer requires a more nuanced interpretation. ODFormer produced very small aggregate MAE and RMSE values, but its sMAPE reached 163.10 ± 6.01, indicating that low absolute error over a highly sparse matrix does not necessarily imply reliable relative accuracy for sparse non-zero OD demand. Therefore, sMAPE is important for assessing whether sparse non-zero OD demand is captured reliably. Metro-GATF achieves the lowest sMAPE among the compared full-matrix models.
Compared with MPGCN, Metro-GATF achieved slightly better forecasting accuracy while requiring substantially less training time. Specifically, Metro-GATF reduced MAE from 0.0172 to 0.0169, RMSE from 0.1746 to 0.1637, and sMAPE from 2.697% to 2.662%. These correspond to approximately 1.7%, 6.2%, and 1.3% reductions in MAE, RMSE, and sMAPE, respectively. More importantly for offline large-scale analysis, the training time decreased from 24.79 ± 5.73 h for MPGCN to 4.36 ± 0.34 h for Metro-GATF, corresponding to an approximately 82.4% reduction. Thus, although the error difference between the two graph-based models is modest, Metro-GATF provides a more favorable accuracy–efficiency trade-off under the evaluated full-matrix OD forecasting protocol.
4.1.2. Pair-Level Reference Experiment
In addition, this study examined the pair-level behavior of the proposed model through a pair-level reference experiment. The ST-LSTM used in this experiment is based on the short-term urban railway OD flow prediction model proposed by Cui et al. [
19]. In the original work, ST-LSTM leveraged network-wide historical OD data, spatial correlation learning, and real-time inflow/outflow information to predict the target OD flows. Owing to computational constraints, the original study evaluated a subset of OD pairs rather than the full OD matrix and provided an analysis of selected individual OD flows [
19]. Accordingly, in this study, ST-LSTM is reimplemented not as a full-matrix baseline but as a reference model for selected OD pairs and is used for supplementary comparison. Therefore, the results presented below should be interpreted not as a direct comparison with full-matrix forecasting models, but rather as a complementary evaluation at the level of specific OD pairs.
Furthermore, for low-flow OD pairs, the true values are frequently zero or near-zero, which can lead to instability in percentage-based metrics [
36,
37]. Therefore, this study presents the (16,523) pair where the flow volume is relatively sufficient as a representative case, whereas the (10,25) pair is included only as part of the supplementary analysis.
As shown in
Table 3, for the (16,523) pair, ST-LSTM achieved a lower error in MAE, whereas Metro-GATF recorded lower errors in the RMSE and sMAPE. Specifically, Metro-GATF slightly reduced the RMSE from 3.007 to 2.986 and achieved a more substantial improvement in the sMAPE from 79.29% to 58.13%. These results suggest that while pair-level models trained directly on individual OD pairs may have an advantage in certain absolute error metrics, full-matrix models trained to reconstruct the entire OD matrix can still exhibit stable relative error characteristics at the level of representative OD pairs. However, because the two models differ in their training objectives and output structures, these results should be interpreted as a pair-level supplementary analysis rather than a direct comparison.
For the auxiliary analysis, the same comparison was conducted for a low-flow OD pair (10,25). This pair exhibits very low traffic volumes across most time steps, with frequent occurrences of zero or near-zero values, leading to significant instability in percentage-based metrics [
36,
37].
As shown in
Table 4, for the (10,25) pair, Metro-GATF achieved lower MAE and sMAPE values, whereas its RMSE was higher than that of ST-LSTM. However, because this pair exhibits an extremely low overall flow, the variability of percentage-based metrics can be significantly amplified [
36,
37]. Therefore, these results should be interpreted not as a representative comparison but rather as a supplementary analysis for low-demand OD pairs.
5. Ablation Study
To better explain how Metro-GATF is progressively assembled into a practical full-matrix OD forecasting model, we conducted progressive core build-up ablation rather than relying only on local leave-one-out variants. Starting from a minimal backbone, we incrementally added the major components of the proposed architecture and examined how each stage changed forecasting accuracy.
The stage definitions are as follows: S0 is a minimal graph-temporal baseline that uses only a short static encoder, a simple GRU-based temporal head, and direct row-wise prediction, without factorization, dynamic OD encoding, metadata, or gating. S1 replaces the direct output head with origin–destination factorization while keeping the remaining settings unchanged. S2 extends the static encoder from a short-only branch to dual short and long, multi-scale branches. S3 further introduces the dynamic OD graph encoder such that time-varying OD interactions can be encoded on top of the static spatial backbone. S4 replaces the simple temporal head with a non-autoregressive Transformer decoder. S5 adds minute-of-day temporal features to both historical and future steps. S6 incorporates weekday embeddings. S7 further appends geographic coordinates as static node features. Finally, S8 adds a sparsity-aware gate, which corresponds to the full Metro-GATF model.
As shown in
Table 5, stages S0–S3 are far from a practically useful full-matrix forecasting regime. The minimal backbone in S0 yields extremely large errors, indicating that short-range static encoding with a simple temporal head and direct prediction is insufficient for large-scale metro OD forecasting. Adding factorization to S1 does not by itself improve the result, and extending the static encoder to a dual short/long structure in S2 still leaves the model in a clearly underpowered regime. When the dynamic OD graph encoder was introduced in S3, the errors decreased substantially, suggesting that time-varying OD interactions provide useful information beyond the static railway topology. However, the performance is still far from that of the final model, implying that dynamic graph modeling alone is not sufficient.
The dominant turning point occurred at S4. Once the simple GRU-based temporal head is replaced by a non-autoregressive transformer decoder, the model enters a practically meaningful performance range. Notably, S3 and S4 share the same batch size under the progressive training schedule, which makes this transition particularly informative. This result indicates that the temporal decoder is not a minor refinement but a core requirement for large-scale offline full-matrix OD forecasting. In other words, static and dynamic graph encoders alone are not sufficient, unless they are paired with a sufficiently expressive future-step decoder.
From S4 to S7, adding time encoding, weekday embedding, and geographic coordinates does not produce measurable gains under the current 30 min forecasting setting, as the reported values are identical up to the shown precision. Therefore, these metadata features appear to play a complementary rather than dominant role in the present setup. Their contributions may become more visible under different horizons or datasets, but they are not the main drivers of the performance transition observed here.
The final improvement was obtained at S8, where the sparsity-aware gate was added to the otherwise complete model. S8 achieves the best MAE, RMSE, and sMAPE among all stages, confirming that explicit zero/non-zero modeling remains important even after the backbone and temporal decoder have already been established. Overall, the progressive build-up study revealed a clear hierarchy of contributions: a minimal backbone is insufficient, dynamic OD interaction modeling is helpful but not decisive, the transformer decoder provides the major performance transition, and the sparsity-aware gate delivers the final gain that completes the full Metro-GATF architecture.
To further examine the inference-time behavior of the sparsity-aware gate, we conducted a gate-threshold sensitivity analysis using the full Metro-GATF configuration. Because the gate threshold is not a trainable parameter but an inference-time operating point, the trained model parameters were fixed, and only was varied.
As shown in
Table 6, increasing the gate threshold consistently reduced the three main full-matrix forecasting errors. As
increased from 0.1 to 0.9, RMSE decreased from 0.4551 to 0.1639, MAE from 0.1836 to 0.0170, and sMAPE from 32.4330 to 2.6665. These results indicate that, under the forecasting metrics used in this study, a conservative gate threshold is beneficial for highly sparse metro OD matrices. This is because a low threshold retains many weakly activated OD pairs as non-zero predictions, which can increase false-positive flows over the large number of truly zero OD entries. In contrast, a high threshold suppresses weak predictions and reduces cumulative full-matrix errors. However,
should not be interpreted as a universally optimal threshold for all operational objectives. The actual non-zero rate of the evaluated OD matrices was 1.348%, whereas the predicted non-zero rate at
was 0.128%. This indicates that the selected threshold is conservative: it is effective for minimizing the full-matrix forecasting errors considered in this study, but it may fail to detect some active OD pairs if the objective is demand detection or recall-oriented monitoring.
6. Discussion
The experimental results suggest that direct full-matrix OD forecasting can be a practical option under the evaluated Seoul metropolitan subway setting and the 30 min short-term forecasting horizon. Full OD matrix prediction is more challenging than station-level inflow/outflow forecasting because the output dimensionality increases quadratically with the number of stations and because most possible OD pairs are zero or near-zero at a given minute. Metro-GATF addresses this issue not by treating the OD matrix as a set of fully independent regression targets, but by first generating future station-level representations and then reconstructing origin–destination relationships through structured factorization. This design reduces the burden of modeling all OD pairs independently while preserving the ability to forecast the complete network-wide OD matrix.
Comparison with baseline models provides insight into why the proposed architecture performs competitively. HA and ARIMA can exploit repetitive or linear temporal patterns but cannot explicitly represent railway topology or time-varying OD interactions. GCN-LSTM incorporates graph-based spatial aggregation and recurrent temporal modeling, but it does not explicitly address sparse full-matrix reconstruction. Autoformer provides a generic Transformer-based time-series baseline, but it does not directly encode the static railway graph or dynamic OD graph structure. ODFormer shows that low aggregate MAE and RMSE can be misleading in sparse OD matrices when relative errors on active OD pairs remain large. MPGCN is a strong graph-based OD forecasting baseline because it also considers static and dynamic graph information. Therefore, the close performance between MPGCN and Metro-GATF indicates that jointly modeling static and dynamic graph structures is important for full-matrix OD forecasting. The advantage of Metro-GATF lies in combining adaptive GATv2-based railway topology encoding, dynamic sparse OD interaction modeling, non-autoregressive future-step decoding, and sparsity-aware OD reconstruction in a unified framework with a shorter training time than MPGCN.
The ablation study further clarifies the role of the temporal decoder. The transition from the dynamic-graph stage to the Transformer-decoder stage produced the dominant performance improvement, suggesting that graph encoders alone are insufficient unless paired with an expressive future-step generation mechanism. The non-autoregressive decoder generates all future station representations in parallel using future-step embeddings and known temporal encodings, without feeding previously predicted OD matrices into subsequent prediction steps. This design can reduce the possibility of sequential error propagation and is well aligned with short-horizon multi-step OD forecasting. In addition, the operating-protocol comparison in
Table 7 further supports this interpretation. Under the same Metro-GATF components and experimental settings, the proposed non-autoregressive protocol achieved lower MAE, RMSE, and sMAPE than the autoregressive decoding variant. These results suggest that parallel future-step generation is more effective than sequential future-step generation for the evaluated offline full-matrix OD forecasting task. Nevertheless, the autoregressive setting in
Table 7 was implemented as an autoregressive decoding protocol rather than as a fully redesigned autoregressive Transformer architecture. Therefore, a strictly matched comparison between independently optimized autoregressive and non-autoregressive Transformer architectures remains an important direction for future work.
The sparsity-aware gate is another important component for large-scale metro OD forecasting. In a 637-station network, the number of possible OD pairs is very large, whereas the number of active OD pairs at a given minute is relatively small. Without explicit zero/non-zero modeling, weak false-positive predictions can accumulate over the full OD matrix and increase aggregate forecasting errors. The gate head addresses this issue by separating OD-pair activity estimation from magnitude prediction. The threshold sensitivity analysis indicates that a conservative threshold is effective for minimizing MAE, RMSE, and sMAPE under the evaluated setting. Nevertheless, the selected threshold should not be regarded as universally optimal. Because the predicted non-zero rate at the selected threshold is lower than the actual non-zero rate, the threshold is better interpreted as an error-minimizing operating point rather than a recall-oriented demand detection threshold. In operational applications where detecting as many active OD pairs as possible is more important than suppressing false positives, a lower threshold or a different threshold-selection criterion may be more appropriate.
From a practical perspective, the proposed framework should be interpreted as a decision-support tool for short-term OD demand analysis rather than as an automatic schedule control system. A 30 min forecasting horizon is useful for monitoring short-term demand changes, identifying emerging OD patterns, and supporting operational awareness, but it is not intended to replace comprehensive timetable planning or emergency-response decision-making. Operational adjustments in metro systems require additional constraints, including rolling-stock availability, crew scheduling, safety margins, passenger transfer behavior, and station-level capacity. Therefore, Metro-GATF should be used as one analytical input within a broader operational decision-making process.
Computational efficiency should be interpreted together with forecasting accuracy. In
Table 2, Metro-GATF required 4.36 ± 0.34 h for training, whereas MPGCN required 24.79 ± 5.73 h under the same hardware and experimental protocol. Thus, the proposed model achieved comparable or slightly better MPGCN error metrics while reducing training time by approximately 82.4%. GCN-LSTM and Autoformer trained faster than Metro-GATF, at 3.06 ± 0.01 h and 3.00 ± 0.02 h, respectively, but their forecasting errors were substantially higher. ODFormer trained fastest among the neural baselines, but its high sMAPE indicates unstable relative accuracy for sparse OD demand.
Table 8 further summarizes the model complexity and inference-efficiency results in terms of parameter count, GPU memory usage, and inference latency. GCN-LSTM and Autoformer showed lower latency than Metro-GATF, but their forecasting errors were substantially larger, indicating that low computational cost alone does not guarantee reliable full-matrix OD prediction. ODFormer had the largest number of parameters, with 263.8 M parameters, and also showed higher inference latency than Metro-GATF. Although MPGCN had the smallest parameter count, it required the largest GPU memory and exhibited the highest inference latency, which suggests that parameter count alone is insufficient for evaluating the practical complexity of full-matrix OD forecasting models.
From an architectural complexity perspective, Metro-GATF uses shared origin and destination projections rather than independent predictors for every OD pair. This design avoids assigning separate trainable predictors to all OD pairs while preserving directional origin–destination interactions. Although reconstructing a full OD matrix at each future step remains the dominant output-size cost. Metro-GATF achieved substantially lower latency than MPGCN and required far fewer parameters than ODFormer. Therefore, the proposed model provides a favorable accuracy–efficiency trade-off for offline full-matrix OD forecasting over a 637-station metro network.
This study has several limitations. First, the experiments were conducted on a single Seoul metropolitan subway network over a limited observation period. Although the network is large and operationally realistic, the results do not by themselves establish general applicability across different cities, network structures, or demand regimes. Second, the study focuses on a 30 min short-term forecasting horizon. Longer horizons, such as one day or one week, may involve different demand patterns, exogenous events, and accumulated uncertainty. Third, the model mainly uses AFC-based OD demand and railway network structure; external factors such as weather, holidays, special events, land use, station-area facilities, and socioeconomic attributes were not incorporated. Finally, this study reports seed-level variability through repeated experiments but does not provide a formal Bayesian or ensemble-based parameter uncertainty analysis. Future work should evaluate the framework across multiple cities and periods, extend it to longer forecasting horizons, incorporate exogenous contextual variables, and examine uncertainty-aware OD forecasting.
7. Conclusions
This study proposed Metro-GATF, an end-to-end framework for offline full-matrix metro origin–destination forecasting. The proposed model departs from sequential autoregressive forecasting by generating future node representations in parallel through a non-autoregressive Transformer decoder. These representations are then used to reconstruct future OD matrices through origin–destination factorization and a sparsity-aware gating mechanism. In this way, Metro-GATF is designed to jointly capture static railway topology and time-varying sparse OD interactions.
Experiments were conducted using minute-level AFC-based OD data from May 2022 for 637 stations in the Seoul metropolitan subway network. Under the full-matrix forecasting setting, final evaluation on the independent test set showed that Metro-GATF achieved an MAE of 0.0169, an RMSE of 0.1637, and an sMAPE of 2.662. The model consistently outperformed HA, ARIMA, GCN-LSTM, and Autoformer, achieved the lowest sMAPE among the compared full-matrix baselines, and showed slightly better MAE, RMSE, and sMAPE than MPGCN while requiring substantially less training time. These results support the effectiveness of Metro-GATF within the empirical setting considered in this study, namely, a single large-scale metropolitan subway network.
The ablation results further indicate that the non-autoregressive temporal decoder is a key component contributing to performance improvement, while the sparsity-aware gating mechanism provides additional benefits for highly sparse OD matrices. The additional comparison with the autoregressive decoding variant further supports the advantage of parallel future-step generation under the evaluated offline full-matrix forecasting protocol. These findings suggest that combining parallel temporal decoding with structured sparse OD reconstruction is a promising design choice for full-matrix metro OD forecasting. The gate-threshold sensitivity analysis further showed that provided the lowest and most stable errors among the evaluated thresholds according to MAE, RMSE, and sMAPE. At the same time, this threshold produced a predicted non-zero rate lower than the actual non-zero rate, indicating that it should be interpreted as a conservative error-minimizing operating point rather than a recall-optimized demand detection threshold.
Importantly, the empirical findings of this study should be interpreted within the scope of the evaluated dataset. Although the Seoul metropolitan subway network represents a large-scale real-world metro system, the experiments were conducted on a single network over a limited observation period. Therefore, the results do not by themselves establish the general applicability of Metro-GATF across different cities, network structures, or operating conditions. Rather, this study provides evidence that the proposed framework is effective in the examined large-scale metro network and offers a practical basis for further validation in broader OD forecasting scenarios.