1. Introduction
The term Due Diligence [
1] originated in the 1930s in the United States, where it required sellers of financial instruments to disclose information mandated by local regulations. Today, according to the American Dictionary of Legal Terms [
2], it refers to an analysis conducted by companies prior to making business decisions, particularly in areas such as mergers and acquisitions or the buying and selling of significant assets. Based on article [
3], the primary objective of a due diligence process is to mitigate risk by protecting the buyer from unforeseen costs arising from issues discovered only after the transaction has been completed, when reversing it is no longer feasible.
In accordance with market practice, the purchase of a building plot and the commencement of a construction project are preceded by the preparation of a Technical Due Diligence (TDD) report. The preparation of the report involves addressing a classification problem [
4], which entails verifying whether a planned building can be constructed on a given plot in compliance with current regulations and the investor’s requirements. This report is essential for the effective execution of the investment, contributing to the further development of the construction market in Poland, both for investors and construction companies [
5].
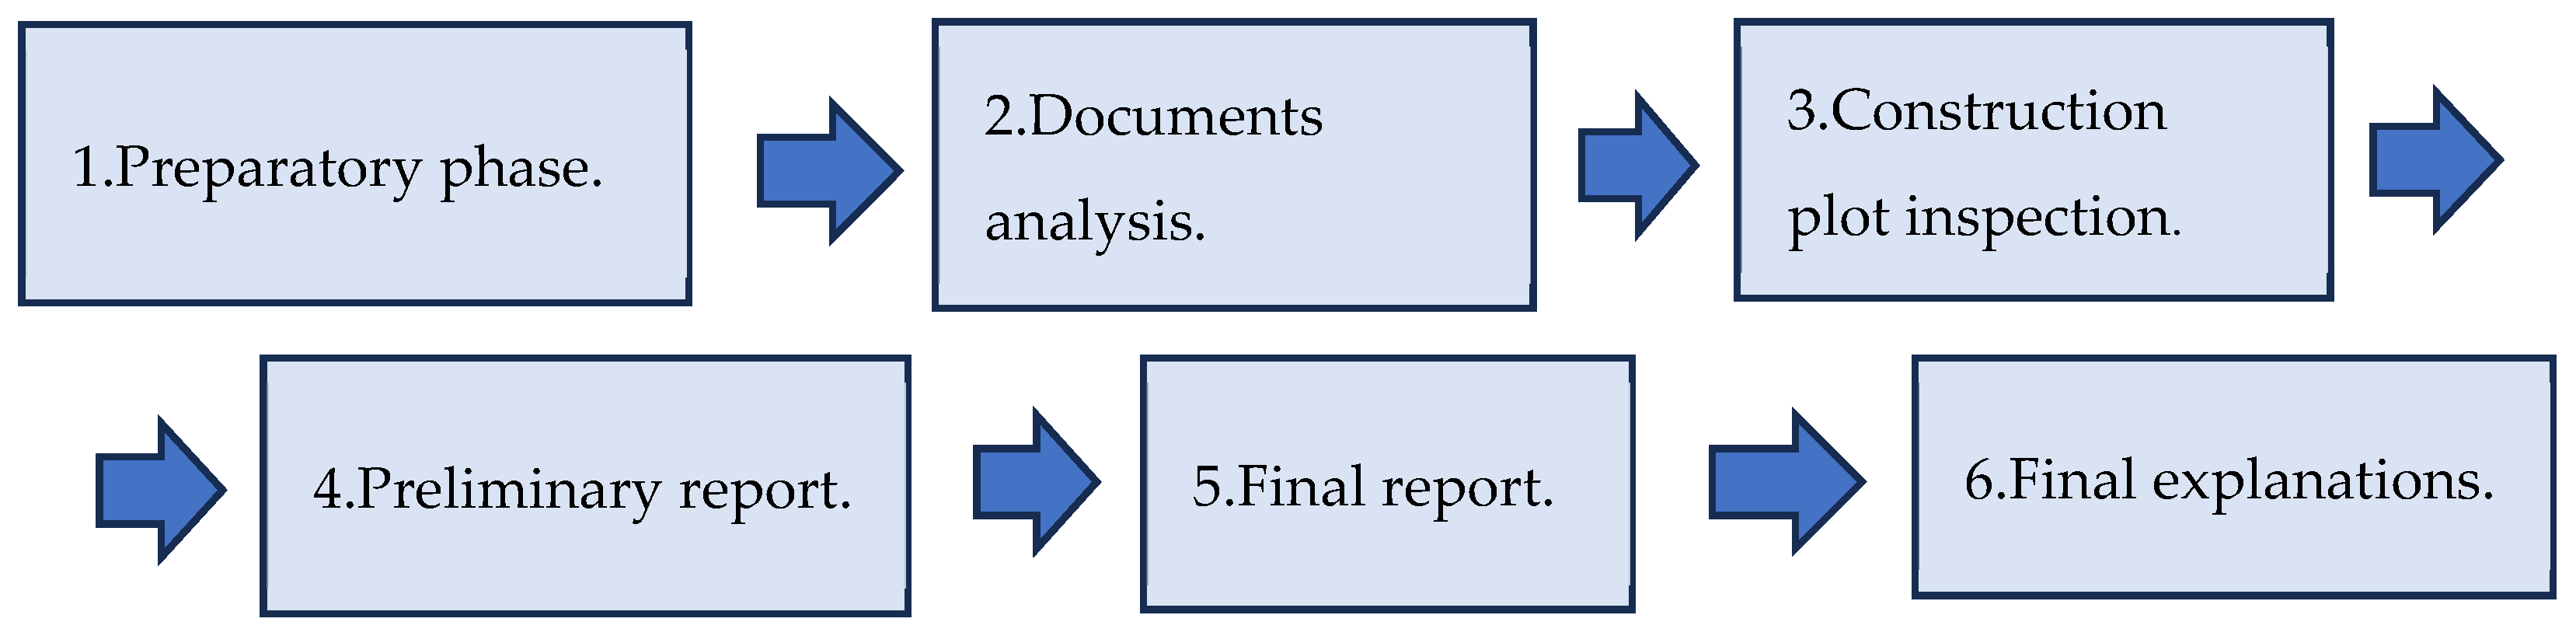
Figure 1 illustrates the main phases of the TDD process.
During the Technical Due Diligence (TDD) process, two reports are prepared. The preliminary report provides an assessment of legal, technical, environmental, social, and economic constraints that may make the realization of the proposed investment impossible, while the final report is subsequently issued upon completion of the entire analysis.
This article focuses on the TDD process, concentrating primarily on technical issues related to the land property [
6]. In line with the RICS (Royal Institution of Chartered Surveyors) [
7], the purpose of TDD is to identify physical defects or instances of non-compliance with local regulations prior to the sale of a property, as these may influence its value.
In scientific literature, several methodological approaches to the preparation of the Technical Due Diligence (TDD) process can be identified, including the Analytic Hierarchy Process (AHP), machine learning techniques, expert interviews, document analysis, and land inspections [
8]. However, the authors did not find any comparative analysis of machine learning methods that could be applied to the development of a decision-support system for investors regarding the purchase of land property. The lack of dedicated decision-support tools for investors acquiring land for construction projects, combined with the high complexity and risk of this process, justifies the application of machine learning methods to improve the quality of decision-making. Compared to the standard approach, a decision-support system based on machine learning could define a consistent methodology for the preparation of TDD reports and may serve as a tool supporting investment decisions.
The preparation of a TDD report can be reduced to solving a binary classification task [
9], in which the input consists of factors affecting the future investment, treated as independent variables, and the output is a recommendation concerning the potential purchase of a given property, which is the dependent variable.
One of the most popular approaches to solving classification tasks is the use of methods based on machine learning algorithms [
10]. The aim of this article is to test machine learning models and identify the optimal algorithm for building a classifier that would form the basis of a decision-support system for investors regarding the potential purchase of land property.
Figure 2 presents the scheme of the investor decision-support system.
2. Data Set
For the development of the machine learning models, a database consisting of 100 projects was used. The dataset was divided into training (60 projects), validation (20 projects), and test (20 projects) sets. The division into validation and test sets was applied to reliably assess the performance of the individual models and to reduce the risk of overfitting. Each project included in the database was described using 25 factors grouped into five categories: legal, technical, environmental, social, and economic. The database was prepared based on the authors’ professional experience and expert interviews. Based on their own analysis, the authors selected the factors that have the most significant impact on the purchase decision, following the principle that each group should be represented by five factors. All factors used to describe the projects are presented in
Table 1.
Based on the above-described database, classifiers supporting investor decision-making were developed. To evaluate the performance of the individual models, cross-validation [
11], the confusion matrix [
12], and the metrics ACC, PPV, REC, and F1 were used, as described in
Table 2,
Table 3 and
Table 4.
In the case of the database described in this article, the value of k is equal to 4, which means that the dataset was divided into four validation–training folds, each consisting of 20 projects. The remaining group of 20 projects constitutes the test set. The confusion matrix is constructed in accordance with the following formulas:
3. Machine Learning Models
3.1. Decision Trees
One of the most widely used methods for solving classification problems is the application of decision trees [
13], which aims to partition data into the most homogeneous possible groups with respect to the dependent variable [
14]. A decision tree model splits the training data by asking successive questions about various factors [
15]. Each question represents a node in the tree, and the answers lead to subsequent branches. At the end of each branch, there is a decision—e.g., to which class the object belongs. Decision trees are intuitive, easy to interpret, and can be easily presented in a graphical form; however, they are prone to overfitting.
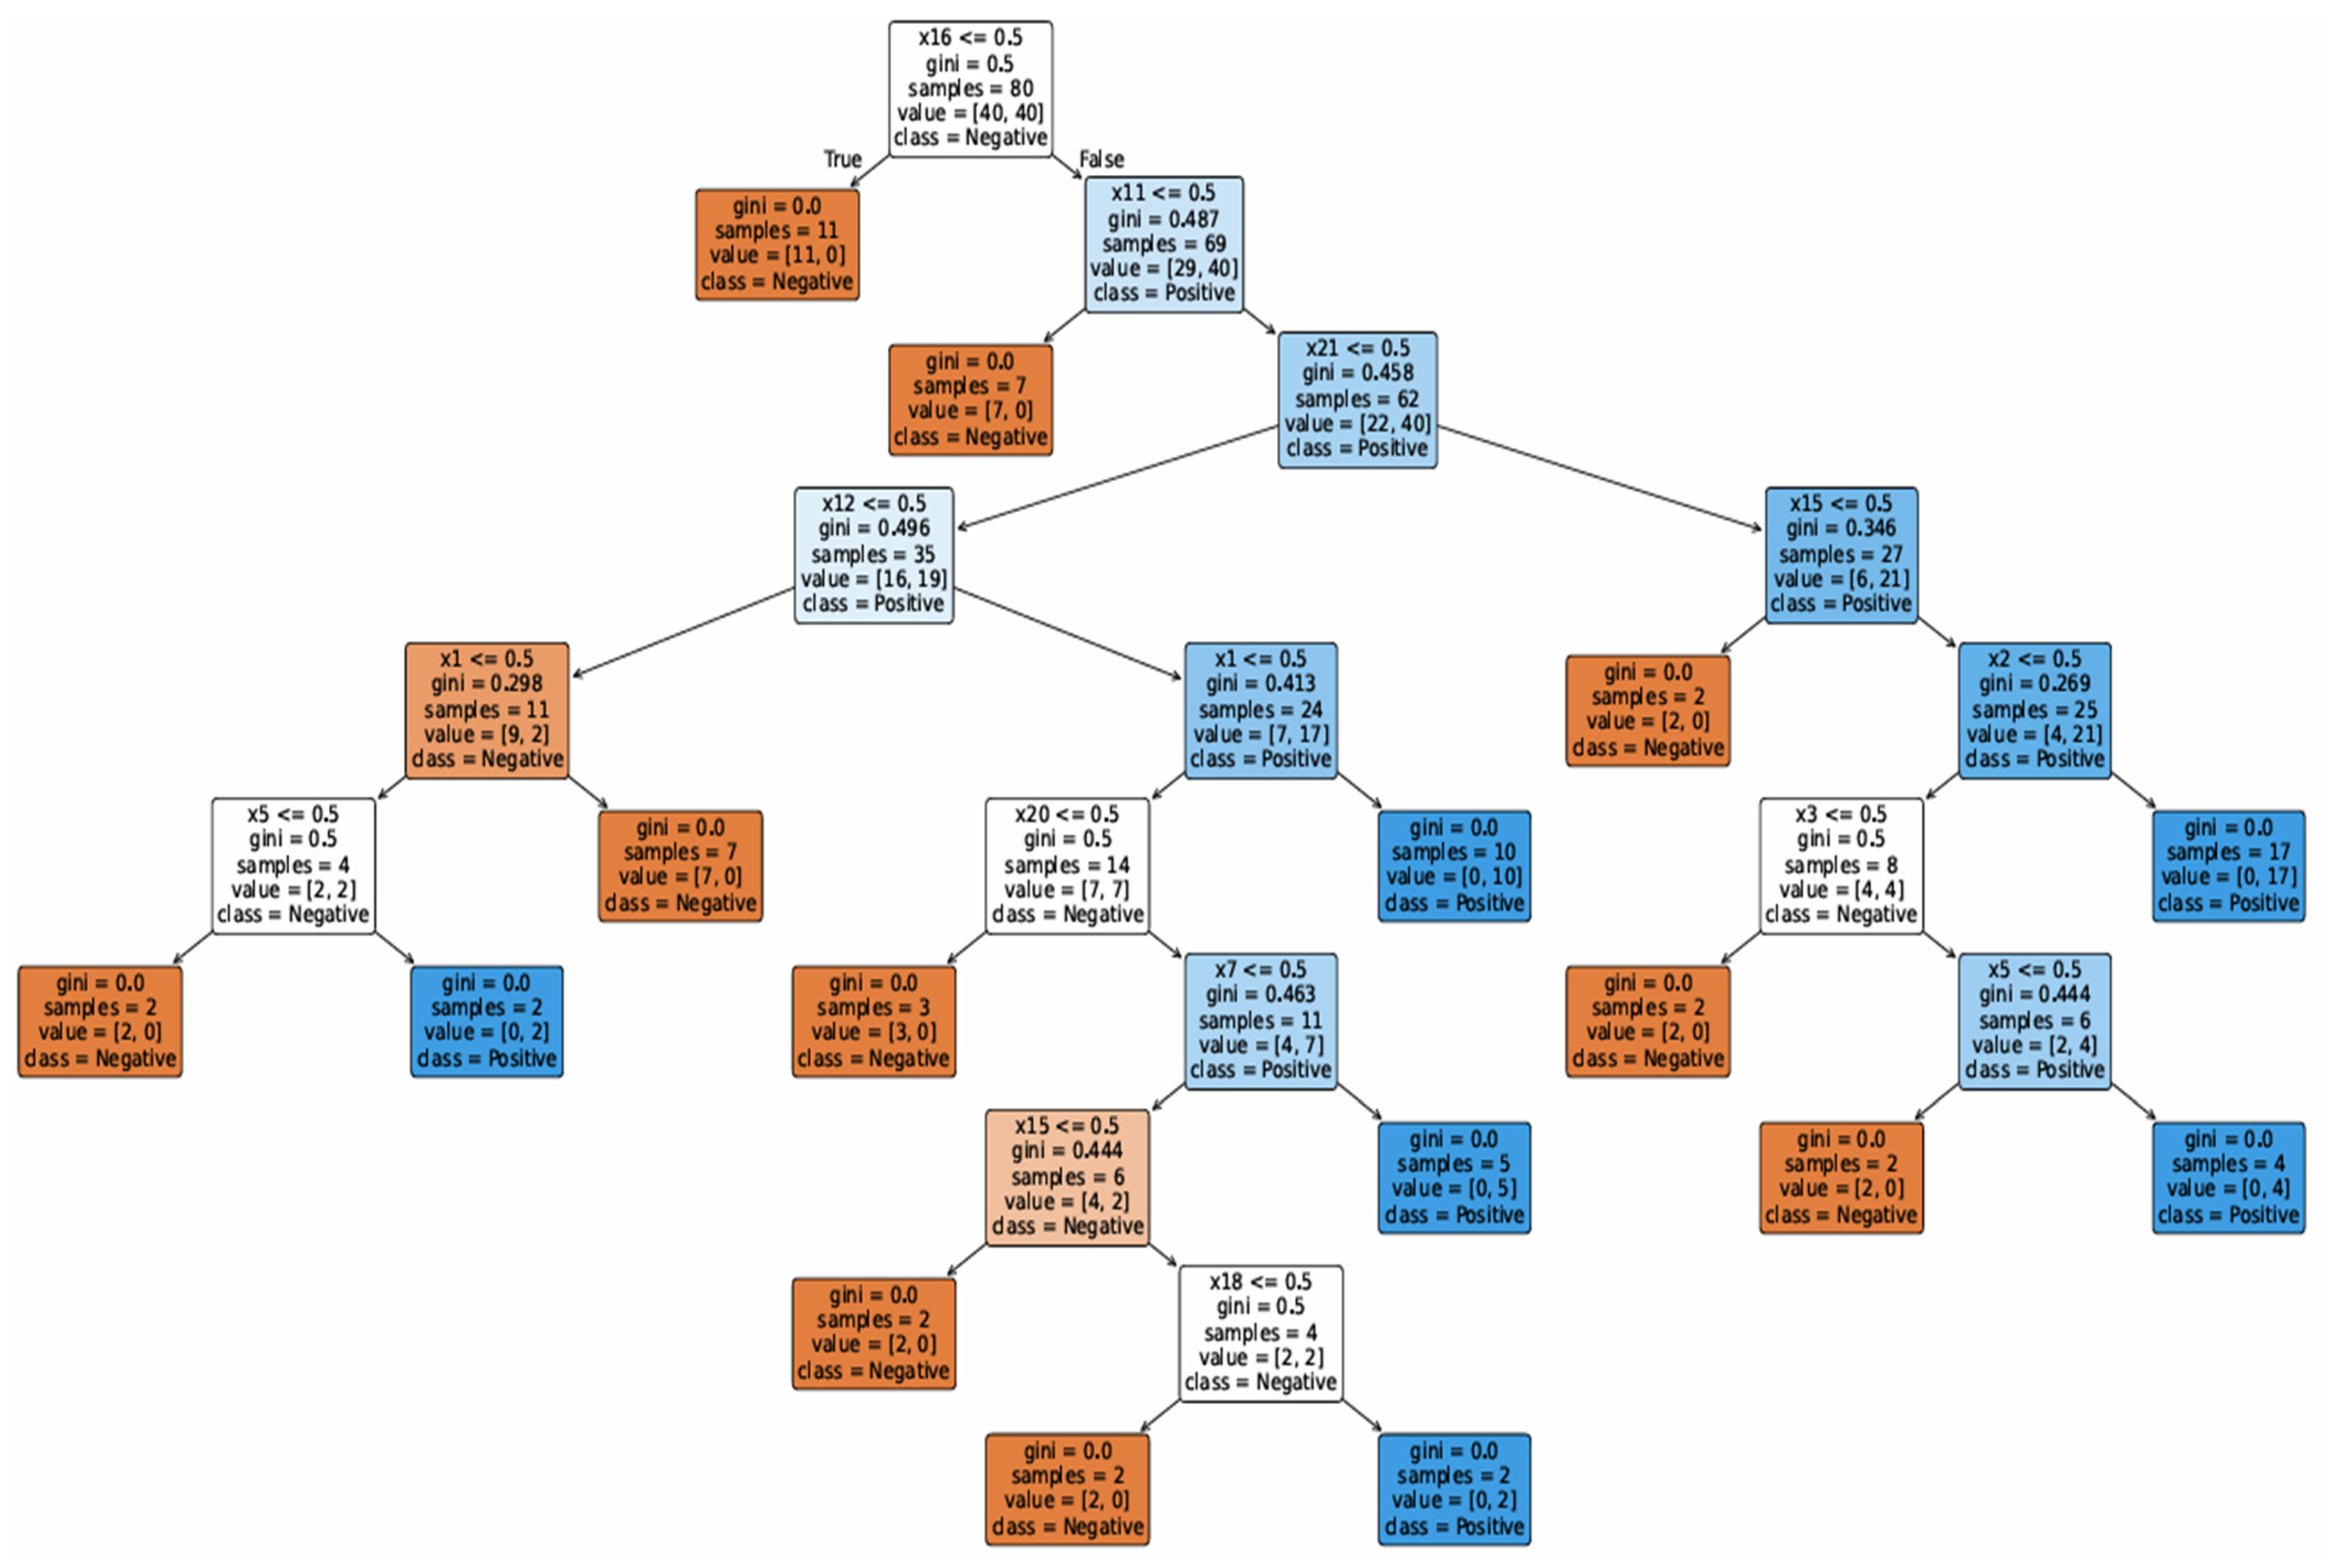
Based on the CART algorithm [
16] and a training dataset consisting of 80 cases, a decision tree was generated (shown in
Figure 3), which can be used to support investor decision-making. An additional benefit of using the decision tree algorithm is the identification of 13 factors included in the decision tree out of 25, which are key in making a positive purchase decision regarding land property. These identified factors can be analyzed at the preliminary report phase of the TDD process, which allows the TDD process to be carried out more optimally. Additionally, the algorithm highlights factors such as plot price and planning decisions, whose fulfillment is essential for making a positive purchase decision and whose verification should be carried out at the beginning of preparing the preliminary report. The confusion matrix of the decision tree method for the test dataset is presented in
Table 5.
3.2. Random Forests
A random forest [
17] is a collection of multiple decision trees. Each tree is trained on a slightly different random subset of data and factors. The prediction of the random forest is based on majority voting, where each tree makes an individual prediction, which is then aggregated, and the final prediction is determined by majority vote. For the purposes of calculations in this article, based on tests performed on the validation data, an optimal number of 200 decision trees was assumed.
A single tree is prone to errors, but multiple decision trees reduce overfitting and provide a more stable and accurate result. Random forests are highly effective, resistant to overfitting, and automatically detect the importance of factors; however, they are difficult to interpret. The confusion matrix of the random forest method for the test dataset is presented in
Table 6.
3.3. Nearest Neighbors (k-Nearest Neighbors)
KNN (the k-Nearest Neighbors algorithm) [
18] is a very simple model: when a new data point appears, the k nearest points from the training dataset are identified, and on this basis a positive or negative decision is made (majority voting). For the purposes of the calculations in this paper, based on tests performed on the validation dataset, the optimal value of k = 3 was adopted. KNN is a simple and intuitive method that does not require model training. Unfortunately, the model is sensitive to irrelevant features. The confusion matrix for the k-Nearest Neighbors Model applied to the test dataset is presented in
Table 7.
3.4. Support Vector Machine (SVM)
SVM (Support Vector Machine) [
19] identifies a ‘boundary’ (hyperplane) that best separates the classes in the dataset. ‘Best’ means that it maximizes the margin, i.e., the distance to the nearest points from each class (the so-called support vectors). For non-linear data, kernel functions are applied to ‘map’ the data into higher-dimensional spaces, where separation becomes easier. The method is characterized by high effectiveness when dealing with data containing many features and is resistant to overfitting; however, it is difficult to interpret. The confusion matrix of the Support Vector Machine method for the test dataset is presented in
Table 8.
3.5. Artificial Neural Networks
ANNs (Artificial Neural Networks) [
20] are computational models inspired by the functioning of the human brain, used in machine learning and artificial intelligence. ANNs learn complex non-linear relationships and are characterized by high effectiveness; however, they are difficult to interpret and require large amounts of data. For the purposes of this study, an MLP [
21] (Multi-Layer Perceptron) network was applied, consisting of one hidden layer with four neurons and the ReLU activation function. The confusion matrix of the ANNs method for the test dataset is presented in
Table 9.
3.6. Summary of Results
Table 10 presents the results obtained for all tested machine learning models on the validation and test datasets.
4. Discussion
The literature includes numerous studies describing decision-support systems across various fields (e.g., decisions of an economic nature [
22], decisions made within construction companies [
23], and the selection of an optimal subcontractor [
24]); however, there is no system specifically dedicated to the purchase of land properties intended for construction investment.
Based on the conducted research, a methodology for creating an investment decision-support system using machine learning methods was proposed. The most widely recognized machine learning techniques were applied to construct the investor decision-support system, including Decision Trees, Random Forests, k-Nearest Neighbors classifiers, Support Vector Machines, and Artificial Neural Networks. The models’ performance was evaluated using validation and test datasets, for which confusion matrices were generated and performance metrics such as ACC (accuracy), PPV (precision), and REC (recall) were calculated.
To mitigate the risk of overfitting, several strategies were applied. The dataset was divided into training, validation, and test subsets, enabling independent model tuning and evaluation. Additionally, k-fold cross-validation (k = 4) was implemented to ensure a more robust assessment of model performance and to reduce dependence on a single data split.
Model complexity was intentionally limited, particularly in the case of the ANN, which was designed with a simple architecture (one hidden layer with four neurons) to match the size of the dataset. Furthermore, model performance was evaluated using multiple metrics (ACC, PPV, REC, and F1) across validation and test datasets, allowing for a comprehensive assessment of generalization ability.
Finally, it should be emphasized that the decision-making process is relatively complex. The twenty-five factors used to describe the project do not exhaust the full range of factors that investors must analyze before making a purchase decision, which constitutes a limitation of the proposed models. However, once the key decision-making factors are identified in cooperation with investors, the developed models may serve as a tool supporting investment decisions.
As part of future research, although the Authors are aware of the challenges associated with collecting appropriate data, it is planned to increase the number of analyzed cases and consider factors in order to improve the system’s accuracy and reduce the number of Type I and Type II errors.
5. Conclusions
Decision-making regarding the purchase of land property for the purpose of construction investment is a complex transaction that, in accordance with market practice, requires conducting a Technical Due Diligence (TDD) process, which is influenced by numerous factors belonging to various fields. The main contribution of this study was to demonstrate that artificial intelligence-based machine learning models can be applied to develop a decision-support model for investors in the process of land acquisition. Additionally, based on the Decision Tree model (built using the CART algorithm), it is possible to identify key factors whose fulfillment is necessary to make a positive purchase decision. Factors such as the price of the land property and planning decisions were identified by the algorithm as essential for making a positive purchase decision.
Furthermore, factors such as the attitude of immediate neighbors, deficiencies in formal documentation related to existing buildings, heritage protection status of the site, land contamination, mining damage, access conditions to public roads, rental market trends, and overall economic conditions were identified as having a significant impact on the decision-making process. Simple method Decision Trees offer full interpretability, allowing investors to understand the model’s decisions, but at the cost of lower accuracy, especially on the test dataset. More complex methods, such as ANNs, provide higher effectiveness, but with limited interpretability.
The following machine learning methods were tested in the study: Decision Trees, Random Forests, k-Nearest Neighbors, Support Vector Machines, and Artificial Neural Networks (ANNs). The highest model accuracy (ACC) for the test dataset was achieved by ANNs at 80%, while for the validation dataset the highest value (79%) was obtained by Random Forests. Additionally, it should be noted that the highest precision (PPV), which determines the magnitude of Type I error, was achieved by the ANN model on the test dataset. This metric is particularly important because it indicates the number of actual negative decisions classified by the model as positive, which may lead to concluding an unfavorable transaction and incurring significant financial losses for the investor.
Regarding recall (REC), which reflects the number of Type II errors (actual positive decisions classified as negative), the highest value was also achieved by ANNs on the test dataset. The F1 score, being the harmonic means of precision and recall, also reached the highest value for the ANN model.
ANNs proved to be the most effective method in the context of supporting investment decision-making in the studied database, due to the model’s ability to capture nonlinear relationships among decision factors. Other methods, such as Decision Trees, Random Forests, SVM, and KNN, showed lower accuracy on the test dataset, which can be attributed, among other things, to their limited ability to capture complex relationships in a relatively small dataset. These methods were more sensitive to the limited number of cases and the uneven distribution of decision-influencing factors, resulting in lower classification performance.
The results obtained in this study are specific to the problem analyzed and may not fully reflect the performance of these methods in other classification tasks. The results depend on the nature of the data, the number of available samples, the number and type of factors, and the degree of nonlinearity in relationships. Therefore, conclusions regarding the superiority of ANNs should be considered specific to the studied dataset and problem, and any generalization should be preceded by testing on larger and more diverse datasets.
For the ANN, the difference between test accuracy (0.80) and validation accuracy (0.71) has been observed. The test set (20 projects) may have been less complex or more homogeneous than the cross-validation folds, which could have resulted in higher performance on this subset.
The observed 9-percentage-point gap may indicate that the model’s performance on unseen data is potentially overestimated. To address this concern, we have emphasized the need for further validation on larger and more diverse datasets in future work.
Due to the small dataset (80 training projects and 20 test projects), all models had low computational requirements and short training times. ANNs required the most computational resources, although with such a small sample the difference in time was minimal. Decision Trees and Random Forests had the shortest prediction times, which may be important for larger datasets.
Decision trees offer a transparent and interpretable structure, allowing investors to directly follow decision rules and understand how specific input factors influence the outcome. This makes them especially useful in situations where explainability and traceability of decisions are required.
ANNs, while often achieving higher predictive accuracy, operate as black-box models. Their output should therefore be interpreted primarily as classification predictions, without direct insight into the internal decision logic. For practical use, this implies that ANNs are more suitable in contexts where predictive performance is prioritized over interpretability.
Decision-support systems for land acquisition may assist investors in making more reliable decisions. However, it should be emphasized that the final decision regarding the purchase of land property is ultimately made by the investor based on their subjective assessment of the factors influencing the future investment.