1. Introduction
Depositional controls on source rock development play a key role in petroleum system analysis, as sedimentary processes and depositional environments control the accumulation, preservation, and distribution of sedimentary organic matter [
1]. Outcrop successions provide a critical link between sedimentological observations and geochemical signatures that are commonly inspected only indirectly from subsurface data. One of the initial parameters used to assess source rock potential is total organic carbon content (TOC) [
2]. In subsurface studies, TOC is commonly estimated using a combination of laboratory analyses and geophysical well logs, and numerous methods have been developed to predict its content from wireline responses, as comprehensively summarized in recent review studies [
3,
4]. In the Croatian part of the Pannonian Basin System (CPBS), previous subsurface investigations of geochemical parameters have applied the ΔlogR method to reconstruct continuous TOC profiles from wireline data, highlighting both the potential and the limitations of log-based TOC estimations [
5,
6]. However, relationships between geophysical parameters may be influenced by multiple interacting geological and petrophysical factors, including lithology, depositional heterogeneity, diagenesis, and reservoir characteristics [
7]. In addition, geochemical datasets from wells are often limited due to sparse coring intervals, resulting in restricted TOC coverage within potential source rock intervals.
Predicting TOC in surface outcrops presents its own challenges due to weathering effects, lateral facies variability, and the absence of correlation with subsurface data in most cases. Despite these limitations, several studies have demonstrated that relationships between TOC and gamma-ray responses can be identified based on the distinctive geophysical behaviour of organic-rich sediments [
8,
9]. Outcrop gamma-ray spectrometry has therefore become an important bridge between sedimentological observations and geophysical logging, allowing high-resolution measured sections to be evaluated using the same parameters routinely applied in subsurface interpretation. However, most previous studies are based on subsurface datasets or do not explicitly evaluate the role of sedimentological heterogeneity, which causes uncertainty regarding the reliability and transferability of gamma-ray–TOC relationships in complex outcrop settings.
Among spectral gamma-ray components, uranium (U) is a redox-sensitive element whose distribution in sedimentary rocks is highly variable due to the combined influence of detrital mineralogy, redox chemistry, weathering, sediment transport, and burial diagenesis [
10]. The retention or mobilization of U within mineral phases is primarily controlled by its oxidation state and associated solubility [
11]. According to Cumberland et al. [
12], under reducing conditions, U is reduced from soluble hexavalent U(VI) to relatively insoluble tetravalent U(IV). This leads to its immobilization through adsorption onto organic matter, association with sulphide phases, or incorporation into early diagenetic minerals [
13,
14,
15,
16,
17,
18]. As a result, U enrichment measured by gamma-ray spectrometry is widely used as a proxy for organic-rich and potential source rock intervals, although the strength and reliability of this relationship vary significantly between depositional settings [
19,
20,
21,
22] and may be influenced by post-depositional processes [
12]. Although U is commonly interpreted as the gamma-ray component most closely related to TOC, the relative contribution of U, K, and Th to TOC variability is rarely evaluated quantitatively.
In contrast to uranium (U), potassium (K) and thorium (Th) are predominantly associated with detrital mineral phases. K concentrations in sedimentary rocks vary primarily with detrital mineralogy and diagenetic modification. In carbonate successions, K is restricted to the non-carbonate fraction and is hosted by detrital silicate minerals such as feldspars, micas, and clay minerals, making K a useful proxy for terrigenous input [
23]. In fine-grained siliciclastic rocks, potassium (K) abundance is largely controlled by clay mineralogy, with additional contributions from K-feldspar, whereas in sand-rich sediments, it mainly reflects the proportions of K-feldspar, mica, and glauconite [
23].
Th is considered relatively immobile, although it becomes separated from more mobile elements (such as U) during weathering and alteration of igneous parent rocks [
16,
24,
25]. As a result, Th is concentrated in resistant detrital-heavy minerals (e.g., zircon, monazite, apatite, xenotime), and, when released during weathering, it is strongly adsorbed onto clay minerals and iron–manganese oxyhydroxides. In carbonate rocks, Th contents are typically very low (<3 mg/kg) and are largely part of the non-carbonate fraction, primarily clays [
10].
There are methodological and geological factors that limit the strength and reliability of the TOC and gamma-ray data relationship that must be explicitly considered when evaluating gamma-ray spectrometry as a proxy for TOC in outcrop studies. A key limitation in relating gamma-ray data to TOC lies in the scale mismatch between sampling methods. Field gamma-ray measurements typically integrate radiation from a surrounding rock volume (and, without collimation, from adjacent beds and lateral surfaces), whereas TOC is measured on a discrete sample. Even when sampling is co-located, this mismatch imposes a practical upper bound on the strength of any TOC–gamma statistical relationship, and it is expected to be most problematic in successions with facies heterogeneity where thin beds and rapid vertical alternations are common. In addition, surface measurements may be affected by weathering processes that can modify both gamma-ray responses and organic matter content, further complicating direct comparisons and interpretation. Moreover, post-depositional processes such as diagenesis and uranium remobilization may further alter primary geochemical signals [
12]. Together, these factors impose a fundamental limitation on the predictive capability of gamma-ray measurements and imply that only moderate statistical relationships between TOC and gamma-ray parameters can be expected, even under favourable conditions.
In this study, these relationships are evaluated in two Middle Miocene (Badenian–Sarmatian) marine successions from the CPBS (see Geological Settings) that differ in depositional architecture: (a) Voćin (VOC)—a section represented by lithofacies variability induced by shifts in water level with frequent coarse-grained sedimentary units interbedded within a marl-dominated sequence, and (b) Podsused (POD) an almost completely marl-dominated section with few coarse-grained units in its upper part. These differences in depositional architectures provide a natural framework to evaluate how facies heterogeneity influences gamma-ray–TOC relationships. Accordingly, this study is based on the hypothesis that uranium-derived gamma-ray response can serve as a proxy for TOC. To test this hypothesis, the study evaluates the capability of surface gamma-ray measurements to predict TOC content using a statistically transparent approach. Specifically, this study aims to quantify relationships between TOC and U, K, Th, and dose rate (DR) in two Middle Miocene stratigraphic sections using Pearson correlation and regression analysis. To assess the contribution of each gamma-ray component to TOC variability, multiple and simple linear regression models are applied. In addition, logistic regression was used to evaluate the predictive power of U and DR for identifying organic-rich intervals, defined as those with TOC ≥ 1 wt.%, a commonly used lower limit for good source rocks in source rock characterization [
26]. Based on these analyses, the study defines probabilistic threshold values for U and DR that may serve as practical screening criteria. By quantitatively evaluating individual gamma-ray components and their predictive behaviour, this study provides a data-driven framework for evaluating the usefulness of gamma-ray measurements in TOC screening, with emphasis on the role of sedimentological variability.
2. Geological Settings
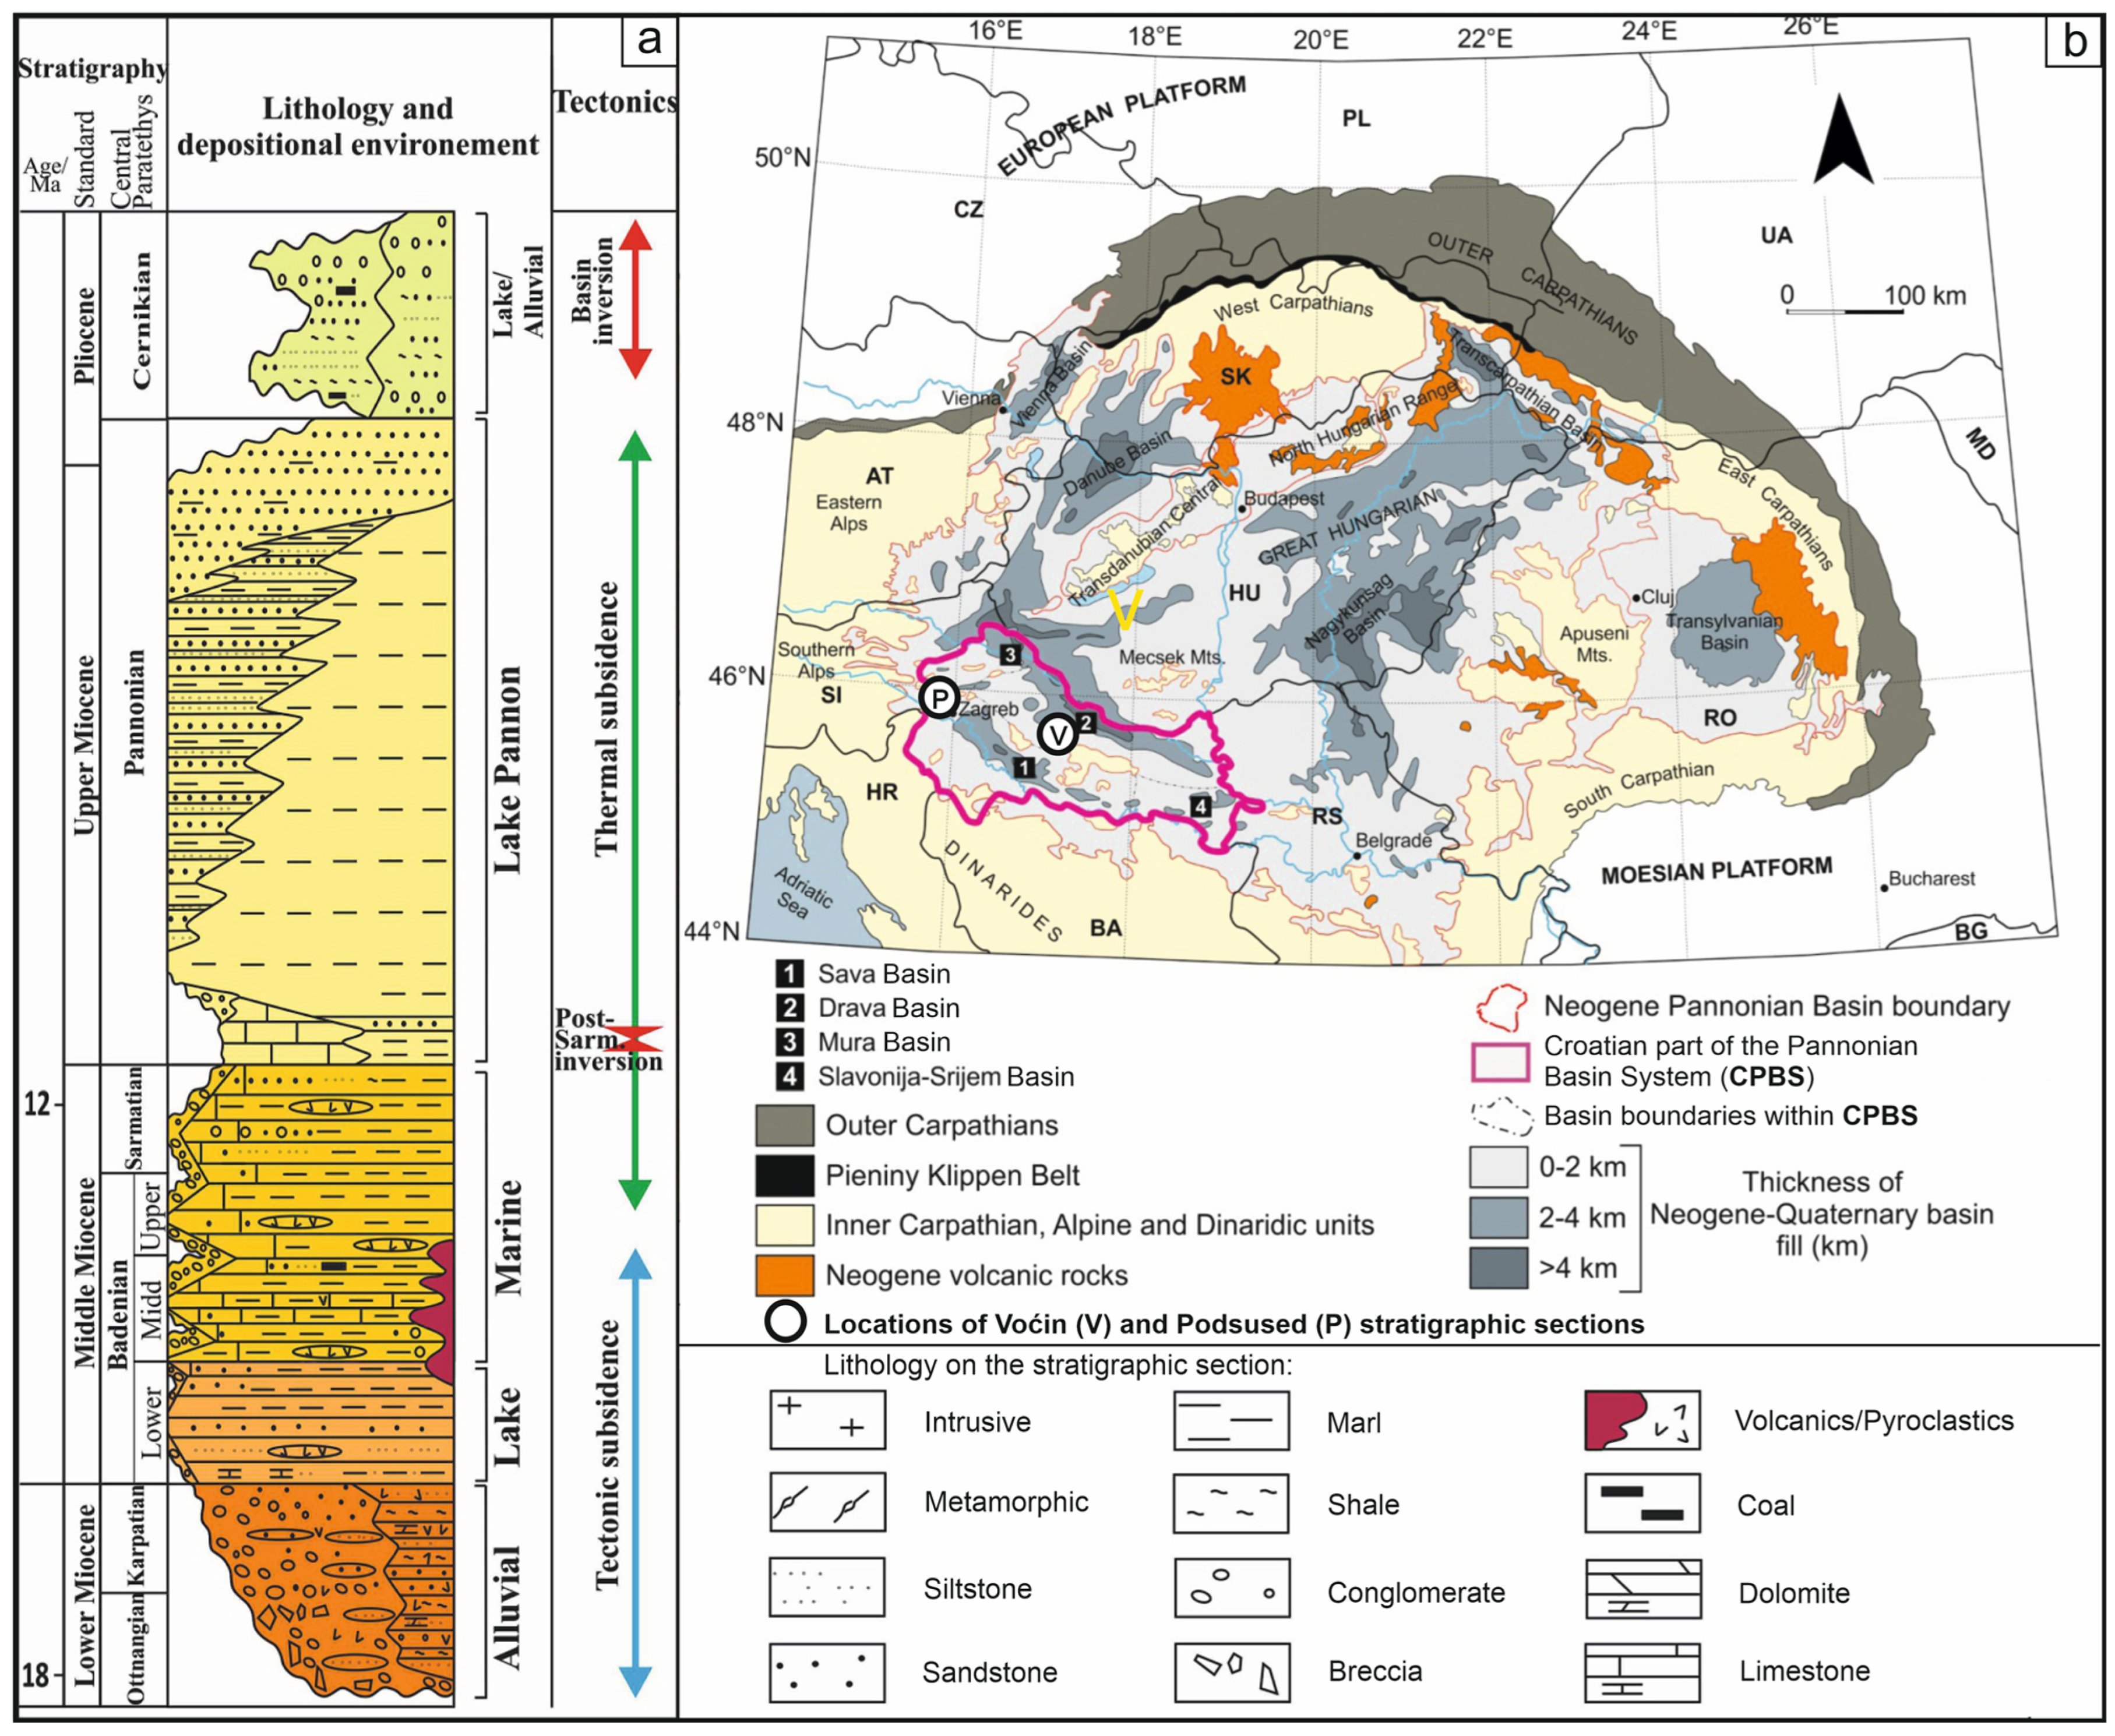
The study area is located in the Croatian part of the Pannonian Basin System (CPBS) (
Figure 1). This rift-type basin represents the southwestern part of the large Pannonian Basin System (PBS) and occupies most of the territory of present-day Northern Croatia [
27]. PBS is a back arc basin surrounded by mountain ranges of Alps, Carpathians, and Dinarides, which paleogeographically covers a substantial portion of the Central Paratethys [
28,
29,
30,
31,
32].
In the CPBS, the continental rifting began in Ottnangian and the main extension stage lasted until Badenian [
37,
38]. During this period, the regional stress orientation changed to N-S in the SW part of the Pannonian Basin System [
39], resulting in activation of sinistral transcurrent faults, displacement of major tectonic blocks in NE direction, and opening of Drava and Sava Basins as narrow asymmetrical half-grabens and opening of smaller depocenters between strike–slip faults. Ottnangian is characterised by sedimentation of predominantly coarse-grained clastics deposited in alluvial to lacustrine environments, with some pyroclastics [
40] resulting from syn-sedimentary volcanism of low intensity during the initial rift phase [
37]. Similar sedimentary conditions continued through Karpatian until the main marine transgression occurred in Badenian [
27,
41]. Early Badenian sediments are deposited in the lake environment, with the lake covering almost the entire SW part of the Pannonian Basin [
37]; or, a system of lakes was present, centred on syn-rift depocenters [
40]. The marine transgression in early Middle Badenian [
41] caused a transition from a lacustrine to a marine environment, with only a short transitional brackish interval [
27,
42,
43]. There were two transgression–regression cycles in the Middle Badenian [
27]. Deposits of both cycles are similar, composed mostly of thick marl layers with rare intercalations of coarse-grained clastics transported into the basin by gravity flows [
41,
42]. The end of the first cycle shows a coarsening-upwards tendency, indicating a marine regression and a relative sea-level fall [
27,
42]. The gradual change from lacustrine to marine sedimentation took place at the beginning of the Late Badenian [
44]. Cessation of rifting in Middle Badenian is marked by unconformity, which is considered as a syn-rift/post-rift boundary [
37,
40,
45]. The Late Badenian sea-level rise, due to re-opening of the Indo-Pacific seaway [
46], caused flooding of uplifted blocks that previously formed islands. The lateral thickness changes and existence of several discrete areas of thicker deposits within the basin suggest that during the Badenian, the growth of accommodation space was not accompanied by increased sediment supply [
38]. Sarmatian deposits mostly cover upper Badenian deposits in a continuous depositional succession [
27]. During the latest Badenian, the sea-level fall caused erosion of newly formed islands and resulted in the deposition of shallow-water gravel, calcarenites, and limestones [
27]. In Sarmatian, after the termination of extension, the thermal subsidence took place, resulting from isostatic sinking of the thinned crust [
47]. Subsidence caused widening of the basin and the sea-level rise caused flooding of the land, resulting in a transgressive contact usually atop of Upper Badenian sediments [
27]. Consequently, Sarmatian is characterized by sedimentation of fine-grain deposits, with only sporadic occurrences of sands that were brought to the basin by gravity flows [
48,
49]. Rare occurrences of bentonites, presumably resulting from the alternation of volcanic glass, suggest decreased volcanic activity during the post-rift phase [
27]. During the latest Sarmatian, a general shallowing trend is indicated by the presence of sandstones and conglomerates [
27,
50,
51].
Isolation of Paratethys from the open sea that started during the Sarmatian resulted in a decrease of salinity that marked a transition from Sarmatian to Pannonian [
46], causing the regional Sarmatian–Pannonian Extinction Event [
52]. Pannonian is characterized by the development of endemic molluscs in the newly formed Lake Pannon [
50]. During the Pannonian, the stress orientation N-S in CPBS conditioned reactivation of sinistral transtensional zones in the area NW of the Medvednica fault zone with extension E-W [
53]. Displacement along the normal faults on the southern margins of the Sava and Drava Basin enabled widening of half-grabens, reaching all the way to the Slavonian Mountains, where the first signs of uplift were observed [
38,
54]. The expansion of the accommodation area was accompanied by an increase in the sediment supply. The regression at the end of the Sarmatian resulted in a shallow lacustrine environment at the beginning of Pannonian, so the oldest Pannonian deposits are represented by limestones and calcareous marls, with sporadically present sandstones deposited in minor deltas along the margins of the basin [
40]. In the western part of the Drava Basin, the first turbidite sandstones occur. Upper Pannonian is characterised by deposition of sandstone–marl sequence [
55,
56]. In the western part of the Drava and Sava Basins, the sedimentation took place in deep troughs that were largely isolated from the rest of the Pannonian basin by islands or by subaqueous basement highs. The deposited sequence is rather uniform, comprising subgreywackes and calcarenite–subgreywackes interlayered with silts and marls [
40]. This sequence is overlain by Uppermost Pannonian sediments represented by delta front sands with intercalations of delta plain gravel and coal layers, resulting from the final infilling and closing of the lake [
27].
The neotectonic phase in the Pliocene and Quaternary is characterized by compressional deformations [
57,
58]. The regional stress orientation changed to NNE-SSW after [
39] marked compression of the area took place and dextral transcurrent displacements occurred. Remnants of Lake Pannon have been filled during the Pliocene and Quaternary with coarse clastic sediments mixed with clay, with occurrences of lignite seams formed in delta plain marshes [
59]. In the Quaternary, meandering river systems predominated with deposition of sandstones and gravels as channel fills [
40]. During the Pleistocene glacial periods, loess deposits were sedimented, with aeolian quartz sands present in the western part of the Drava Basin. During interglacial periods, sedimentation of lacustrine–marsh sediments took place [
40].
Total thickness of Neogene–Quaternary deposits within the CPBS can reach up to 7 kilometres [
36,
40]. The significant sediment accumulation, coupled with an elevated geothermal gradient [
36,
60,
61,
62], formed favourable conditions for forming hydrocarbon accumulations and utilization of geothermal energy.
Source rocks within the CPBS are primarily related to Middle and Upper Miocene formations, as documented by various studies [
63,
64,
65,
66]. These formations are predominantly composed of marls containing type II kerogen, which has excellent generative potential for liquid hydrocarbons [
65,
66,
67]. There are a few older stratigraphic intervals of source rocks on the margins of the CPBS, but these are scarce [
68].
According to [
63], assessment of source rocks from the eastern part of the Drava Basin was conducted using conventional geochemical analyses on the substantial quantity of core samples, drill cuttings, oils, and gases sourced from over 30 wells. TOC exhibited a range between 0.6% and 6%, with source rock sequences shallower than 2000 m demonstrating low TOC contents due to partially oxidized organic material [
63]. Conversely, an increase in organic matter concentration was connected to carbonate-rich pelitic sediments. Rock Eval analyses indicated favorable source rocks with a substantial potential for hydrocarbon generation (S1 + S2), values surpassing 30 mg HC/g rock [
63]. Overall, the hydrocarbon potential of the source rocks is heterogeneous. Variations in organic matter content were attributed to decreased biomass production and alterations in depositional environments, confirmed by the presence of thinner layers of highly oxidized sediments [
63].
Organic facies characterization, based on visual kerogen assessments, revealed a prevalence of amorphous kerogen alongside increased exinite content, with hydrogen indices (HI) ranging from 400 to 650 mg CH/g TOC [
63]. Organic constituents exhibited characteristics indicative of oil-prone, type II kerogen. Vitrinite was detected only in trace amounts, though some terrigenous influences were attributed to hydrogen-rich lipids—specifically sporinite and resinite [
63].
Regarding the analysis of source rocks from outcrops, data availability is quite limited. Zečević et al. [
67] conducted a study on a restricted number of Badenian source rock samples from the Bukova Glava location. The TOC in collected samples varied from 0.48 to 13.5% TOC. Some of the samples, having kerogen type III, exhibited low generative potential, their organic matter being partially changed by oxidation. In contrast, samples with kerogen type II showed high TOC values and fair generative potential based on Rock Eval Pyrolysis results [
67]. All these potential source rocks are found to be in an immature state, indicating that they have not yet undergone sufficient thermal maturation for hydrocarbon generation [
67]. Consequently, outcrop sections primarily reflect original depositional and early diagenetic controls on organic matter accumulation rather than thermal overprinting. This makes them suitable for evaluating sedimentary controls on TOC preservation and for testing how such controls are recorded in surface gamma-ray signatures.
4. Results
4.1. Stratigraphy and Lithofacies Determination
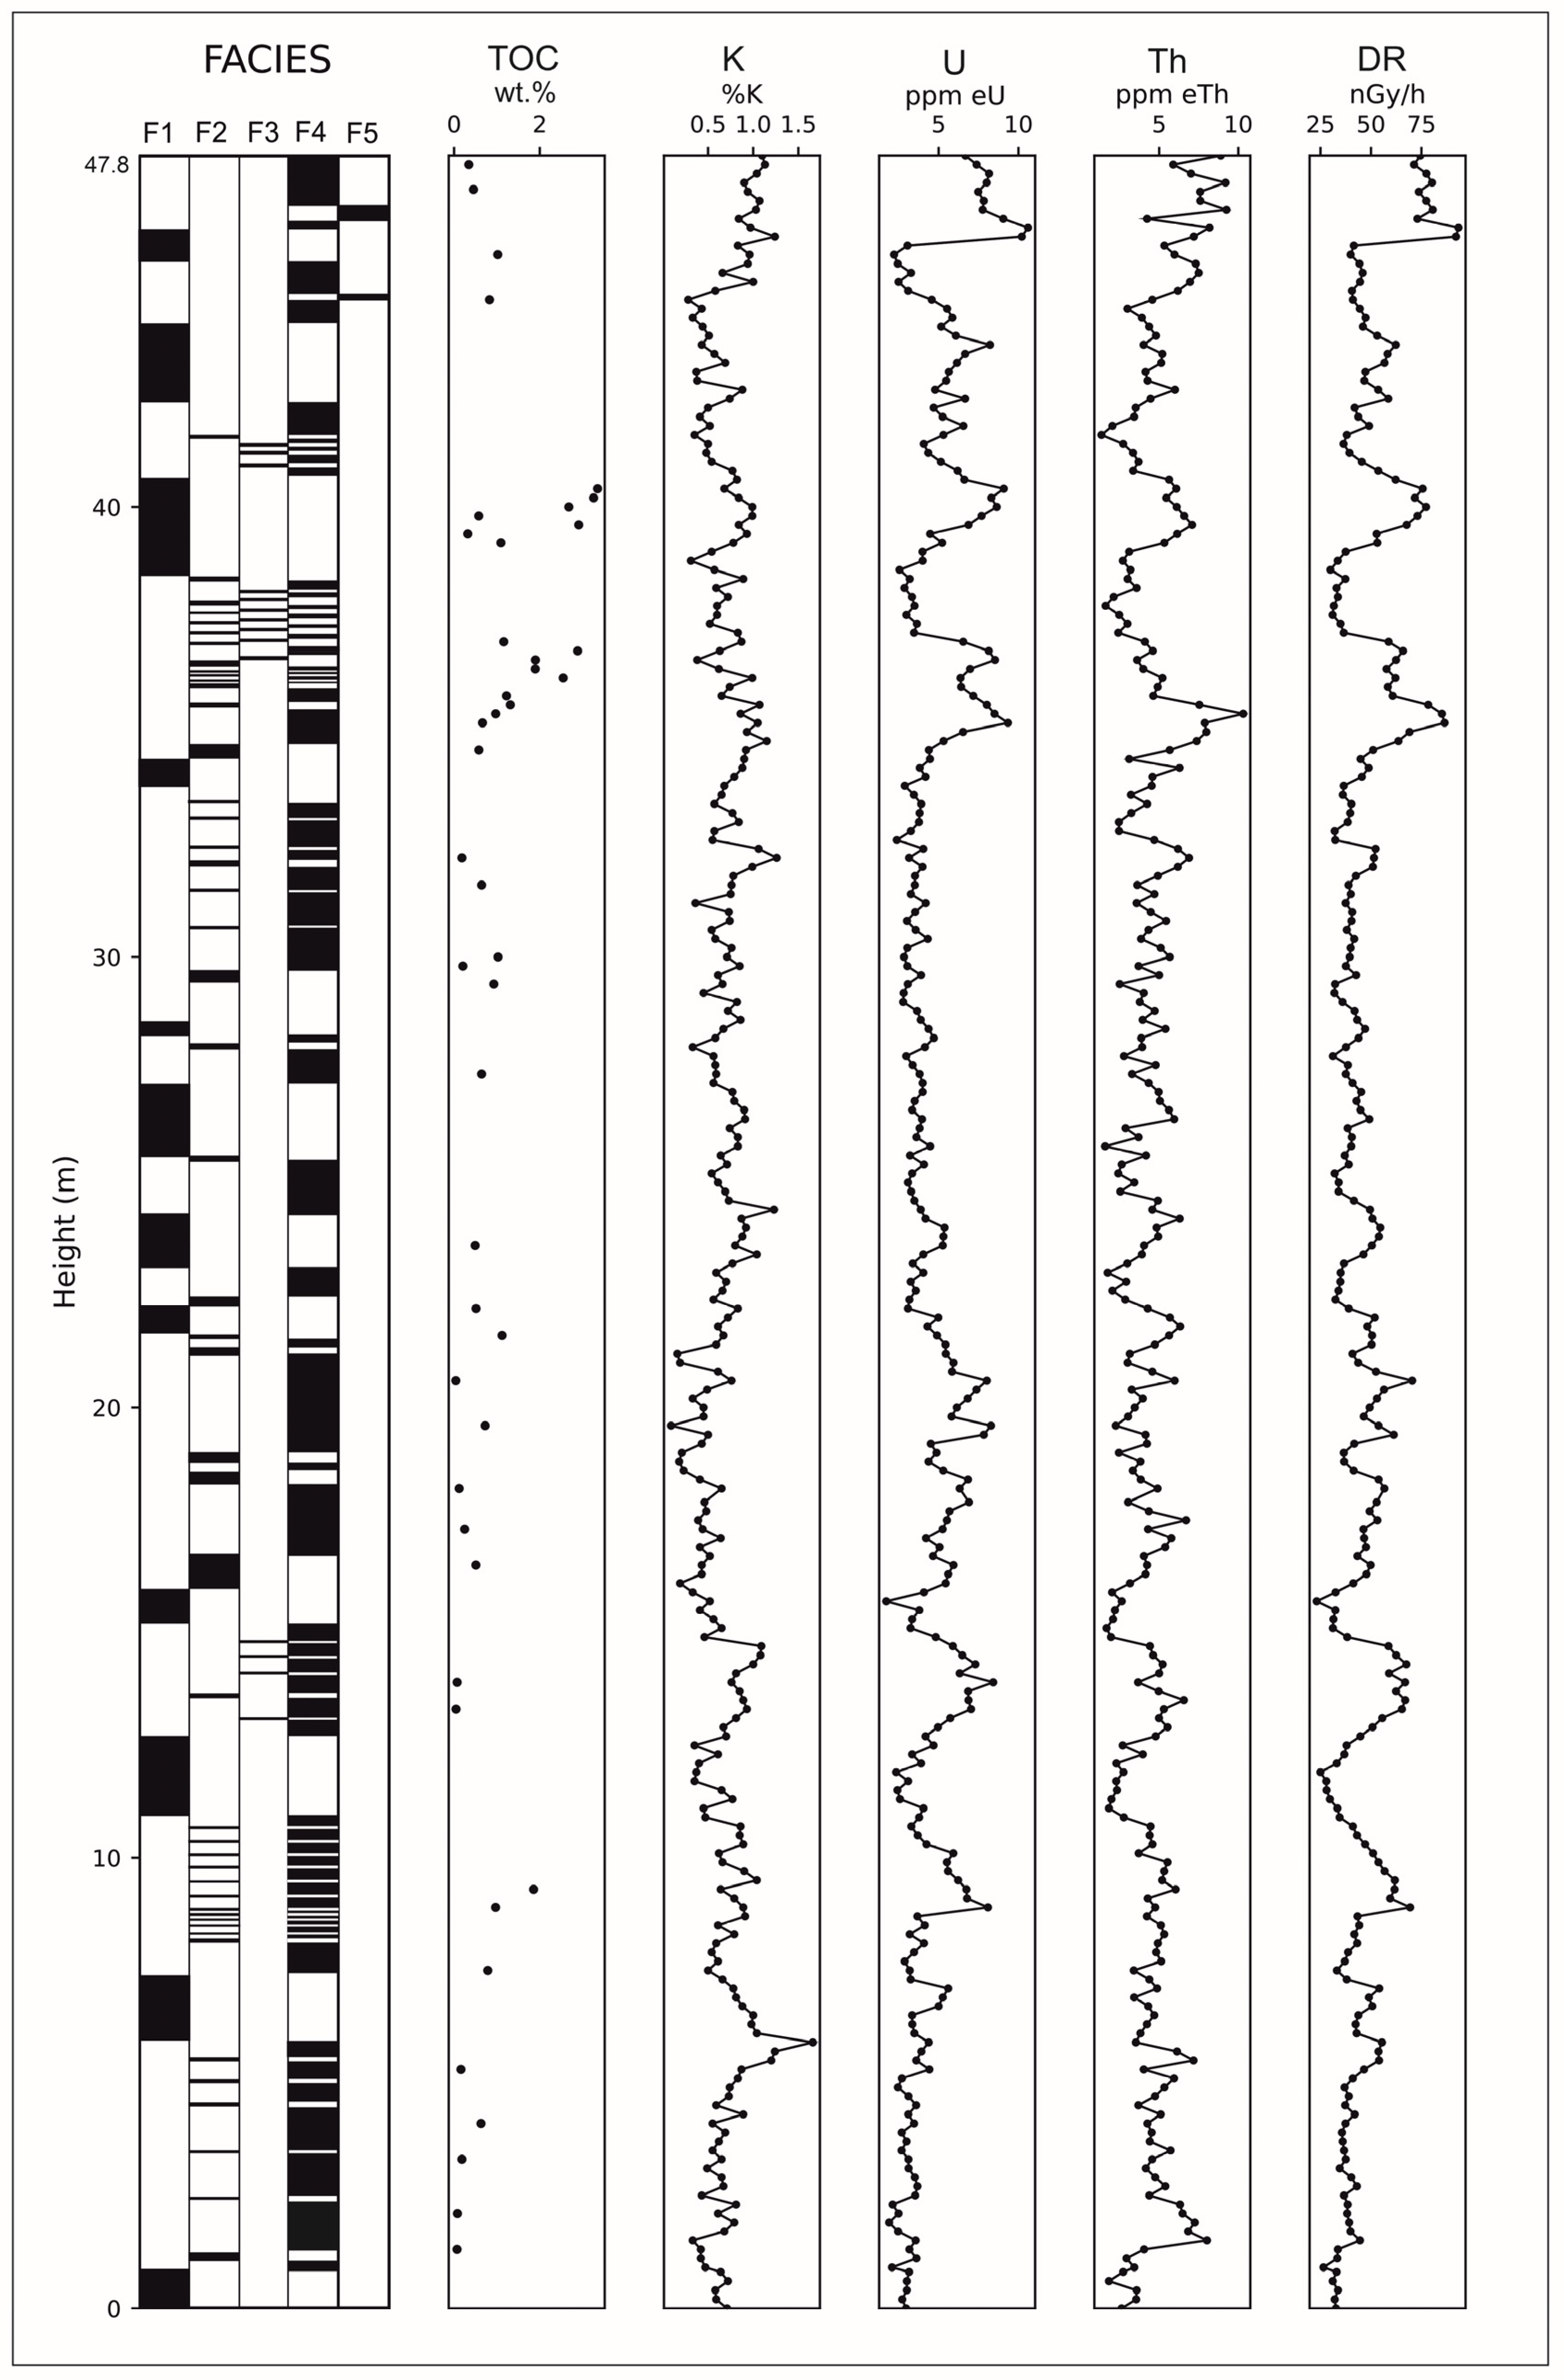
Sedimentary succession Voćin (
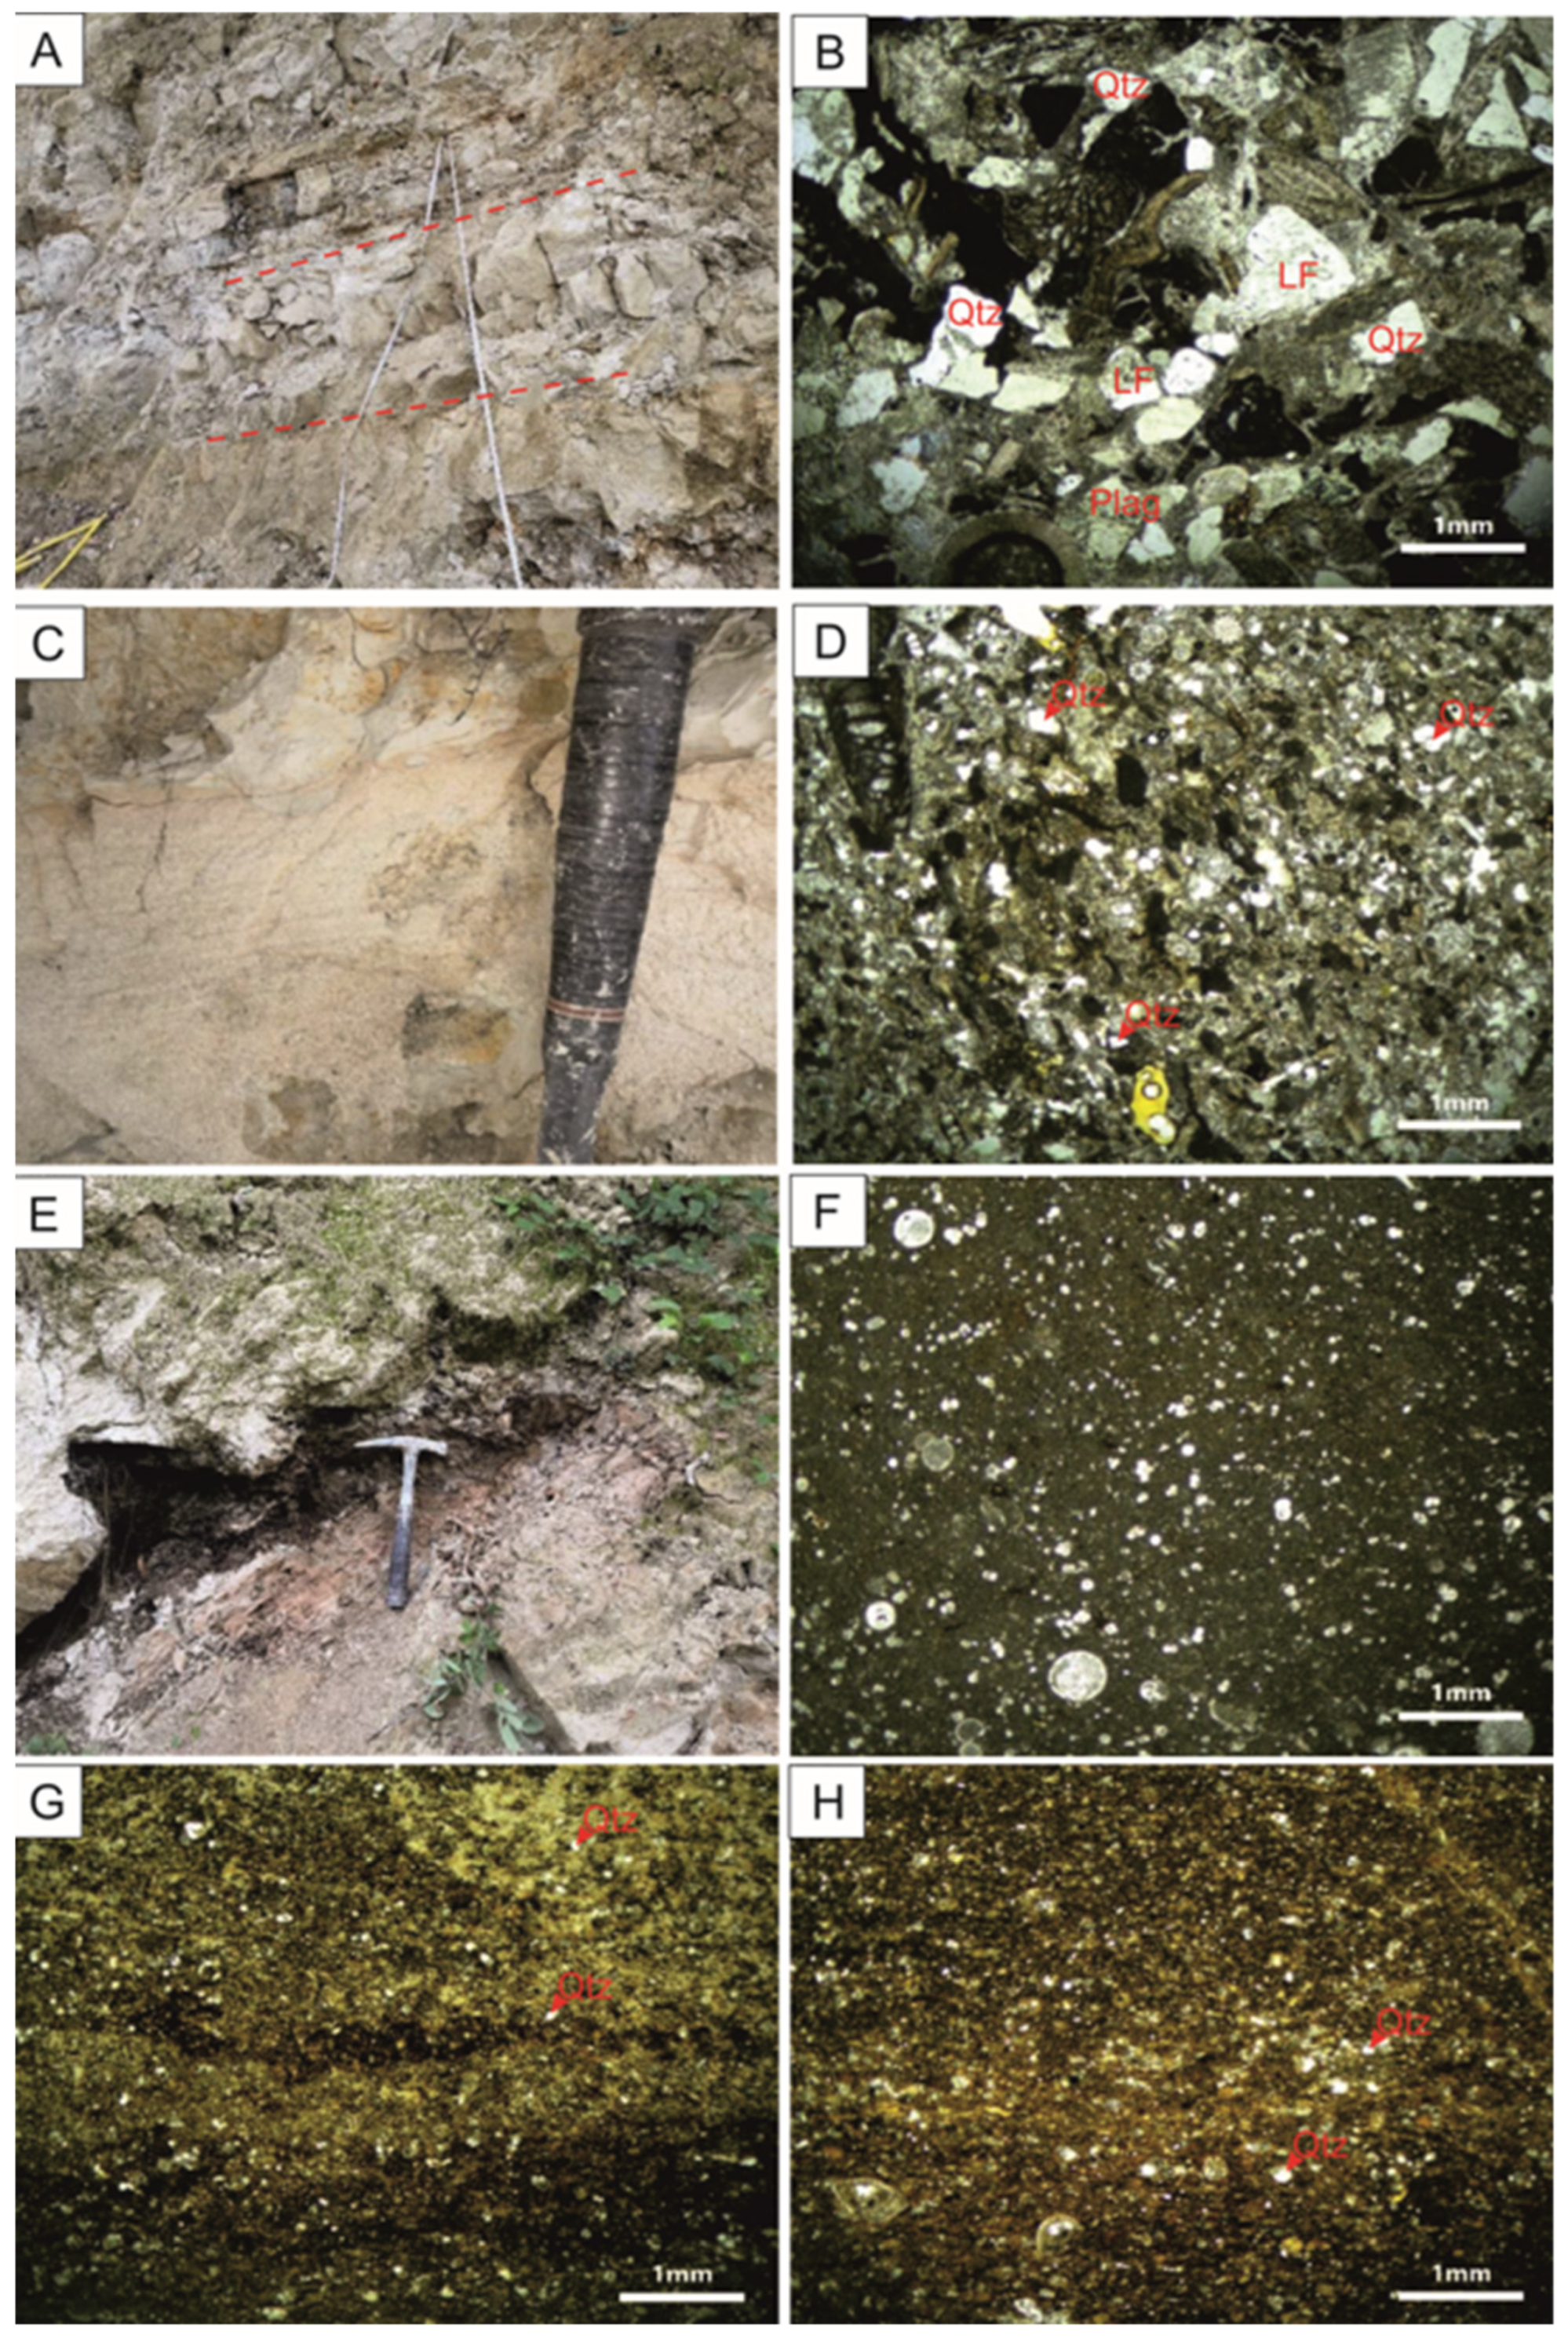
Figure 2) is 47.8 m thick. Based on lithological differences, five different lithofacies have been determined: biocalcrudite (F1) and biocalcarenite (F2) interbedded with siltstone (F3) and marl (F4), with rare occurrences of limestone (F5) in the upper part of the column, with representative examples shown in
Figure 3.
Biocalcrudite lithofacies comprise coarse, up to several cm large lithoclasts, bioclasts, and siliciclastic grains. Clasts are usually unsorted and have a bimodal texture in terms of grain size and are matrix-supported. Bioclasts belong to red algae Lithotamnium, benthic foraminifera, bivalve shells, gastropods, echinoids, bryozoans, brachiopods, and plankton foraminifera. Red algae, bivalve, and bryozoan fragments reach up to 5 mm in size. Bioclasts occupy around 50% of the samples. Lithoclasts of limestone, marlstone, and effusive rocks are present. Limestone lithoclasts are up to 2 mm in size and belong to different limestone types (micritic limestone, biomicrite, biosparite). Marlstone lithoclasts reach up to several cm in size; they often exhibit plastic deformations and are well-rounded. Effusive lithoclasts have porphyry texture and are composed of plagioclase phenocrystals in the hyaline effusive matrix. Medium-grained clasts are also present and dominantly belong to quartz grains of 1 to 2 mm in size, followed by K-feldspar and plagioclase, and rare biotite grains. Dark, organic-rich clasts are also seen in layers of this lithofacies. Between the coarse-grained clasts, finer-grained carbonate material is present as the matrix. Some biocalcrudite layers exhibit a fining upward trend.
Biocalcarenite lithofacies is composed also of bioclasts, lithoclasts, and siliciclastic grains. The origin and composition are the same as in the biocalcrudite lithofacies, with the only difference in clast size. In this lithofacies, clasts are usually very well-sorted, well-rounded, and tightly packed. Often, horizontal and cross-lamination is seen. Some layers exhibit fining upward sequences.
Siltstone lithofacies is composed of silt-sized carbonate bioclasts and lithoclasts, as well as siliciclastic grains. Grains are very well-sorted. Siltstones are sometimes horizontally laminated or graded with a gradual transition into marls.
Marlstone lithofacies is dominant in the entire succession. Marlstone colors vary from white, gray, dark gray, reddish, and brownish. Several lithotypes of marlstones have been recognized: homogenous marlstone, silty marlstone, sandy marlstone, and laminated marlstone.
The homogenous marlstone is homogenous in texture, often containing planktonic foraminifera. Sometimes these foraminifera are filled with dark organic matter. Scarcely echinoid, bivalve fragments, and fish scales are present in such marlstone. Silty marlstone has a homogenous-to-heterogenous texture with around 10% of silt-sized detrital quartz grains. In heterogeneous varieties, clay components can be concentrated in specific areas of the sample, seen as dark molds and nodules. Some layers have inverse grading, with the silt component increasing towards the top of the interval. Some samples exhibit silicification in the form of irregularly dispersed fine crystalline quartz aggregates. Thin-shelled bivalves and planktonic foraminifera are usually present, while rare benthic foraminifera and echinoid fragments can be observed. Sandy marlstone is composed of a homogenous calcite–clay mixture with randomly incorporated sand-sized grains. These grains belong to quartz and K-feldspar and occupy up to 15% of the sample volume. Rare planktonic foraminifera are seen in this lithotype. Laminated marlstone is characterized by an alternation of silt/calcarenite and marlstone lamina in the form of horizontal lamination. In the marl lamina, planktonic foraminifera can be frequently observed. Fine- to medium-grained particles concentrated in the laminae belong to quartz, feldspar, limestone, and effusive magmatic rock lithoclast grains. Some laminae are very rich in dark organic matter.
Limestone lithofacies is found only in the upper part of the Voćin succession. It is composed of very dense and homogenous micritic limestone. Around 5% of quartz grains of silt size and rare microgastropod shells are present.
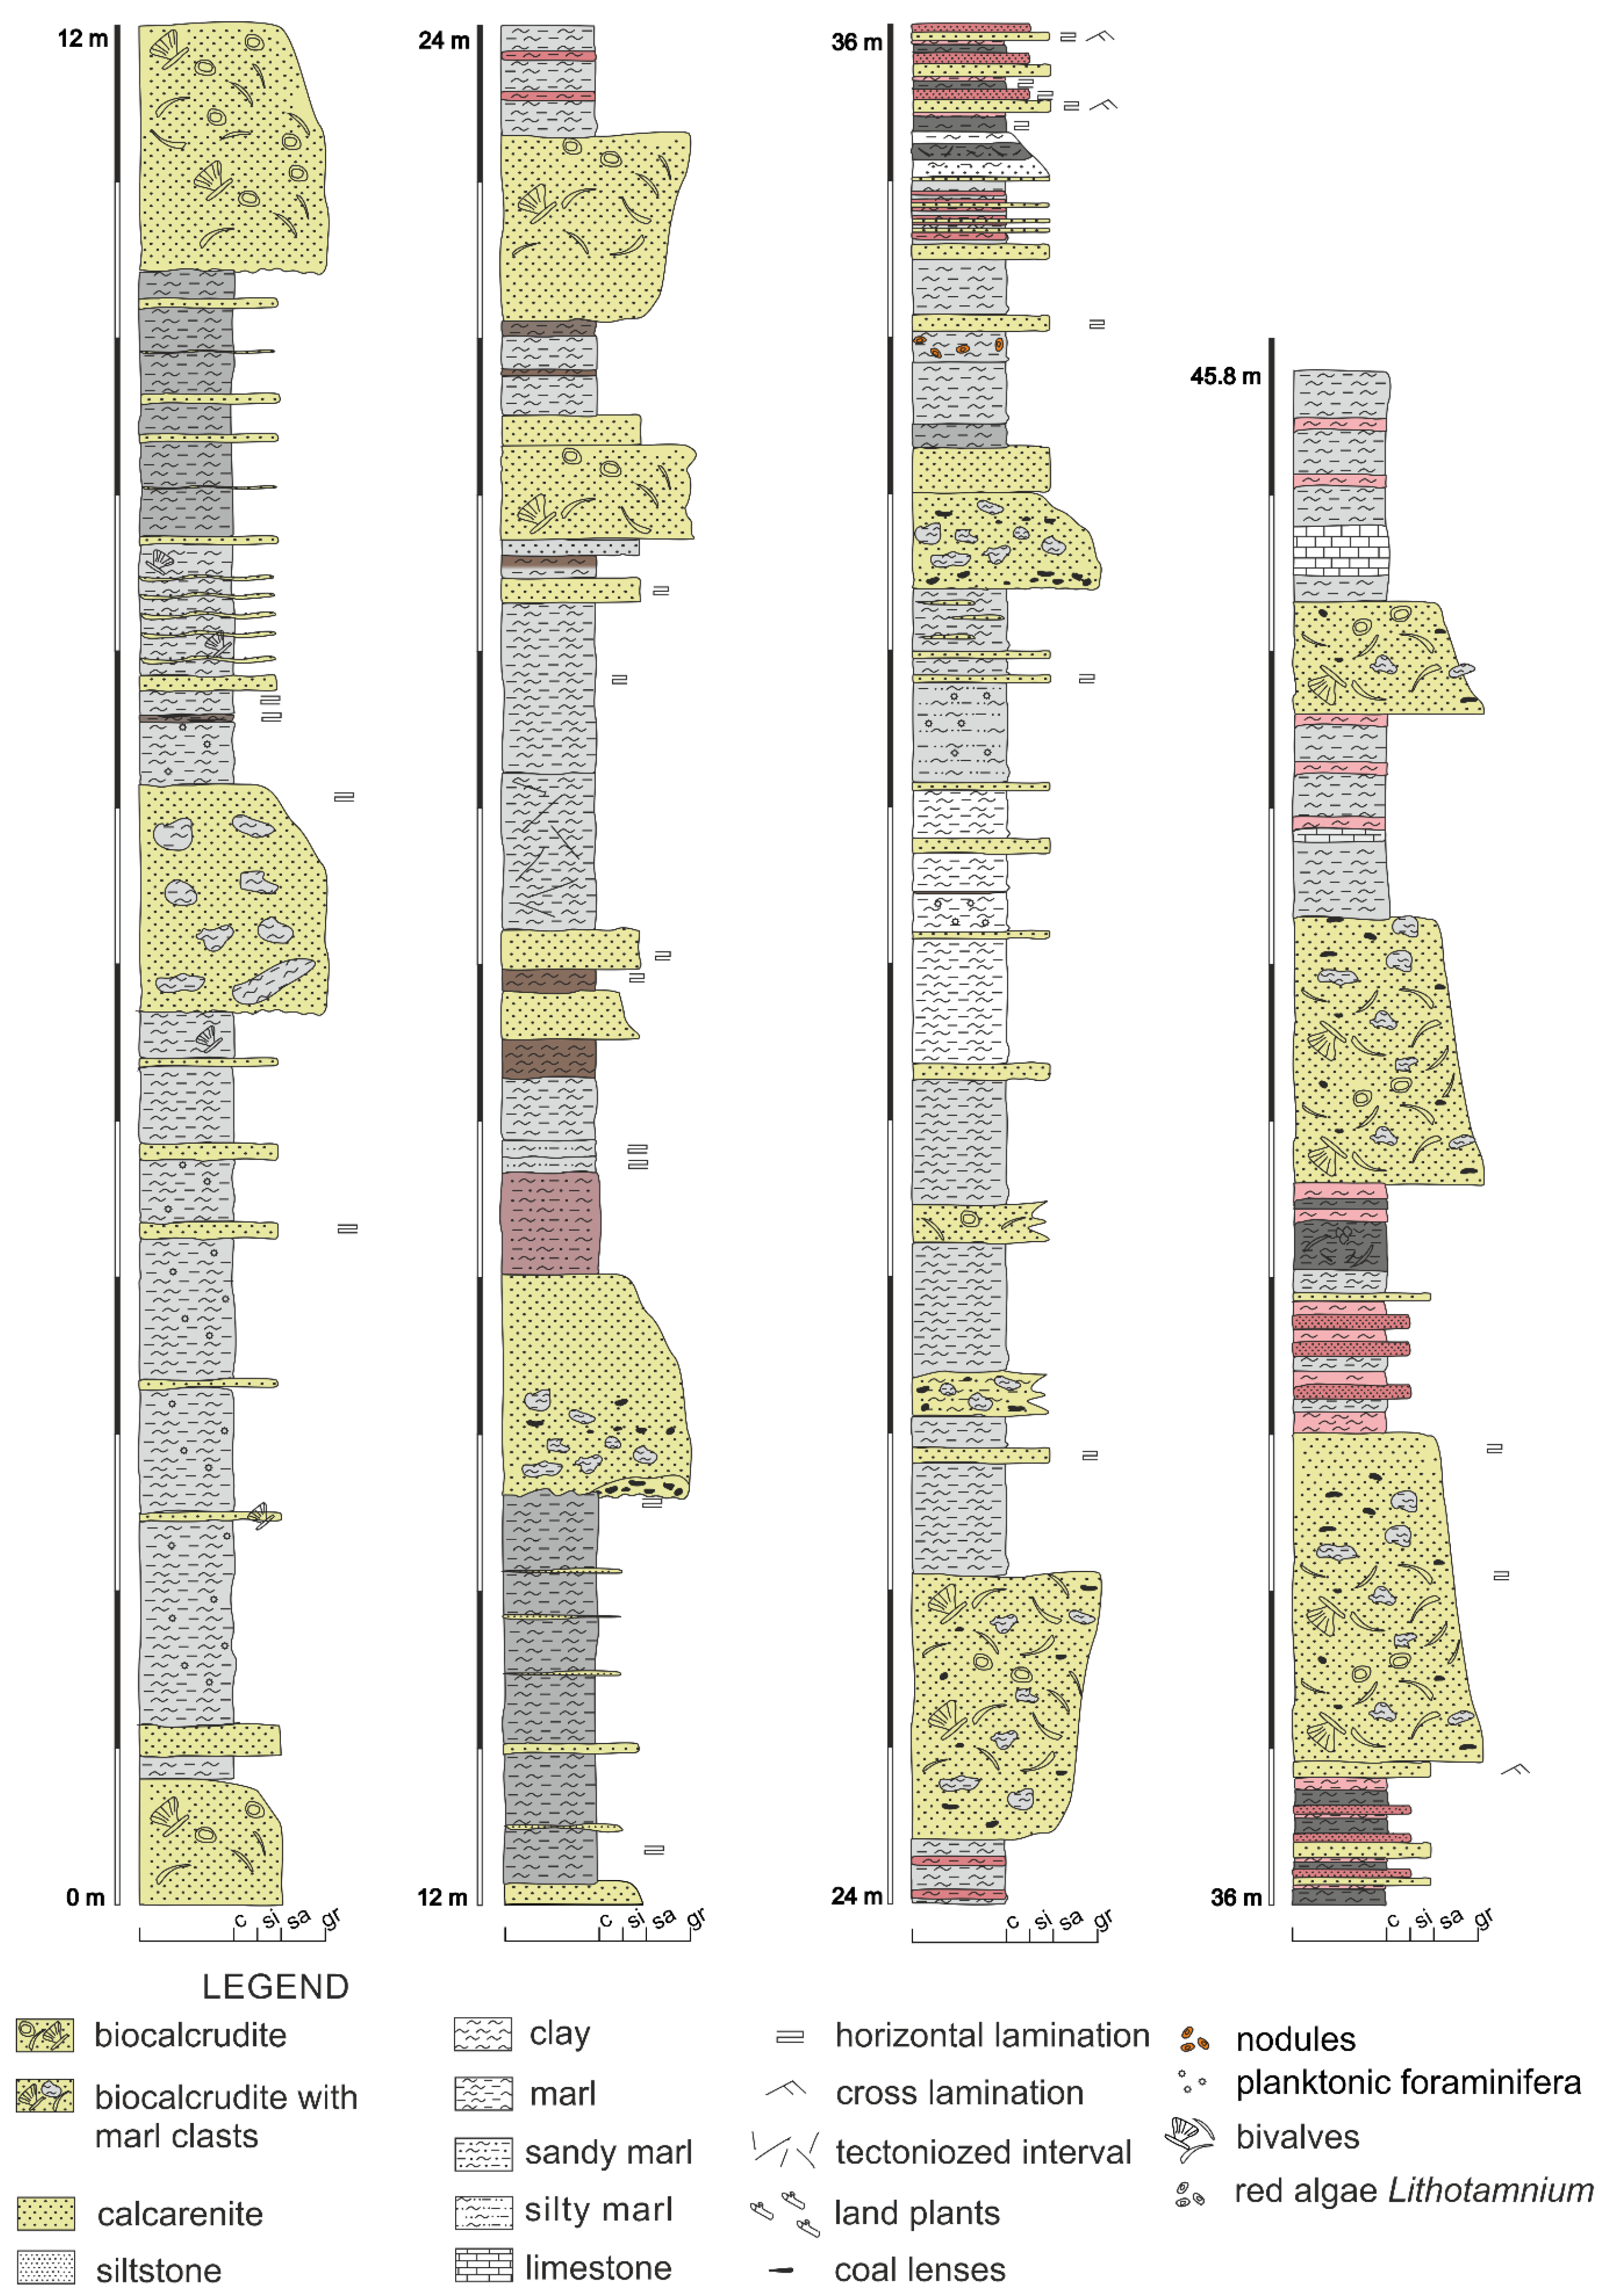
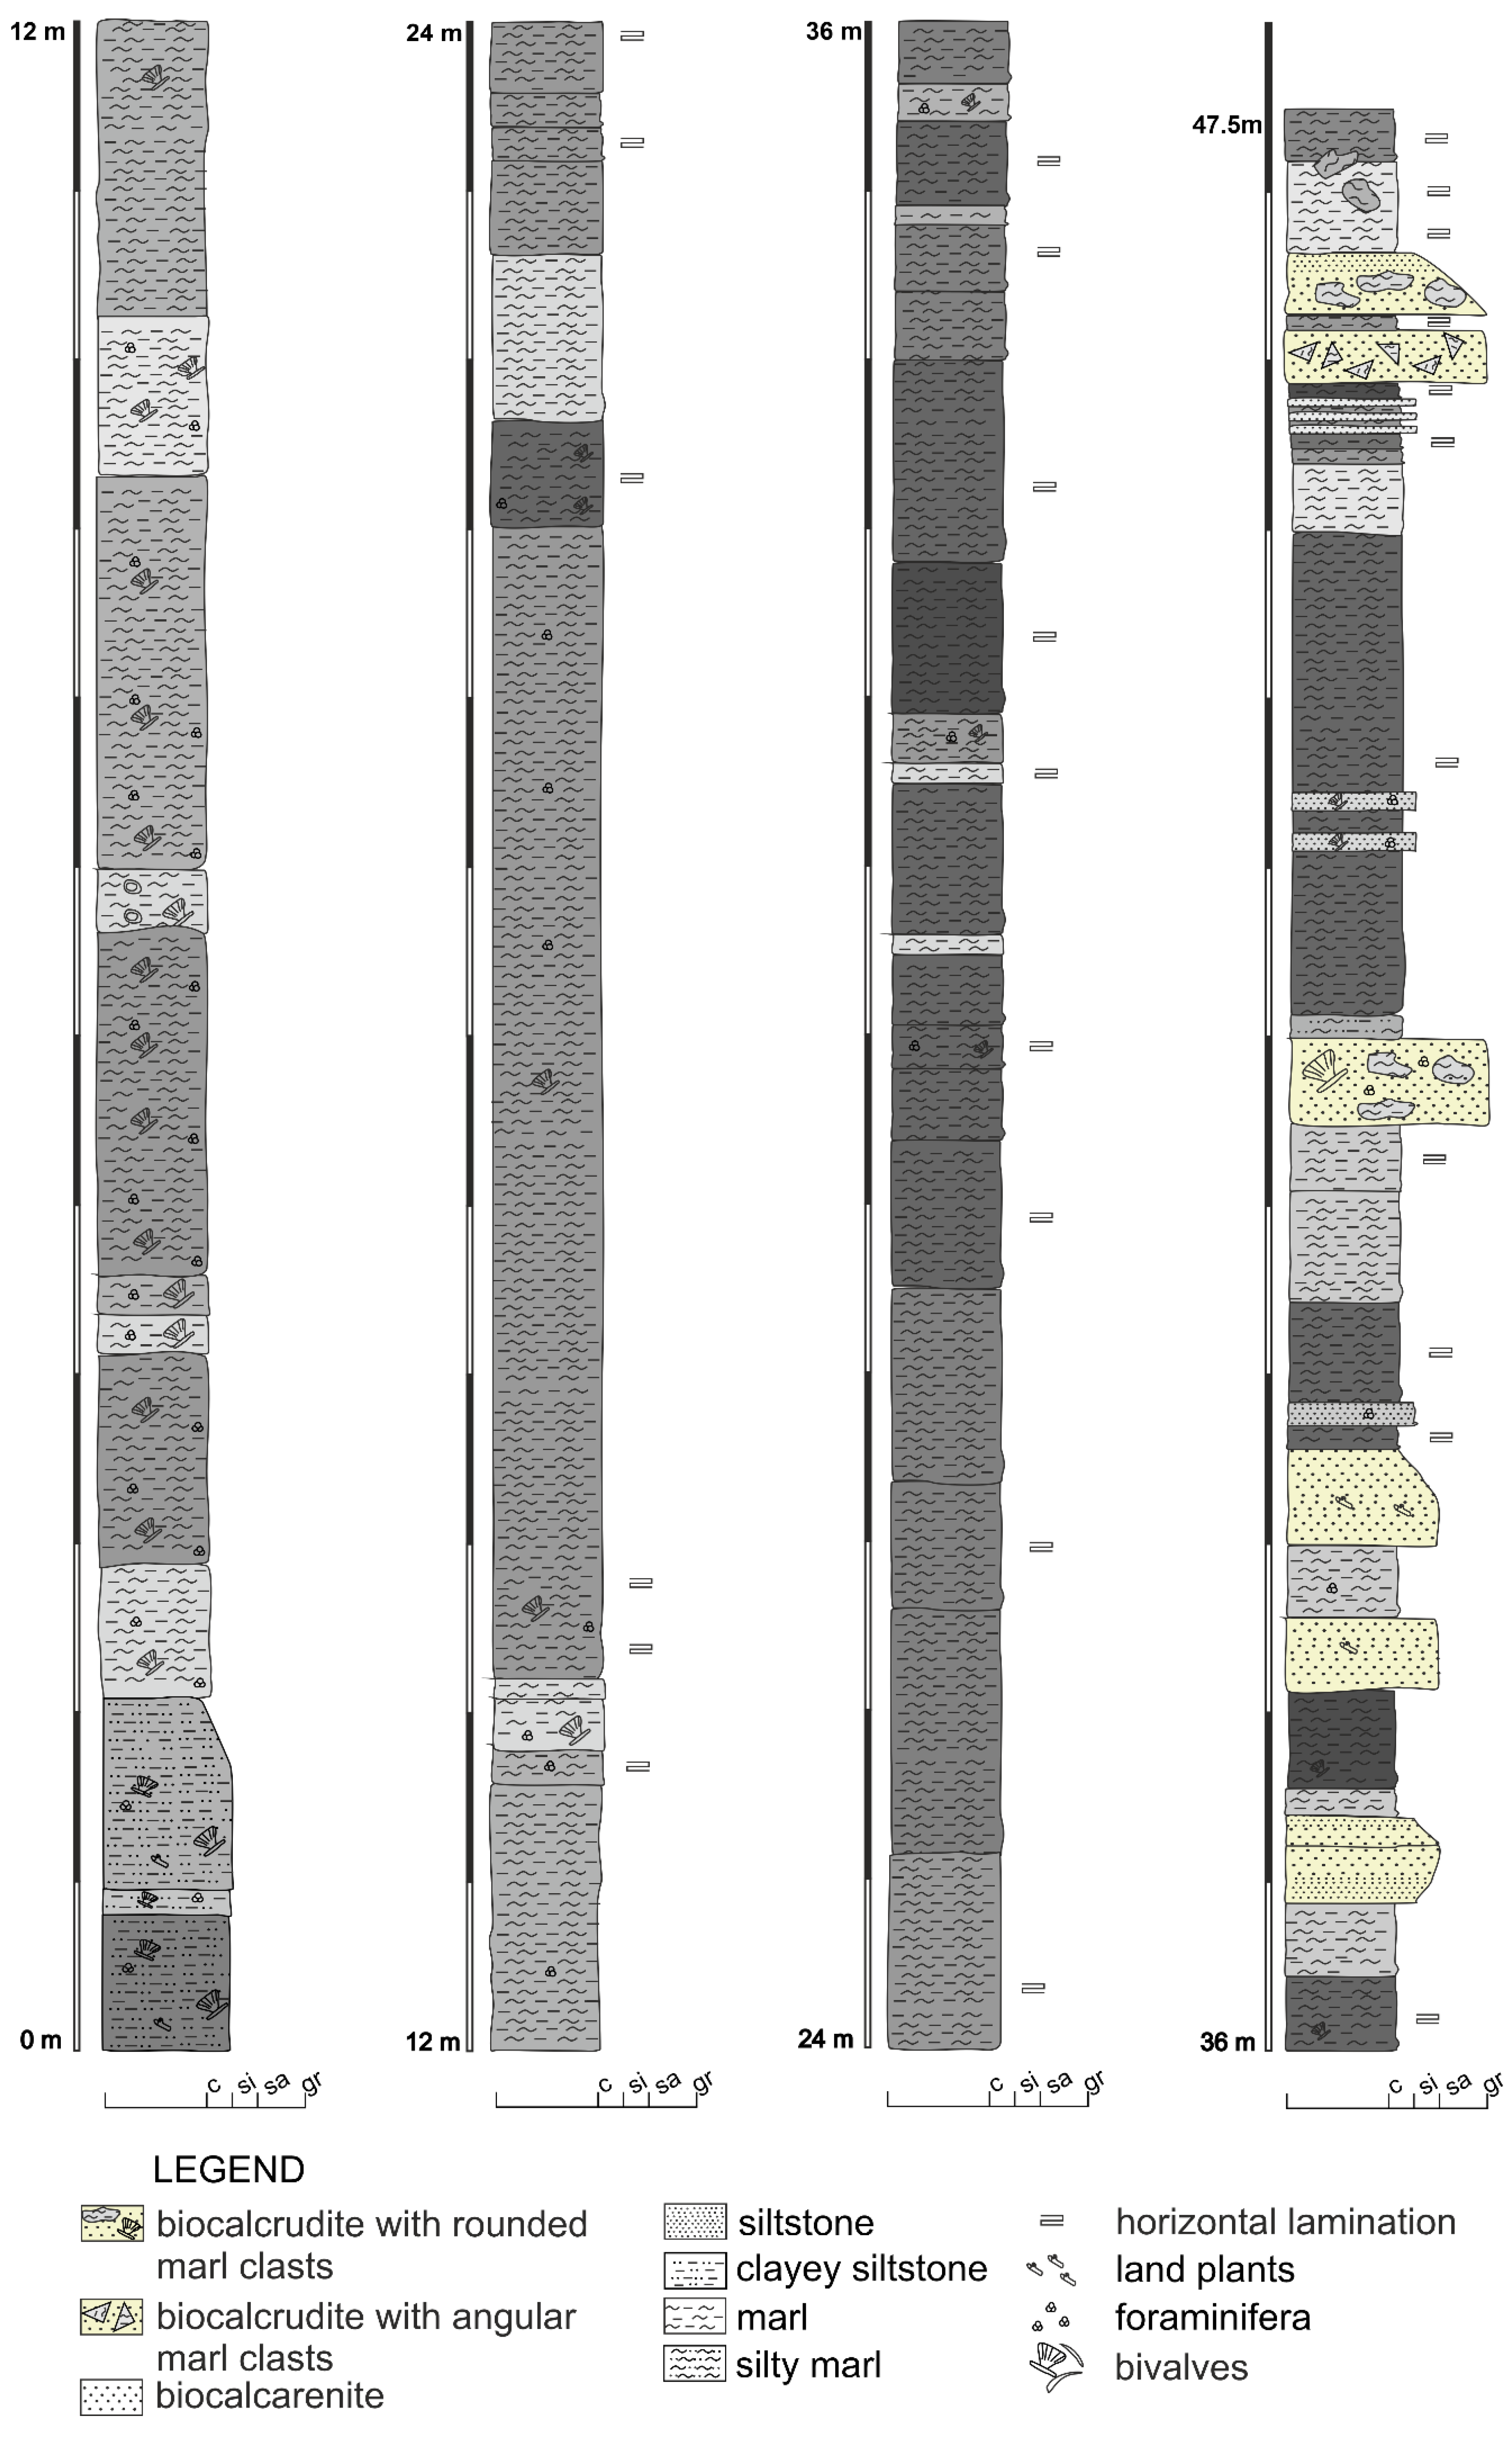
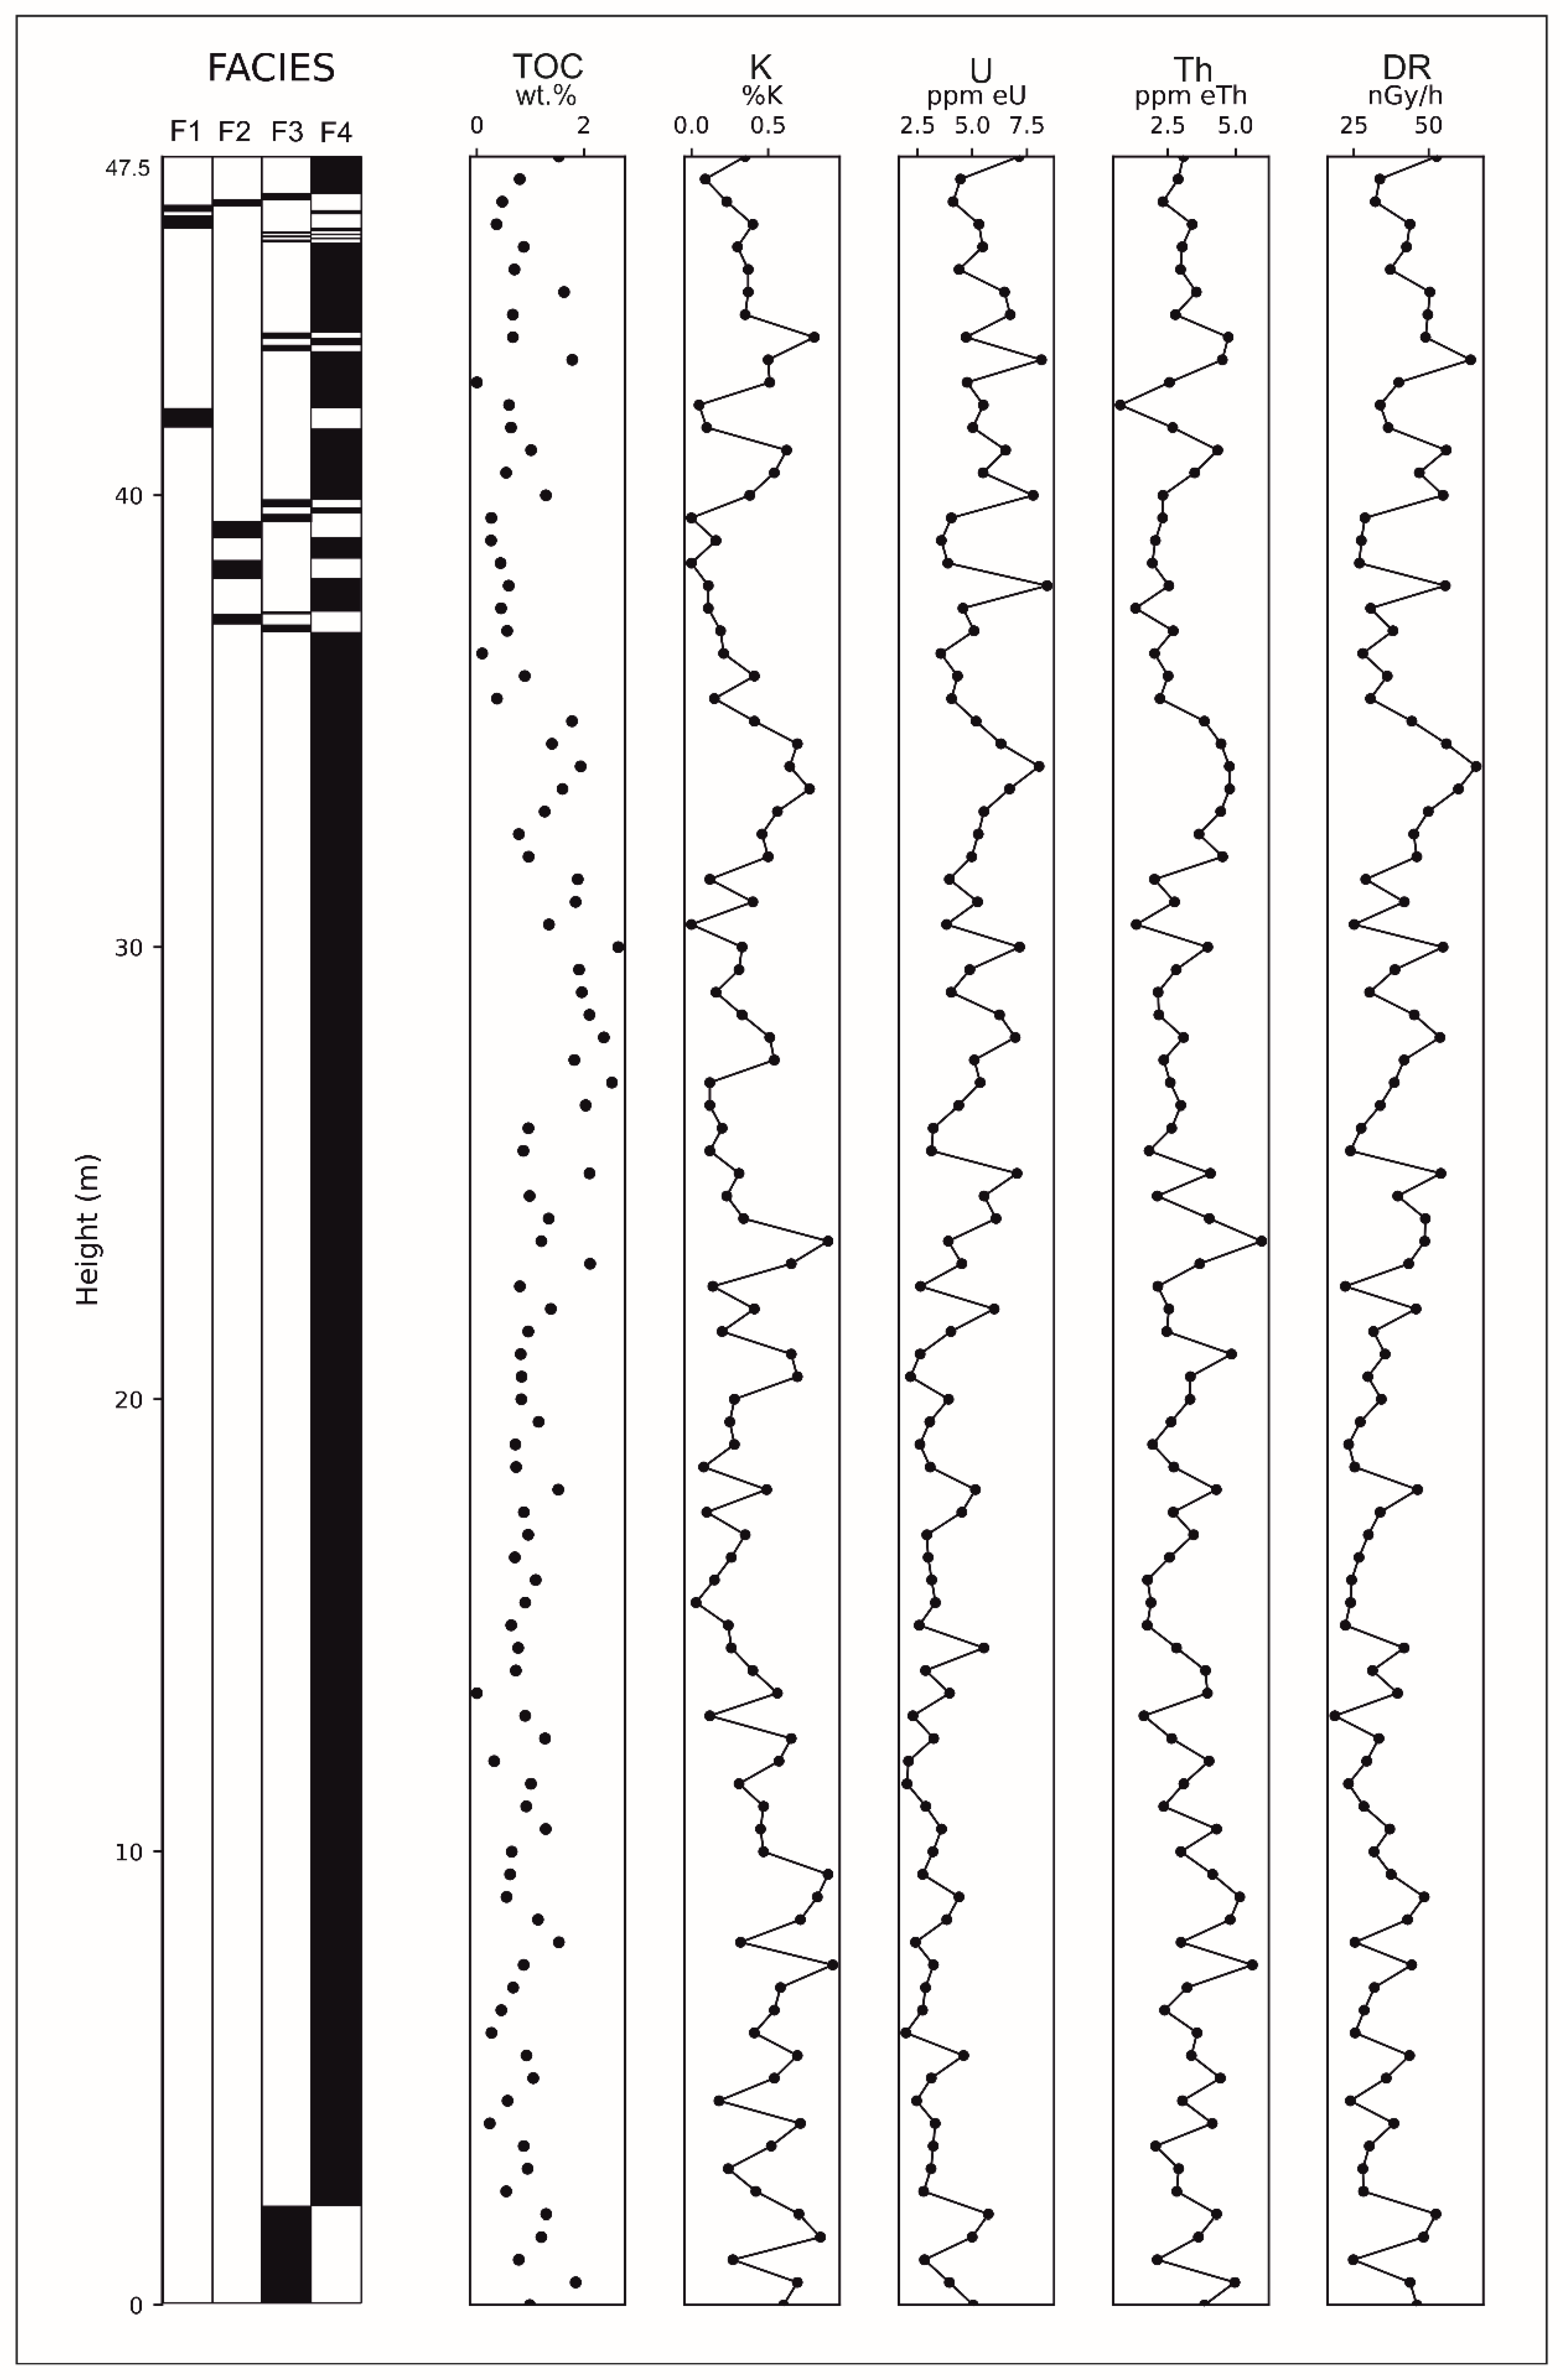
The Podsused section (
Figure 4) consisted of a 47.5 m long continuous deposit of Middle Miocene (presumably Sarmatian). The section is predominantly composed of marls and silty marls of light grey to dark grey colour. Sporadic occurrences of biocalcrudites, biocalcarenites, and siltstones can be observed in intercalations with the aforementioned marls.
In the entire
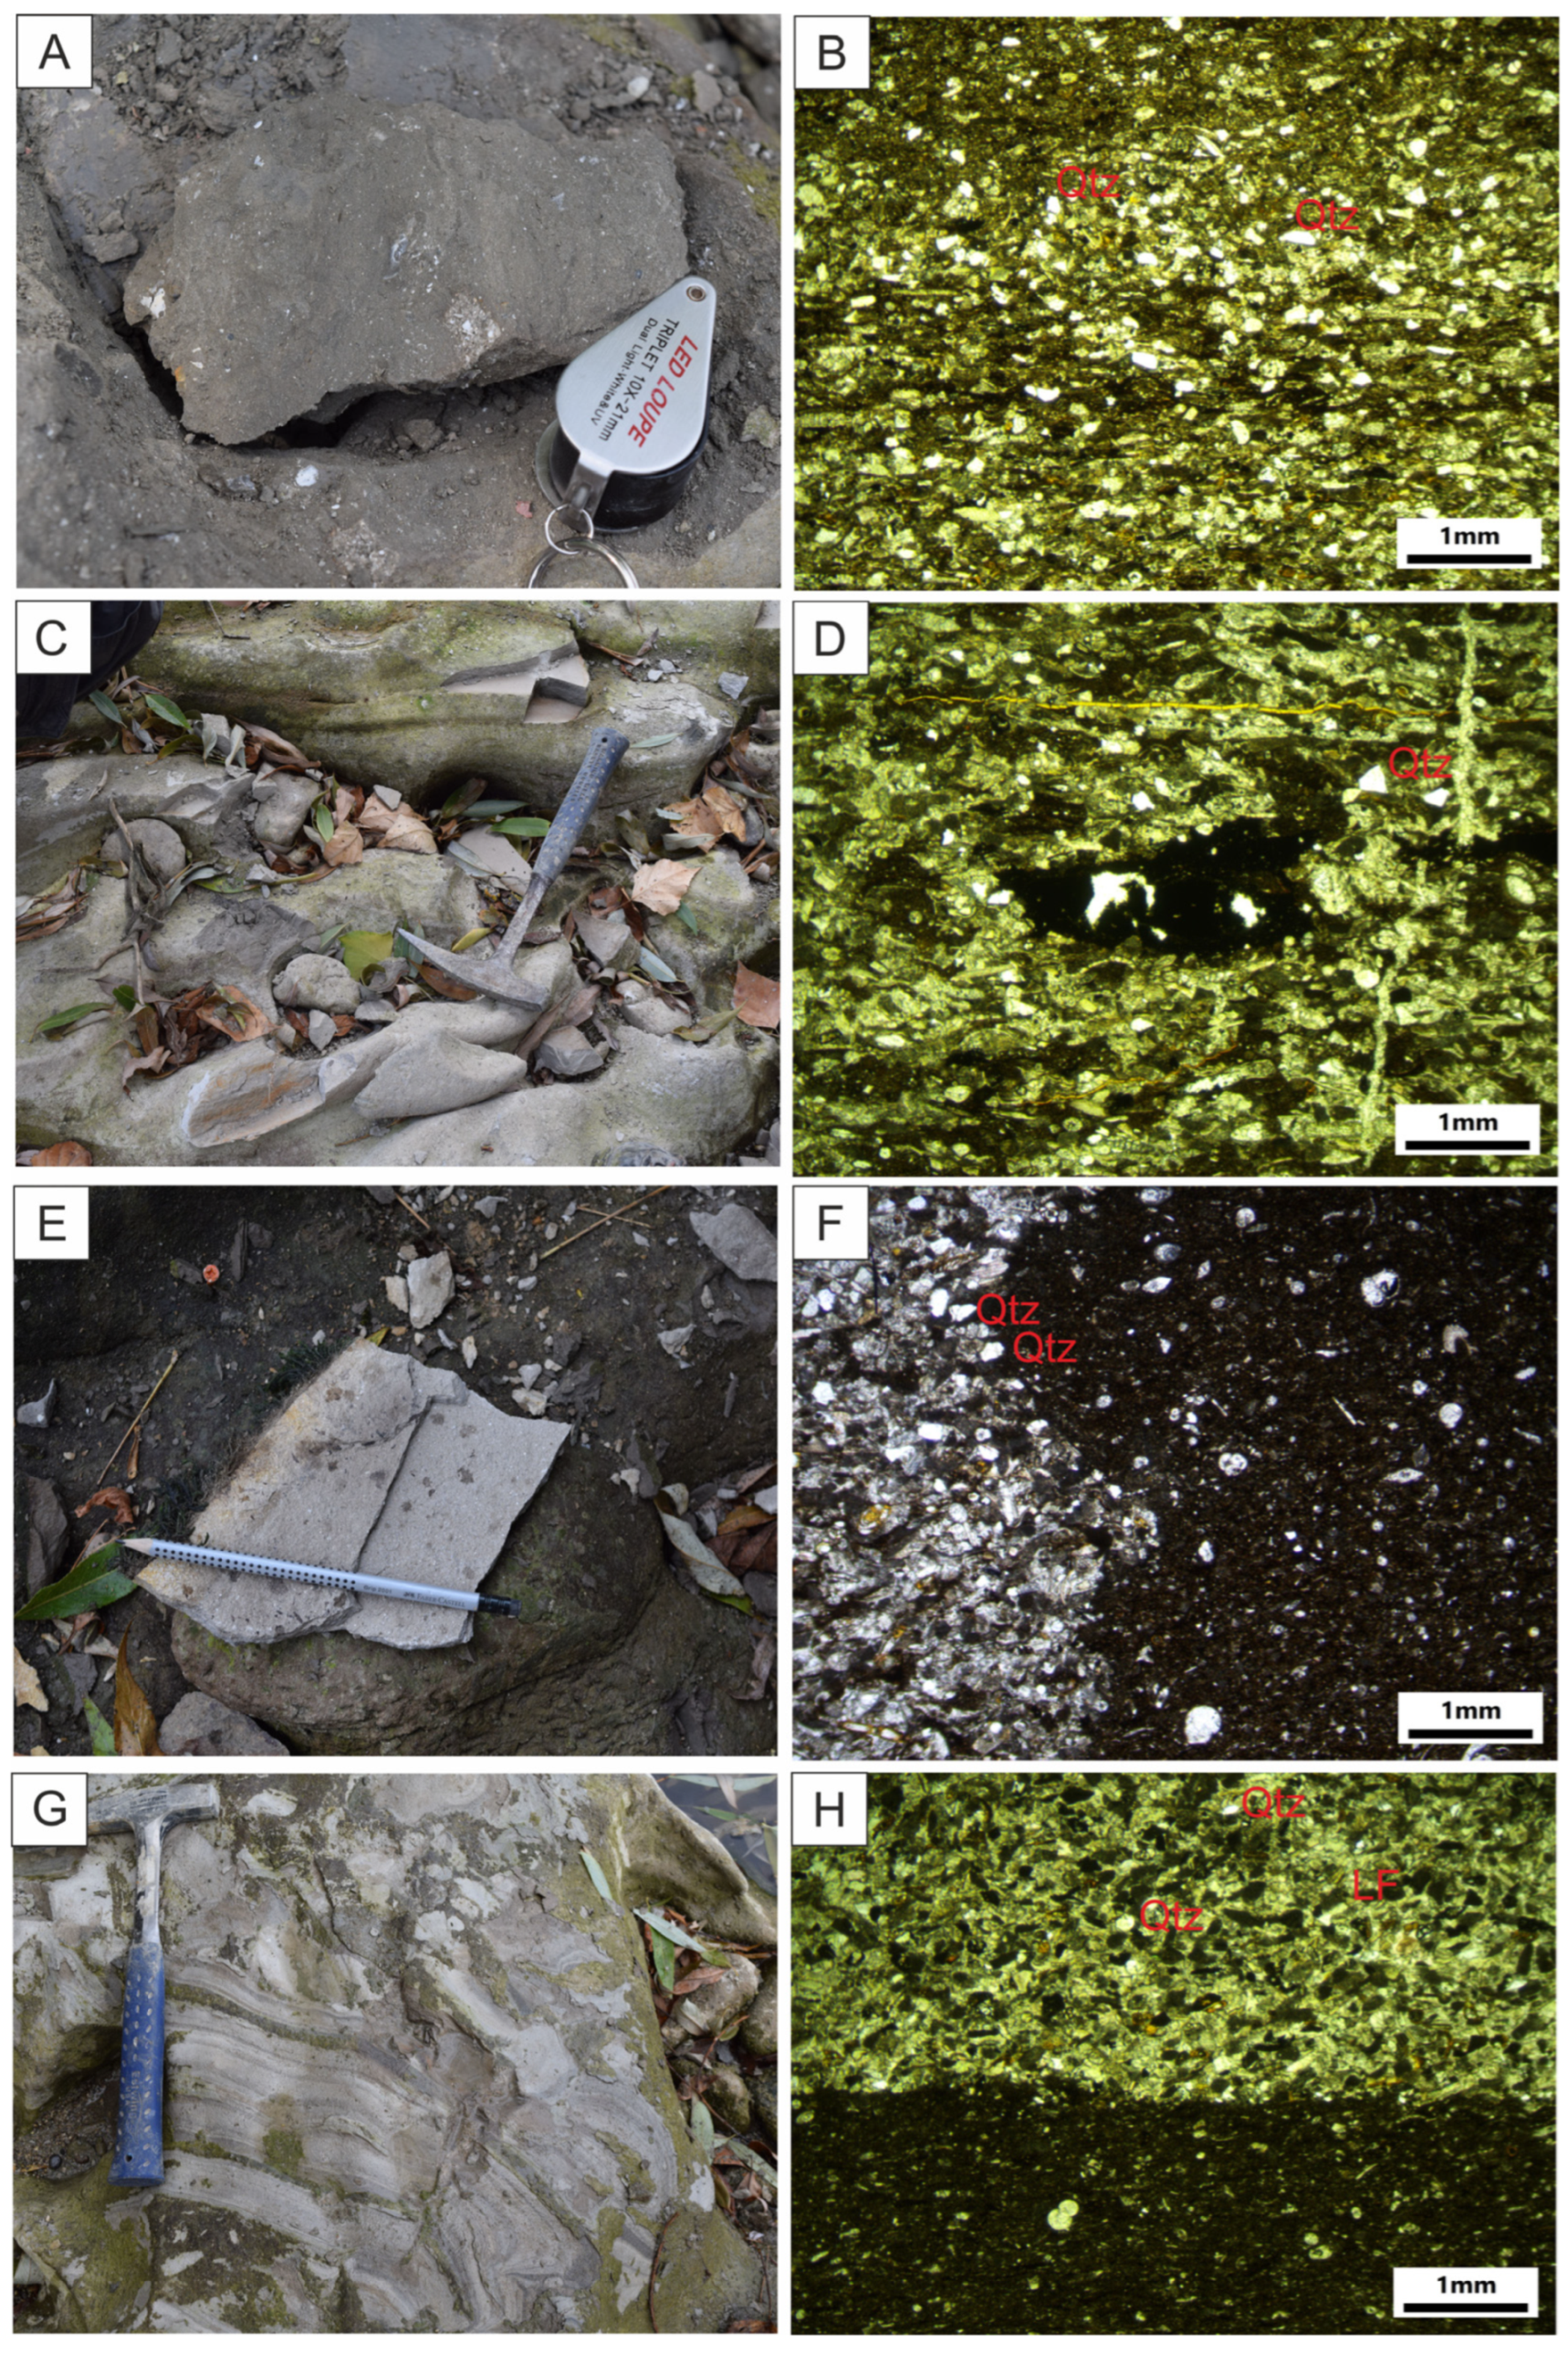
Section 4, lithofacies have been determined, with representative examples seen in
Figure 5: biocalcrudite (F1), biocalcarenite (F2), siltstone (F3), and marlstone (F4). Biocalcrudite lithofacies in the Podsused succession is very similar to that of the Voćin succession. The main difference is the presence of plant debris and sometimes very angular clasts of marlstone, forming the breccia lithotype. The thickness of such individual layers ranges from 20 to 50 cm.
Biocalcarenite lithofacies is usually characterized by a sharp lower bedding plane on top of marlstone. They are sometimes graded and gradually transition towards siltstones. Generally, well-sorted clasts are composed of carbonates (lithoclasts and bioclasts), followed by siliciclastic material (quartz, igneous rock lithoclasts). Rare plant fossils are also recorded in this lithofacies.
Siltstone lithofacies can be divided into two lithotypes: homogenous siltstone and clayey siltstone. Homogenous siltstone is similar in composition to the siltstone lithofacies from the Voćin section. Clayey siltstone is often laminated, exhibiting changes of thin, dominantly clay laminae, and laminae dominantly composed of siltstone clasts supported by dark clay matrix. Marlstone lithofacies is dominant in the entire sedimentary succession and can be subdivided into three lithotypes: homogenous marlstone, silty marlstone, and laminated marlstone. Their petrographic characteristics are similar to those recorded in the Voćin section.
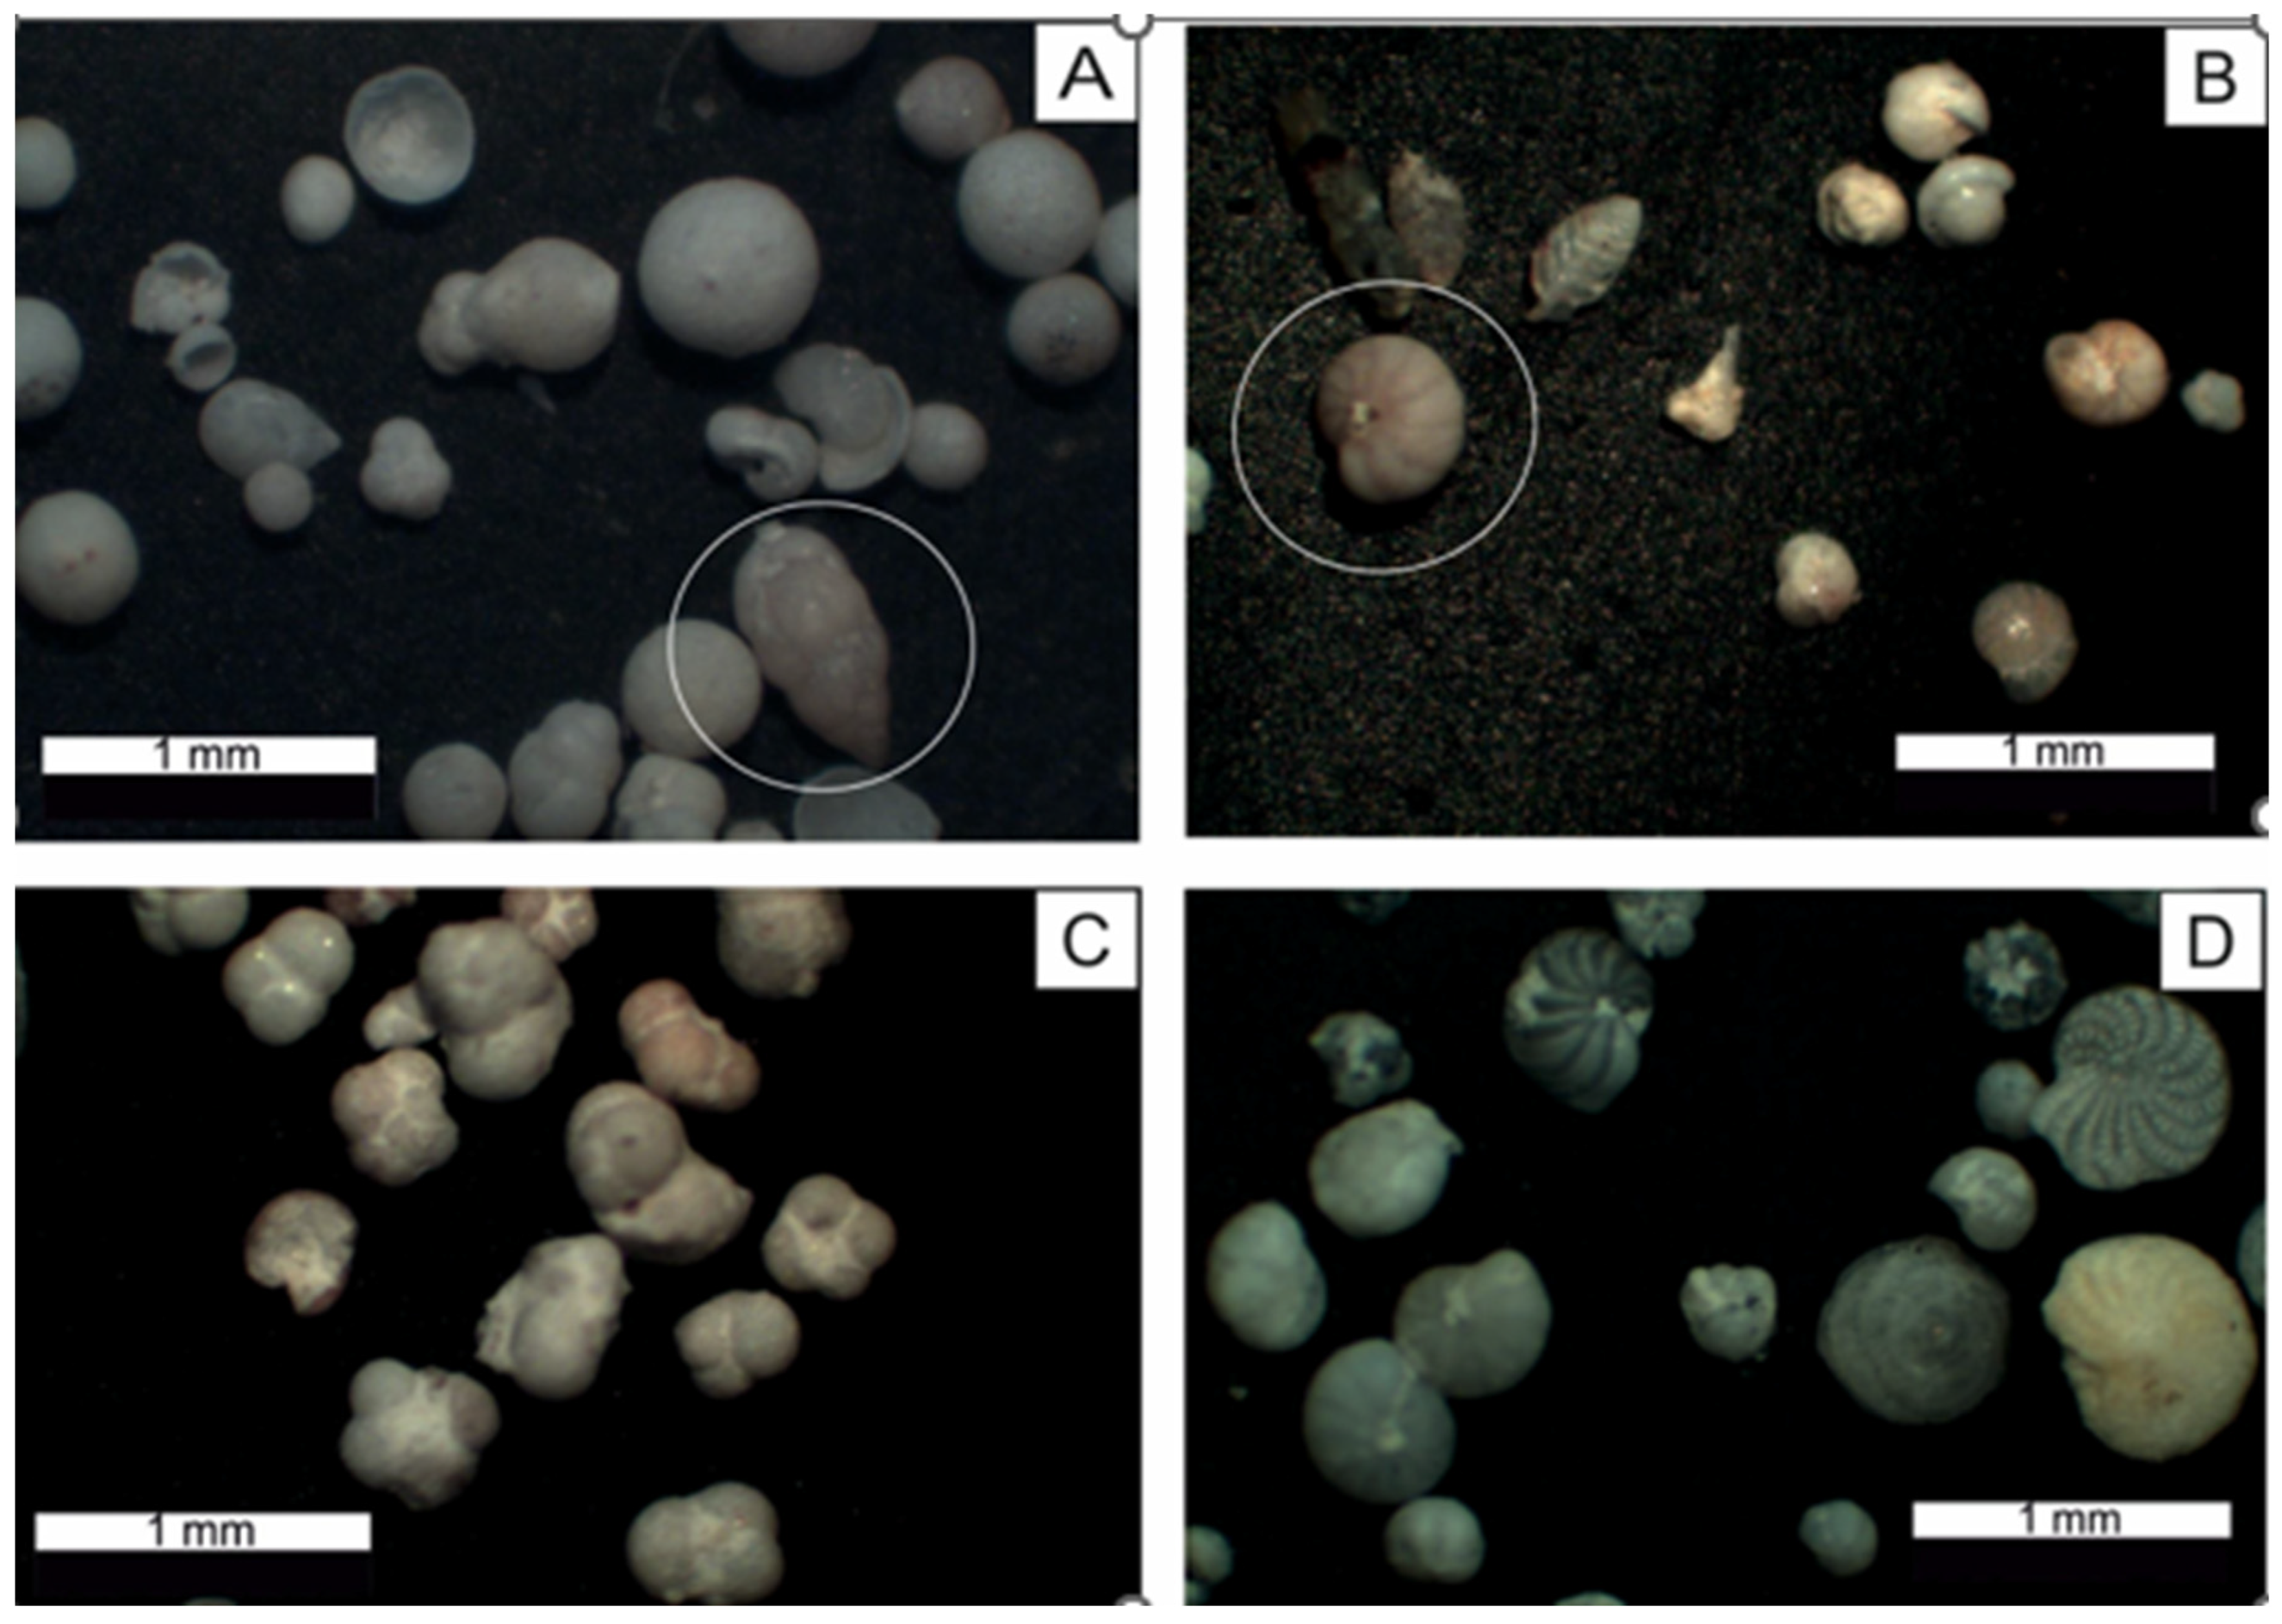
Micropaleontological observations from the Voćin section provide a paleoenvironmental context for the geochemical results presented in this study (
Figure 6). The analysed samples contain benthic and planktonic foraminifera [
74], including
Bulimina,
Bolivina,
Uvigerina,
Cibicides, and
Globigerina. This assemblage is characteristic of open-marine depositional settings ranging from the outer shelf to upper bathyal environments [
74]. The relative predominance of benthic foraminifera suggests deposition under relatively low-energy conditions with generally oxygenated bottom waters, while the consistent presence of planktonic taxa reflects normal open-marine conditions. These micropaleontological observations are consistent with sedimentological evidence from the Voćin succession and support interpretation of an open marine environment influenced by sea-level fluctuations and tectonic activity [
75].
4.2. Surface Gamma Ray Spectrometry and Laboratory Geochemical Analyses
Surface gamma-ray spectrometry and TOC content results for Voćin section can be seen in
Figure 7 and
Appendix A.1 and
Appendix A.2. TOC content ranges from 0.04 to 3.35 wt.%. K concentrations vary between 0.09 and 1.66%, U concentrations between 1.72 and 10.6 ppm, and Th between 1.36 and 10.31 ppm. DR ranges from 23.0 to 93.32 nGy/h. In the Podsused section (
Figure 8), TOC content is somewhat lower than in Voćin, with maximum values 2.64 wt.%, K ranges from 0 to 0.92%, U between 1.96 and 8.42 ppm, and Th between 0.75 and 5.96 ppm. DR values are also lower than those in the Voćin section.
4.3. Statistical Analyses
4.3.1. Correlation Matrices
Table 1 shows correlation matrix results for Voćin section. TOC is positively correlated with U (r = 0.48) and DR (r = 0.41) but has no linear relationship with K and Th. There is a strong correlation among gamma-ray components, particularly between U and DR (r = 0.91) and medium correlation for K and Th (r = 0.59). U and Th have low linear correlation (r = 0.29).
In the Podsused section (
Table 2), correlations are comparable to those observed in Voćin, indicating a consistent association of TOC and the gamma-ray responses across both successions. TOC shows moderate positive correlations with U (r = 0.45) and DR (r = 0.43), whereas the relationships with K (r = 0.08) and Th (r = 0.18) remain weak to negligible. Inter-correlations among the gamma-ray components are again strong, particularly between U and DR (r = 0.87), while K and Th display moderate to high correlation (r = 0.78). Differences between sections are limited to small variations in coefficient magnitude rather than systematic strengthening or weakening of relationships, suggesting broadly similar statistical behaviour of the measured variables in both datasets.
To evaluate whether the TOC–U and TOC–DR correlations differ significantly between sections, Fisher r-to-z comparisons were performed. The tests showed that neither the TOC–U correlations (z = 0.149, p = 0.8815) nor the TOC–DR correlations (z = −0.122, p = 0.9031) differ significantly between the Voćin and Podsused sections, indicating statistically comparable overall linear relationships in both datasets.
4.3.2. Multiple Linear Regression (TOC ~ U + K + Th)
Multiple linear regression models were applied to evaluate the independent contribution of U, K, and Th to TOC variability in the Voćin and Podsused stratigraphic sections. In the Voćin section, the model explains 23.2% of TOC variation (R
2 = 0.232; adjusted R
2 = 0.176; F = 4.13;
p = 0.012), as seen in
Table 3. U is the only statistically significant predictor of TOC (B = 0.216,
p = 0.001; 95% CI = 0.090–0.342), while K (B = 0.192,
p = 0.781) and Th (B = −0.050,
p = 0.608) do not show statistically significant contributions. In the Podsused section, the regression model explains 21.9% of TOC variation (R
2 = 0.219; adjusted R
2 = 0.193; F = 8.60;
p < 0.001). U is again the only statistically significant predictor (B = 0.160,
p < 0.001; 95% CI = 0.090–0.230). K (B = −0.205,
p = 0.579) and Th (B = 0.091,
p = 0.275) remain statistically insignificant, as seen in
Table 4. Standardized coefficients (β) also indicate that U is the dominant predictor of TOC in both sections (VOC: β = 0.50; POD: β = 0.43), whereas K and Th show much smaller effects and do not contribute significantly to TOC variation. Variance inflation factor (VIF) values were low in both sections (VOC: K = 1.56, U = 1.12, Th = 1.70; POD: K = 2.58, U = 1.05, Th = 2.66), indicating no problematic multicollinearity among K, U, and Th predictors.
4.3.3. Simple Linear Regression (TOC ~ U; TOC ~ DR)
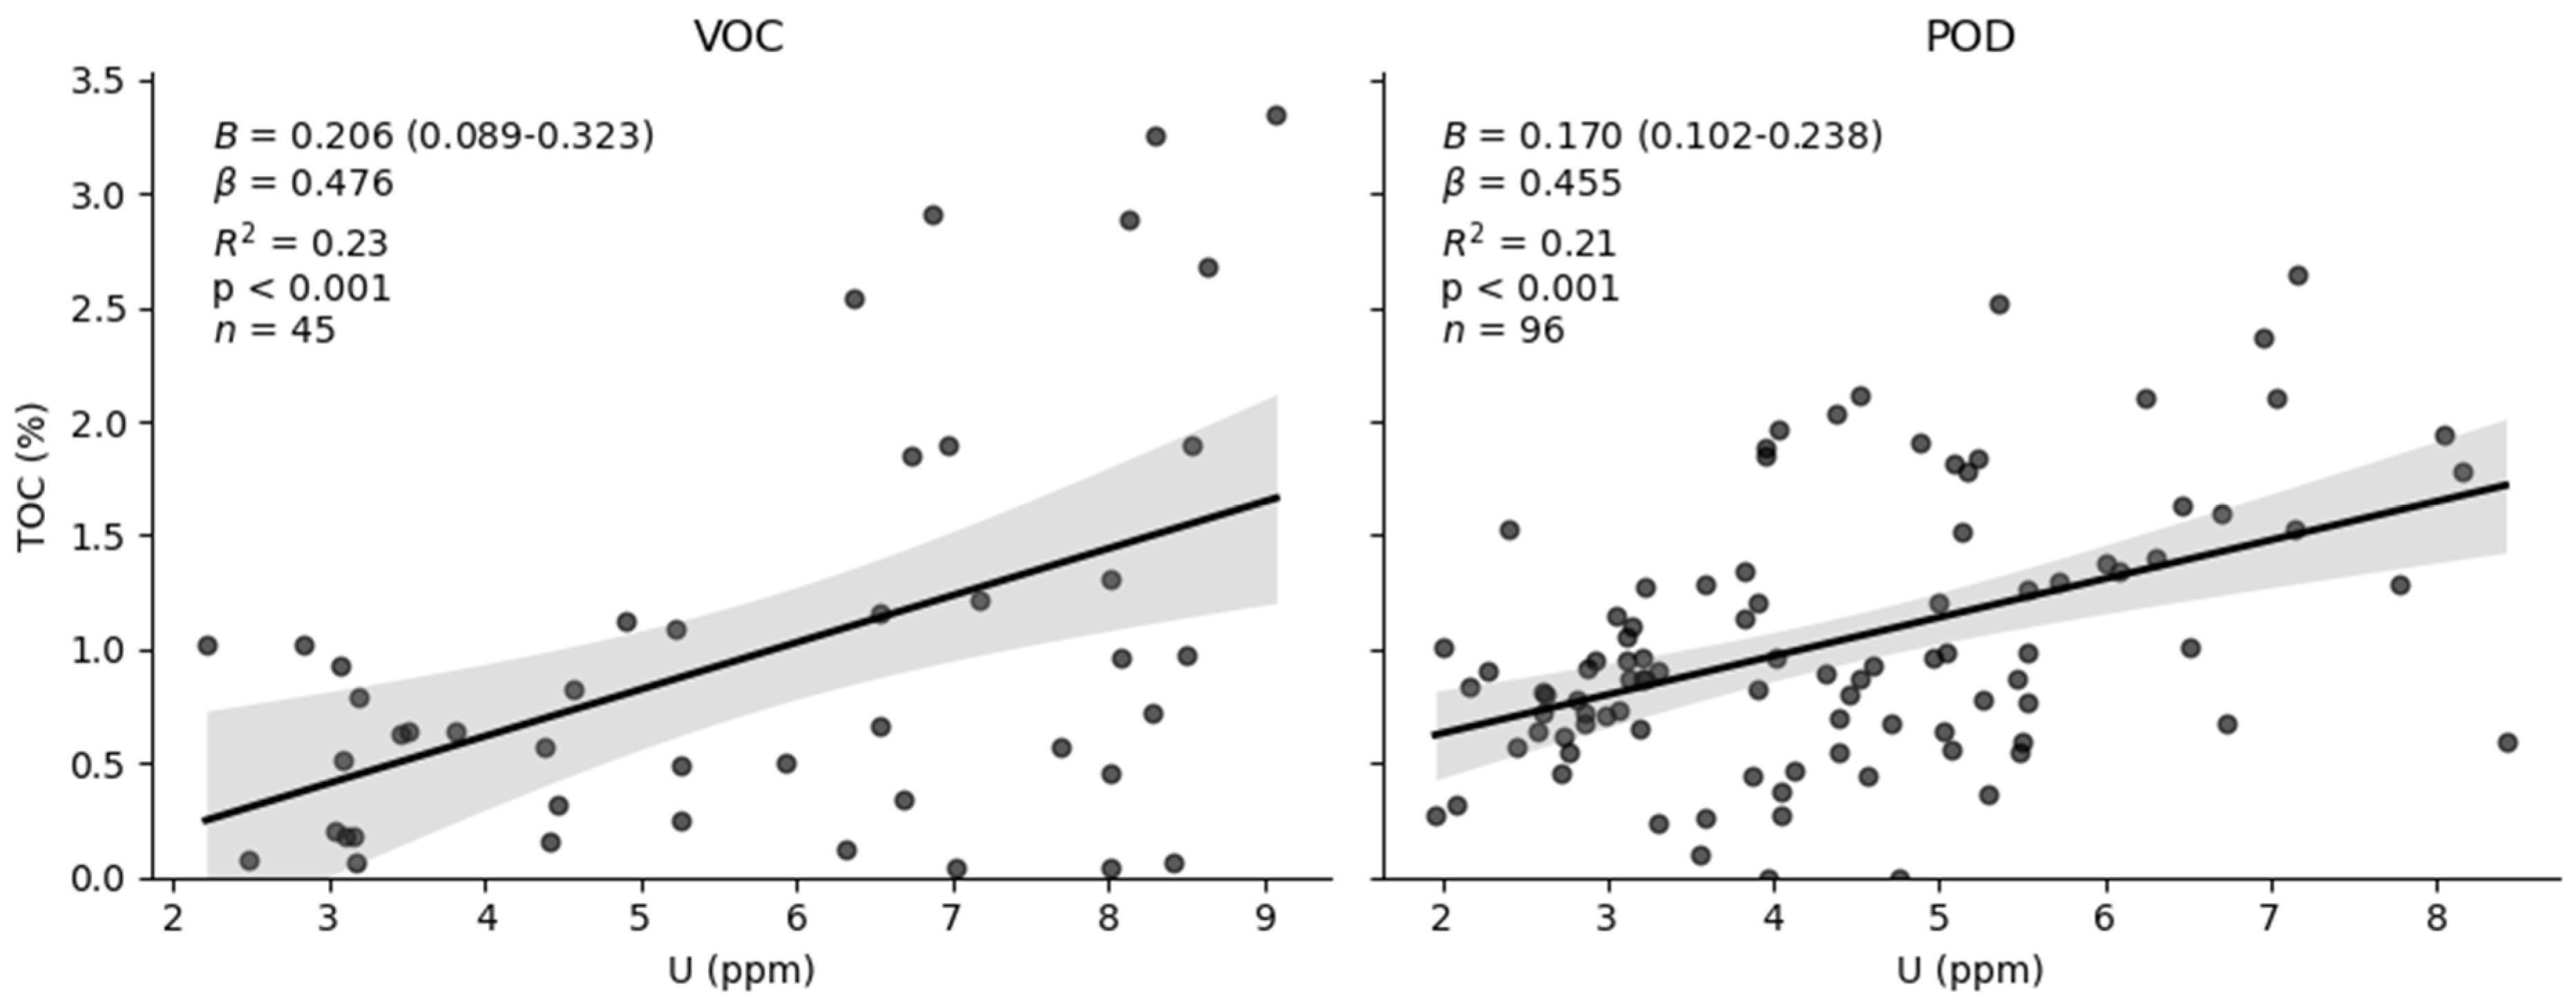
In the Voćin section (
n = 45), TOC shows a statistically significant positive linear relationship with U concentration (
Figure 9). The model explains 22.7% of the variation in TOC (R
2 = 0.227; adjusted R
2 = 0.209; F = 12.62;
p < 0.001). The regression coefficient indicates an average increase of 0.206% TOC per 1 ppm increase in U. In standardized terms, a one standard deviation increase in U corresponds to an increase of 0.476 standard deviations in TOC (B = 0.206; β = 0.476; 95% CI: 0.089–0.323). The intercept is not statistically significant (
p = 0.567).
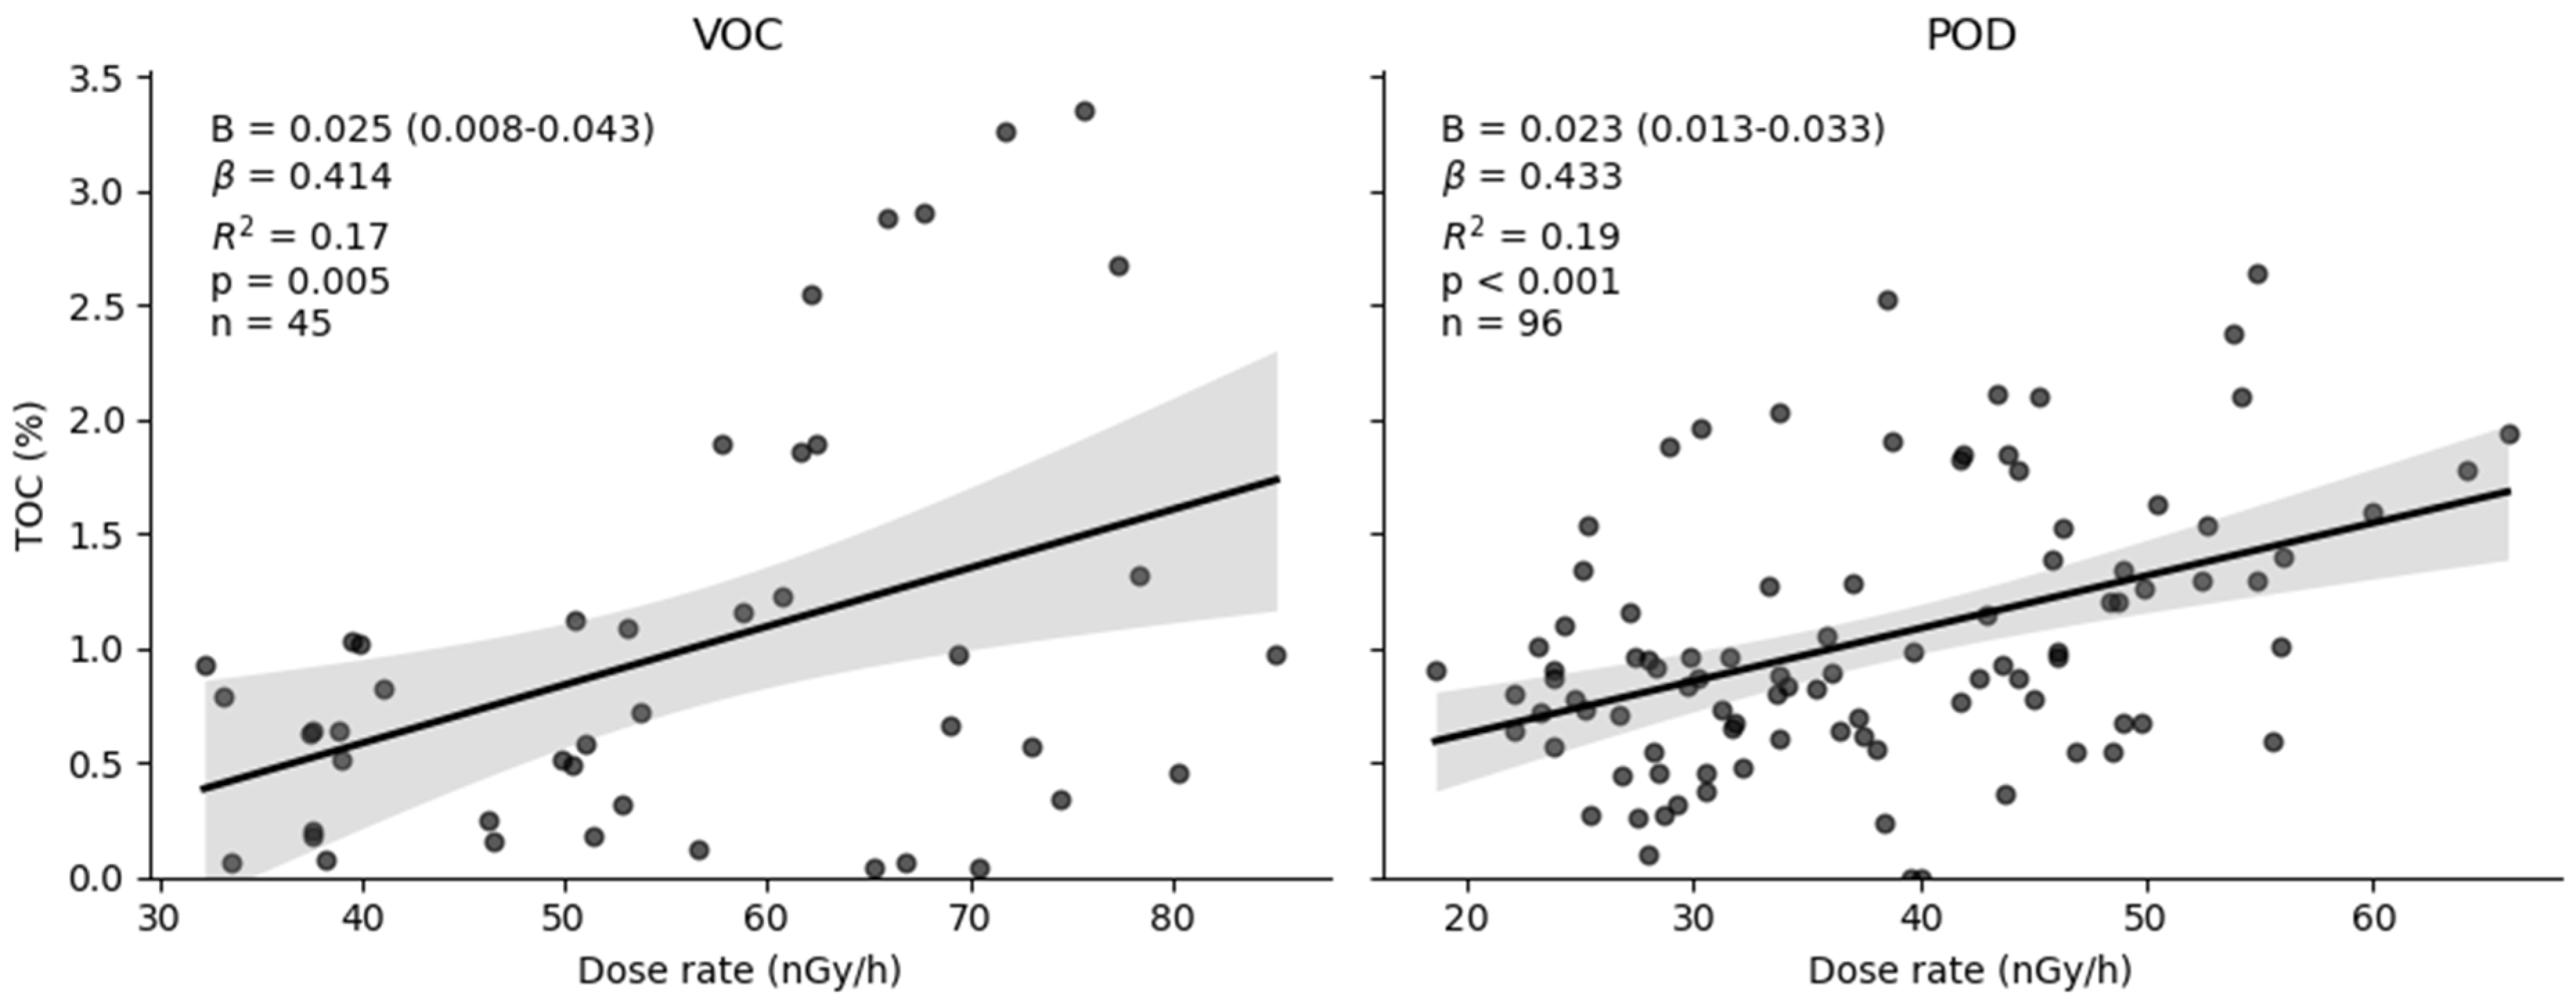
A significant positive relationship is also observed between TOC and DR in the Voćin section (
Figure 10). The DR model explains 17.1% of TOC variation (R
2 = 0.171; adjusted R
2 = 0.152; F = 8.90;
p = 0.005), as seen in
Table 5. The regression coefficient corresponds to an average increase of 0.0255% TOC per 1 nGy/h increase in DR. In standardized terms, a one standard deviation increase in DR corresponds to an increase of 0.41 standard deviations in TOC (B = 0.0255; β = 0.41; 95%; CI: 0.008–0.043). The intercept is not statistically significant (
p = 0.381). Compared to U, DR accounts for a smaller proportion of TOC variability in the Voćin succession.
In the Podsused section (
n = 96), TOC also exhibits a statistically significant positive linear relationship with U concentration (
Figure 9). The model explains 20.7% of TOC variation (R
2 = 0.207; adjusted R
2 = 0.198; F = 24.49;
p = 3.27 × 10
−6), as seen in
Table 6. The regression coefficient indicates an average increase of 0.170% TOC per 1 ppm increase in U. In standardized terms, a one standard deviation increase in U corresponds to an increase of 0.455 standard deviations in TOC (B = 0.169, β = 0.455, 95% CI: 0.102–0.238). The intercept is marginally non-significant (
p = 0.070).
The TOC–DR relationship in the Podsused section is similarly significant (
Figure 10). The model explains 18.7% of TOC variation (R
2 = 0.187; adjusted R
2 = 0.179; F = 21.65;
p = 1.07 × 10
−5), as seen in
Table 6. The regression coefficient corresponds to an average increase of 0.0230% TOC per 1 nGy/h increase in DR. In standardized terms, a one standard deviation increase in DR corresponds to an increase of 0.433 standard deviations in TOC (B = 0.023, β = 0.433, 95% CI: 0.013–0.033). The intercept is not statistically significant (
p = 0.394).
In both sedimentological sections, U explains a larger proportion of TOC variation than DR. Regression coefficients are comparable between the Voćin and Podsused sections, indicating similar average TOC sensitivity to changes in U and DR despite differences in facies architecture and data density. Interaction regression models showed that neither the U–TOC nor DR–TOC regression slopes differ significantly between sections (U × section: p = 0.551; DR × section: p = 0.778). However, Levene’s tests performed on regression residuals revealed significantly different residual variances for both relationships (U residuals: p = 0.0018; DR residuals: p = 0.0008). In both cases, the Voćin section exhibits substantially greater residual variance than Podsused, indicating increased scatter and reduced predictive stability despite statistically comparable overall regression relationships. These results provide the basis for subsequent multivariate and logistic regression analyses.
4.3.4. Logistic Regression Analysis
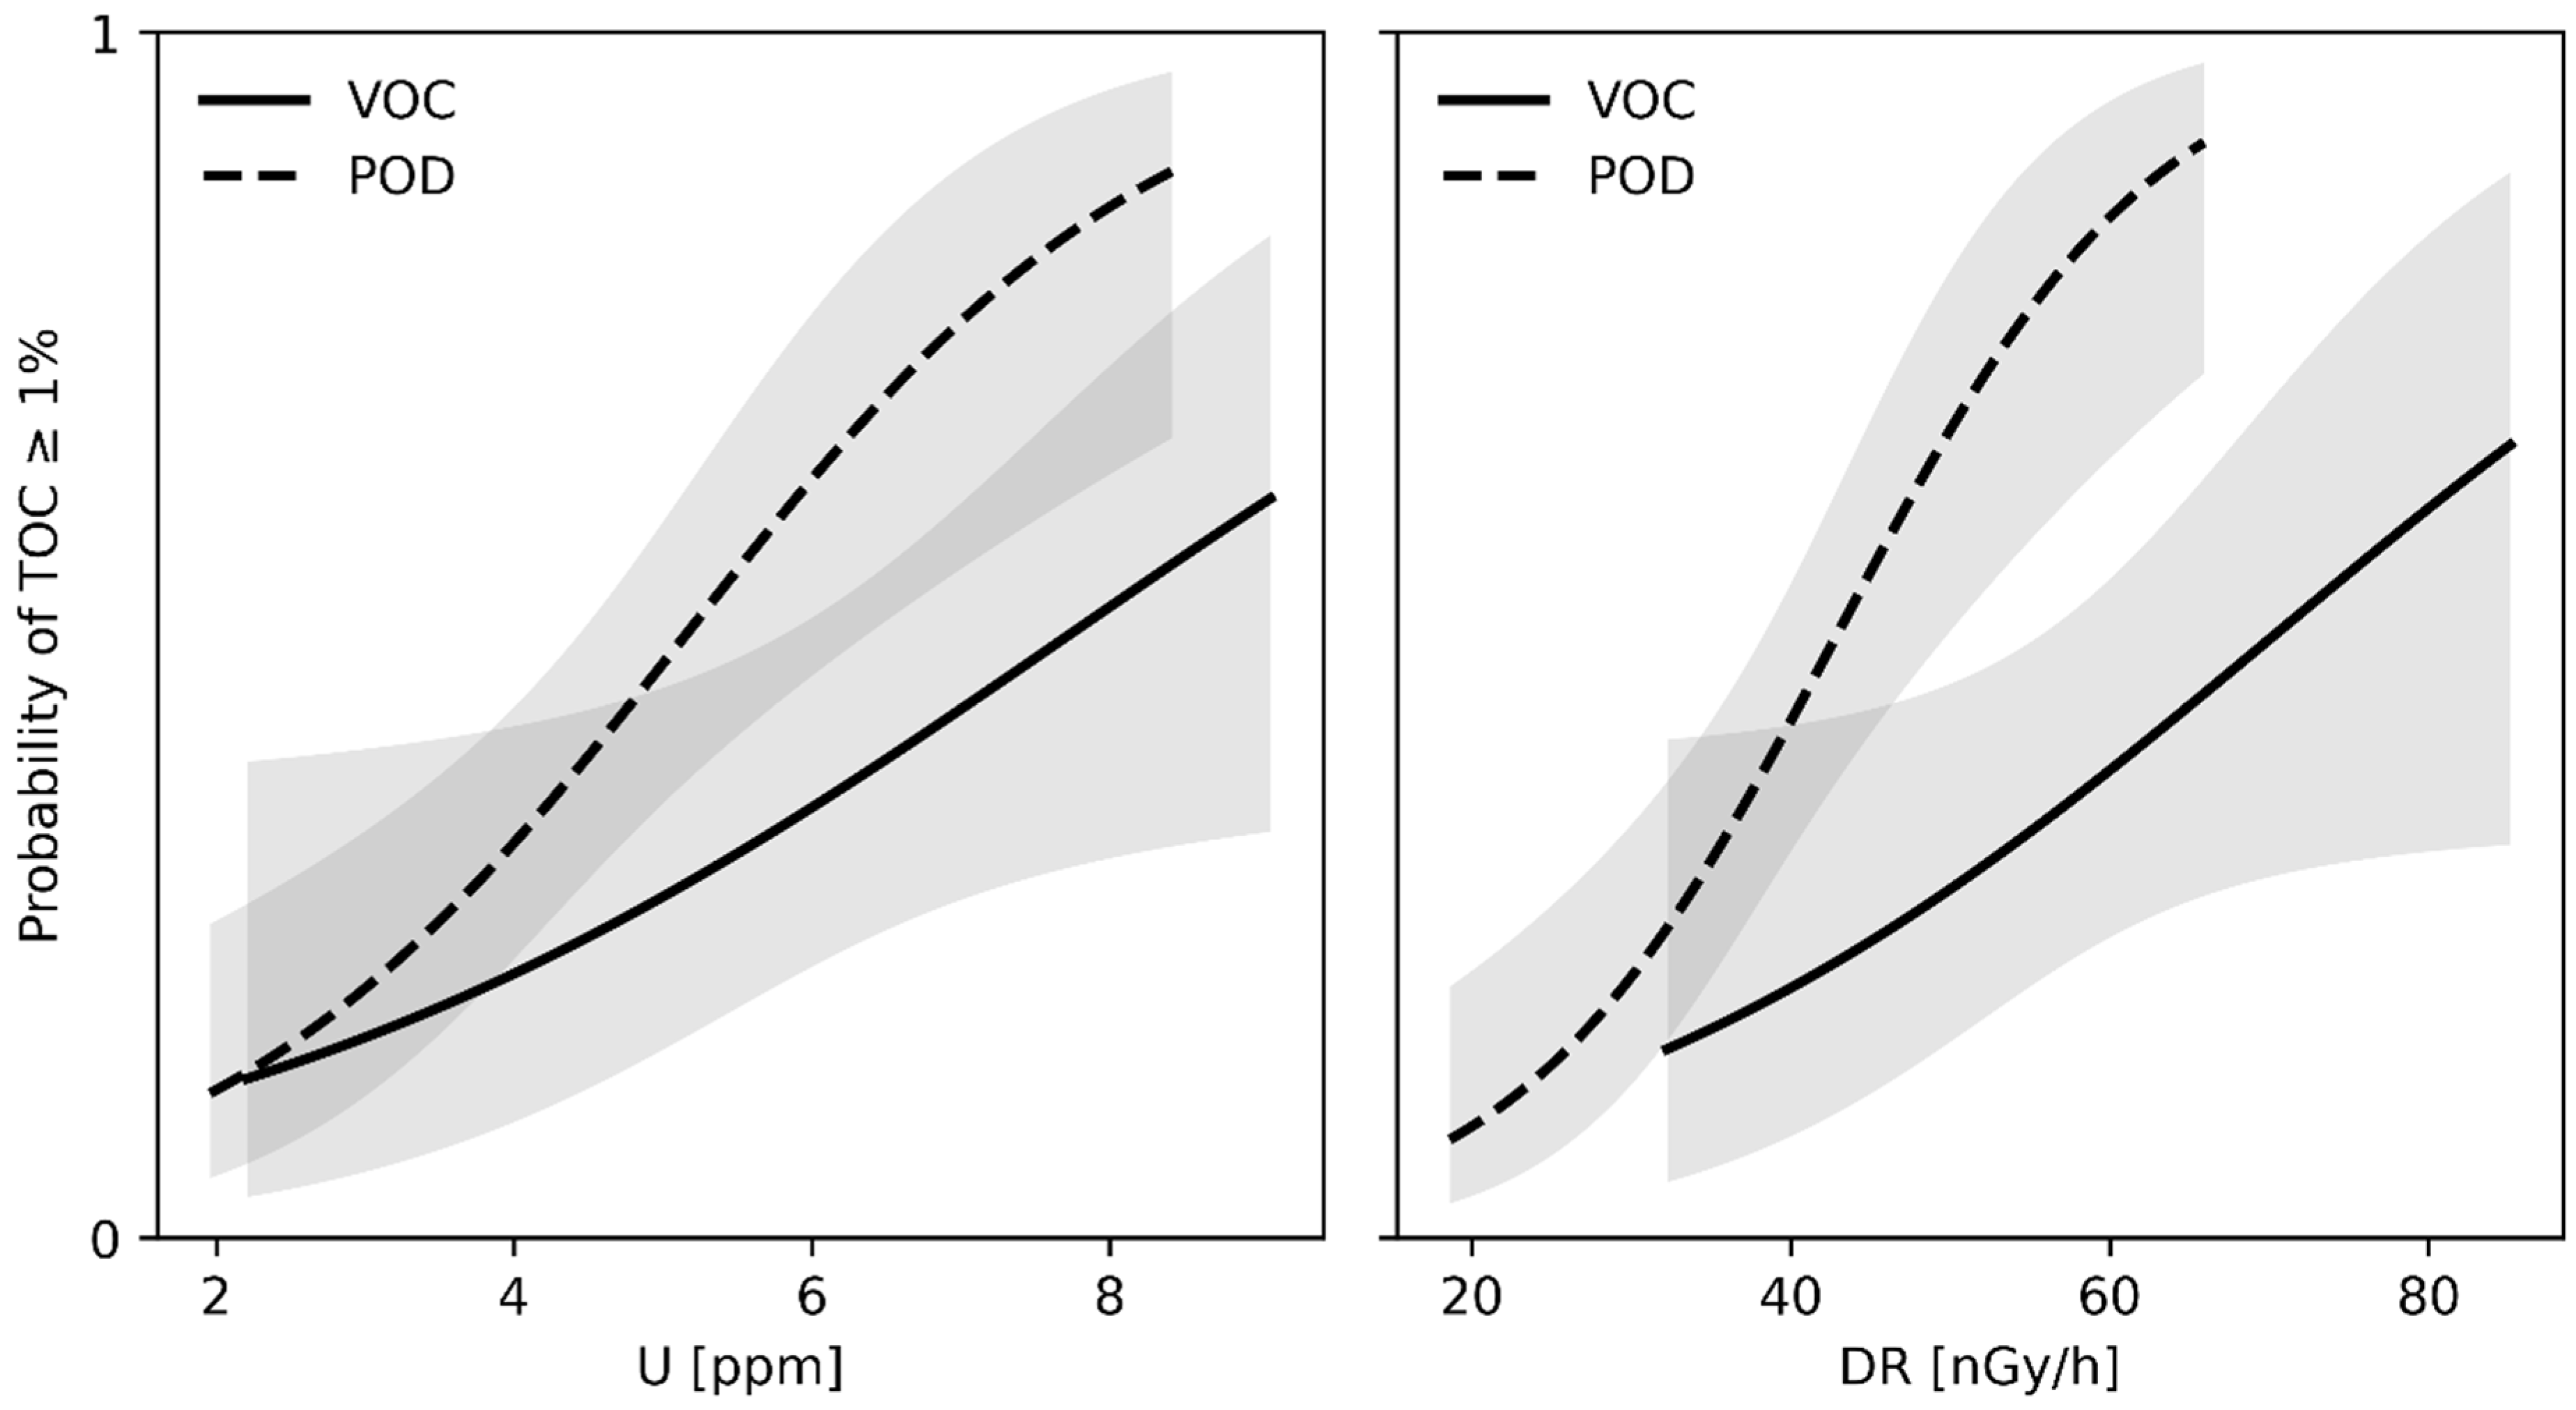
Logistic regression was used to evaluate probabilistic associations between gamma-ray variables (U and DR) and the occurrence of organic-rich intervals (TOC ≥ 1 wt.%). Models were fitted separately for U and DR and independently for each section to account for differences in depositional architecture and locality (
Figure 11).
In the Voćin section (n = 45), U shows a weak but statistically significant association with TOC ≥ 1 wt.% (B = 0.341, p = 0.041; pseudo-R2 = 0.080), corresponding to an odds ratio of 1.41 (95% CI: 1.01–1.95). Dose rate shows a weak and marginally non-significant relationship with TOC ≥ 1 wt.% (B = 0.044, p = 0.056; pseudo-R2 = 0.068; OR = 1.05, 95% CI: 1.00–1.09).
In the Podsused section (n = 96), both predictors show statistically significant associations. U yields B = 0.624 (p < 0.001; pseudo-R2 = 0.134; OR = 1.87, 95% CI: 1.34–2.59) indicating that the odds of organic-rich intervals nearly double with each 1 ppm increase in U, while DR yields B = 0.100 (p < 0.001; pseudo-R2 = 0.163; OR = 1.10, 95% CI: 1.05–1.16).
4.3.5. Threshold Analysis
Threshold analysis was used to examine how increasing gamma-ray components, U concentration, and DR relate to the probability of organic-rich intervals (TOC ≥ 1 wt.%). This approach evaluates probabilistic trends and is not intended to define strict deterministic cutoffs.
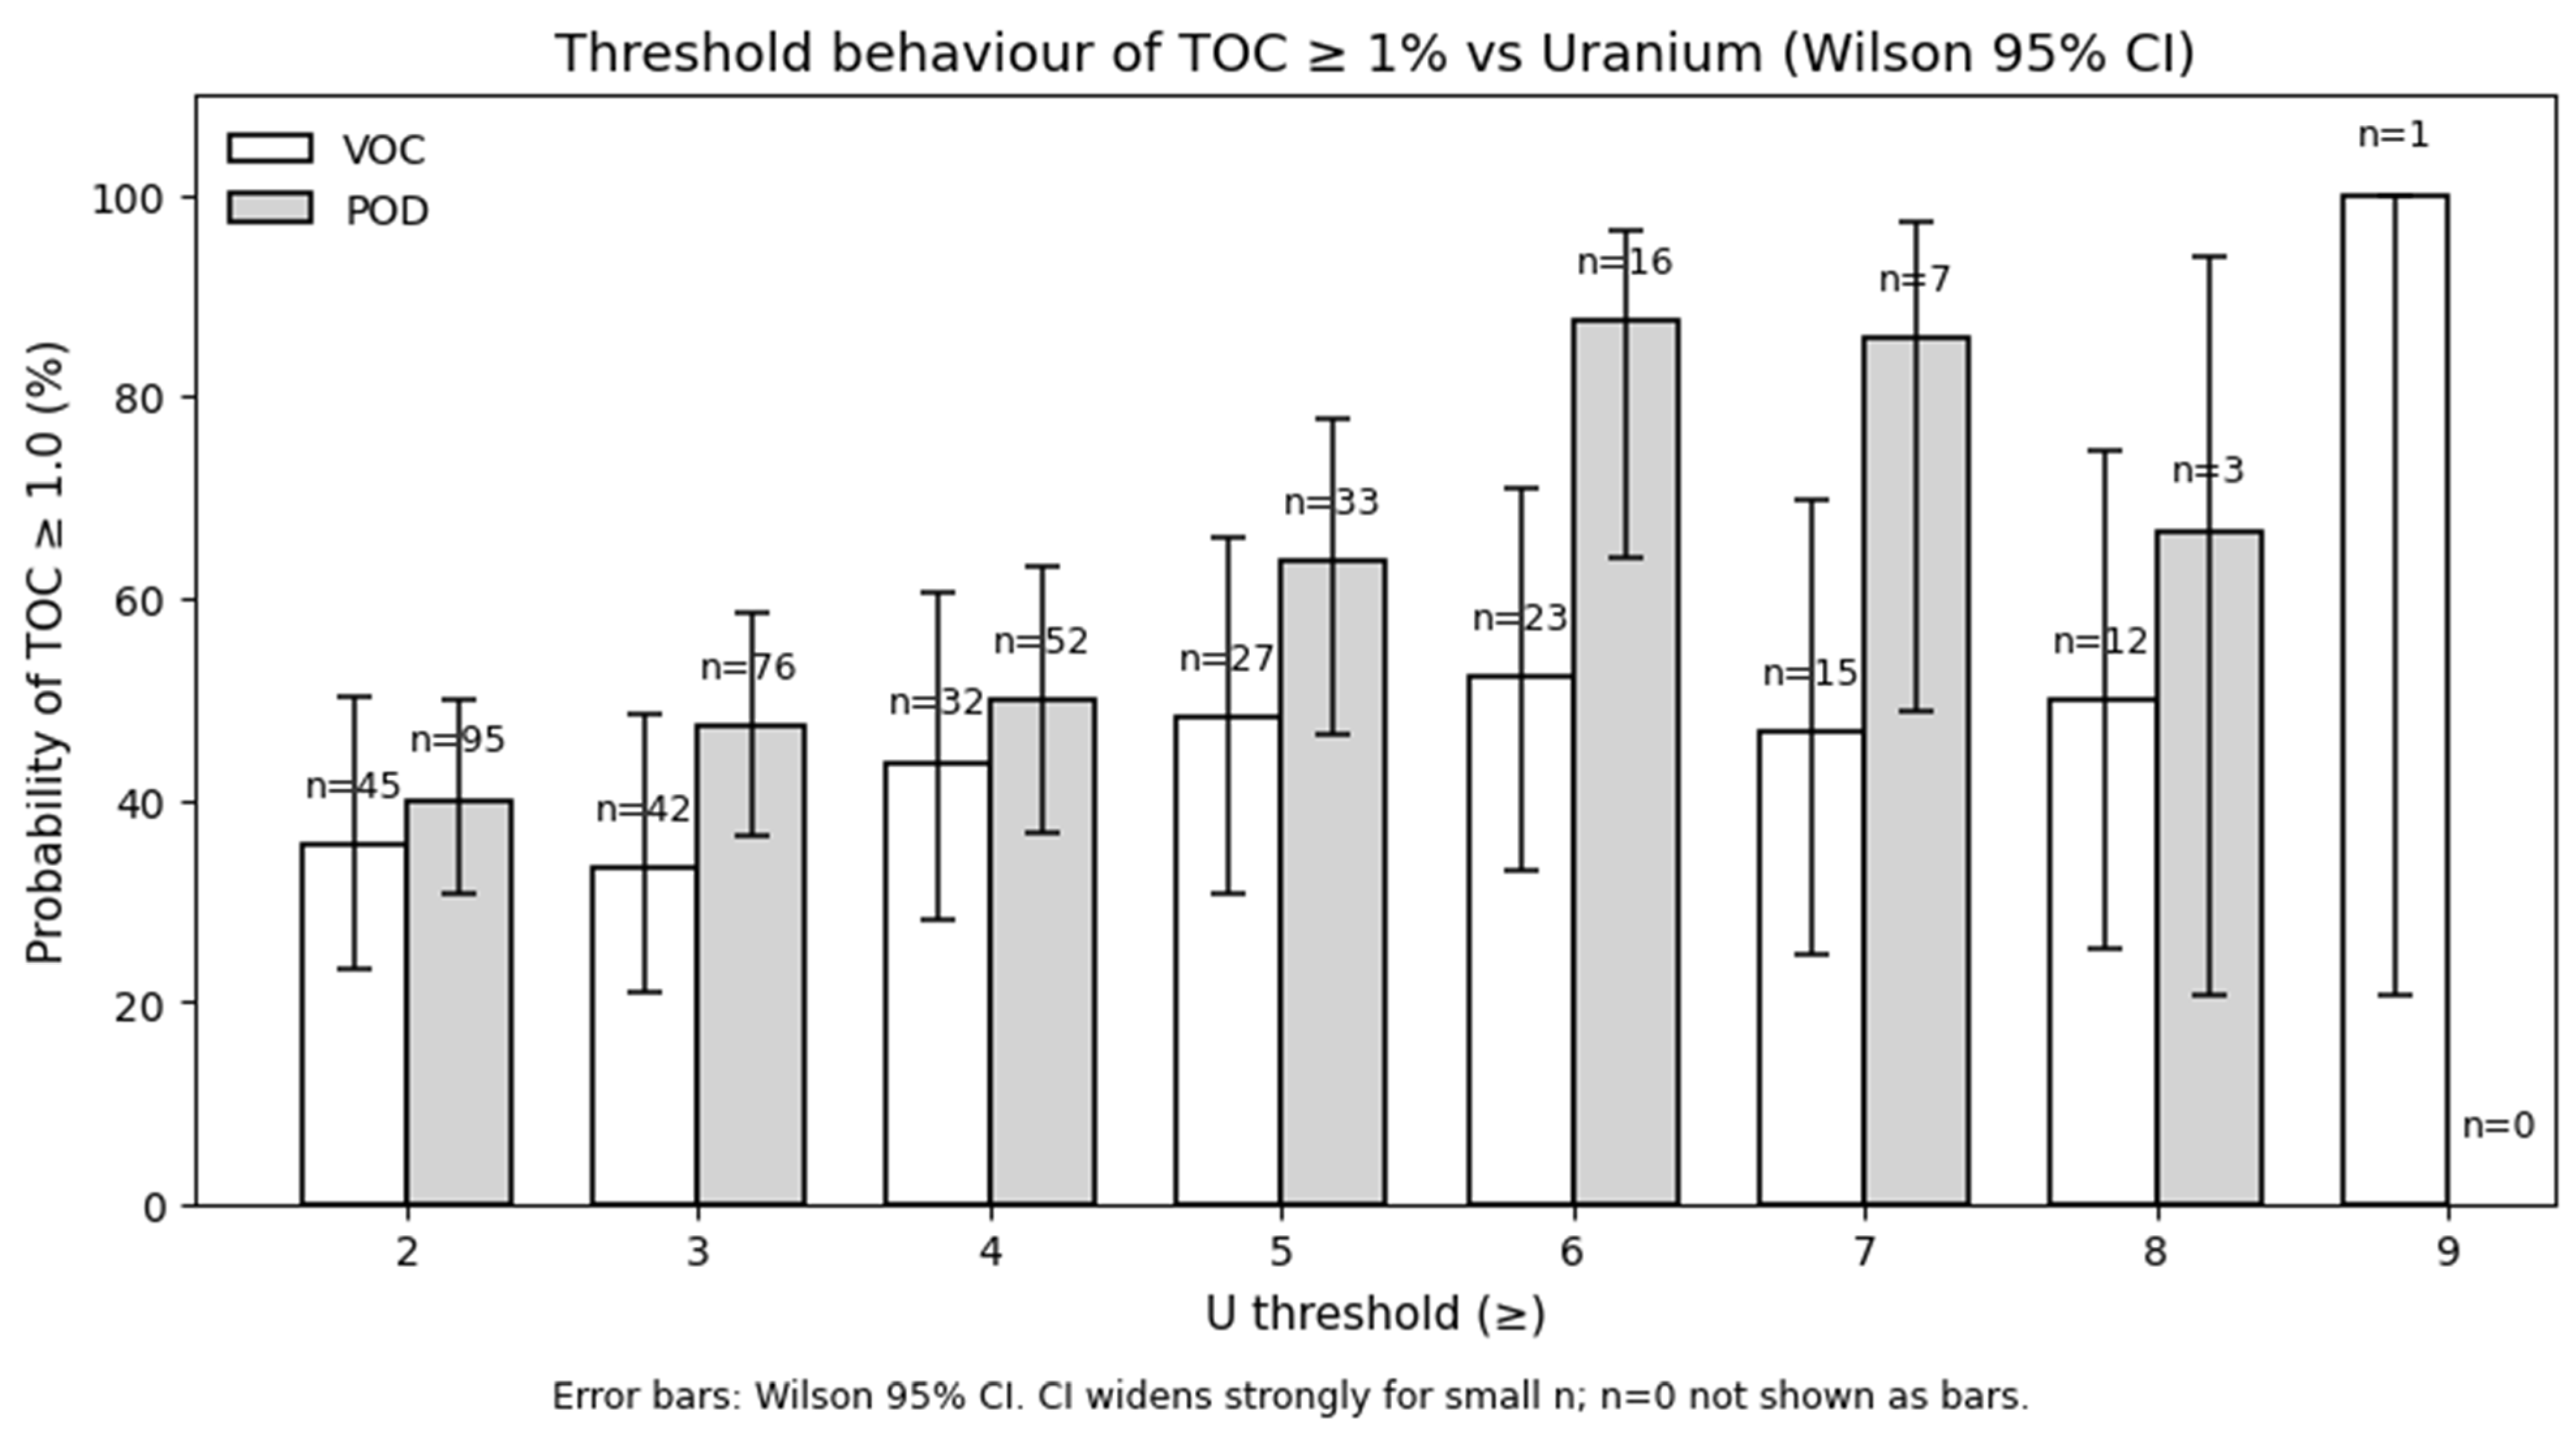
In the Voćin section (
Figure 12), the proportion of organic-rich samples slowly increases across increasing U thresholds, excluding the last 9 ppm threshold, where
n = 1. In the Podsused section, the proportion of samples with TOC ≥ 1 wt.% increases faster than in the Voćin section for U thresholds, from ~40% at U ≥ 2 ppm to ~50% at ≥4 ppm, ~64% at ≥5 ppm, and mostly >90% at ≥6 ppm, although the highest thresholds correspond to very small sample sizes (
n = 3 for 8 ppm threshold, and
n = 0 for 9 ppm threshold). Threshold intervals were intentionally standardized between sections to enable direct comparison of probabilistic behaviour across equivalent U and DR ranges; consequently, the highest thresholds naturally contain fewer samples because the two sections exhibit different maximum values and distribution structures. Accordingly, interpretation focuses primarily on the consistency of threshold trends across progressively increasing U and DR values rather than on isolated extreme thresholds with limited sample counts.
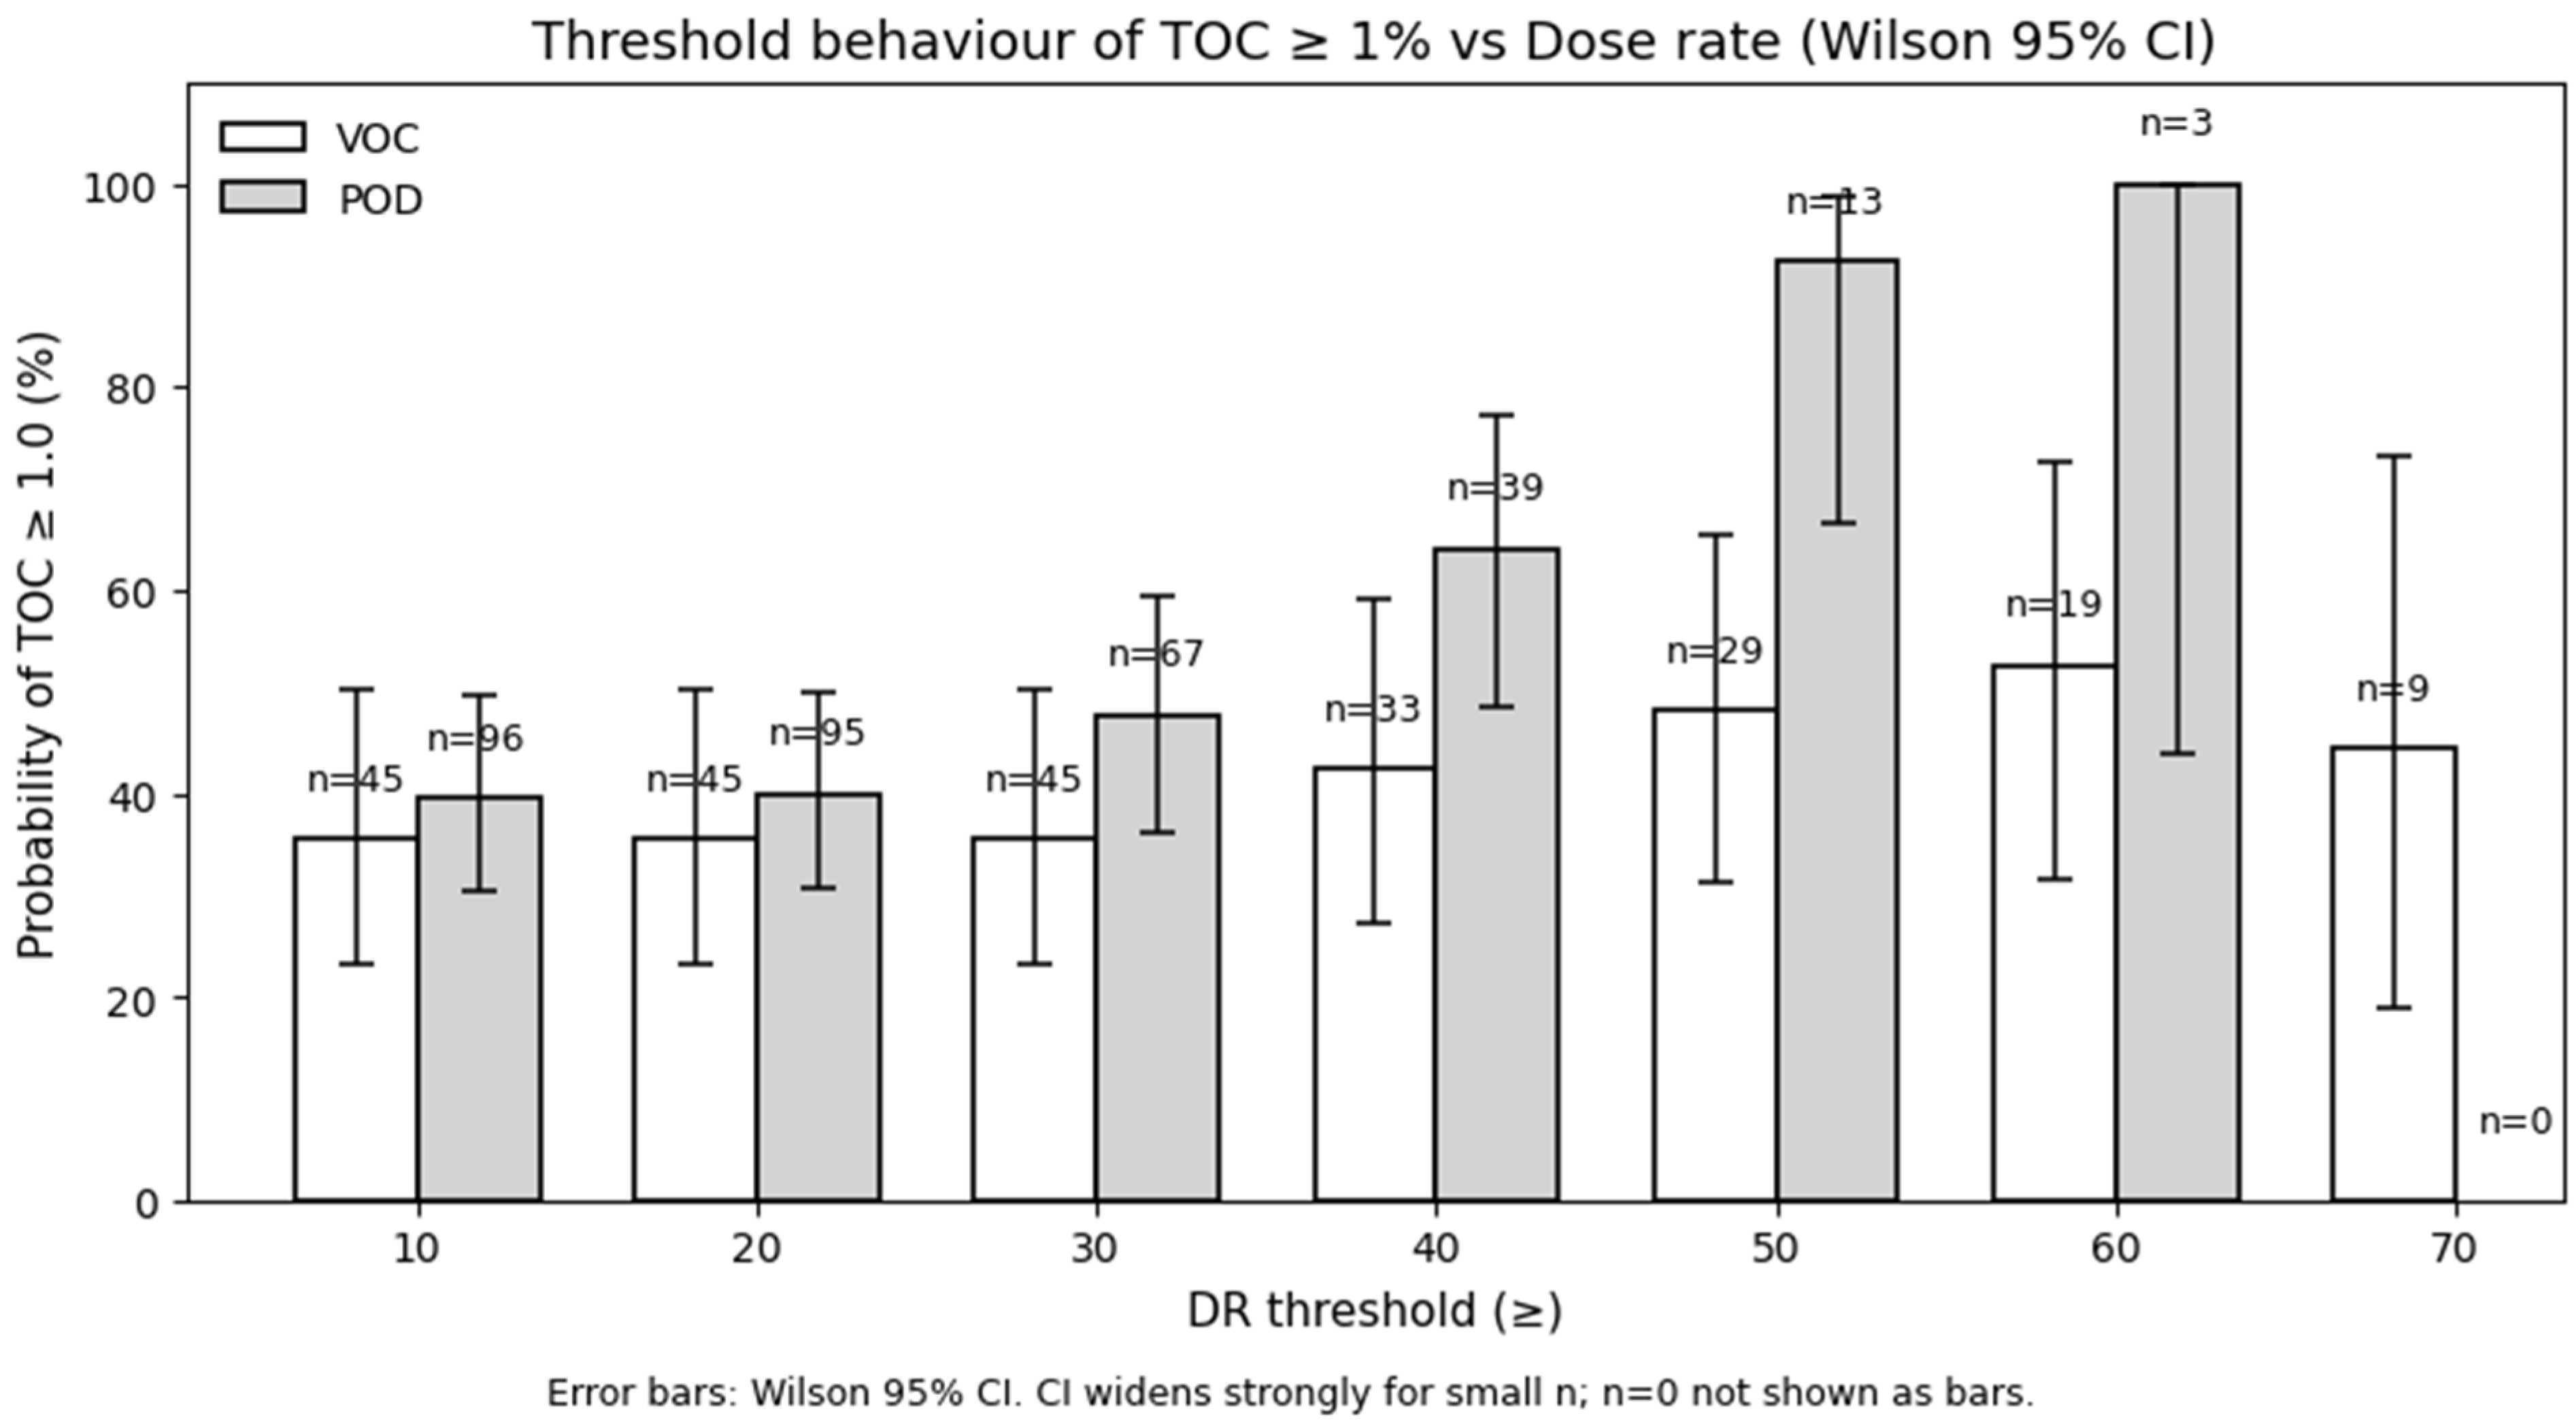
Threshold analysis using DR shows a comparable pattern (
Figure 13). In the Voćin section, organic-rich proportions slowly rise (~35–50%) across increasing thresholds. In the Podsused section, the proportion of TOC ≥ 1 wt.% samples increases with higher DR thresholds, from ~40–50% at lower values to ~65% at ≥40 nGy/h and >90% at ≥50 nGy/h, although the highest thresholds (60 and 70 nGy/h) are based on very small sample sizes.
5. Discussion
5.1. Relationships Between TOC and Gamma-Ray Components
The primary objective of this study was to assess the relationship between surface gamma-ray spectrometry measurements and TOC content in fine- to coarse-grained sedimentary Middle Miocene successions that differ in depositional architectures. Results demonstrate that U and DR show positive, statistically significant linear relationships with TOC in both studied sections. Redox-sensitive indicators were not available in this study, but this finding is consistent with numerous subsurface and outcrop studies that link U enrichment to reducing depositional conditions and enhanced preservation of organic matter [
13,
15,
16]. In both sections, U explains a slightly larger proportion of TOC variations than DR. The strong correlation between U and DR in both sections could mean that U is the primary contributor to the combined DR response, and that is the reason why DR also exhibits this linear relationship with TOC content in the first place. Helleren et al. [
76] found a similar effect where combined gamma-ray spikes were result of higher U concentrations. Relatively high TOC contents in both sections (up to 3.35% in Voćin, and 2.64% in Podsused) may indicate a potentially very good source rocks [
2], although all studied rocks are thermally immature. Consequently, the observed TOC patterns primarily reflect depositional and early diagenetic controls rather than thermal overprinting.
5.2. Detrital Control on K and Th and Implications for Multivariate Analysis
Medium to high correlations between K and Th observed in both the Voćin (r = 0.59) and Podsused (r = 0.78) sections are interpreted as reflecting a shared detrital origin. However, direct mineralogical or granulometric confirmation was beyond the scope of the present study. Relevant studies conclude both elements are dominantly associated with terrigenous mineral phases, particularly clay minerals, and therefore track variations in sediment supply, provenance, and grain size [
13,
77].
Because Th is considered relatively immobile, it becomes separated from the more mobile elements (such as U) during weathering and alteration of igneous parent rocks [
13]. As a result, Th is concentrated in resistant detrital heavy minerals (e.g., zircon, monazite, apatite, xenotime) and, when released during weathering, is strongly adsorbed onto clay minerals and iron–manganese oxyhydroxides. In carbonate rocks, thorium (Th) contents are typically very low (<3 mg/kg) and are largely confined to the non-carbonate fraction, primarily clays [
10].
K similarly tracks clay mineral abundance and sediment supply and does not respond directly to organic matter preservation processes [
78].
The strong K–Th correlation, particularly in the Podsused section, approaches levels commonly associated with multicollinearity in regression analysis.
A general rule is if the Pearson correlation coefficient is close to 0.8, multicollinearity is likely to exist [
79,
80]. Collinearity is primarily problematic when it obscures the interpretation of predictors that contribute substantially to explaining the response variable [
81,
82]. While the K and Th high correlation might raise concerns about possible multicollinearity, variance inflation factor (VIF) values remained low in both sections (VOC: 1.12–1.70; POD: 1.05–2.66), indicating no problematic predictor dependence. Furthermore, neither variable shows a significant relationship with TOC. This is further supported by the decrease in adjusted R
2 when K and Th are included in the regression models, indicating that they add no explanatory value. Regression model evaluation metric adjusted R
2 accounts for the number of predictors in a model and penalizes unnecessary complexity; it only increases when additional variables improve model fit beyond what would be expected by chance [
83]. Multiple linear regression results were similar for both sections, and confirmed that, among U, K, and Th, only U is a statistically significant variable explaining the dominant proportion of TOC variability, whereas K and Th do not provide additional explanatory power. This was further confirmed with standardized coefficients (β), which provide additional insight into the relative importance of individual predictors. In both sections, U exhibits the highest standardized coefficient (VOC: β = 0.50; POD: β = 0.43). In contrast, K and Th display substantially lower β values (|β| < 0.17), again indicating that their contribution to TOC prediction is negligible. These results demonstrate that the gamma-ray signal relevant for organic matter assessment is primarily controlled by uranium, whereas detrital components represented by K and Th do not meaningfully influence TOC variability. Consequently, K and Th were not further considered in subsequent predictive analyses as individual predictors. The weak and statistically insignificant relationships between TOC and K or Th observed in this study are consistent with previous outcrop gamma-ray investigations. Phujareanchaiwon et al. [
8] similarly reported that K and Th responses primarily reflected lithology and clay–mineral composition and remained relatively consistent across facies, whereas U showed a stronger relationship with organic-rich intervals, and total gamma-ray counts did not always follow high TOC trends. Accordingly, subsequent analyses focused on simple linear regression models using U and DR as predictors.
The consistency of regression coefficients and confidence intervals between the Voćin and Podsused sections indicates comparable average TOC sensitivity to U concentration despite differences in facies variability and sedimentary regimes. The Podsused model yields a higher F-statistic, suggesting a better overall explanatory value. However, since the coefficients of determination (R2) for the two sections are nearly identical, this primarily reflects the larger sample size and therefore greater statistical robustness rather than a fundamentally stronger overall relationship.
Additional intersection statistical comparisons further support this interpretation. Fisher r-to-z tests indicate that neither the TOC–U nor TOC–DR correlations differ significantly between sections, while interaction regression models show no significant differences in regression slopes. However, Levene’s tests performed on regression residuals revealed significantly greater residual variance in the Voćin section for both U- and DR-based models, indicating increased scatter and reduced predictive stability despite comparable average regression behaviour.
5.3. Facies Role on U-TOC Relationships
U exhibits fundamentally different behaviour from K and Th in sedimentary successions, reflecting its sensitivity to redox conditions rather than detrital mineral supply [
15]. Elevated U concentrations are commonly associated with fine-grained intervals deposited under oxygen-restricted conditions, where U is immobilized during early diagenesis through reduction and adsorption processes linked to organic matter preservation [
15,
17]. U enrichment may be locally modified by facies heterogeneity, variable sedimentation rates, and episodic reworking caused by deposition in tectonically active areas, which can weaken the direct correspondence between U concentration and TOC at the bed scale [
12,
22]. Comparable facies-dependent behaviour was also reported by Phujareanchaiwon et al. [
7], where calcareous mudstone intervals showed decreased K and Th responses but relatively elevated U concentrations associated with higher TOC values. The same authors concluded that, although U provided the strongest association with TOC among spectral gamma-ray components, the linear relationship remained only moderate (R
2 = 0.50). They attributed this variability to lithological composition, sedimentation rate, duration of anoxia, and diagenetic factors. Similarly, the present study demonstrates that even where U represents the most informative gamma-ray parameter, lithofacies heterogeneity and depositional variability introduce substantial scatter and reduce predictive stability at the bed scale. Consequently, U concentrations are best interpreted as probabilistic indicators of preservation conditions rather than deterministic predictors of TOC content.
5.4. Logistic Regression and Threshold Behaviour in Different Sedimentation Regimes
Logistic regression demonstrates that increasing U concentrations are associated with a higher probability of encountering organic-rich intervals (TOC ≥ 1 wt.%), while the relationship of this probability with DR is weaker. This difference is particularly evident in the Voćin section, where only U shows a statistically significant association, while DR is marginally non-significant. In the Podsused section, both U and DR are significant predictors and yield a higher odds ratio and higher pseudo-R2 values compared to the Voćin section, indicating a more consistent relationship between gamma-ray response and TOC. Although part of this difference likely reflects the larger sample size in Podsused (n = 96 vs. 45), the higher odds ratios and pseudo-R2 values indicate greater predictive consistency and more stable probabilistic screening behaviour in that succession.
Threshold analysis further supports this contrast. In Podsused, progressively higher U and DR values correspond to monotonic increases in the proportion of organic-rich samples (e.g., >60–90% for U ≥ 5–6 ppm and DR ≥ 40–50 nGy/h), providing a practical probabilistic basis for screening. In contrast, threshold responses in the Voćin section show slower rise in organic-rich proportions across increasing thresholds and are in the ~35–50% range across all thresholds (except highest of 9 ppm, which is based on one sample). Similar U and DR values occur in both organic-rich and organic-poor beds, limiting their ability to reliably distinguish TOC-rich intervals. The higher and more variable signals observed in this section are best explained by lithological heterogeneity and measurement-scale effects: handheld gamma-ray instruments integrate radiation over several decimeters, so thin beds and rapidly alternating facies produce locally elevated but noisy responses. Consequently, the gamma-ray-TOC relationship is less consistent in Voćin than in the more uniform Podsused succession. This interpretation is further supported by significantly greater residual variance observed in the Voćin regression models, indicating increased scatter and reduced predictive stability despite comparable average regression relationships between sections.
5.5. Sedimentological Controls, Methodological Limitations, and Applicability
Differences between the Voćin and Podsused successions are best explained by depositional architecture and facies variability. Organic carbon accumulation reflects the balance between organic matter production, preservation efficiency, and dilution by detrital input [
1]. In environmentally stable, fine-grained successions, such as the marl-dominated Podsused section, preservation signals are more consistently recorded. In contrast, facies–heterogeneous successions characterized by variable sediment supply and fluctuating depositional energy are prone to detrital dilution and variable oxygen exposure, which weaken geochemical proxy–TOC relationships [
84,
85]. The gamma-ray signal integrates radioactivity from multiple lithologies due to frequent lithological changes. Another discrepancy of U and TOC relationship has been documented in carbonate-rich sediments where dilution and early diagenetic effects obscure preservation signals [
22].
Although the present study primarily evaluates preservation-related controls reflected in the uranium enrichment and gamma-ray response, TOC accumulation is also influenced by variations in organic productivity and sediment dilution. These processes were not independently quantified in the present dataset but likely contribute to the observed scatter and moderate goodness of fit in the TOC–gamma-ray relationships. In particular, detrital or carbonate dilution may reduce TOC independently of redox-related uranium enrichment, whereas productivity fluctuations may alter organic matter supply without producing proportional changes in the gamma-ray response.
For all statistical analyses, only co-located gamma-ray and TOC pairs were used (n = 45 in Voćin; n = 96 in Podsused), so the difference in measurement spacing does not directly affect the regression inputs. In both sections, TOC sampling preferentially targeted fine-grained marlstone intervals, reflecting their known source rock potential and the expectation that U–TOC relationships are most pronounced in such lithologies. In the marl-dominated Podsused section, this sampling approach is broadly representative of the actual lithological composition of the succession. In the Voćin section, however, where coarse-grained facies are more frequently interbedded, fine-grained marlstone intervals are disproportionately represented in the dataset relative to their actual occurrence in the section. Since U enrichment under reducing conditions is not expected in coarse-grained, carbonate-dominated facies, the reported correlations and regression results should be interpreted as most representative of fine-grained depositional conditions, which is consistent with the focus on fine-grained intervals as the lithologies most relevant to organic matter preservation and source rock assessment. The similar TOC–U correlation coefficients (r = 0.48 vs. 0.45) and comparable R2 values (~0.23 vs. ~0.21) between sections suggest that differences in sampling density did not systematically distort correlation strength or model performance. Although the overall TOC–U and TOC–DR correlations and regression slopes are statistically comparable between the Voćin and Podsused sections, residual variance differs significantly. The substantially greater residual variance observed in the Voćin section indicates increased scatter around the regression relationships and reduced predictive stability. This suggests that lithofacies heterogeneity primarily affects the consistency and operational reliability of gamma-ray-based TOC screening rather than the existence of the underlying TOC–gamma-ray relationships themselves. The increased variance observed in the Voćin section likely contributes to the weaker probabilistic performance and marginal logistic regression significance observed for DR in heterogeneous facies settings.
The observed differences in logistic regression performance and threshold behaviour between sections are therefore better attributed to lithological heterogeneity in Voćin, where gamma-ray measurements integrate signals across rapidly alternating facies, than to differences in sampling design.
Weathering represents an additional factor that may influence the observed relationships between gamma-ray responses and TOC in outcrop studies. Surface samples are exposed to oxidation processes that can lead to partial degradation of organic matter and potential reduction of TOC values [
1]. At the same time, uranium may be mobilized under oxidizing conditions and redistributed within the rock [
12], potentially decoupling its concentration from original organic matter content. However, the present study does not include independent indicators of weathering intensity; therefore, weathering is interpreted only as a possible secondary influence rather than a directly demonstrated control, although weathering effects on U concentration and TOC content cannot be excluded as an additional source of scatter in observed relationships.
A direct comparison between weathered surface samples and unexposed (fresh) material would be required to quantify the magnitude of this effect; however, such data were not available in this study. Despite this limitation, several precautions were taken to minimize potential weathering-related bias, including preferential sampling of freshly exposed surfaces, avoidance of visibly altered or oxidized intervals, and interpretation of gamma-ray data in parallel with sedimentological observations.
Field gamma-ray measurements have inherent statistical uncertainty because radiation is a natural spontaneous process and are additionally influenced by lithological variability and carbonate content [
86]. Sêco et al. [
86] demonstrated that measurement reliability improves in thicker and more homogeneous sedimentary intervals, whereas strongly heterogeneous and thinly interbedded lithologies increase uncertainty. Although the present study applies different statistical approaches, including regression and probabilistic threshold analysis, the observed contrast between the homogeneous Podsused section and the heterogeneous Voćin section is consistent with their conclusions.
The magnitude of gamma-ray/TOC scale mismatch could not be directly corrected in this study because field gamma-ray measurements integrate a surrounding rock volume, whereas TOC analyses represent discrete samples. A full correction would require matched-volume TOC composites or repeated gamma-ray measurements with different collimation geometries. Therefore, scale mismatch is interpreted here as a likely contributor to scatter, particularly in the heterogeneous Voćin succession where rapidly alternating lithologies increase volumetric averaging effects, rather than as a quantitatively corrected parameter.
Even though in laboratory conditions the U and organic matter bond is stable, other more theoretical views suggest the opposite [
12]. Over geological time, organic matter that contains U goes through various changes, including diagenetic alteration through oxidation, biodegradation, aromatization, radiolysis, and thermal maturation [
87]. A further cause of U and organic matter bond degradation is from the radioactive decay of U [
88,
89].
The mechanisms governing uranium–organic matter complexation extend beyond simple redox-controlled immobilization. At the molecular level, complexation depends on the type and maturity of organic functional groups, diagenetic history, and prevailing geochemical conditions [
12,
90], all of which introduce additional variability into the U–TOC relationship that cannot be fully captured by bulk gamma-ray measurements. Recent ultrahigh-resolution mass spectrometric evidence by Xu et al. [
90] shows that the types of organic compounds involved in uranium–organic matter complexation varies with hydro-biogeochemical conditions. The same authors suggest U is not uniformly associated with total organic matter but molecularly selective and environmentally sensitive, with U preferentially found in organic matter complexes with specific N-containing organic compounds and Fe-stabilized phases. However, these processes were not investigated since they are beyond the scope of the present study, but they are further emphasizing the complexity of U and organic matter relationship.
The use of regression, logistic models, and threshold analysis in this study does not imply that gamma-ray data alone can fully predict TOC at the scale of individual samples. Instead, these methods are used to quantify tendencies observed in sedimentological analysis and to test whether associations between gamma-ray parameters and organic matter preservation are systematic or merely coincidental. The low coefficients of determination in linear regression models (R2 ~0.22 in both sections) reflect the physical and geological constraints outlined above: volumetric averaging of gamma-ray measurements relative to point-based TOC sampling, facies heterogeneity, weathering, the inherent complexity of the U–organic matter relationship, and whether they represent an expected outcome rather than a methodological limitation. The practical screening case presented here is built on logistic regression and threshold analysis, which evaluate the probability of encountering organic-rich intervals rather than predicting exact TOC values. In the Podsused section, U exceeding 6 ppm and DR exceeding 50 nGy/h correspond to greater than 90% probability of TOC ≥ 1 wt.%, providing a robust probabilistic screening criterion despite the moderate linear R2. In the heterogeneous Voćin section, threshold probabilities remaining at ~50% across increasing U and DR values demonstrate that lithological complexity fundamentally limits the predictive consistency of gamma-ray responses. This outcome is consistent with the geological interpretation that rapid facies alternations, detrital dilution, and volumetric averaging of gamma-ray signals in heterogeneous successions decouple U concentrations from TOC at the bed scale. This provides a diagnostic criterion: where threshold probabilities have moderate values despite increasing gamma-ray responses, additional sedimentological characterization is necessary before gamma-ray data can be used reliably for TOC screening. It is also a practical basis for subsurface application. Where calibration data show a consistent increase in TOC probability with increasing gamma-ray parameters, these variables can be used to support interpolation between TOC measurements. Where such a trend is not observed, gamma-ray responses do not provide reliable information on TOC distribution.
6. Conclusions
This study evaluated relationships between surface gamma-ray spectrometry parameters and TOC content in two Middle Miocene marine successions differing in depositional architecture using correlation, regression, and threshold analyses. Results confirm that uranium (U) is the only statistically significant gamma-ray component consistently related to TOC, whereas potassium (K) and thorium (Th) do not contribute meaningfully to TOC prediction.
The first core contribution of this study is the demonstration that lithofacies heterogeneity is an important factor influencing the reliability of gamma-ray-based TOC screening. In the marl-dominated Podsused succession, regression residual variance is significantly lower, and threshold behaviour is systematic, reflecting stable depositional conditions that allow uranium enrichment to be consistently recorded. In contrast, the facies–heterogeneous Voćin section shows significantly greater residual variance and weaker threshold behaviour, attributable to rapid bed-scale alternations, detrital dilution by coarse-grained event deposits, and volumetric averaging of outcrop gamma-ray measurements across contrasting lithologies. Importantly, the underlying TOC–uranium relationships are statistically comparable between sections; it is predictive stability, rather than the existence of the relationship itself, that is affected by facies heterogeneity.
The second core contribution is a probabilistic screening approach derived from logistic regression and threshold analysis. In the Podsused succession, U exceeding 6 ppm and DR exceeding 50 nGy/h correspond to greater than 90% probability of TOC ≥ 1 wt.%. However, these values should not be treated as universal cutoffs, as threshold behaviour is inherently succession-specific and depends on local depositional settings and facies variability. Where threshold probabilities remain flat despite increasing gamma-ray values, as observed in the heterogeneous Voćin section, additional sedimentological characterization is required before gamma-ray data can be used reliably for TOC screening. This behaviour itself serves as a diagnostic criterion for assessing the suitability of gamma-ray proxies in a given sedimentary setting.
Moderate R2 values (~0.20–0.23) indicate that U alone cannot fully explain the TOC variability, reflecting the combined influence of facies heterogeneity, measurement-scale mismatch, weathering-related uranium mobilization, and the inherent complexity of the uranium–organic matter relationship. These results highlight that gamma-ray-based TOC screening should always be interpreted within its sedimentological context, both in outcrop investigations and subsurface applications, where U can support TOC screening in sedimentologically stable successions and guide targeted sampling strategies.




 ,
,