Article

Assessing the Spatial Suitability and Adequacy of Emergency Assembly Areas for Urban Disaster Resilience Using GIS and the Best–Worst Method (BWM): The Case of Malatya, Türkiye


1
Department of Geography, Faculty of Human and Social Sciences, Firat University, Elazığ 23200, Türkiye
2
Department of Forest Industrial Engineering, Bartın University, Barti 74100, Türkiye
3
Elazığ Provincial Disaster and Emergency Management Directorate–AFAD, Elazığ 23040, Türkiye
4
Department of Transportation Services, Vocational School of Technical Sciences, Bitlis Eren University, Bitlis 13100, Türkiye
5
Department of Geography, Faculty of Arts and Science, Inonu University, Malatya 44910, Türkiye
6
Department of Forest Engineering, Faculty of Forestry, Bartin University, Bartin 74110, Türkiye
*
Author to whom correspondence should be addressed.
Appl. Sci. 2026, 16(11), 5206; https://doi.org/10.3390/app16115206
Submission received: 22 April 2026 / Revised: 12 May 2026 / Accepted: 13 May 2026 / Published: 22 May 2026
(This article belongs to the Special Issue Advancing Disaster Resilience Through Geographic Information Systems)

Abstract

The 6 February 2023 Kahramanmaraş earthquakes highlighted the importance of emergency assembly areas for disaster response, evacuation safety, and urban resilience in earthquake-prone cities. Although GIS-based multi-criteria decision-making approaches are widely used to assess spatial suitability, relatively few studies integrate suitability, capacity adequacy, and accessibility within a single framework, particularly in cities directly affected by the 2023 earthquakes. This study evaluates emergency assembly areas in Malatya, Türkiye, using an integrated GIS–Best–Worst Method (BWM) framework. Nine criteria—geology, population density, building density, elevation, slope, distance to roads, distance to rivers, distance to fault lines, and distance to buildings—were weighted based on the judgements of 15 experts involved in Provincial Disaster Risk Reduction Plan (İRAP) processes. The BWM results show that geology and distance to fault lines received the highest weights, whereas distance to roads had the lowest weight. The spatial analysis indicates that highly suitable areas are concentrated mainly in the city centre, while several peripheral neighbourhoods are constrained by geological, topographical, and accessibility-related factors. Existing official emergency assembly areas cover only 27.9% of the population and are located in 13 of 88 neighbourhoods. Estimated access times range from 0 to 5 min in central areas to 10–15 min, or beyond effective service coverage, in peripheral neighbourhoods. Although integrating parks and green spaces substantially increases potential capacity, it does not fully eliminate neighbourhood-level inequalities. The findings provide a spatial decision-support framework for emergency planning in earthquake-prone cities.

1. Introduction

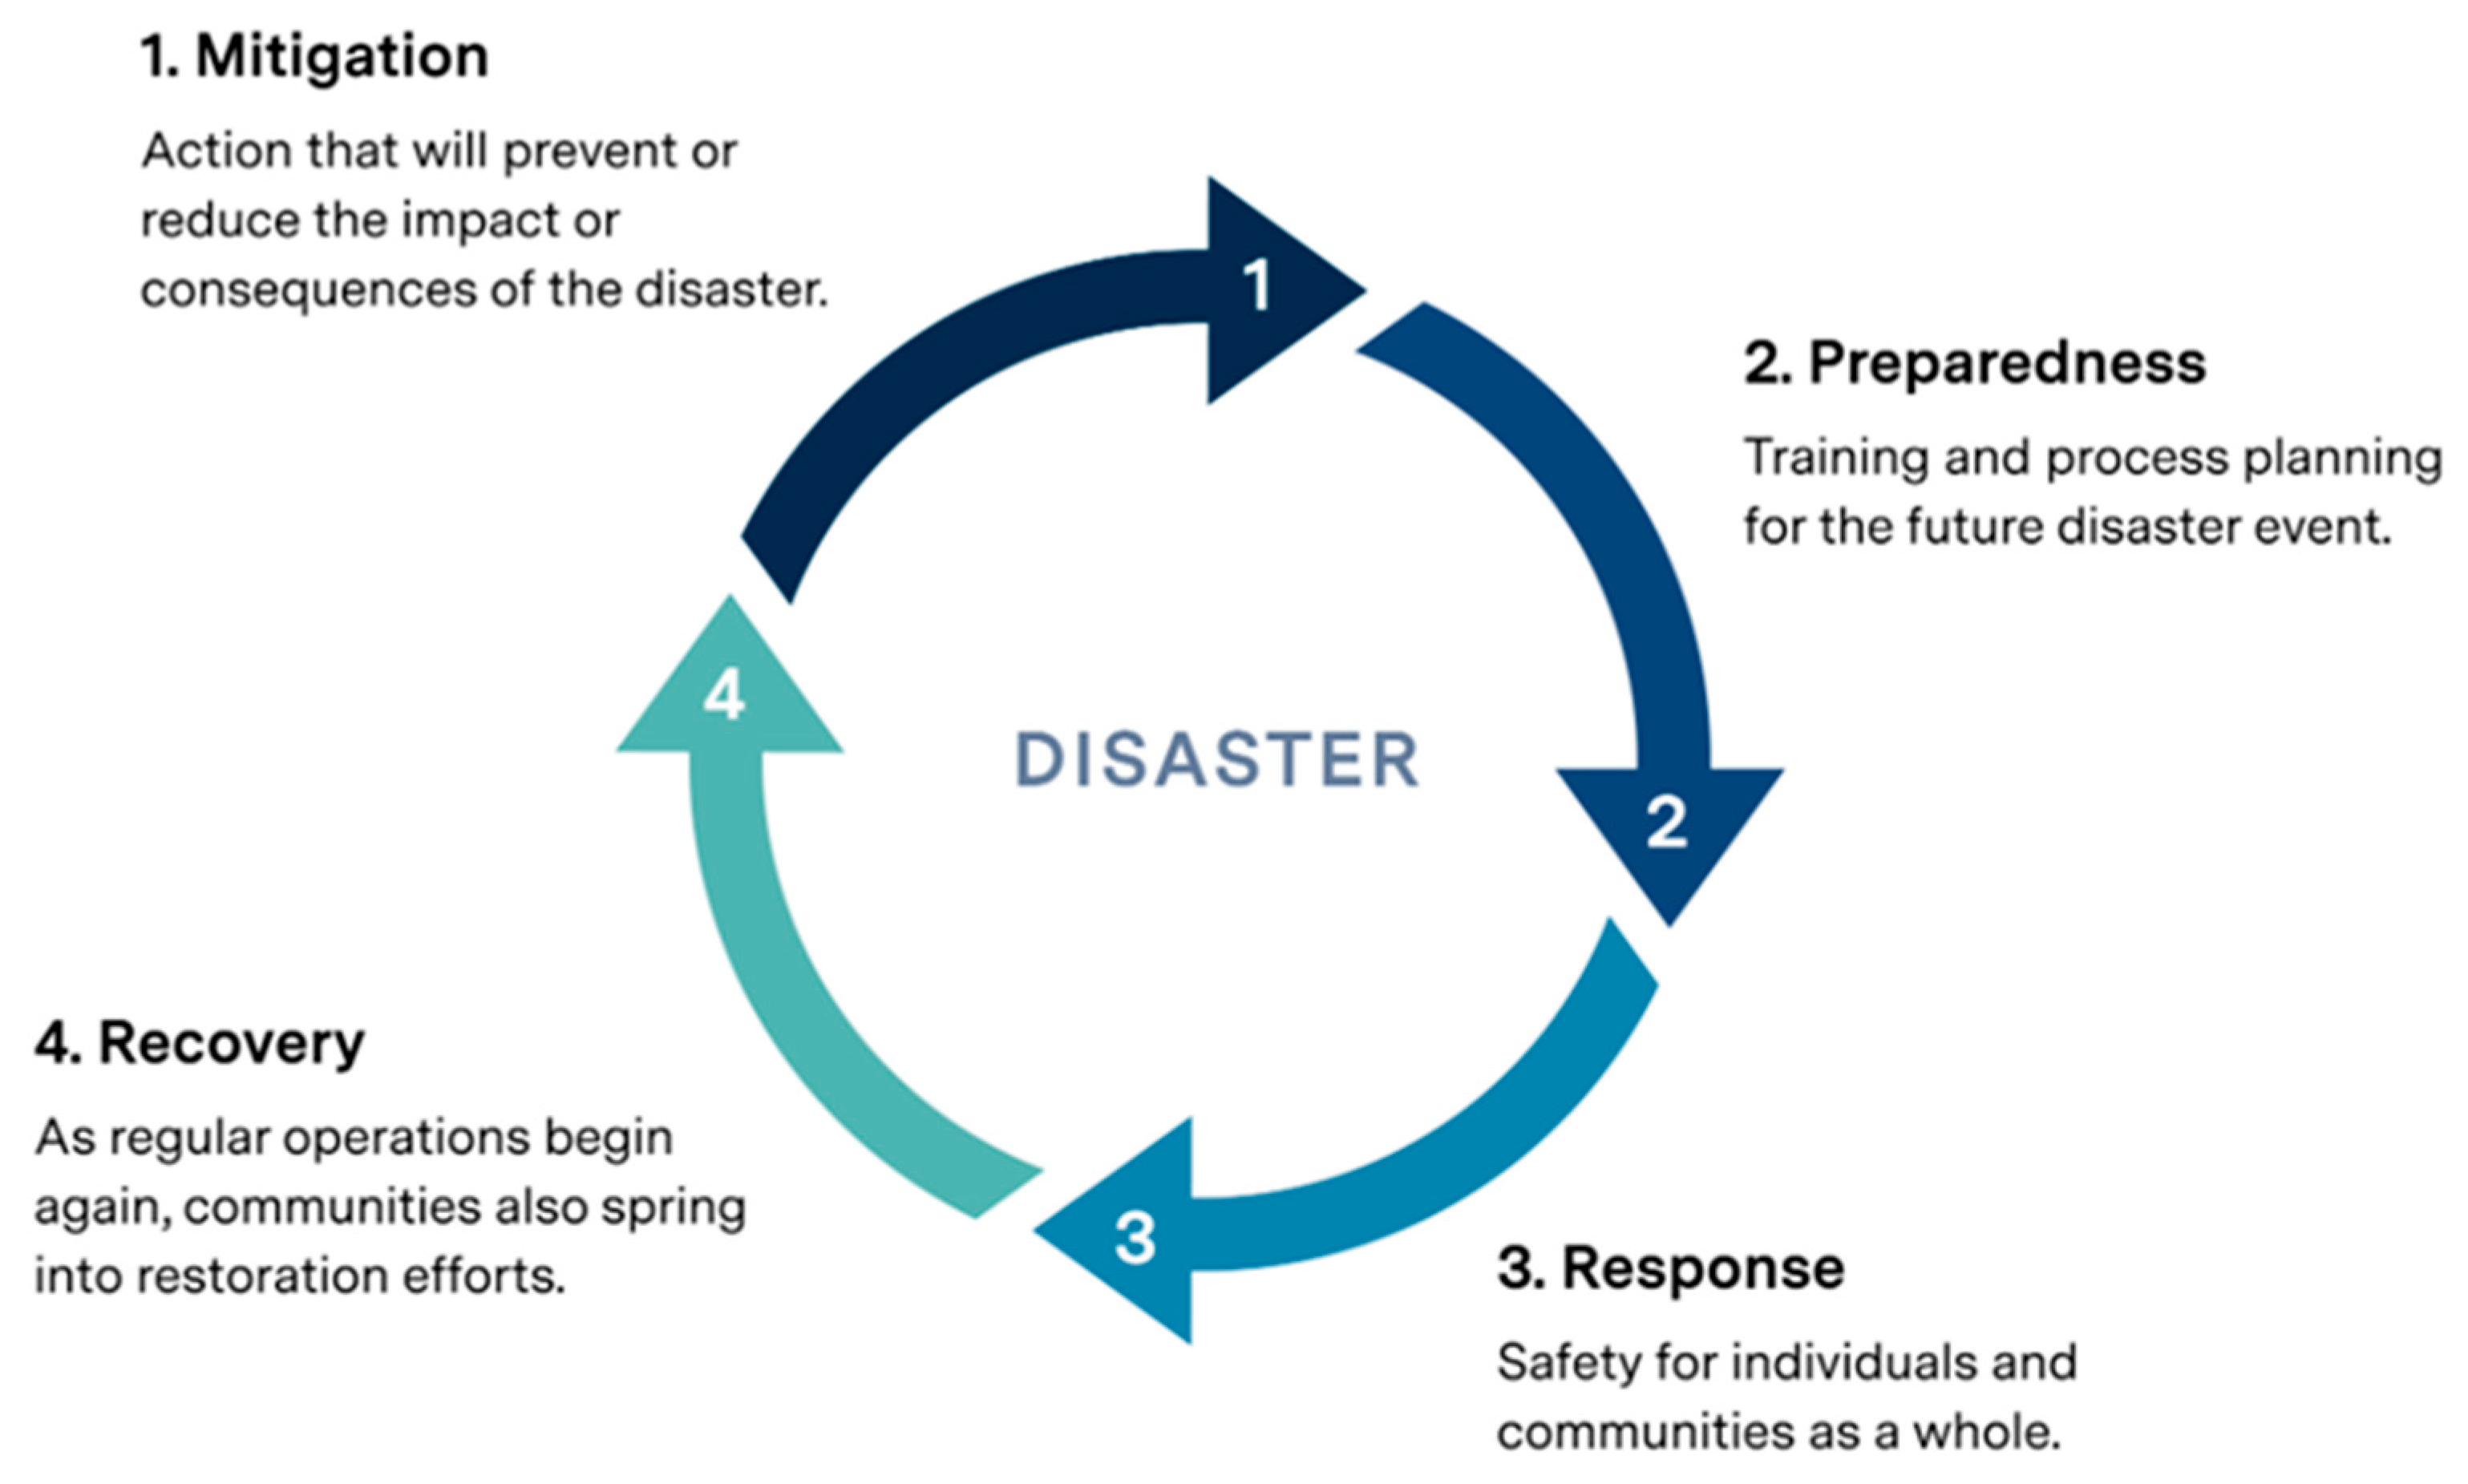
Natural disasters, although acute events, also pose persistent and growing threats to human life, rural and urban settlements, and critical infrastructure worldwide, thereby undermining the resilience of these settlements [1,2]. Earthquakes, in particular, are expected to cause hundreds of thousands of deaths and billions of dollars in economic losses between 2000 and 2025 [3,4]. This risk is further intensified by rapid urbanisation, unprecedented population growth, and unplanned urban development [1,5,6]. As cities expand, they become more densely populated and their infrastructure becomes increasingly complex; this reduces urban resilience while increasing vulnerability to disasters [7,8]. Projections indicate that, by 2050, approximately 75% of the global population will live in urban centres [9], meaning that an increasing number of people will be directly exposed to heightened disaster risks [10]. Consequently, effective emergency management, typically conceptualised through the four fundamental phases of mitigation, preparedness, response, and recovery, has become a priority for public administration and urban governance [11,12] (Figure 1). In this context, disaster preparedness and emergency response planning are of critical importance. Because the timing and magnitude of sudden-onset events such as earthquakes cannot be predicted with certainty, the pre-disaster preparedness phase represents one of the most effective strategies not only for reducing loss of life and property but also for facilitating post-disaster recovery and strengthening overall resilience.
Against this background, resilience has become a central concept in risk management and disaster risk reduction within the modern disaster management cycle. Traditionally regarded as the opposite of fragility, resilience refers to the capacity to withstand adverse conditions, cope with disruptive events, recover rapidly, and adapt to changing circumstances [14,15,16,17,18]. In this context, resilience assessment has become an important concern for decision-makers, researchers, and urban planners involved in both pre- and post-disaster planning [19]. Among the spatial components of urban disaster resilience, the adequacy and accessibility of emergency assembly areas are particularly important. These areas provide safe locations where residents can gather immediately after an evacuation. Their appropriate siting and sufficient capacity are therefore essential for effective post-disaster response and for supporting social recovery.
Emergency assembly areas are defined as safe, predefined, and easily accessible open spaces where residents can gather immediately after evacuation and move away from hazardous built-up zones [4]. These areas play several important roles, especially in the immediate aftermath of destructive disasters such as earthquakes [20]. First, they allow survivors to remain in relatively safe locations while coping with the initial shock of the disaster. Second, they support early response activities, including information sharing, first aid, and short-term emergency assistance. Third, directing residents to the nearest safe assembly area helps disaster managers reduce chaos, panic, and misinformation in densely populated urban environments. This function is particularly important after major earthquakes, when damaged buildings that have not collapsed may still pose serious risks during aftershocks.
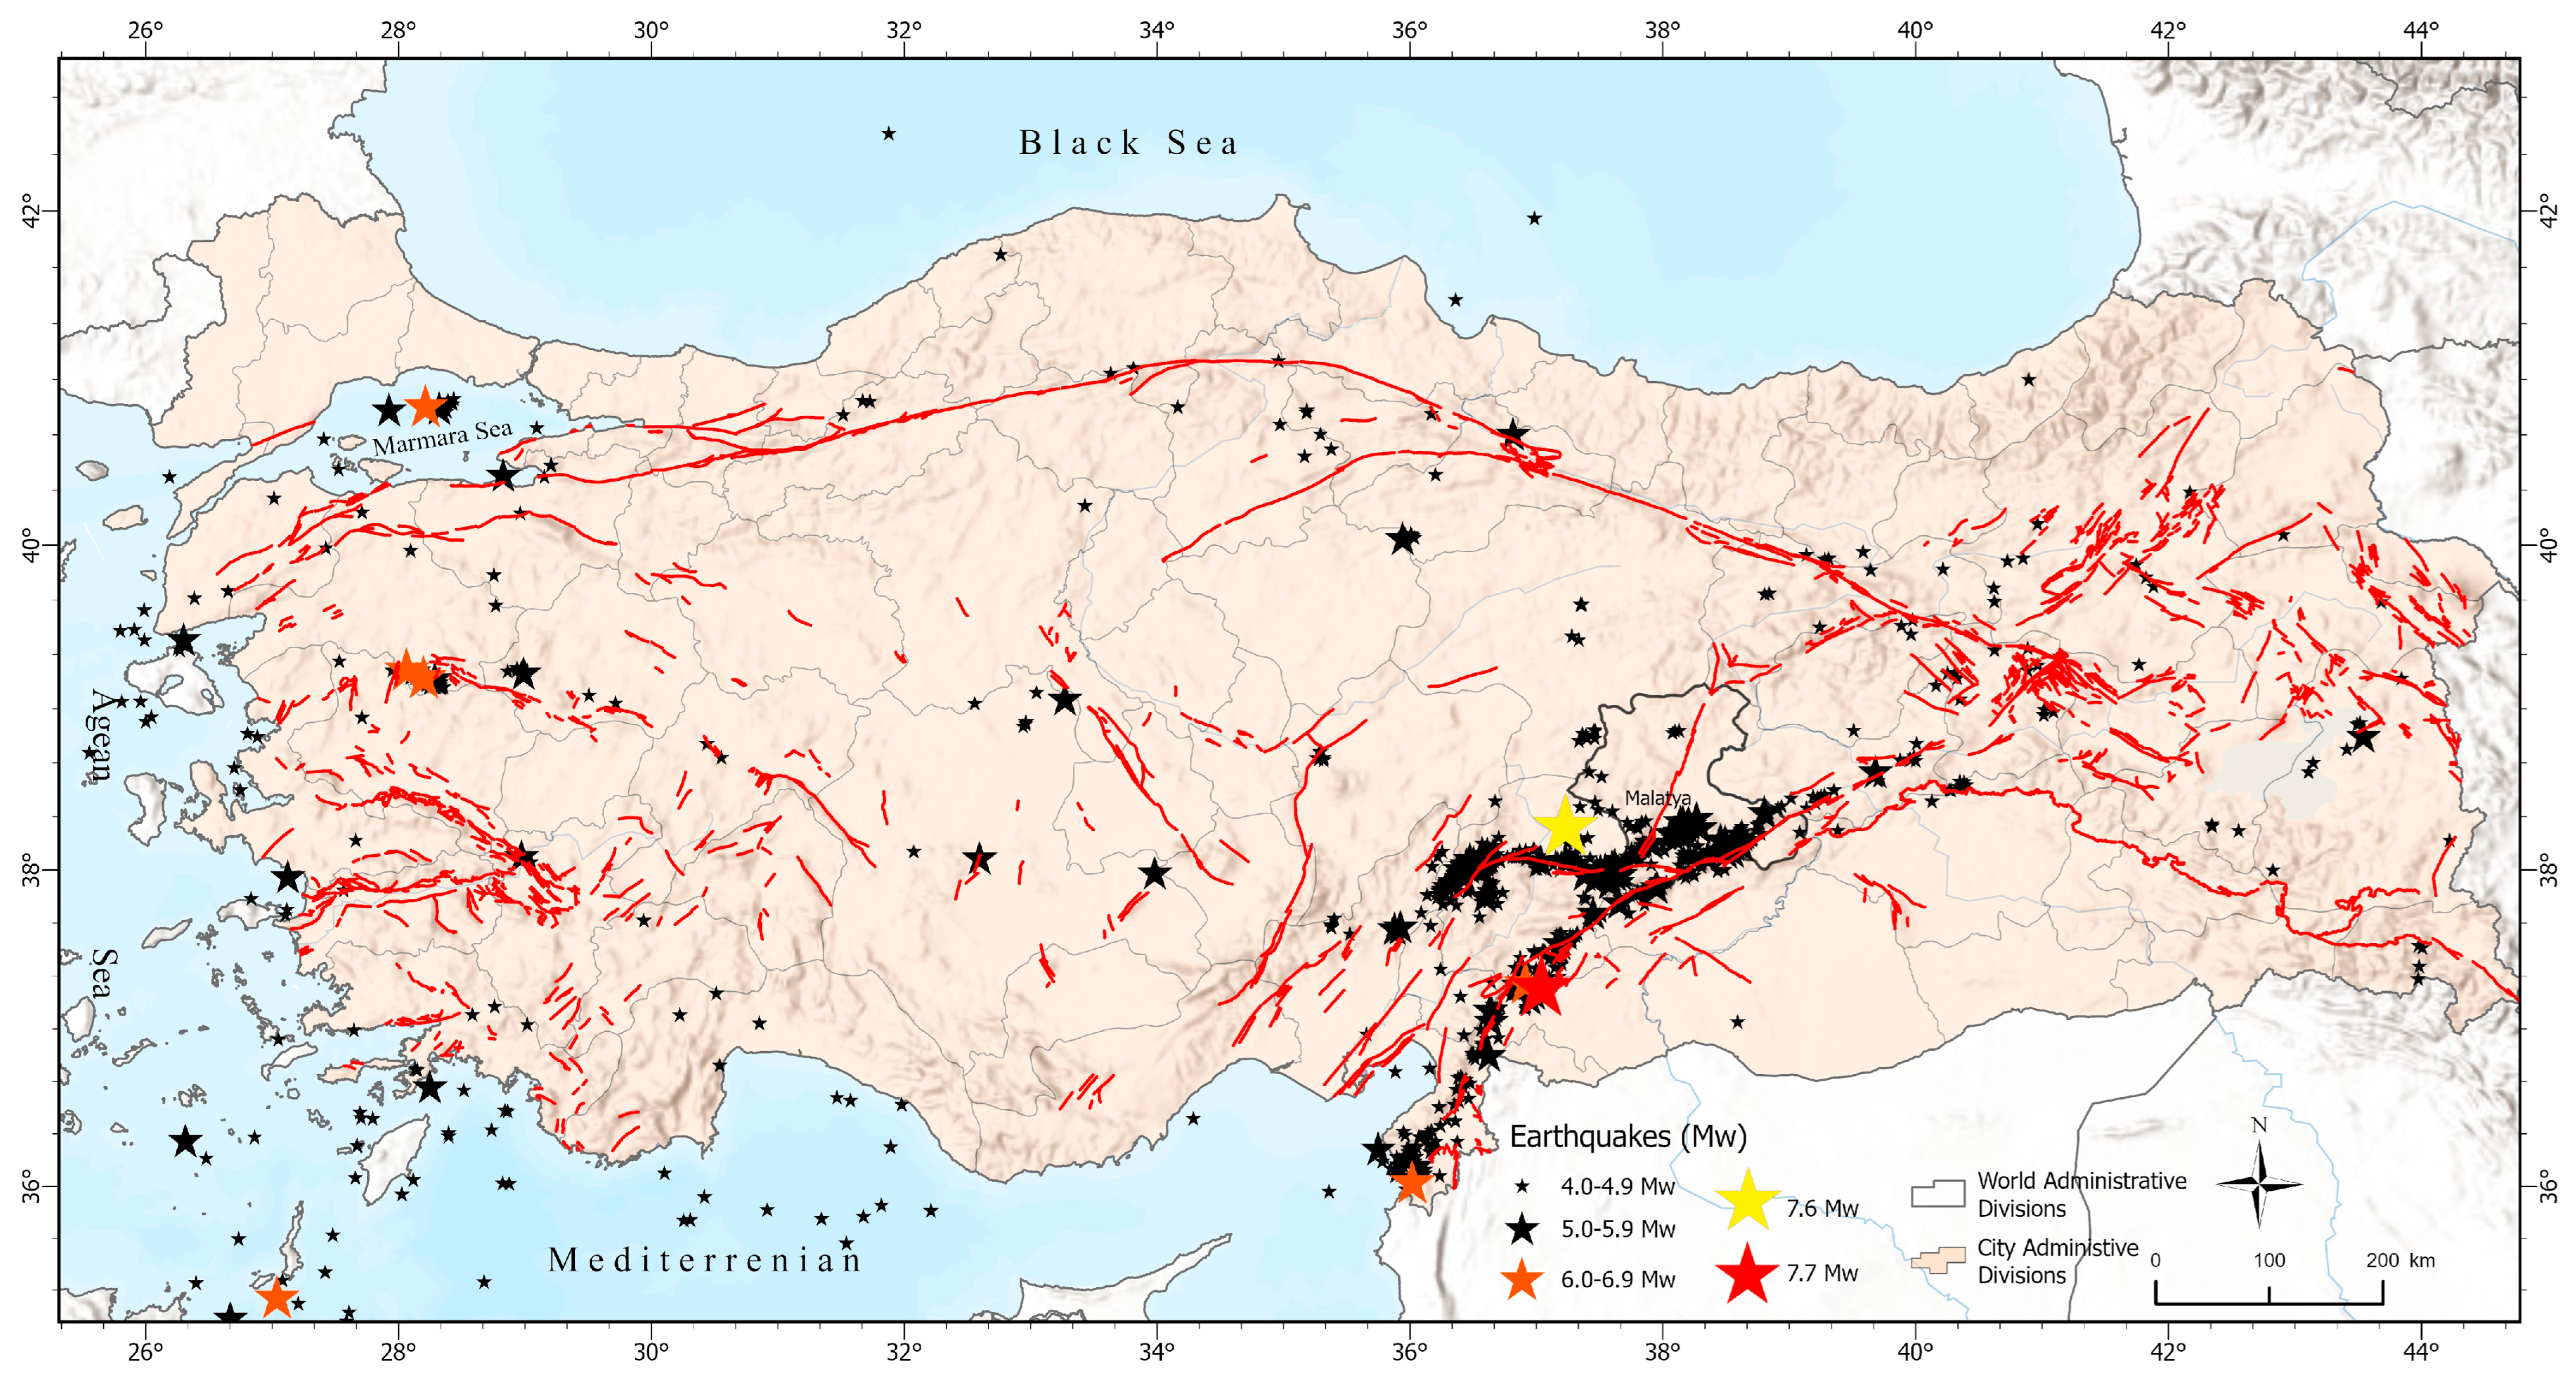
The 7.7 and 7.6 magnitude earthquakes that struck Kahramanmaraş, Türkiye, on 6 February 2023 were followed by more than 285 aftershocks with a magnitude of 4.0 or higher in the region (Figure 2) [21]. This post-earthquake sequence demonstrated that identifying safe and accessible emergency assembly areas is a fundamental step in strengthening urban resilience. In general, criteria such as accessibility, connection to road networks, usability, multifunctionality, ownership status, and site size are considered when selecting disaster assembly areas [22]. The integrated assessment of these criteria is essential for identifying locations that are both safe and accessible under post-disaster conditions. In this regard, Geographic Information Systems (GISs) provide a powerful spatial decision-support tool by enabling the systematic analysis of multiple spatial data layers.
GIS-based spatial analysis enables multiple criteria, such as population density, transport networks, critical infrastructure, and environmental risk factors, to be evaluated simultaneously. This makes it possible to assess the spatial suitability of potential emergency assembly areas in a systematic manner. However, despite its strong spatial analysis capabilities, GIS does not provide a direct mechanism for assigning relative priorities to evaluation criteria, particularly when the criteria are complex and depend on expert judgement [26,27]. For this reason, the integration of GIS with multi-criteria decision-making (MCDM) methods has become increasingly common in spatial planning and disaster management studies [28,29,30]. The main advantage of this integration is that GIS can manage, analyse, and visualise spatial data, while MCDM methods provide a structured framework for evaluating multiple and often competing criteria [26,31]. MCDM approaches are particularly useful in decision-making contexts characterised by uncertainty, limited resources, and complex site selection requirements [32,33,34]. Among these methods, the Best–Worst Method (BWM) has gained increasing attention in spatial planning studies because of its simplicity, transparency, lower comparison burden, and ability to produce more consistent weighting results [5].
A review of the existing literature reveals that GIS and MCDM methods are widely used in the assessment of temporary shelter areas and emergency assembly points following a disaster [29,30,35,36,37]. In this context, whilst methods such as AHP and TOPSIS have traditionally been prominent, there has been a marked increase in the use of the Best–Worst Method (BWM) in recent years, due to its lower inconsistency rate and the fact that it requires fewer comparisons [5,36]. Studies conducted in this context have been carried out in Turkey, particularly in Istanbul [4], Düzce [38], Elazığ [39], Izmir [22] and Tokat [5]. The studies conducted in this context have revealed significant findings regarding the spatial suitability of emergency assembly points in Turkey, particularly in cities such as Istanbul. However, for Malatya, which is situated close to the highly active East Anatolian Fault Zone and suffered severe destruction during both the 2020 Elazığ–Sivrice earthquake and the 2023 Kahramanmaraş earthquakes, there are very few studies that comprehensively assess the adequacy and spatial suitability of emergency assembly areas. In particular, the lack of a data-driven and holistic methodological approach that addresses both the assessment of the spatial distribution and capacity of existing assembly areas and the identification of new potential sites represents a significant gap in the region’s disaster preparedness planning.
Beyond this geographic gap, several systematic limitations also constrain the existing body of research on GIS and MCDM-based assessment of emergency assembly areas [36,40]. First, the majority of existing studies focus primarily on spatial suitability analysis and do not evaluate capacity and accessibility dimensions in an integrated manner [5,36,40]. Consequently, whether the identified suitable areas can adequately meet population demand or remain accessible under emergency conditions often remains unclear. Second, many studies continue to rely on traditional weighting methods such as the Analytic Hierarchy Process (AHP), whereas approaches offering higher consistency and lower comparison burden, such as the Best–Worst Method (BWM), remain relatively underutilised in disaster planning studies [26]. Third, integrated spatial–capacity–accessibility analyses for Turkish cities directly affected by the 2023 Kahramanmaraş earthquakes are still scarce despite the urgent practical need revealed by recent disaster experiences [39]. Furthermore, the fragmented evaluation of spatial suitability, capacity adequacy, and accessibility in the existing literature limits the development of comprehensive decision-support frameworks for disaster preparedness and urban resilience planning. Addressing these limitations within a single analytical framework constitutes the principal motivation and original contribution of the present study.
In this context, the primary objective of this study is to address the aforementioned gap in the literature and to assess the spatial adequacy and suitability of existing and potential emergency assembly areas in Malatya. The study employs an approach that integrates GIS with the BWM, with the aim of identifying areas capable of safely accommodating the city’s population in the event of a potential earthquake. The study aims to assess the adequacy of existing gathering spaces in terms of their spatial distribution, accessibility and population capacity through suitability analyses, whilst also identifying the most suitable alternative locations for new gathering spaces within the urban fabric. It is expected that the findings will contribute to enhancing the city’s disaster preparedness capacity and urban resilience by providing a spatial decision-support tool for local authorities, disaster management agencies and urban planners.

Study Area

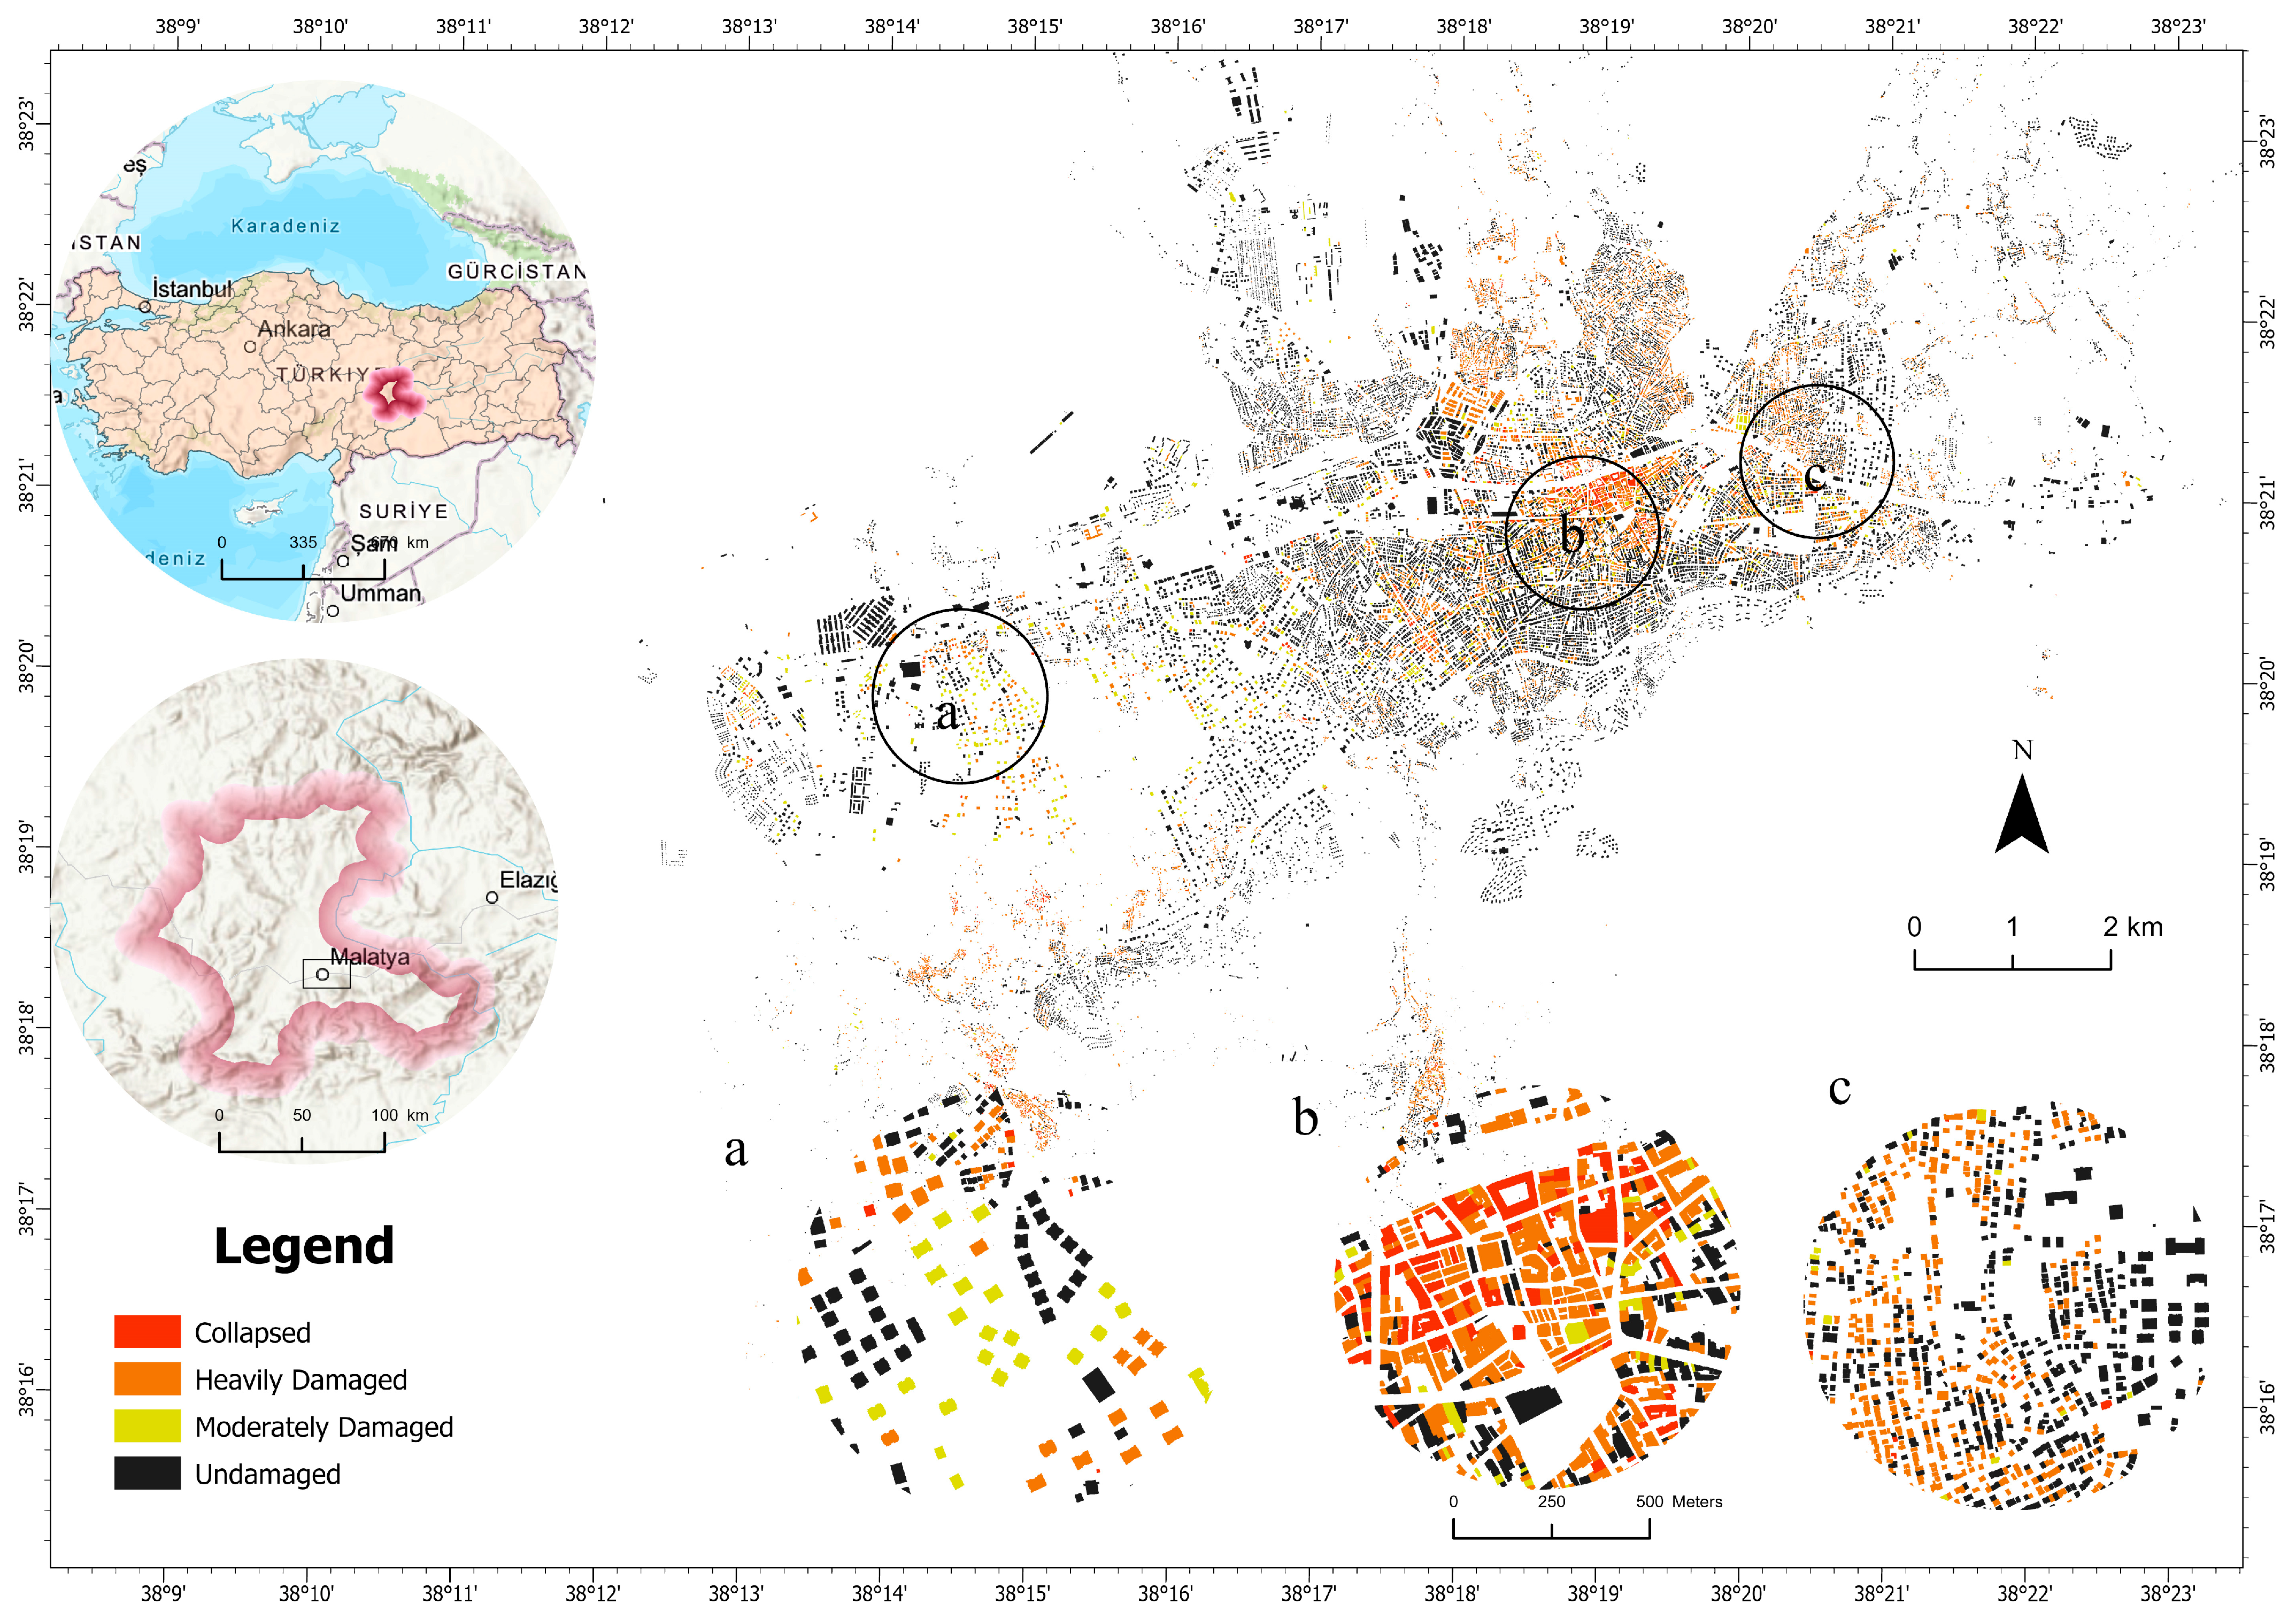
The study area, Malatya, is a mid-sized Anatolian city located in close proximity to the East Anatolian Fault Zone (Figure 3). Geographically, Malatya is situated between 38°21′19.3032″ N and 38°20′0.6972″ E coordinates. The total population of the province is 733,789, while the combined population of Battalgazi and Yeşilyurt districts, which constitute the urban core and the primary focus of the study area, is 557,453 [41]. On 6 February 2023, two devastating earthquakes with magnitudes of Mw 7.7 and Mw 7.6 occurred approximately nine hours apart in the Pazarcık and Elbistan districts of Kahramanmaraş. The first earthquake occurred at 04:17, followed by the second event at 13:24 [42]. These earthquakes caused severe physical destruction ranging from moderate structural damage to complete building collapse across 11 provinces (Adana, Adıyaman, Diyarbakır, Elazığ, Gaziantep, Hatay, Kahramanmaraş, Kilis, Malatya, Osmaniye, and Şanlıurfa), including Malatya, directly affecting a vast geographical area and millions of people [43]. The disaster resulted in substantial damage to buildings, transportation systems, and urban infrastructure, significantly disrupting social and economic life throughout the region. According to post-earthquake damage assessment records for the city centre of Malatya, a total of 32,150 buildings were classified as undamaged, while 1421 buildings were identified as moderately damaged, 12,318 as heavily damaged, and 1009 buildings were reported as collapsed due to the earthquake [44] (Figure 3). These findings indicate a remarkably high concentration of heavily damaged and collapsed structures within the urban core and highlight the critical importance of safe and accessible open spaces for post-disaster emergency management. Due to its proximity to the East Anatolian Fault Zone and the extensive physical and spatial impacts experienced following the earthquakes, Malatya represents a critically important case for evaluating the spatial adequacy, accessibility, and resilience of emergency assembly areas within the framework of post-disaster urban planning.

2. Materials and Methods

This study adopts an approach that integrates GIS and BWM to determine the adequacy and site selection of emergency assembly areas. The study requires the integration of criteria derived from various data sources (Table 1) containing different types of data that influence the selection of disaster assembly points. In this context, use has been made of GIS’s powerful spatial analysis capabilities [36]. The datasets used for the site selection model have been imported into the geographical database. Geographical criteria were established by deriving new data such as geological features, population, building density, elevation, slope, proximity to roads, proximity to watercourses, proximity to faults and proximity to buildings using datasets imported into the geographical database. These criteria have been established on the basis of a literature review, expert opinions and the policies used to designate emergency assembly points. Once the weighing of each criterion had been calculated using BWM, potential assembly areas were spatially analysed using ArcGIS Pro 3.5.0 (Esri, Redlands, CA, USA) software, and the adequacy and suitability of existing assembly areas were determined.

2.1. Emergency Assembly Places and Affecting Criteria

In the face of acute events such as earthquakes, emergency assembly points and access to these areas are among the most critical elements of disaster response plans in urban settlements. Following an earthquake, people should gather at designated locations to receive assistance from first-aid teams and government officials [36]. The most commonly used criteria for identifying these areas where disaster victims are informed, coordination with relief teams is ensured, and they are directed to the temporary accommodation sites to be established are accessibility, connection to transport routes, usability and multifunctionality, ownership and site size [22].
The primary consideration when designating assembly points is the ability to reach pre-designated areas from buildings via the shortest and quickest walking route. Accessibility is defined as the ability of city dwellers to reach these areas from their homes, which constitute their living spaces [45]. There is no specific standard for measuring accessibility to emergency assembly points [46,47]. However, during the analysis process, an average walking speed of 5 km/h (≈1.42 m/s) has been adopted to determine the distance individuals can cover on foot in an emergency [48]. Accordingly, travel times were calculated based on the urban road network, and pedestrian catchment areas were generated for each assembly point. The accessibility analysis was conducted using the service area tool within the ArcGIS Pro 3.5.0 Network Analyst extension based on the existing urban road network of Malatya. Using the ArcGIS StreetMap Premium database, walking accessibility zones were calculated according to actual road connections and travel routes rather than simple Euclidean distance [49,50,51].
t = d w = 1.42   m / s
Another key factor in determining emergency assembly points is the availability of safe areas of sufficient size at the intersection of access routes that have been cleared of structural hazards. In this context, assembly points should be well-connected to main road routes and capable of meeting the immediate needs of the local population in the event of a disaster. In this context, existing active green spaces such as children’s play areas, sports fields, neighbourhood parks, small parks and local parks; passive green spaces, artificial turf pitches; building gardens, school grounds, and the gardens of mosques and hospitals; as well as vacant lots and open-air car parks may be proposed as gathering areas [22]. The main criteria used in the literature and their explanations are set out in Table 2.
Although various criteria have been proposed in the literature for the designation of emergency assembly areas, the responsible authority in Türkiye is the Disaster and Emergency Management Authority (AFAD). According to AFAD, disaster and emergency assembly areas should be selected by considering population density, accessibility, ease of evacuation, and, where possible, accessibility for people with disabilities and older adults. They should also be located away from areas susceptible to liquefaction, active fault lines, and secondary hazards such as fire, flooding, tsunamis, and infrastructure-related risks. In addition, the terrain should be as flat and regular as possible. Assembly areas should be close to residential areas but should not be exposed to structural or non-structural hazards. Proximity to facilities where basic needs such as electricity, water, toilets, and similar services can be provided should also be considered, and suitable public lands should be prioritised wherever possible [54].
In this study, nine criteria were used to determine the spatial suitability of disaster and emergency assembly areas in Malatya. These criteria were selected based on a review of the relevant literature, expert judgements, AFAD-related disaster risk reduction practices, and the physical characteristics of the study area. The criteria included geology, population density, building density, elevation, slope, distance from roads, distance from watercourses, distance from fault lines, and distance from buildings (Table 3). Conceptually, these criteria were grouped under three main dimensions: accessibility, safety, and environmental suitability. Population density, building density, and distance from roads were used to represent demand, urban density, and access conditions. Geology, slope, and elevation were included to assess physical suitability and terrain-related constraints. Distance from watercourses, distance from fault lines, and distance from buildings were used to minimise exposure to secondary hazards, seismic risk, and potential building collapse impacts.
To determine the relative importance of the nine criteria, the Best–Worst Method (BWM) evaluation process was conducted with 15 experts involved in Provincial Disaster Risk Reduction Plan (İRAP) activities in Elazığ and Malatya. The expert panel consisted of academic and technical personnel specialising in disaster management, urban and regional planning, geology/geomorphology, GIS/remote sensing, and civil engineering. Experts were selected based on three main criteria: direct experience in disaster risk reduction and emergency assembly area planning in earthquake-prone regions of Türkiye, professional or academic expertise in spatial planning and disaster management, and familiarity with the study area and its hazard characteristics.
All expert evaluations were obtained through face-to-face structured interviews conducted under identical instructions. During the interviews, the experts independently completed the BWM pairwise comparison forms, including the Best-to-Others and Others-to-Worst preference vectors. Individual criterion weight vectors were first calculated separately for each expert. The final criterion weights were then obtained by aggregating the individual evaluations using the geometric mean approach, which is commonly recommended for group BWM applications. In addition, the consistency ratio (ξ∗) was calculated for each expert evaluation, and only sufficiently consistent responses (CR < 0.25) were included in the aggregation process. The aggregated ξ∗ value of 0.2147 indicates an acceptable level of consistency and reliability in the group decision-making process.

2.2. The Best–Worst Method (BWM)

Previous studies on the adequacy and suitability of post-disaster assembly areas indicate that GIS-based spatial analysis provides an effective tool for producing rapid and interpretable spatial outputs [5,60]. GIS is particularly useful for integrating, processing, and analysing spatial and non-spatial datasets within a common analytical environment [61]. However, GIS alone does not provide a direct mechanism for determining the relative importance of multiple evaluation criteria. For this reason, GIS is commonly integrated with multi-criteria decision-making (MCDM) methods in spatial planning and disaster risk reduction studies [5,36].
In this study, the Best–Worst Method (BWM) was used to determine the relative weights of the criteria included in the spatial suitability analysis. BWM, proposed by Rezaei [62], is an MCDM method based on pairwise comparisons between the most important criterion, the least important criterion, and the remaining criteria. Compared with traditional methods such as the Analytic Hierarchy Process (AHP), BWM requires fewer pairwise comparisons and generally produces more consistent results. Therefore, it has been increasingly used in site selection and disaster planning studies [5]. In the present study, BWM was preferred because it provides a transparent, consistent, and relatively simple weighting procedure for expert-based decision-making.
The BWM procedure applied in this study consisted of six main steps [62]:
Step 1: Identification of evaluation criteria
The decision criteria affecting the suitability of emergency assembly areas were first identified. In this study, nine criteria were used: geology, population density, building density, elevation, slope, distance to roads, distance to watercourses, distance to fault lines, and distance to buildings.
Step 2: Selection of the best and worst criteria
The experts selected the best criterion, representing the most important factor, and the worst criterion, representing the least important factor, among the nine criteria (Table 4).
Step 3: Determination of the preference of the best criterion over the other criteria
The preference of the best criterion over each of the other criteria was determined using a scale from 1 to 9, where 1 indicates equal importance and 9 indicates extreme importance. This step produces the Best-to-Others vector:
A B = ( a B 1 ,   a B 2 , . a B n )
where a B j represents the preference of the best criterion B over criterion j .
Step 4: Determination of the preference of all criteria over the worst criterion
In this step, each criterion was compared with the worst criterion using the same 1–9 preference scale. This produces the Others-to-Worst vector:
A W = a 1 W , a 2 W , , a n W T
where a j W represents the preference of criterion j over the worst criterion W . By definition, the comparison of the worst criterion with itself equals 1:
a W W = 1
Step 5: Calculation of optimal criterion weights
The optimal weights of the criteria are obtained by minimising the maximum absolute deviations between the pairwise comparison values and the ratios of the corresponding weights. The objective is to determine the optimal weight vector:
W * = w 1 * , w 2 * , , w n *
The original non-linear BWM model is expressed as follows:
m i n m a x j w B w j a B j , w j w W a j W
j w j = 1
w j 0 , for   all   j
This model can be transformed into the following linear programming model:
min ξ
w B a B j w j ξ , for   all   j
w j a j W w W ξ , for   all   j
j w j = 1
w j 0 , for   all   j
where ξ represents the maximum deviation and is used to evaluate the consistency of the pairwise comparisons.
Step 6: In the final step, the consistency of the expert comparisons was assessed. The consistency ratio was calculated as follows:
C R = ξ C I
where C I represents the consistency index corresponding to the Best-to-Worst comparison value. A lower C R value indicates a higher level of consistency in the expert judgements. In BWM, the consistency ratio is used not only to assess the reliability of the comparison process but also to indicate the confidence level of the derived criterion weights (Table 5) [5].
Within the GIS environment, multi-criteria spatial decision analysis was performed by integrating the BWM-derived criterion weights with spatial data layers. This process enabled the production of a composite suitability map for emergency assembly area planning. The thematic layers used in the analysis included geology, population density, building density, elevation, slope, distance to roads, distance to watercourses, distance to fault lines, and distance to buildings. All spatial data were processed and organised in ArcGIS Pro 3.5.0 using the WGS 1984 UTM Zone 37N projected coordinate system.
To ensure spatial consistency, all thematic layers were converted into raster format (12.5 m) using the same cell size, spatial extent, and snap-raster settings. Each criterion layer was then reclassified into three suitability classes: low suitability, moderate suitability, and high suitability. The reclassification thresholds were determined based on AFAD technical guidelines, the relevant literature, expert judgement, and the natural breaks (Jenks) classification method where appropriate. This standardisation process ensured that all criteria could be compared on a common suitability scale.
The weighted overlay analysis was conducted using the weighted overlay tool in the Spatial Analyst extension of ArcGIS Pro 3.5.0. The influence value of each criterion was assigned according to its BWM-derived weight. The weighted layers were then combined to generate the final composite suitability surface. Finally, the resulting suitability map was reclassified into three categories: unsuitable, suitable, and highly suitable. The natural breaks (Jenks) method was used to define the final suitability categories because it identifies natural groupings within the spatial distribution of suitability values.

2.3. Capacity Calculation

The capacity assessment of emergency assembly areas was carried out using the AFAD standard of 2.5 m2 per person [38]. For each neighbourhood i , the available capacity C i and the required capacity R i were calculated as follows:
C i = A i 2.5   m 2  
R i = P i × 2.5
G i = A i R i
where A i is the total area of officially designated assembly points (and, where indicated, also of parks and open green spaces) within neighbourhood i in m2, P i is the resident population of neighbourhood i according to TURKSTAT 2025 data, and G i is the surplus (>0) or deficit (<0) capacity in m2. A neighbourhood was classified as ‘sufficient’ when G i ≥ 0 and ‘insufficient’ when G i < 0.
The calculation rests on three explicit assumptions: (i) simultaneous use: the entire resident population of a neighbourhood is assumed to require assembly space at the same moment, representing a worst-case demand scenario; (ii) no overflow/no inter-neighbourhood redistribution: residents are assumed to use only the assembly points located within their own neighbourhood, so that surplus capacity in one neighbourhood cannot offset deficits in adjacent ones; and (iii) static population: only the resident population is considered, excluding daytime mobile populations such as commuters, students and visitors. These assumptions yield conservative deficit estimates at the neighbourhood scale and are appropriate for highlighting structural inequalities in capacity distribution.

3. Results

3.1. Neighbourhood-Level Adequacy and Accessibility of Emergency Assembly Areas

Emergency assembly areas are predefined safe open spaces where residents can gather temporarily before the establishment of temporary accommodation centres after disasters and emergencies [54]. These areas play a key role in reducing panic during the initial response phase, supporting safe evacuation, and enabling coordinated information flow. Therefore, distance from structural risks, accessibility, connection to transport networks, and sufficient site capacity are essential criteria for evaluating the adequacy of emergency assembly areas.
The study area comprises the city centre of Malatya, including the two central districts of Battalgazi and Yeşilyurt, and covers 88 neighbourhoods. According to the Turkish Statistical Institute data for 2025, the total population of the study area is 557.453. Official data published by the Presidency of Disaster and Emergency Management indicate that Malatya has 35 designated emergency assembly areas, with a total area of 407,554.3 m2, corresponding to approximately 40.8 ha. However, the neighbourhood-level distribution of these areas is highly uneven. Only 13 of the 88 neighbourhoods, corresponding to 14.8%, have an officially designated emergency assembly area. This indicates that the spatial coverage of official assembly areas across the city is limited and uneven (Appendix A).
Based on the AFAD-recommended standard of 2.5 m2 per person, the total emergency assembly area required for a population of 557,453 is approximately 1,393,632.5 m2, or 146.11 ha. In contrast, the existing official emergency assembly areas provide only 407,554.3 m2. This corresponds to 29.2% of the required area. Given that Malatya was directly affected by the 6 February 2023 Kahramanmaraş earthquakes, this finding indicates a substantial capacity deficit in terms of mass evacuation and safe assembly needs. The current distribution and capacity of assembly areas therefore reveal a critical planning gap in the city’s disaster preparedness system.
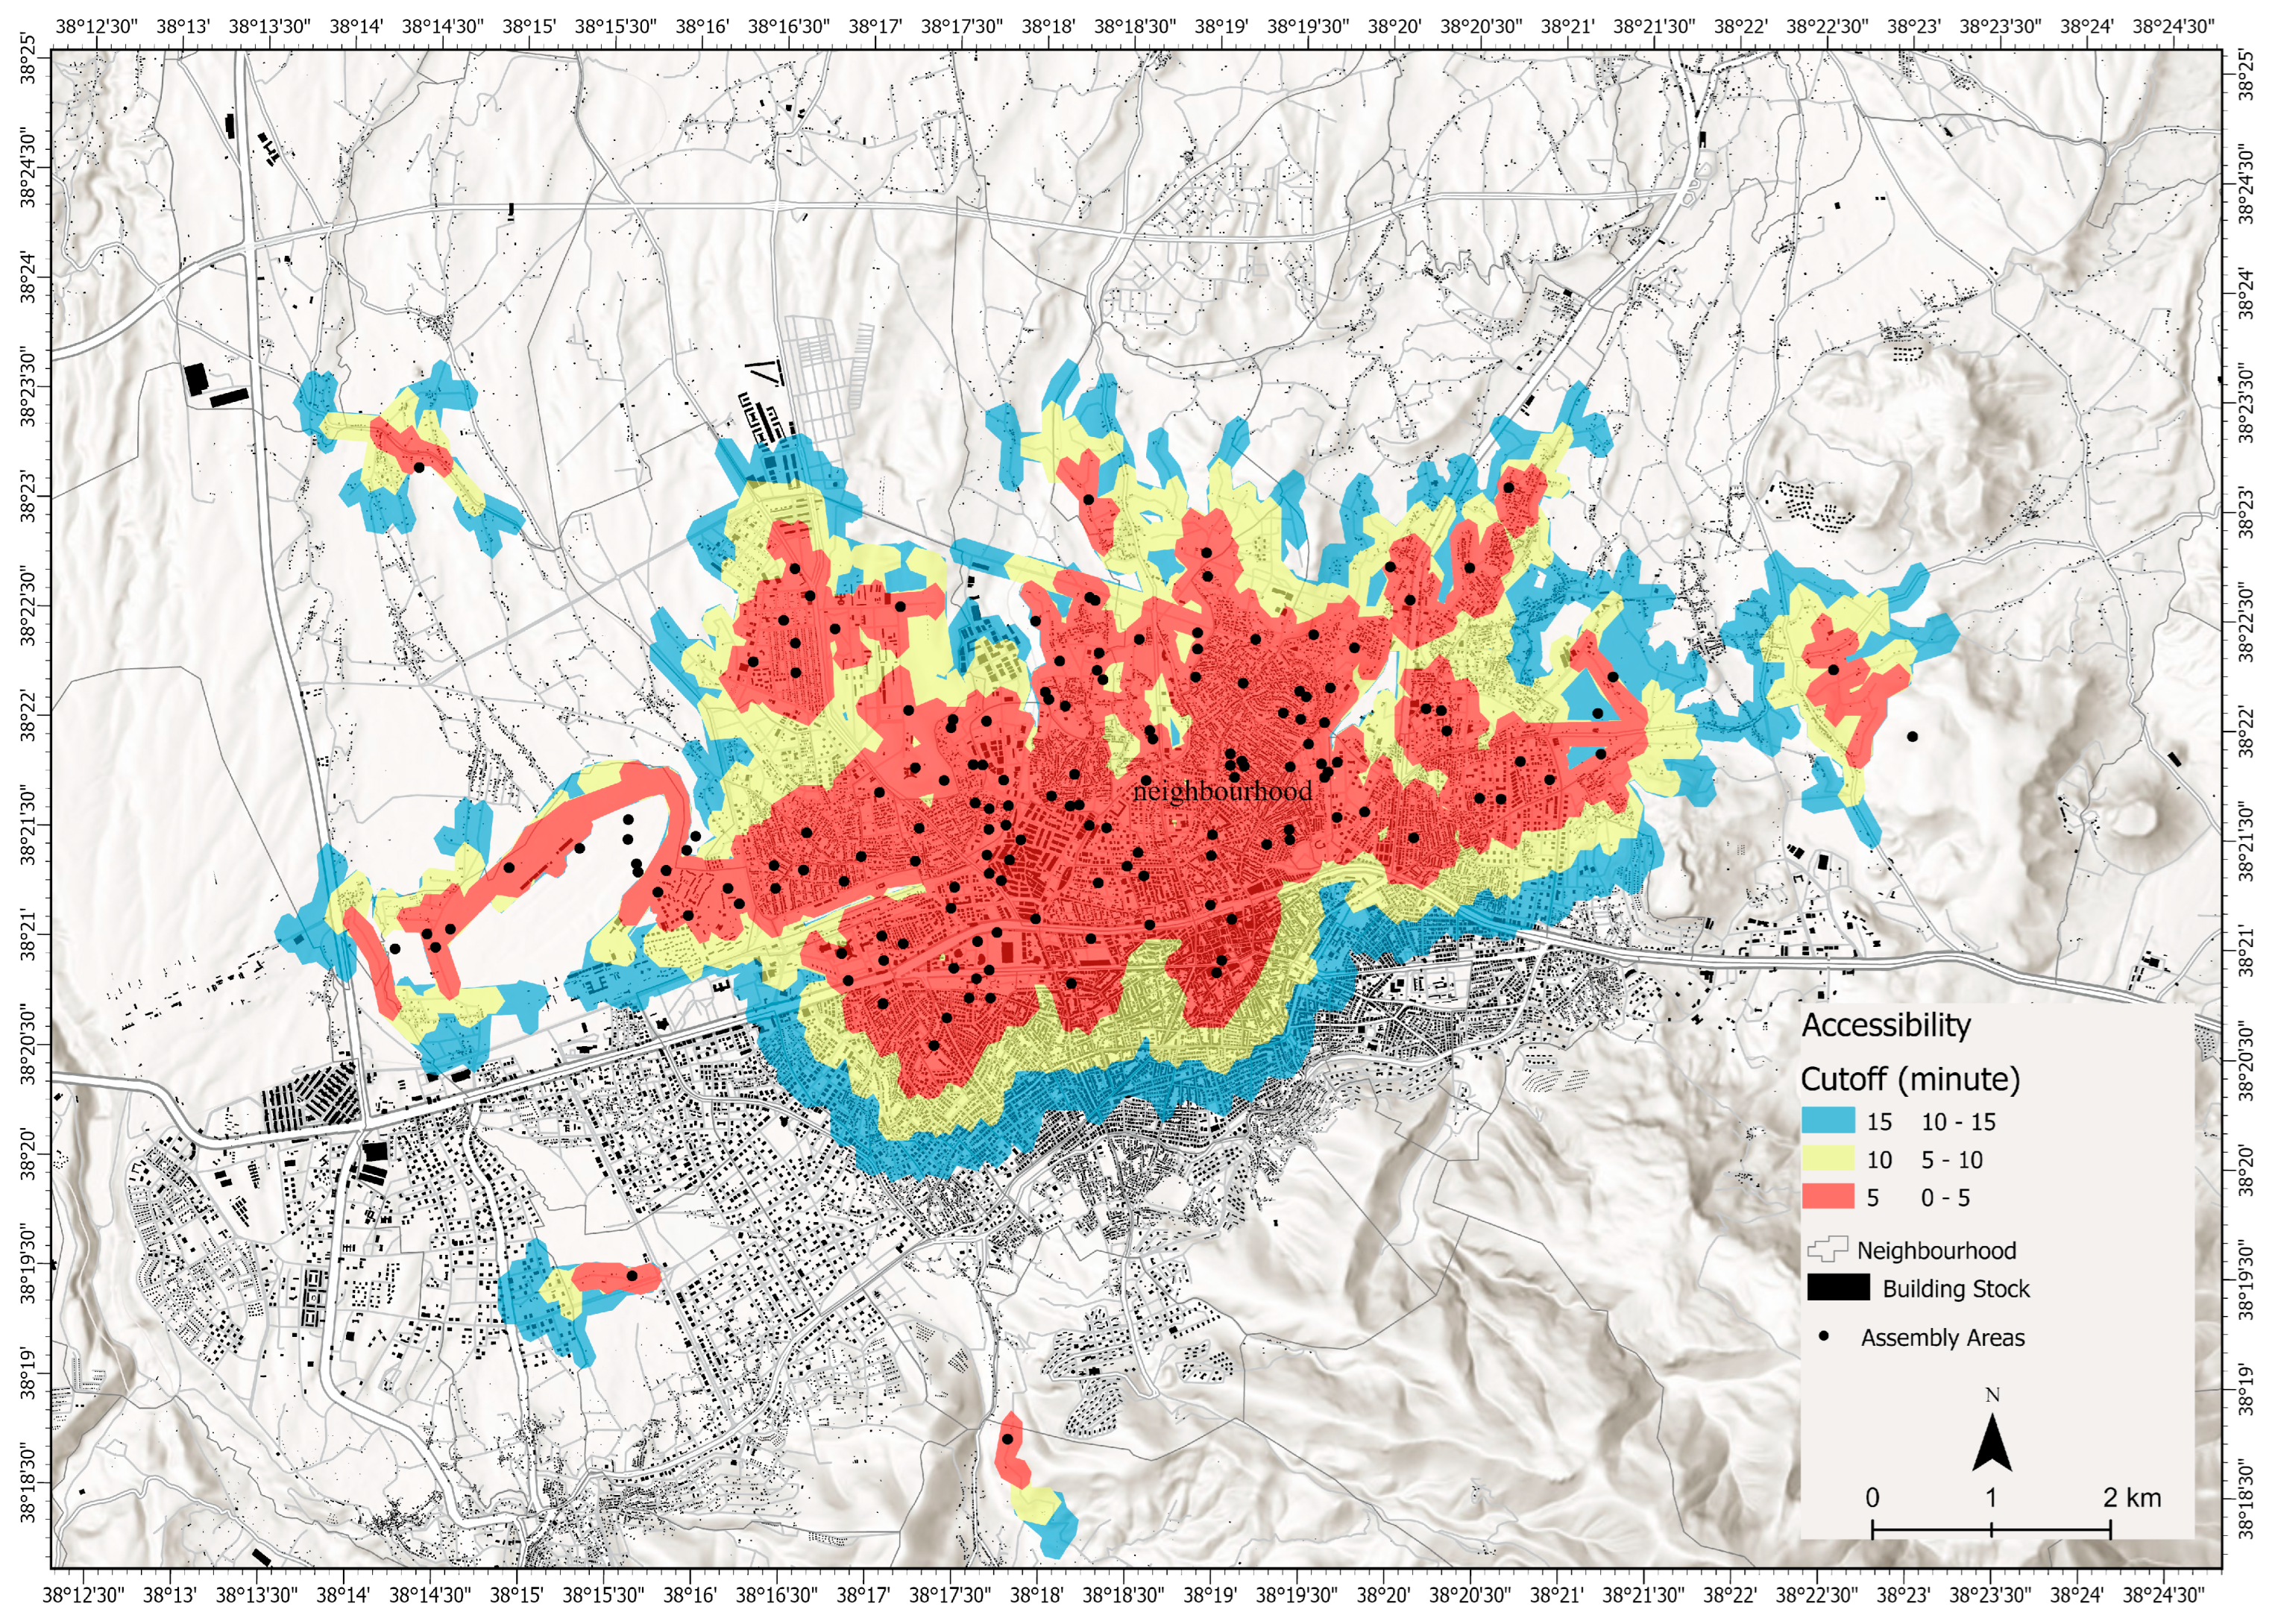
The accessibility analysis further shows that capacity deficiencies are accompanied by spatial access inequalities. Existing emergency assembly areas are mainly concentrated in the city centre, where their catchment areas largely fall within 0–5 min walking zones. By contrast, in peripheral neighbourhoods, walking times extend to 10–15 min, and some residential areas remain outside the effective service coverage of the transport network (Figure 4). This pattern suggests that residents in peripheral neighbourhoods face spatial disadvantages in accessing safe assembly areas after a disaster.
Overall, the existing emergency assembly areas in Malatya are insufficient in terms of both capacity and accessibility. The combination of limited assembly area capacity and longer access times in some neighbourhoods may create operational challenges during post-disaster evacuation and assembly processes. Therefore, new emergency assembly areas should be planned, particularly in neighbourhoods with accessibility gaps. Existing parks and open spaces should also be assessed as potential complementary assembly areas. In addition, assembly areas should be spatially redistributed according to population density, accessibility needs, and local hazard conditions. Such a planning approach would contribute to strengthening Malatya’s urban disaster resilience.

3.2. Calculation and Mapping of Criterion Weights Using BWM

In this study, the Best–Worst Method (BWM) was used to calculate the weights of the criteria used in the spatial suitability analysis of emergency assembly areas. In the first stage, nine criteria were identified based on the literature review and expert opinions. These criteria were geology, population density, building density, elevation, slope, distance from roads, distance from watercourses, distance from fault lines, and distance from buildings. In the second stage, the most and least important criteria were determined based on expert assessments. Accordingly, C1–Geology was identified as the most important criterion, whereas C6–Distance from Roads was identified as the least important criterion. In the third stage, the Best-to-Others vector was constructed by assigning preference scores from the best criterion to the remaining criteria. In the fourth stage, the Others-to-Worst vector was obtained by assigning preference scores from each criterion to the worst criterion (Table 6).
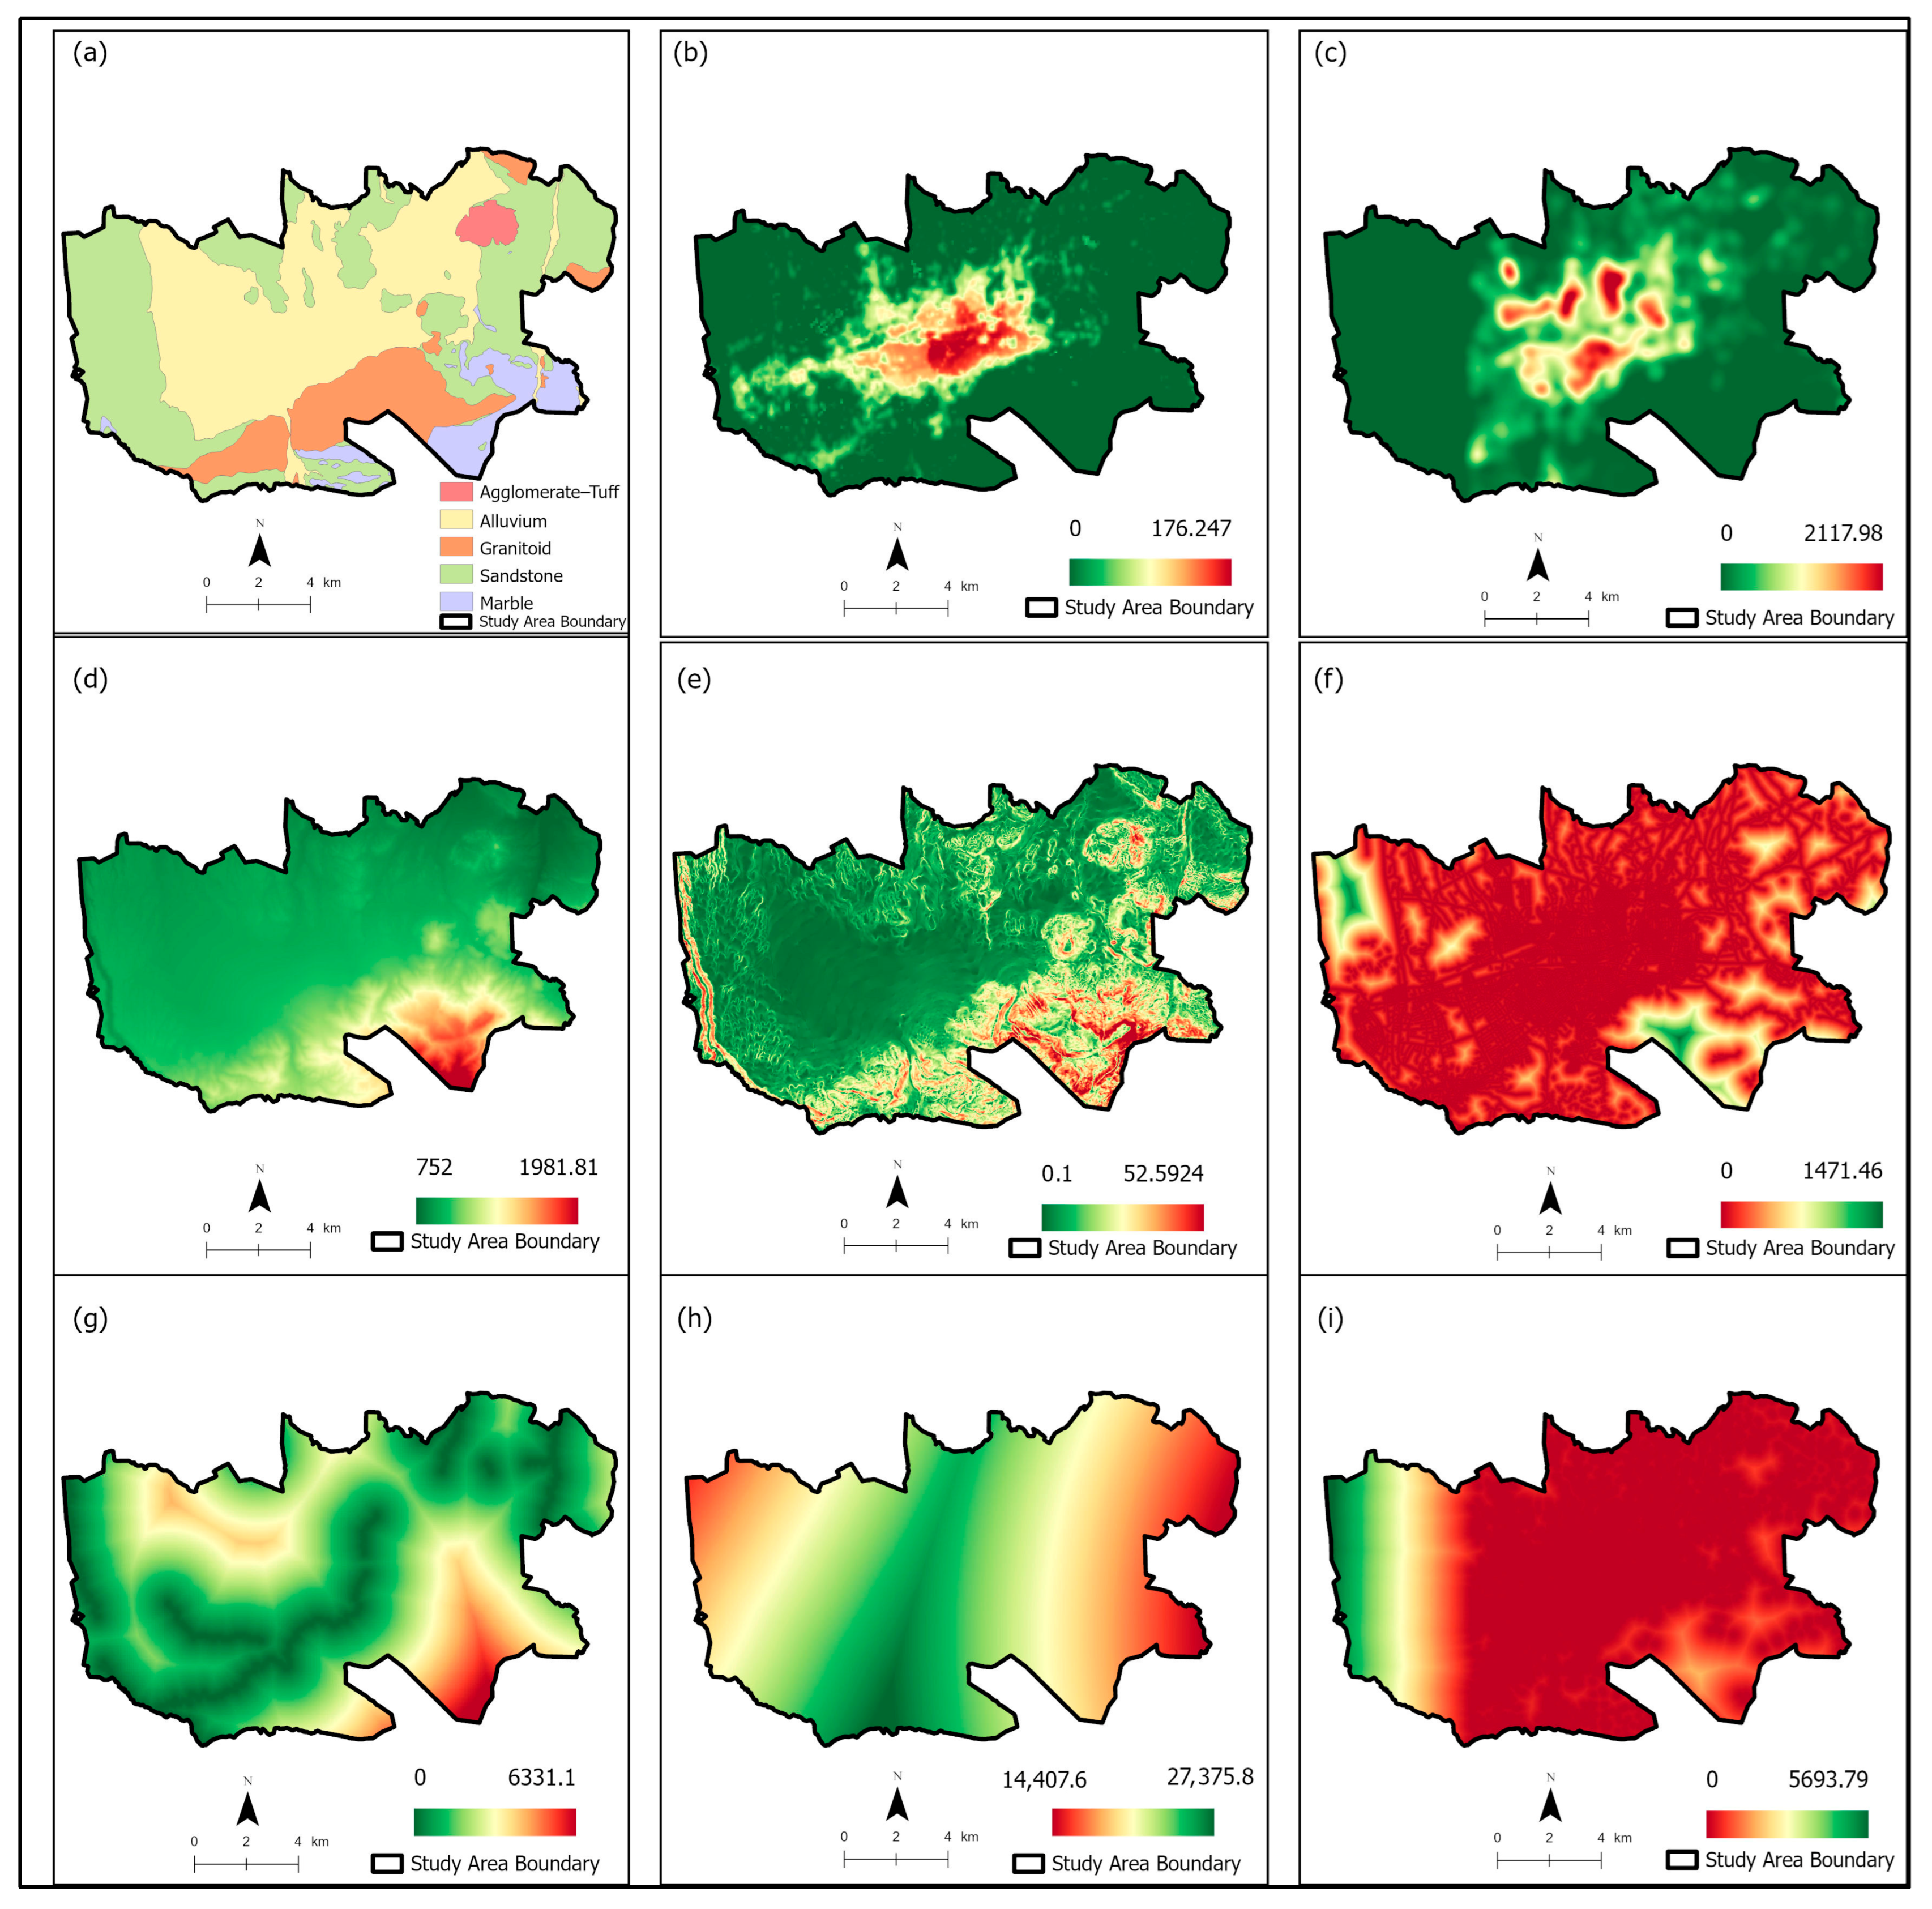
In the final stage, the linear programming model was solved to calculate the optimal criterion weights and the consistency value. The highest weights were assigned to C1–Geology and C8–Distance from Fault Lines, both with a weight of 0.2147, corresponding to 21.5%. These were followed by C2–Population Density with 0.1431, C5–Slope with 0.1073, and C3–Building Density with 0.0859. Lower weights were assigned to C7–Distance from Watercourses with 0.0716, C4–Elevation with 0.0613, and C9–Distance from Buildings with 0.0537. The lowest weight was assigned to C6–Distance from Roads, with a value of 0.0477 (Table 7 and Table 8; Figure 5).
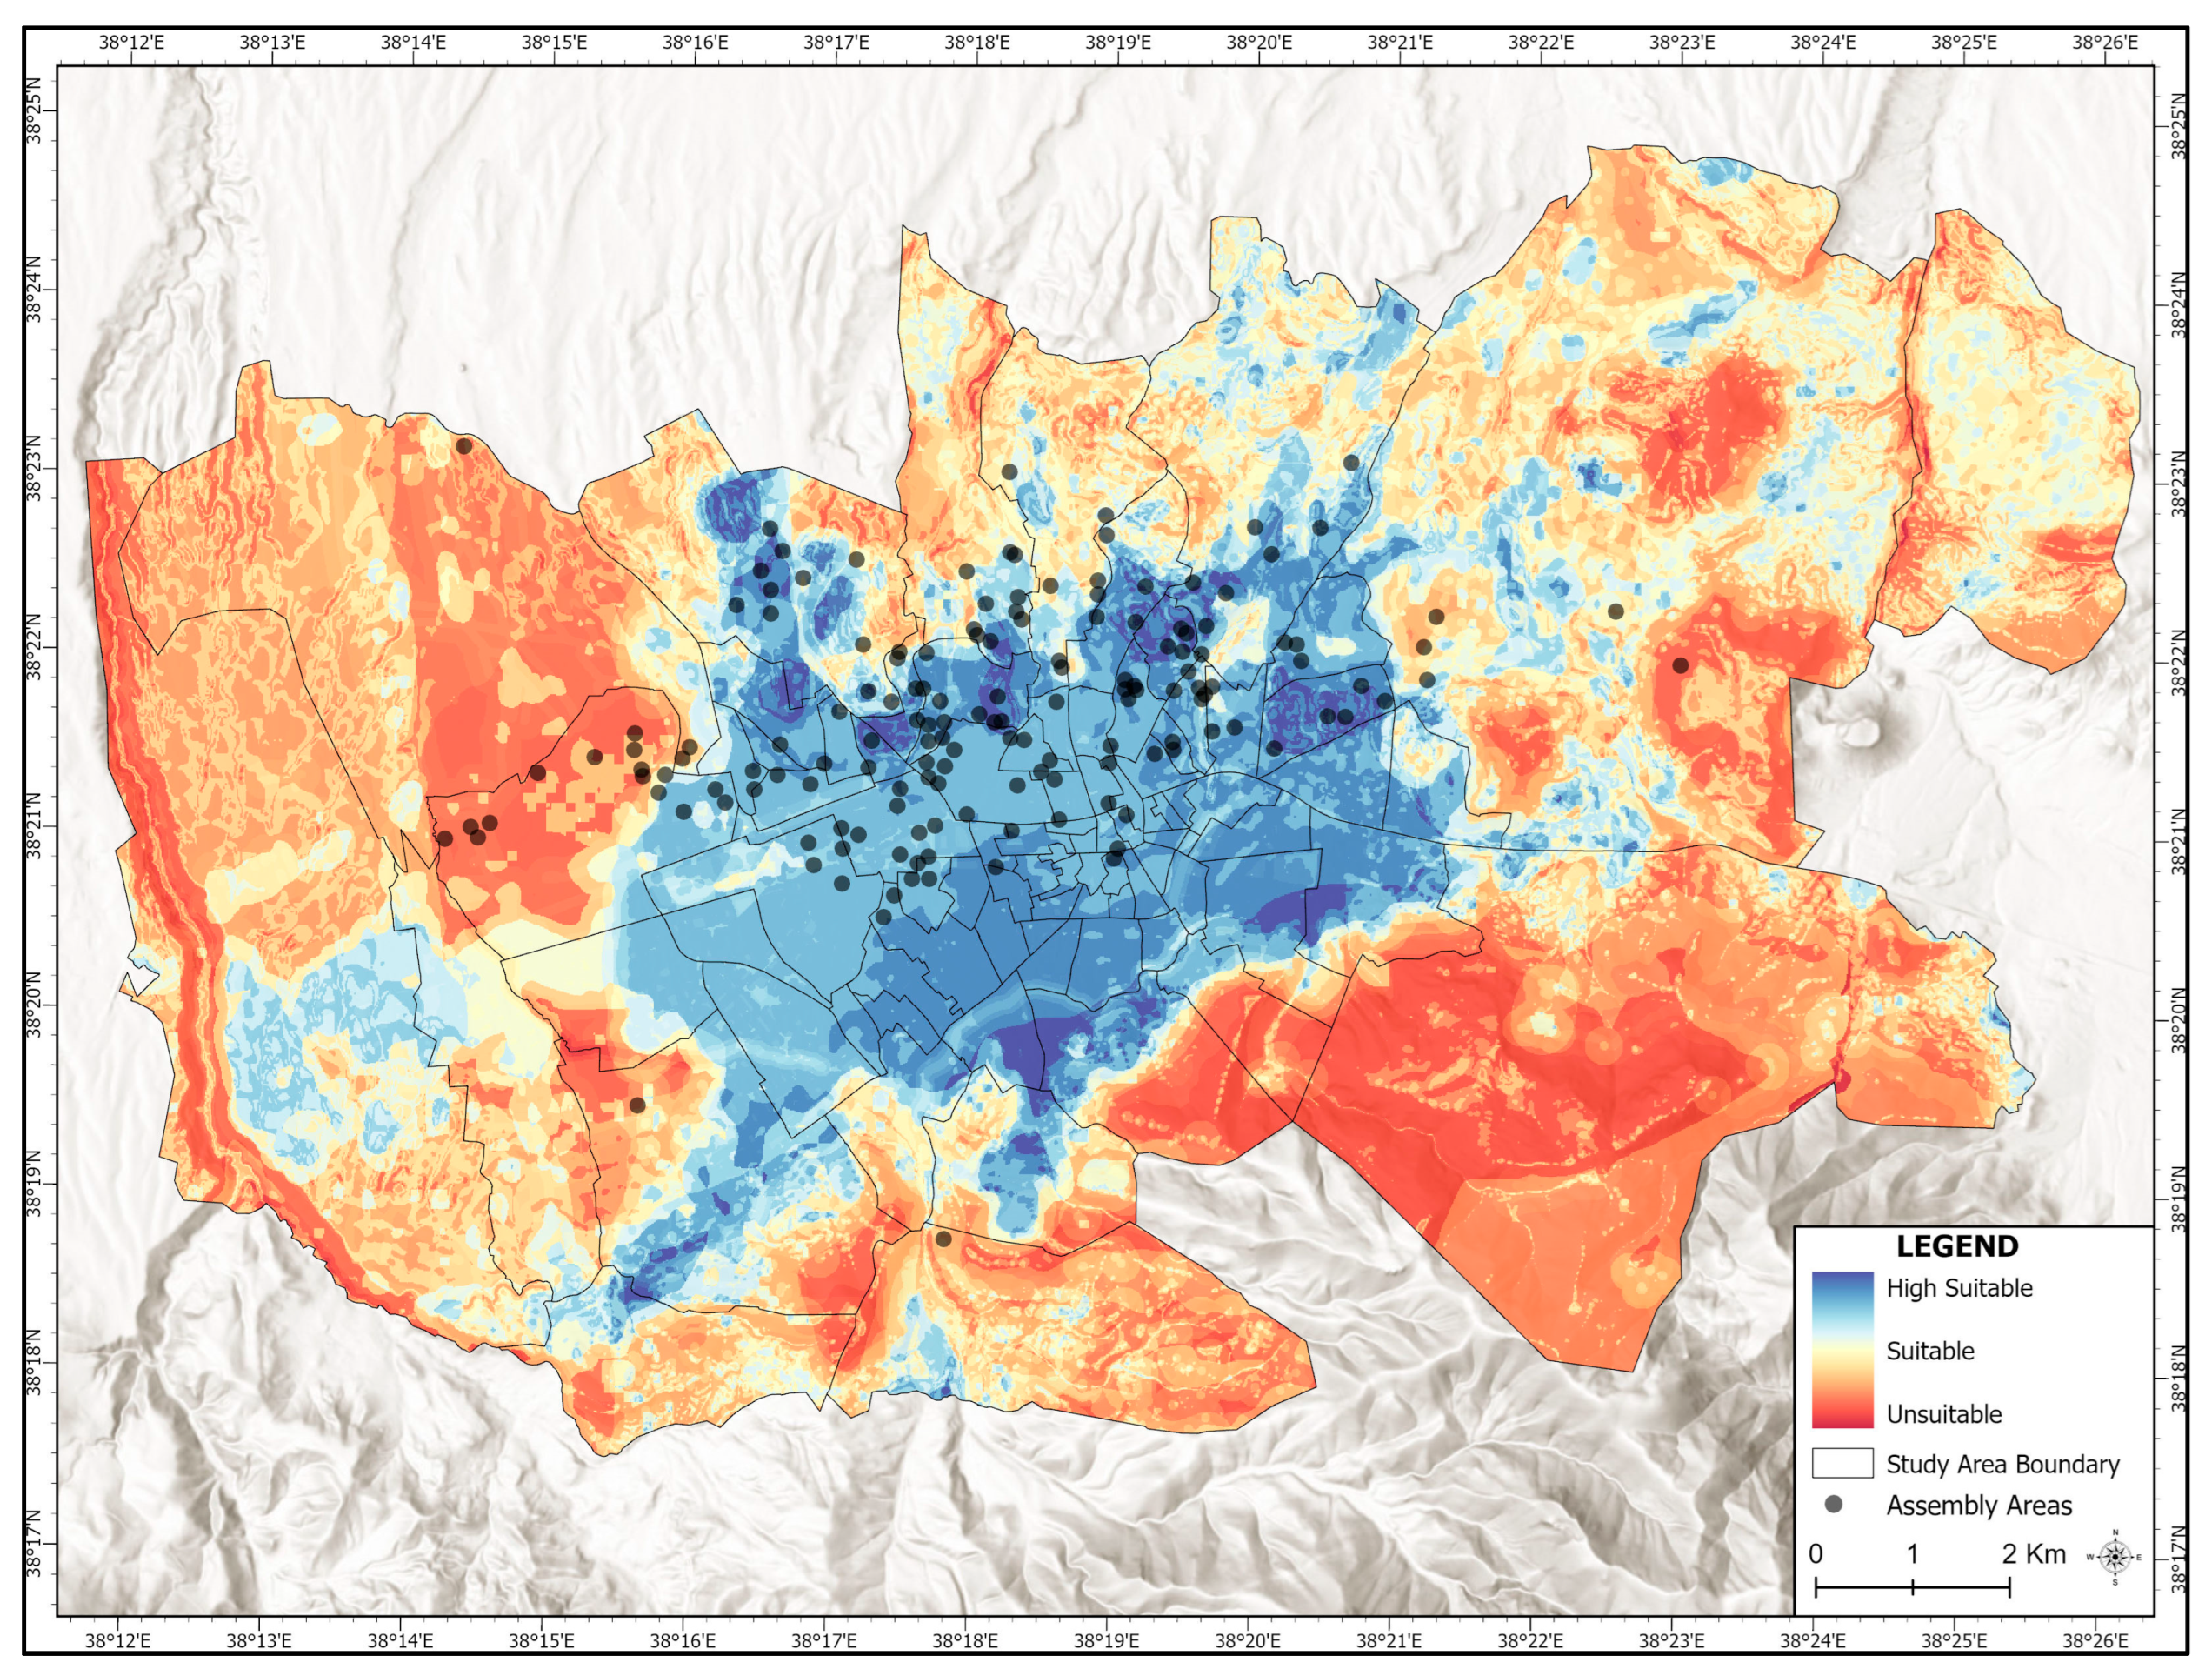
The BWM results show that geology and distance from fault lines received the highest and equal weights. This indicates that ground conditions and proximity to active faults are the most influential factors in determining the suitability of emergency assembly areas in Malatya. This result is consistent with the seismic characteristics of the study area and the severe effects of the 6 February 2023 Kahramanmaraş earthquakes. By contrast, distance from roads received the lowest weight. This does not mean that accessibility is unimportant. Rather, it suggests that, in the expert assessments, safety-related criteria were prioritised over road proximity. It may also reflect the relatively dense road network in the urban core, which reduces the discriminating effect of the road-distance criterion. However, post-earthquake conditions such as debris, congestion, road closures, and bridge or overpass damage may substantially alter actual accessibility. Therefore, the low weight of this criterion should be interpreted cautiously. The spatial suitability results are presented in Figure 6. The results reveal a clear centre–periphery pattern in the distribution of suitable emergency assembly areas in Malatya. Areas classified as highly suitable are concentrated mainly in the city centre and its immediate surroundings. These areas generally have more favourable physical conditions and better accessibility. In contrast, lower suitability values are observed particularly in the western and south-eastern parts of the study area. These lower suitability levels are associated with slope, elevation, geological conditions, proximity to fault lines, and accessibility constraints.
The fact that many existing emergency assembly areas are located within high-suitability zones indicates a generally appropriate spatial tendency from a planning perspective. However, this does not mean that the current system is adequate. Several densely populated neighbourhoods still lack sufficient assembly area capacity, despite being located in or near suitable zones. Therefore, the emergency assembly area system should be evaluated not only in terms of physical suitability but also in relation to population demand, accessibility, and capacity adequacy. This finding highlights the need for a more integrated planning approach that combines suitability analysis with neighbourhood-level capacity assessment.

4. Discussion

This study shows that the main issue concerning disaster and emergency assembly areas in Malatya is not limited to the total amount of available open space. Rather, capacity, accessibility, and spatial suitability must be evaluated together. The findings indicate that some areas may appear physically suitable but may not correspond to neighbourhood-level population distribution or accessibility needs. Therefore, the planning of emergency assembly areas should not be treated simply as the selection of vacant or physically appropriate sites. Since post-earthquake assembly areas function not only as safe open spaces but also as part of the urban infrastructure supporting the initial phase of disaster response, their functionality is a key component of urban resilience [15,17,20].
The finding that the existing official assembly areas in Malatya can accommodate only approximately 29.2% of the total population and are located in just 13 of 88 neighbourhoods indicates that the current system is deficient in both capacity and spatial coverage. This pattern is consistent with previous studies conducted in Türkiye. For example, studies in Elazığ have shown that assembly areas in many neighbourhoods are inadequate in terms of both number and size, while several existing sites also have accessibility and locational problems [39]. Similarly, research in Düzce has reported deficiencies related to site size, accessibility standards, and locational suitability in Erzincan; the uneven distribution of existing assembly areas and their insufficiency in relation to population and building density have led to the proposal of alternative sites [52]. When considered together with this literature, the Malatya case suggests that the problem is not merely the need to increase the number of assembly areas. More importantly, the existing capacity does not form a spatially balanced network aligned with the geography of urban demand. The accessibility findings further reinforce this structural problem. While access times of 0–5 min are achievable in central neighbourhoods, they increase to 10–15 min in peripheral areas, and some settlements remain outside the effective service area. This indicates that access to disaster safety is unevenly distributed across the city. Therefore, accessibility should not be interpreted only as a matter of physical distance or walking time. It should also be considered within the broader context of spatial justice and neighbourhood-level vulnerability. Wang et al. [63] emphasise that accessibility, safety, effectiveness, suitability, and equity should be considered together when evaluating emergency shelters. Similarly, Lee et al. [64], in the case of Daegu, demonstrate that assessments based only on static population data may fail to capture mobile populations and may lead to deviations in equity analysis. Kronenberg et al. [45] also argue that access to urban public goods does not necessarily produce equal outcomes for different social groups. In this context, the centre–periphery disparity observed in Malatya may create a particularly serious access disadvantage for groups with limited mobility.
The BWM results indicate that expert priorities in Malatya are strongly oriented towards safety. The high weights assigned to geology and distance from fault lines suggest that ground stability and seismic safety are regarded as key criteria in the planning of emergency assembly areas. This outcome is expected for a city located near the East Anatolian Fault Zone and recently affected by major earthquakes. Similar findings have been reported in the Erzincan case, where proximity to active faults and fault-avoidance zones were among the key assessment variables [52]. Yıldırım and Şişman [36] and Atmaca et al. [35] also emphasise that safety, accessibility, and usability should be considered together in multi-criteria decision-making processes. However, the lower weight assigned to distance from roads should not be interpreted as meaning that accessibility is unimportant. Rather, the results suggest that experts prioritised seismic and ground safety criteria over road proximity. Nevertheless, an emergency assembly area must be both safe and accessible. In line with this argument, Kılcı et al. [20] show that post-disaster site selection should consider not only location but also capacity, population allocation, and land-use balance.
Another important finding is that, although the integration of parks and open green spaces increases total potential capacity, neighbourhood-level inequalities remain. This suggests that green spaces have considerable complementary potential in disaster management, but they are not sufficient on their own to resolve structural capacity deficits. Kırçın et al. [65] note that green spaces in Türkiye can function effectively as post-disaster assembly areas only when they are sufficiently large, accessible, safe, and supported by basic infrastructure. Studies in Düzce and Elazığ similarly highlight the importance of open and green spaces for post-disaster use, while also showing that each city faces different challenges in terms of quantity, location, and accessibility [38,39]. In Malatya, the contribution of parks to the assembly area system is significant. However, their uneven spatial distribution and functional heterogeneity limit their overall effectiveness. Parks, schoolyards, and other open public spaces should therefore be considered as part of a reserve assembly area system. At the same time, a more comprehensive network logic is needed to address neighbourhood-level capacity deficits directly.
This study contributes to the existing literature in two main respects. First, using the Malatya case, it evaluates capacity shortfalls, accessibility disparities, and BWM-based spatial suitability within a single framework. This makes it possible to identify not only which areas are physically suitable, but also which neighbourhoods remain underserved by the current assembly area network. Second, the findings show that the spatial distribution of capacity is as important as total capacity. The capacity and accessibility problems identified in Düzce, Elazığ, and Erzincan are also observed in Malatya. However, the Malatya case demonstrates more clearly that the existence of physically suitable areas alone is not sufficient; these areas must also be evaluated in relation to neighbourhood-level population distribution and access needs [38,39,52]. The dominance of geological stability and distance from active fault lines in the BWM weighting structure is consistent with the criterion hierarchies reported for Erzincan [52] and Tokat [5], as well as with the multi-city evaluations of Atmaca et al. [35] and Yıldırım and Şişman [36]. Similarly, the centre–periphery differentiation observed in Malatya’s suitability and accessibility patterns corresponds to spatial inequalities documented in Kocaeli–İzmit [53] and İzmir–Karşıyaka [22].

5. Limitations and the Way Forward

Despite its contributions, this study has several limitations that should be considered when interpreting the results.
The first limitation concerns the accessibility analysis. This study assumes a uniform pedestrian walking speed of 5 km/h. Although this value is commonly used in emergency accessibility studies and represents average adult walking conditions in normal urban environments, it does not reflect the mobility differences of vulnerable groups, such as older adults, children, persons with disabilities, pregnant women, or individuals with chronic health conditions. In addition, the analysis does not model post-disaster mobility constraints such as debris-blocked roads, damaged bridges or overpasses, traffic congestion, panic-induced crowd behaviour, aftershocks, fires, or infrastructure failures. Therefore, the accessibility results should be interpreted as baseline estimates under ideal walking conditions rather than as direct projections of actual post-earthquake evacuation performance [63].
The second limitation relates to the spatial and thematic resolution of the input datasets used in the GIS-based suitability analysis. Although official and up-to-date institutional datasets were used, the study relies mainly on static spatial indicators. It does not incorporate temporal changes in population distribution, daytime–night-time mobility, seasonal variations, floating population, or dynamic traffic conditions. In addition, due to data availability constraints, socio-economic vulnerability indicators and detailed building structural characteristics could not be directly integrated into the weighted overlay model. These factors may influence the actual effectiveness and usability of emergency assembly areas during real disaster events.
The third limitation is related to the BWM weighting procedure. Although the weighting process was supported by consistency analysis and structured face-to-face expert evaluations, it still involves a degree of expert-based subjectivity. The inclusion of experts from different professional backgrounds increased the reliability of the weighting process. However, alternative expert panels, different weighting methods, or scenario-based sensitivity analyses could produce slightly different criterion weights and spatial suitability outputs [36].
Finally, this study did not include direct field verification or validation against actual post-disaster use of assembly areas. The findings were generated using official datasets, spatial criteria, expert judgements, and GIS-based modelling. Therefore, the results should be interpreted as decision-support outputs rather than as field-verified evidence of actual performance. Future studies should validate suitability and accessibility results through field observations, local government planning documents, community-based surveys, and real post-disaster usage data.
Building on these limitations, future research should integrate dynamic evacuation modelling, agent-based simulations, real-time transportation constraints, socio-economic vulnerability indicators, and high-resolution building inventory data. Multi-scenario assessments should also consider secondary hazards such as post-earthquake fires, infrastructure failures, and road blockages. Such approaches would support the development of more realistic and operationally robust frameworks for disaster accessibility and emergency assembly area planning. This is particularly important for Malatya, where post-earthquake reconstruction is rapidly transforming the urban fabric in many neighbourhoods

6. Conclusions

This study examined the capacity, accessibility, and spatial suitability of emergency assembly areas in Malatya, a city directly affected by the 6 February 2023 Kahramanmaraş earthquakes. By integrating GIS-based spatial analysis with the Best–Worst Method, the study developed a decision-support framework for evaluating the current emergency assembly area system and identifying spatial planning deficiencies.
The findings show that highly suitable zones are concentrated mainly in the city centre and its immediate surroundings. These areas generally have more favourable physical and spatial characteristics, including lower slope values, more suitable geological conditions, better accessibility, and stronger infrastructure connections. Existing official emergency assembly areas are also largely located within these high-suitability zones, indicating a generally appropriate tendency in terms of site selection. However, this does not mean that the current system is sufficient. The spatial distribution of these areas remains highly uneven at the neighbourhood scale.
The capacity analysis reveals a significant deficiency. Malatya has 35 officially designated emergency assembly areas with a total area of 407,554.3 m2. Based on the AFAD standard of 2.5 m2 per person and a study area population of 584,453, the required assembly area is approximately 1,461,132.5 m2. The existing official areas therefore meet only about 29.2% of the required capacity. In addition, official assembly areas are present in only 13 of the 88 neighbourhoods. This indicates that the system is not only quantitatively insufficient but also spatially fragmented.
Although the inclusion of parks and green spaces substantially increases the overall potential capacity, it does not fully eliminate deficits in many densely populated neighbourhoods. In particular, the severe inadequacies identified in neighbourhoods such as Fırat, Başharik, and Battalgazi indicate a considerable risk of spatial vulnerability during future disaster events. These findings show that the main problem is not only the lack of total area, but also the uneven distribution of assembly areas across the urban fabric.
The BWM results further indicate that geology and distance from fault lines are the most influential criteria in determining spatial suitability, each with a weight of 0.2147. These are followed by population density, slope, and building density. Distance from roads has the lowest weight. This result should not be interpreted as implying that accessibility is unimportant. Rather, it suggests that experts prioritised seismic safety and ground conditions in the Malatya case. Nevertheless, the accessibility analysis shows that peripheral neighbourhoods remain disadvantaged in terms of walking time coverage.
Based on these findings, several practical planning recommendations can be made. First, new emergency assembly areas should be established in underserved and high-density neighbourhoods where significant accessibility and capacity deficits exist. Vacant public lands, schoolyards, sports fields, urban open spaces, and municipally owned reserve areas should be systematically evaluated as potential assembly sites. Second, existing parks and green spaces should be redesigned as multifunctional disaster-resilient urban open spaces by improving pedestrian access, emergency infrastructure, lighting, water supply points, sanitation facilities, and temporary shelter capacity. Third, post-earthquake reconstruction and urban transformation projects in Malatya should integrate emergency assembly area planning directly into neighbourhood-scale spatial planning. Finally, future disaster preparedness strategies should prioritise a more balanced spatial distribution of assembly areas in order to strengthen urban resilience and reduce neighbourhood-scale inequalities in emergency accessibility.

Author Contributions

Conceptualisation, A.Y.K. and E.I.; methodology, A.Y.K. and C.G.; software, E.K. and F.A.; validation, A.Y.K., E.I. and C.G.; formal analysis, E.K. and F.A.; investigation, A.Y.K. and H.B.Ö.; resources, Y.B. and H.B.Ö.; data curation, E.K. and F.A.; writing—original draft preparation, A.Y.K.; writing—review and editing, A.Y.K., E.I. and C.G.; visualisation, E.K. and F.A.; supervision, E.I. and C.G.; project administration, A.Y.K. All authors have read and agreed to the published version of the manuscript.

Funding

This research received no external funding.

Institutional Review Board Statement

Not applicable.

Informed Consent Statement

Not applicable.

Data Availability Statement

The data presented in this study are available on request from the corresponding author.

Acknowledgments

During the preparation of this work, no artificial intelligence tools were used. All analyses and writing was conducted entirely by the authors, who take full responsibility for the final content.

Conflicts of Interest

The authors declare no conflicts of interest.

Abbreviations

The following abbreviations are used in this manuscript:
GISsGeographic Information Systems
BWMBest–Worst Method
MCDMMulti-Criteria Decision-Making

Appendix A. Capacity Adequacy of Disaster and Emergency Assembly Areas by Neighbourhood

NeighbourhoodAFAD
(m2)
Capacity
(Persons)
Park
Count
Park
(m2)
Total
(m2)
Required
(m2)
Gap
(m2)
Sufficient?
Abdulgaffar8908.3−8908.3No
Akpinar3605.5−3605.5No
Aslanbey7361.9−7361.9No
Aşaği bağlar9815.3−9815.3No
Ataköy5523.9−5523.9No
Atatürk3743.7−3743.7No
B.hüseyinbey3435.5−3435.5No
B.mustafa paşa11167.11167.110,648.1−9481.0No
Bahçebaşi11385.51385.511.91373.5Yes
Başharik27,721.3−27,721.3No
Battalgazi35798.25798.218,432.7−12,634.5No
Bentbaşi21940.21940.27680.5−5740.3No
Beylerbaşi26004.06004.06070.1−66.1No
Bostanbaşi125,888.750,355125,888.733,206.392,682.4Yes
Cemalgürsel13,966.0−13,966.0No
Cevatpaşa14110,917.3110,917.329,842.081,075.3Yes
Cevherizade6132.3−6132.3No
Cirikpinar14414.14414.17493.7−3079.5No
Cumhuriyet1449.0449.04514.0−4065.0No
Çamurlu5246.1−5246.1No
Çarmuzu914,217.314,217.36761.27456.0Yes
Çavuşoğlu813,792.113,792.134,488.9−20,696.8No
Çilesiz23,139.7925523,139.730,783.2−7643.5No
Çöşnük41,694.1−41,694.1No
Çukurdere11,851.1−11,851.1No
Dabakhane1492.4492.45184.9−4692.5No
Ferhadiye5222.8−5222.8No
Firat513.4205513.442,202.7−41,689.3No
Gazi36680.56680.59688.7−3008.2No
Gedik306.1−306.1No
Göztepe517,295.717,295.732,424.6−15,128.9No
Haci abdi16,852.4−16,852.4No
Halfettin12315.52315.57567.2−5251.6No
Hamidiye357.8143357.86307.6−5949.9No
Haniminçiftliği825,581.325,581.337,297.4−11,716.1No
Hasan varol10,622.0−10,622.0No
Hidayet515,299.015,299.018,244.9−2945.9No
Hoca ahmet yesevi1183,418.683,418.632,745.050,673.7Yes
Ilyas11526.61526.66836.7−5310.1No
Inönü821,978.321,978.338,331.2−16,352.9No
Iskender1928.3928.314,100.2−13,171.9No
Ismetiye2845.7−2845.7No
Istiklal1349.85391349.89784.5−8434.7No
Izzetiye13035.23035.26194.3−3159.1No
K.hüseyinbey1173.1−1173.1No
K.mustafa paşa7046.1−7046.1No
Karakavak29,953.7−29,953.7No
Karaköy639.4−639.4No
Kavaklibağ3260.4−3260.4No
Kaynarca713,735.613,735.66359.77375.9Yes
Kernek14,634.0−14,634.0No
Kirçuval3490.4−3490.4No
Kiltepe1196,132.096,132.019,285.176,846.9Yes
Koşu26164.76164.77603.2−1438.5No
Koyunoğlu18.8738129.58148.313,809.5−5661.2No
Melekbaba47234.87234.815,034.6−7799.9No
Merkez beydaği18,048.4−18,048.4No
Merkez fatih12908.92908.95191.2−2282.3No
Niyazi1220.3220.310,897.3−10,677.0No
Nuriye5787.2−5787.2No
Orduzu97,750.839,1005301,283.0399,033.839,488.5359,545.3Yes
Özalper48999.38999.363,934.2−54,934.8No
Paşaköşkü16,417.0−16,417.0No
Salköprü38553.58553.510,033.7−1480.2No
Samanli7419.6−7419.6No
Sancaktar4645.7−4645.7No
Saray7183.6−7183.6No
Saricioğlu11099.71099.712,483.1−11,383.4No
Selçuklu314,188.414,188.415,810.6−1622.2No
Seyran210,563.710,563.716,427.1−5863.4No
Şehitfevzi529,661.629,661.611,506.918,154.7Yes
Şeyh bayram8542.734178542.720,998.0−12,455.4No
Şikşik2008.9−2008.9No
Şifa8165.6−8165.6No
Tandoğan27,296.7−27,296.7No
Taştepe1696.867845056.96753.713,609.7−6856.0No
Tecde11487.51487.521,186.5−19,699.0No
Topsöğüt39723.39723.38951.1772.2Yes
Turgut özal11,728.4469111,728.424,757.3−13,029.0No
Üçbağlar69,935.827,97469,935.816,835.353,100.5Yes
Yakinca41,799.6−41,799.6No
Yamaç6334.8−6334.8No
Yavuz selim13,540.2−13,540.2No
Yenihamam11765.61765.65040.6−3275.0No
Yeşilkaynak39910.59910.56334.23576.4Yes
Yildiztepe11,507.1−11,507.1No
Zafer61,821.324,72861,821.328,836.332,985.0Yes
Zaviye2754.9754.933,394.7−32,639.8No

References

  1. Zandi, I.; Jafari, A.; Pahlavani, P.; Alesheikh, A.A.; Lotfata, A. A four-stage GIS-Integrated multi-criteria decision analysis for post-earthquake shelter site selection: A case study in Tehran. Sustain. Resilient Infrastruct. 2025, 1–21. [Google Scholar] [CrossRef]
  2. Li, T.; Sun, J.; Fei, L. Application of Multiple-Criteria Decision-Making Technology in Emergency Decision-Making: Uncertainty, Heterogeneity, Dynamicity, and Interaction. Mathematics 2025, 13, 731. [Google Scholar] [CrossRef]
  3. UNDRR. Global Assessment Report on Disaster Risk Reduction 2025: Resilience Pays: Financing and Investing for Our Future; Stylus Publishing, LLC: Sterling, VA, USA, 2025. [Google Scholar]
  4. Ghaffarian, S.; Shafapourtehrany, M.; Lagap, U.; Batur, M.; Özener, H.; Kılcı, R.E.; Karaman, H. Earthquake-based multi-hazard resilience assessment: A case study of Istanbul, Turkey (neighborhood level). npj Nat. Hazards 2025, 2, 15. [Google Scholar] [CrossRef]
  5. Ersayin, K. Post-disaster temporary shelter site location determination with BWM and GIS: A case study of Tokat, Turkey. Sustain. Resilient Infrastruct. 2025, 10, 252–266. [Google Scholar] [CrossRef]
  6. Wang, Z.; Cheng, J.; Xu, C. Earthquake scenario-specific framework for spatial accessibility analysis (SAA) of emergency shelters: A case study in Xichang City, Sichuan Province, China. Front. Earth Sci. 2024, 12, 1376900. [Google Scholar] [CrossRef]
  7. Kaya, A.Y.; Sajjad, M.; Dedekorkut-Howes, A. Downscaling Urban Disaster Resilience: Toward Building-Scale Geo-Information Modeling and Machine Learning-Assisted Resilience Knowledge Systems. Trans. GIS 2025, 29, e70153. [Google Scholar] [CrossRef]
  8. Vale, L.J.; Campanella, T.J. The Resilient City: How Modern Cities Recover from Disaster; Oxford University Press: Oxford, UK, 2005. [Google Scholar]
  9. Hoornweg, D.; Pope, K. Population predictions for the world’s largest cities in the 21st century. Environ. Urban. 2017, 29, 195–216. [Google Scholar] [CrossRef]
  10. Mesta, C.; Cremen, G.; Galasso, C. Urban growth modelling and social vulnerability assessment for a hazardous Kathmandu Valley. Sci. Rep. 2022, 12, 6152. [Google Scholar] [CrossRef]
  11. Fu, Y.; Liu, L.; Yuan, D. What Leads to Effective Emergency Management? A Configurational Analysis of Empirical Cases of Local Chinese Governments. Land 2024, 13, 469. [Google Scholar] [CrossRef]
  12. Fernández García, A.; Gan, R.K.; Cernuda Martínez, J.A.; Arcos González, P. Global trend and epidemiological profiles of climate-related disasters from 2000 to 2021. Trop. Med. Int. Health 2024, 29, 731–738. [Google Scholar] [CrossRef]
  13. Barsamian, A. The Clock Starts Now for Recovery–Assessing the Impacts of Hurricane Ian Part 1. Available online: https://urbanfootprint.com/blog/blog-post/hurricane-ian-impacts-part-1/ (accessed on 15 April 2026).
  14. Graveline, M.-H.; Germain, D. Disaster Risk Resilience: Conceptual Evolution, Key Issues, and Opportunities. Int. J. Disaster Risk Sci. 2022, 13, 330–341. [Google Scholar] [CrossRef]
  15. Cutter, S.L.; Ash, K.D.; Emrich, C.T. The geographies of community disaster resilience. Glob. Environ. Change 2014, 29, 65–77. [Google Scholar] [CrossRef]
  16. Lin, K.-H.E.; Lee, H.-C.; Lin, T.-H. How does resilience matter? An empirical verification of the relationships between resilience and vulnerability. Nat. Hazards 2017, 88, 1229–1250. [Google Scholar] [CrossRef]
  17. Meerow, S.; Newell, J.P.; Stults, M. Defining urban resilience: A review. Landsc. Urban Plan. 2016, 147, 38–49. [Google Scholar] [CrossRef]
  18. Walters, P. The problem of community resilience in two flooded cities: Dhaka 1998 and Brisbane 2011. Habitat Int. 2015, 50, 51–56. [Google Scholar] [CrossRef]
  19. Sajjad, M.; Chan, J.C.L.; Chopra, S.S. Rethinking disaster resilience in high-density cities: Towards an urban resilience knowledge system. Sustain. Cities Soc. 2021, 69, 102850. [Google Scholar] [CrossRef]
  20. Kılcı, F.; Kara, B.Y.; Bozkaya, B. Locating temporary shelter areas after an earthquake: A case for Turkey. Eur. J. Oper. Res. 2015, 243, 323–332. [Google Scholar] [CrossRef]
  21. AFAD. Earthquake Catalogue. Available online: https://deprem.afad.gov.tr/event-catalog (accessed on 22 March 2026).
  22. Çınar, A.K.; Akgün, Y.; Maral, H. Afet sonrası acil toplanma ve geçici barınma alanlarının planlanmasındaki faktörlerin incelenmesi: İzmir-Karşıyaka örneği. Planlama 2018, 28, 179–200. [Google Scholar]
  23. General Command of Mapping. Türkiye Administrative Boundaries. Available online: https://www.harita.gov.tr/urun/turkiye-mulki-idare-sinirlari/232 (accessed on 10 May 2026).
  24. Duman, T.Y.; Emre, Ö.; Karakaya Gülmez, F.; Özalp, S.; Elmacı, H.; Olgun, Ş.; Çörekçioğlu, Ş.; Çan, T.; Şaroğlu, F. Türkiye Diri Fayları Veri Tabanı. In Proceedings of the TMMOB Coğrafi Bilgi Sistemleri Kongresi 2013, Ankara, Türkiye, 11–13 November 2013; Available online: https://obs.hkmo.org.tr/show-media/resimler/ekler/510e4c76a84cb6e_ek.pdf?utm_source=chatgpt.com (accessed on 10 May 2026).
  25. Esri. ArcGIS Online World Imagery Basemap; Data Sources: Esri, TomTom, Garmin, FAO, NOAA, USGS, © OpenStreetMap Contributors, and the GIS User Community. Available online: https://www.arcgis.com/home/item.html?id=10df2279f9684e4a9f6a7f08febac2a9 (accessed on 15 April 2026).
  26. Nyimbili, P.H.; Erden, T. Comparative evaluation of GIS-based best–worst method (BWM) for emergency facility planning: Perspectives from two decision-maker groups. Nat. Hazards 2021, 105, 1031–1067. [Google Scholar] [CrossRef]
  27. Wang, Y.; Han, Y.; Luo, A.; Xu, S.; Chen, J.; Liu, W. Site selection and prediction of urban emergency shelter based on VGAE-RF model. Sci. Rep. 2024, 14, 14368. [Google Scholar] [CrossRef]
  28. Sánchez-Lozano, J.M.; Teruel-Solano, J.; Soto-Elvira, P.L.; Socorro García-Cascales, M. Geographical Information Systems (GIS) and Multi-Criteria Decision Making (MCDM) methods for the evaluation of solar farms locations: Case study in south-eastern Spain. Renew. Sustain. Energy Rev. 2013, 24, 544–556. [Google Scholar] [CrossRef]
  29. Chang, N.-B.; Parvathinathan, G.; Breeden, J.B. Combining GIS with fuzzy multicriteria decision-making for landfill siting in a fast-growing urban region. J. Environ. Manag. 2008, 87, 139–153. [Google Scholar] [CrossRef]
  30. Ahmadi Choukolaei, H.; Jahangoshai Rezaee, M.; Ghasemi, P.; Saberi, M. Efficient Crisis Management by Selection and Analysis of Relief Centers in Disaster Integrating GIS and Multicriteria Decision Methods: A Case Study of Tehran. Math. Probl. Eng. 2021, 2021, 5944828. [Google Scholar] [CrossRef]
  31. Malczewski, J.; Rinner, C. GIScience, Spatial Analysis, and Decision Support; Springer: Berlin/Heidelberg, Germany, 2015; pp. 3–21. [Google Scholar]
  32. Alihosseini, G.; Gholamalifard, M.; Jokar, P.; Barzegar, Z.; Hesami, Z. Deploying a GIS-based decision model for disaster management support bases (DMSBs) siting in urban environments based on ordered weighted average (OWA) procedure. Prog. Disaster Sci. 2025, 26, 100434. [Google Scholar] [CrossRef]
  33. Feizizadeh, B.; Blaschke, T. GIS-multicriteria decision analysis for landslide susceptibility mapping: Comparing three methods for the Urmia lake basin, Iran. Nat. Hazards 2013, 65, 2105–2128. [Google Scholar] [CrossRef]
  34. Skilodimou, H.D.; Bathrellos, G.D.; Chousianitis, K.; Youssef, A.M.; Pradhan, B. Multi-hazard assessment modeling via multi-criteria analysis and GIS: A case study. Environ. Earth Sci. 2019, 78, 47. [Google Scholar] [CrossRef]
  35. Atmaca, E.; Aktaş, E.; Öztürk, H.N. Evaluated Post-Disaster and Emergency Assembly Areas Using Multi-Criteria Decision-Making Techniques: A Case Study of Turkey. Sustainability 2023, 15, 8350. [Google Scholar] [CrossRef]
  36. Yildirim, R.E.; Sisman, A. Spatial Decision Support for Determining Suitable Emergency Assembly Places Using GIS and MCDM Techniques. Sustainability 2025, 17, 2144. [Google Scholar] [CrossRef]
  37. Lin, Y.; Xiang, Y.; Yin, H.; Chen, Z. Selection of emergency logistics facility locations considering major natural disasters in mountainous cities based on GIS-MCDM. Sci. Rep. 2026, 16, 11634. [Google Scholar] [CrossRef]
  38. Şenik, B.; Uzun, O. An assessment on size and site selection of emergency assembly points and temporary shelter areas in Düzce. Nat. Hazards 2021, 105, 1587–1602. [Google Scholar] [CrossRef]
  39. Cetin, M.; Kaya, A.Y.; Elmastas, N.; Adiguzel, F.; Siyavus, A.E.; Kocan, N. Assessment of emergency gathering points and temporary shelter areas for disaster resilience in Elazıg, Turkey. Nat. Hazards 2024, 120, 1925–1949. [Google Scholar] [CrossRef]
  40. Bektaş, Y.; Doğan, G. Examination of emergency assembly areas based on planning criteria after the two major earthquakes on 6 February, 2023: A case study from Turkey. J. Infrastruct. Policy Dev. 2024, 8, 3917. [Google Scholar] [CrossRef]
  41. Kaya, A.Y. Detection of Structural Damage After an Earthquake Using GIS and Remote Sensing Methods. Turk. J. Agric.-Food Sci. Technol. 2025, 13, 688–696. [Google Scholar] [CrossRef]
  42. AFAD (AFAD). 06 Şubat 2023 Pazarcık (Kahramanmaraş) Mw 7.7 ve Elbistan (Kahramanmaraş) Mw 7.6 Depremlerine İlişkin Ön Değerlendirme Raporu; AFAD: Ankara, Türkiye, 2023. [Google Scholar]
  43. Mertol, H.C.; Tunç, G.; Akış, T.; Kantekin, Y.; Aydın, İ.C. Investigation of RC Buildings after 6 February 2023, Kahramanmaraş, Türkiye Earthquakes. Buildings 2023, 13, 1789. [Google Scholar] [CrossRef]
  44. Republic of Türkiye Ministry of Environment, Urbanisation and Climate Change. Damage Assessment Results [Hasar Tespit Sonuçları]. Available online: https://hasartespit.csb.gov.tr/ (accessed on 15 April 2026).
  45. Kronenberg, J.; Haase, A.; Łaszkiewicz, E.; Antal, A.; Baravikova, A.; Biernacka, M.; Dushkova, D.; Filčak, R.; Haase, D.; Ignatieva, M.; et al. Environmental justice in the context of urban green space availability, accessibility, and attractiveness in postsocialist cities. Cities 2020, 106, 102862. [Google Scholar] [CrossRef]
  46. Xu, Y.; Zhou, C.; Hu, B. Measuring the accessibility of emergency shelters based on an improved two-step floating catchment area model. Int. J. Digit. Earth 2025, 18, 2479864. [Google Scholar] [CrossRef]
  47. Zhang, Z.; Hu, Y.; Lu, W.; Cao, W.; Gao, X. Spatial accessibility analysis and location optimization of emergency shelters in Deyang. Geomat. Nat. Hazards Risk 2023, 14, 2213809. [Google Scholar] [CrossRef]
  48. Stoia, N.L.; Niţă, M.R.; Popa, A.M.; Iojă, I.C. The green walk—An analysis for evaluating the accessibility of urban green spaces. Urban For. Urban Green. 2022, 75, 127685. [Google Scholar] [CrossRef]
  49. Kaya, A.Y. Kentsel Yeşil Alanların Yeterliliği ve Erişilebilirliğinin Değerlendirilmesi: Tarsus (Mersin) Örneği. Turk. J. Remote Sens. GIS 2024, 5, 222–239. [Google Scholar] [CrossRef]
  50. Esri. Types of Network Analysis Layers. Available online: https://desktop.arcgis.com/en/arcmap/latest/extensions/network-analyst/types-of-network-analyses.htm (accessed on 15 April 2026).
  51. Yi, F.; Jia, H.; Liang, C.; Zhang, Q.; Wang, Y.; Wang, Y.; Zhang, H. Analyzing Emergency Service Performance and Fastest Rescue Routes to Vulnerable Population Places Under Compound Pluvial Flooding and Traffic Congestion. Water 2026, 18, 736. [Google Scholar] [CrossRef]
  52. Akar, A.; Akar, Ö.; Konakoğlu, B. Analysis of emergency assembly points for post-earthquake disaster management: A case study of Erzincan, Türkiye. Nat. Hazards 2024, 120, 11791–11824. [Google Scholar] [CrossRef]
  53. Gerdan, S.; Şen, A. Evaluation of Qualifications of Assembly Points For Disasters and Emergency: Example of Kocaeli, İzmit. İDEALKENT 2019, 10, 962–983. [Google Scholar] [CrossRef]
  54. AFAD. Toplanma Alanına Erişim. Available online: https://ankara.afad.gov.tr/toplanma-alanina-erisim (accessed on 16 March 2026).
  55. Sarris, A.; Loupasakis, C.; Soupios, P.; Trigkas, V.; Vallianatos, F. Earthquake vulnerability and seismic risk assessment of urban areas in high seismic regions: Application to Chania City, Crete Island, Greece. Nat. Hazards 2010, 54, 395–412. [Google Scholar] [CrossRef]
  56. Cutter, S.L.; Boruff, B.J.; Shirley, W.L. Social Vulnerability to Environmental Hazards. Soc. Sci. Q. 2003, 84, 242–261. [Google Scholar] [CrossRef]
  57. Kontokosta, C.E.; Malik, A. The Resilience to Emergencies and Disasters Index: Applying big data to benchmark and validate neighborhood resilience capacity. Sustain. Cities Soc. 2018, 36, 272–285. [Google Scholar] [CrossRef]
  58. Giuliani, F.; De Falco, A.; Cutini, V. The role of urban configuration during disasters. A scenario-based methodology for the post-earthquake emergency management of Italian historic centres. Saf. Sci. 2020, 127, 104700. [Google Scholar] [CrossRef]
  59. Gerçek, D.; Güven, İ.T. Urban Earthquake Vulnerability Assessment and Mapping at the Microscale Based on the Catastrophe Progression Method. Int. J. Disaster Risk Sci. 2023, 14, 768–781. [Google Scholar] [CrossRef]
  60. Ma, Y.; Xu, W.; Qin, L.; Zhao, X. Site Selection Models in Natural Disaster Shelters: A Review. Sustainability 2019, 11, 399. [Google Scholar] [CrossRef]
  61. Goodchild, M.; Haining, R.; Wise, S. Integrating GIS and spatial data analysis: Problems and possibilities. Int. J. Geogr. Inf. Syst. 1992, 6, 407–423. [Google Scholar] [CrossRef]
  62. Rezaei, J. Best-worst multi-criteria decision-making method. Omega 2015, 53, 49–57. [Google Scholar] [CrossRef]
  63. Wang, X.; Guan, M.; Dong, C.; Wang, J.; Fan, Y.; Xin, F.; Lian, G. A Multi-Indicator Evaluation Method for Spatial Distribution of Urban Emergency Shelters. Remote Sens. 2022, 14, 4649. [Google Scholar] [CrossRef]
  64. Lee, Y.H.; Lee, J.S.; Baek, S.C.; Hong, W.H. Spatial Equity with Census Population Data vs. Floating Population Data: The Distribution of Earthquake Evacuation Shelters in Daegu, South Korea. Sustainability 2020, 12, 8046. [Google Scholar] [CrossRef]
  65. Kırçın, P.; Çabuk, S.; Aksoy, K.; Çabuk, A. A Research on Increasing the Possibility of Using Green Areas as Post-Disaster Assembly Areas in Turkey. Disaster Sci. Eng. 2018, 4, 22–31. [Google Scholar]
Figure 1. The four main phases of disaster management: mitigation, preparedness, response, and recovery [13].
Applsci 16 05206 g001
Figure 2. Earthquakes of magnitude 4 or higher in Turkey between 1 February 2023 and 15 April 2026 [21,23,24,25].
Applsci 16 05206 g002
Figure 3. Location of the study area and spatial distribution of post-earthquake building damage in Malatya city centre, illustrating three representative urban fabrics: (a) post-2000 urban fabric, representing newly developed residential areas; (b) compact (attached-order) urban fabric in the city centre; (c) pre-2000 urban fabric, which sustained the most severe damage. Building damage levels are indicated in the legend as collapsed (red), heavily damaged (orange), moderately damaged (yellow), and undamaged (black) [25,44].
Applsci 16 05206 g003
Figure 4. Accessibility analysis of emergency assembly areas in Malatya: walking time zones (0–15 min) [25]. Source: generated by the authors in ArcGIS Pro 3.5.0 using official emergency assembly area data and the urban road network.
Applsci 16 05206 g004
Figure 5. Spatial distribution maps of criteria (a): Geology, (b): Population Density, (c): Building Density, (d): Elevation, (e): Slope, (f): Distance to Road, (g): Distance to River, (h): Distance to Fault, (i): Distance to Building. Source: generated by the authors in ArcGIS Pro 3.5.0.
Applsci 16 05206 g005
Figure 6. Spatial suitability classes for emergency assembly areas in Malatya. Source: generated by the authors in ArcGIS Pro 3.5.0 using BWM-derived criterion weights [25].
Applsci 16 05206 g006
Table 1. Data used in the study and their sources.
DataData SourceDerived Data
Geological Map (1/100,000)General Directorate of Mineral Research and Exploration (MTA)Lithology, fault lines and proximity to faults
PopulationTurkish Statistical Institute (TURKSTAT)Population density
Buildings and TransportationMalatya Metropolitan Municipality Urban Information SystemBuildings, building density, proximity to buildings, roads, proximity to roads
Emergency assembly pointsMalatya Metropolitan Municipality Urban Information SystemLocation and spatial distribution of emergency assembly areas, accessibility/service areas, area size, and population capacity
Neighbourhood populationTURKSTAT/Address-Based Population Registration System (2025)Population demand by neighbourhood, required assembly area capacity, capacity deficit/surplus
ElevationALOS PALSAR DEM (12.5 m)Slope, Elevation, Stream network
Building damage dataMinistry of Environment, Urbanisation and Climate ChangeCollapsed, heavily damaged, moderately damaged, and undamaged buildings; post-earthquake spatial risk pattern
Parks and green areasMalatya Metropolitan Municipality Urban Information SystemAlternative open spaces, potential assembly area capacity, supplementary capacity analysis
Table 2. Key criteria for emergency assembly area selection.
CriterionDefinitionSource
AccessibilityThe distance from building blocks to assembly points
should be no more than 500 m or 15 min walk, ensuring that everyone can reach them easily.
[22,35,36]
Connection to Road AxlesThese areas should be located close to the main transport networks and provide continuous access.[35,36,52]
CapacityIt has sufficient space to accommodate a large number of people and can be adapted for a variety of uses.[36]
OwnershipWhen designating assembly areas, preference should be given to public land. However, provided they meet the relevant criteria, vacant plots of privately owned land and open-air car parks, as well as the grounds of schools and mosques that are seismically safe, may also be designated as assembly areas.[22]
AreaPublic spaces with an area of 500 m2 or more (parks, mosques, schools, green spaces, etc.).[35,53]
Table 3. Criteria and categories used in the spatial suitability analysis of emergency assembly areas.
NoCriterionCategoryDescriptionSource
C1GeologyPhysical/SecurityThe geological structure has been assessed in order to determine the ground safety of assembly areas.[55]
C2Population DensitySocio-spatialAccessibility is a critical factor in determining the location of disaster and emergency assembly points, as it directly affects capacity and the effectiveness of evacuation.[56,57]
C3Building DensityUrban structureIt indicates the building density in residential areas and has been used to assess the risk of building collapse that may occur during a disaster.[58]
C4Elevation (m)PhysicalThe elevation of the site was used to assess environmental risks and spatial suitability.[5,59]
C5Slope (%)PhysicalThe slope of the terrain is a key factor affecting the safety and usability of assembly areas.[5,59]
C6Distance from the roads (km)AccessibilityThe proximity of assembly points to transport networks improves accessibility in emergencies.[22]
C7Distance from rivers (km)Environmental riskThe distance from watercourses has been taken into account in order to mitigate environmental hazards such as the risk of flooding.[35]
C8Distance from Fault Lines (km)Seismic hazardThe distance from active fault lines is a key factor in earthquake safety.[35]
C9Distance from Buildings (km)SecurityThe distance between assembly points and buildings has been assessed with a view to reducing the risk of potential building collapse.[5,59]
Table 4. Pairwise comparison vector for the Best–Worst criterion.
CriterionThe Best Criterion: C1The Worst Criterion: C4
C119
C235
C362
C491
Table 5. CI values used in BWM [62].
ABW123456789
CI0.000.441.001.632.303.003.734.475.23
Table 6. Best-to-Others and Others-to-Worst pairwise comparison vectors.
C1C2C3C4C5C6C7C8C9
BO135749628
BW975361482
Table 7. Criteria weights calculated with BWM.
Criteria BWM Weight
C10.2147
C20.1431
C30.0859
C40.0613
C50.1073
C60.0477
C70.0716
C80.2147
C90.0537
Consistency0.2147
Source: authors’ expert-based BWM analysis.
Table 8. Suitability criteria and reclassification scores used for emergency assembly area analysis.
NoCriterion (C)Evaluation RangesScore *Weight (%)
C1GeologyAlluvium10.21
Colluvium1
Limestone, Sandy Limestone2
Volcanic, Conglomerate, Tuff2
Marble, Quartzite Schist, Granitoid3
C2Population Density
(person/cell)
<510.14
5–252
>253
C3Building Density
(Kernel Density)
Low (0–35)30.09
Medium (35–157)2
High (>157)1
C4Elevation (m)>120010.06
900–12002
<9003
C5Slope (%)>1010.11
2–102
<23
C6Distance to Road (m)>20010.05
50–2002
<503
C7Distance to River (m)<5010.07
50–1002
>1003
C8Distance to Fault (km)<1710.21
17–222
>223
C9Distance to Building (m)>20010.05
50–2002
<503
Source: authors’ expert-based BWM analysis. * Highly suitable 3, Suitable 2, Not suitable 1.
Disclaimer/Publisher’s Note: The statements, opinions and data contained in all publications are solely those of the individual author(s) and contributor(s) and not of MDPI and/or the editor(s). MDPI and/or the editor(s) disclaim responsibility for any injury to people or property resulting from any ideas, methods, instructions or products referred to in the content.