1. Introduction
Expansive soils are a class of heavy clay soils with high montmorillonite content and are characterized by pronounced swell–shrink behavior [
1]. They are widely distributed worldwide, occurring in more than 40 countries across six continents [
2]. In China, expansive soils are found in more than 20 provinces and occupy an area of nearly 600,000 km
2 [
3,
4]. Expansive soils undergo significant volumetric expansion upon water infiltration and shrinkage upon drying, leading to the development of shrinkage cracks [
5]. This behavior is primarily attributed to their strong hydrophilicity and the suction-dependent interaction between clay minerals and pore water, which causes repeated volume change under seasonal wetting–drying conditions [
6,
7]. For expansive soil slopes, this hydro-mechanical response is particularly critical because rainfall infiltration reduces matric suction, weakens shallow soil strength, and induces swelling deformation, whereas subsequent drying promotes shrinkage cracking and preferential flow paths. These cracks further accelerate rainfall infiltration during later wetting stages, causing progressive deterioration of the near-surface soil structure. Consequently, expansive soil slopes are highly susceptible to shallow failures, surface erosion, and landslides, posing significant risks to infrastructure safety and human life [
8,
9].
Current expansive soil slope protection methods can generally be categorized into rigid and flexible systems. Rigid protection measures, such as retaining walls [
10,
11], anti-slide piles [
12], anchors [
13,
14], and soil nails [
15,
16], have demonstrated effectiveness in stabilizing conventional slopes. Their stabilizing mechanism is mainly based on providing high structural stiffness, resisting lateral earth pressure, and improving global slope stability. However, their application to expansive soil slopes is often problematic because expansive soils do not behave as conventional frictional soils under rainfall and drying cycles. Swelling-induced expansion pressures exert additional lateral forces on rigid structures, while shrinkage and cracking may cause stress redistribution and local loss of contact. Since conventional rigid systems have limited deformation tolerance, they often experience shear cracking, interface separation, or local structural damage under repeated swelling–shrinkage action [
10]. These limitations indicate that structural stiffness alone is insufficient for expansive soil slopes; instead, a suitable protection system must combine stability with deformation compatibility.
In contrast, flexible protection methods are designed to accommodate soil deformation by allowing limited movement, thereby dissipating swelling-induced stresses. These systems deform compatibility with the soil during swelling and restrain soil movement during shrinkage, effectively reducing the development of shrinkage cracks [
17]. Common flexible protection techniques include geosynthetics such as geogrids [
18,
19], geomembranes and geocells [
9,
20], and soil bags [
21,
22,
23]. Their advantages include tensile reinforcement, erosion resistance, surface confinement, and, in some cases, vegetation support. However, the exclusive use of flexible systems presents serviceability and stability concerns. Their relatively low structural stiffness is susceptible to excessive deformation under swelling pressure, and their ability to restrain large-scale slope movement is limited. In addition, geosynthetics are susceptible to durability-related degradation, making long-term performance an important design consideration. Consequently, flexible protection measures are rarely sufficient when used in isolation for expansive soil slopes where both deformation accommodation and structural restraint are required.
The instability of expansive soil slopes is governed by the coupled effects of hydraulic disturbance, suction loss, swelling–shrinkage deformation, crack development, erosion, and progressive strength attenuation. Therefore, an effective protection system should satisfy three functional requirements. First, it should provide hydraulic control by reducing direct rainfall infiltration, delaying runoff concentration, and moderating pore-water pressure and suction fluctuations. Second, it should provide deformation compatibility by allowing limited surface deformation without brittle failure or loss of protection. Third, it should provide sufficient structural restraint to prevent excessive lateral displacement and maintain overall slope integrity. Existing rigid systems generally satisfy the third requirement but perform poorly in deformation compatibility, while flexible systems satisfy the second requirement but may lack adequate stiffness. This mismatch provides the theoretical basis for developing a composite protection system that integrates rigid and flexible components in a coordinated manner.
Driven by rapid infrastructure development and increasingly stringent sustainability requirements, recent research has increasingly focused on composite slope protection systems that integrate rigid and flexible components to capitalize on their complementary advantages [
24]. In such systems, rigid elements provide the structural stiffness required to maintain global stability, while flexible components accommodate limited deformation associated with the swelling behavior of expansive soils. Vegetation is also usually incorporated to enhance hydrological regulation, improve erosion resistance, and provide ecological benefits, thereby forming a more resilient and sustainable slope protection system. Xu et al. [
3] evaluated an Anchor Reinforced Vegetation System (ARVS) on an expansive soil slope. The system, consisting of vegetation, anchors, and HPTRMs, effectively regulated shallow soil moisture, reduced cracking caused by moisture gradients, and mitigated wetting–drying effects. These results support earlier analyses by Miller and Loizeaux [
25], who demonstrated the suitability of the ARVS for slopes susceptible to shallow failures. Ertugrul and Trandafir [
26] studied cantilever retaining walls with expanded polystyrene (EPS) and extruded polystyrene (XPS) geofoam inclusions through model tests and numerical simulations. Geofoam significantly reduced lateral earth pressures, with the magnitude of reduction controlled by geofoam stiffness, wall flexibility, and backfill shear strength. Huang et al. [
27] further suggested that geofoam inclusions may be feasible for expansive soil slopes, although the approach currently lacks sufficient field validation. Wang et al. [
28] investigated the use of expansive soil bags in retaining walls through physical model tests. The bags improved drainage and permeability, stabilized peak swelling pressures during rainfall, and restricted soil expansion. However, it was noted that long-term durability may be compromised due to degradation under prolonged sunlight exposure. Huang et al. [
29] proposed a Composite Ecological Lattice Anchorage System (CELAS) consisting of a lattice frame, anchor rods, HPTRMs, and vegetation. Model tests showed that the system effectively reduced runoff and erosion and allowed limited deformation to release swelling stresses while transferring residual forces to deeper soil layers through anchorage. Although these composite systems are promising, many rely on multiple structural components such as anchors, rods, geofoam inclusions, or retaining elements, which can increase construction complexity, cost, and maintenance requirements. Moreover, the specific contribution of each component to hydraulic regulation, deformation control, and stress redistribution is not always clearly isolated. Therefore, there remains a need for a comparatively simple composite system that can integrate the structural restraint of a rigid element with the deformation compatibility and erosion-control capacity of a flexible geosynthetic layer, while avoiding excessive construction complexity and with minimal maintenance requirements.
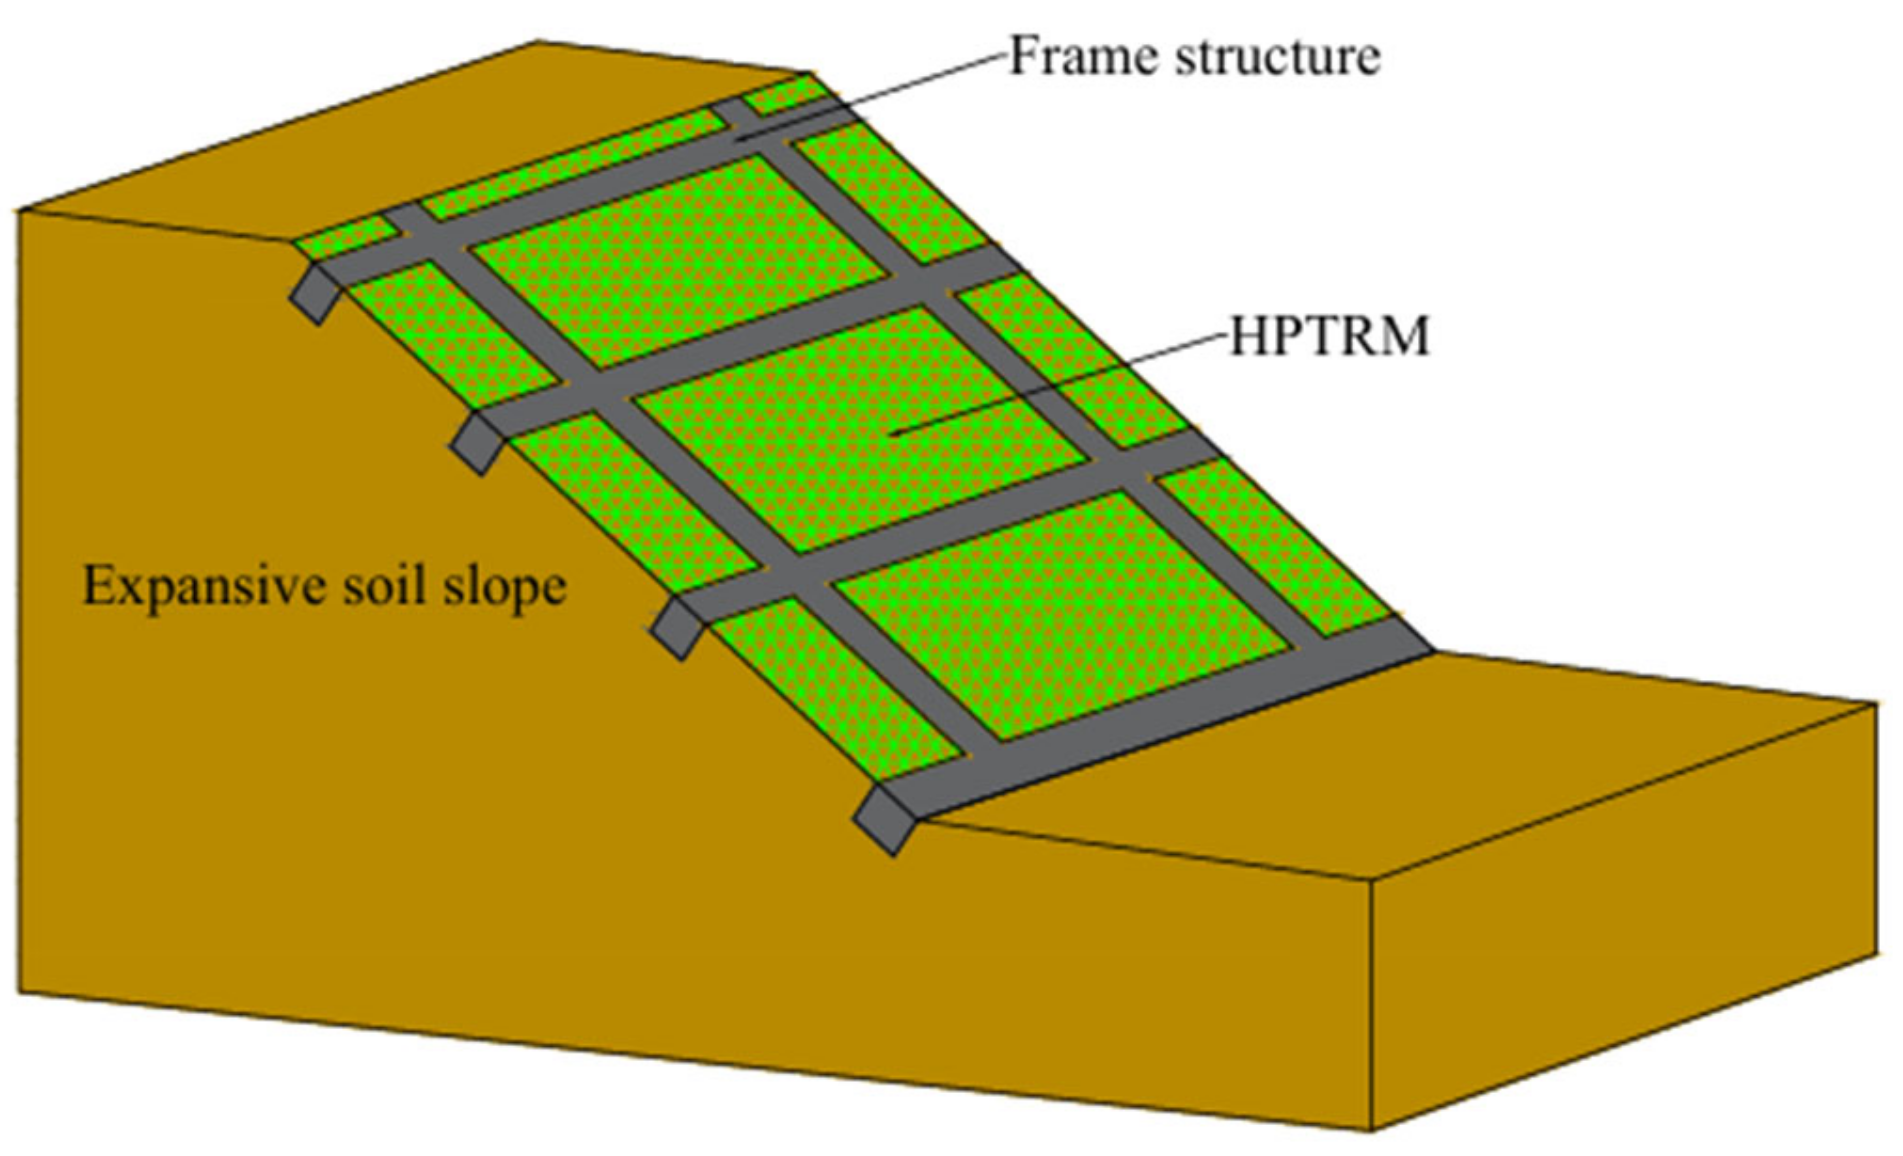
To address the limitations of the current protection methods, this study develops a composite frame–geosynthetic system (CFGS) for the protection of expansive soil slopes. The proposed CFGS consists of a rigid concrete frame and a high-performance turf reinforcement mat (HPTRM). The concrete frame provides structural restraint, divides the slope surface into confined units, reduces the directly exposed infiltration area, and facilitates surface drainage. The HPTRM provides flexible tensile restraint, erosion control, surface confinement, and vegetation-supporting capacity. In this way, the CFGS is intended to combine hydraulic control, deformation accommodation, and structural reinforcement within a single integrated slope protection system.
To evaluate the performance of the developed system, indoor physical model tests were conducted under controlled wetting–drying cycles representative of the natural climatic conditions of the study area and subsequently validated through numerical simulation in COMSOL Multiphysics 6.3. The performance of the CFGS was systematically compared with that of a bare slope and a slope protected solely with HPTRMs. Key performance indicators included runoff initiation time and volume, erosion magnitude, slope deformation associated with swell–shrink behavior, moisture content variation, and pore-water pressure response during wetting–drying cycles. The main contribution of this study is the development and experimental evaluation of a simplified rigid–flexible composite protection system for expansive soil slopes, together with a mechanistic assessment of its ability to regulate rainfall-induced hydraulic response, reduce erosion, control swell–shrink deformation, and improve slope surface stability. By validating the effectiveness of the developed CFGS, this study provides a sustainable, efficient, and reliable protection strategy for expansive soil slopes.
2. Materials and Methods
2.1. Similarity Criteria
According to similarity theory, the similarity ratio of a physical quantity
is defined as
, where the subscripts
and
denote the prototype and model, respectively. Based on the prototype slope dimensions, laboratory space, instrumentation requirements, and operational feasibility, the geometric similarity ratio was selected as
. Because the model was prepared using expansive soil collected from the prototype site and compacted to a representative density, the bulk density similarity ratio was taken as
. Consequently, the stress similarity ratio was
, while the strain similarity ratio was
. The similarity relationships used are shown in
Table 1.
However, it should be noted that complete hydro-mechanical similitude was not imposed for all material parameters. The prototype expansive soil was used directly because its wetting–drying response is governed by intrinsic properties, including mineral composition, plasticity, soil–water characteristic behavior, hydraulic conductivity, swelling potential, and shrinkage behavior. For the expansive soil, using an artificially weakened or modified soil to force and could alter the mineralogy, plasticity, swelling potential, suction response, crack behavior, and hydraulic conductivity. This scaling could compromise the core purpose of this study, because the expansive soil is the active expansive medium and the primary study object. Therefore, for the soil material, representativeness was prioritized over strict mechanical scaling. Consequently, the model was designed as a geometrically scaled and materially representative comparative test, rather than a fully similitude-controlled prototype prediction model. Under this framework, the results are interpreted as model-scale comparative performance indicators for the bare slope, HPTRM-protected slope, and CFGS-protected slope under identical laboratory conditions.
For the protection components, however, analogue materials were selected to reflect the reduced stress and stiffness requirements of the model. Since and , the use of prototype concrete and full-scale HPTRM would have introduced excessive stiffness relative to the model soil mass, causing over-restraint of deformation. The rationale for selecting model materials was therefore guided by the satisfaction of the similarity ratio of 10 for the primary material property.
2.2. Test Materials
The soil used in this study was obtained from a highway construction site in Nanning, Guangxi Zhuang Autonomous Region, China, a region where expansive soils are widely distributed. The soil was air-dried, disaggregated, and stored in sealed containers prior to laboratory testing. In the dry state, the soil is light brown. The basic physical and expansion characteristics were determined through laboratory tests conducted in accordance with GB/T 50123-2019 (Standard for Geotechnical Testing Method). The optimum moisture content and maximum dry density were determined as 15.9% and 1.82 g/cm
3, respectively. The measured free expansion rate was 36%, indicating a soil with low to medium expansion. The fundamental, basic, and expansive properties of the soil are summarized in
Table 2.
The Composite Frame–Geosynthetic Structure (CFGS) comprises a rigid concrete frame, within which high-performance turf reinforcement mats (HPTRMs) are installed in the frame openings. To ensure appropriate stiffness, the selection of model materials focused on the governing mechanical properties, while the remaining material properties were maintained within acceptable ranges. The concrete frame was simulated using plaster of Paris. Plaster of Paris is calcium sulphate hemihydrate (CaSO4·½H2O), obtained through partial dehydration of naturally occurring gypsum (calcium sulphate dihydrate, CaSO4·2H2O). As compressive strength governs the structural behavior of concrete, this property was adopted as the primary criterion for material selection. The compressive strength of plaster of Paris is approximately 2–5 MPa, which is about 1/10 of the compressive strength of conventional structural concrete (typically 25–50 MPa), making it suitable for representing the mechanical behavior of the concrete frame at model scale while satisfying the similarity ratio relationship adopted for the physical model.
The relevant properties of plaster of Paris are summarized in
Table 3.
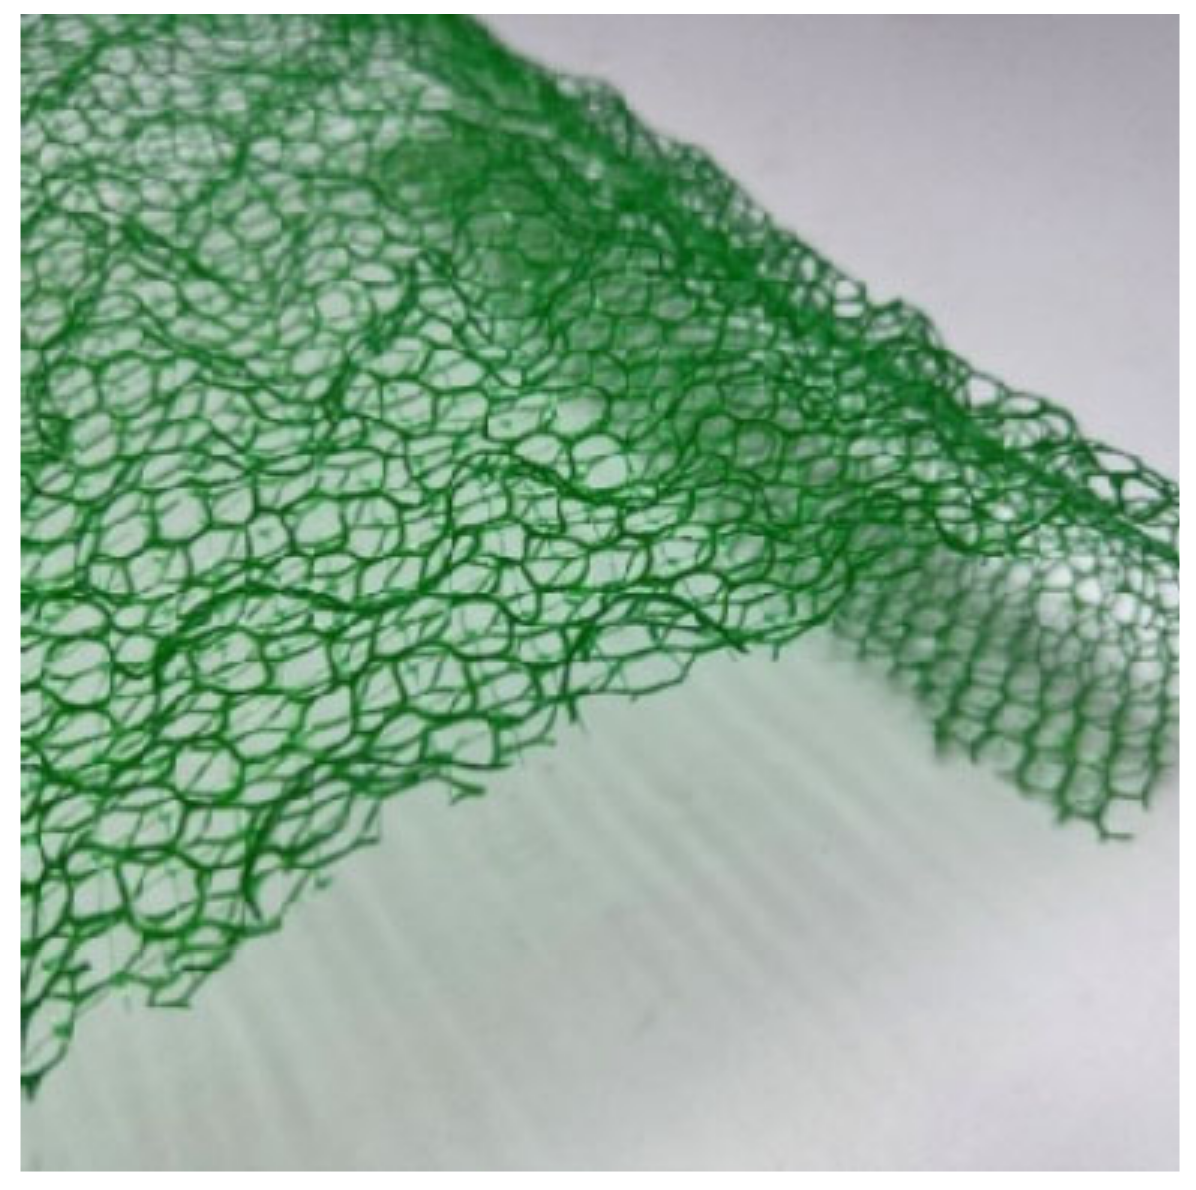
HPTRMs are polymer-based geosynthetic materials, typically manufactured from polypropylene, and are widely employed for erosion control and slope stabilization. Their mechanical response is predominantly governed by tensile behavior rather than compressive resistance. HPTRMs are characterized by high tensile strength, adequate elongation, ultraviolet resistance, and long-term durability. Their three-dimensional structure enhances soil confinement and promotes vegetation establishment, making them suitable for both vegetated and unvegetated slope protection applications. In this study, a commercially available HPTRM product, EM5, was selected as the model reinforcement. The EM5 material was obtained from Shandong Obor New Materials Co., Ltd. based in Taian City, Shandong Province, China.EM5 exhibits in-plane isotropic tensile behavior, with comparable tensile strengths in both the x and y directions. The tensile strength of EM5 is about 3.2 kN/m, which is also about 1/10 the tensile strength of typical full-scale HPTRMs used in large infrastructure projects. This fulfils the scaling rationale adopted for these model tests, and EM5 is therefore appropriate for representation of the tensile behavior of HPTRM at model scale. EM5 has also been successfully used in previous studies as a model material for HPTRM (Huang et al., 2025) [
29].A photograph of EM5 is shown in
Figure 1, and its key performance properties are summarized in
Table 4.
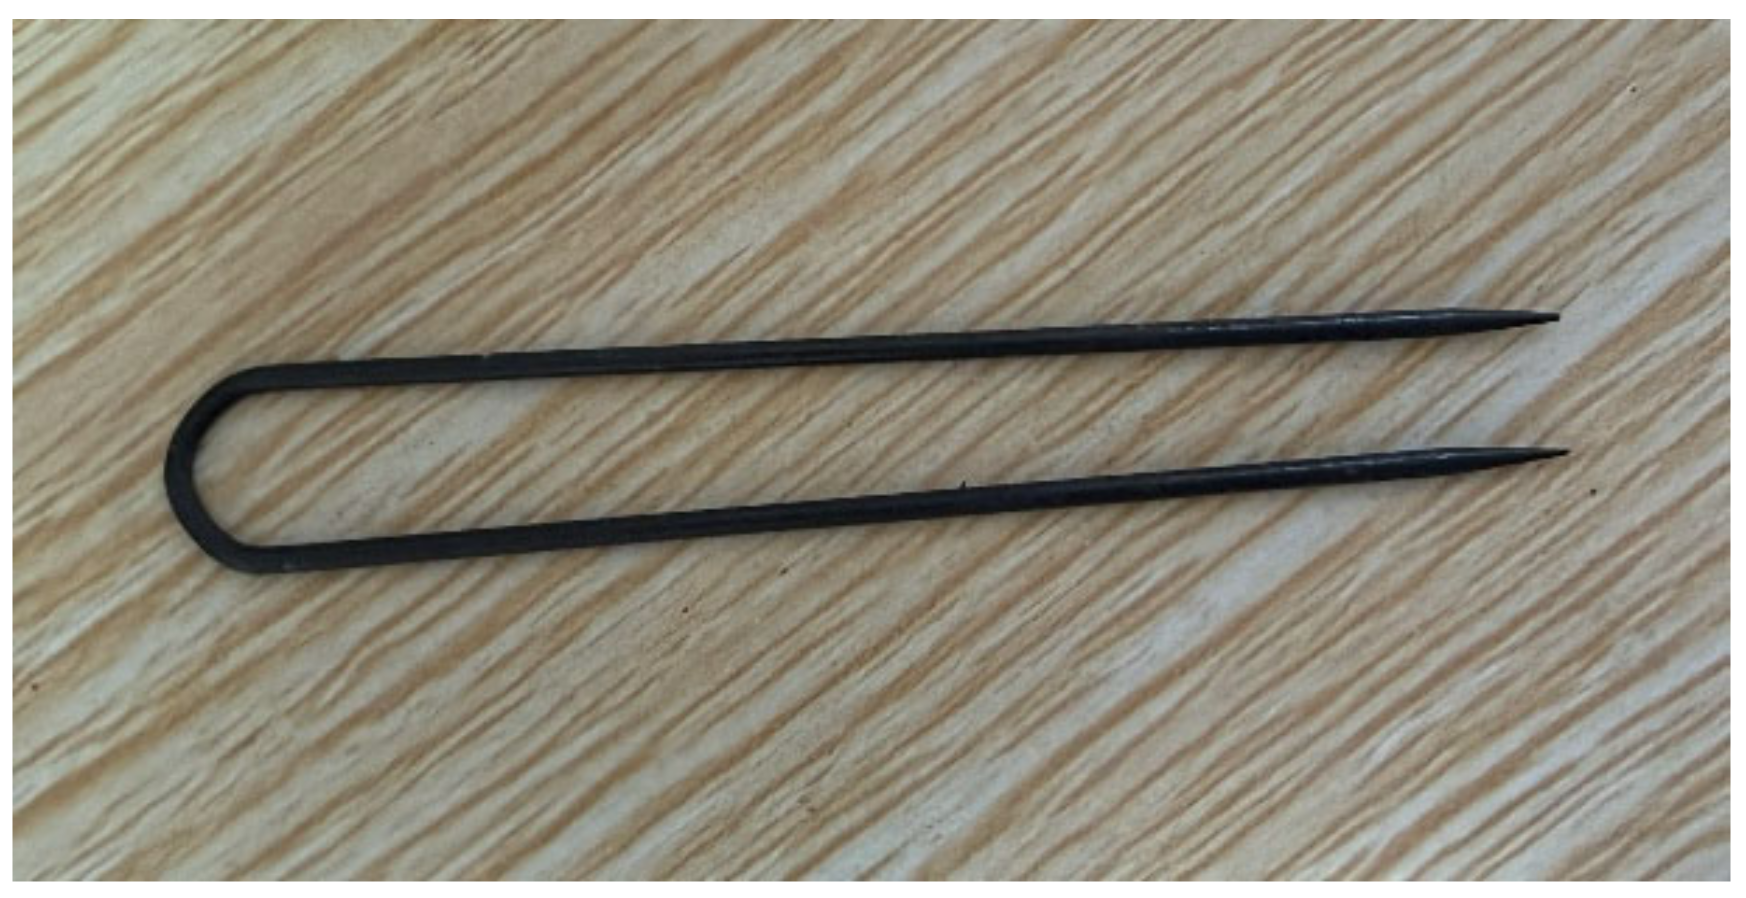
The EM5 was secured in place using downward-facing U-shaped coated steel pins embedded in the soil, and was additionally anchored to the frame structure by more steel pins installed during the concrete casting process.
Figure 2 presents an image of the coated U-shaped steel pin. Owing to practical limitations associated with physical modelling, complete material similitude could not be achieved; nevertheless, the selected materials adequately reproduced the governing mechanical behavior relevant to the performance of the CFGS. A schematic illustration of the CFGS configuration is shown in
Figure 3.
2.3. Test Model Design and Sensor Layout
The physical model tests were conducted in a model box with internal dimensions of 100 × 58 × 50 cm. The box consists of an aluminum frame with transparent acrylic side panels for visual observation. Expansive soils are recognized as problematic engineering materials. Both TB 10035-2018 (Code for Design on Special Railway Earth Structures) and JTG D30-2015 (Specifications for Design of Highway Subgrades) limit slope gradients in expansive soil areas to 1:1.5. Accordingly, the same gradient—representing the steepest allowable gradient and therefore a conservative, worst-case condition—was adopted in the physical model tests. The soil was prepared at an initial moisture content of 14%, which is 2% below the optimum moisture content, to represent a relatively dry initial state with a higher matric suction. In order to mitigate the influence of boundary effects, a thin layer of laboratory vaseline was applied to the inner side of the model box sides before filling in the soil. The model box was then filled with the prepared soil in four layers, each 5 cm thick, to a total height of 20 cm, with compaction applied after each layer. The target degree of compaction was 90% of the maximum dry density, corresponding to a dry density of 1.64 g/cm3. A 5 kg compaction hammer with a square metal plate base measuring 15 × 15 cm and a wooden handle was used to compact the soil layers. To ensure consistency and uniformity, compaction was performed from both sides of the model box until the marked level of the specific layer. Before placing each successive layer, the compacted soil surface was scarified to ensure interlayer bonding and continuity.
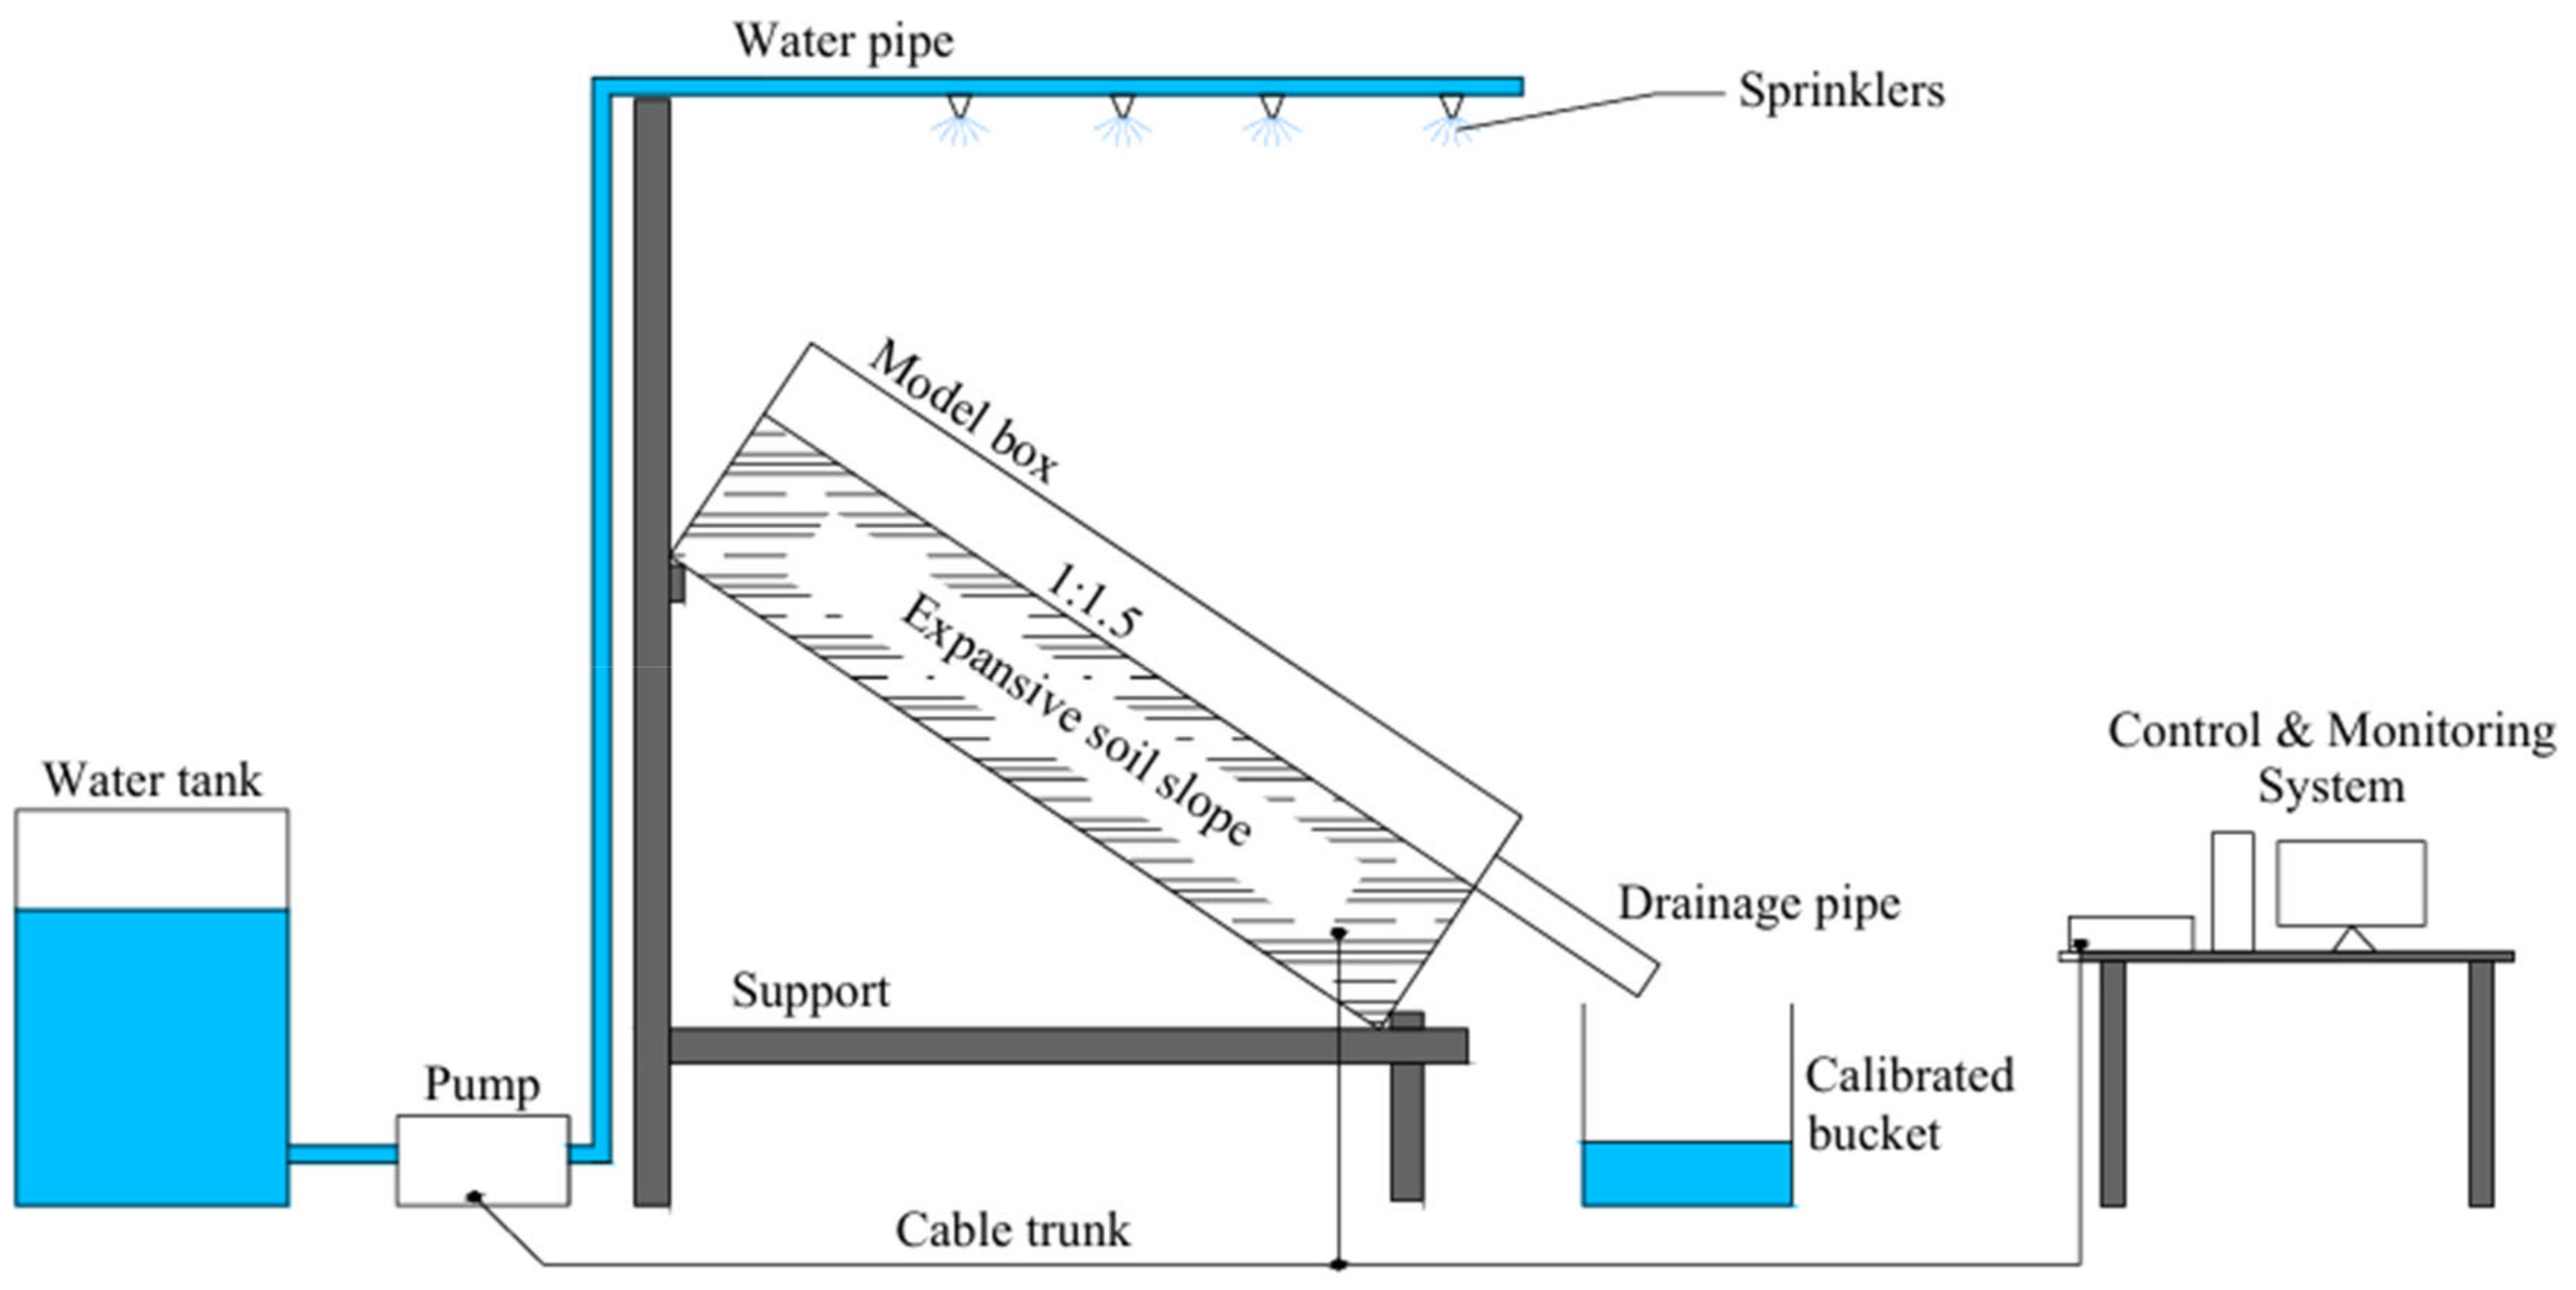
The rainfall simulation system comprised a water tank, a pump, supply pipes, and sprinklers, with the entire system controlled by computer software to ensure stable, repeatable rainfall conditions. Drying was simulated using high-energy lamps. The monitoring system included moisture content sensors, pore-water pressure sensors, a runoff collection system, and dial indicators for deformation measurement. A schematic of the complete model test setup is presented in
Figure 4.
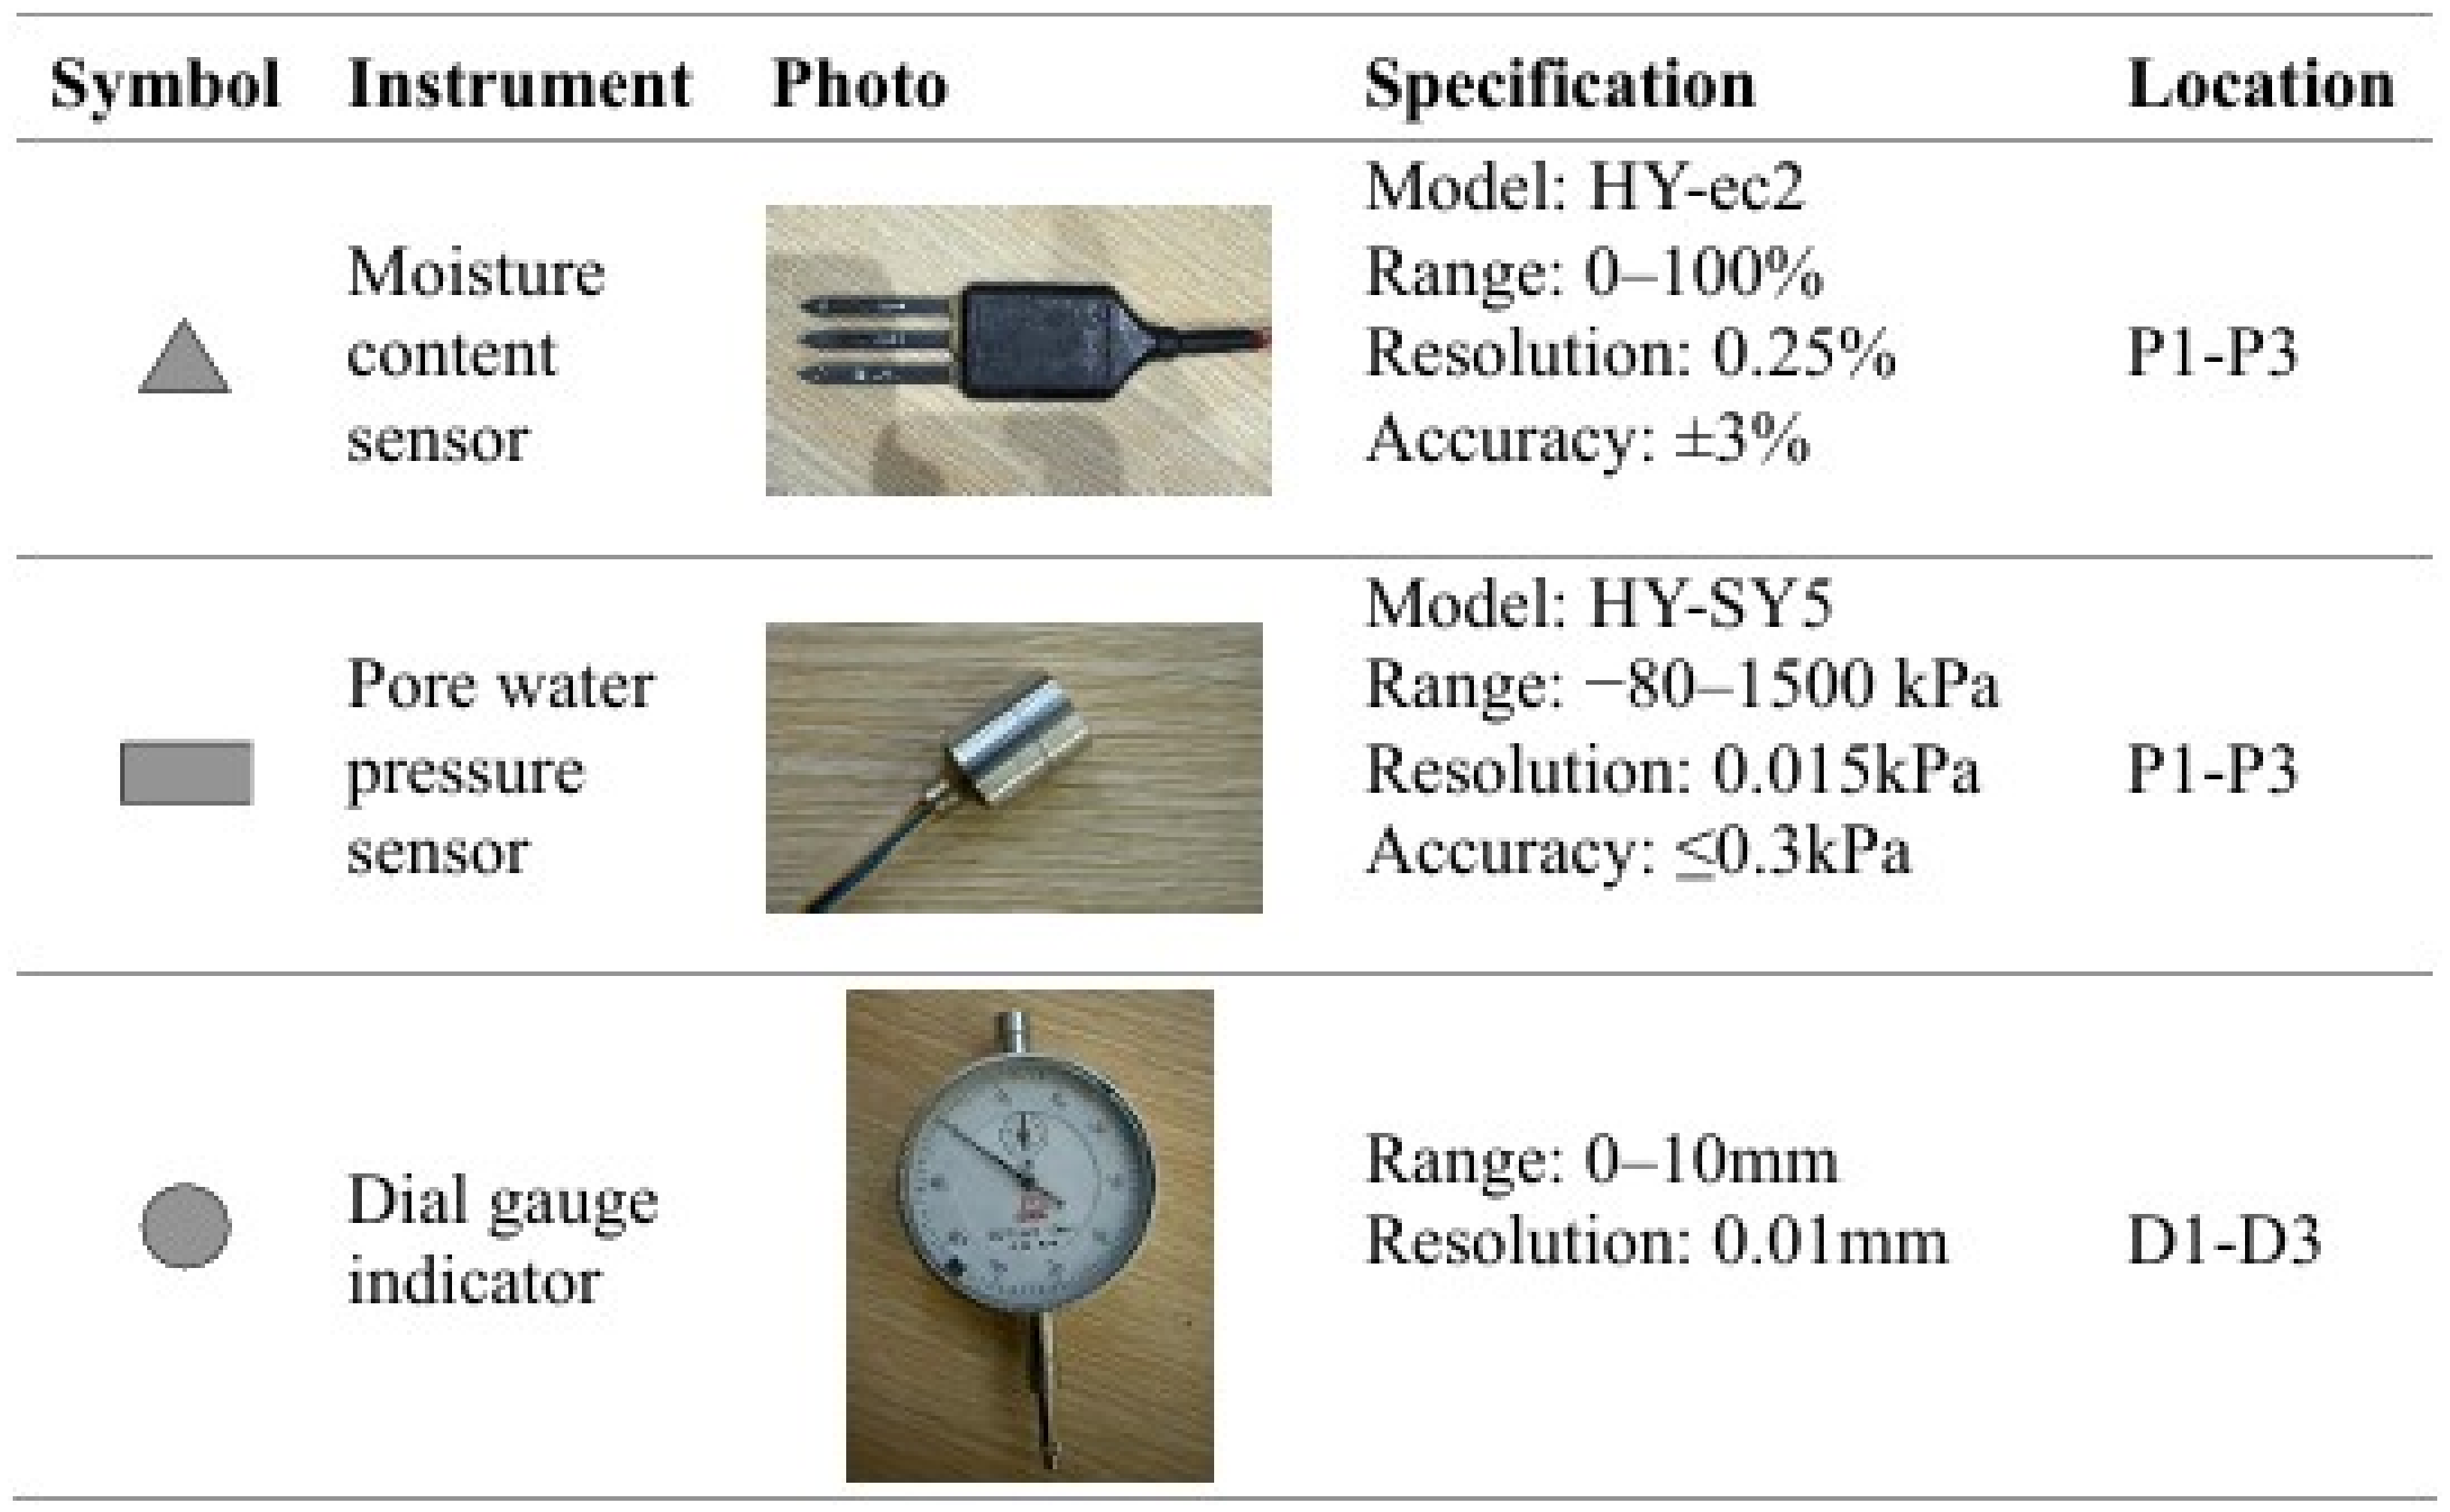
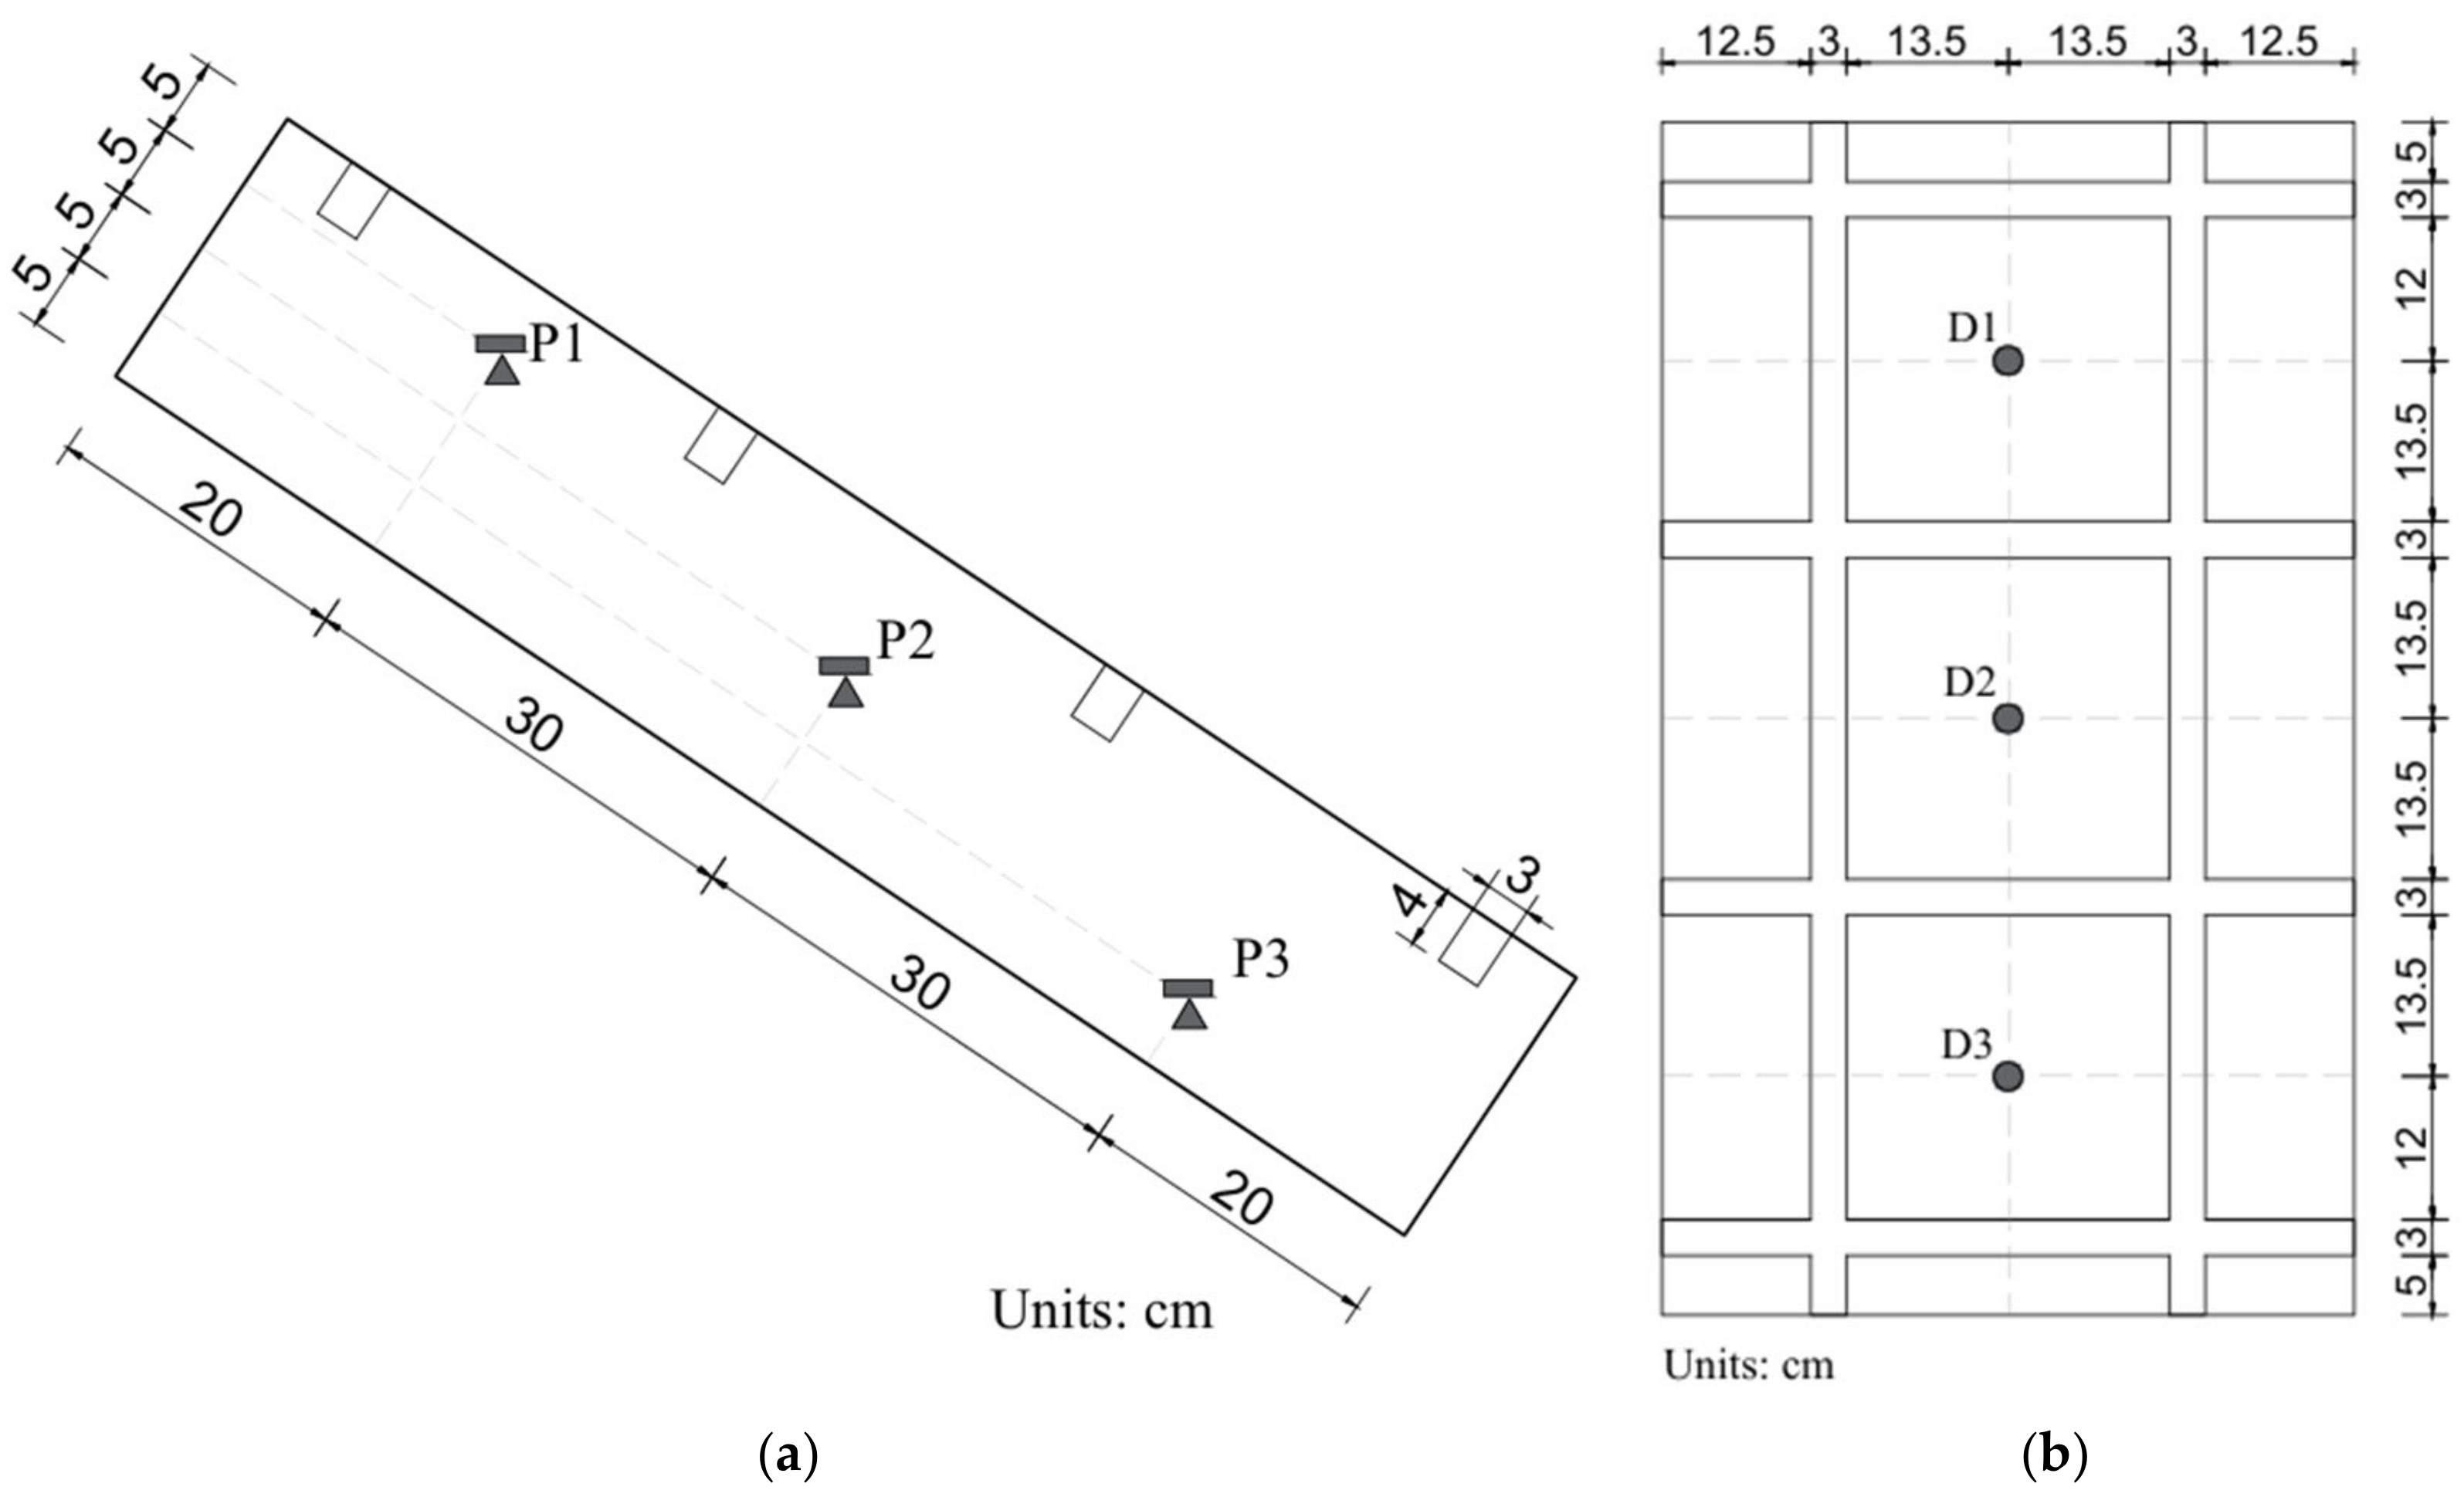
Three moisture content sensors and three pore-water pressure sensors were installed within the slope model, while three dial indicators were positioned to monitor surface deformation. The monitoring layout for moisture content and pore-water pressure comprised measurement points at the slope crest (P1), mid-slope (P2), and slope toe (P3), with sensors installed at increasing depths. Surface deformation was recorded using dial indicators at D1–D3, corresponding to the slope crest, mid-slope, and slope toe, respectively. The moisture content sensors had a measurement range of 0–100%, a resolution of 0.25% and an accuracy of ±3%; the pore-water pressure sensors had a measurement range of −80 to 1500 kPa, a resolution of 0.015 kPa and an accuracy ≤ 0.3 kPa; and the dial gauge indicators used for surface deformation measurement had a range of 0–10 mm and a resolution of 0.01 mm. The monitoring instruments were obtained from Beijing Haiyan Zhice Technology Co., Ltd. based in Beijing, China. Even though all the stated specifications were manufacturer provided, laboratory verification tests were conducted before installation and subsequent data collection by the monitoring instruments. The moisture content sensors were verified using soil samples, with known water contents determined by the oven-drying method. The pore-water pressure sensors were verified by immersion in a calibrated water column, and the recorded pressure-head readings were compared with the theoretical values corresponding to the known immersion depths of the sensors. The dial gauge indicators were zeroed before each test and checked using known displacement increments. Since the moisture content and pore-water pressure sensors were connected to a computerized data recorder, the readings displayed by the data acquisition software were also checked and confirmed to be consistent with the manufacturer-provided calibration information and instrument specifications. In addition, the pore-water pressure sensors were soaked in water for 24 h before installation to ensure saturation of the porous stone and rapid sensitivity to pressure changes during monitoring. The detailed monitoring scheme layout is illustrated in
Figure 5, while
Figure 6 shows the measurement instruments’ specifications.
2.4. Test Scheme and Procedure
The prototype site is located in the Nanning region, which experiences a humid subtropical monsoon climate characterized by pronounced seasonal variability and distinct wet–dry cycles. The mean annual rainfall is approximately 1662 mm, with the wet season occurring between May and August and an average monthly rainfall of about 217 mm, while the dry season extends from October to March, with an average monthly rainfall of approximately 34 mm. The region receives around 1579 h of sunshine annually, with the highest solar radiation occurring in August and September [
30,
31].
To realistically reproduce local climatic conditions, precipitation and evaporation cycles were determined using a statistical analysis of long-term meteorological data for Nanning. Previous studies have shown that low-intensity rainfall acting over extended durations is more detrimental to expansive soil slopes than short-duration, high-intensity events; this consideration was therefore incorporated into the design of the wetting–drying cycles [
32,
33]. A total of 5 wetting–drying cycles were applied, each lasting 48 h, for a total test duration of 240 h. The 48 h cycle adopted in the physical model tests was an accelerated laboratory wetting–drying regime developed for controlled comparative evaluation of the different slope protection systems. The selection of five wetting–drying cycles was based on the need to reproduce the progressive hydro-mechanical degradation behavior of expansive soils under repeated climatic loading while maintaining a practical and controlled laboratory testing duration. Previous studies have shown that the most significant changes in crack development, suction variation, erosion susceptibility, and swelling–shrinkage deformation of expansive soils generally occur during the early wetting–drying cycles. Therefore, five cycles were considered sufficient to capture the representative evolution of slope behavior and to enable comparative evaluation of the protection performance of the different slope configurations. Each cycle consisted of a 4 h wetting phase followed by a 4 h moisture equalization period to allow internal moisture redistribution and ambient drying, a 28 h active drying phase, and a final 12 h suction stabilization period. Rainfall was applied at 35 mm/h using atomizing nozzles to ensure uniform distribution over the slope surface. The rainfall intensity was controlled using a computerized rainfall-simulation system. Before the wetting tests, the target rainfall intensity of 35 mm/h was set in the control software, which regulated the pump discharge and spraying duration during rainfall application. To verify the actual rainfall delivered to the model slope, the spray system was calibrated before testing using the catch-can method. Several collection containers were uniformly arranged at representative positions along the upper, middle, and lower parts of the sloping surface. The system was then operated for a fixed duration under the software-controlled 35 mm/h setting, and the collected water volumes were measured. The equivalent rainfall intensity was calculated using the collected water volume, container opening area, and spraying time. The nozzle height, spray angle, nozzle spacing, and pump setting were adjusted until the measured average rainfall intensity was consistent with the target value and the spatial distribution over the slope surface was sufficiently uniform for comparative testing. During the physical model tests, the same software setting, nozzle arrangement, spray height, spray angle, and wetting duration were maintained for all three slope configurations to ensure consistent hydraulic loading. High-energy lamps were used to simulate solar radiation during the active drying phase, while the equalization and stabilization periods represented natural drying under cloudy conditions.
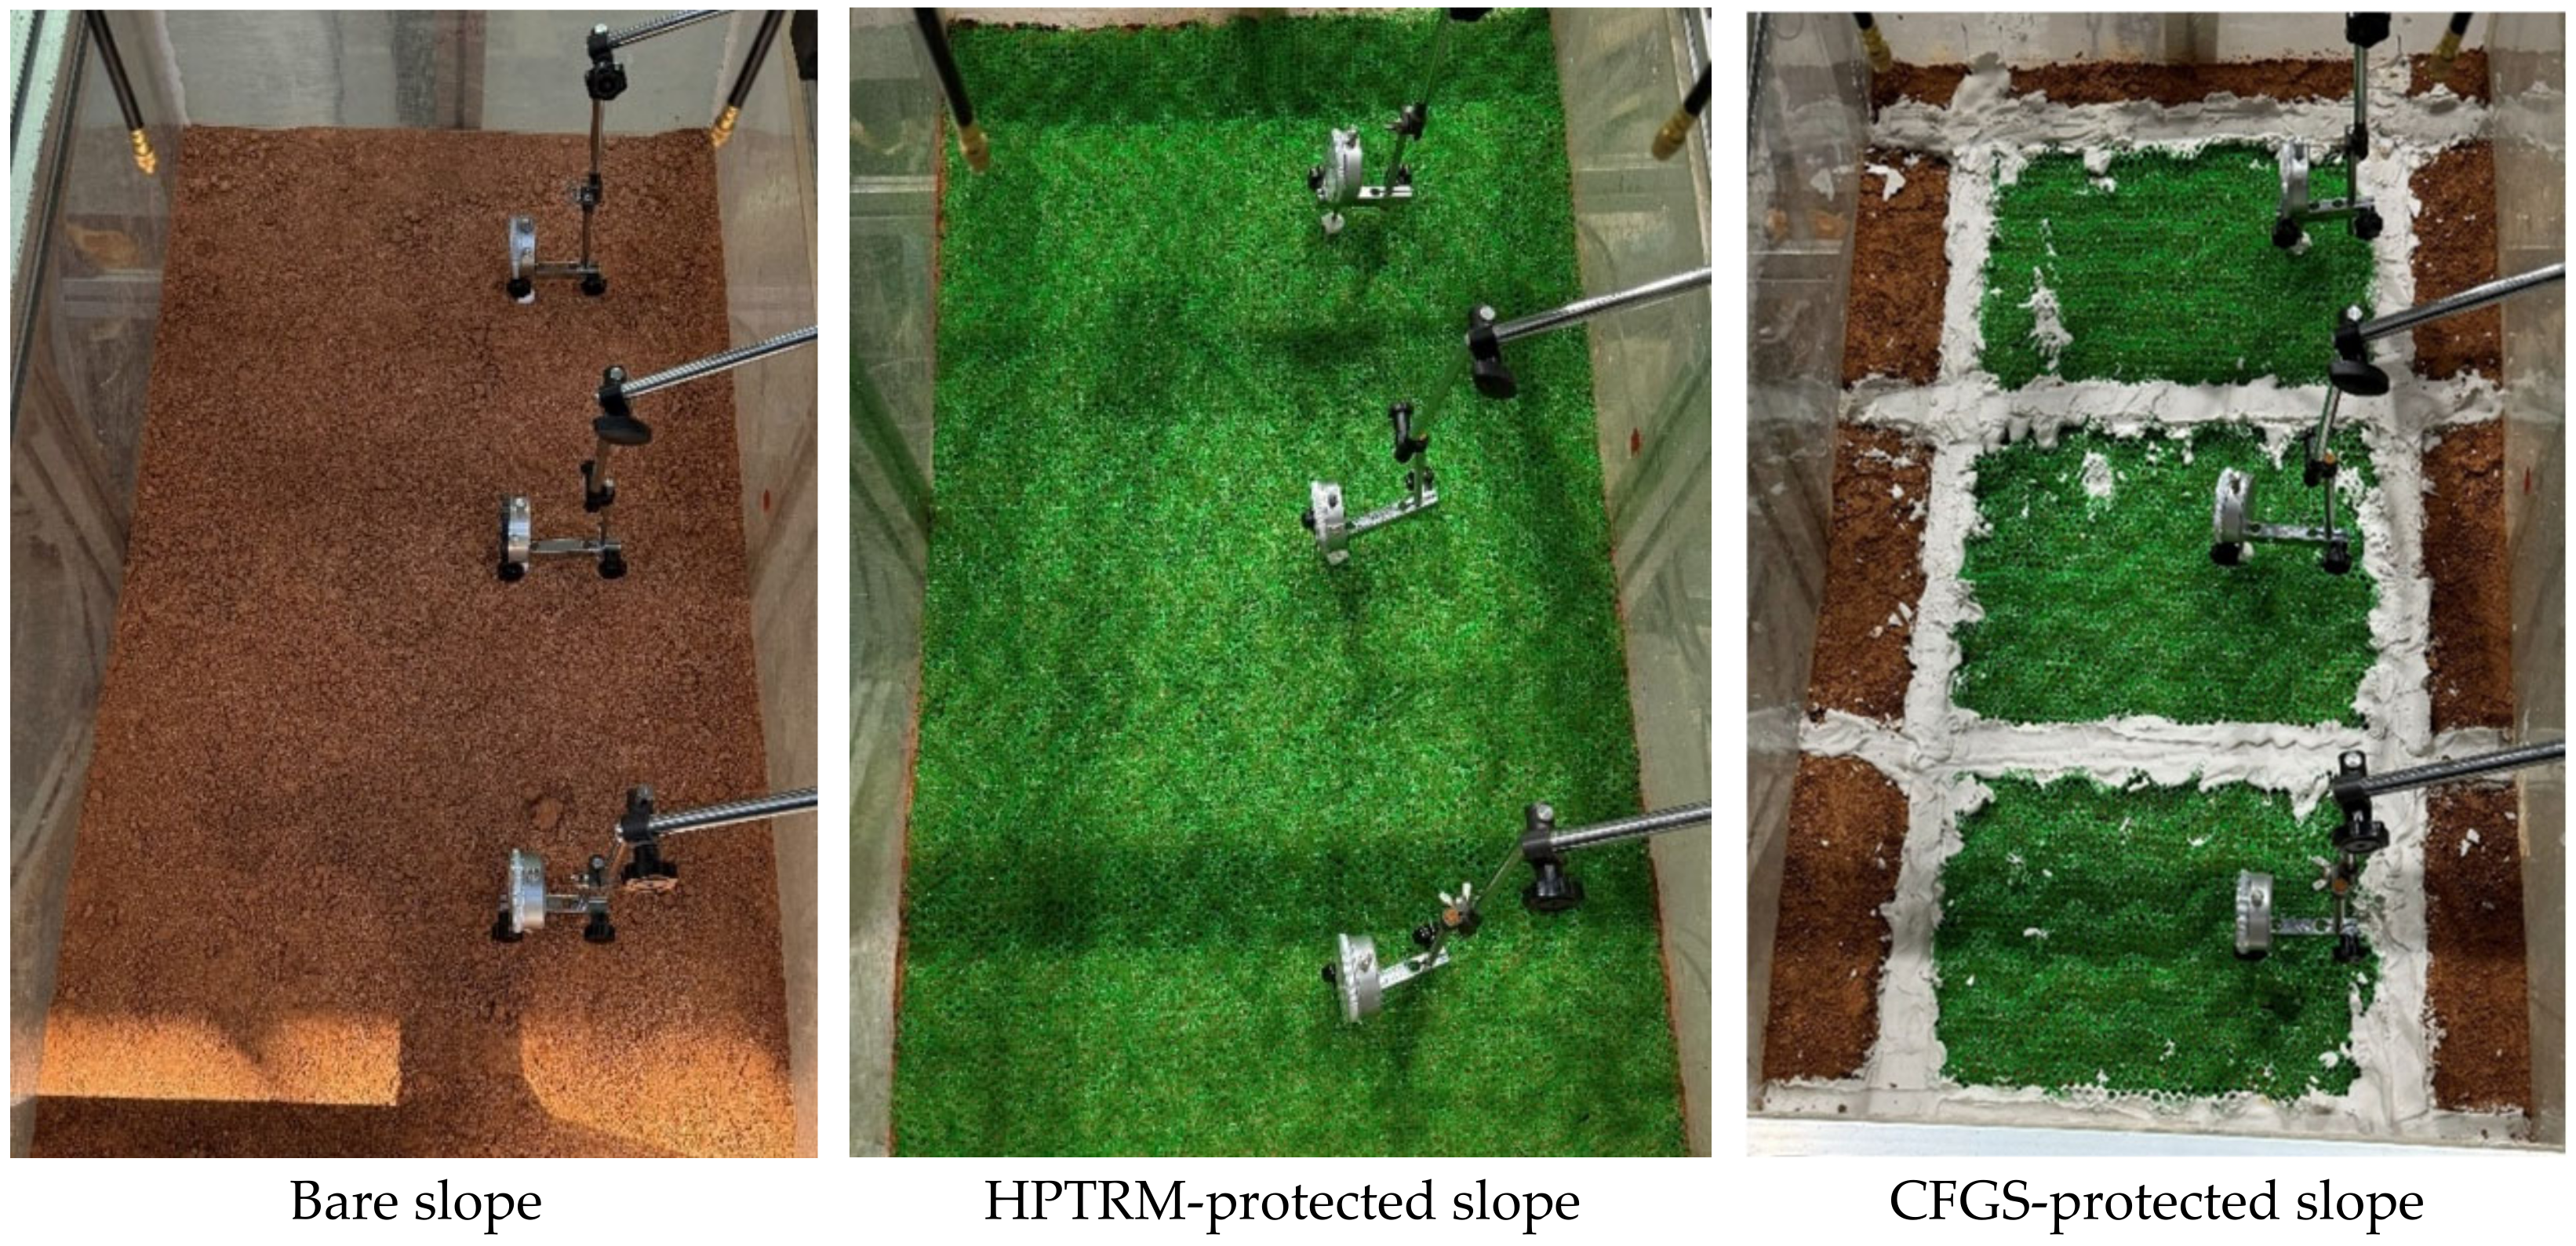
Three physical model tests were conducted in this study, corresponding to the three slope protection configurations: bare slope, HPTRM-protected slope, and CFGS-protected slope. The purpose of the tests was to compare the relative hydro-mechanical response of the three configurations under controlled laboratory conditions. To ensure comparability, all models were prepared using the same soil source, compaction procedure, target density, initial moisture condition, slope geometry, boundary conditions, wetting–drying program, and monitoring arrangement. The results were evaluated using multiple indicators, including cumulative erosion, surface deformation, moisture variation, pore-water pressure/suction response, and observed slope-surface behavior. The main experimental variable was the protection configuration. All other factors were controlled as far as was practicable. Therefore, the observed differences among the three slopes can reasonably be attributed to the protection condition rather than differences in soil type, geometry, moisture state, loading program, or monitoring layout. Therefore, the experimental assessment was based on internal consistency and comparative response trends rather than statistical replication. The three slope schemes are shown in
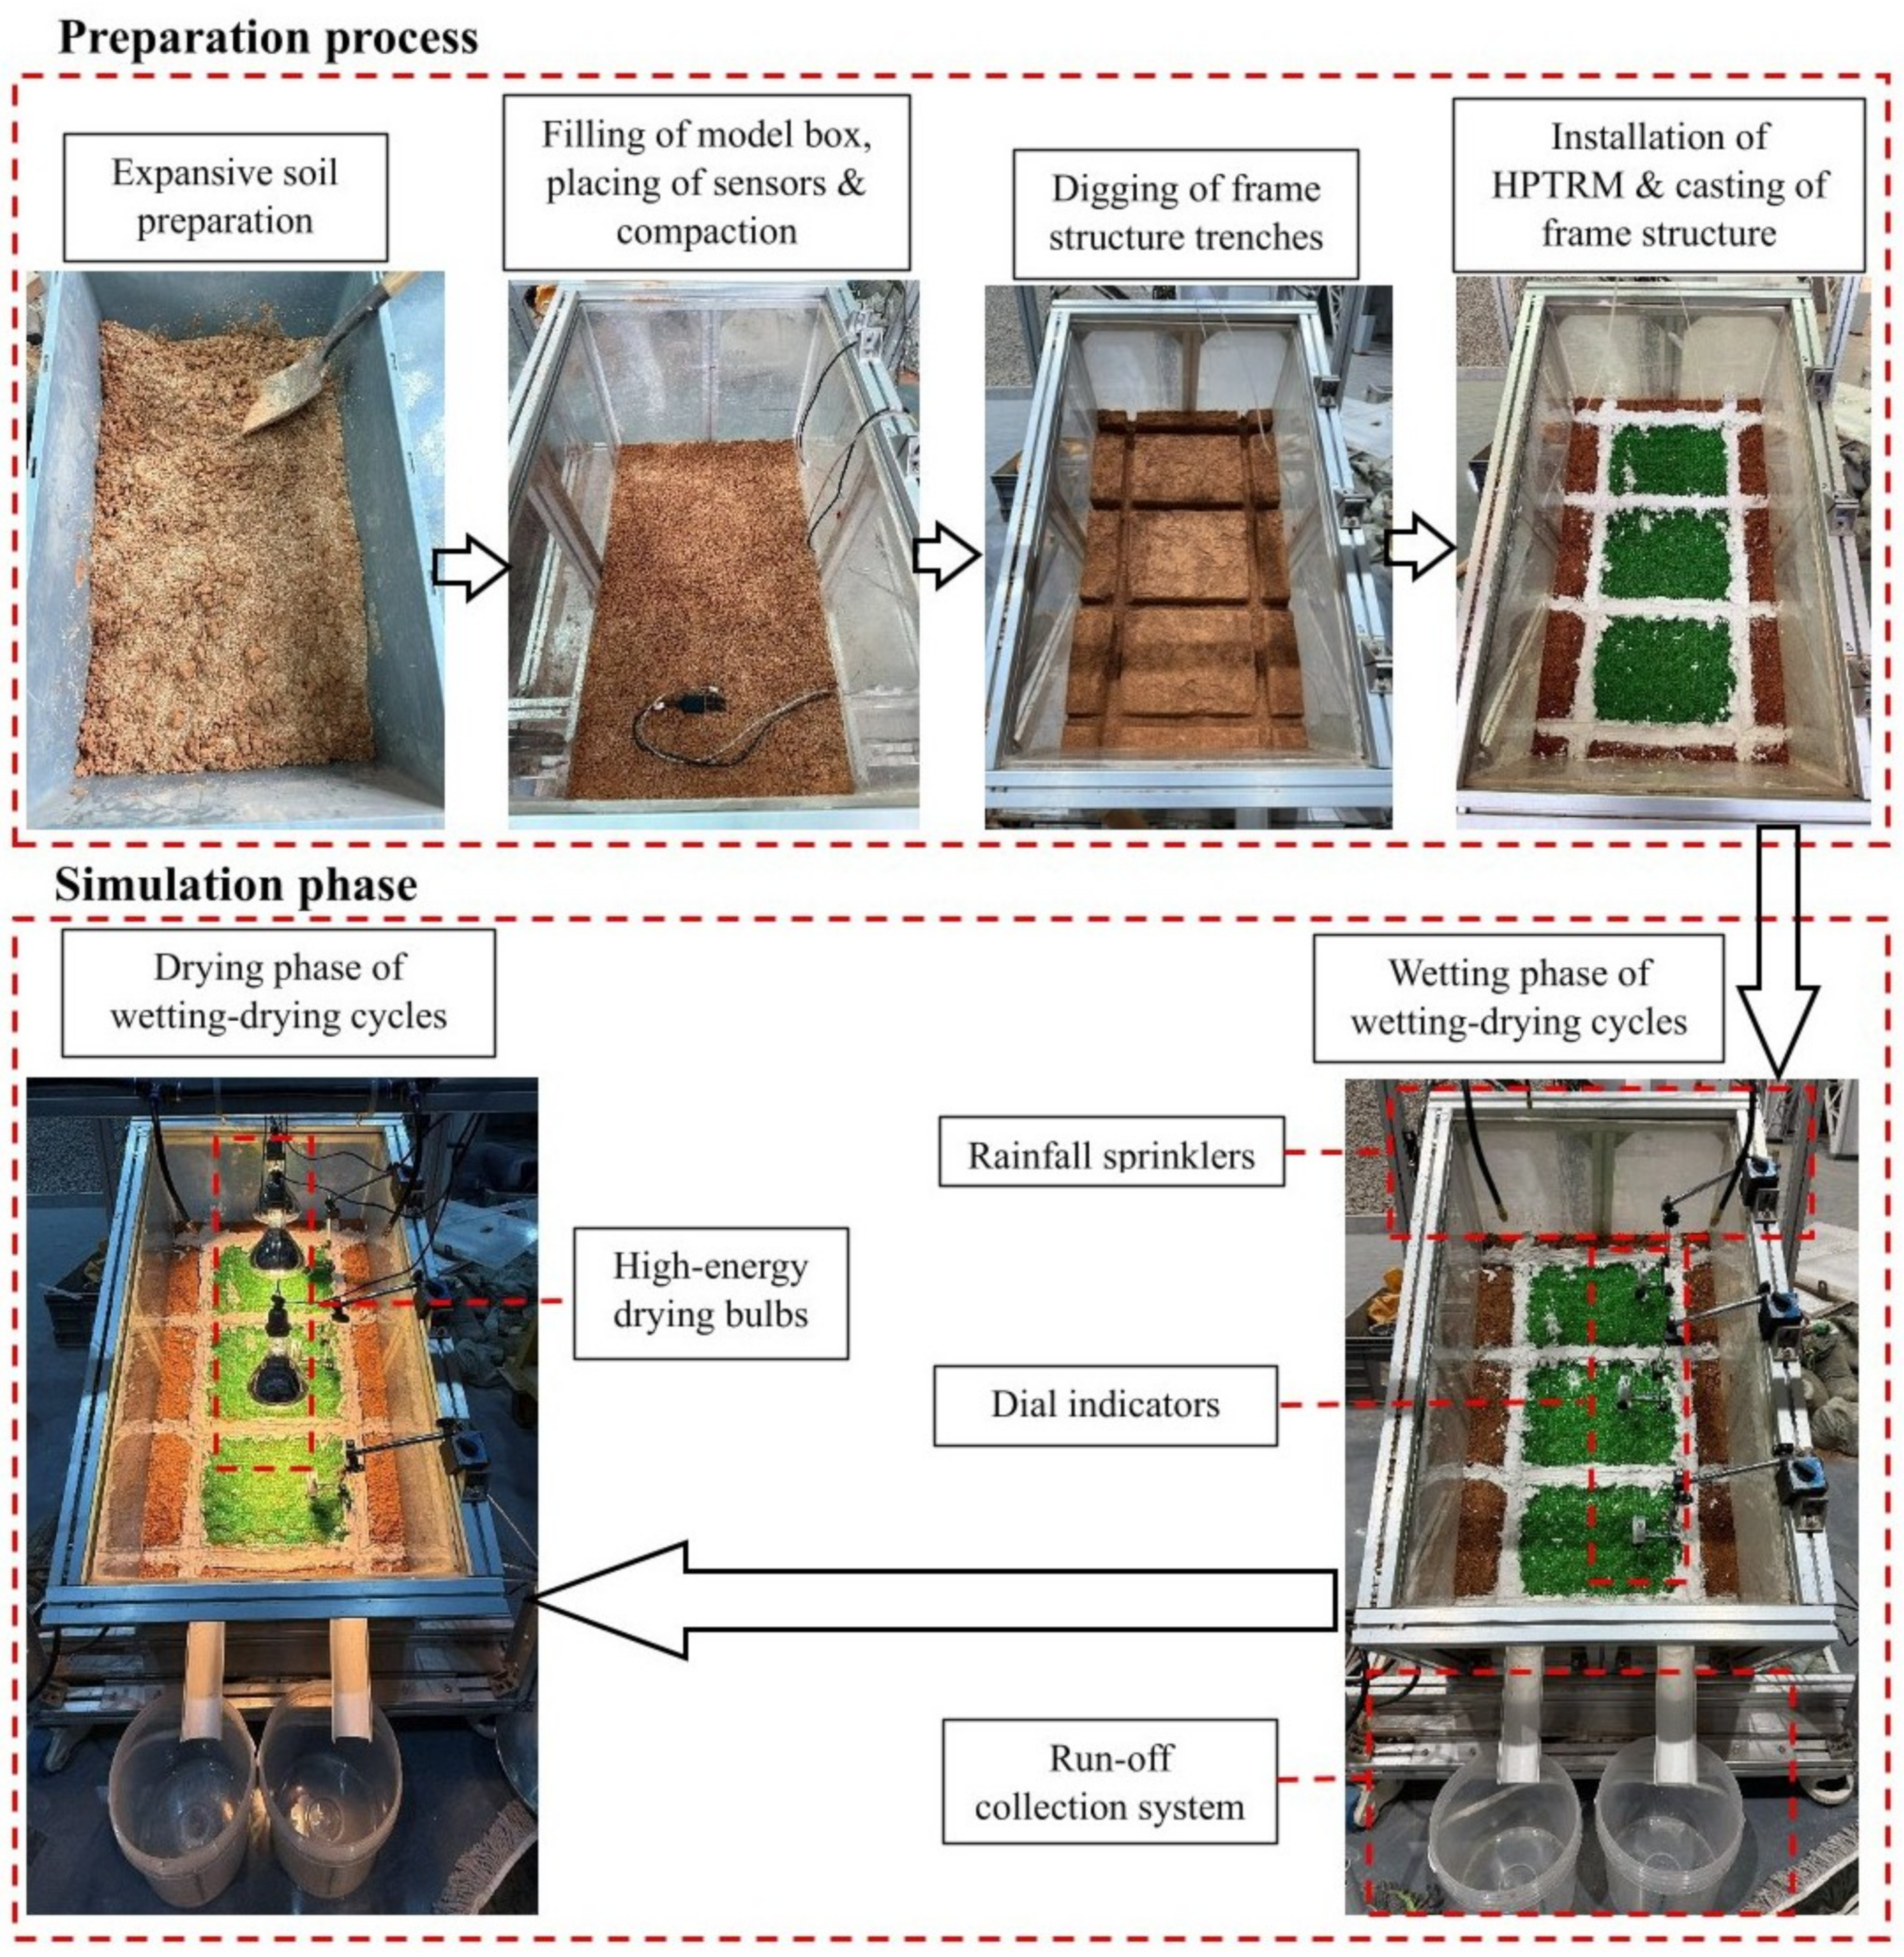
Figure 7, while
Figure 8 shows representative complete model test preparation and simulation procedures for the CFGS-protected slope.
3. Results and Analysis
3.1. Runoff
Runoff behavior was evaluated using two indicators: (i) runoff initiation time after rainfall onset and (ii) cumulative runoff volume during each wetting phase. These indicators reflect the interaction between rainfall infiltration, surface hydraulic resistance, and the evolving soil structure during cyclic wetting–drying processes.
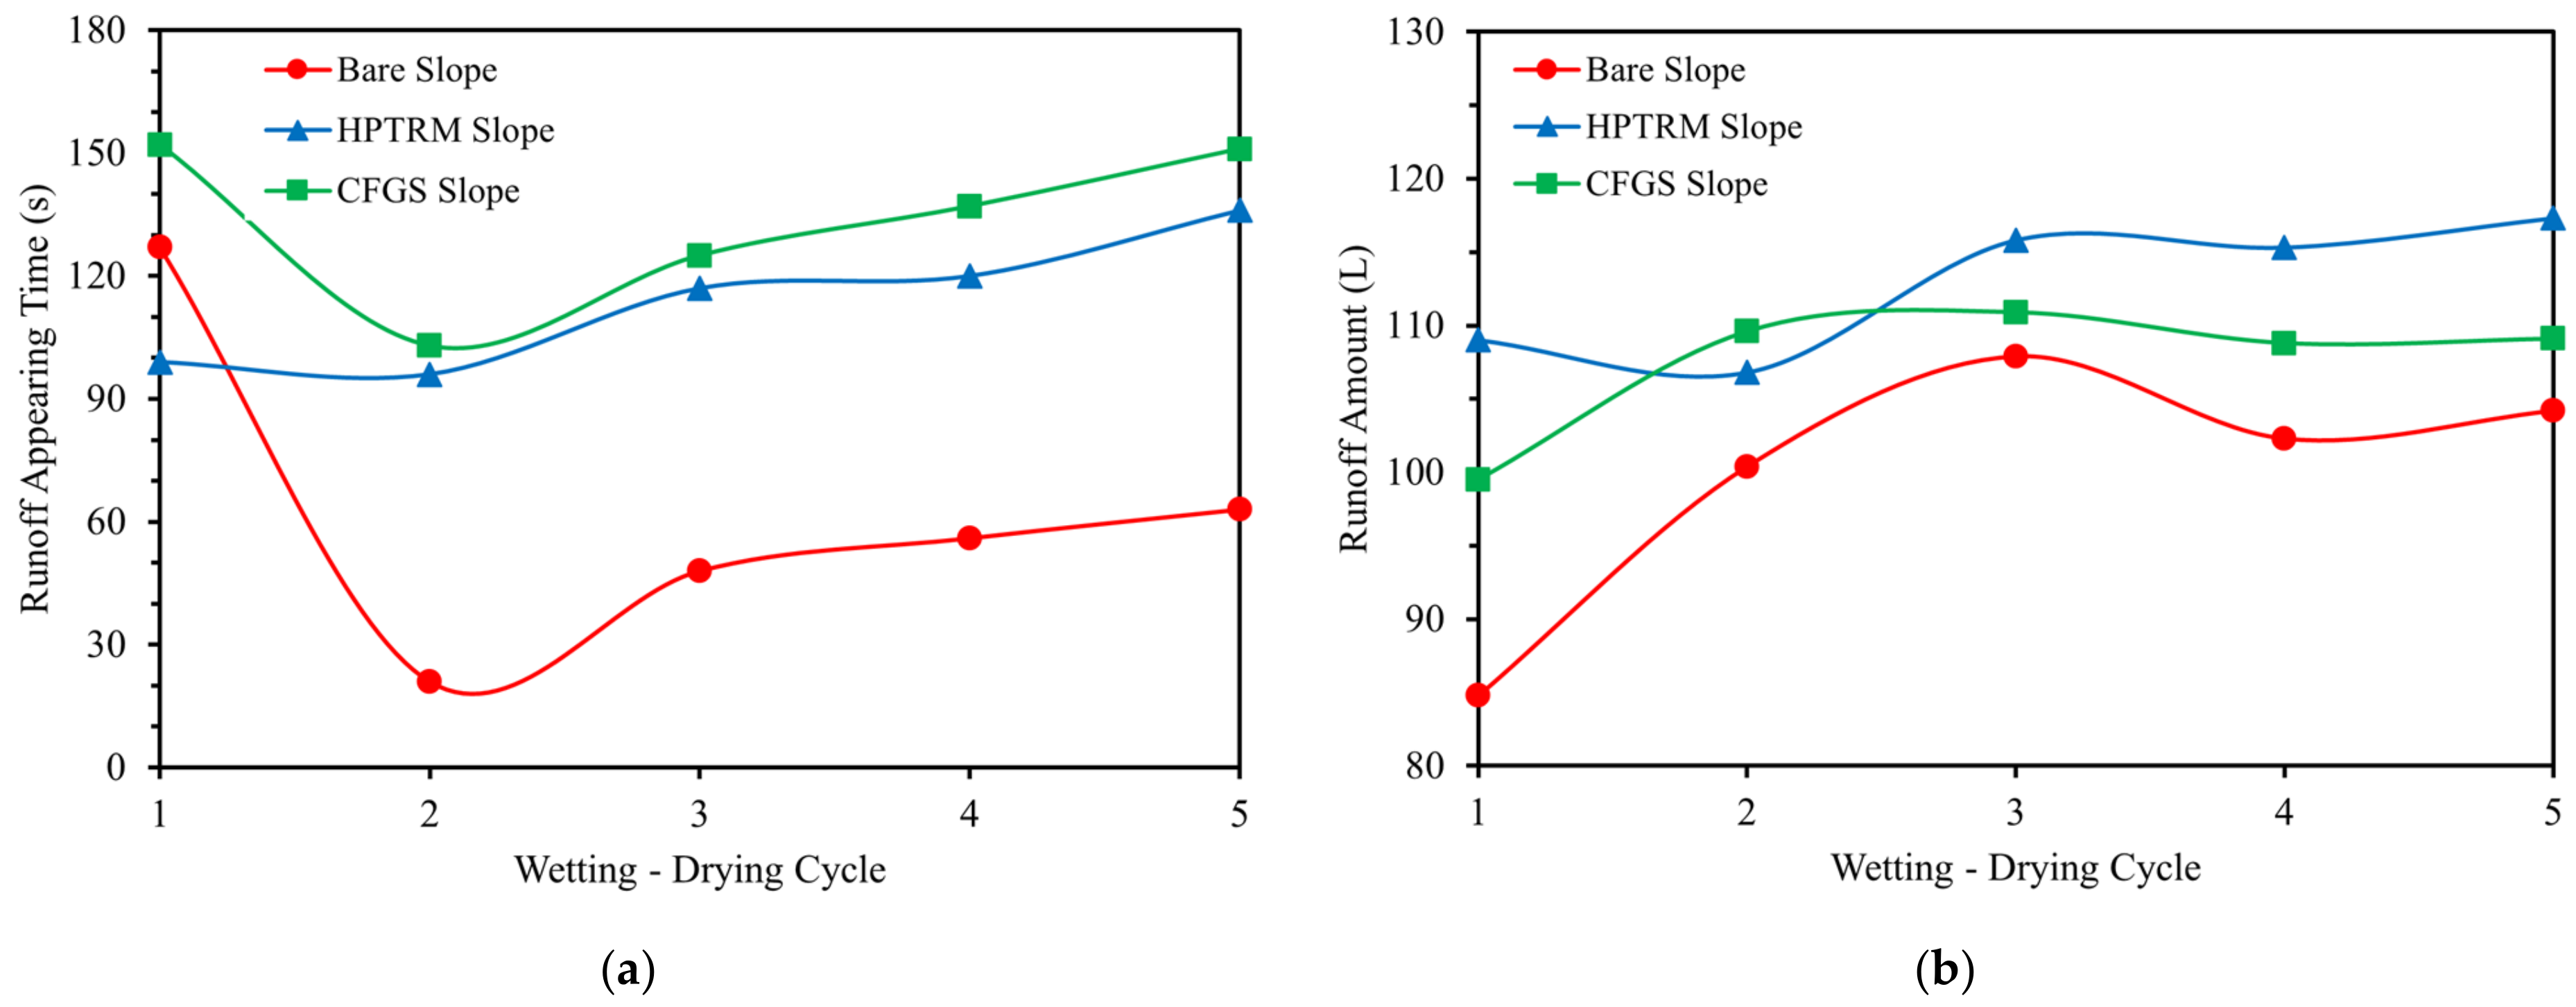
Figure 9a presents the runoff initiation times for the three slope configurations. For all slopes, runoff initiation was markedly delayed during the first wetting cycle due to the initially dry soil condition. The compacted soil possessed high matric suction and, therefore, a high infiltration capacity, allowing a substantial portion of rainfall to infiltrate before surface runoff developed. During the second cycle, runoff initiation occurred earlier as partial suction loss, and the initial formation of shrinkage cracks during drying altered the infiltration–runoff balance. From the third to the fifth cycles, runoff initiation time gradually increased again as the progressive expansion of desiccation cracks enhanced infiltration capacity and temporarily increased soil water storage during rainfall events.
Clear differences were observed among the three slope configurations. Except for the first cycle, the bare slope consistently exhibited the shortest runoff initiation times. The absence of surface protection provided minimal resistance to overland flow, allowing rainfall to rapidly concentrate and move downslope once the infiltration capacity of the surface soil layer was exceeded. In contrast, the HPTRM slope exhibited longer runoff initiation times due to the presence of the HPTRM layer. The three-dimensional structure of the mat increases surface roughness and temporarily retains rainfall within the matrix, thereby reducing flow velocity and delaying the formation of continuous runoff. The CFGS-protected slope exhibited the longest runoff initiation times throughout the tests. This behavior reflects the combined influence of the rigid frame and the HPTRM infill. The frame subdivides the slope surface into discrete drainage cells, increasing hydraulic resistance to downslope flow. In contrast, the HPTRM within the cells temporarily stores rainfall and promotes local infiltration before runoff pathways are activated.
Statistical analysis of the results further highlights the stabilizing effect of the protection systems. Across the five wetting–drying cycles, the mean runoff initiation time increased from 63.0 s for the bare slope to 113.6 s for the HPTRM slope and 133.6 s for the CFGS slope. Meanwhile, the coefficient of variation decreased from 62.16% in the bare slope to 14.45% and 15.26% for the HPTRM and CFGS slopes, respectively, indicating a substantially more consistent hydraulic response once surface protection was introduced.
The cumulative runoff volume during each wetting phase is shown in
Figure 9b. Larger runoff volumes indicate that a greater proportion of rainfall is conveyed downslope rather than infiltrating into the soil mass. The bare slope consistently produced the smallest runoff volumes, indicating that a substantial portion of rainfall infiltrated into the soil through exposed pores and shrinkage cracks. In contrast, the HPTRM-protected slope generated the largest runoff volumes. Once runoff was initiated, the three-dimensional mat structure formed interconnected preferential flow paths that facilitated lateral water movement along the slope surface. As wetting–drying cycles progressed and shrinkage cracks expanded beneath the mat, these preferential pathways became more pronounced, further promoting efficient surface drainage. The CFGS-protected slope exhibited slightly smaller runoff volumes than the HPTRM slope but larger volumes than the bare slope. Under CFGS protection, the rigid frame establishes fixed drainage pathways that control runoff routing across the slope surface, while the HPTRM confined within the frame cells retains soil and limits the lateral expansion of preferential flow paths. Consequently, the hydraulic response of the slope remains relatively stable across cycles, as the frame-defined drainage network restricts the progressive development of new runoff channels.
Over the entire testing period, the cumulative runoff volumes were 499.6 L, 564.2 L, and 537.9 L for the bare, HPTRM, and CFGS slopes, respectively. Thus, the cumulative runoff of the bare slope corresponded to approximately 89% and 93% of that recorded for the HPTRM and CFGS slopes, respectively. These results indicate that the surface protection systems, particularly the CFGS, effectively regulate rainfall partitioning by directing a larger proportion of incident water as controlled surface runoff rather than allowing unrestricted infiltration into the expansive soil mass.
3.2. Erosion
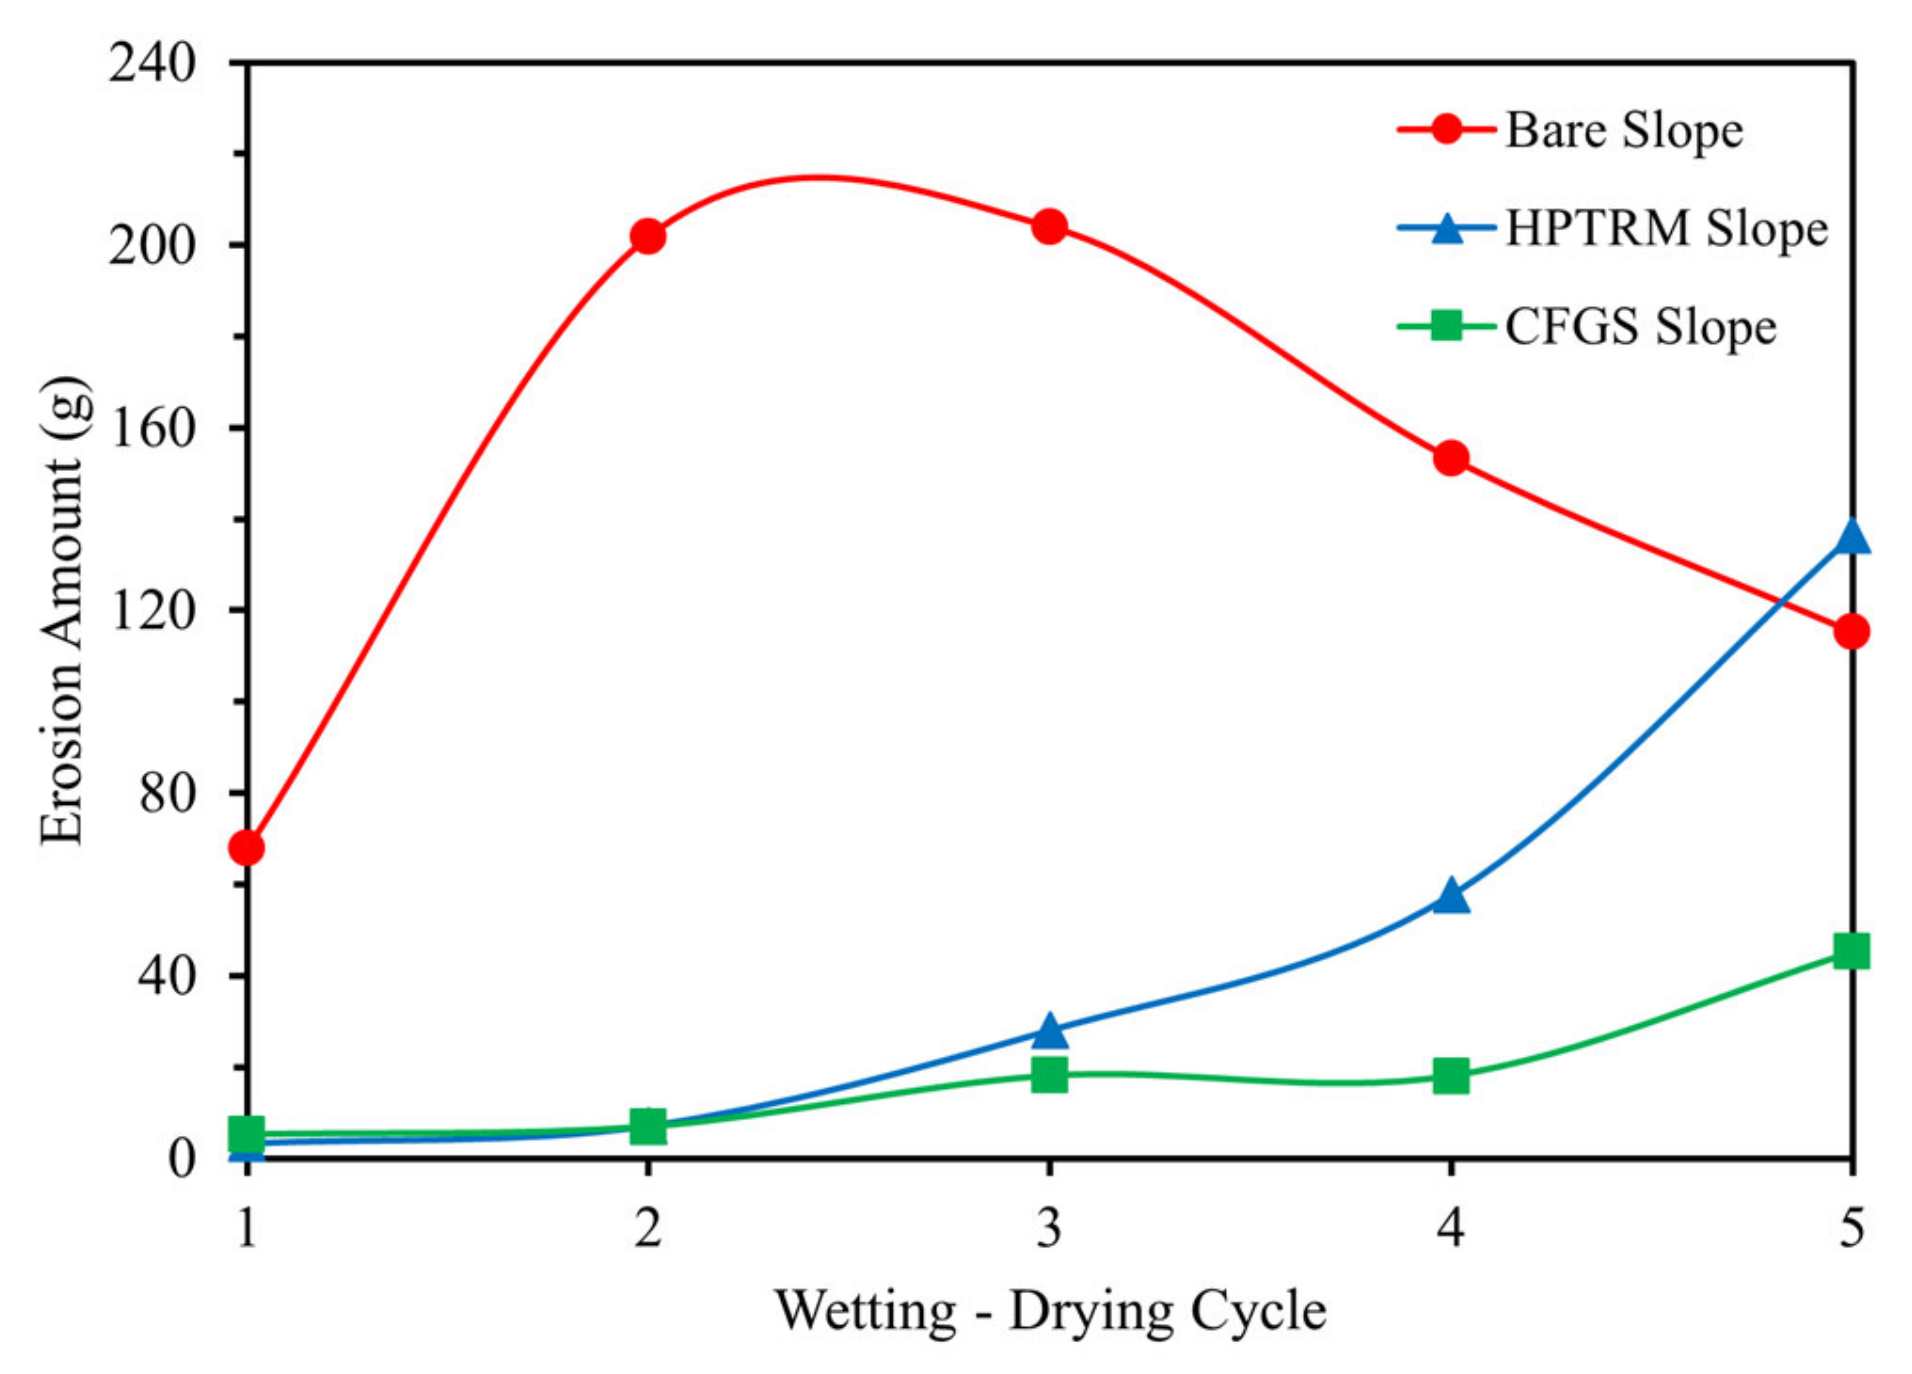
Figure 10 presents the cumulative erosion for the three slope configurations during the wetting–drying cycles. Erosion is defined as the mass of soil removed from the slope surface by runoff during each rainfall event. It reflects the combined effects of raindrop impact, runoff shear stress, and the progressive degradation of soil structure caused by cyclic swelling–shrinkage processes.
The bare slope exhibited the highest erosion throughout the testing period. A pronounced increase in erosion occurred between the first and second cycles. During the first cycle, the compacted and relatively dry soil maintained high matric suction and strong interparticle bonding, allowing significant rainfall infiltration while limiting particle detachment. After the first drying phase, however, shrinkage cracks developed, and the soil began the second wetting phase with higher moisture content and reduced structural integrity. These conditions weakened near-surface shear strength and increased the susceptibility of soil particles to detachment and transport by runoff. From the third to the fifth cycles, erosion of the bare slope gradually decreased. By this stage, the loosely bound soil particles generated during earlier cycles had largely been removed, leaving a relatively denser and more stable surface layer. This progressive reduction in erosion is characteristic of expansive soils subjected to repeated wetting–drying processes.
Both protected slopes exhibited substantially lower erosion magnitudes. During the first cycle, erosion on the protected slopes was negligible due to the presence of surface protection and the initially intact soil structure. However, with continued wetting–drying cycles, erosion on both slopes increased gradually as cyclic swelling–shrinkage processes progressively degraded the soil beneath the protective layers. Erosion on the HPTRM-protected slope remained consistently higher than that observed on the CFGS-protected slope. Although the HPTRM layer attenuates raindrop impact and increases surface roughness, it provides limited structural confinement to the underlying soil. As shrinkage cracks propagate beneath the mat during repeated cycles, localized soil detachment occurs, and particles may be transported downslope through mat openings.
In contrast, the CFGS-protected slope consistently exhibited the lowest erosion across all cycles. The rigid frame confines soil within discrete cells, restricting lateral soil displacement and preventing the formation of continuous erosion channels. At the same time, the HPTRM within the frame openings attenuates raindrop impact energy and stabilizes surface particles. This combined mechanism of structural confinement and surface protection effectively reduces both soil detachment and sediment transport.
Quantitatively, the cumulative erosion masses recorded for the bare, HPTRM, and CFGS slopes were 742.28 g, 232.33 g, and 93.37 g, respectively. Thus, the cumulative erosion of the HPTRM slope corresponded to approximately 31% of that observed for the bare slope. In comparison, the cumulative erosion of the CFGS slope corresponded to only 13% of that of the bare slope. These results demonstrate that the CFGS provides the most effective erosion control among the tested configurations, substantially enhancing the resistance of expansive soil slopes to rainfall-induced surface degradation.
3.3. Moisture Content
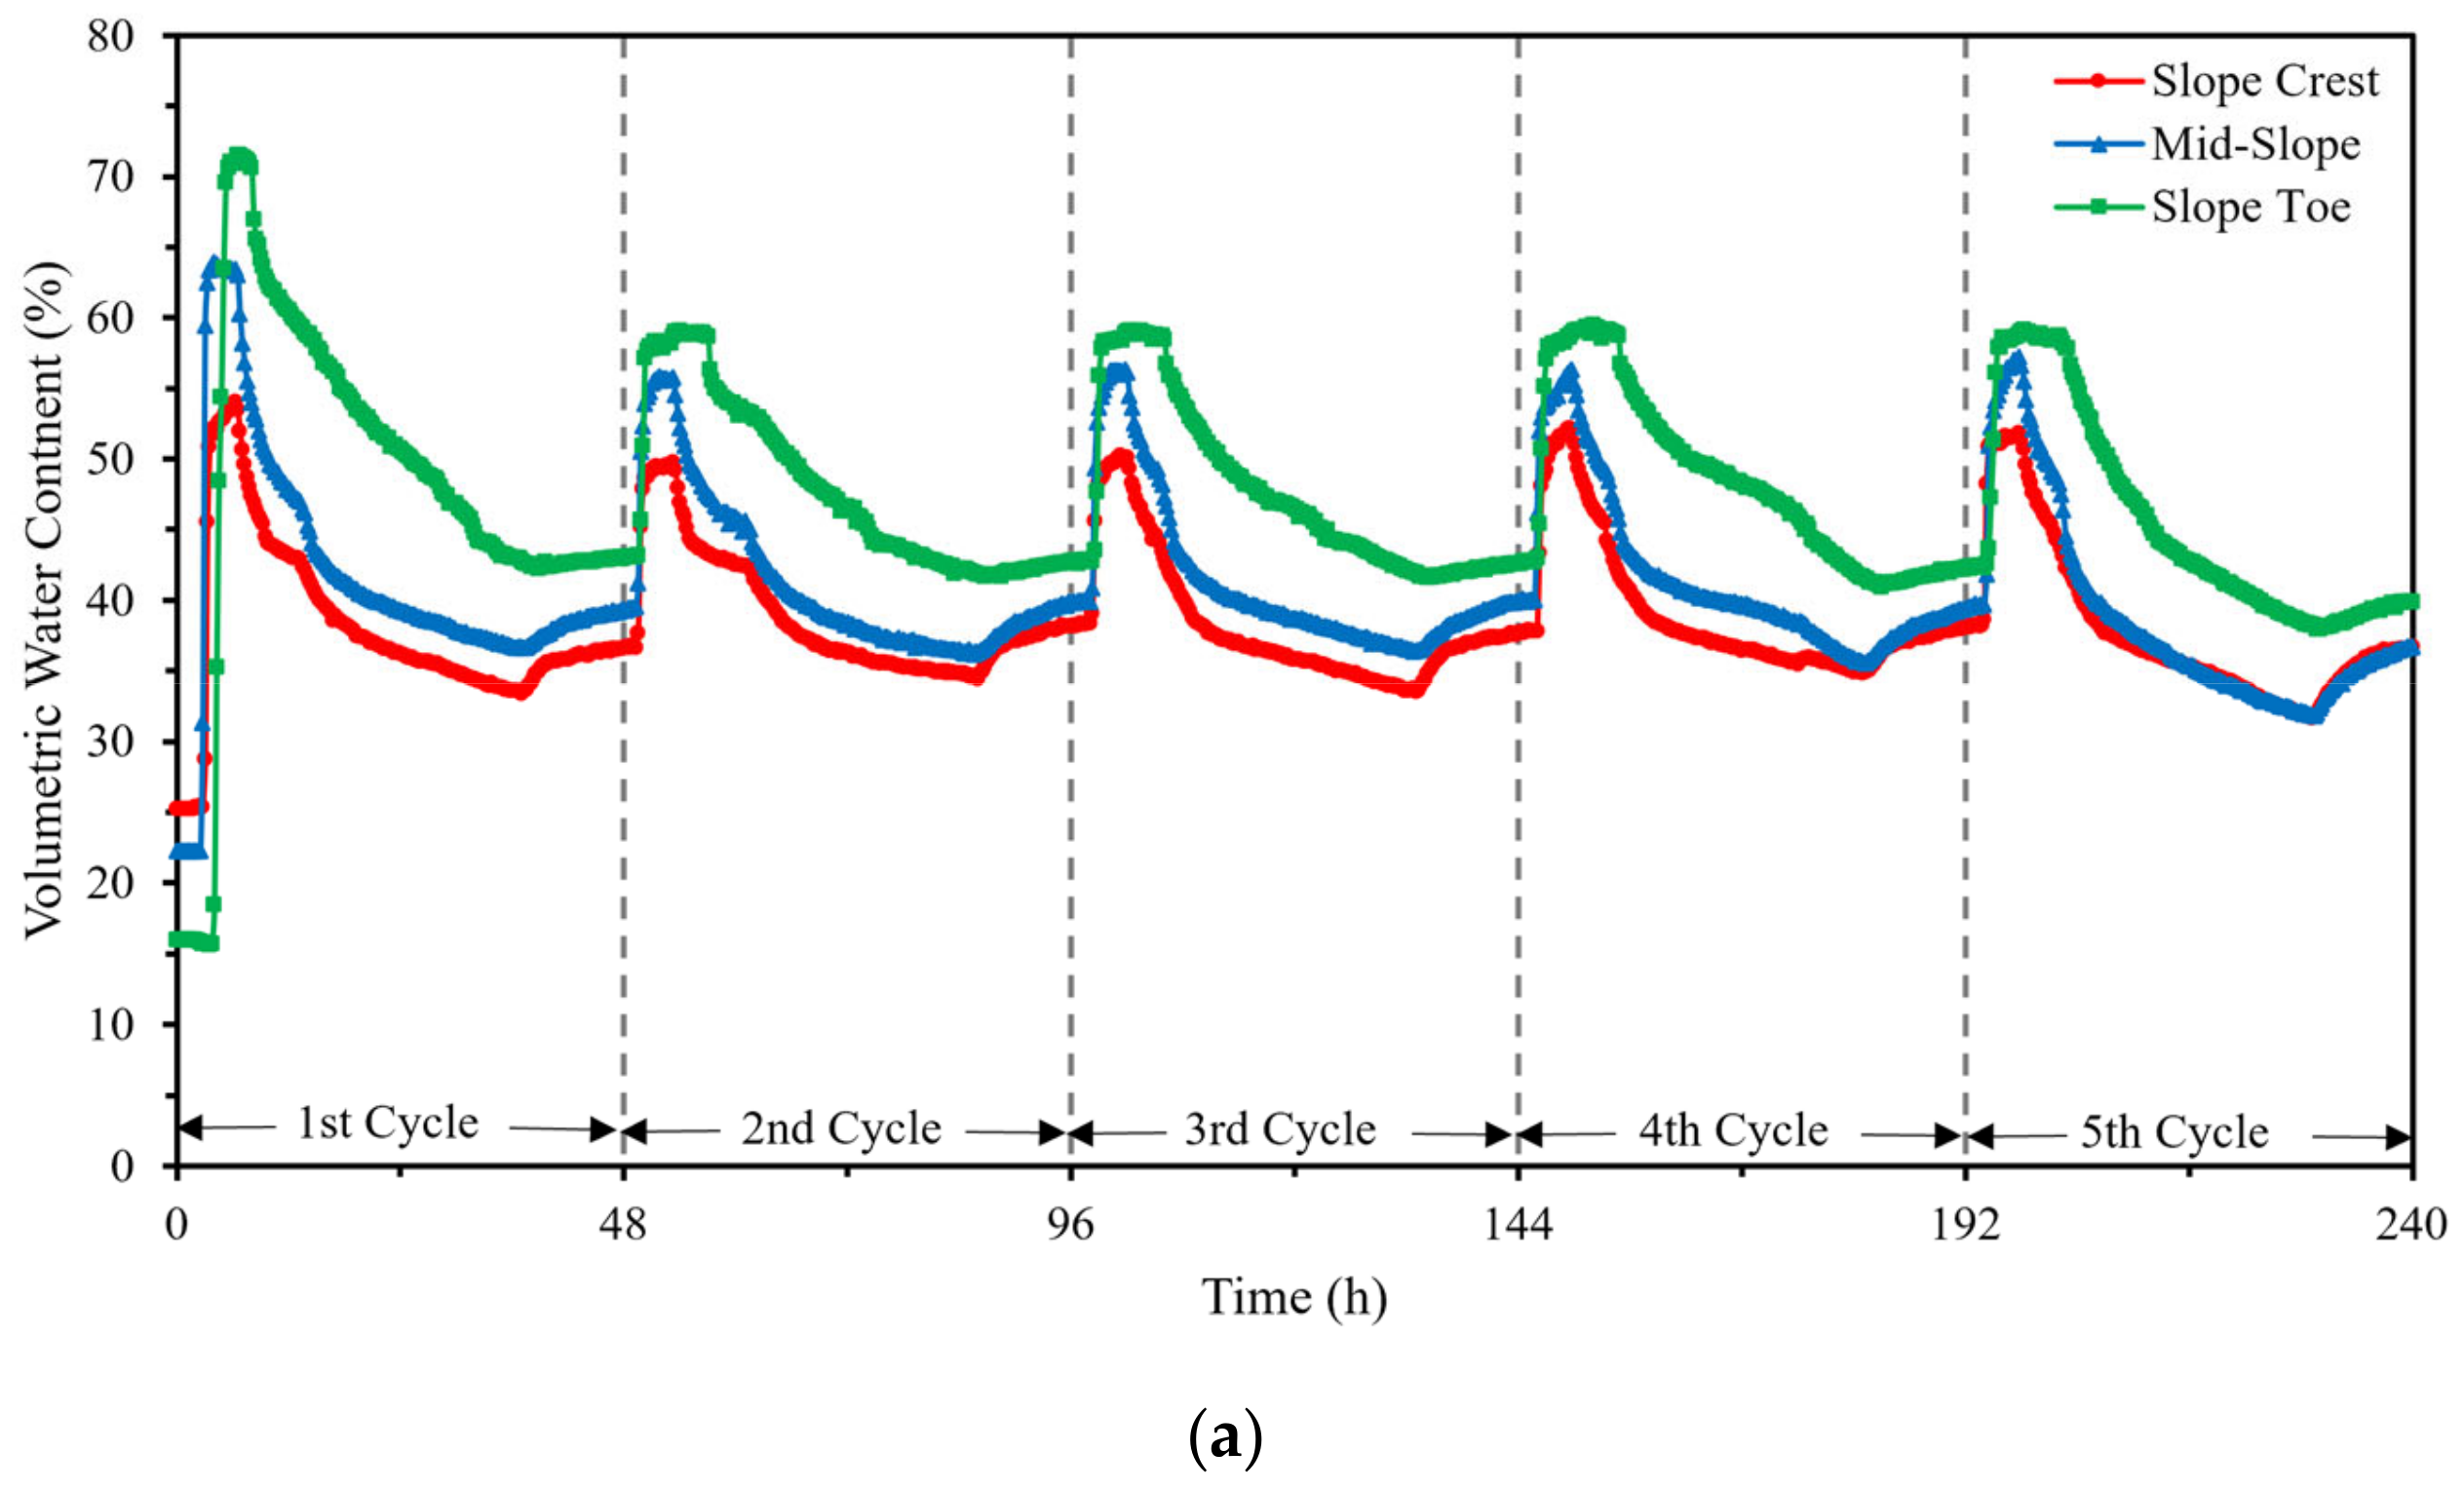
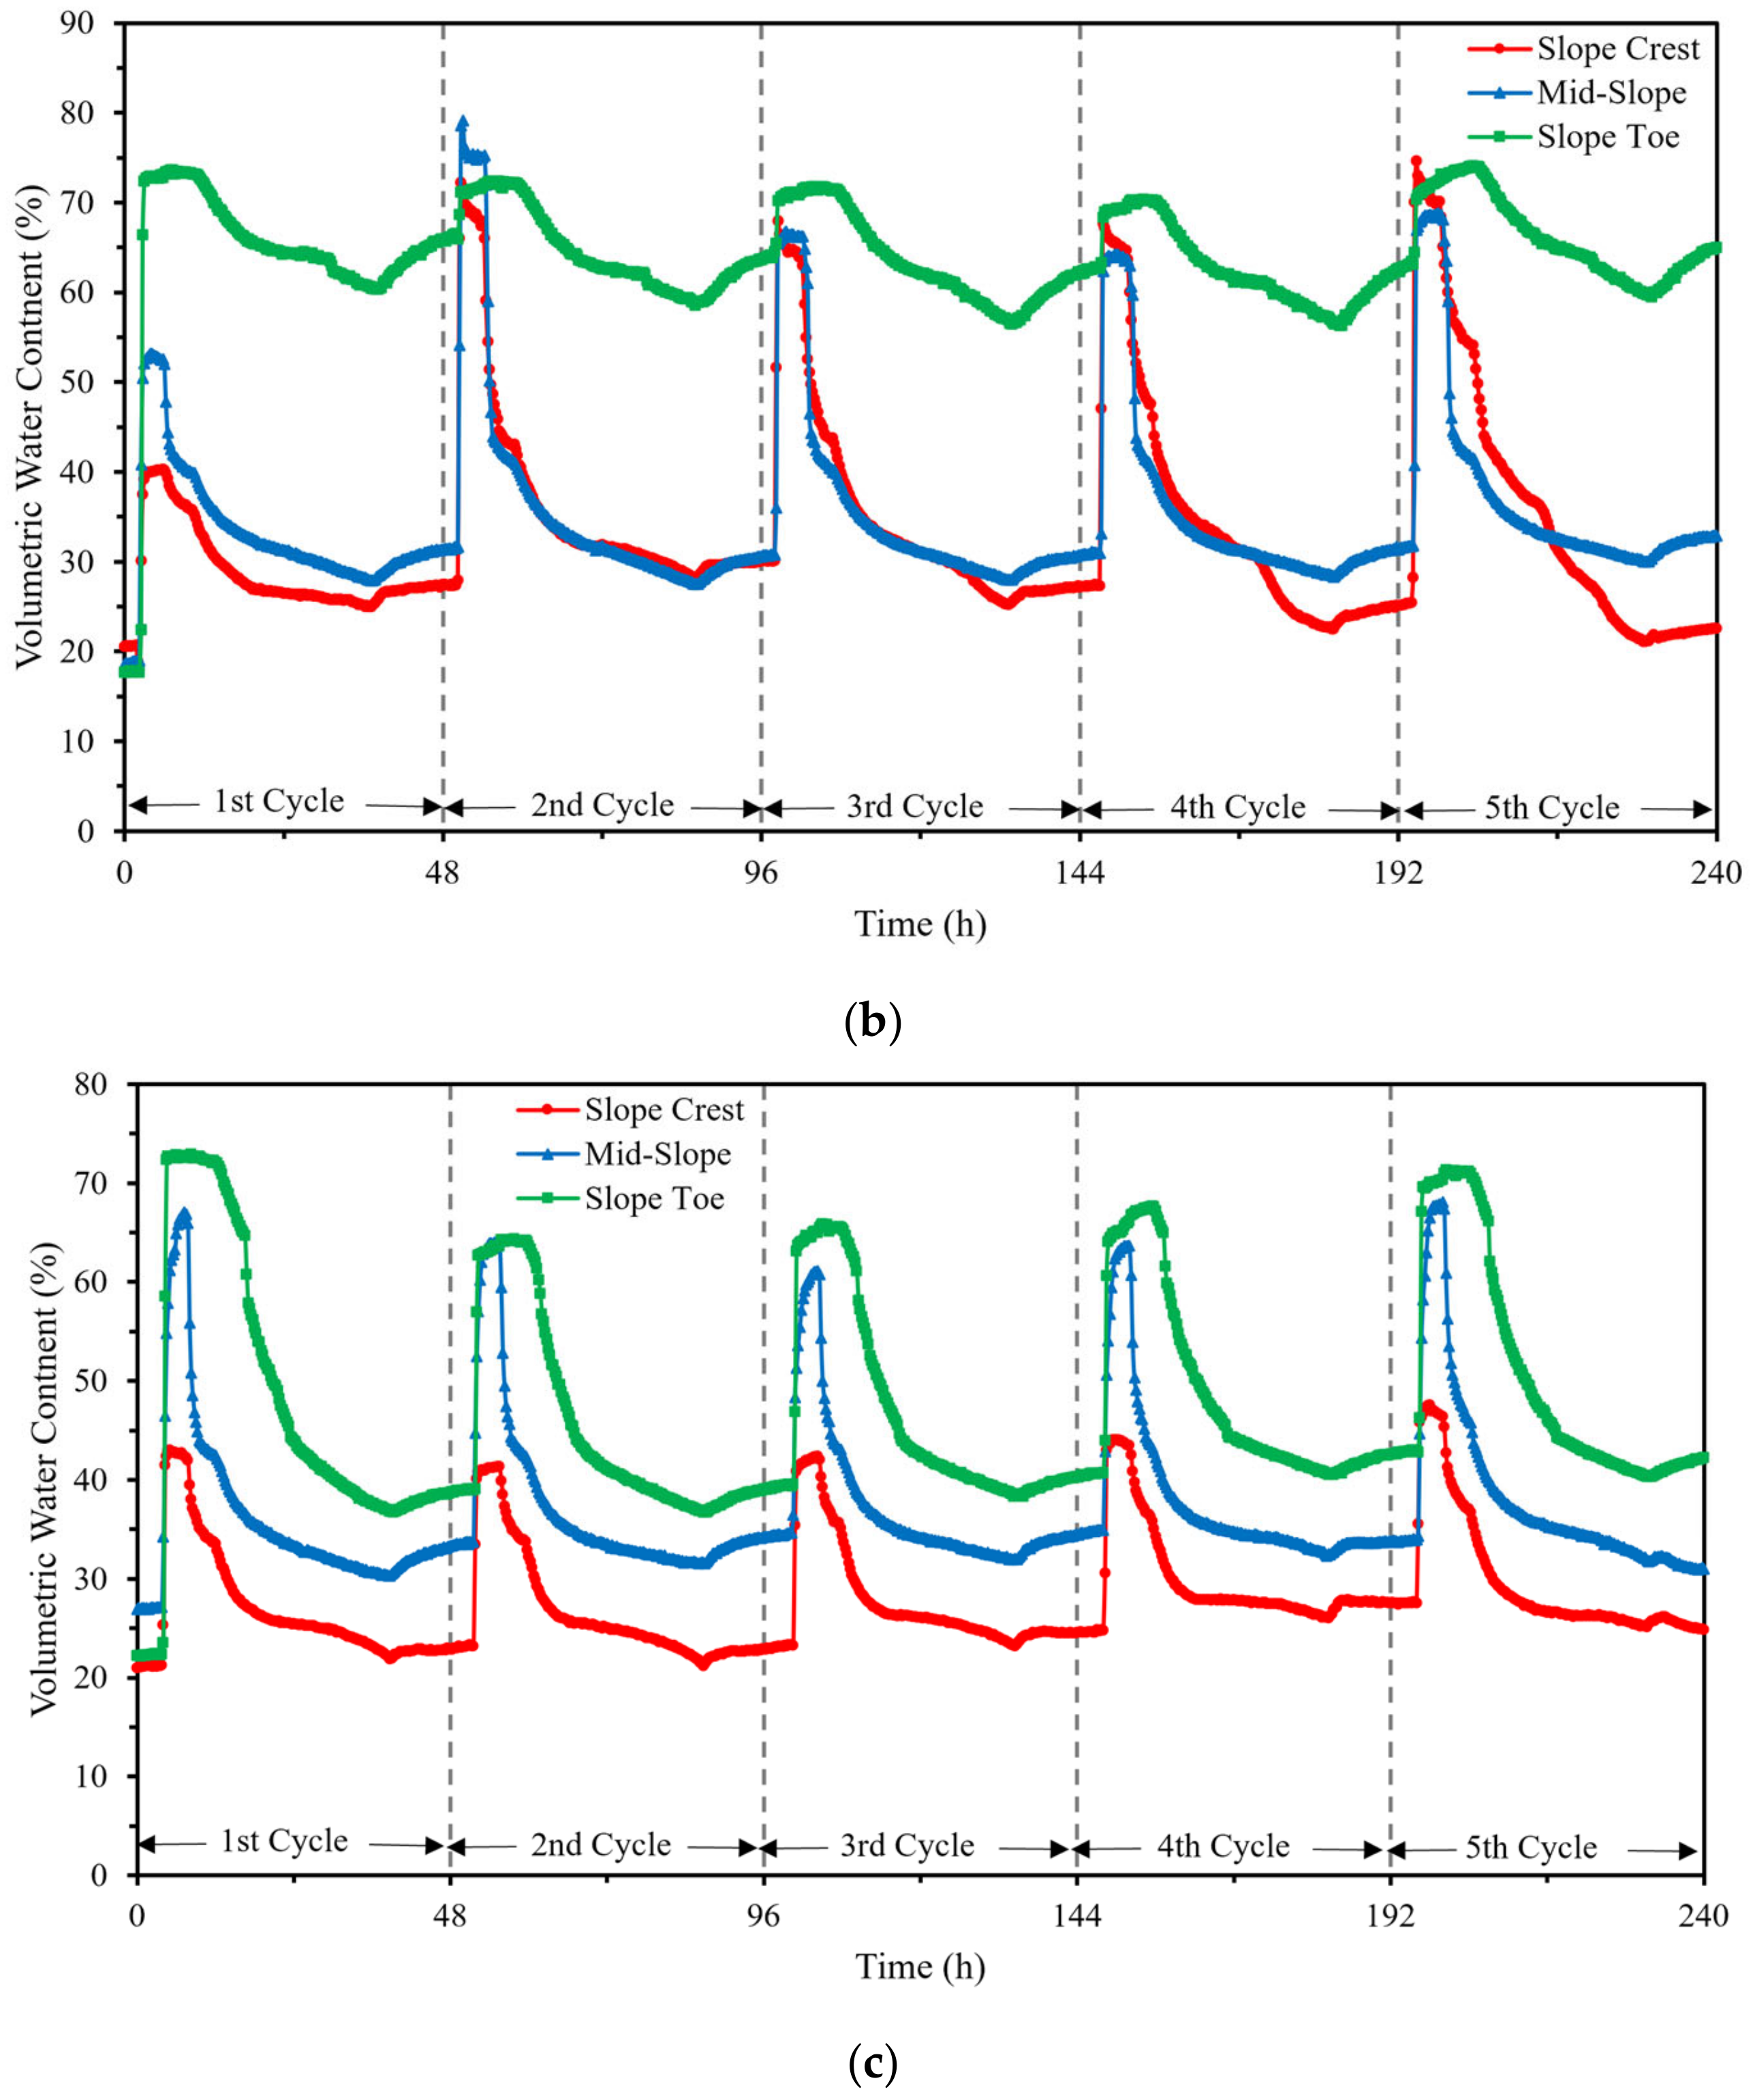
Figure 11 illustrates the variations in volumetric moisture content (VMC) for the three slope configurations. For all slopes, VMC exhibited a clear cyclic pattern associated with the imposed wetting–drying conditions, characterized by rapid increases during rainfall infiltration followed by gradual decreases during drying. This behavior reflects the transient redistribution of pore water within the unsaturated soil mass under alternating infiltration and evaporation processes.
For the bare slope, moisture redistribution exhibited pronounced depth-dependent behavior. The shallow monitoring points (P1 and P2) responded rapidly to rainfall and evaporation, showing moderate cyclic fluctuations. In contrast, the deepest monitoring point (P3) displayed a delayed but progressive increase in VMC, which eventually exceeded the moisture levels at the shallower locations and remained relatively elevated during subsequent cycles. This behavior indicates that infiltrated water gradually migrated downward through the soil profile under gravity and matric suction gradients, particularly along preferential flow paths created by shrinkage cracks. Because evaporation primarily affects near-surface layers, moisture accumulated progressively at greater depths, resulting in delayed wetting and stronger moisture hysteresis at P3. This concentration of moisture variation near the surface is consistent with the hydro-mechanical behavior of expansive soils, where suction loss and swelling deformation are typically most pronounced in the shallow active zone, contributing to the occurrence of shallow slope failures.
In the HPTRM-protected slope, moisture redistribution exhibited stronger hysteresis within the shallow soil layers. The three-dimensional structure of the HPTRM temporarily retained rainfall and reduced surface runoff velocity, promoting rapid wetting of the underlying shallow soil. Consequently, the shallow and mid-depth monitoring points experienced sharp increases in VMC at the onset of each wetting phase, followed by gradual reductions during drying. In contrast, the deepest monitoring point (P3) remained relatively stable throughout the testing period, indicating that rainfall infiltration was largely confined to the near-surface zone. Mechanistically, once runoff was initiated, lateral drainage along the mat structure limited downward water migration, thereby restricting moisture penetration into deeper soil layers.
The CFGS-protected slope exhibited the most uniform moisture distribution among the three configurations. Moisture fluctuations were smaller and more synchronized across monitoring depths, indicating that the composite system effectively regulated infiltration and internal moisture redistribution. The rigid frame reduces the exposed infiltration area and partitions the slope surface into discrete drainage cells, while the HPTRM within the frame openings moderates rainfall impact and promotes controlled infiltration. At the same time, the frame beams function as organized drainage pathways that remove excess water from the slope surface. As a result, abrupt moisture accumulation and irregular redistribution within the soil mass are suppressed, producing a more stable internal moisture regime. While the HPTRM-only configuration exhibited the largest moisture variability due to concentrated shallow wetting, the CFGS maintained relatively stable moisture conditions throughout the soil profile by combining infiltration regulation with organized drainage pathways.
Across all slope configurations, the response rate to wetting–drying cycles decreased with depth. The shallowest monitoring point (P1) exhibited the fastest moisture response because of its direct exposure to rainfall and evaporation. In contrast, deeper layers showed delayed and smoother moisture variations governed by unsaturated flow processes and hydraulic gradients. Overall, the smaller and more synchronized VMC fluctuations observed in the CFGS slope demonstrate the ability of the CFGS to regulate internal moisture conditions under cyclic climatic loading, thereby contributing to improved hydro-mechanical stability of expansive soil slopes.
3.4. Pore-Water Pressure
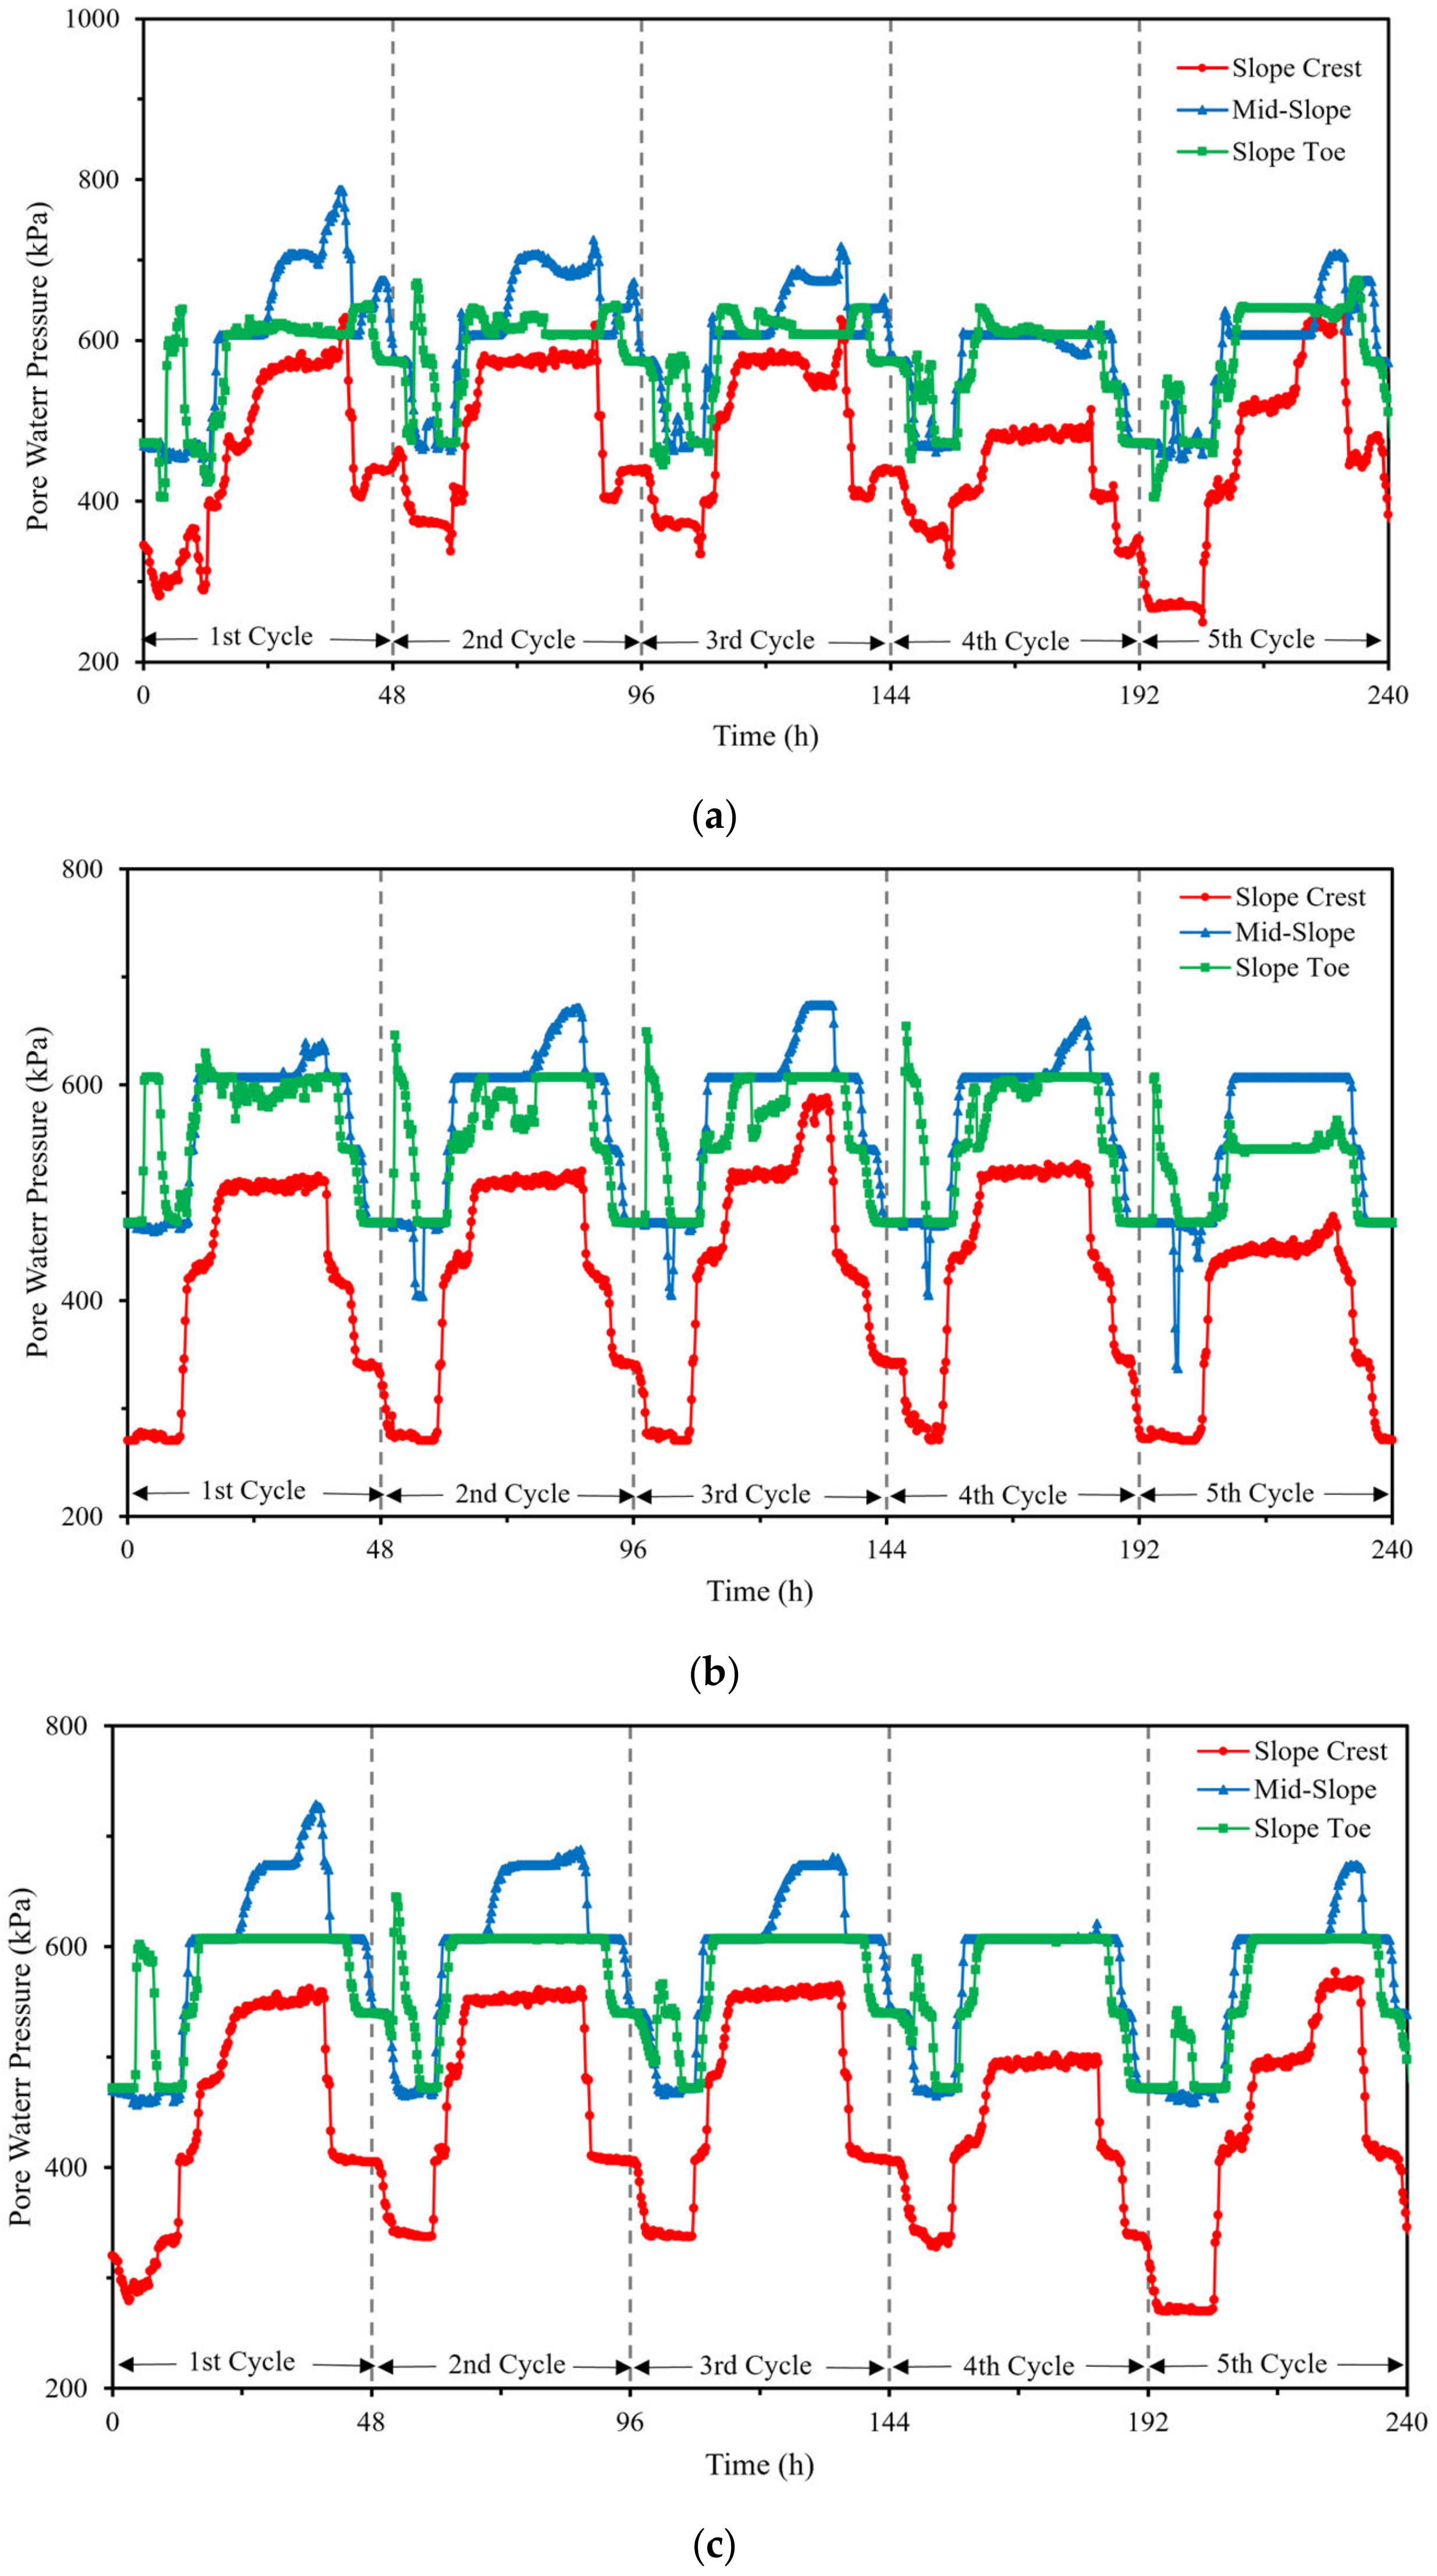
Pore-water pressure was monitored at the same locations as volumetric moisture content, and the results are presented in
Figure 12. Because expansive soils are typically unsaturated, the recorded pore-water pressure values represent variations in matric suction rather than positive pore pressure. During rainfall infiltration, incoming water reduces matric suction, causing pore-water pressure to increase toward zero. Conversely, during drying, evaporation removes pore water and increases matric suction, thereby reducing pore-water pressure. Consequently, pore-water pressure exhibited cyclic variations corresponding to the imposed wetting–drying conditions.
The bare slope exhibited the largest pore-water pressure fluctuations at all monitoring depths, indicating a strong hydraulic response to rainfall infiltration and subsequent evaporation. The shallowest monitoring point (P1) recorded the largest variation, reaching a maximum fluctuation magnitude of 390 kPa. Because this location is closest to the slope surface, it is directly influenced by rapid infiltration during rainfall and intense evaporation during drying. In the absence of surface protection, the bare slope allows unrestricted moisture exchange with the atmosphere, resulting in rapid suction reduction during wetting and pronounced suction recovery during drying. These processes generate significant pore-water pressure fluctuations within the near-surface soil layer.
The HPTRM-protected slope exhibited moderate pore-water pressure variations compared with the bare slope. The HPTRM layer modifies the near-surface hydraulic boundary condition by attenuating raindrop impact and temporarily retaining water within its three-dimensional structure. This mechanism moderates infiltration rates and partially buffers moisture exchange between the soil and the atmosphere, thereby reducing the amplitude of suction fluctuations relative to the bare slope.
The CFGS-protected slope consistently exhibited the smallest pore-water pressure variations among the three configurations. The lowest fluctuation magnitude was recorded at monitoring point P3, where the variation was reduced to 173 kPa. This behavior reflects the hydrological regulation provided by the composite system. The rigid frame reduces the exposed infiltration area and partitions the slope surface into discrete drainage cells, while the HPTRM within the frame openings moderates rainfall impact and promotes controlled infiltration. At the same time, the frame beams act as organized drainage pathways that facilitate the removal of excess water from the slope surface. These combined mechanisms limit abrupt moisture variations within the soil mass and stabilize matric suction, resulting in more uniform pore-water pressure responses.
For all slope configurations, the magnitude of pore-water pressure variation decreased with depth, reflecting the attenuation of atmospheric and rainfall effects with increasing soil cover. Deeper soil layers experience slower moisture redistribution governed by unsaturated flow processes, resulting in smoother and delayed pore pressure responses. Statistical analysis further highlights the stabilizing effect of the protection systems. To ensure representative coverage of the entire slope domain, pore-water pressure monitoring was conducted at the slope crest, mid-slope, and slope toe locations. These monitoring points corresponded to shallow (near-surface), intermediate-depth, and deeper monitoring profiles within the slope. The reported average pore-water pressure values were therefore obtained by averaging the measurements recorded at these three monitoring locations for each of the three slope schemes.
The mean suction fluctuation range decreased from 340.83 kPa in the bare slope to 279.00 kPa in the HPTRM-protected slope and 250.67 kPa in the CFGS-protected slope, corresponding to average reductions of approximately 18% and 26%, respectively. The attenuation of suction variation was particularly pronounced at greater depth; at monitoring point P3, the fluctuation range under CFGS protection decreased by approximately 36% relative to the bare slope.
A direct comparison of the pore-water pressure responses at corresponding monitoring depths indicates that the CFGS-protected slope exhibits the most stable and regular suction behavior. This stabilization of matric suction is particularly important for expansive soils because suction variations govern swelling–shrinkage deformation and influence shear strength. The results therefore demonstrate that the CFGS effectively regulates internal hydraulic conditions within the slope, thereby enhancing hydro-mechanical stability under cyclic wetting–drying loading.
3.5. Swelling–Shrinkage Deformation
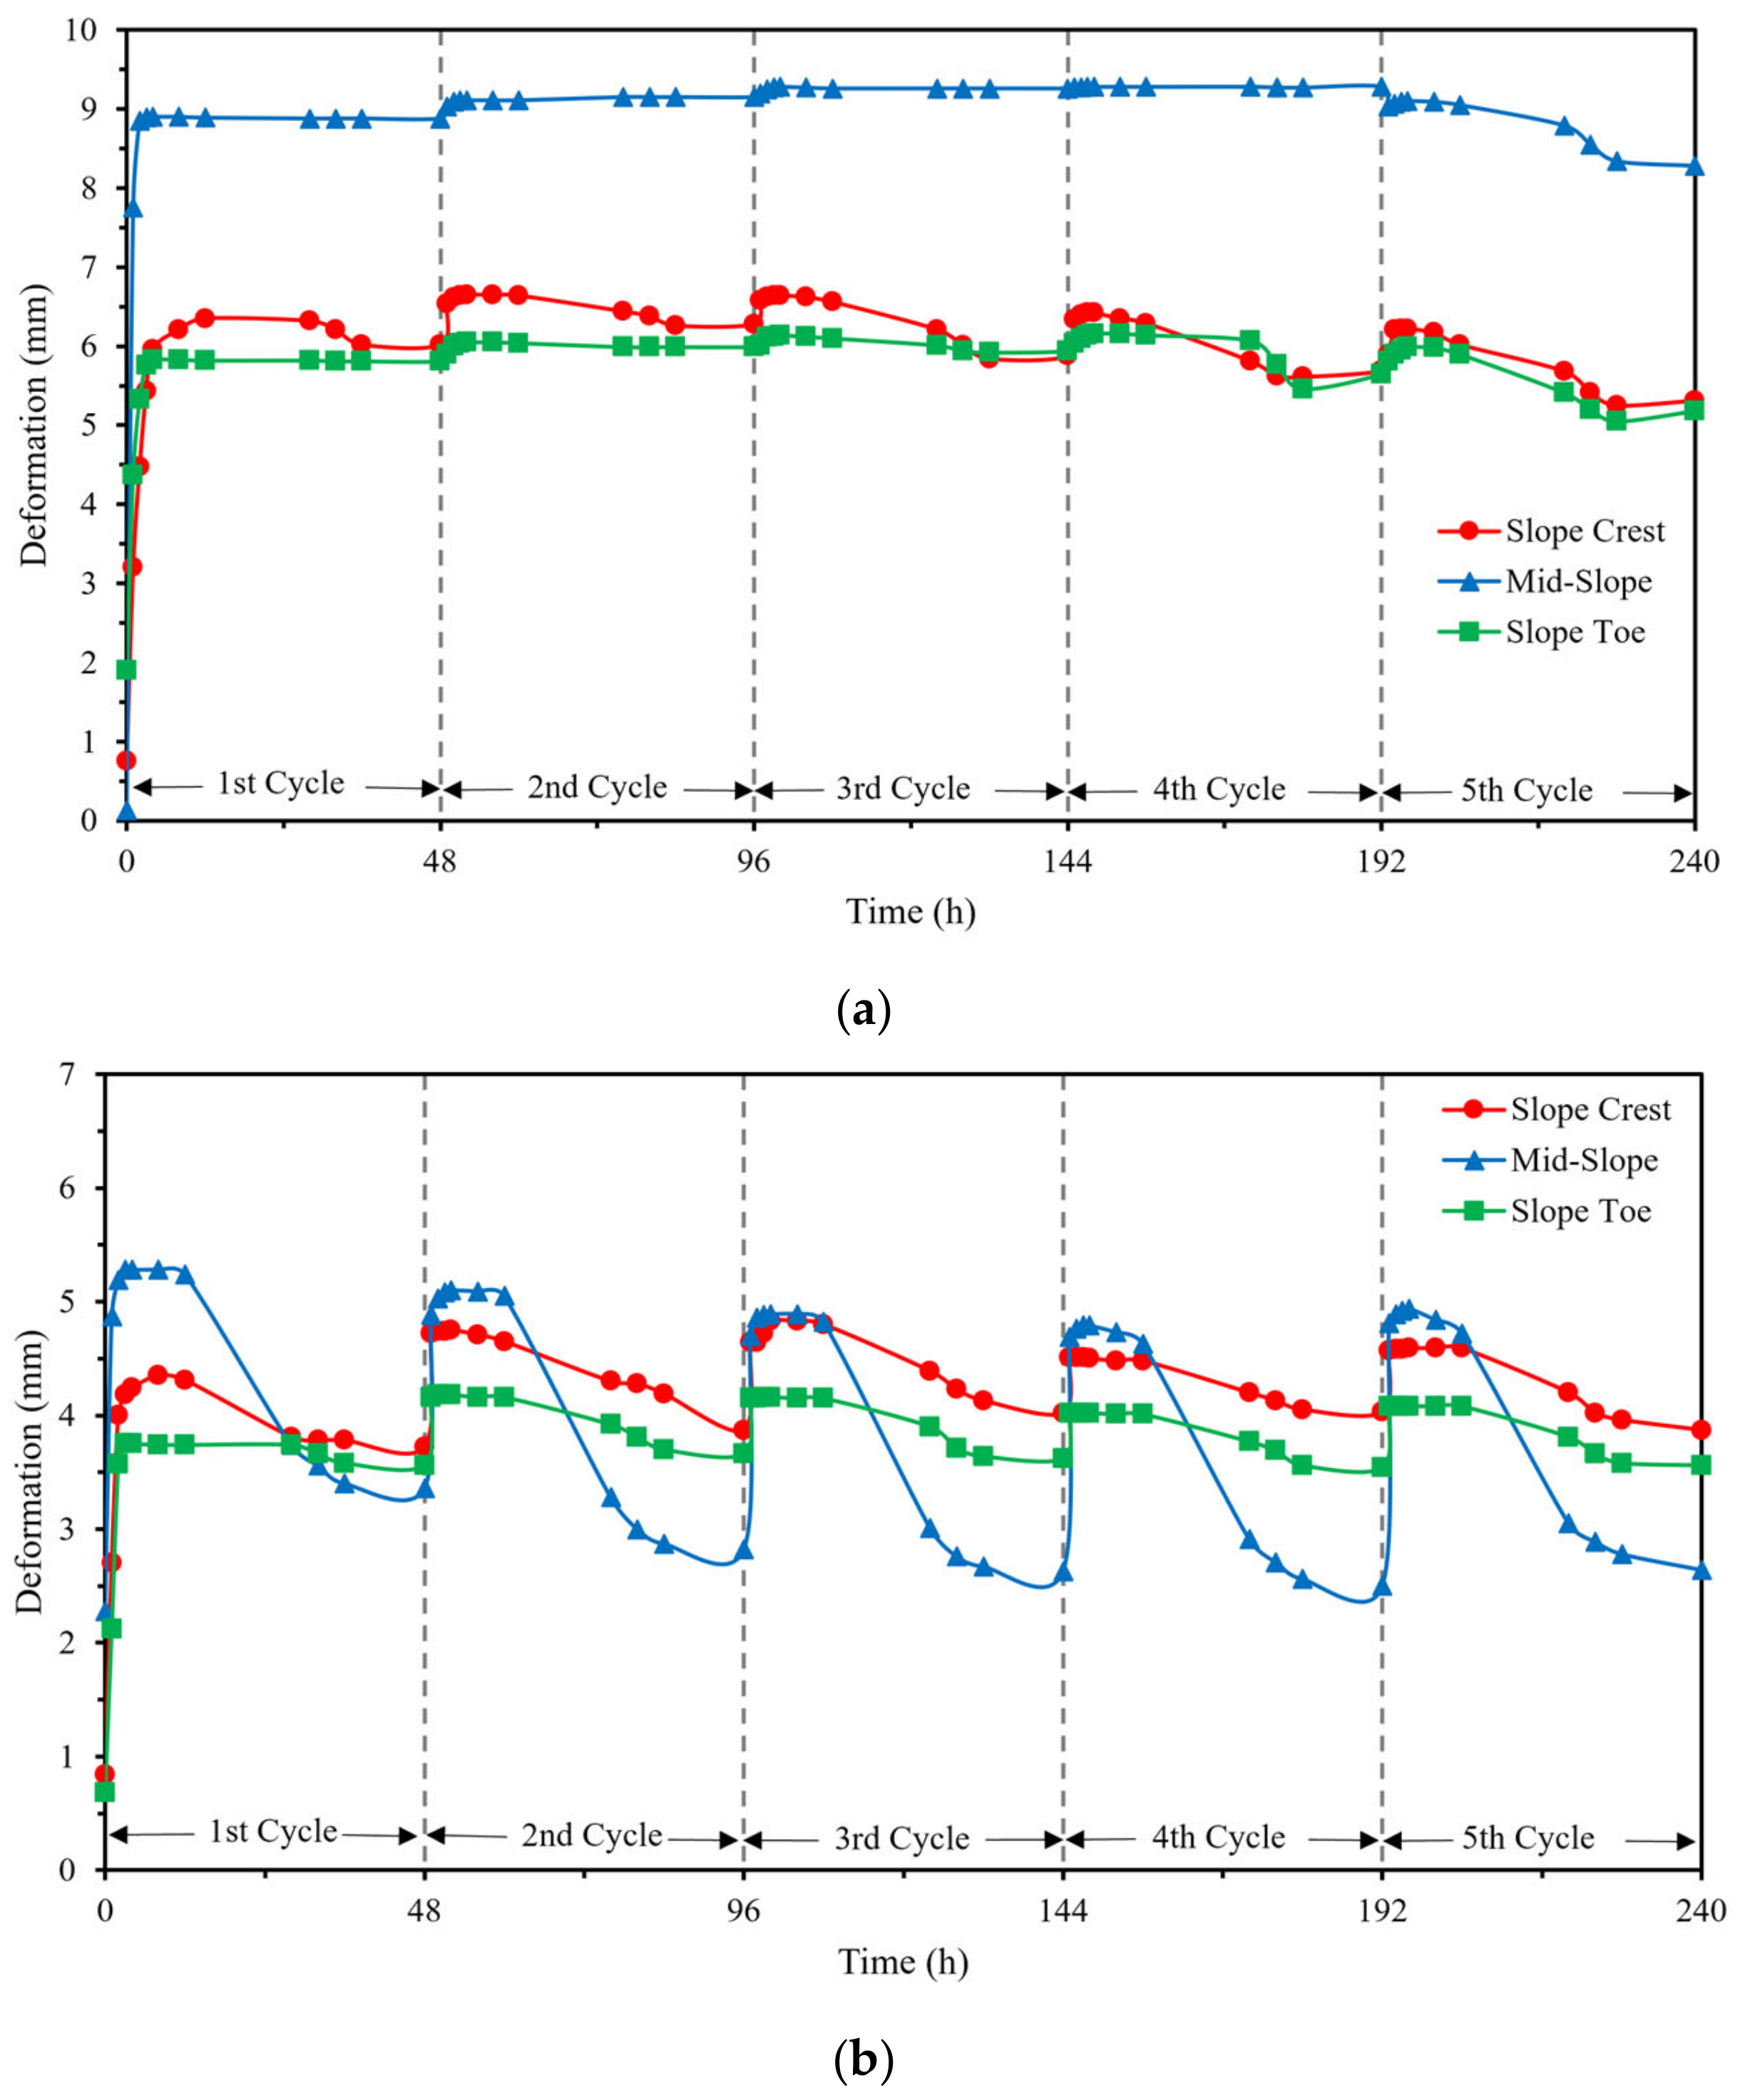
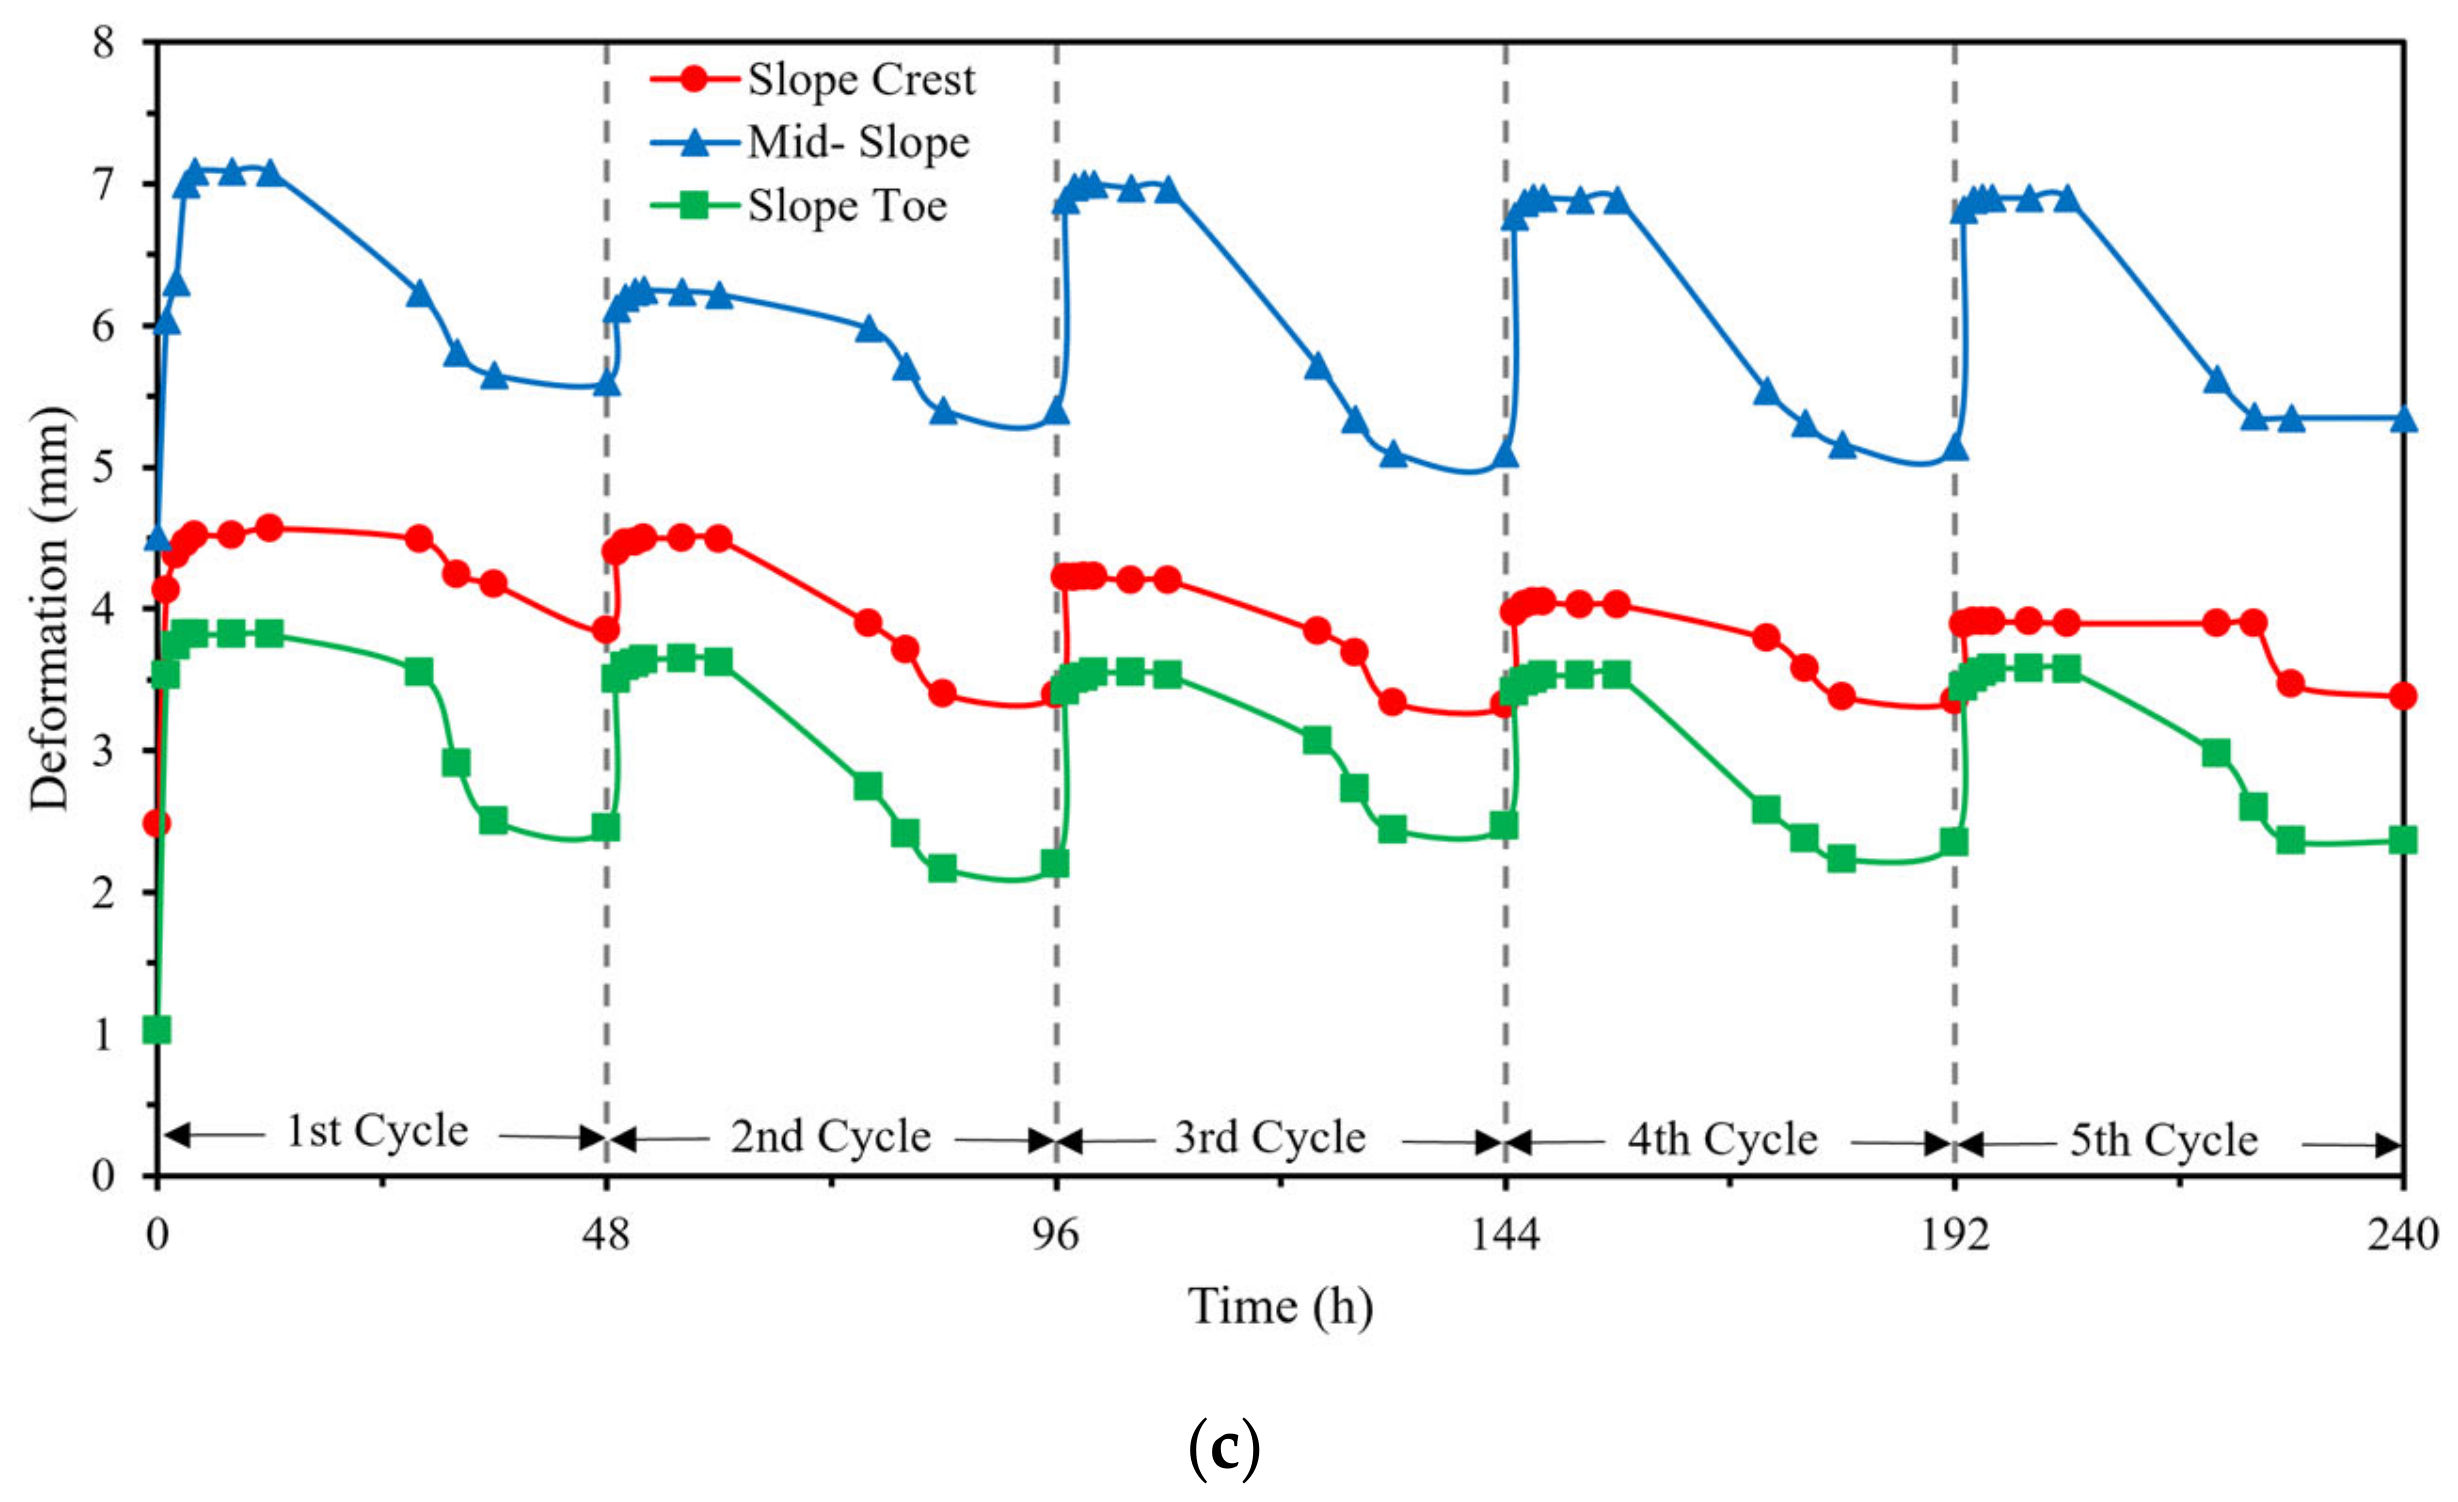
Swelling–shrinkage deformation results of the slope configurations during the wetting–drying cycles are presented in
Figure 13. All slopes exhibited a cyclic deformation pattern characterized by upward displacement during wetting (swelling) and downward displacement during drying (shrinkage). This behavior reflects the suction-dependent hydro-mechanical response of expansive soils, where rainfall infiltration reduces matric suction and induces swelling, while evaporation restores suction and produces shrinkage.
The largest deformation across all slopes occurred during the first wetting cycle. At this stage, the soil was initially relatively dry and possessed high matric suction; therefore, the rapid suction reduction during the first infiltration event produced the greatest volumetric expansion. In subsequent cycles, deformation amplitudes gradually stabilized as the soil structure adjusted to repeated wetting–drying processes.
The bare slope exhibited the largest and most irregular deformation response. Because the slope surface was unprotected, swelling–shrinkage deformation occurred freely, leading to progressive development of shrinkage cracks and localized soil displacement. These processes altered the surface morphology of the slope and prevented the soil from fully recovering its initial configuration after each cycle. Consequently, deformation became increasingly spatially irregular as soil mass redistributed and preferential deformation zones developed.
The HPTRM-protected slope exhibited reduced deformation amplitudes compared with the bare slope, although noticeable spatial differences remained. At monitoring points D1 (slope crest) and D3 (slope toe), deformation remained relatively moderate and consistent. In contrast, the mid-slope location D2 experienced larger displacement amplitudes. This behavior reflects the mechanical restraint provided by the HPTRM anchorage system. Near the crest and toe, the mat is closer to anchorage points that provide greater confinement and restrict soil movement. The mid-slope region lies farther from these anchorage locations and therefore experiences lower structural restraint, allowing swelling pressures generated within the expansive soil to dissipate primarily through deformation in this zone.
In contrast, the CFGS-protected slope exhibited the smallest and most uniform deformation across all monitoring points. Although the mid-slope location again experienced the largest displacement—consistent with the typical deformation pattern of expansive soil slopes, where moisture variation and stress redistribution are most pronounced—the overall deformation magnitude was significantly reduced. This behavior indicates that the CFGS provides both structural confinement and deformation accommodation. The rigid frame restricts excessive lateral soil movement and redistributes swelling stresses across the slope surface, while the HPTRM within the frame openings allows limited compatible deformation. This combination constrains large-scale displacement while preventing the accumulation of excessive swelling stresses.
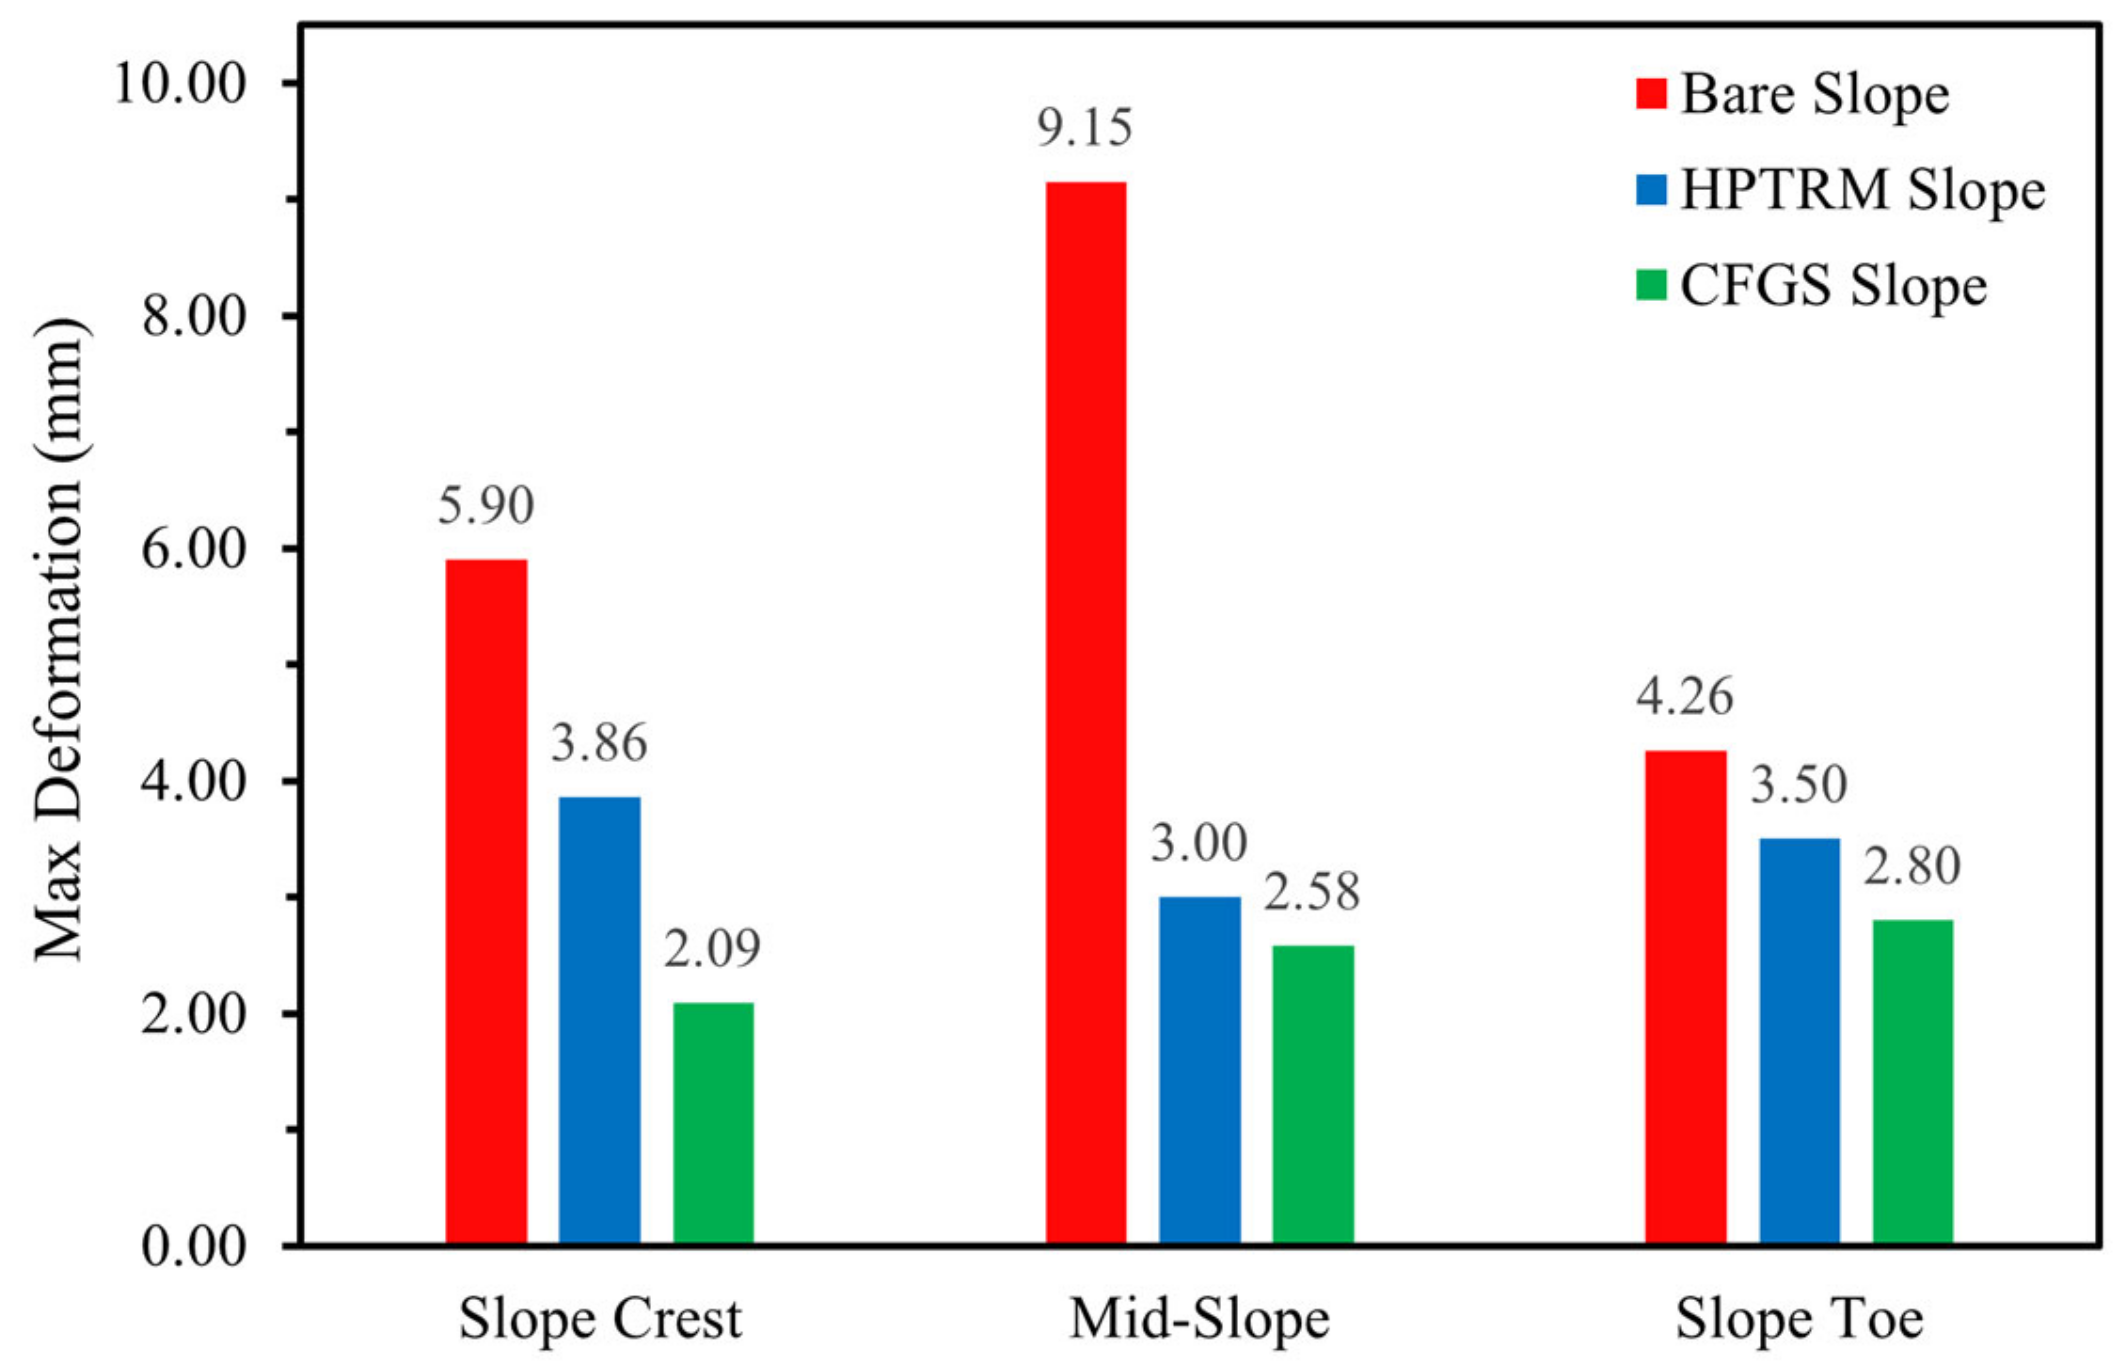
The mean deformation range decreased from 6.44 mm in the bare slope to 3.50 mm in the HPTRM-protected slope and 2.49 mm in the CFGS-protected slope, corresponding to average deformation reductions of approximately 46% and 61%, respectively. At individual monitoring points, the maximum deformation of the HPTRM- and CFGS-protected slopes corresponded to 65.42% and 35.42% of that of the bare slope at D1, 32.79% and 28.20% at D2, and 82.16% and 65.73% at D3, as shown in
Figure 14. These results confirm that the CFGS provides the most effective control of swelling–shrinkage deformation among the tested configurations.
Overall, the significantly reduced and more uniform deformation observed in slope C demonstrates that the CFGS effectively regulates swelling–shrinkage behavior by stabilizing internal moisture conditions and providing structural confinement. This combined hydro-mechanical regulation improves the deformation resistance and serviceability of expansive soil slopes subjected to cyclic wetting–drying loading.
4. Validation of CFGS by Numerical Simulation
4.1. Numerical Model Setup
To further elucidate and validate the hydro-mechanical behavior of expansive soil slopes protected by the composite frame–geosynthetic system (CFGS), a coupled numerical modelling framework is established in COMSOL Multiphysics. Building upon the experimental findings presented in
Section 2, the numerical model integrates unsaturated seepage governed by the Richards equation with solid mechanics under a poroelastic formulation to simulate rainfall infiltration, evaporation, matric suction evolution, and stress redistribution within the slope system. The model explicitly represents the concrete frame, the HPTRM layer, and the expansive soil mass, enabling quantitative assessment of swelling–shrinkage deformation and slope degradation patterns under cyclic wetting–drying conditions.
A full-scale numerical model is set up. In accordance with commonly adopted numerical modelling guidelines, model boundaries are positioned sufficiently far from the slope to minimize boundary effects on the simulation results. Specifically, the vertical distance below the slope toe is taken as at least 2.5 times the slope height, while the horizontal distances extending from the slope toe and slope crest are also set to at least 2.5 times the slope’s base length. Based on these requirements, a computational domain with a length of 81 m, a height of 27 m, and a section width of 10 m is established. The model further assumes a uniform soil stratigraphy consisting entirely of expansive soil.
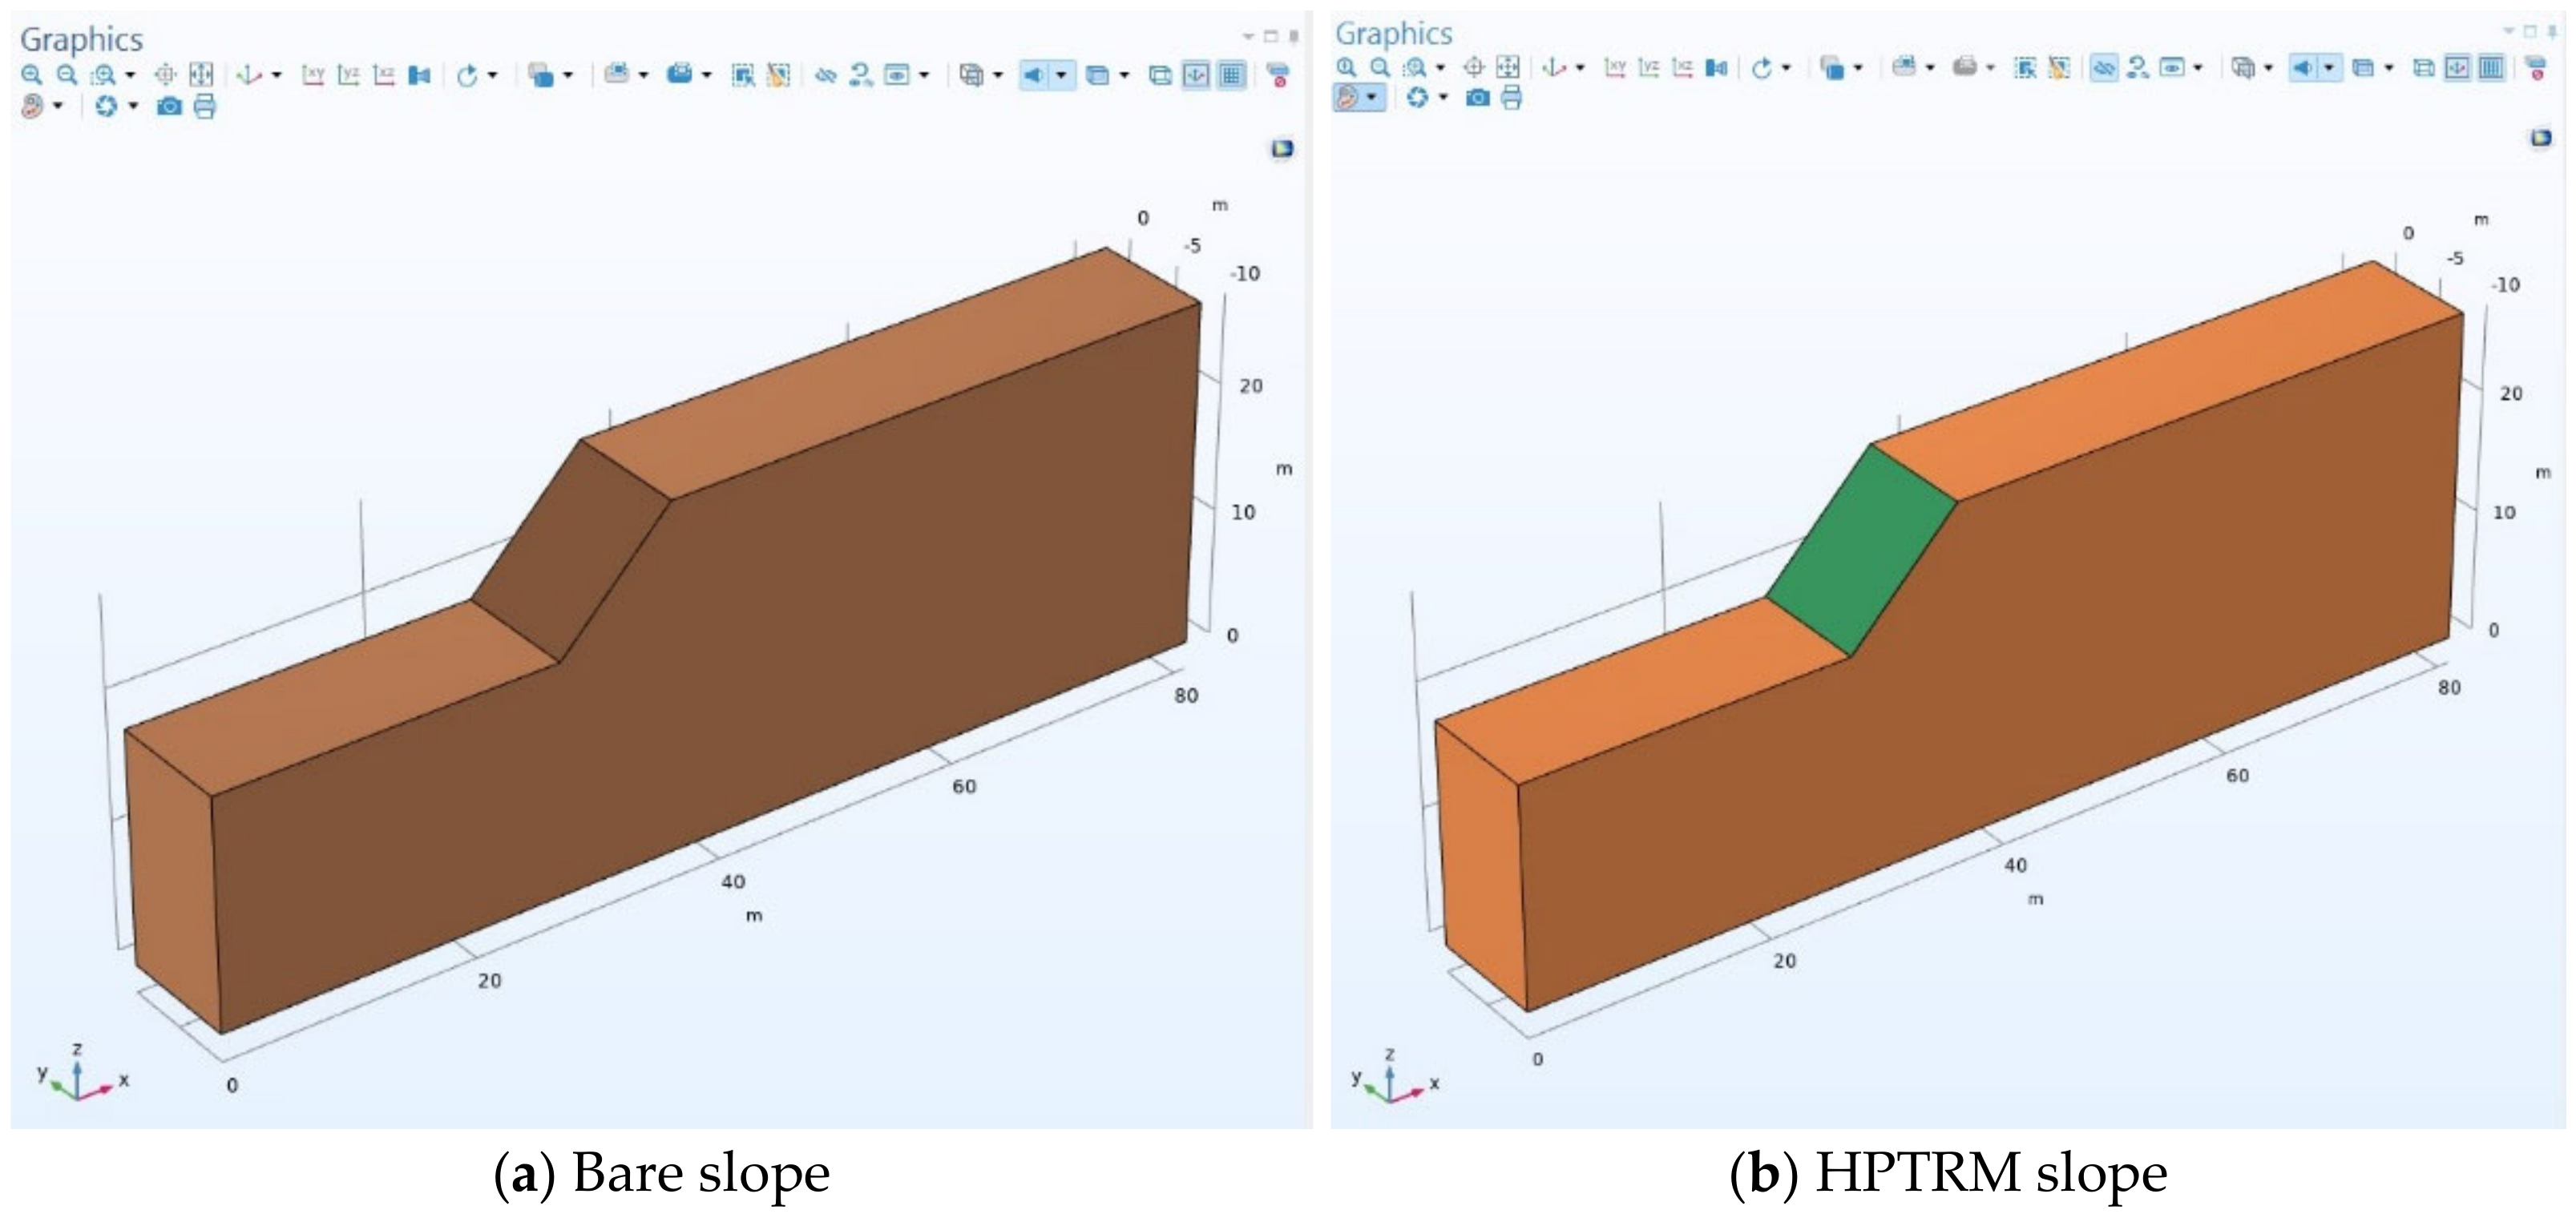
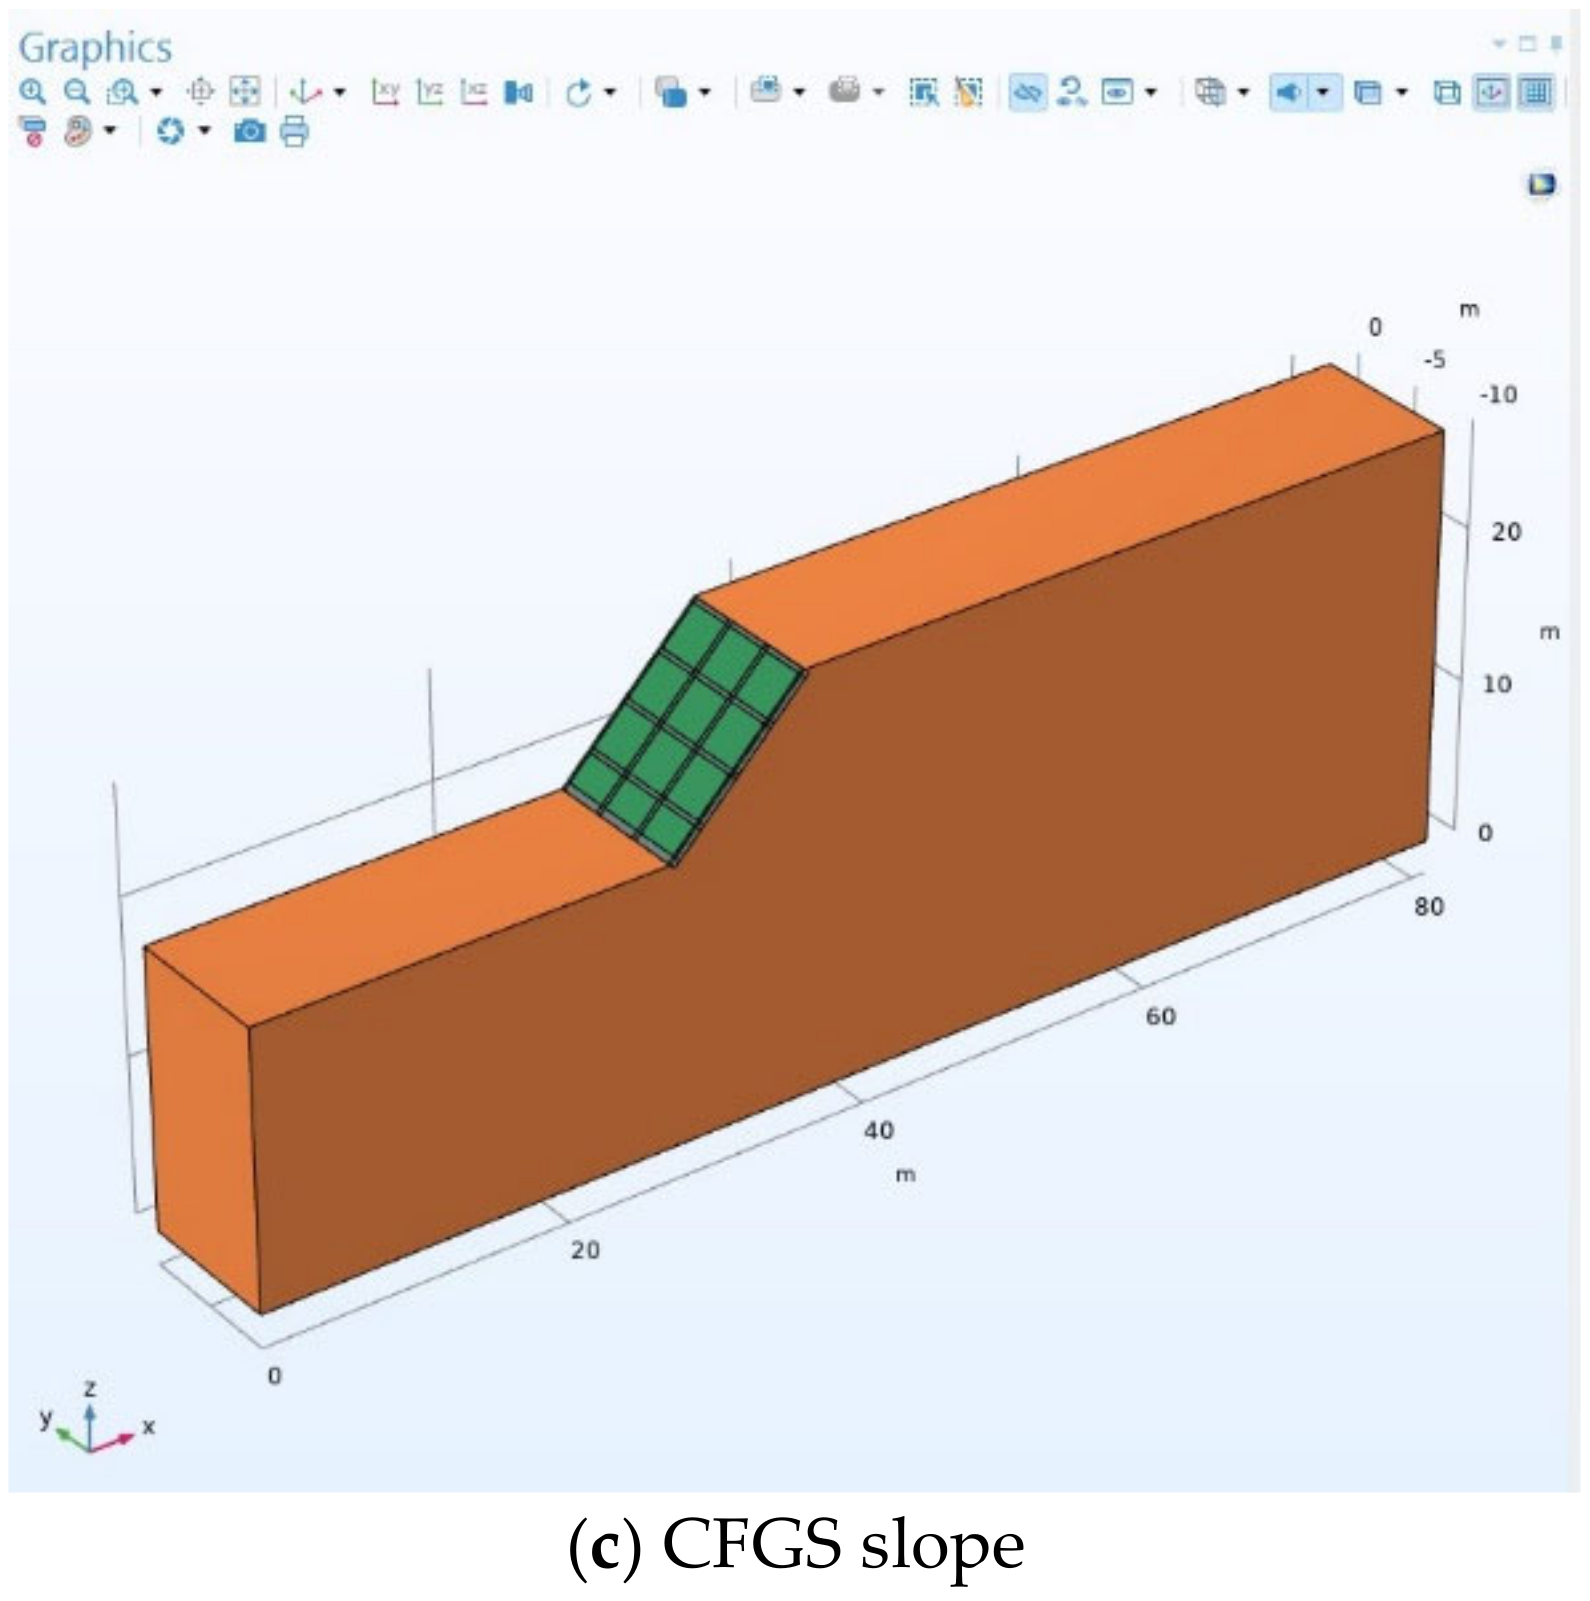
For comparative analysis, three numerical models are developed: a bare slope, a slope protected solely by an HPTRM, and a slope protected by the CFGS. The HPTRM is represented as a thin high-density polyethylene (HDPE) layer with a thickness of 16 mm. The frame structure is modelled as a solid concrete grid composed of identical vertical and lateral beams. Each beam has a width of 300 mm and a depth of 400 mm, and the beams are spaced at 3 m intervals, forming square frame openings of 3 × 3 m within which the HPTRM is installed to constitute the CFGS protection system. To reinforce the CFGS protection, the lower frame windows at the slope toe are set at 3 × 2 m. The monitoring scheme is consistent with that of the physical model tests, with deformation being monitored on the slope surface at points D1–D3 (
Figure 5b). The three model setups are shown in
Figure 15.
4.2. Numerical Model Configuration and Simulation
First, the parameters that govern and influence the overall behavior of the model are defined under global definitions. These global parameters include intrinsic expansive soil properties, particularly the Van Genuchten parameters describing the soil–water characteristic curve and hydraulic behavior, as well as parameters associated with the imposed wetting–drying cycles, such as rainfall infiltration intensity, evaporation intensity, and the corresponding phase durations. In addition, several fundamental physical constants required for the coupled hydro-mechanical analysis—such as the density of water and gravitational acceleration—are also specified at the global level.
The wetting–drying cycles implemented in the numerical simulations follow a 10-day cycle, consisting of 4 days of rainfall infiltration followed by 6 days of evaporation. This temporal distribution reflects the general climatic characteristics of the Nanning region, where rainfall events occur approximately 40% of the time. In comparison, the remaining 60% corresponds to periods of ambient drying and solar-driven evaporation. This duration was selected to represent longer field-scale hydro-mechanical evolution and to allow sufficient development of pore-pressure, suction, and deformation responses in the full-scale slope. Compared with the physical model tests, a longer wetting–drying cycle was adopted in the numerical simulations to ensure numerical stability and convergence during the coupled hydro-mechanical calculations. A total of six wetting–drying cycles were simulated, corresponding to a cumulative simulation period of 60 days. The selection of six wetting–drying cycles in the numerical simulation was intended to reproduce the progressive hydro-mechanical response of expansive soil slopes under repeated climatic loading while allowing sufficient simulation time for the coupled hydraulic and deformation fields to stabilize numerically. A slightly larger number of cycles than those used in the physical model tests was adopted to better capture the long-term evolution of pore-water pressure redistribution and deformation accumulation within the continuum-based numerical framework. This also helped minimize the influence of short-term numerical fluctuations associated with the initial cycles and provided a clearer evaluation of the sustained protective performance of the different slope configurations under prolonged cyclic loading.
Two coupled physics interfaces were employed in the COMSOL model to simulate the hydro-mechanical behavior of the expansive soil slope under cyclic wetting–drying conditions. The Richards equation interface was used to represent transient unsaturated seepage within the slope, enabling simulation of rainfall infiltration, evaporation, pore-water pressure evolution, and matric suction redistribution within the soil mass. The hydraulic behavior of the expansive soil was governed by the Van Genuchten soil–water characteristic curve, which defines the relationship between matric suction, moisture content, and effective saturation. The solid mechanics interface was applied to simulate the stress–strain response and deformation of the slope subjected to self-weight and suction-induced stress variations. Within the Richards equation interface, the fluid phase was defined as water at room temperature, while the porous medium corresponded to the entire expansive soil domain. The initial condition was specified as a uniform pressure head of −2 m, representing an initially unsaturated state with relatively high matric suction. Gravitational acceleration was incorporated as a constant body force to account for vertical hydraulic gradients within the slope. Impermeable no-flow boundary conditions were imposed on all boundaries except the slope surface, where a time-dependent prescribed mass flux was applied to represent rainfall infiltration and evaporation during the wetting–drying cycles. In the solid mechanics interface, appropriate mechanical boundary conditions were defined to represent realistic constraints on the slope domain. Roller supports were assigned to the front and back faces of the model, allowing vertical displacement while restricting horizontal movement. The slope surface was defined as a free boundary to permit deformation and outward expansion associated with swelling and soil movement. All remaining boundaries were specified as fixed constraints, preventing displacement in both horizontal and vertical directions to represent confinement by the surrounding ground. These boundary conditions ensure that the numerical model captures the essential deformation characteristics of the slope while maintaining computational stability during the coupled hydro-mechanical analysis.
Rainfall and evaporation were implemented as time-dependent surface flux boundary conditions applied along the slope surface to reproduce cyclic atmospheric loading. During the rainfall phase, a downward water flux of 2 × 10⁻⁷ m/s was imposed to simulate rainfall infiltration, whereas during the drying phase, a negative flux of 4 × 10⁻⁸ m/s was applied to represent evaporation. These fluxes correspond approximately to rainfall and evaporation rates of about 17 mm/day and 3.5 mm/day, respectively, which fall within the typical range of hydrological conditions observed in subtropical monsoon climates.
Coupling between the hydraulic and mechanical fields was achieved through pore-pressure transfer, whereby the pore-water pressure calculated from the Richards equation directly influences the effective stress within the soil domain. This coupling enables the model to reproduce the key hydro-mechanical processes governing expansive soil slope behavior, including moisture-induced softening, swelling–shrinkage deformation, and progressive changes in slope stability during repeated wetting–drying cycles.
For all three slope configurations, physics-controlled meshing was employed to ensure consistency with the governing equations and the overall numerical framework of the model. This meshing approach automatically adjusts element sizes according to the requirements of the coupled Richards equation and solid mechanics interfaces, thereby improving numerical accuracy and stability during the hydro-mechanical analysis. By allowing the mesh density to adapt to gradients in hydraulic and mechanical variables, the physics-controlled mesh ensures that key processes such as pore-pressure redistribution, suction variation, and stress concentration are adequately resolved. A time-dependent, physics-controlled study was then conducted to simulate the transient hydro-mechanical behavior of the slope under cyclic climatic loading. An implicit BDF time-stepping scheme with adaptive (free) time stepping was adopted in the transient simulations to improve numerical stability during wetting–drying transitions. Nonlinear iterative convergence was controlled using scaled tolerance criteria within the segregated time-dependent solver.
4.3. Swelling–Shrinkage Deformation Results Analysis
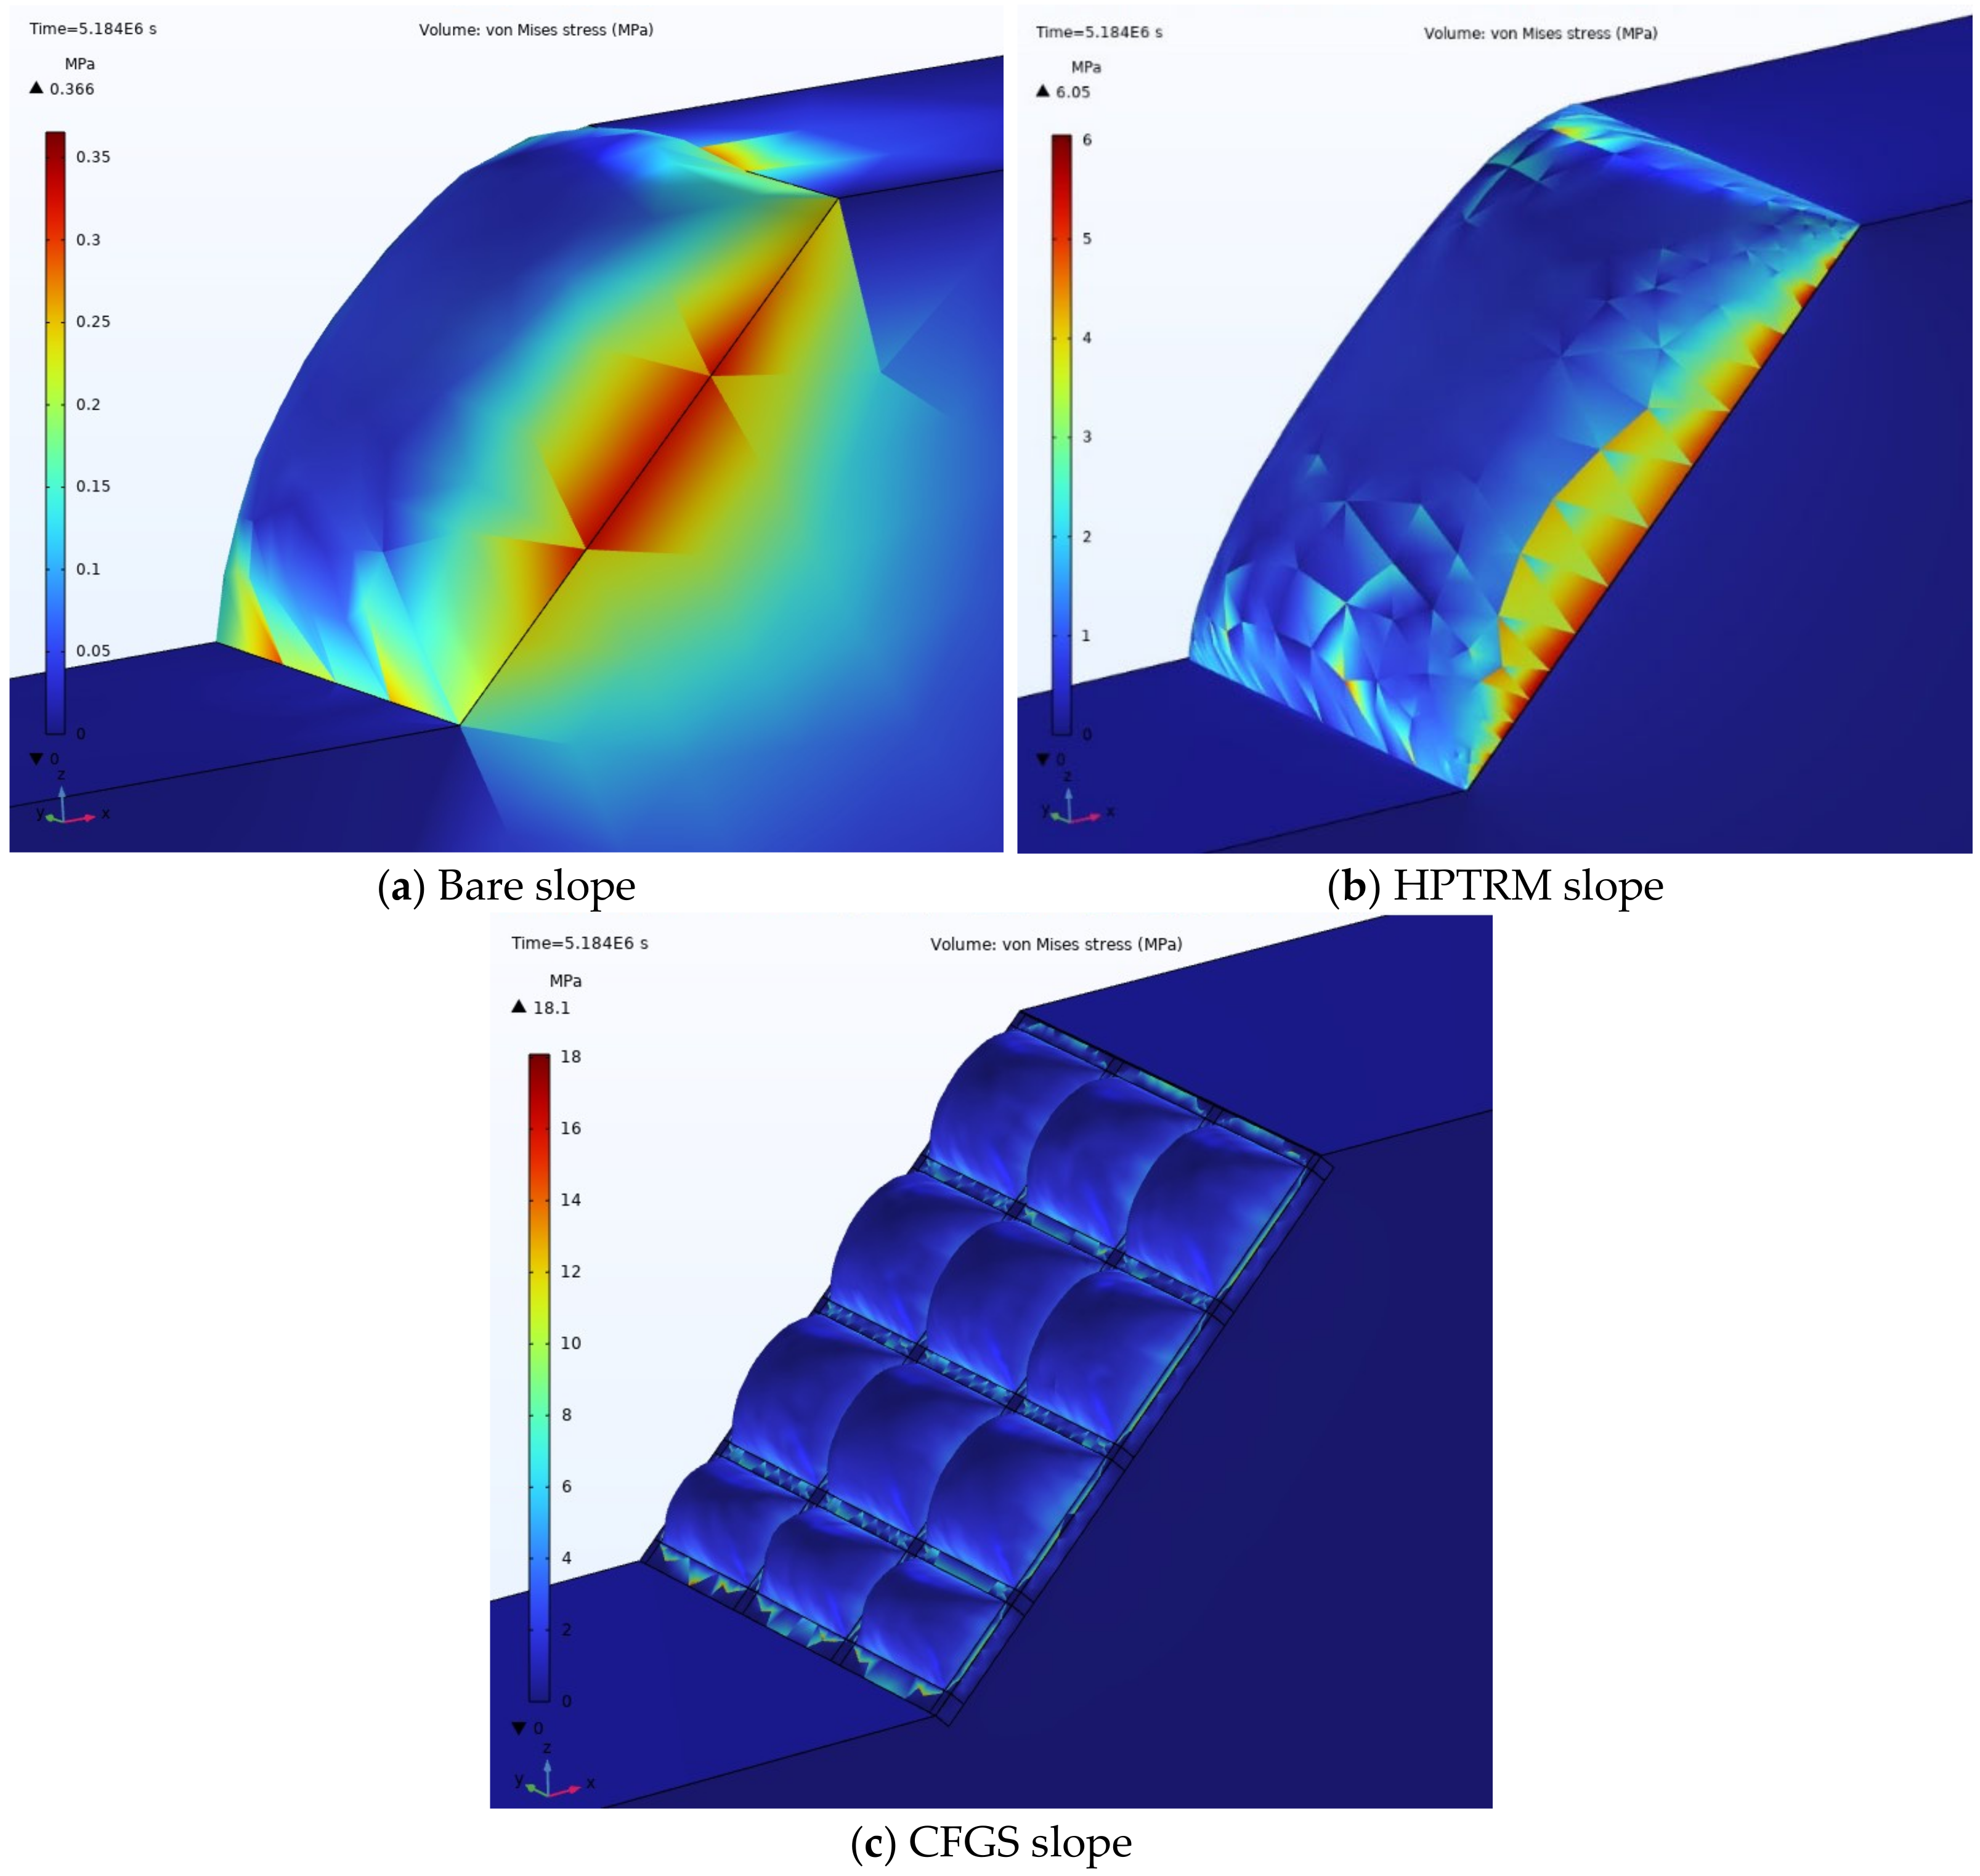
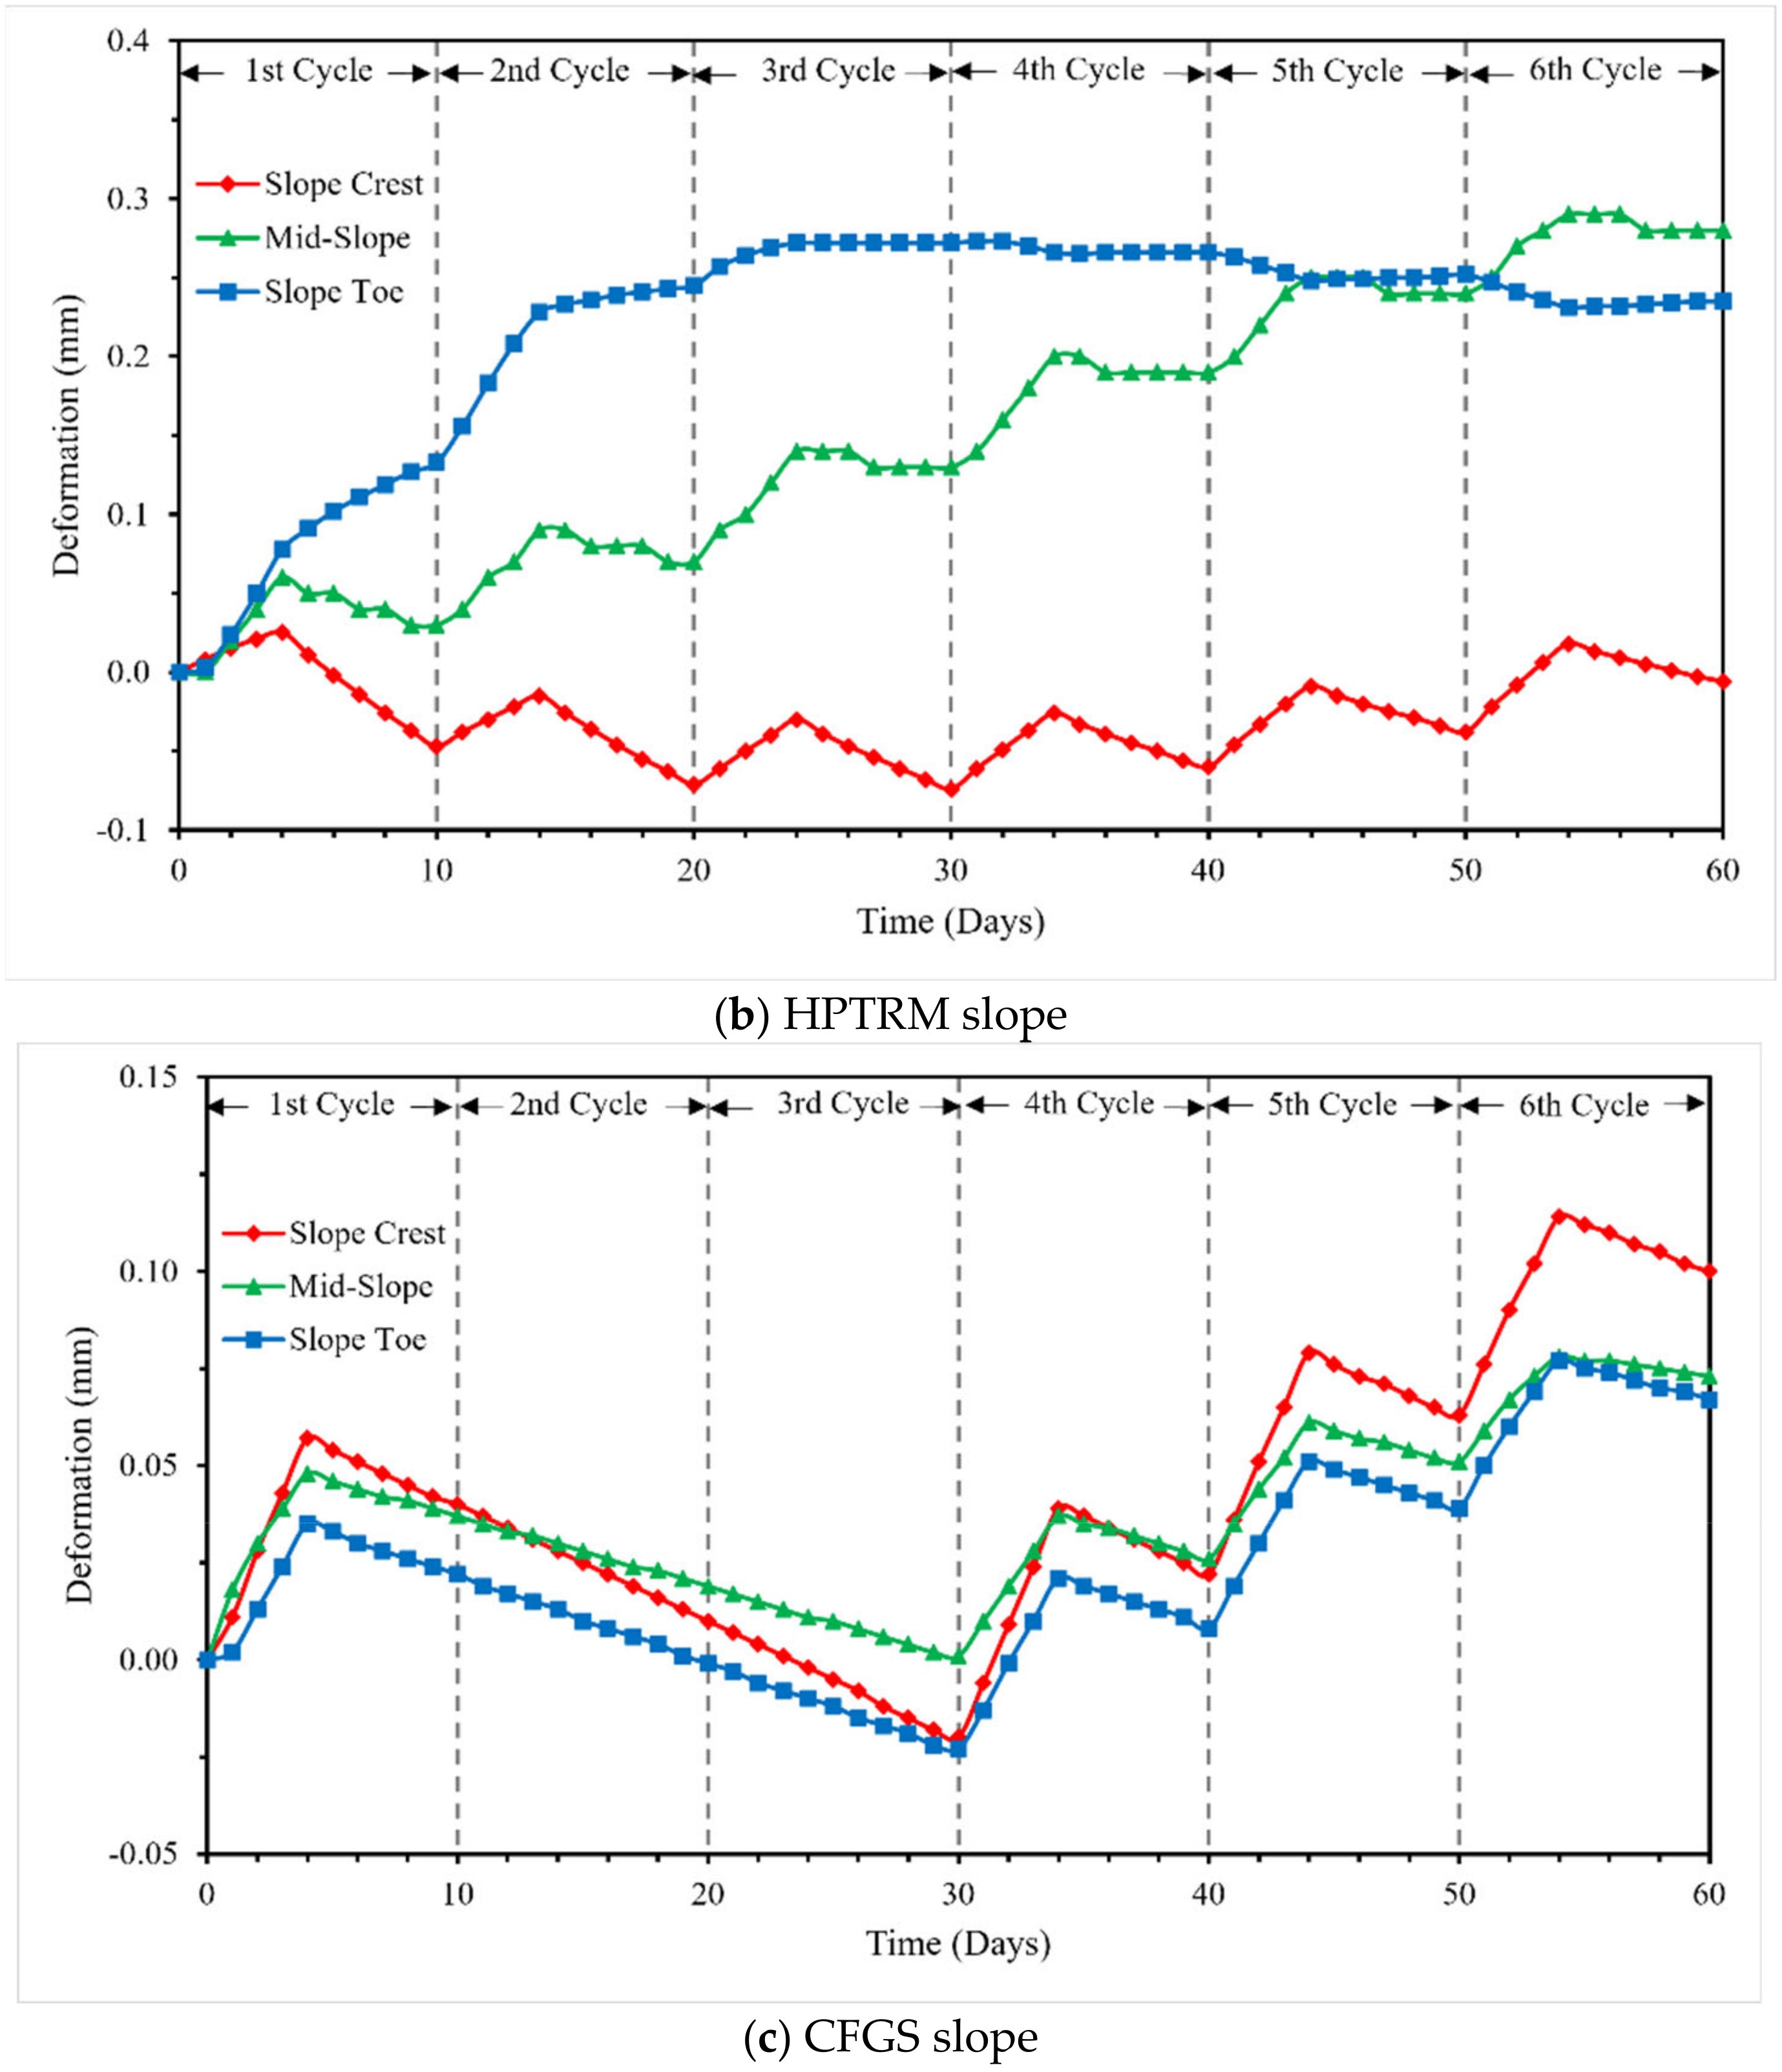
Figure 16 illustrates the swelled slope surfaces, while the corresponding swelling–shrinkage responses of the numerical models for the three slope configurations are presented in
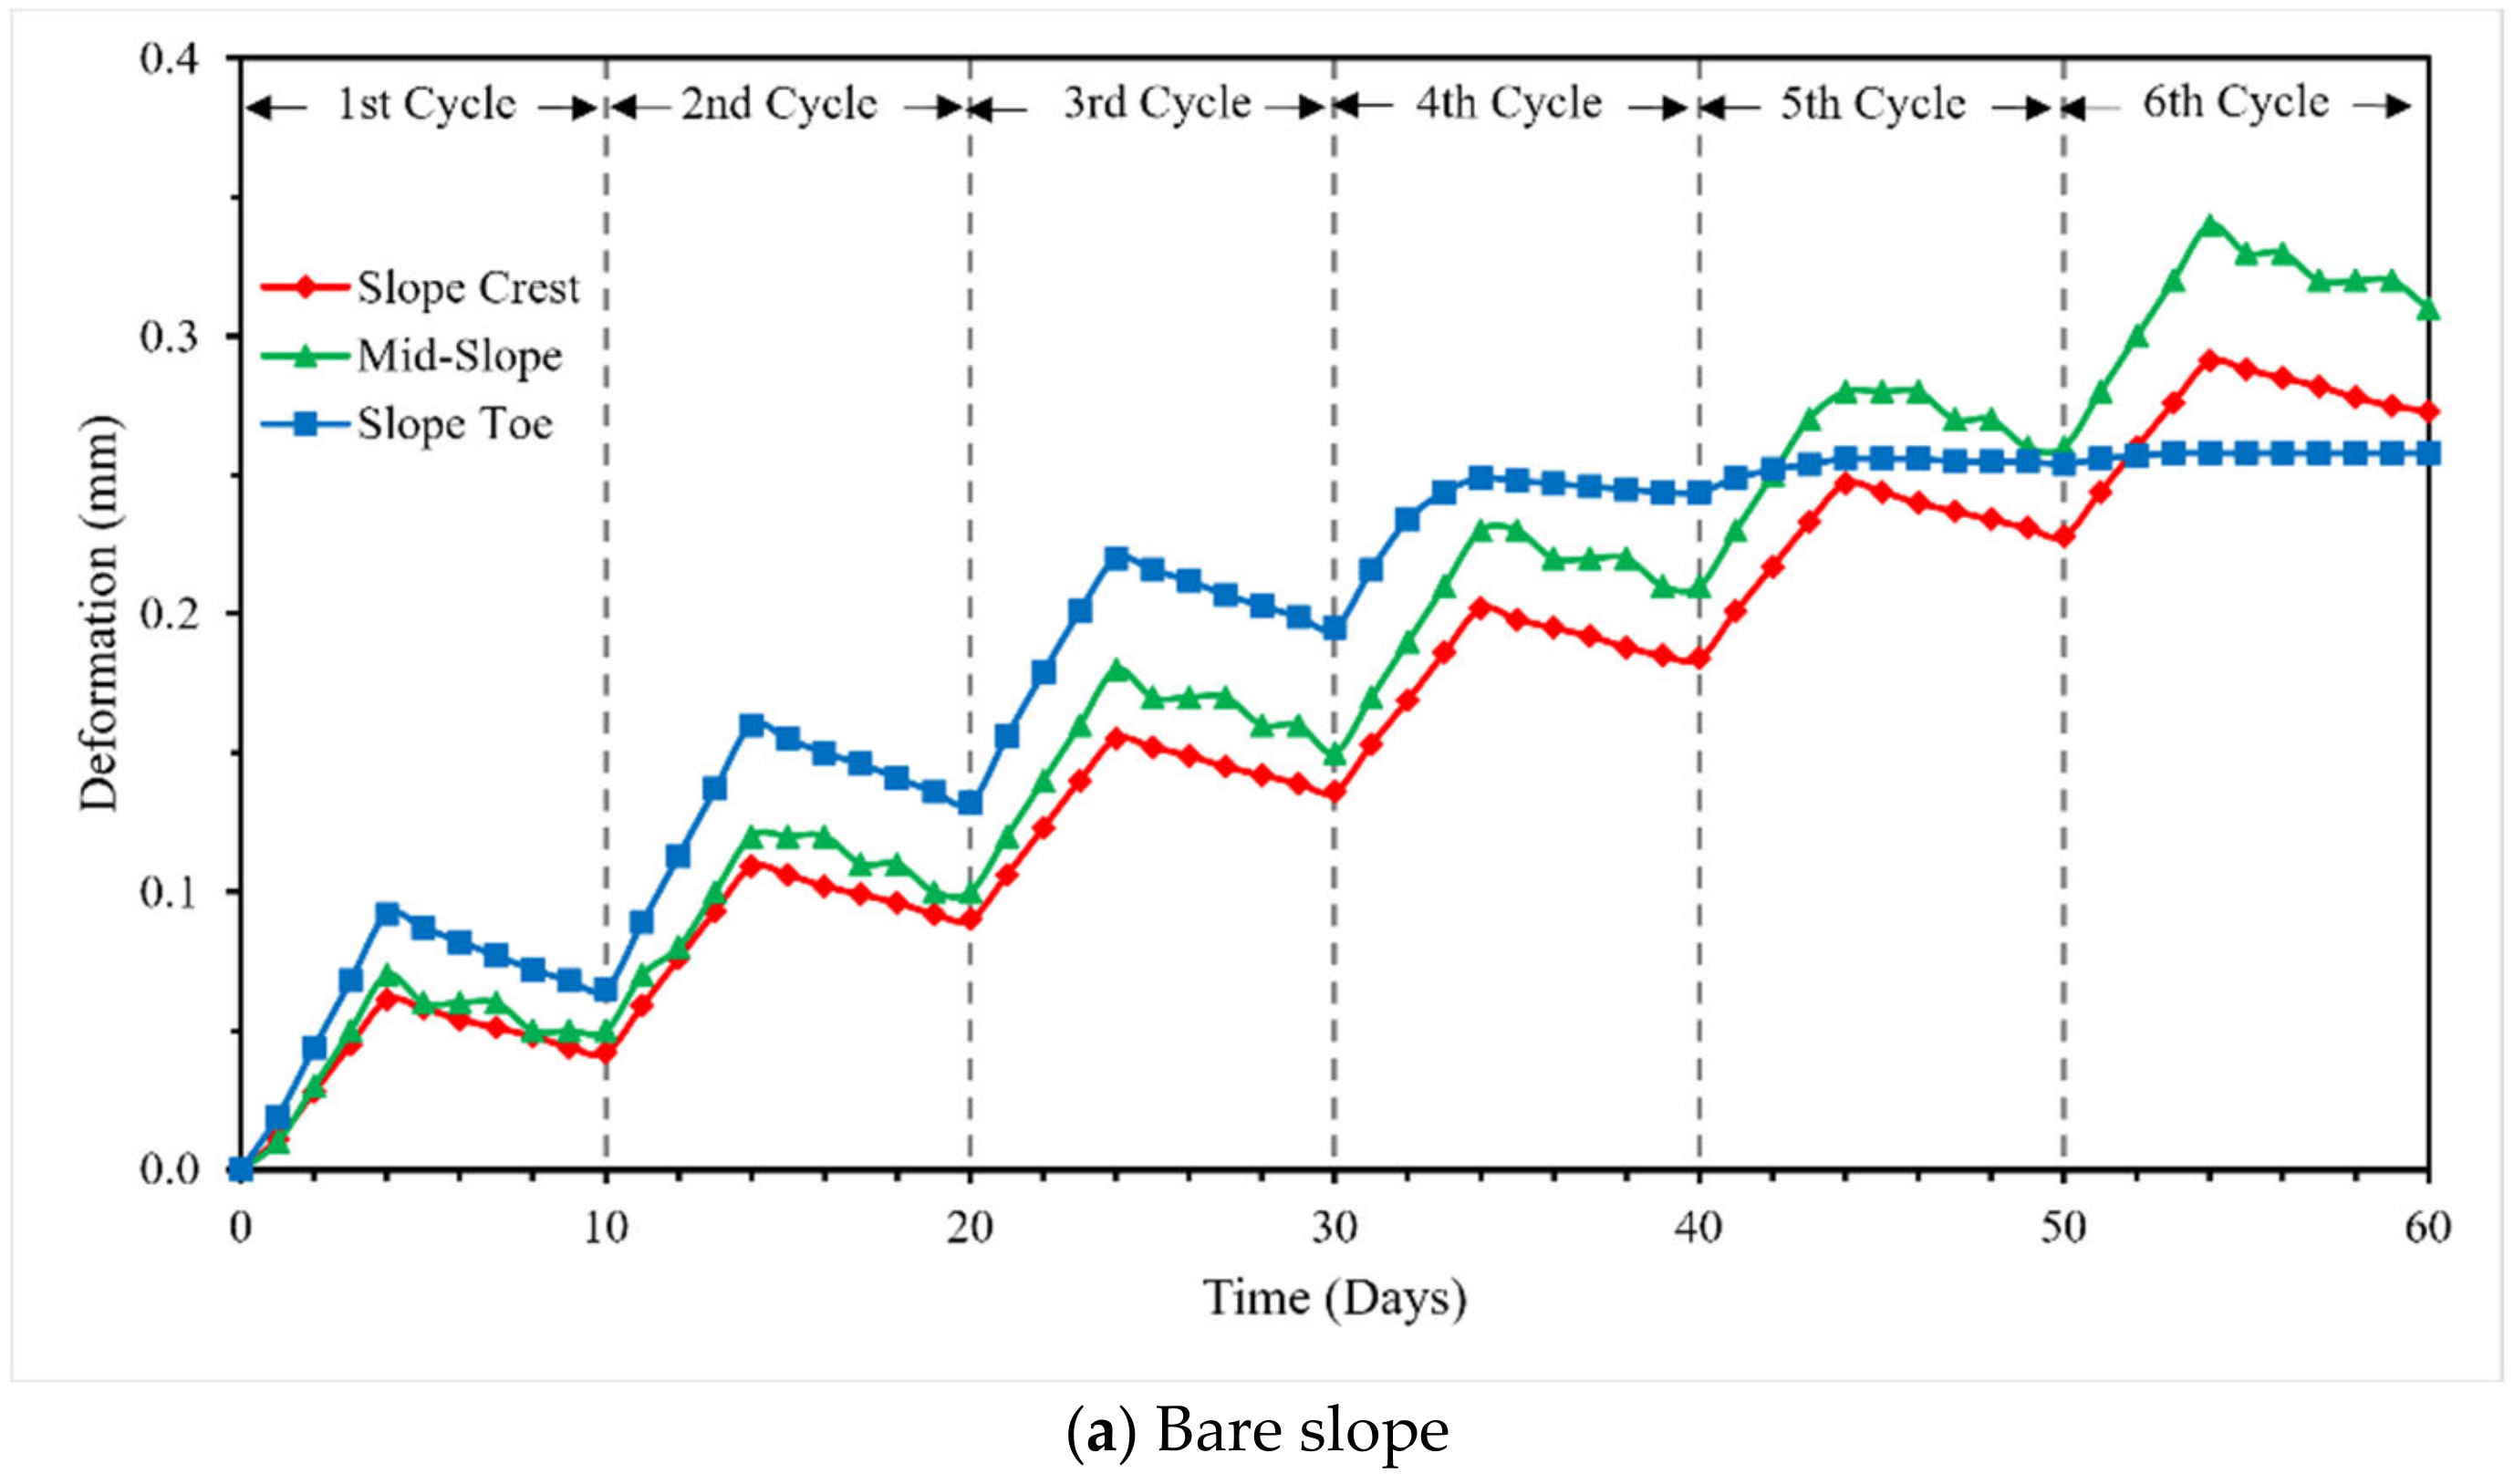
Figure 17. All slopes exhibited expansion during rainfall infiltration and contraction during evaporation, consistent with the hydro-mechanical behavior of expansive soils. However, beyond the first wet–dry cycle, the deformation patterns diverged distinctly.
For the bare slope, the absence of protective restraint results in a relatively regular swelling–shrinkage pattern, albeit with progressively increasing cumulative deformation. The sustained swelling trend is attributable to the wet–dry cycle configuration, which simulates natural climatic conditions characterized by prolonged rainfall infiltration and comparatively slower evaporation. This imbalance promotes cumulative wetting, progressive softening, and gradual strength degradation over successive cycles. Up to the fourth cycle, deformation trends remain generally consistent; however, the monitoring point D3, located near the slope toe, begins to deviate, indicating the onset of erosion-induced instability. The mid-slope monitoring point D2 records the largest displacement overall, reflecting the zone of maximum shear strain concentration.
For the HPTRM slope, the mid-slope monitoring point also exhibits a relatively regular swelling–shrinkage response with incremental cumulative displacement, similar to the bare slope but of reduced magnitude. The crest monitoring point D1 initially shows slight settlement during the first three cycles before transitioning to gradual expansion. This behavior can be attributed to the three-dimensional structure of the HPTRM, which promotes temporary surface ponding and the formation of preferential flow paths. Localized saturation near the crest induces transient softening and minor settlement, which subsequently recovers as ponded water dissipates and loose surface soil is partially eroded. At the slope toe monitoring location, D3, pronounced and continuous swelling occurs during the first three cycles before stabilization. This observation is explained by the anchorage of the HPTRM at the toe, which traps eroded soil particles transported downslope. The accumulated material occupies available void space, thereby reducing shrinkage potential and maintaining outward deformation. By the third cycle, as the majority of loose topsoil has been removed and erosion rates decline, the deformation response correspondingly stabilizes.
In contrast, the CFGS slope exhibits notable settlement during the first three cycles following the initial rainfall event. This early-stage response is associated with the gradual establishment of effective contact interaction between the composite frame and the underlying soil mass prior to full mechanical coupling. After the third cycle, the deformation pattern transitions into a more regular incremental swelling–shrinkage response. Importantly, the displacement histories at monitoring points D1, D2, and D3 follow nearly identical trends with minimal divergence. This uniformity demonstrates the effectiveness of the CFGS in redistributing stresses and reducing spatial variability in surface deformation, thereby enhancing global slope integrity.
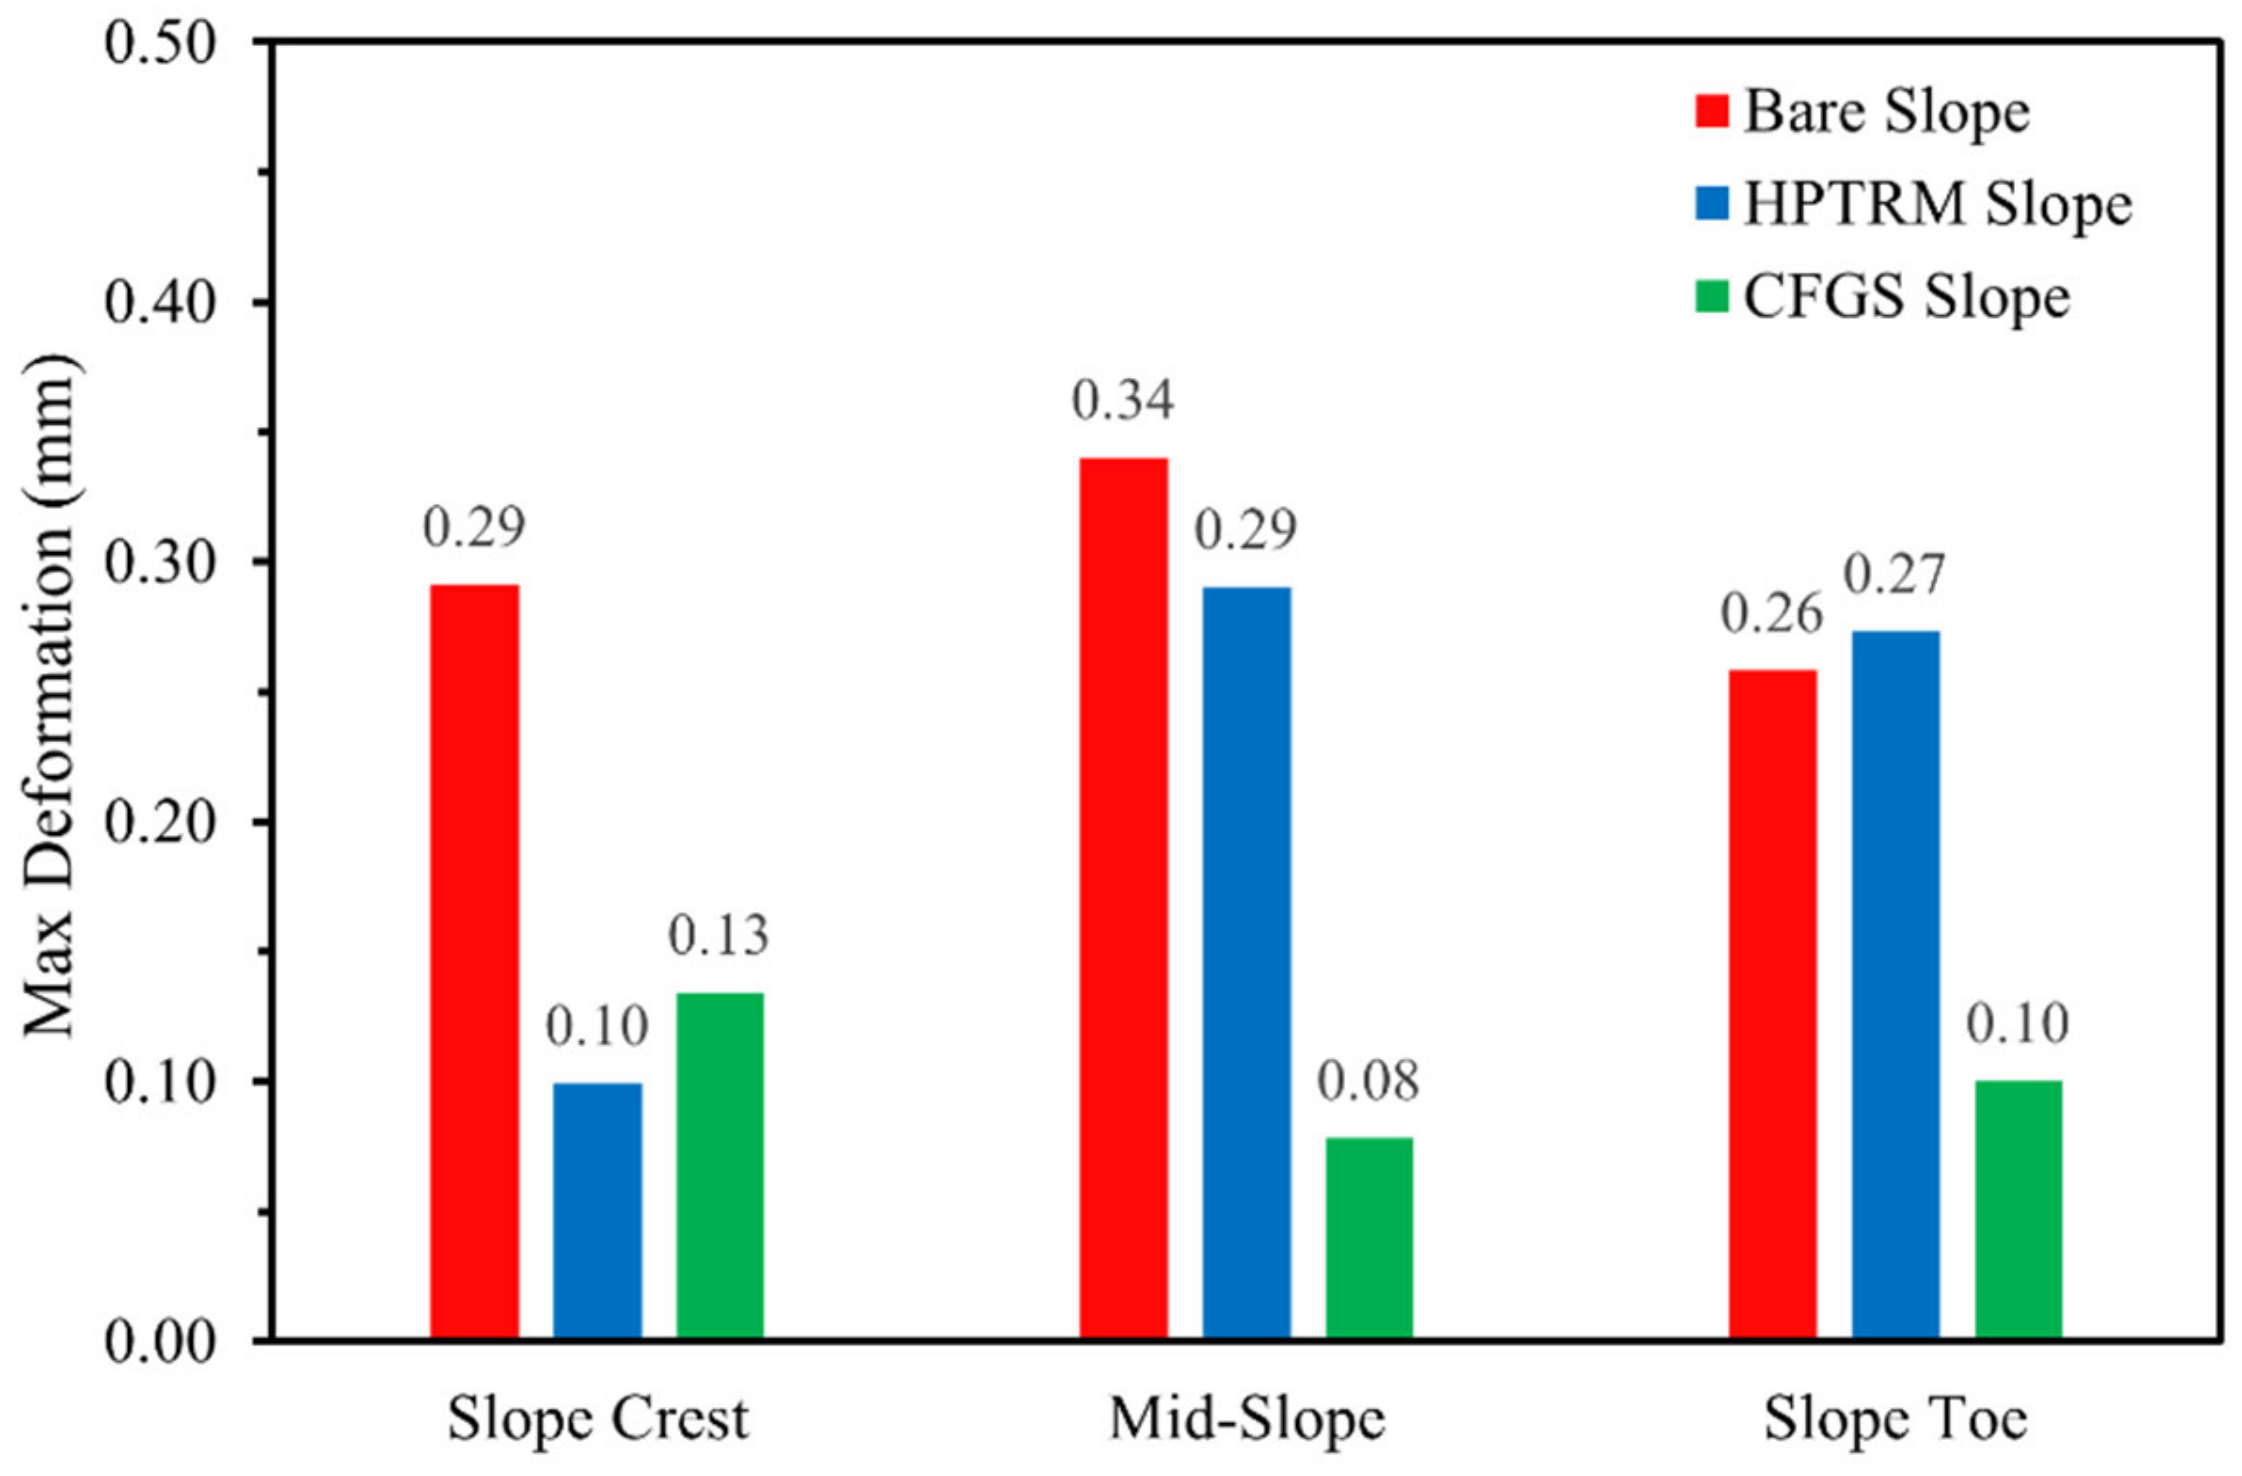
In terms of peak displacement, the CFGS slope records the smallest maximum deformations overall, as illustrated in
Figure 18. Quantitatively, the maximum deformation values of the HPTRM and CFGS slopes correspond to 34.02% and 46.05% of the bare slope at D1, 85.29% and 22.94% at D2, and 105.81% and 38.76% at D3, respectively. These results confirm that while the HPTRM provides partial deformation control, the composite stiffness and confinement introduced by the CFGS substantially enhance deformation mitigation performance under cyclic wetting–drying conditions.
4.4. Experimental–Numerical Validation of CFGS
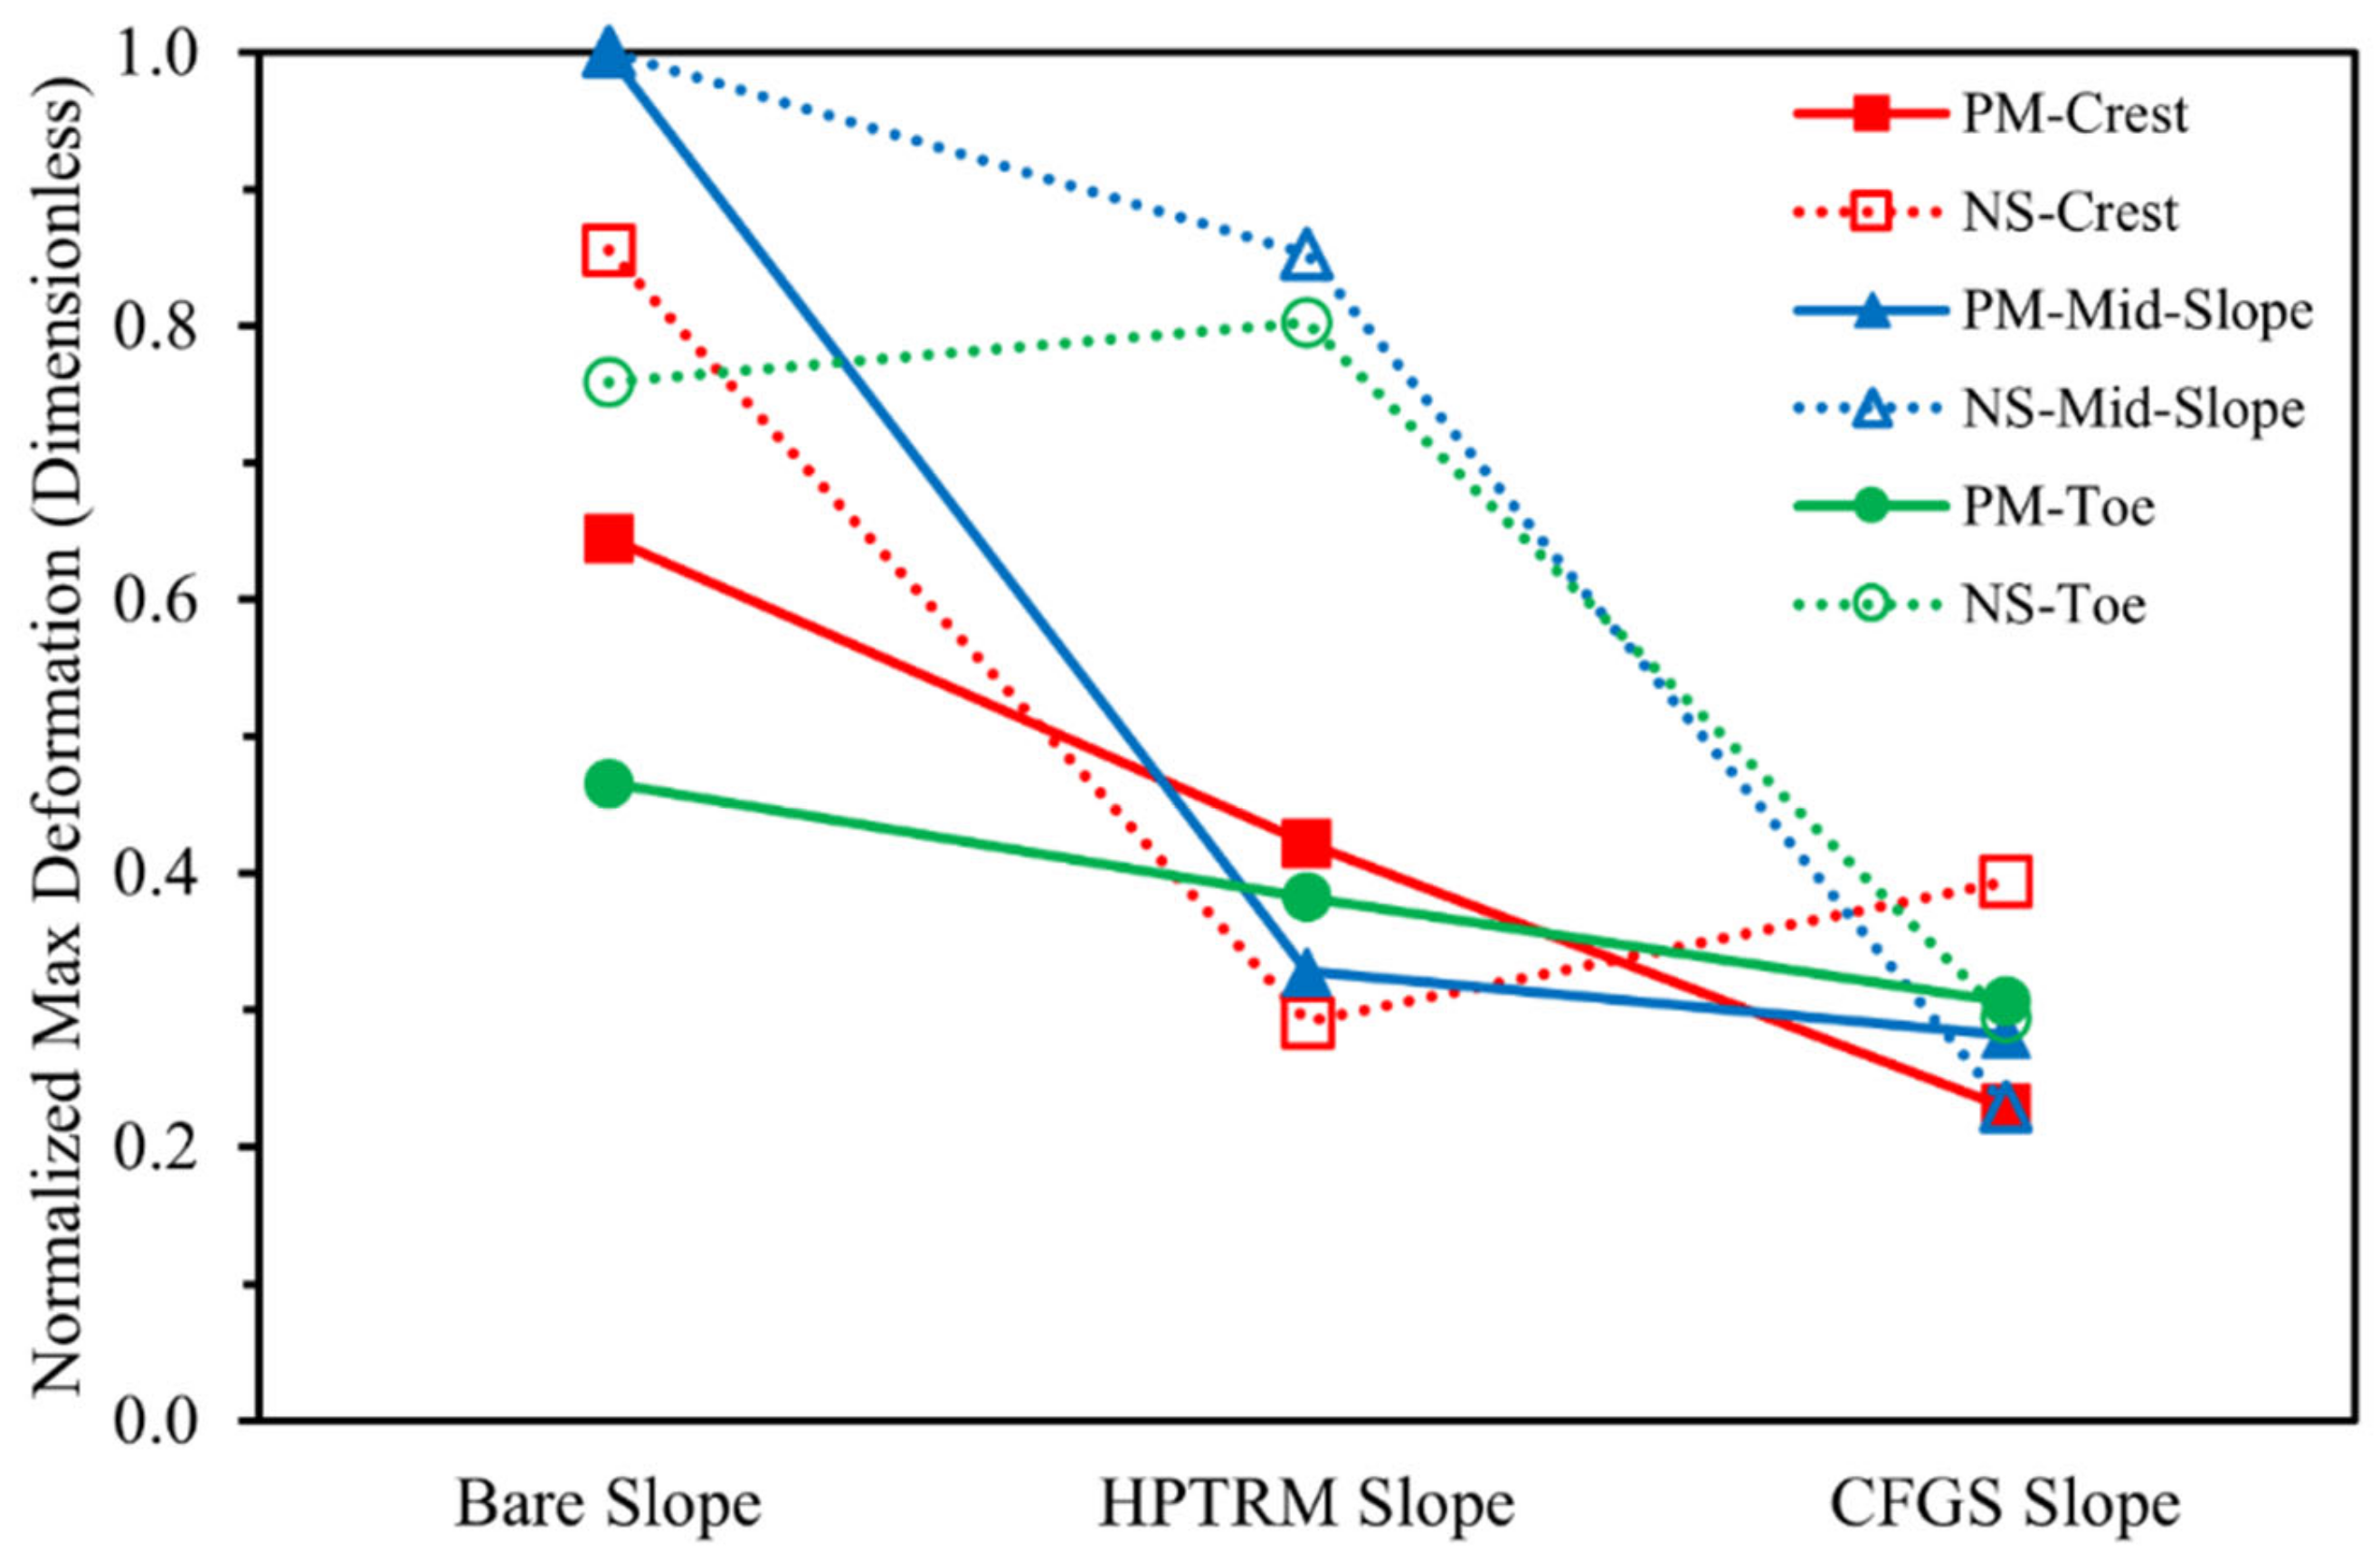
Swelling–shrinkage deformation is the most definitive characteristic for expansive soil slopes under the effect of cyclic climatic wetting–drying loading. While this behavior is triggered by the precipitation and furthered by evaporation, it is the deformation that eventually leads to slope instability. Therefore, this study based its core validation on the swelling–shrinkage deformation mitigation performance of the CFGS. In both the experimental and numerical results, and across all monitoring points, the CFGS slope consistently exhibited the smallest maximum deformation, with the overall deformation trend being bare slope > HPTRM slope > CFGS slope. However, as the deformation magnitudes for the physical model test and numerical simulation differ significantly, the data were first normalized using the maximum dataset value to enable consistent trend comparison and further validation on the concurrence of the physical model results and those for the numerical simulation. Equation (1) is presented below for normalization, and the normalized data are presented in
Table 5.
where:
= deformation at a given point.
= maximum deformation within that dataset.
A graphical comparison of the normalized maximum deformation values for both the physical model tests and the numerical simulations is presented in
Figure 19.
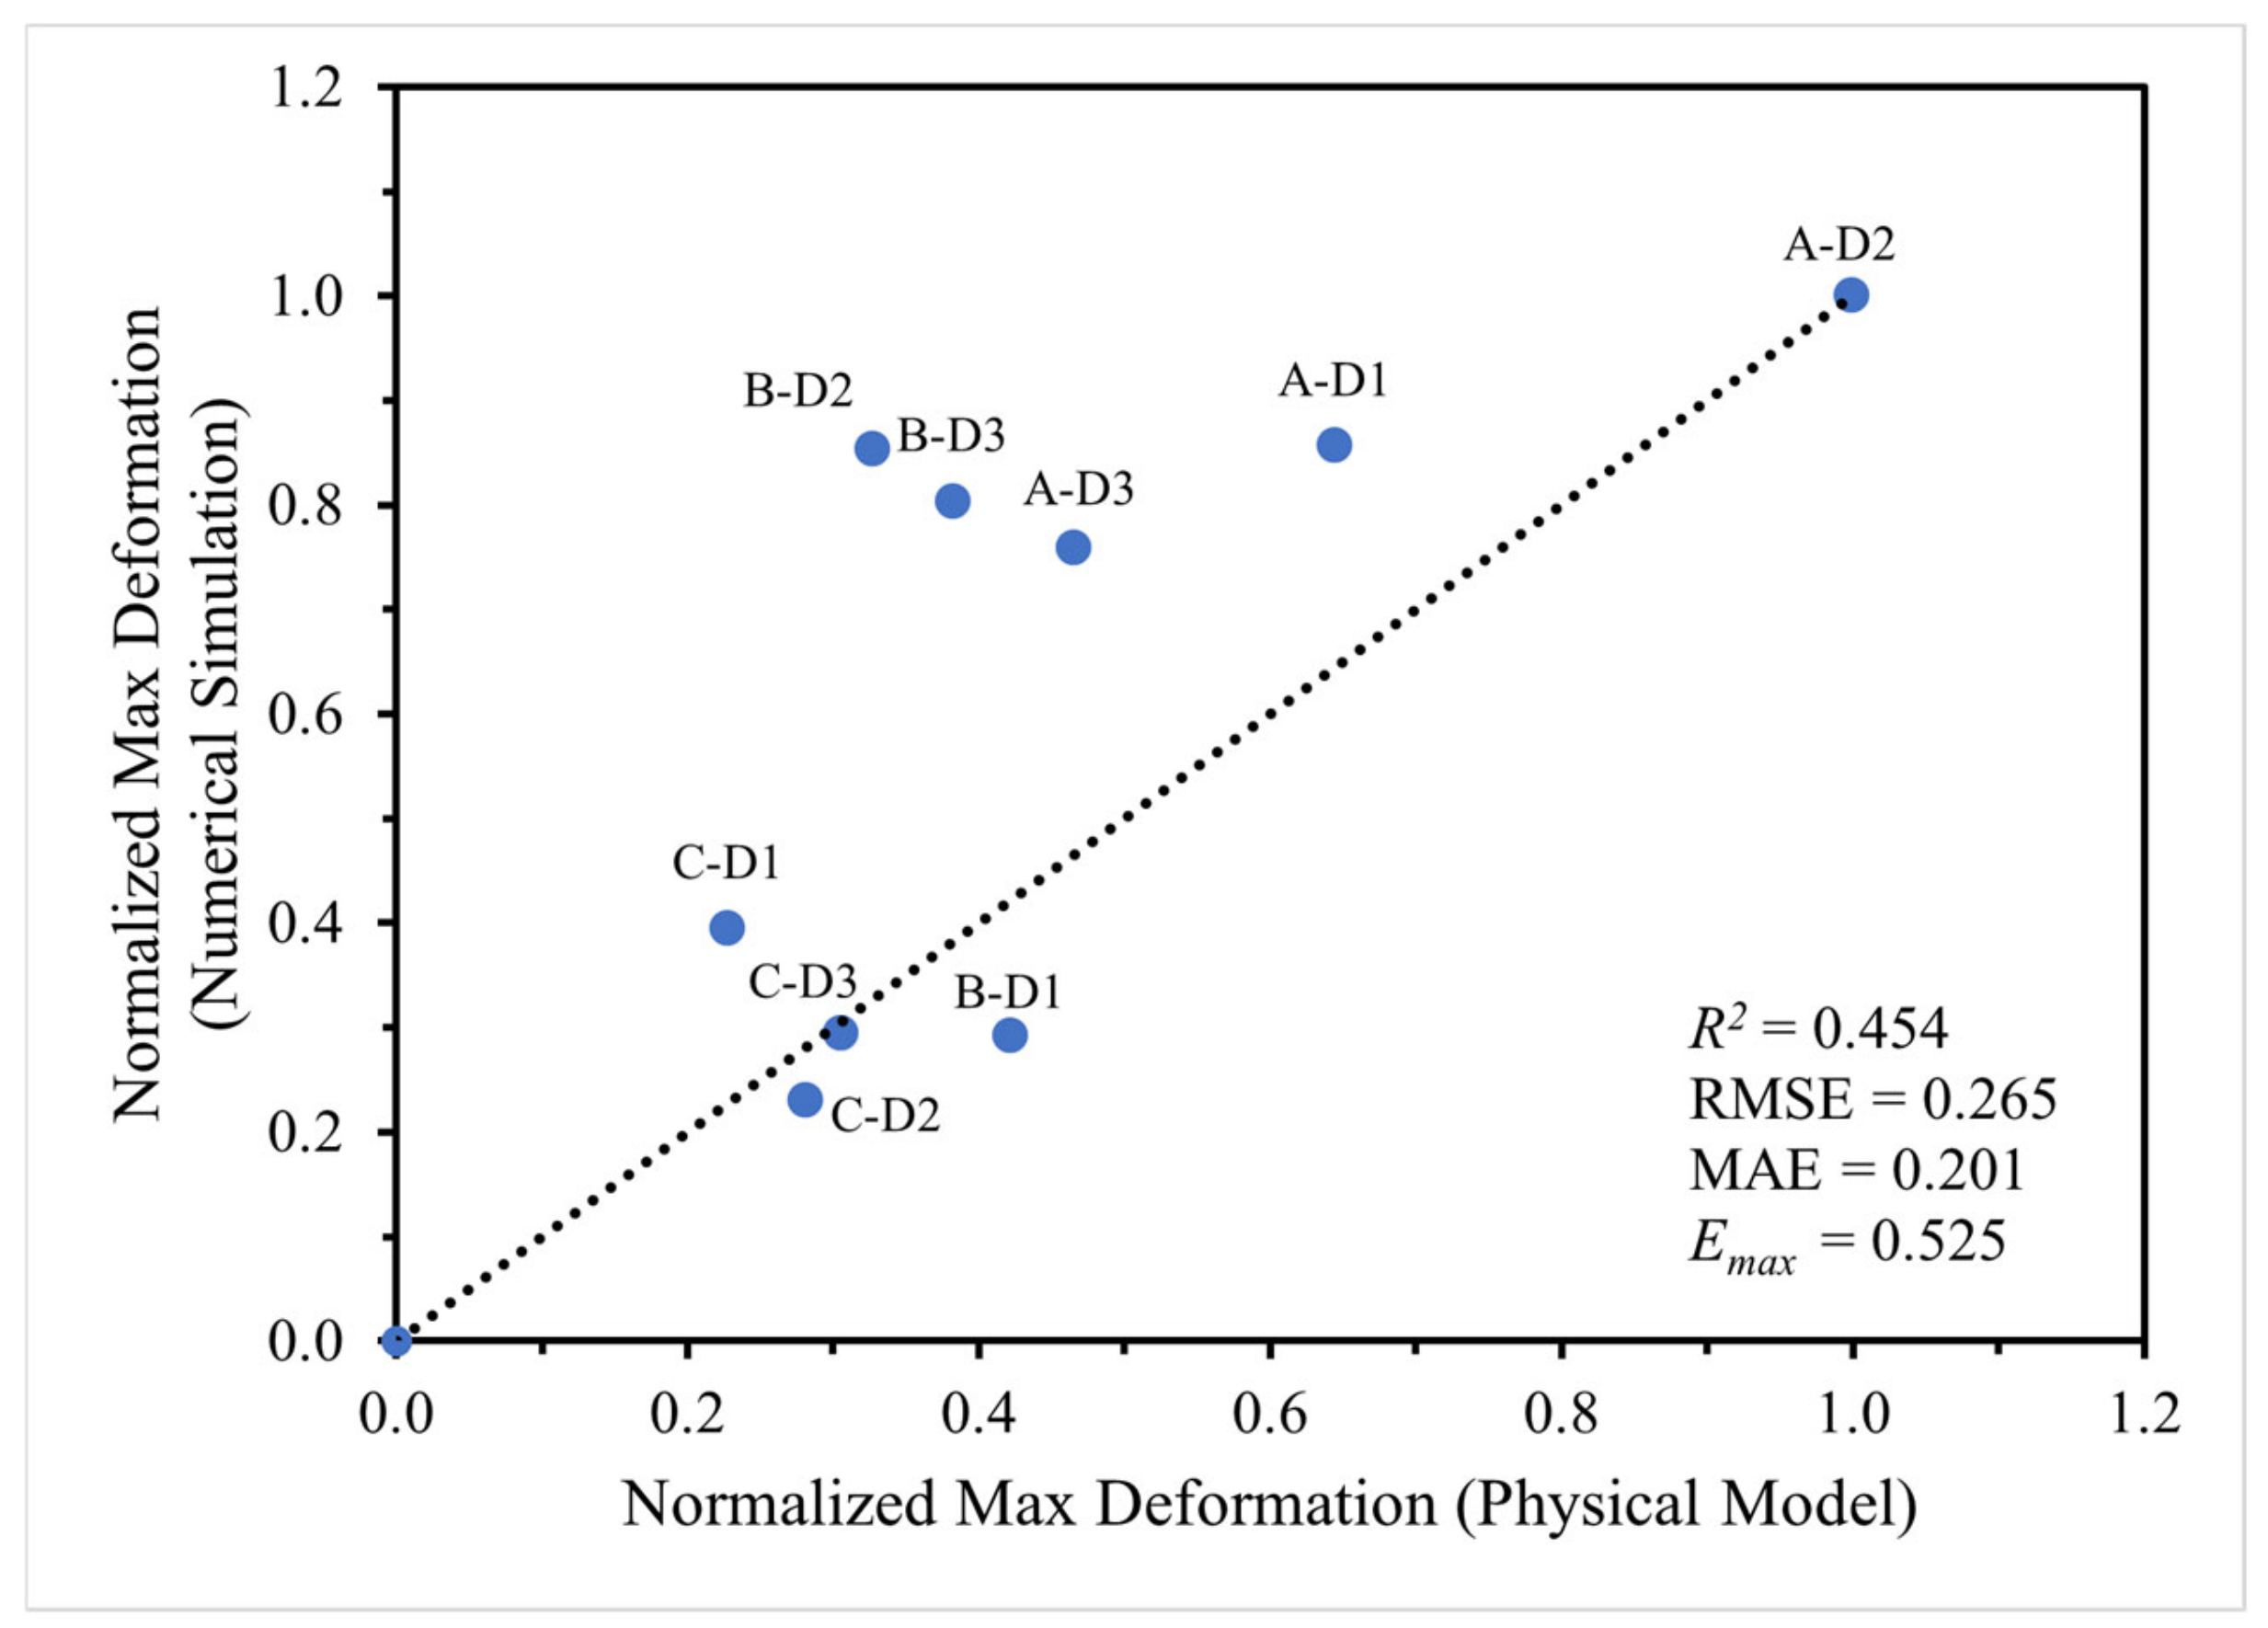
A scatter validation plot comparing the deformation obtained from the physical model tests and numerical simulations is presented in
Figure 20, and the notations used in the figure are explained in
Table 6. Each point represents deformation at a specific monitoring location across the three slope configurations for both the physical model test and numerical simulation. The dashed line represents the 1:1 agreement line corresponding to perfect agreement between the experimental and numerical results. The distribution of points indicates a consistent positive relationship between the two datasets, suggesting that locations exhibiting larger deformation in the physical model tests also correspond to larger deformation predicted by the numerical simulations. Points associated with the bare slope, where deformation is greatest, lie closer to the agreement line, whereas slightly larger deviations are observed at smaller deformation levels. This behavior is expected in the numerical modelling of expansive soils, where predictions of small displacements are generally more sensitive to modelling assumptions and parameter uncertainties. It is also noteworthy that the maximum deformation for both approaches occurs at the same monitoring location, the mid-slope of the bare slope, which further reinforces the consistency between the two methods.
To quantitatively evaluate the agreement between the physical model tests and numerical simulations, statistical validation metrics were calculated using normalized deformation values at corresponding monitoring locations. The agreement between the physical model results and numerical simulations was evaluated using the coefficient of determination
, root mean square error (RMSE), mean absolute error (MAE), and maximum absolute error
, calculated as follows:
where
and
represent the normalized deformation values obtained from the physical model and numerical simulation, respectively.
The calculated statistical indicators are:
The coefficient of determination (R2) between the two datasets was 0.454, indicating a moderate correlation between experimental observations and numerical predictions. The corresponding root mean square error (RMSE) was 0.265, representing the average deviation between the normalized datasets. The discrepancies between the physical and numerical results can mainly be attributed to scale effects, modelling simplifications, the complex hydro-mechanical behavior of expansive soils, and measurement uncertainty. The physical tests were conducted using a reduced-scale model based on simplified similitude relationships, whereas the numerical model represented a prototype-scale continuum system; therefore, exact quantitative agreement was not expected, even after deformation normalization. In addition, the numerical model assumed homogeneous and isotropic material behavior; perfect bonding between the soil, frame, and HPTRM; and continuum-based unsaturated flow, while the physical model involved local cracking, preferential flow paths, and spatially non-uniform deformation during repeated wetting–drying cycles. These discrepancies were further amplified by the nonlinear, hysteretic, and anisotropic response of expansive soils, as well as local variability caused by material heterogeneity as well as deformation around cracks and reinforcement interfaces. Despite these discrepancies, both the experimental and numerical results consistently reproduced the same overall hydro-mechanical response trends. In both approaches, the CFGS-protected slope exhibited the smallest hydraulic fluctuation amplitude and the lowest swelling–shrinkage deformation, followed by the HPTRM-protected slope and then the bare slope.
The statistical validation metrics between the two approaches demonstrates reasonable consistency in overall trend evolution between the physical and numerical analyses. It systematically validates the effectiveness of the CFGS in mitigating deformation in expansive soil slopes.