Article

Model Predictive Control for Multi-Objective Optimization of Separate Sewer Networks Based on Dynamic Weights


1
School of Environment and Energy Engineering, Beijing University of Civil Engineering and Architecture, Beijing 100044, China
2
Key Laboratory of Urban Stormwater System and Water Environment, Ministry of Education, Beijing University of Civil Engineering and Architecture, Beijing 100044, China
3
CAUPD Beijing Planning & Design Consultants Co., Ltd., Beijing 100044, China
*
Author to whom correspondence should be addressed.
Appl. Sci. 2026, 16(11), 5177; https://doi.org/10.3390/app16115177
Submission received: 25 April 2026 / Revised: 15 May 2026 / Accepted: 20 May 2026 / Published: 22 May 2026
(This article belongs to the Special Issue Recent Advances in Hydraulic Engineering for Water Infrastructure)

Abstract

Urban separate sewer systems face significant challenges from rainfall-derived infiltration and inflow (RDII) during the wet season. To achieve the integrated optimization of operational safety, energy consumption, and carbon emissions, this study proposes a dynamic optimal control method. A real-time regulation framework was developed by coupling a Storm Water Management Model (SWMM) hydraulic model with a Non-dominated Sorting Genetic Algorithm II (NSGA-II) multi-objective optimization algorithm within a Model Predictive Control (MPC) structure. Based on real-time water level risks, the framework adaptively adjusts the priority among three objectives: overflow reduction, pumping station energy consumption, and methane emission potential. Using a real separate sewer network in CZ city as a case study, the method was evaluated under light, moderate, and heavy rainfall scenarios. Results show that, compared with traditional rule-based control (RBC) and fixed-weight static model predictive control (SMPC), the proposed dynamic model predictive control (DMPC) strategy reduces overflow by 37.2% during heavy rain, and achieves 16.5% energy savings and a 15.8% reduction in methane emission potential during light rain. The strategy also balances network storage utilization, mitigates local overload, and demonstrates enhanced robustness to rainfall forecast errors, providing an effective technical solution for safe, energy-efficient, and low-carbon urban drainage operation.

1. Introduction

Urban drainage systems are an essential component of urban infrastructure [1,2]. The continuous expansion of drainage networks and the rapid growth of wastewater discharge have confronted these systems with unprecedented challenges in operational safety, energy efficiency, and environmental impact [3]. Meanwhile, driven by global climate change mitigation efforts, the energy consumption and greenhouse gas emissions during the operation of urban drainage systems have received high attention [4,5]. Among them, urban drainage networks, as the core carriers for wastewater conveyance and storage, have been identified as one of the important potential sources of greenhouse gas emissions [6,7]. Joo et al. [8] further demonstrated that methane emissions from sewer networks are substantially underestimated in current inventories. In actual operation, factors such as rainfall-derived inflow and infiltration (RDII), cross-connections, and leakage allow a large amount of extraneous water to enter separate sewer networks during the wet season. Wang et al. [9] assessed RDII using machine learning approaches, while Zhang et al. [10] provided a comprehensive review of extraneous water quantification and mitigation strategies. Ge et al. [11] further proposed a data-driven method for estimating sewer inflow and infiltration based on temperature and conductivity monitoring. RDII can cause the proportion of extraneous water to reach 20–50% [12,13]. This hydraulic overload weakens the conveyance capacity and significantly increases the risks of pipe surcharge and overflow. Furthermore, the inflow of extraneous water forces pumping stations to operate at high frequency and high load, leading to a sharp rise in energy consumption [14]. Additionally, sewer networks are important sources of methane emissions, which are closely related to hydraulic conditions such as water level and flow velocity [15]. Under the influence of RDII, the decreased flow velocity in sewer pipes amplifies carbon emission intensity, forcing the operation to face complex trade-offs among safety, energy consumption, and carbon emissions. However, existing research mostly focuses on traditional objectives like overflow control and energy reduction, rarely incorporating potential carbon emissions into the real-time control framework.
In practical engineering, wastewater pumping station control has long relied on Rule-Based Control (RBC) strategies based on liquid level thresholds [16]. Although simple and reliable, RBC is a passive reactive control method lacking the ability to predict inflow processes. When rainfall causes unstable inflow rates, RBC often leads to frequent starting and stopping of pumps, aggravating equipment wear and failing to reduce overflow risks. In recent years, Real-Time Control (RTC) [17] technology has become an important means to improve operational efficiency in urban drainage systems [18,19]. Zhang et al. [20] proposed a decentralized multi-agent framework for coordinated overflow and flooding reduction. Van der Werf et al. [21] examined the long-term implementation factors of RTC in combined sewer systems. Model Predictive Control (MPC) shows significant advantages by forecasting network load changes in advance to carry out feedforward scheduling, effectively dealing with the lag and uncertainty in hydraulic processes [22,23].
Under the MPC framework, how to efficiently solve the Multi-objective Optimization Problem (MOP) involving multiple conflicting objectives is the key to achieving high-performance control [24,25]. In recent years, intelligent optimization algorithms such as Genetic Algorithm (GA) [13,26], Particle Swarm Optimization (PSO) [27,28], and Differential Evolution algorithms [29,30] have been widely applied in the research of planning, design, and operational control of drainage systems. These algorithms have significant advantages in handling nonlinear, nonconvex, and high-dimensional optimization problems. Intelligent optimization algorithms such as the Non-dominated Sorting Genetic Algorithm II (NSGA-II) perform outstandingly in multi-objective trade-offs and collaborative optimization. It is highly suitable for comprehensive control problems among objectives such as overflow control [31], energy consumption [32], and operational safety [33].
Despite these progresses, existing studies mostly focus on combined sewer systems, or single objectives for separate networks under RDII conditions. Furthermore, robustness evaluations facing input uncertainty from rainfall forecast errors remain limited. Based on this background, this study selects a typical separate sewer network in Changzhou as the research object and constructs a real-time optimal control framework coupling the Storm Water Management Model (SWMM), and the MPC-NSGA-II algorithm. The main objectives include: (1) Constructing a multi-objective dynamic optimization model aiming at minimizing node overflow volume, pumping station operational energy consumption, and methane emission potential, embedding it into the real-time control framework; (2) Analyzing the interrelationships among overflow control, energy consumption, and methane emission potential under the influence of RDII; (3) Evaluating the control effect and robustness of the proposed framework under multiple rainfall scenarios, quantitatively analyzing its comprehensive benefits in overflow reduction, energy reduction, and methane emission potential suppression.

2. Methods

This study adopts SWMM, which was developed by the U.S. Environmental Protection Agency (US EPA) to construct a hydraulic model of the drainage system, aiming to simulate the dynamic hydraulic responses of the sewer network and pumping stations under different operational conditions. As a mechanistic model widely applied in urban drainage system analysis, SWMM can relatively accurately describe rainfall runoff, pipeline conveyance, nodal water level changes, and pumping station operational processes, providing a reliable hydrodynamic basis for drainage system control optimization research. To achieve active regulation and real-time optimization of pumping station operations, it is necessary to construct a dynamic simulation environment capable of bidirectional interaction with the optimization algorithm. Therefore, this study uses Python 3.11 to call libraries such as swmm_api and pyswmm to interact with SWMM in real time, constructing a co-simulation and control framework that supports hydraulic simulation, system state acquisition, and control command feedback.

2.1. MPC-NSGA-II Dynamic Optimization Control Framework

To achieve the real-time optimal scheduling of urban drainage systems under uncertain rainfall conditions, this study constructs a multi-objective control framework based on Model Predictive Control (MPC). This framework takes the physical drainage system as the controlled object, uses SWMM as the hydraulic prediction model, and utilizes the NSGA-II algorithm to achieve the collaborative optimization of multiple objectives such as overflow risk, operational energy consumption, and greenhouse gas emissions within a rolling horizon.

2.1.1. Overall Design of the Control Framework

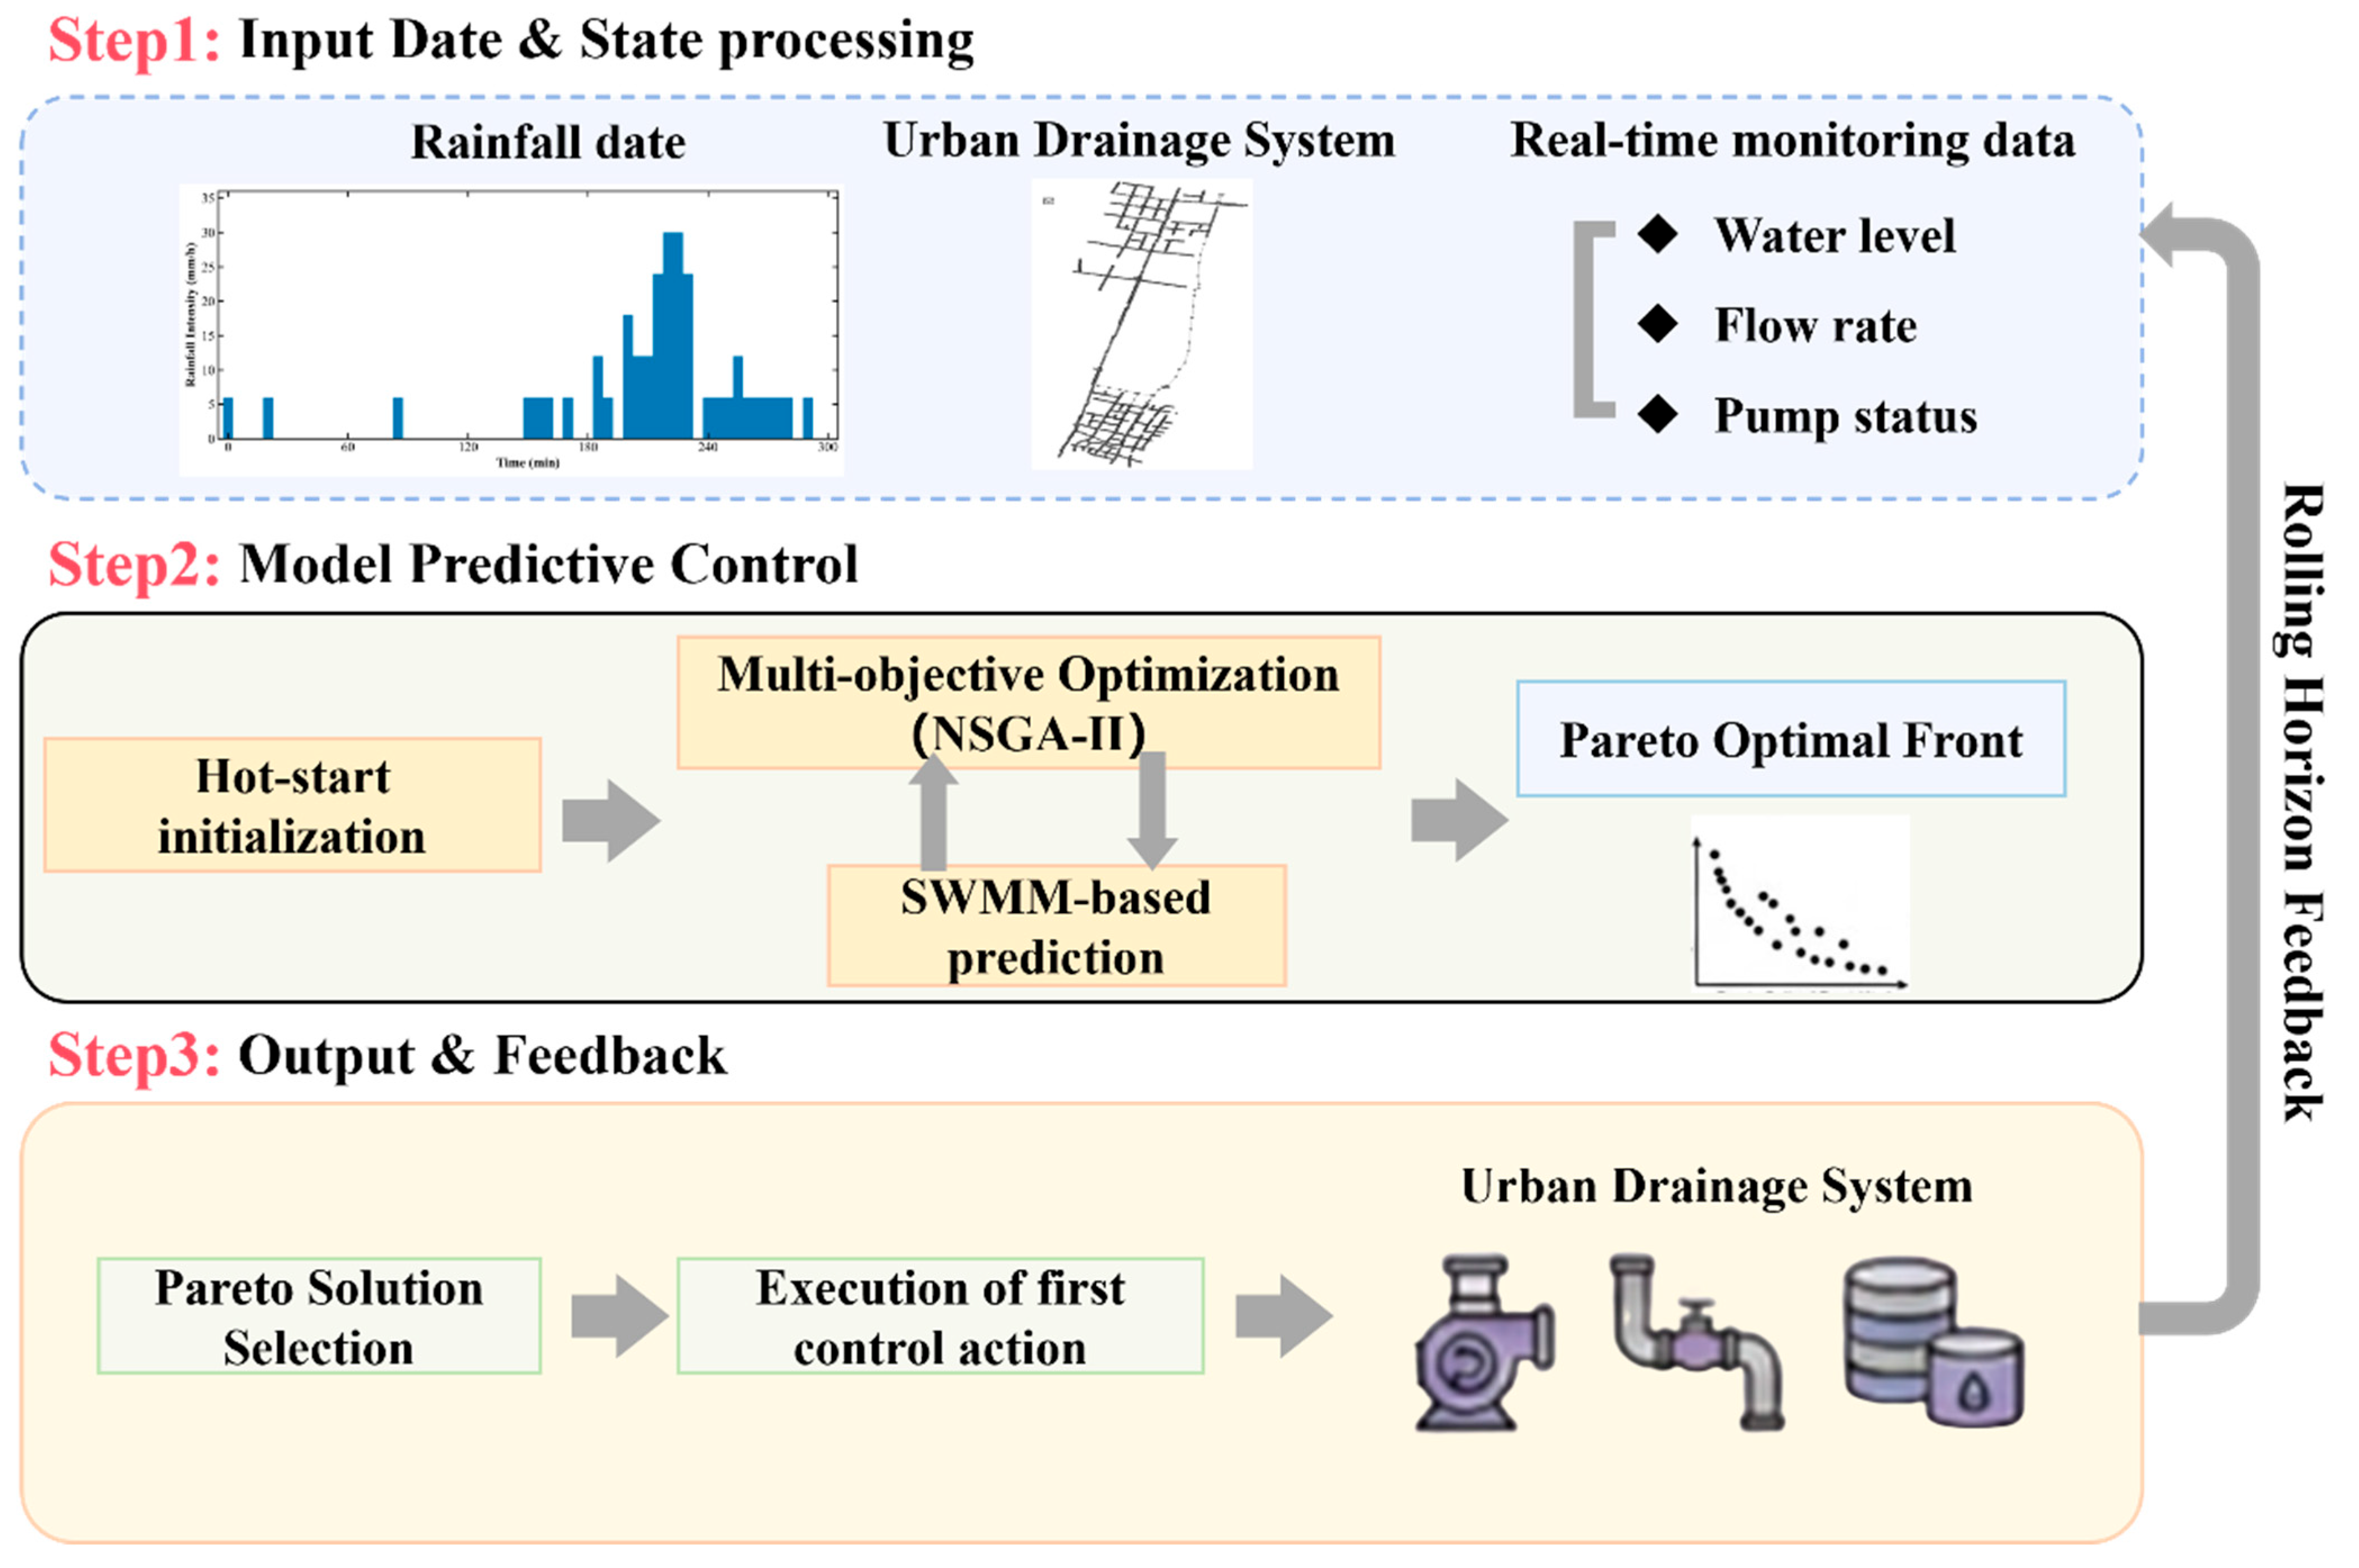
As shown in Figure 1, the proposed control framework adopts a typical closed-loop MPC structure, consisting of modules such as the physical system, state perception, prediction model, multi-objective optimization, and control execution. At each control step, the system first obtains the current hydraulic state information of the drainage system (including node water levels, pipe flow rates, and rainfall information, etc.) through real-time monitoring. It uses it as the initial condition for model prediction. Subsequently, within a given prediction horizon, the SWMM-based hydraulic model simulates and evaluates the future system response and generates candidate control sequences driven by the multi-objective optimization algorithm. Through a comprehensive evaluation of the prediction results, the controller selects an optimal control sequence from the Pareto optimal solution set and executes only the first step of the control action in it. As the system state updates, the control horizon rolls forward, and the above process is repeated at the next time step, thereby forming a rolling closed-loop control mechanism of “prediction-optimization-execution-feedback”.

2.1.2. Hydraulic Predictive Model and Initialization Mechanism

In the MPC framework, the accuracy and computational efficiency of the hydraulic prediction model have a decisive impact on real-time control performance. This study selects SWMM as the high-fidelity hydraulic simulation engine for the drainage system, which is used to evaluate the system responses of different control strategies within the prediction horizon. To ensure the consistency between the prediction model and the physical system state, the SWMM model is initialized through a hot-start mechanism at each control step, that is, using the system state at the end of the previous control step as the initial condition for the current prediction. This hot-start strategy can effectively avoid the error accumulation and computational redundancy caused by repeatedly simulating from the initial conditions, making the prediction process closer to the real operational state, thereby improving the reliability and stability of MPC decisions.

2.1.3. The NSGA-II Algorithm

Based on the prediction model, this study adopts the Non-dominated Sorting Genetic Algorithm II (NSGA-II) to conduct multi-objective optimization on control decisions. The optimization variables are the control sequences of various control actuators (such as pump start and stop) within the prediction horizon, and the objective functions comprehensively consider key performance indicators such as total node overflow, operational energy consumption, and methane emissions.
During the optimization process, NSGA-II conducts an evolutionary search on candidate solutions through non-dominated sorting and crowding distance mechanisms, gradually approaching the multi-objective Pareto optimal front. Each candidate control sequence needs to call the SWMM prediction model for a complete hydraulic simulation, and its corresponding objective function value is calculated from the simulation results and used as the basis for the algorithm’s fitness evaluation.
This study selects the NSGA-II algorithm for solving, which is known for its excellent global search capability and solution set distribution [34]. It is especially suitable for comprehensive control problems among objectives such as overflow control, energy consumption optimization, and operational safety [31,32]. For instance, Wang et al. [35] had utilized NSGA-II to establish a multi-objective optimization model under excessive runoff conditions, successfully solving the balance problem among rainfall runoff, facility efficiency, and cost-effectiveness under different return periods. Ke et al. [36] proposed an NSGA-II-based resilient and controllable optimization model that co-optimizes traditional drainage network design and impervious surface (ODIS) planning for the design and rehabilitation of urban drainage systems.
To ensure reproducibility and evaluate the feasibility of real-time application, the specific configurations of the MPC and NSGA-II algorithms are detailed as follows. The MPC framework operates with a control interval of 300 s (5 min). The prediction horizon was set to 60 min, which equates to 12 control steps. The multi-objective optimization was solved using the NSGA-II algorithm. To balance global exploration and real-time computational constraints, a rolling-horizon warm-start mechanism was implemented for population initialization. Unlike the offline reference Pareto front analysis, which utilized 100 individuals and 100 generations to ensure full convergence, the real-time online optimization adopts a reduced population of 50 individuals. Specifically, 50 generations are executed for the initial online control step, while only 15 generations are required for subsequent steps by inheriting the optimal population from the previous step. Because the hydraulic state of the drainage network evolves gradually over the 5 min interval, this warm-start mechanism provides a high-quality initial seed, substantially reducing the required global exploration effort and ensuring that the reduced population can rapidly maintain near-optimal Pareto front convergence. The multi-objective optimization was solved using the NSGA-II algorithm with a population size of 50. To balance global exploration and real-time computational constraints, the maximum number of generations was dynamically adapted: 50 generations were executed for the initial control step, while only 15 generations were required for subsequent steps by employing a warm-start mechanism that inherited the shifted optimal population from the previous time step. The genetic operators included Simulated Binary Crossover (SBX) with a crossover probability of 0.9 and a distribution index of 15, and Polynomial Mutation (PM) with a distribution index of 20. Binary tournament selection was utilized to select parent individuals. For the hydraulic prediction, the SWMM model was updated at each control step using a hot-start file (.hsf). This file seamlessly transferred the current system states—specifically, node water depths and link flows—to initialize the prediction model, thereby preventing error accumulation. Under the current workstation configuration, a single SWMM simulation over the 60 min prediction horizon required approximately 5 s. With 50 individuals, 15 generations, and 8 parallel workers, the estimated wall-clock time for one steady-state optimization step was approximately 470 s, and the initial 50-generation step required approximately 1560 s. While this exceeds the nominal 300 s control interval under the present hardware, the framework remains suitable for near-real-time operational decision support. Future work will explore data-driven surrogate models (e.g., artificial neural networks or Gaussian process regression) to rapidly approximate objective function values and pre-screen candidate solutions, thereby substantially reducing the number of full SWMM simulations required per control step and enabling strict real-time execution.
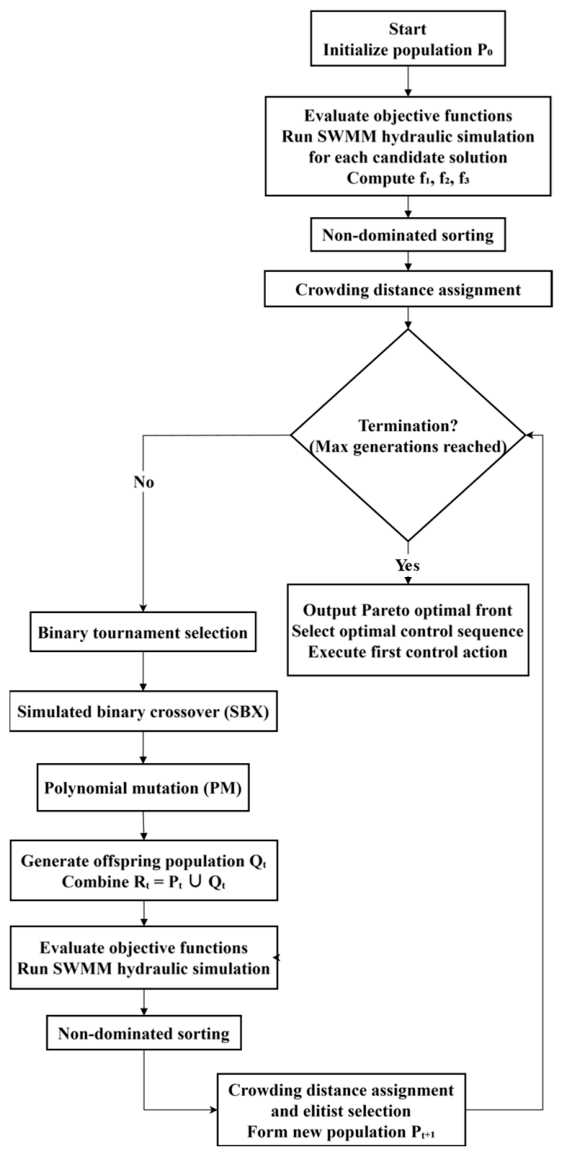
To further clarify the dynamic optimization process and ensure algorithmic reproducibility, a detailed flowchart of the applied NSGA-II algorithm, coupled with the SWMM hydraulic evaluations and rolling-horizon warm-start mechanism, is presented in Figure 2.
The entire control framework was executed on a workstation equipped with an Intel(R) Core(TM) Ultra 7 255HX (2.40 GHz) processor and 16 GB of RAM. Accelerated by Python’s multiprocessing module, utilizing up to 8 parallel workers.

2.2. Multi-Objective Optimization Problem

2.2.1. Decision Variables

The decision variables of the optimization model are the start-stop states of each pump in the pumping station during the control period, typically represented by discrete variables “0” for pump stop and “1” for operation. Within a given prediction horizon, the combination of all pump start-stop states forms the decision vector of the optimization problem, which is used to describe the operational strategy of the pumping station for a future period of time.

2.2.2. Objective Function

This study defines four primary objective functions, as follows:
1.
Objective function F1: Minimizing total node overflow volume, calculated as Equation (1).
Node overflow is a major cause of urban water pollution. This objective aims to minimize the total sewage overflow volume within the network through control, or even achieve zero overflow.
F 1 = min i = 1 n Q sso
where Q S S O is the cumulative overflow volume at node i (m3); and n represents the total number of nodes experiencing overflow events.
2.
Objective function F2: Minimizing pumping station energy consumption, calculated as Equation (2).
Pumping stations are the main energy-consuming units of the drainage system. On the premise of meeting drainage requirements, total power consumption is reduced by optimizing the start-stop combination of pumps and operating periods (e.g., operating in high-efficiency ranges).
F 2 = min k = 1 K i = 1 M P i ( k ) x i ( k ) Δ t
where M is the total number of pump units within the station; P i ( k ) represents the instantaneous power demand of the i -th pump at time step k (kW); and x i ( k ) denotes the binary decision variable representing the operational status (start-stop state) of the pump.
3.
Objective function F3: Methane (CH4) emission potential in the drainage network, calculated as Equation (3).
CH4 is generated during the transport of sewage in pipes, which is a greenhouse gas. This objective function is used to evaluate the carbon emission potential during the operation of the network. The coefficients and exponential powers in Equation (3) were adopted from the empirical formula developed by Willis et al. [37] under the WRF CAPS project (WERF Project #U5R12). This formula was derived from extensive SeweX mechanistic model simulations and successfully validated against full-scale field measurements from DC Water’s Potomac Interceptor (with a summer accuracy of −1% to +5% and a winter accuracy of −6% to +19%). The coefficients (0.419 and 1.06) and exponents (0.26, 0.28, and −0.138) explicitly capture the dominant effects of sewage temperature, flow rate, pipe diameter, and pipe slope on methane generation.
F 3 = min   0.419 × 1.06 ( T 20 ) × i = 1 n Q i 0.26 × D i 0.28 × S i 0.138 × L i
where T is the annual average temperature of the sewage within the conduits (°C); Q i represents the flow rate of the i -th pipe segment (m3/s); D i denotes the diameter of the i -th segment (m); S i is the longitudinal slope of the i -th pipe segment; L i signifies the length of the i -th segment (km); and n represents the total number of pipe segments in the network.
4.
Objective Function F4: Influent Flow Fluctuation at the wastewater treatment plant (WWTP), calculated as Equation (4).
The stable operation of a WWTP requires influent flow to be as steady as possible. Violent flow fluctuations will shock biological treatment processes, affect pollutant removal efficiency, increase operational control difficulty, and require chemical dosing. Therefore, this study takes the influent volume fluctuation as one of the optimization objectives, aiming to smooth the flow process into the downstream WWTP through control. It should be noted that F2 serves as a monitoring indicator rather than an active optimization objective in the dynamic control framework. The WWTP inflow fluctuation is tracked to ensure that it remains within the biological treatment shock tolerance, but it is not embedded in the dynamic weight adjustment mechanism of DMPC. It should be noted that F4 serves as a monitoring indicator rather than an active optimization objective in the DMPC dynamic weight adjustment mechanism. This design choice is made for two reasons. First, the nature of F4 differs fundamentally from the other three objectives: whereas overflow risk, energy consumption, and methane emissions are directly coupled to the system’s real-time hydraulic risk state, influent flow fluctuation primarily reflects the temporal smoothness of the pumping strategy rather than the risk level itself. Second, during high-risk periods, effective overflow mitigation inherently requires rapid changes in pumping rates, which necessarily increases short-term inflow fluctuation; incorporating F4 into the dynamic weight adjustment would create an undesirable conflict with the safety-critical overflow objective. Instead, F4 is tracked to ensure that pumping strategies remain within the biological treatment shock tolerance of the downstream WWTP, serving as a soft operational constraint rather than a dynamically weighted objective.
F 4 = min 1 K k = 1 K Q WWTP ( t + k Δ t ) Q ¯ WWTP 2
where Q WWTP is the WWTP influent flow rate at the k -th discrete step within the prediction horizon (m3/s); Q ¯ WWTP represents the mean influent flow rate across the specified prediction horizon (m3/s); t denotes the current control instant (rolling optimization time); Δ t is the control interval (sampling period), which is assigned a value of 300 s (5 min); and k represents the total number of discrete steps in the prediction horizon.
To compute the aforementioned objective functions during dynamic optimization, the necessary variables are acquired through a coupled Python-SWMM interface. Static parameters (e.g., pipe diameter D , slope S , length L ) are pre-defined by the network topology. Dynamic hydraulic variables (e.g., instantaneous flow rate Q , cumulative node overflow volume, and pump operating states) are extracted directly from the SWMM computational engine at each discrete control step via the swmm_api and pyswmm libraries. These real-time states dynamically populate Equation (1) through Equation (4) to evaluate the fitness of each candidate control sequence.

2.2.3. Constraints

To ensure the executability of the control sequences obtained from the optimization in engineering practice, and to ensure the operational safety of the sewer network system during the dynamic control process, the model sets the following constraints:
The pumping flow rate of the pump units in the station is limited by their physical installed capacity and cannot exceed the design maximum flow rate. For the pumping behavior of any station i at time period t , the constraint can be expressed as Equation (5):
Q i , t p u m p Q i m a x
where Q i , t p u m p represents the actual pumping flow rate (m3/s) of station i at time t , and Q i m a x is the preset maximum design flow rate (m3/s). This constraint ensures that all pump units operate within their safe performance curves, avoiding problems such as cavitation and motor overload caused by excessive flow, thereby ensuring the operational stability of pump equipment under frequent start-stop conditions.
To prevent the deposition of suspended solids in the sewage within the pipes and avoid the generation of gases such as methane (CH4) and hydrogen sulfide (H2S) due to the anaerobic decomposition of sediments, the flow velocity in each pipe section must be maintained above the minimum scouring velocity. The constraint can be expressed as Equation (6):
v j , t v m i n
where v j , t is the average velocity (m/s) of pipe j at time t , and v m i n is the minimum allowable velocity (m/s). Based on engineering experience and relevant research, the speed is typically set to 0.6 m/s to reduce the risk of sediment deposition and organic biofilm accumulation. Under conditions where rainfall-derived infiltration and inflow (RDII) increases water volume, maintaining this velocity lower limit helps mitigate methane generation potential. It reduces long-term maintenance costs caused by pipeline siltation.

2.3. Evaluation Metrics

To systematically quantify the performance differences among various control strategies in terms of operational stability and spatial coordination, this section defines three key evaluation metrics: the water level standard deviation of individual forebays ( H s t d ), the system-wide forebay water level standard deviation ( S y s s t d ), and the coefficient of variation in spatial utilization (CVR). These metrics are all calculated based on the time-series data of individual forebay water levels and design water depth parameters, and subsequent sections will conduct comparative analyses of the strategies based on these metrics:
1.
Water level standard deviation of individual forebays ( H s t d )
For the forebay of the pumping station i , given N water level observations h i , t ( t = 1 , 2 , , N ) collected during the simulation period, the water level standard deviation is calculated as follows:
H std , i = 1 N t = 1 N ( h i , t h ¯ i ) 2
where h ¯ i = 1 N t = 1 N h i , t is the mean water level of the pumping station i . This metric reflects the fluctuation intensity of the individual forebay; a smaller value indicates smoother operation.
2.
System-wide forebay water level standard deviation ( S y s s t d )
To characterize the overall fluctuation level of the entire drainage network’s hydraulic state, the water level data from all M pumping station forebays at all time steps are merged into a single dataset (totaling M × N data points). The system-wide water level standard deviation is defined as:
Sys _ std = 1 MN i = 1 M t = 1 N ( h i , t h ¯ all ) 2
where h ¯ all = 1 M N i = 1 M t = 1 N h i , t is the overall mean water level of all pumping station forebays across all time steps. A lower S y s s t d value demonstrates that the entire system operates more stably.
3.
Coefficient of variation of spatial utilization (CVR)
To measure the balanced distribution of hydraulic loads among multiple pumping station forebays, the spatial utilization rate U i for each pumping station forebay i is first calculated based on its average water level h ¯ i and its designed maximum water depth H m a x , i :
U i = h ¯ i H max , i
Then, the mean U ¯ and standard deviation σ U of the spatial utilization rates across all M pumping station forebays are computed:
U ¯ = 1 M i = 1 M U i
σ U = 1 M i = 1 M ( U i U ¯ ) 2
Finally, the coefficient of variation in spatial utilization is defined as:
CVR = σ U U ¯
This dimensionless metric indicates the spatial synergy of the system. A lower CVR value implies that the utilization rates of the various pumping stations are closer to each other, representing better spatial coordination; conversely, a higher value indicates concentrated hydraulic loads and poor synergy.

3. Case Study

3.1. Study Area

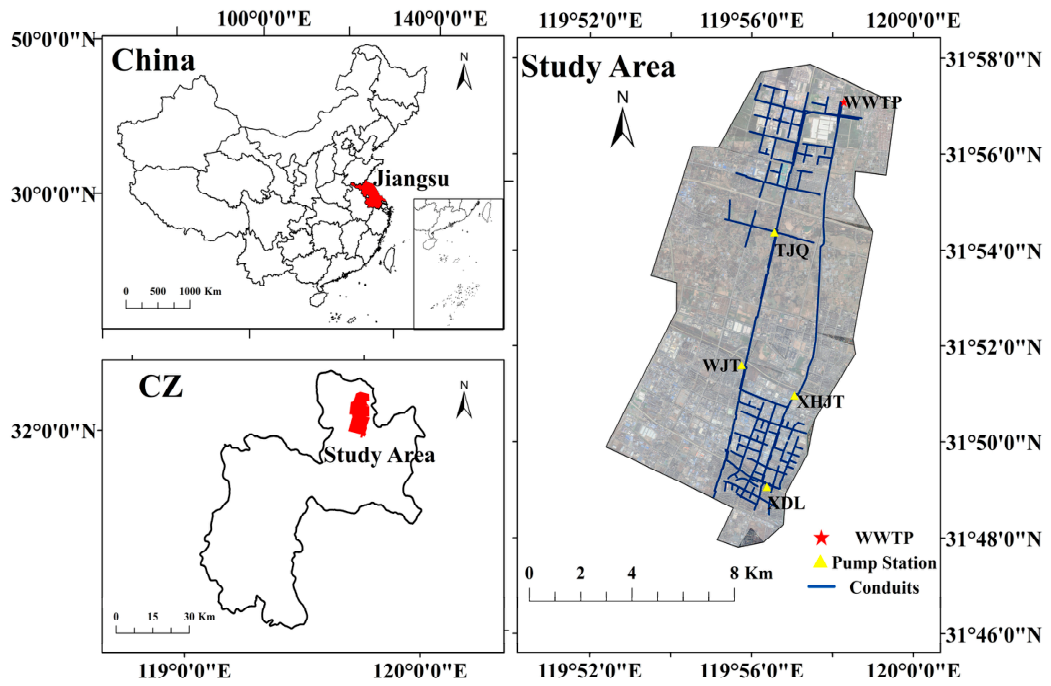
The study area is located in CZ city (Figure 3), with an area of 47.76 km2. The length of the pipe network is 130.42 km, and the pipe diameters range from 0.4 m to 2.4 m. The region has abundant rainfall, with an average annual rainfall of 1363.3 mm. The area network uses a separate drainage system, but it is significantly affected by rainfall-derived inflow and infiltration (RDII), and the pipe network’s operational load fluctuates greatly during the wet season. There are 4 pumping stations in this area, which are the TJQ pumping station, the WJT pumping station, the XDL pumping station, and the XHJT pumping station.
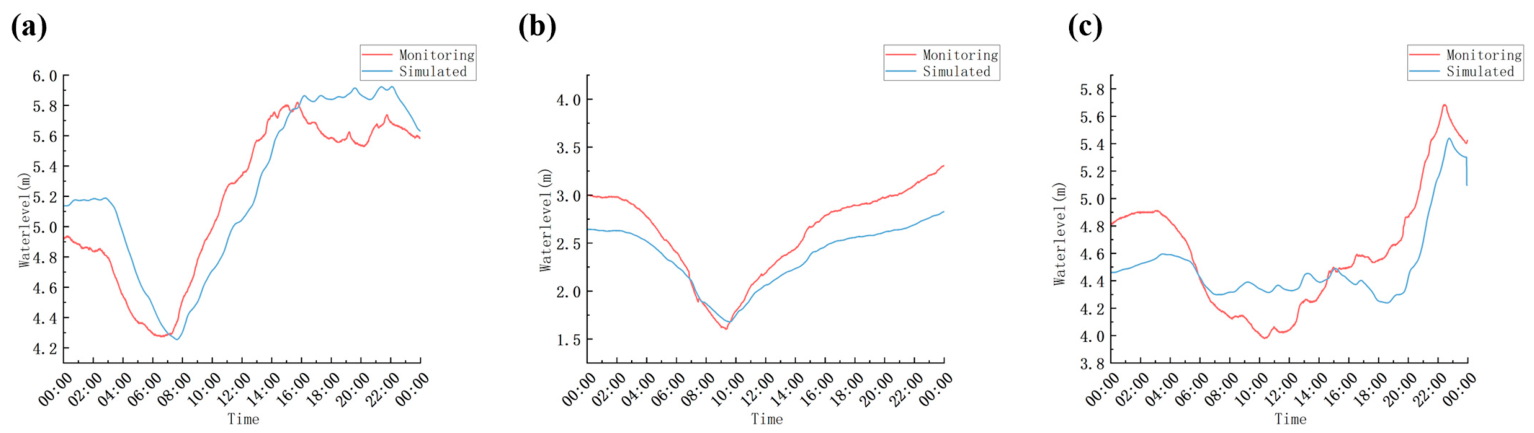
The hydraulic model of the CZ city sewer network was constructed using high-precision GIS data. To ensure the model’s fidelity and transparent parameter estimation, a rigorous calibration and validation process was conducted using historical monitoring data. To accurately capture the complex rainfall-derived infiltration and inflow (RDII) dynamics, the RTK unit hydrograph method was employed in the SWMM model. The R, T, and K parameters (representing the short-term, medium-term, and long-term RDII responses) were rigorously calibrated against actual influent monitoring data from the CZ city drainage network. Based on the monitoring records, the measured rainfall event on 16 May 2024, was selected for model calibration, achieving a Nash-Sutcliffe Efficiency (NSE) value greater than 0.65. Subsequently, rainfall events on 21 June and 28 June 2024, were selected for model validation. The simulated hydrographs closely matched the observed data in terms of shape, peak values, and overall dynamic trends, yielding NSE values of 0.62 and 0.59, respectively. These validation results meet the modeling requirements and indicate a satisfactory degree of fit, demonstrating that the calibrated model is reliable and can accurately evaluate the drainage system’s real-time operational states. The comparison between the simulated and measured water levels during the calibration and validation periods is illustrated in Figure 4, which demonstrates that the model can effectively capture the complex hydraulic dynamic responses of the sewer network.

3.2. Rainfall Scenarios

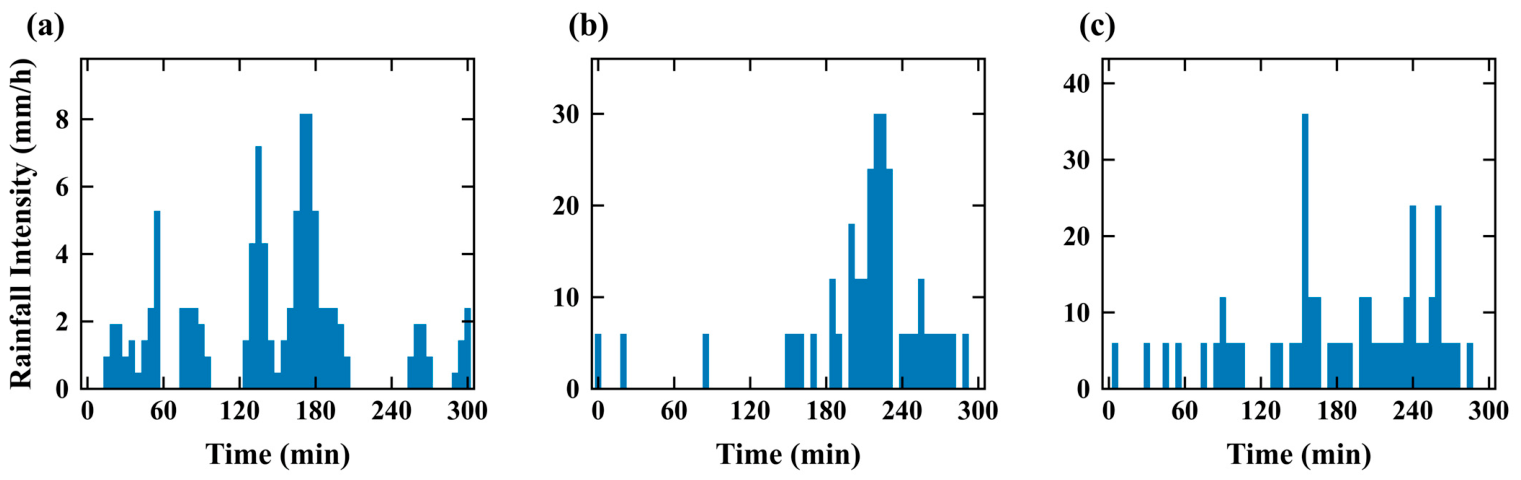
To comprehensively evaluate the adaptability and performance of sewer network operational strategies under different rainfall conditions, this study constructs three scenarios of varying rainfall intensities based on historical measured rainfall data: light, moderate, and heavy rain, as shown in Figure 5. Through this scenario design, the robustness and adaptability of different control strategies in multi-objective optimization can be systematically evaluated.

3.3. Control Strategies

To systematically evaluate the regulation performance of the proposed control framework under different operational conditions, this study designs three representative control strategies for comparative analysis: Rule-Based Control (RBC), Static Model Predictive Control (SMPC), and Dynamic Model Predictive Control (DMPC). The three strategies have obvious differences in control philosophies and decision-making mechanisms, and can reflect the application effects of optimal control methods in urban drainage systems from different perspectives.

3.3.1. Rule-Based Control (RBC)

As the most common regulation method in engineering practice, RBC is selected as the baseline control strategy. This method controls the start and stop of pumping stations and gates based on preset liquid level threshold rules. When the monitored water level exceeds the upper limit threshold, the pumping station starts to lower the water level; when the water level is below the lower limit threshold, the pumping station stops running. This control strategy has a simple structure and low implementation cost. However, because it does not consider the future evolution trend of the system and cannot balance multiple operational objectives, it is often difficult to simultaneously meet the needs of overflow prevention, energy saving, and emission reduction under complex rainfall scenarios. Therefore, RBC is used as a reference baseline to evaluate the improvement effect of MPC control strategies.

3.3.2. Static Model Predictive Control (SMPC)

SMPC adopts a rolling horizon model predictive control framework. At each control step, based on the current system state and future rainfall predictions, it conducts multi-objective optimization on the control sequence within the prediction horizon and executes only the first control action. Unlike RBC, this strategy can explicitly consider the dynamic characteristics and future evolution trends of the system. In SMPC, the objective function weights adopted in the multi-objective optimization remain unchanged under all operational conditions, meaning that the same set of weight parameters is used to select the Pareto optimal solutions in different rainfall scenarios. This study selects overflow prevention as the main control objective, with its weight set to 0.8, while the weights for pumping station energy consumption and methane emissions are 0.1 and 0.1, respectively [38]. This weight combination reflects to a certain extent the principle of prioritizing the safe operation of the drainage system under rainfall conditions.

3.3.3. Dynamic Model Predictive Control (DMPC)

DMPC is also based on a receding horizon optimization framework and is consistent with SMPC in control structure, prediction model, and optimization algorithm. However, its decision preferences no longer use fixed weights, but instead adjust weights online according to the system’s operational risk state, achieving adaptive updates of multi-objective trade-offs. Specifically, DMPC constructs risk factors using state indicators such as water levels at key nodes and inflow intensity that reflect the system’s safety margins. When the risk level is high, the weight of the overflow mitigation objective is increased to prioritize the safe operation of the system. When the risk level decreases, the weights for energy and methane objectives are appropriately increased to avoid the energy and environmental costs caused by excessive pumping.
The multi-objective optimization in this study considers three core objectives: total node overflow volume F 1 , pumping station energy consumption F 2 , and methane emission potential F 3 . DMPC updates the objective weights online based on a comprehensive risk factor.
To quantify the safety risks faced by the system at the control moment, this study constructs a comprehensive risk factor η k [ 0 , 1 ] , where a larger value indicates that the system is closer to the overflow risk state. This factor comprehensively considers the degree of water level exceeding the limit in the pump station forebay and the proportion of the inflow load, and is defined as Equation (13):
η k = max H k H safe H max H safe , Q k Q cap
where H k is the current forebay water level of the pumping station at the current time step (m); H safe is the safe warning water level (m); H max is the maximum design water level (m); Q k represents the current inflow rate (m3/s); and Q cap denotes the design pumping capacity of the station (m3/s).
After obtaining η k , the DMPC updates the weights of the three core objectives according to the following rules. First, determine the overflow prevention objective weight w 1 ( k ) . To ensure smooth weight changes and avoid strategy oscillation, this study adopts a linear interpolation method:
w 1 ( k ) = w 1 min + w 1 max w 1 min η k
where w 1 min and w 1 max are the minimum and maximum values of the overflow prevention weight, respectively. In this study, w 1 min is set to 0.5, and w 1 max is set to 0.9.
The remaining weight 1 w 1 ( k ) is equally distributed between the energy consumption objective w 2 ( k ) and the methane emission potential objective w 3 ( k ) , to obtain the complete weight vector Equation (15):
w ( k ) = w 1 ( k ) ,   w 2 ( k ) ,   w 3 ( k )
w 1 ( k ) + w 2 ( k ) + w 3 ( k ) = 1
This design ensures that the weights always satisfy Equation (16) and can change smoothly with the risk state, without introducing unstable control preferences.
The main difference between the two is that DMPC can adaptively adjust the weight parameters in the multi-objective optimization according to the different operating conditions of the system. Through the above dynamic weight adjustment mechanism, the pumping station can make adaptive trade-offs among multiple objectives according to different scenarios, thereby realizing a more flexible control strategy. This can better meet the comprehensive operational requirements of the urban drainage system in terms of safety, economy, and environmental benefits.

4. Results and Discussion

4.1. Multi-Objective Trade-Off Relationships

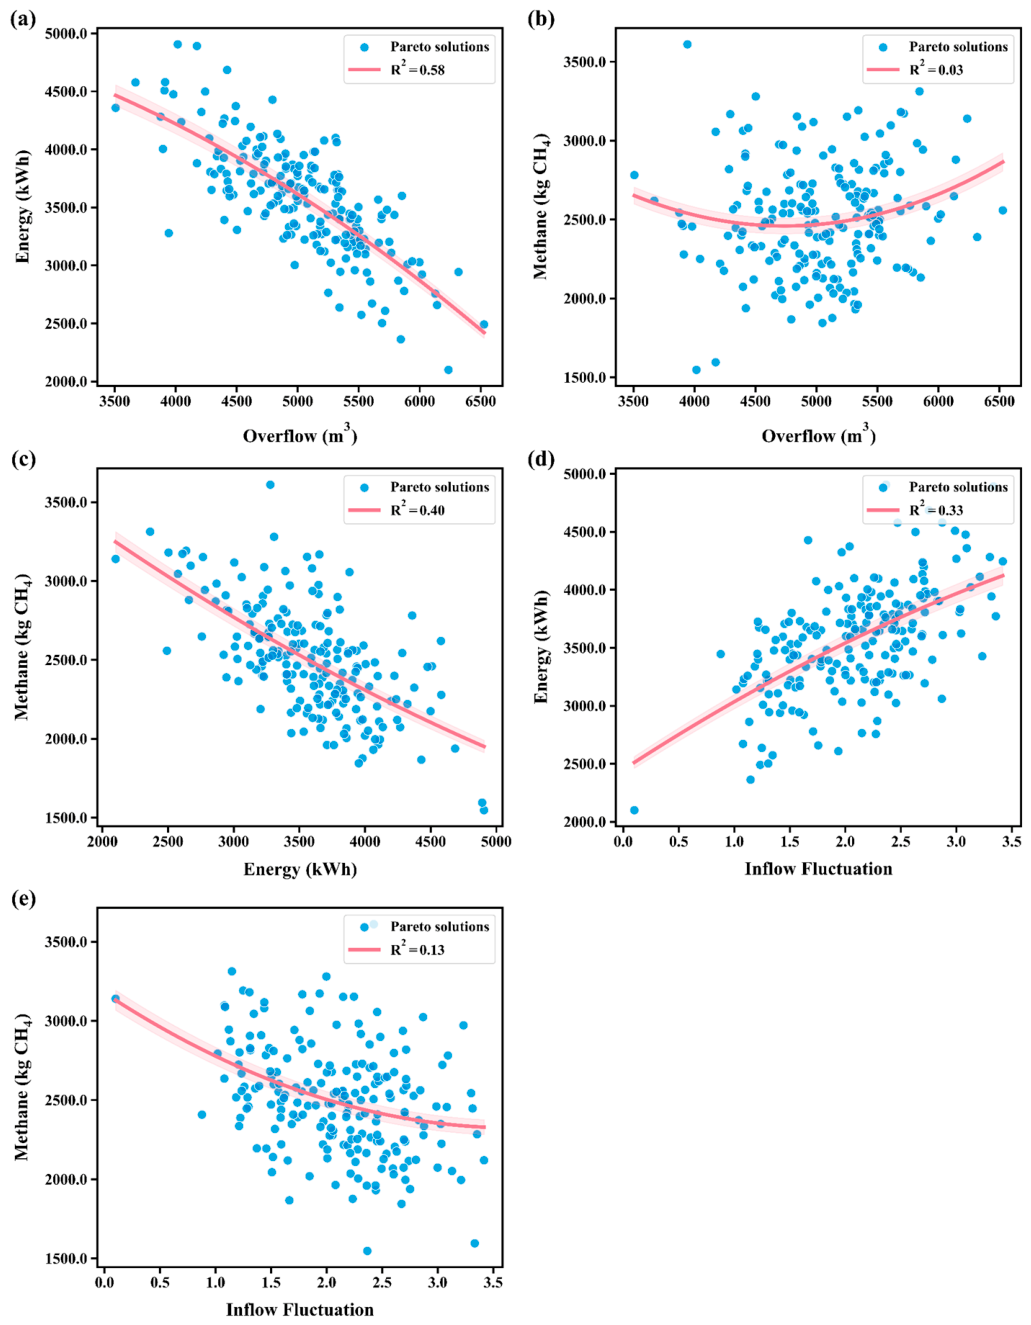
To characterize the fundamental trade-off structure among the four evaluation indicators before analyzing real-time control performance, an offline multi-objective optimization was conducted for each rainfall scenario. The NSGA-II algorithm was executed with a population size of 100 and 100 generations, without any real-time computational constraint, to ensure full convergence to a well-distributed Pareto front. Figure 6 shows the observed statistical associations and trade-off tendencies among node overflow volume, wastewater treatment plant inflow fluctuation, pumping station energy consumption, and methane emission potential during the multi-objective optimization process.
Figure 6a presents a typical Pareto trade-off relationship between node overflow volume and pumping station energy consumption. The quadratic fitting R2 = 0.58, indicating a moderate nonlinear negative association between the two. When the control strategy emphasizes minimizing overflow risk, the system usually needs stronger emptying capacity to release hydraulic pressure, thereby bringing higher pumping station operational energy consumption; conversely, when the control strategy leans towards minimizing energy consumption, energy saving can be achieved by reducing operational intensity or decreasing start-stop frequency, but the system water level is more likely to rise and increase the overflow risk. This reflects the conflict between safety and economy in the operational control of drainage systems.
The imperfect correlation between overflow and energy (R2 = 0.58) reveals that approximately 42% of the variance is unexplained by a simple monotonic relationship. This variance is physically attributed to the network’s in-line storage buffering capacity and spatial routing lags, which temporarily decouple instantaneous pumping effort from downstream overflow events, as well as the distinct pump characteristic curves across the four stations, which cause different energy costs for similar hydraulic outcomes. The highly non-linear dynamics of RDII generation further prevent a strictly proportional response, highlighting the necessity for advanced multi-objective optimization rather than simple linear control rules.
As shown in Figure 6b, the overflow volume and methane emission indicators show a certain change trend overall, but the scatter distribution is relatively discrete, indicating that there is no stable monotonic mapping relationship between the two. Due to the complex characteristics of drainage systems, methane generation is not only affected by hydraulic conditions, but is also closely related to factors such as wastewater quality, temperature, and pipeline deposition status, making it difficult to optimize directly through a single overflow control objective.
As shown in Figure 6c, there is a discernible but weak negative trend between pumping station energy consumption and methane emission indicators (R2 = 0.40). This indicates that high-intensity operation (i.e., high energy consumption) may suppress methane generation by shortening wastewater retention time and reducing anaerobic environments. However, this result reflects a statistical association based on hydraulic states and is not yet sufficient to directly infer changes in actual methane emission fluxes.
Furthermore, it is important to emphasize that R2 values substantially below 1 across these correlations are not a limitation of this analysis. Instead, they confirm the presence of genuine, non-trivial trade-offs among the objectives. If R2 were close to 1, the objectives would be essentially collinear, and multi-objective optimization would be unnecessary. The observed imperfect correlations demonstrate that each objective captures distinct aspects of system performance, namely overflow risk, operational cost, and carbon emission potential, which cannot be simultaneously minimized by a simple linear control policy.
Figure 6d,e introduce the relationship between wastewater treatment plant inflow volume fluctuation and other objectives. Figure 6d shows that flow fluctuation is positively correlated with energy consumption (R2 = 0.33), and greater fluctuation is usually accompanied by frequent pump starts and stops, with corresponding increases in energy consumption. In Figure 6e, flow fluctuation is weakly negatively correlated with methane (R2 = 0.12), which may originate from the fact that when fluctuation intensifies, the water flow velocity increases and the retention time shortens, which has a certain inhibitory effect on methane generation, but the degree of impact is limited.
Discussing the aggregated data of Figure 6, it can be seen that there are differentiated correlation strengths among the four objectives: there is a significant trade-off relationship between node overflow volume and pumping station energy consumption, the correlation between pumping station energy consumption and methane emission potential is relatively low, and the wastewater treatment plant inflow volume fluctuation, as an operational stability indicator, has a weak correlation with energy consumption and methane. However, it is important to emphasize that these moderate-to-weak correlations (R2 ranging from 0.12 to 0.58) are not indicative of poor analysis, but rather demonstrate that the objectives represent genuinely conflicting operational criteria. If the relationships were perfectly linear, a simple single-objective control strategy would suffice. This structural conflict is precisely what necessitates a multi-objective optimization approach. Ultimately, these complex trade-off relationships provide the theoretical basis for the dynamic weight adjustment of DMPC. The mechanism is designed specifically to navigate this conflict by adaptively prioritizing different objectives according to the real-time risk state: when the safety risk is high, it prioritizes minimizing the node overflow volume; under low rainfall intensity conditions, it balances the optimization of pumping station energy consumption and methane emission potential, while controlling the wastewater treatment plant inflow volume fluctuation as a constraint condition.

4.2. Control Processes Under Different Rainfall Scenarios

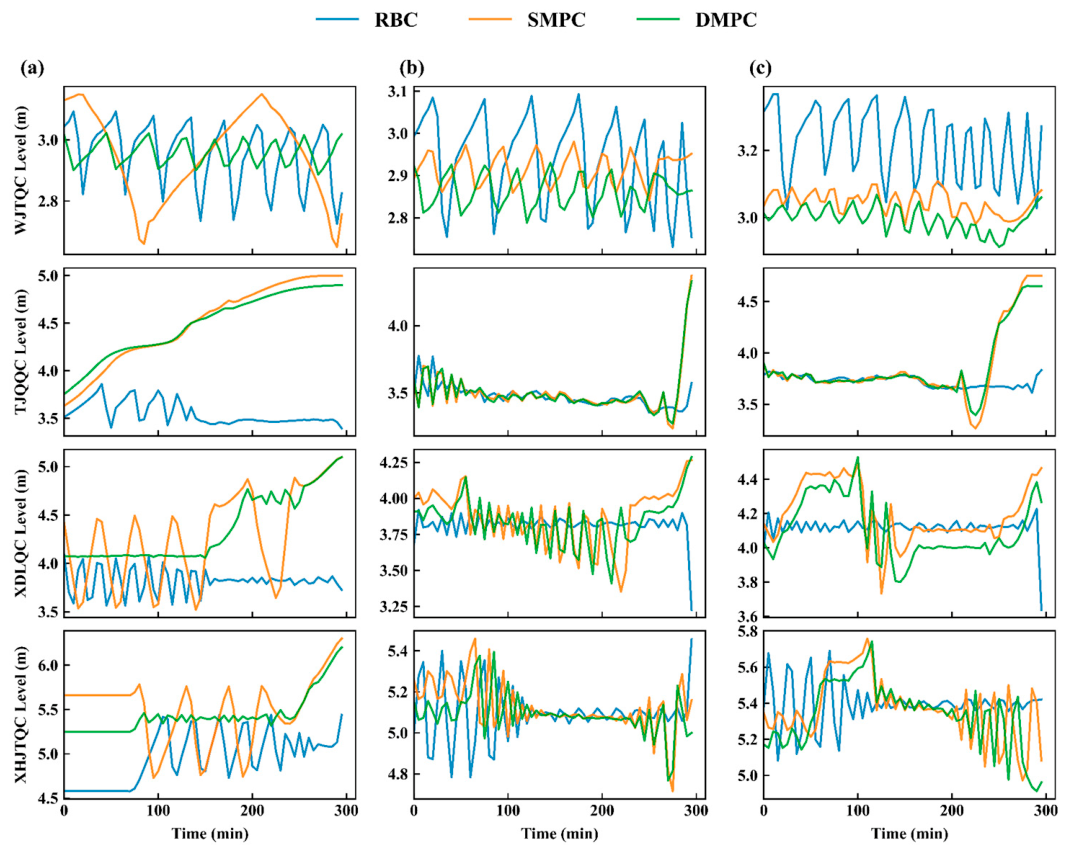
To deeply reveal the essential differences among the three strategies of Rule-Based Control (RBC), Static Model Predictive Control (SMPC), and Dynamic Model Predictive Control (DMPC) in terms of operational stability and spatial synergy, this section analyzes the forebay water level change processes of four pumping stations (WJT, TJQ, XDL, and XHJT) under three typical rainfall scenarios: P1 (light rain), P2 (moderate rain), and P3 (heavy rain) (Figure 7). By calculating the water level standard deviation of individual forebays ( H s t d ) and the system-wide forebay water level standard deviation ( S y s s t d ), the operational stability of the pumping station forebays is quantitatively evaluated. Meanwhile, based on the design water depth of the forebays, the spatial utilization rate and its coefficient of variation (CVR) are introduced to characterize the balanced distribution degree of hydraulic loads among multiple facilities, thereby systematically evaluating the spatial synergistic efficiency of each strategy (Table 1).
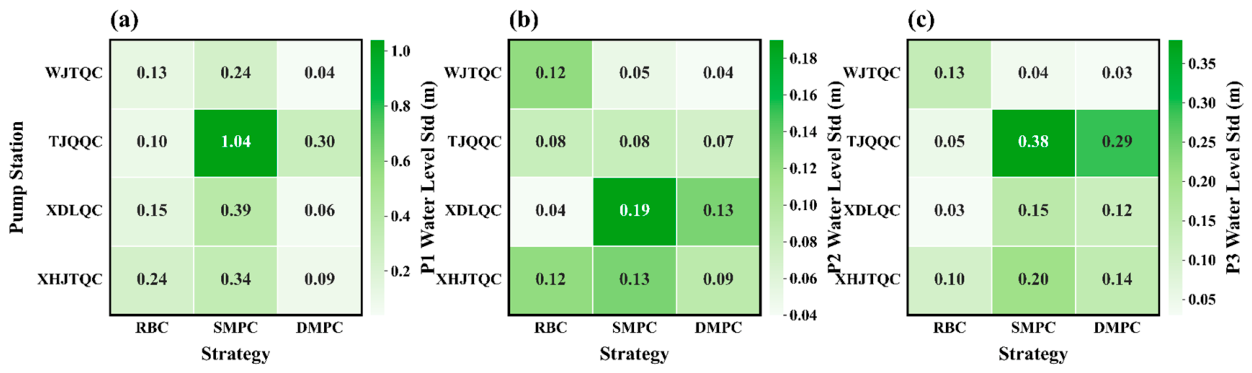
To quantitatively characterize the impact of different control strategies on the system’s hydraulic response, this study selects the pumping station forebay water level standard deviation ( H s t d ) as the indicator for local operational stability, and combines the overall system water level fluctuation characteristics to comparatively analyze the control effects under different strategies (Figure 8).
The operational stability analysis shows that the RBC strategy, due to its start-stop logic relying on fixed thresholds, leads to higher overall system volatility in all scenarios, with S y s s t d ranging from 0.80 to 0.83, and the H s t d of each pumping station is generally large. For example, under the P1 light rain scenario, the H s t d of the XHJT forebay reaches 0.24 m, reflecting the water level fluctuation caused by frequent starts and stops. Through feed-forward prediction optimization, the SMPC strategy shows fluctuation suppression capability on some forebay water levels, such as the H s t d of the WJT forebay dropping to 0.04 m under the P3 scenario. However, its fixed weight mode is prone to uneven regulation under complex working conditions, typically manifested by the abnormally high fluctuation of H s t d = 1.04 m in the TJQ forebay under the P1 scenario. In contrast, the DMPC strategy, relying on its dynamic weight mechanism, achieves the lowest fluctuation level in all scenarios: under the P1 scenario, DMPC reduces the H s t d of the WJT forebay, XDL forebay, and XHJT forebay to 0.04 m, 0.06 m, and 0.09 m, respectively, which are 69.2%, 60.0%, and 62.5% lower than the RBC strategy. This indicates that under conditions of low rainfall intensity, DMPC can effectively reduce unnecessary high-frequency operations and make the system’s operational state approach stability by optimizing the start-stop sequence and control strategy. Under the P3 scenario, while maintaining a S y s s t d of 0.85, DMPC optimizes the H s t d of the most violently fluctuating TJQ forebay from 0.38 m under SMPC to 0.29 m. These quantitative results confirm that DMPC can dynamically adjust the control strategy based on real-time hydraulic states, achieving optimal fluctuation suppression on a system-wide scale.

4.2.1. Spatial Coordination

The advantages of DMPC are reflected not only in the stable water level control of a single pumping station but also in the spatial collaborative scheduling capability among multiple facilities. Under the RBC strategy, the water level changes in the forebays of each pumping station are mainly controlled by local thresholds, lacking synergy between different nodes, resulting in significant differences in average water levels. For example, in the P1 scenario, the average water level of the XHJT forebay is 2.14 m higher than that of the WJT forebay, reflecting that the system’s storage capacity is in a passive and scattered utilization state, making it difficult to achieve overall optimization. Although SMPC introduces a global optimization framework, it still exposes the problem of uneven load distribution in some scenarios. In the P1 scenario, the TJQ forebay bears excessive storage pressure, while the water levels of other pumping stations remain at relatively low levels. This strategy of sacrificing the operational status of local facilities for the improvement of overall indicators may lead to local equipment being in high-load conditions for a long time, which is unfavorable to the sustainable operation of the system.
The CVR values of the RBC strategy in P1, P2, and P3 scenarios are 0.158, 0.173, and 0.183, respectively, which are all the highest, indicating that its control logic depends entirely on local feedback and cannot coordinate load distribution at the system level, resulting in low utilization efficiency of storage resources. Although the CVR values of the SMPC strategy are lower than those of RBC (0.121, 0.127, and 0.134 in P1, P2, and P3), its fixed weight mode still leads to excessive local loads in specific scenarios. For example, the 0.49 utilization rate of the TJQ forebay in P1 is significantly higher than other pumping stations, reflecting the limitations of static optimization. The DMPC strategy achieves the lowest CVR values in all scenarios (0.102, 0.105, and 0.098 in P1, P2, and P3), proving that its dynamic decision-making mechanism can fully consider the design capacity differences in each pumping station and distribute the rainfall inflow load relatively evenly to the available storage space of the entire network.
Further analyzing the evolution of control performance with rainfall intensity, it can be found that the DMPC strategy has the ability to adaptively adjust control priorities according to the scenario. In the P1 light rain scenario, its optimization focuses on operational stability and economy, manifested as the lowest volatility and balanced load distribution. As the rainfall intensity increases to P2 and P3 scenarios, the system safety demand rises. While maintaining optimal synergy (lowest CVR) and low volatility, DMPC strategically adjusts the water levels of each pumping station to pre-release network capacity. For example, in P3, the average water level of the XHJT forebay is reduced to 4.99 m, thereby accumulating larger redundant regulation space to cope with rainfall inflow.

4.2.2. Comprehensive Discussion

Synthesizing the above analysis, the three control strategies present a clear performance gradient in terms of operational stability, spatial synergy, and scenario adaptability. RBC, as the engineering benchmark, primarily relies on local threshold feedback for control, exhibiting typical characteristics of high volatility and low synergy, making it difficult to meet system-level scheduling requirements under complex conditions. SMPC realizes the transition from passive response to proactive scheduling by introducing prediction and rolling optimization mechanisms, but its fixed weight structure limits its regulatory flexibility in different scenarios, which easily leads to localized load concentration. DMPC demonstrates the best performance in both fluctuation suppression and spatial synergy. Its core advantage does not stem from the reinforcement of a single objective, but from dynamically adjusting the multi-objective preference structure, allowing the system to prioritize stability and economy under low-load conditions and strengthen safety constraints and storage capacity under high-load conditions, achieving a better comprehensive trade-off under conflicting objectives.

4.3. Quantitative Evaluation of Optimization Benefits

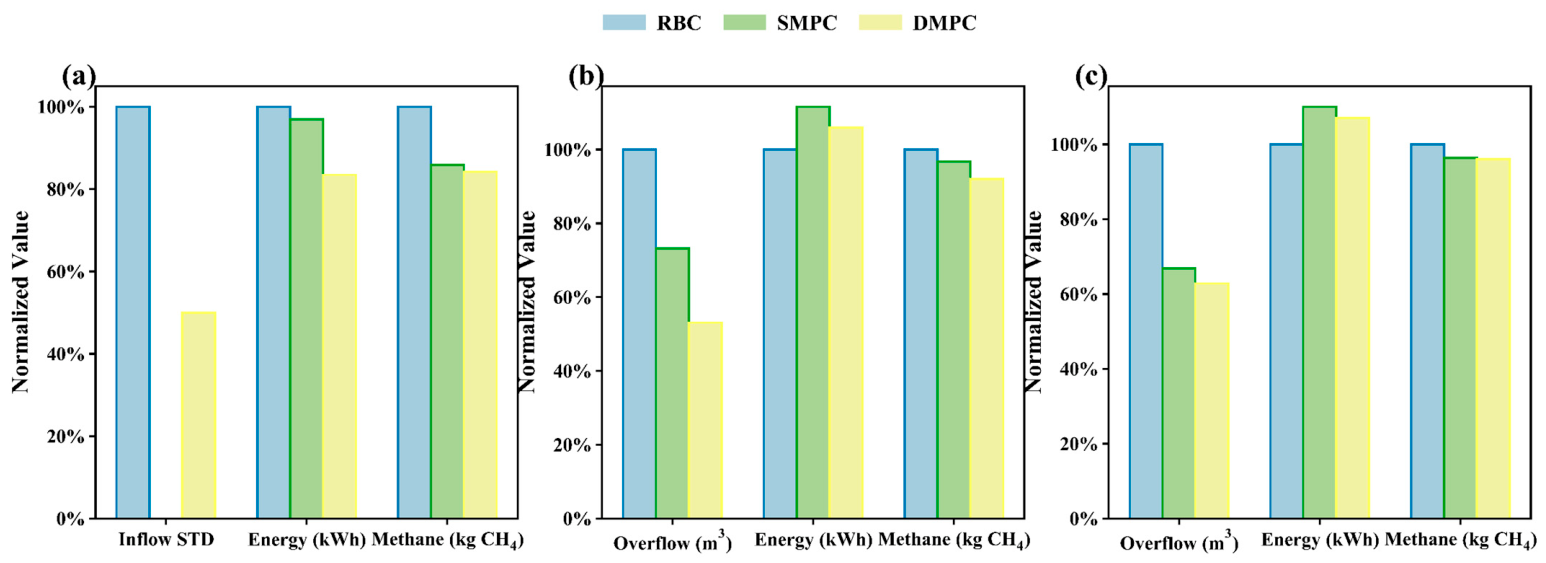
To uniformly evaluate the comprehensive performance of the three control strategies (RBC, SMPC, DMPC) under different rainfall scenarios, Figure 9a–c normalize each indicator to 100% based on RBC, thereby visually presenting the relative improvements of SMPC and DMPC across different objective dimensions. The comprehensive analysis shows that the DMPC strategy, with its dynamic weight mechanism, achieves superior and balanced multi-objective synergistic benefits in all rainfall scenarios.
Specifically, in the P1 light rain scenario, the overall system load is low and no overflow risk is faced, so the optimization focus of the control strategy lies in improving operational economy and stability. Figure 9a shows that DMPC presents comprehensive benefits significantly better than RBC in terms of influent volume equilibrium, energy consumption, and methane emissions. DMPC reduces the Inflow STD from 0.9208 to 0.46, indicating its ability to more effectively suppress influent flow fluctuations and enhance the smoothness of the inflow process. DMPC’s energy consumption dropped from 2070.5 kWh to 1728.81 kWh, a reduction of 16.50%, reflecting the greater energy-saving potential of dynamic control strategies under low-intensity rainfall. DMPC’s methane emission potential decreased from 1748.4 kg to 1471.96 kg, a reduction of 15.81%, indicating that while reducing the volume of water conveyed and unnecessary emptying actions, it also brings better low-carbon performance. This confirms the performance of dynamic strategies in tapping energy-saving and carbon-reduction potential under low-load conditions.
In the P2 moderate rain scenario, the system begins to face significant hydraulic response uncertainty and overflow risks, requiring the control strategy to trade off between mutually restrictive objectives. Figure 9b shows that DMPC demonstrates its core advantages here, achieving a precipitous reduction in overflow volume by 46.9%, significantly better than SMPC’s 26.8%. Compared to RBC, DMPC’s energy consumption rose from 1919.38 kWh to 2032.83 kWh, an increase of only 5.91%, showing that when safe operation is prioritized, the system needs to pay a certain energy cost in exchange for network safety. However, DMPC still reduced energy consumption by 5.10% compared to SMPC, indicating that the dynamic weight mechanism can avoid excessive pump operation caused by fixed weights. Meanwhile, the methane emission potential was further reduced by 7.99%. This series of data reveals that the fixed weight of SMPC easily leads to increased energy consumption due to excessive pumping to achieve safety goals, while DMPC achieves more precise regulation through dynamic adjustments, thereby maximizing economy and low-carbon performance while effectively ensuring system safety.
In the P3 heavy rain scenario, the primary contradiction of control is concentrated on the risk of overflow. Figure 9c shows that under this condition, DMPC still maintains leading overflow control capability, with a 37.2% reduction compared to RBC, superior to SMPC’s 33.1%. However, the changes in energy consumption and methane emission potential are small and comparable to SMPC levels. This indicates that in high-risk scenarios, DMPC is better able to utilize limited storage space for regulation during critical periods.
This further illustrates that when safe operation is prioritized, DMPC ensures that resources are primarily allocated to risk mitigation, yet its dynamic framework prevents a one-sided performance bias. Looking at the performance across the three rainfall intensities, the RBC strategy is limited by its passive threshold response mechanism, making it difficult to maintain stable comprehensive performance across varying intensities. While SMPC improves operational efficiency through model predictive optimization, its static weight configuration constitutes an inherent constraint, prone to one-sided tendencies in certain scenarios—leading to insufficient economy during low-risk periods and high economic costs during high-risk periods. The core strength of DMPC lies in its dynamic weighting mechanism, which transforms system states and rainfall data into real-time objective preferences, creating a scenario-based adaptation among safety, economy, and low-carbon goals. By prioritizing storage utilization for overflow mitigation when risks escalate, and shifting toward energy and emission reduction when risks subside, DMPC avoids efficiency losses associated with being overly conservative or aggressive. Consequently, DMPC exhibits more balanced multi-objective gains and more stable comprehensive performance across diverse rainfall intensities, validating its efficacy and regulatory potential as a collaborative control framework for uncertain rainfall conditions.

4.4. Strategy Robustness

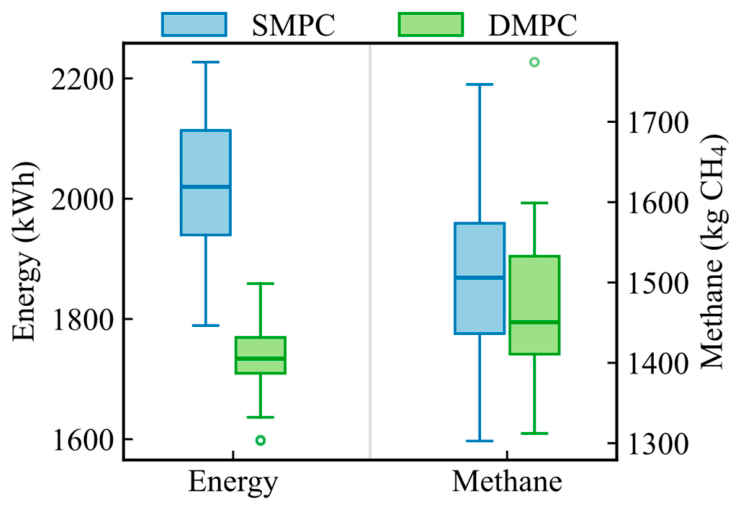
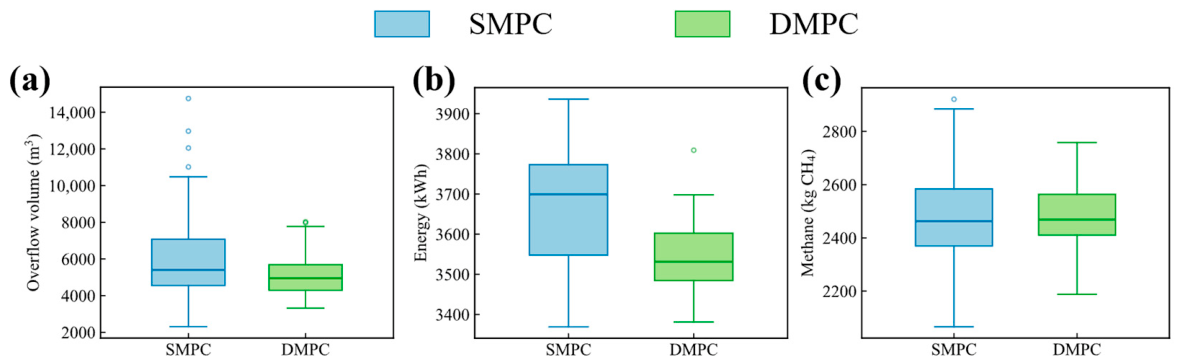
Under ideal conditions without considering input uncertainty, the aforementioned results have verified the overall control performance of different control strategies under various rainfall scenarios. However, in practical applications, rainfall forecast errors and online monitoring errors are inevitable, and control strategies need to maintain stable performance under uncertain rainfall. Therefore, this section further evaluates the impact of rainfall prediction uncertainty on optimization strategies to test their adaptability and robustness under uncertain rainfall inputs. 50 sets of random uncertain rainfall events were generated by applying independent perturbations to the rainfall intensity at each time step within a ±20% range [38]. P1 and P3 were selected for robustness testing as they represent the boundaries of system hydraulic loads: the low-load period focused on economy and the high-load period focused on safety, and SMPC and DMPC were run separately for analysis.
As shown in Figure 10, under the P1 light rain condition, the overall system load is low and no overflow risk occurs. Therefore, the impact of rainfall uncertainty on control strategies is mainly reflected in the robustness of economic and low-carbon operational indicators (energy consumption and methane emissions). Statistical results show that DMPC performs better in both average performance and sensitivity. In terms of energy consumption, the mean energy consumption of DMPC is 1731.58 kWh, significantly lower than SMPC’s 2018.29 kWh, indicating that DMPC can more fully exploit energy-saving potential under low rainfall intensity. More importantly, DMPC’s sensitivity to uncertain rainfall inputs is significantly lower, with its energy consumption standard deviation (SD) at approximately 54 kWh, lower than SMPC’s ~105 kWh, reducing the coefficient of variation (CV) from 5.2% to 3.1%. This indicates that DMPC can maintain more stable energy levels when facing different uncertain rainfall processes, exhibiting stronger robustness. In terms of methane emissions, the mean for DMPC is 1470.17 kg CH4, a 3.10% decrease compared to SMPC’s 1517.19 kg CH4. Meanwhile, the degree of dispersion also converged: the methane SD decreased from ~104 kg to ~83 kg, and the CV decreased from 6.9% to 5.8%. Overall, uncertainty in the light rain scenario does not trigger systemic safety risk shifts, but DMPC maintains more stable energy and methane levels under uncertain inputs, reflecting superior robustness and adaptability.
In the P3 heavy rain scenario, rainfall prediction uncertainty significantly amplifies differences in system hydraulic responses, making overflow volume the most sensitive risk variable. As shown in Figure 11, DMPC achieves both better expected performance and stronger robustness in overflow control. For overflows, the mean for DMPC is 5176.18 m3, 16.88% lower than SMPC’s 6226.99 m3. Simultaneously, DMPC’s overflow SD decreased from 2689.24 m3 to 1127.47 m3, and the CV fell from 43.19% to 21.78%, indicating significantly lower sensitivity to uncertain inputs. Furthermore, DMPC’s overflow interquartile range (IQR) converged from 2524.71 m3 to 1401.83 m3, with more robust performance in high-risk zones: its 95th percentile overflow decreased by 36.16% compared to SMPC. This suggests that under adverse perturbations, DMPC better inhibits risk propagation and reduces extreme deviations. Energy metrics in heavy rain show small mean differences but distinct robustness disparities. DMPC’s mean energy consumption was 3595.14 kWh, only 1.45% lower than SMPC’s 3647.96 kWh, indicating similar operational costs when safety goals dominate; however, its dispersion converged markedly, with SD decreasing by 33.19% and IQR by 38.94%, meaning DMPC maintains more consistent energy performance. For methane, DMPC’s mean was 3.72% higher than SMPC’s, showing that to prioritize overflow suppression in heavy rain, the strategy may increase carbon emission potential by altering hydraulic retention times via more aggressive conveyance. However, the overall volatility of methane remained limited, with sensitivity to uncertainty being significantly weaker than overflow. Thus, the primary source of robustness disparity in P3 remains overflow control, where DMPC demonstrates a stronger advantage for safety-oriented control.
Synthesizing P1 and P3, it is evident that the impact of rainfall uncertainty on control strategies is highly scenario-dependent. In light rain, uncertainty primarily affects economic indicators like energy and methane, where DMPC shows a robust energy-saving advantage. In heavy rain, uncertainty significantly amplifies the dispersion and extreme deviations of overflow risks; here, DMPC demonstrates superior robustness in key risk metrics by reducing average overflow while significantly suppressing extreme overflow risks, thereby enhancing overall system safety against uncertain disturbances. It should be noted that the present robustness analysis focuses exclusively on rainfall forecast errors as the primary source of input uncertainty. In practical field deployments, additional uncertainties arise from water level sensor noise and communication delays, which may further affect real-time control performance. Future work should consider integrating state estimation techniques, such as Kalman filtering, to explicitly account for these sensor-related uncertainties.

5. Conclusions

This study addresses the synergistic needs of safe operation, energy saving, and low-carbon emission in the operation of separate sewer network pumping stations. It constructs a real-time control framework coupling the SWMM hydraulic model and MPC-NSGA-II multi-objective optimization, and proposes a dynamic synergistic optimization (DMPC) strategy that adjusts preferences online based on system risk states.
The multi-objective optimization framework effectively achieves the synergistic trade-off among overflow control, energy reduction, and carbon emission mitigation. Research results show a significant trade-off between overflow volume and pump energy consumption, while methane emission indicators and hydraulic states exhibit complex coupling characteristics. The proposed MPC-NSGA-II framework can generate Pareto optimal solution sets covering different preferences, providing flexible and scientific decision support for operational control.
Compared to RBC and SMPC, DMPC achieves a dynamic migration of control focus with rainfall intensity and system load through an adaptive weight adjustment mechanism based on system risk status. Based on network topology and pump capacity, DMPC optimizes water distribution among nodes and forebays, making network space utilization more balanced and avoiding local frequent fluctuations and resource waste, thereby achieving better economy and reliability at the system level. In addition, in light rain scenarios, the system focuses more on the optimization of energy and methane; in moderate and heavy rain scenarios, it prioritizes system safety, significantly reducing overflow risks while keeping energy and emission indicators within reasonable ranges.
Considering rainfall prediction uncertainty, DMPC not only outperforms comparison strategies in expected performance but also shows better stability in indicator volatility. Especially in heavy rain scenarios, it can effectively suppress the high-level dispersion and extreme deviations of overflow risk, improving the overall safety of the system under uncertain disturbances.
In general, the real-time multi-objective control framework proposed in this study can improve energy efficiency and low-carbon operation while ensuring the safe operation of the system, providing a feasible technical path for the intelligent control of pump station clusters. Future work can further integrate probabilistic rainfall forecasting to improve risk control under extreme events, and conduct verification under different urban scales and drainage systems to promote the application and long-term benefit evaluation of this research in broader engineering scenarios.
Additionally, computational acceleration of the optimization loop should be pursued to achieve strict real-time execution within the 5 min control interval. A promising strategy is the development of data-driven surrogate models—such as artificial neural networks (ANNs) or Gaussian process regression (GPR)—trained on historical SWMM simulation outputs to rapidly approximate objective function values and pre-screen candidate control sequences. By integrating these surrogate models into the NSGA-II evaluation loop, the number of full SWMM simulations required per control step can be substantially reduced, potentially bringing per-step computation time from minutes to seconds while maintaining solution quality. Beyond computational acceleration, future studies should also integrate data assimilation techniques, such as Kalman filtering, to enhance robustness against real-time sensor noise and measurement drift in pump station forebays. Furthermore, incorporating equipment degradation models and life-cycle economic costs associated with high-frequency pump switching into the multi-objective optimization framework will be a vital next step for transitioning this control strategy into full-scale field deployment.

Author Contributions

Conceptualization, C.X. and X.T.; methodology, C.X. and X.T.; Investigation, Y.R. and F.X.; Visualization, Y.R. and S.W.; Writing—original draft, C.X. and Y.R.; Writing—review and editing, X.T., M.L., Y.Z., F.Z. and J.L.; Funding acquisition, C.X., X.T. and J.L. All authors have read and agreed to the published version of the manuscript.

Funding

This research was funded by the National Key Research and Development Program of China, grant number 2023YFC3804705.

Informed Consent Statement

Not applicable.

Data Availability Statement

The original contributions presented in the study are included in the article; further inquiries can be directed to the corresponding author.

Acknowledgments

This work was supported by the School of Environment and Energy Engineering and the Key Laboratory of Urban Stormwater System and Water Environment (Ministry of Education) at Beijing University of Civil Engineering and Architecture.

Conflicts of Interest

Author Fengchang Zhao was employed by the company CAUPD Beijing Planning & Design Consultants Co., Ltd. The remaining authors declare that the research was conducted in the absence of any commercial or financial relationships that could be construed as a potential conflict of interest.

Abbreviations

The following abbreviations are used in this manuscript:
RDIIRainfall-derived infiltration and inflow
RBCRule-Based Control
RTCReal-Time Control
MPCModel Predictive Control
MOPMulti-objective Optimization Problem
NSGA-IINon-dominated Sorting Genetic Algorithm II
SWMMStorm Water Management Model
US EPAU.S. Environmental Protection Agency
SBXSimulated Binary Crossover
PMPolynomial Mutation
CH4Methane
WWTPWastewater treatment plant
H2SHydrogen sulfide
CVRCoefficient of variation in spatial utilization
SMPCStatic Model Predictive Control
DMPCDynamic Model Predictive Control
STDstandard deviation
SDstandard deviation
CVcoefficient of variation
IQRinterquartile range

References

  1. Shao, Z.; Li, Y.; Gong, H.; Chai, H. From risk control to resilience: Developments and trends of urban roads designed as surface flood passages to cope with extreme storms. Front. Environ. Sci. Eng. 2023, 18, 22. [Google Scholar] [CrossRef]
  2. Chen, Y.; Wang, C.; Yang, Q.; Lei, X.H.; Wang, H.; Jiang, S.; Wang, Z. Model predictive control and rainfall Uncertainties: Performance and risk analysis for drainage systems. J. Hydrol. 2024, 630, 130779. [Google Scholar] [CrossRef]
  3. Wang, T.; Zhang, Y.; Li, H.; Xu, Z.; Jin, W. Policies on combined sewer overflows pollution control: A global perspective to inspire China and less developed countries. Crit. Rev. Environ. Sci. Technol. 2024, 54, 1050–1069. [Google Scholar] [CrossRef]
  4. Yan, Y.; Zhu, J.J.; May, H.D.; Song, C.; Jiang, J.; Du, L.; Ren, Z.J. Methanogenic Potential of Sewer Microbiomes and Its Implications for Methane Emission. Environ. Sci. Technol. 2024, 58, 19990–19998. [Google Scholar] [CrossRef] [PubMed]
  5. Gao, H.; Wei, D.; Zhang, P.; Zhang, W.; Yan, G.; Xue, W.; Zhao, Y.; Ye, W.; Guo, L.; Peng, S. Methane emissions features from China’s municipal wastewater management, based on the whole-process evaluation of collection, treatment and discharge. J. Clean. Prod. 2025, 509, 145592. [Google Scholar] [CrossRef]
  6. Chen, J.; Wang, H.; Yin, W.; Wang, Y.; Lv, J.; Wang, A. Deciphering carbon emissions in urban sewer networks: Bridging urban sewer networks with city-wide environmental dynamics. Water Res. 2024, 256, 121576. [Google Scholar] [CrossRef]
  7. Xu, Y.; Ye, C.; Xu, Z.; Chu, W. A Systematic Review of Greenhouse Gas Emissions Derived from Combined Sewer Overflows and Synergistic Control Strategies Toward Carbon Neutrality. Engineering 2025, 50, 40–51. [Google Scholar] [CrossRef]
  8. Joo, J.; Jeong, S.; Shin, J.; Chang, D.Y. Missing methane emissions from urban sewer networks. Environ. Pollut. 2024, 342, 123101. [Google Scholar] [CrossRef] [PubMed]
  9. Wang, Y.; Huang, B.; Zhu, D.Z. Assessment of rainfall-derived inflow and infiltration in sewer systems with machine learning approaches. Water Sci. Technol. 2024, 89, 1928–1945. [Google Scholar] [CrossRef]
  10. Zhang, H.; Jia, H.; Mels, A.; Rijnaarts, H.; Chen, W.S. Extraneous water in sewer systems: A Comprehensive review on sewer infiltration and inflow quantification, localization and mitigation. Water Res. X 2025, 29, 100426. [Google Scholar] [CrossRef]
  11. Ge, J.; Li, J.; Qiu, R.; Shi, T.; Zhang, C.; Huang, Z.; Yuan, Z. A data-driven method for estimating sewer inflow and infiltration based on temperature and conductivity monitoring. Water Res. 2024, 261, 122002. [Google Scholar] [CrossRef]
  12. Yang, F.; Zhang, X.; Li, J.; Jin, F.; Zhou, B. Simple method to quantify extraneous water and organic matter degradation in sewer networks. Environ. Sci. Water Res. Technol. 2021, 7, 172–183. [Google Scholar] [CrossRef]
  13. Huang, Z.; Wang, Y.; Dong, X. Dimensions of superiority: How deep reinforcement learning excels in urban drainage system real-time control. Water Res. X 2025, 28, 100313. [Google Scholar] [CrossRef] [PubMed]
  14. Dai, X.; Xu, G.; Ding, Y.; Zeng, S.; You, L.; Jiang, J.; Zhang, H. Online Storage Technology of the Separate Sewage System: Demonstration Study in a Typical Plain River Network City. Water 2022, 14, 3194. [Google Scholar] [CrossRef]
  15. Manga, M.; Muoghalu, C.C. Greenhouse gas emissions from on-site sanitation systems: A systematic review and meta-analysis of emission rates, formation pathways and influencing factors. J. Environ. Manag. 2024, 357, 120736. [Google Scholar] [CrossRef]
  16. He, Z.; Tian, W.; Wang, J.; Yan, H.; Xin, K.; Tao, T. Deep reinforcement learning control as an innovative approach for urban drainage systems: Review and prospects. Water Res. 2025, 284, 123954. [Google Scholar] [CrossRef]
  17. Schütze, M.; Campisano, A.; Colas, H.; Schilling, W.; Vanrolleghem, P.A. Real time control of urban wastewater systems—Where do we stand today? J. Hydrol. 2004, 299, 335–348. [Google Scholar] [CrossRef]
  18. van der Werf, J.A.; Kapelan, Z.; Langeveld, J. Towards the long term implementation of real time control of combined sewer systems: A review of performance and influencing factors. Water Sci. Technol. 2022, 85, 1295–1320. [Google Scholar] [CrossRef] [PubMed]
  19. Sun, C.; Romero, L.; Joseph-Duran, B.; Meseguer, J.; Munoz, E.; Guasch, R.; Martinez, M.; Puig, V.; Cembrano, G. Integrated pollution-based real-time control of sanitation systems. J. Environ. Manag. 2020, 269, 110798. [Google Scholar] [CrossRef]
  20. Zhang, X.; Kang, A.; Lei, X.; Wang, H. Urban drainage efficiency evaluation and flood simulation using integrated SWMM and terrain structural analysis. Sci. Total Environ. 2024, 957, 177442. [Google Scholar] [CrossRef]
  21. van der Werf, J.A.; Kapelan, Z.; Langeveld, J. Real-time control of combined sewer systems: Risks associated with uncertainties. J. Hydrol. 2023, 617, 128900. [Google Scholar] [CrossRef]
  22. Castelletti, A.; Ficchì, A.; Cominola, A.; Segovia, P.; Giuliani, M.; Wu, W.; Lucia, S.; Ocampo-Martinez, C.; De Schutter, B.; Maestre, J.M. Model Predictive Control of water resources systems: A review and research agenda. Annu. Rev. Control 2023, 55, 442–465. [Google Scholar] [CrossRef]
  23. Chen, C.; Li, B.; Zhang, H.; Zhao, M.; Liang, Z.; Li, K.; An, X. Performance enhancement of deep learning model with attention mechanism and FCN model in flood forecasting. J. Hydrol. 2025, 658, 133221. [Google Scholar] [CrossRef]
  24. Seyedashraf, O. Enhancing Decision-Making in Sustainable Urban Drainage System Optimization: A Novel Framework for Sparse Pareto-Fronts. Water Resour. Manag. 2024, 38, 6157–6172. [Google Scholar] [CrossRef]
  25. Xu, W.; Fang, Z.; Xie, Q. A multi-objective optimization framework for urban flood mitigation using machine learning and optimization algorithms. J. Environ. Manag. 2026, 397, 128147. [Google Scholar] [CrossRef]
  26. Khatri, B.; Wang, W.; Pan, C.; Zhang, H. Assessment of rainfall-derived inflow and infiltration using smart sewer sensors and ensemble optimization. J. Water Process Eng. 2026, 81, 109382. [Google Scholar] [CrossRef]
  27. Liu, X.; Zeng, S. Multiobjective optimization control for multifacility coordination in integrated urban drainage systems. Front. Environ. Sci. Eng. 2025, 19, 125. [Google Scholar] [CrossRef]
  28. Hu, X.; Gu, F. Optimization Strategies for Urban Waterlogging Warning in Complex Environments: Based on Particle Swarm Optimization and Deep Neural Networks. Adv. Civ. Eng. 2024, 2024, 9601590. [Google Scholar] [CrossRef]
  29. Zhao, Z.; Zhang, H.; Yu, Z.; Yin, H.; Xu, Z. Abatement of Sewer Overflow Pollution Based on Distributed Optimal Control Approach. ACS ES&T Water 2022, 4, 859–868. [Google Scholar] [CrossRef]
  30. Javan, K.; Banihashemi, S.; Nazari, A.; Roozbahani, A.; Darestani, M.; Hossieni, H. Coupled SWMM-MOEA/D for multi-objective optimization of low impact development in urban stormwater systems. J. Hydrol. 2025, 656, 133044. [Google Scholar] [CrossRef]
  31. Sun, C.; Romero, L.; Joseph-Duran, B.; Meseguer, J.; Palma, R.G.; Puentes, M.M.; Puig, V.; Cembrano, G. Control-oriented quality modelling approach of sewer networks. J. Environ. Manag. 2021, 294, 113031. [Google Scholar] [CrossRef]
  32. Zhou, H.; Gao, C.; Luan, Q.; Shi, L.; Lu, Z.; Liu, J. Multi-objective optimization of distributed green infrastructure for effective stormwater management in space-constrained highly urbanized areas. J. Hydrol. 2024, 644, 132065. [Google Scholar] [CrossRef]
  33. Tansar, H.; Li, F.; Duan, H.F. An efficient Gaussian process-based optimization for resilience improvement of urban drainage systems considering changing climate. Reliab. Eng. Syst. Saf. 2025, 264, 111428. [Google Scholar] [CrossRef]
  34. Deb, K.; Pratap, A.; Agarwal, S.; Meyarivan, T. A fast and elitist multiobjective genetic algorithm: NSGA-II. IEEE Trans. Evol. Comput. 2002, 6, 182–197. [Google Scholar] [CrossRef]
  35. Wang, B.; Gong, Y.; Li, X.; Zhang, Y.; Li, Z. Multi-objective optimization of urban stormwater systems. J. Environ. Manag. 2025, 386, 125671. [Google Scholar] [CrossRef]
  36. Ke, E.; Zhao, J.; Zhao, Y.; Wu, J.; Xu, T. Coupled and collaborative optimization model of impervious surfaces and drainage systems from the flooding mitigation perspective for urban renewal. Sci. Total Environ. 2024, 917, 170202. [Google Scholar] [CrossRef] [PubMed]
  37. Willis, J.; Brower, B.; Murthy, S.; Peot, C.; Sharma, K.; Yuan, Z. Manuscript: The National Implications of Adding Sewer CH4 and Methanol-Derived CO2 to Wastewater Treatment and Conveyance GHG Inventories. Proc. Water Environ. Fed. 2017, 2017, 5027–5037. [Google Scholar] [CrossRef]
  38. Zhang, Z.; Tian, W.; Liao, Z. Towards coordinated and robust real-time control: A decentralized approach for combined sewer overflow and urban flooding reduction based on multi-agent reinforcement learning. Water Res. 2023, 229, 119498. [Google Scholar] [CrossRef]
Figure 1. Real-time optimization control framework based on MPC-NSGA-II.
Applsci 16 05177 g001
Figure 2. Flowchart of the NSGA-II algorithm for multi-objective pump start–stop optimization.
Applsci 16 05177 g002
Figure 3. Pipeline topology and pump station distribution in the study area.
Applsci 16 05177 g003
Figure 4. Comparison of simulated and monitoring water levels for model calibration and validation: (a) 16 May 2024; (b) 21 June 2024; (c) 28 June 2024.
Applsci 16 05177 g004
Figure 5. Design rainfall scenarios: (a) light rain (P1); (b) moderate rain (P2); (c) heavy rain (P3).
Applsci 16 05177 g005
Figure 6. Trade-offs among multi-objective Pareto solutions: (a) overflow vs. energy consumption; (b) overflow vs. methane emission potential; (c) energy consumption vs. methane emission potential; (d) inflow fluctuation vs. energy consumption; (e) inflow fluctuation vs. methane emission potential.
Applsci 16 05177 g006
Figure 7. Dynamic response of pump station forebay water levels under different control strategies: (a) light rain (P1); (b) moderate rain (P2); (c) heavy rain (P3).
Applsci 16 05177 g007
Figure 8. Spatial distribution of water level fluctuation ( H s t d ) in pump station forebays: (a) light rain (P1); (b) moderate rain (P2); (c) heavy rain (P3).
Applsci 16 05177 g008
Figure 9. Multi-objective performance improvement relative to RBC: (a) light rain (P1); (b) moderate rain (P2); (c) heavy rain (P3).
Applsci 16 05177 g009
Figure 10. Strategy robustness comparison under light rain scenario (P1).
Applsci 16 05177 g010
Figure 11. Strategy robustness comparison under heavy rain scenario (P3): (a) Overflow volume; (b) Energy; (c) Methane.
Applsci 16 05177 g011
Table 1. Comparison of overall system performance under different rainfall scenarios and control strategies.
Rainfall ScenariosControl Strategies S y s s t d (m)CVR
P1 (light rain)RBC0.830.158
SMPC0.930.121
DMPC0.850.102
P2 (moderate rain)RBC0.800.173
SMPC0.830.127
DMPC0.810.105
P3 (heavy rain)RBC0.820.183
SMPC0.880.134
DMPC0.850.098
Disclaimer/Publisher’s Note: The statements, opinions and data contained in all publications are solely those of the individual author(s) and contributor(s) and not of MDPI and/or the editor(s). MDPI and/or the editor(s) disclaim responsibility for any injury to people or property resulting from any ideas, methods, instructions or products referred to in the content.