Article

Multi-Stage Hydrocarbon Charging and Fluid Evolution in Ultra-Deep Sinian Marine Carbonate Reservoirs, Tarim Basin


1
PetroChina Tarim Oilfield Company, Korla 841000, China
2
Hubei Key Laboratory of Petroleum Geochemistry and Environment, Yangtze University, Wuhan 430100, China
*
Authors to whom correspondence should be addressed.
Appl. Sci. 2026, 16(10), 5006; https://doi.org/10.3390/app16105006
Submission received: 18 April 2026 / Revised: 14 May 2026 / Accepted: 14 May 2026 / Published: 17 May 2026
(This article belongs to the Section Earth Sciences)

Featured Application

The integrated geochronological and geochemical framework developed in this study provides a practical tool for constraining hydrocarbon charging histories in deep-to-ultra-deep marine carbonate reservoirs, making it suitable for evaluating accumulation timing and preservation risk in ultra-deep exploration targets of the Tarim Basin compared to conventional methods.

Abstract

Deep-to-ultra-deep marine carbonate reservoirs represent an important frontier for hydrocarbon exploration in the Tarim Basin, yet fluid sources and accumulation processes in the Ediacaran (Sinian) succession remain poorly constrained due to extreme burial depth and complex tectono-thermal evolution. Here, we investigate fracture–vug reservoirs of the Sinian Qigebulake Formation in Well LT3 (Tabei Uplift) using an integrated dataset including petrography and cathodoluminescence, fluid-inclusion microthermometry, fluorescence and Raman spectroscopy, in situ major/trace element analysis and C–O–Sr isotope geochemistry, and LA-ICP-MS carbonate U–Pb dating of authigenic minerals. The paragenetic sequence comprises early dolomite (Dol-I), later dolomite (Dol-II), co-precipitated calcite (Cal-I) and quartz (Qtz-I), and late solid bitumen (Bit). Dolomite veins show PAAS-normalized REE patterns and 87Sr/86Sr ratios (0.70918–0.70984; average 0.70942) comparable to the surrounding Sinian marine wall rocks, indicating precipitation from diagenetic fluids dominated by closed-system water–rock interaction. In contrast, Cal-I displays LREE enrichment, pronounced positive Eu anomalies (δEu = 4.91–7.21), radiogenic 87Sr/86Sr ratios (0.71161–0.71417; average 0.71256), and negative δ18OVPDB values (down to −9.439‰), suggesting a large-scale influx of deep-seated, high-temperature, Sr-rich hydrothermal fluids likely linked to fault-assisted fluid circulation. Fluid inclusions record four hydrocarbon charging episodes, evolving from lower- to higher-maturity oils and ultimately to dry gas. Dol-II hosts pale-yellow to pale-blue oil inclusions, whereas Cal-I and Qtz-I predominantly contain deep-blue oil inclusions and methane-rich gas inclusions (Raman peak near 2917 cm−1). Carbonate U–Pb ages constrain dolomite precipitation to the Middle Ordovician (~468–463 Ma) and hydrothermal-related carbonate filling to the Early Triassic (~247–244 Ma). Collectively, these results support a time-resolved evolution in which early diagenetic fluid circulation in a marine carbonate system was overprinted by a later hydrothermal pulse that modified pore structures and thermal conditions, followed by late-stage deep burial leading to cracking of retained liquids, widespread bitumen formation, and methane charging. This framework provides new information on the constraints for fluid–rock interaction and hydrocarbon evolution in deep marine carbonate successions.

1. Introduction

Deep-to-ultra-deep marine carbonate rocks have become a vital strategic replacement domain for global and domestic oil and gas resource exploration [1,2]. Globally, successful exploration in deeply buried carbonate successions has been well-documented in major petroliferous provinces, such as the pre-salt reservoirs of the Santos Basin in Brazil, the deeply buried Khuff Formation in the Middle East, and the Paleozoic successions in the Permian Basin of North America. These global discoveries demonstrate that favorable early diagenetic conditions coupled with subsequent fluid–rock interactions can effectively preserve or even enhance reservoir porosity under extreme burial depths [3,4,5,6]. In recent years, the Tarim Basin, as a core area for ultra-deep oil and gas exploration in China, has achieved a series of major breakthroughs in the Cambrian and deeper ancient successions [7,8,9]. Well Luntan 3 (LT3), an ultra-deep exploration well located on the Tabei Uplift with a drilling depth exceeding 8000 m, has not only confirmed the hydrocarbon generation potential of the high-quality source rocks in the Lower Cambrian Yuertusi Formation but also revealed that the underlying ancient marine strata of the Sinian possess the geological conditions for large-scale accumulation [10]. Compared to the overlying Middle-Upper Paleozoic, the Sinian has undergone a longer and more complex tectonic and thermal evolution process [11,12]. Under the extreme high-temperature and high-pressure conditions of deep burial, multi-stage authigenic minerals (e.g., dolomite cements, calcite, and quartz) developed in the fracture–vug systems objectively record the complete history of deep fluid evolution and hydrocarbon accumulation in the basin [13,14].
Currently, research on hydrocarbon accumulation in the deep-to-ultra-deep marine carbonates of the Tarim Basin mainly focuses on the Ordovician and Cambrian [15,16]. However, there is still a lack of systematic investigation into the older Sinian strata, particularly regarding complex fluid sources, deep hydrothermal modification effects, and their control mechanisms of the phase evolution of ultra-deep hydrocarbons [17,18]. The Tabei area has experienced the composite superimposition of multiple tectonic stress fields during the Caledonian, Hercynian, Indosinian, and Yanshanian–Himalayan periods [19,20,21]. The periodic activation of deep strike-slip fault systems has not only profoundly constrained the heterogeneous development of reservoir spaces but they have also served as critical transport pathways connecting early formation water, multi-stage hydrocarbon-generating fluids, and late deep hydrothermal fluids for cross-stratal migration, accumulation, and modification. The critical role of fault-assisted hydrothermal fluid circulation in modifying deep carbonate reservoirs is a widely recognized mechanism globally. Extensive studies in the Western Canadian Sedimentary Basin and the Appalachian Basin have established classic models illustrating how deep-seated, high-temperature fluids migrating along structural fault networks can cause massive dissolution and hydrothermal dolomitization. Understanding these global hydrothermal-fluid flow models is essential for unraveling the complex fluid evolution observed in ultra-deep settings like the Tarim Basin [22]. Furthermore, earlier investigations in the Tarim Basin largely relied on bulk-rock geochemical analyses, which often obscure the signals of superimposed fluid events [23,24]. Based on this, this study focuses on the Sinian Qigebulake Formation reservoirs in Well LT3 in the Tabei area by applying a high-resolution in situ analytical workflow [25,26]. In recent years, the global application of in situ LA-ICP-MS U-Pb dating of authigenic carbonates, often integrated with fluid-inclusion microthermometry, has revolutionized the ability to determine the absolute timing of fluid events and hydrocarbon charging in structurally complex basins worldwide. By comprehensively utilizing multi-scale analytical techniques—starting with macroscopic core observations and sedimentological descriptions to characterize the host-rock lithologies and fracture–vug development patterns, followed by micro-scale petrographic observation, fluid-inclusion microthermometry, micro-area geochemical analysis (rare earth elements and C-O-Sr isotopes), and in situ U-Pb absolute dating of authigenic carbonate minerals—we finely characterize the paragenetic sequences of multi-stage authigenic minerals in the Sinian reservoirs, determine the sources and geochemical attributes of fluids from different stages, and systematically reconstruct the multi-stage hydrocarbon charging and accumulation evolution process in the deep-to-ultra-deep study area. These findings provide critical constraints for determining the accumulation periods and reservoir modification mechanisms of the Sinian ultra-deep hydrocarbon reservoirs in the Tabei area, offering direct guidance for identifying deep-to-ultra-deep exploration targets and predicting favorable zones in this succession.

2. Geological Setting

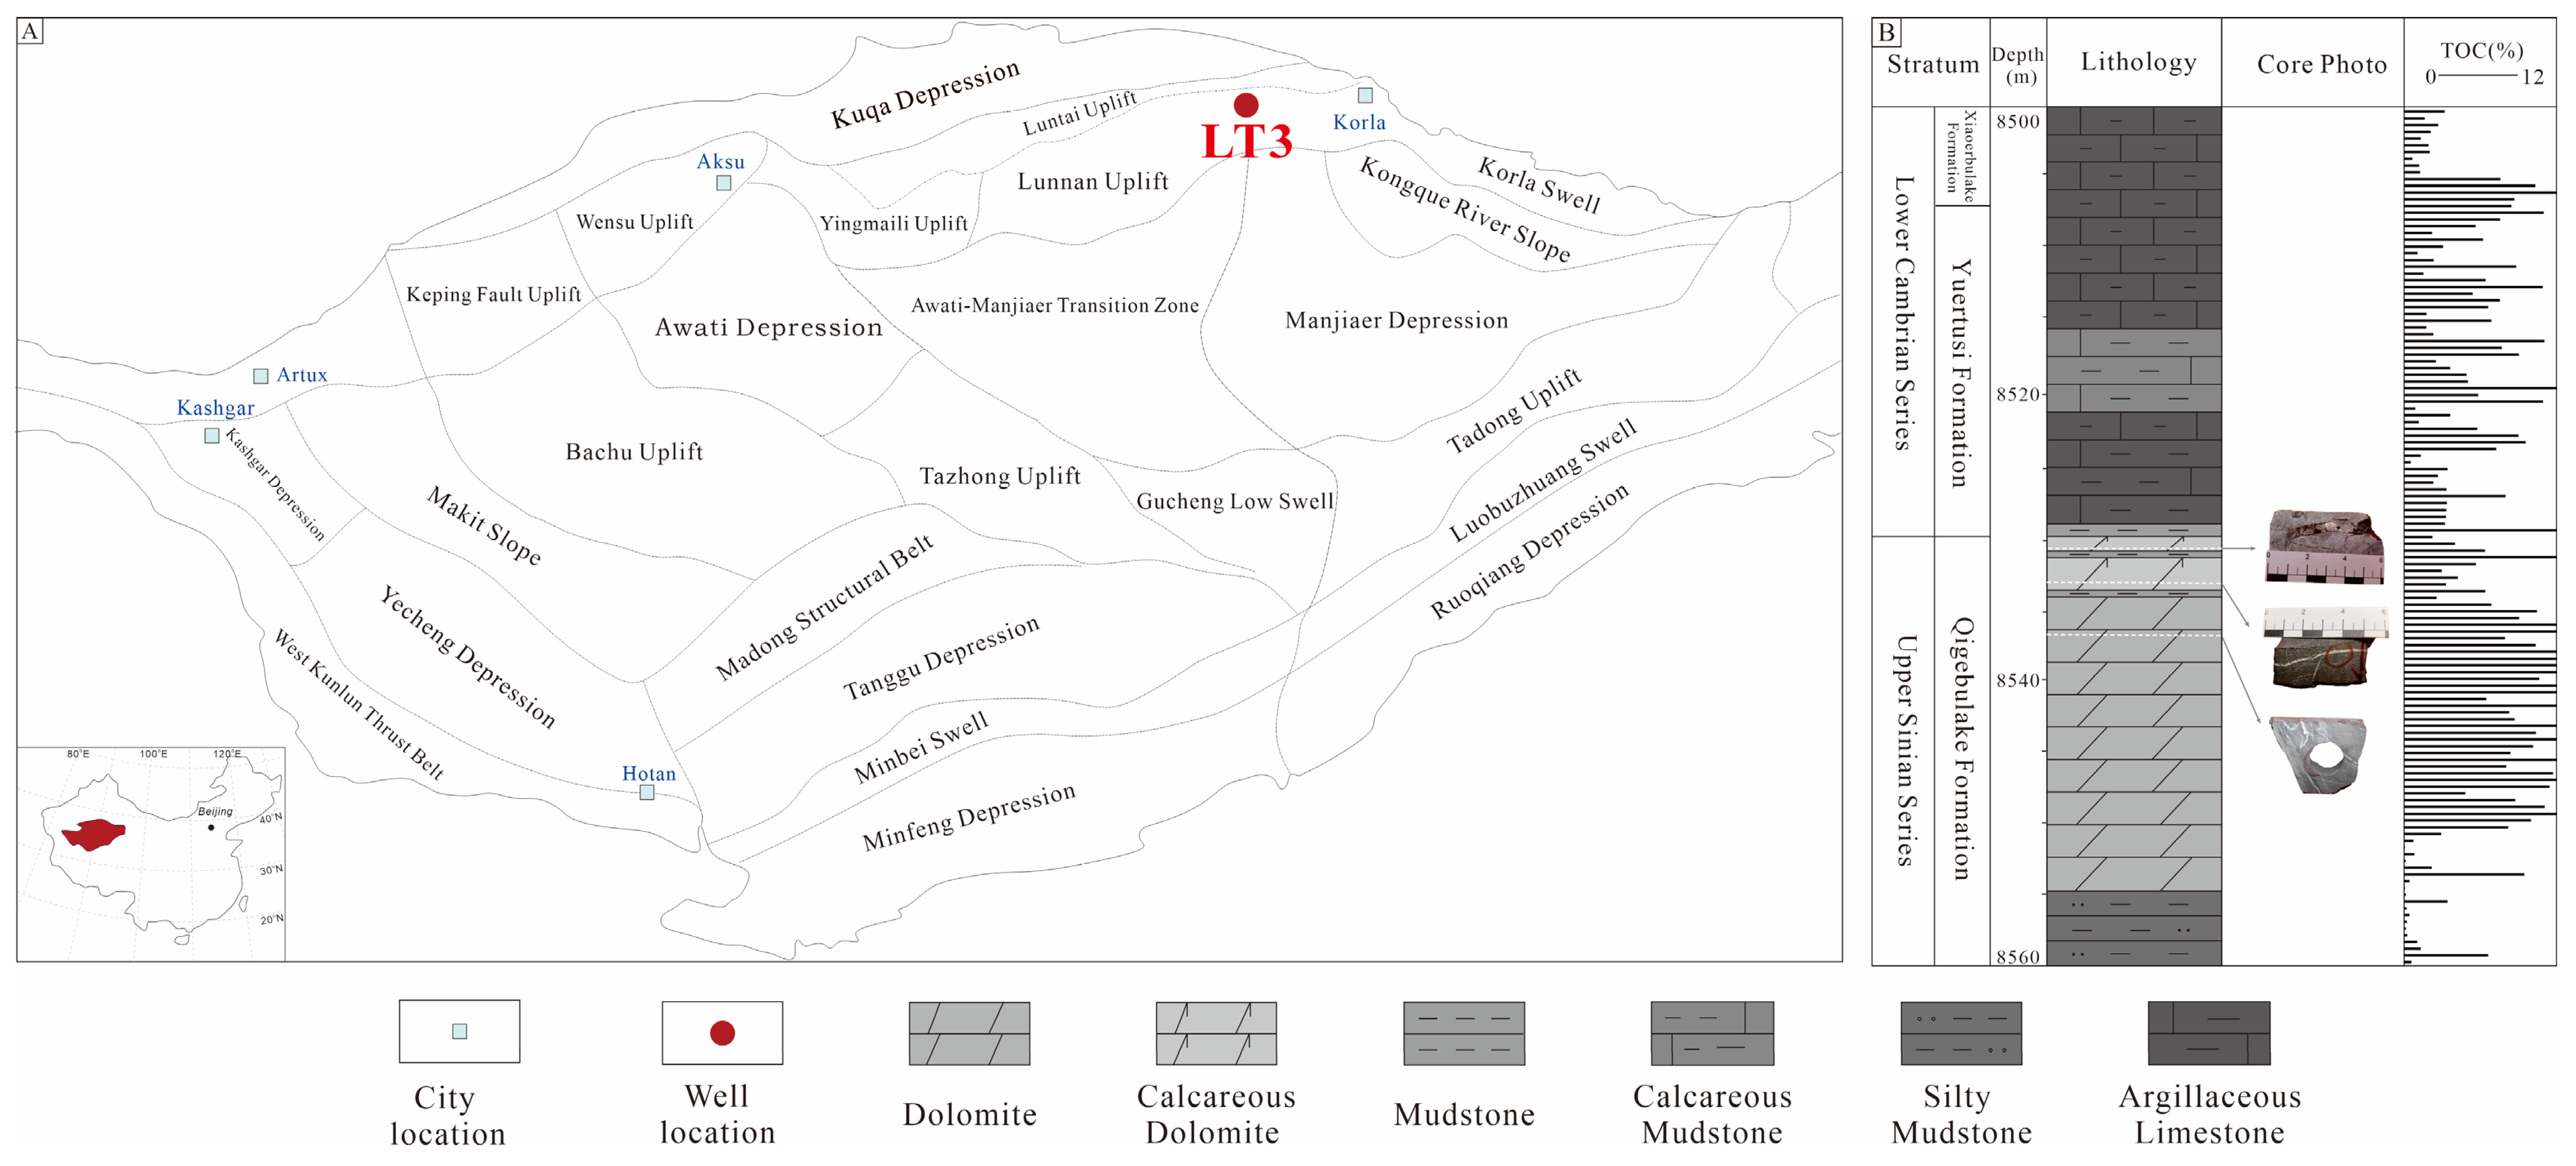
The Tarim Basin, located in the Xinjiang Uygur Autonomous Region in northwestern China and covering an area of 560,000 km2, is a major hydrocarbon-bearing basin in China [27] (Figure 1). It is a large-scale composite superimposed basin developed on an Archean to Early Neoproterozoic crystalline basement. Based on the relief of the basement top surface, regional structural deformation styles, and the distribution patterns of sedimentary sequences, the basin can be divided into a secondary structural unit combination of “four uplifts and five depressions”. The four positive structural belts are the Tabei Uplift, Bachu Uplift, Tazhong Uplift, and Southeast Uplift; the five negative structural units are the Kuqa Depression, Northern Depression, Tanggu Depression, Southeast Depression, and Southwest Depression [28,29]. Developed on a pre-Sinian continental crustal basement, the Tarim Basin is a large superimposed cratonic basin that has experienced multiple tectonic stages, including the extensional rift and passive continental margin development stage during the Sinian–Early Paleozoic, the compressional uplift stage during the Late Paleozoic, and the foreland basin evolution stage during the Mesozoic–Cenozoic [30,31,32]. Well Luntan 3 is located in the northern part of the Tarim Basin, situated in the transitional slope zone between the Tabei Uplift and the Manjiaer Depression (Figure 1A). The tectonic evolution of this area is extremely complex, controlled by the superimposition of early extensional faulting and later multi-stage strike-slip faulting [33]. Recent high-resolution 3D seismic studies have characterized the intra-cratonic conjugate strike-slip fault system in the Tabei area as following a three-stage evolutionary process: (1) an initial isolated stage during the Middle Ordovician; (2) a subsequent linkage-intersection stage during the Late Hercynian; and (3) a final disturbance-localization stage from the Indosinian onwards [34]. These deep-penetrating faults serve as critical vertical conduits, with their complex intersection zones and overlapping damage zones providing structural pathways connecting the crystalline basement to the sedimentary successions.
The Sinian sequence in the study area is relatively complete, divided from bottom to top into the Sugetbrak Formation and the Qigebulake Formation [8]. The extensively developed dolomites in the Upper Sinian Qigebulake Formation constitute the key interval for the formation of large-scale deep reservoirs (Figure 1B) [35]. During the prolonged geological burial process, this succession was not only modified by early syngenetic-penecontemporaneous dolomitization but also subjected to intense brittle deformation during the deep burial and subsequent tectonic uplift stages [36]. This led to the development of a complex reservoir space characterized by intersecting micro-fractures and dissolution vugs, which became the primary sites for deep fluid and hydrocarbon accumulation [37,38]. Analysis of regional tectono-sedimentary evolution indicates that this area has experienced the superimposition and modification of multi-stage fluid activities from various sources [39]. From the Early Paleozoic Caledonian to the Late Paleozoic Hercynian, hydrocarbon fluids generated by the overlying high-quality source rocks of the Lower Cambrian Yuertusi Formation, along with syn-sedimentary formation water, migrated vertically and laterally along pre-existing faults and regional unconformities, charging the underlying Sinian reservoirs in multiple stages. Entering the Late Paleozoic Hercynian period, controlled by strong regional compressional stress fields and the activation of deep strike-slip faults, deep-source hydrothermal fluids invaded on a large scale along the fault zones, causing significant thermal alteration and fluid adjustment to the paleo-reservoirs previously accumulated in the Sinian. By the Late Yanshanian–Himalayan period, accompanied by rapid basin subsidence and deep burial, the study area re-entered a high-temperature and high-pressure diagenetic environment, driving the deep charging of late-stage high-maturity hydrocarbons. Simultaneously, the high temperatures prompted the in situ thermal cracking of residual liquid hydrocarbons trapped in the fracture–vug systems, forming abundant pyrobitumen [40]. The coupled superimposition of multi-stage tectonic activities and fluid events jointly shaped the current complex hydrocarbon accumulation pattern in the Sinian of Well LT3.

3. Methods

All samples in this study were collected from deep cores of the Sinian Qigebulake Formation (Z2q) in Well Luntan 3, Tarim Basin (Table 1). To systematically reveal the developmental characteristics of authigenic minerals, fluid activities, and hydrocarbon accumulation evolution, suitable areas with veins and wall rocks were selected to prepare doubly polished thin sections for fluid-inclusion observation. The sections, approximately 60–80 μm thick, facilitated a strict sequential analytical strategy to maximize data correlation. Non-destructive optical and spectroscopic analyses (e.g., petrographic and fluorescence observation, Raman spectroscopy, and microthermometry) were sequentially conducted on the exact same reused thin sections. Subsequently, specific targeted micro-areas on these sections were subjected to destructive, single-use laser ablation techniques (LA-ICP-MS and LA-MC-ICP-MS).
A NIKON-LV100 dual-channel fluorescence–transmitted-light microscope (Nikon Corporation, Tokyo, Japan) was utilized for petrographic observation of fluid inclusions. A UV fluorescence excitation module with a wavelength range of 300–365 nm was selected as the fluorescence filter. Concurrently, a May2000Pro micro-fluorescence spectrometer (Ocean Insight, Orlando, FL, USA) was used to obtain the fluorescence spectra of oil inclusions. Cathodoluminescence (CL) analysis of minerals was performed using a CL8200MK5 cathodoluminescence instrument (Cambridge Image Technology Ltd., Hertfordshire, UK) equipped with a Leica DM2500 microscope (Leica Microsystems, Wetzlar, Germany, operating at 15 kV, 250 μA, and a vacuum of 0.003 mBar). Fluid-inclusion homogenization temperature (Th) measurements were conducted on a Linkam THMSG 600 heating–cooling stage (Linkam Scientific Instruments, Surrey, UK). The heating rate was controlled at 1–2 °C/min and reduced to 0.2 °C/min near phase transition points to ensure measurement accuracy. Raman spectroscopy, a non-destructive and high-resolution micro-area molecular structure characterization technique, can effectively identify the volatile composition of individual fluid inclusions, making it particularly suitable for determining the relative content of hydrocarbon gas (CH4) and non-hydrocarbon gases (CO2, N2). Quantitative laser Raman analysis of inclusions was performed using a JY/Horiba Labram HR800 micro-laser Raman spectrometer (HORIBA Scientific, Paris, France). All the aforementioned experiments were completed at the State Key Laboratory of Geological Processes and Mineral Resources, China University of Geosciences (Wuhan, China).
Micro-area in situ elemental analyses of calcite veins and their wall rocks were separately conducted at Wuhan Sample Solution Analytical Technology Co., Ltd., using a Laser Ablation–Inductively Coupled Plasma Mass Spectrometer (LA-ICP-MS, Agilent Technologies, Santa Clara, CA, USA). The analysis employed a laser spot diameter of 120 μm, with approximately 100 s required for background collection and laser ablation per spot. The synthetic silicate glass NIST610 was used as the standard, and it was remeasured every 10 samples. The experimental results were normalized using Post-Archean Australian Shale (PAAS). Strontium isotope analysis was performed using a Laser Ablation Multi-Collector Inductively Coupled Plasma Mass Spectrometer (LA-MC-ICP-MS, Thermo Fisher Scientific, Bremen, Germany) combined with a coherent 193 nm excimer laser ablation system (GeoLas HD, Coherent Inc., Santa Clara, CA, USA). A 90 μm spot size and a laser ablation frequency of 15 Hz were used, with helium (He) as the carrier gas at a flow rate of 650 mL/min. Sr isotope data were corrected using 86Sr/88Sr = 0.1194, and the MAD standard (86Sr/87Sr = 0.7118) was utilized to ensure instrument stability and data accuracy. Micro-area in situ stable C and O isotope analyses employed a FUSION CO2 laser system (Teledyne Photon Machines, Bozeman, MT, USA) emitting a high-energy laser focused to a 100 μm spot on the sample surface to pyrolyze the carbonate and generate CO2 gas. Subsequently, the collected and purified CO2 was introduced into a Delta V isotope ratio mass spectrometer (Thermo Fisher Scientific, Bremen, Germany) for analysis to obtain δ13CVPDB (‰) and δ18OVPDB (‰) values.
In situ U-Pb isotope dating of calcite was conducted at the Hangzhou Institute of Petroleum Geology using an excimer laser ablation system coupled with a quadrupole inductively coupled plasma mass spectrometer (Q-ICP-MS, Agilent Technologies, Santa Clara, CA, USA). The excimer laser was set to a spot diameter of 200 μm, a frequency of 15 Hz, and an energy density of 1.0 J/cm2. The ablated material was transported by helium, with argon and nitrogen serving as auxiliary gases to enhance the signal. NIST614 (National Institute of Standards and Technology, Gaithersburg, MD, USA) was used to calibrate the instrument sensitivity and the 207Pb/206Pb ratio, while AHX-1 (209.8 ± 1.3 Ma) was used to calibrate the 238U/206Pb ratio.

4. Results

4.1. Characteristics of Fracture-Vein Development

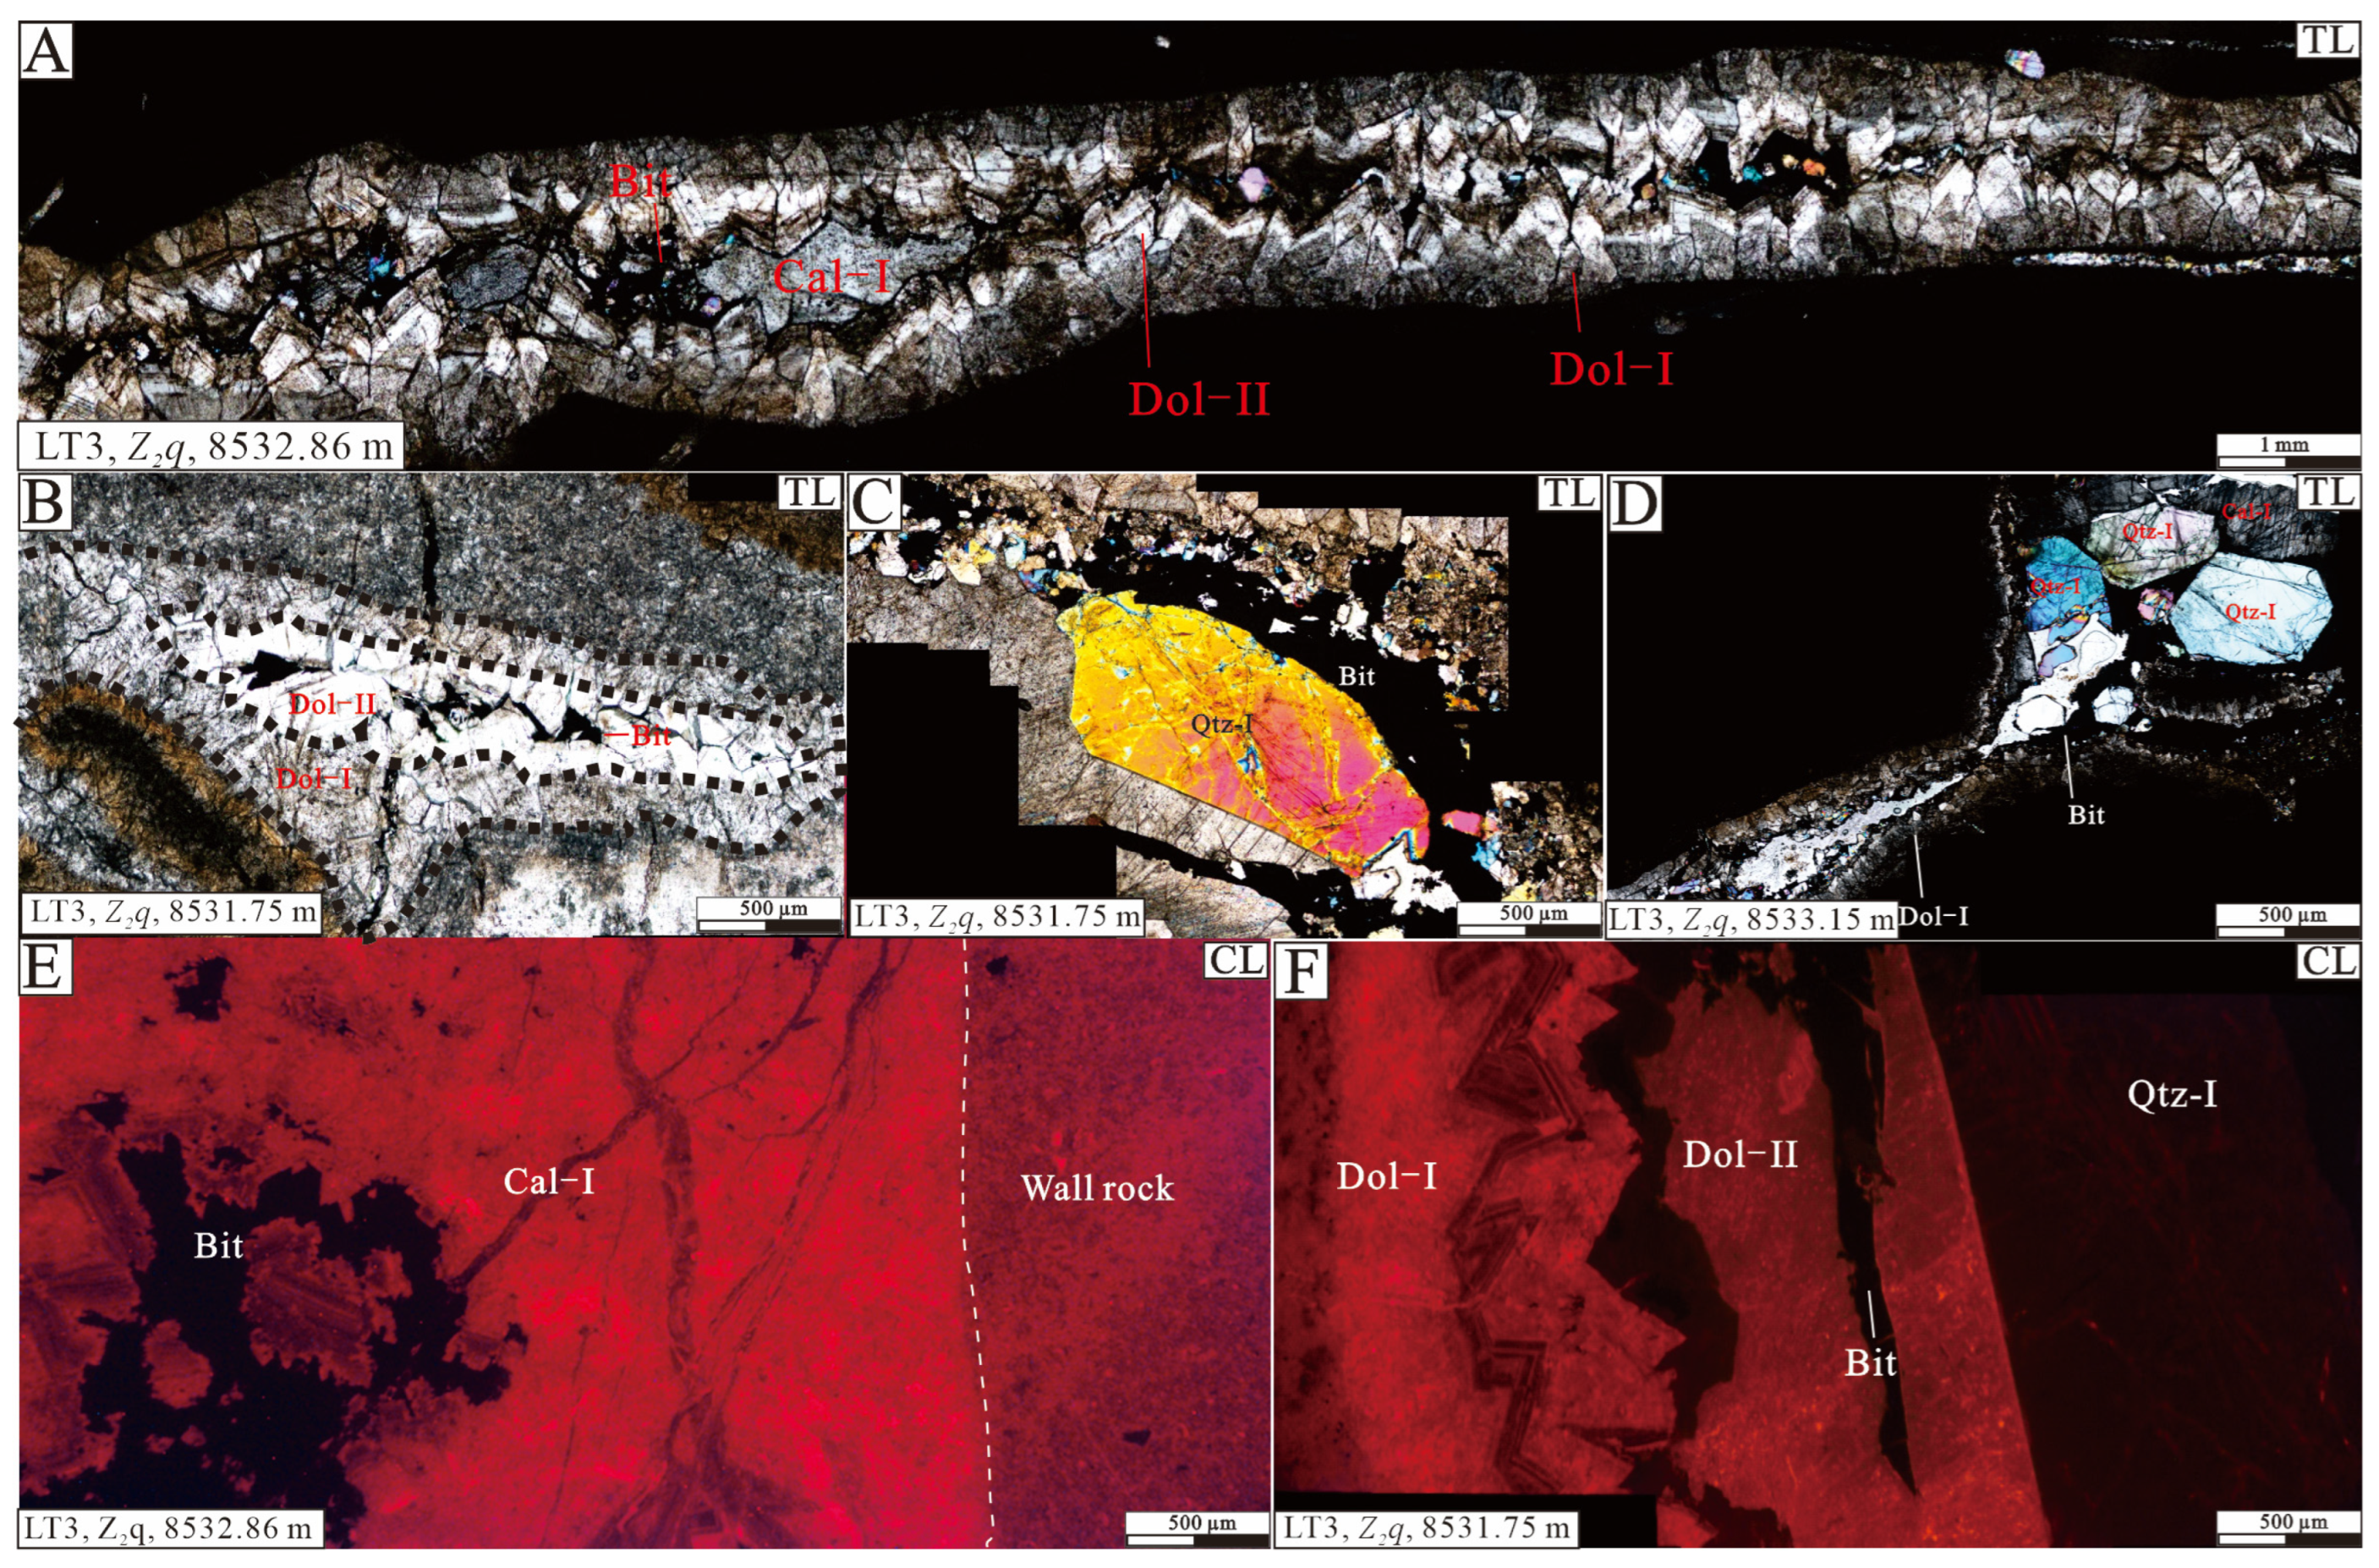
Based on petrographic observations of core samples and thin sections, multi-stage filling minerals are observed to have developed within the reservoirs of the Sinian Qigebulake Formation in Well LT3, and the sequence of authigenic mineral filling is relatively clear (Figure 2). Microscopic features reveal that dolomite I often grows as zoned linings along the edges of vugs or fractures, in contact with the wall rock. It has a rough surface, belongs to early dolomite cements, and exhibits an orange to dark red cathodoluminescence (Figure 2A,B,F). Dolomite II crystals are relatively larger, saddle-shaped, and have cleaner surfaces. They frequently overgrow dolomite I and show dark brown cathodoluminescence. Calcite and quartz typically fill the centers of vugs or fracture veins (Figure 2A,B,F). Calcite I exhibits two sets of typical perfect rhombohedral cleavage, with cleavage planes appearing as dense, straight, intersecting black lines, and shows brown cathodoluminescence (Figure 2A,D,E). Under plane-polarized light, quartz I is colorless and transparent with clean surfaces; under cross-polarized light, it displays bright, higher-order interference colors and is non-luminescent under cathodoluminescence (Figure 2C,D,F). Carbonaceous bitumen (black and non-fluorescent) is widely associated with the margins of these late-stage minerals and is found along reservoir stylolites (Figure 2A–F). This coexistence of minerals and bitumen directly records the processes of large-scale hydrocarbon charging, followed by thermal cracking and adjustment. Based on the cross-cutting relationships among calcite, quartz, and bitumen, there is no distinct chronological order between calcite and quartz, suggesting they formed simultaneously as co-precipitates affected by hydrothermal activity (Figure 2D). Bitumen is interpreted as the latest-stage product. Therefore, the paragenetic sequence of authigenic minerals in the Sinian Qigebulake Formation of Well LT3, in order of formation, is: early dolomite (Dol-I), second-stage dolomite (Dol-II), co-precipitation of calcite I (Cal-I) and quartz I (Qtz-I), and late-stage solid bitumen (Bit).

4.2. Fluid-Inclusion Characteristics

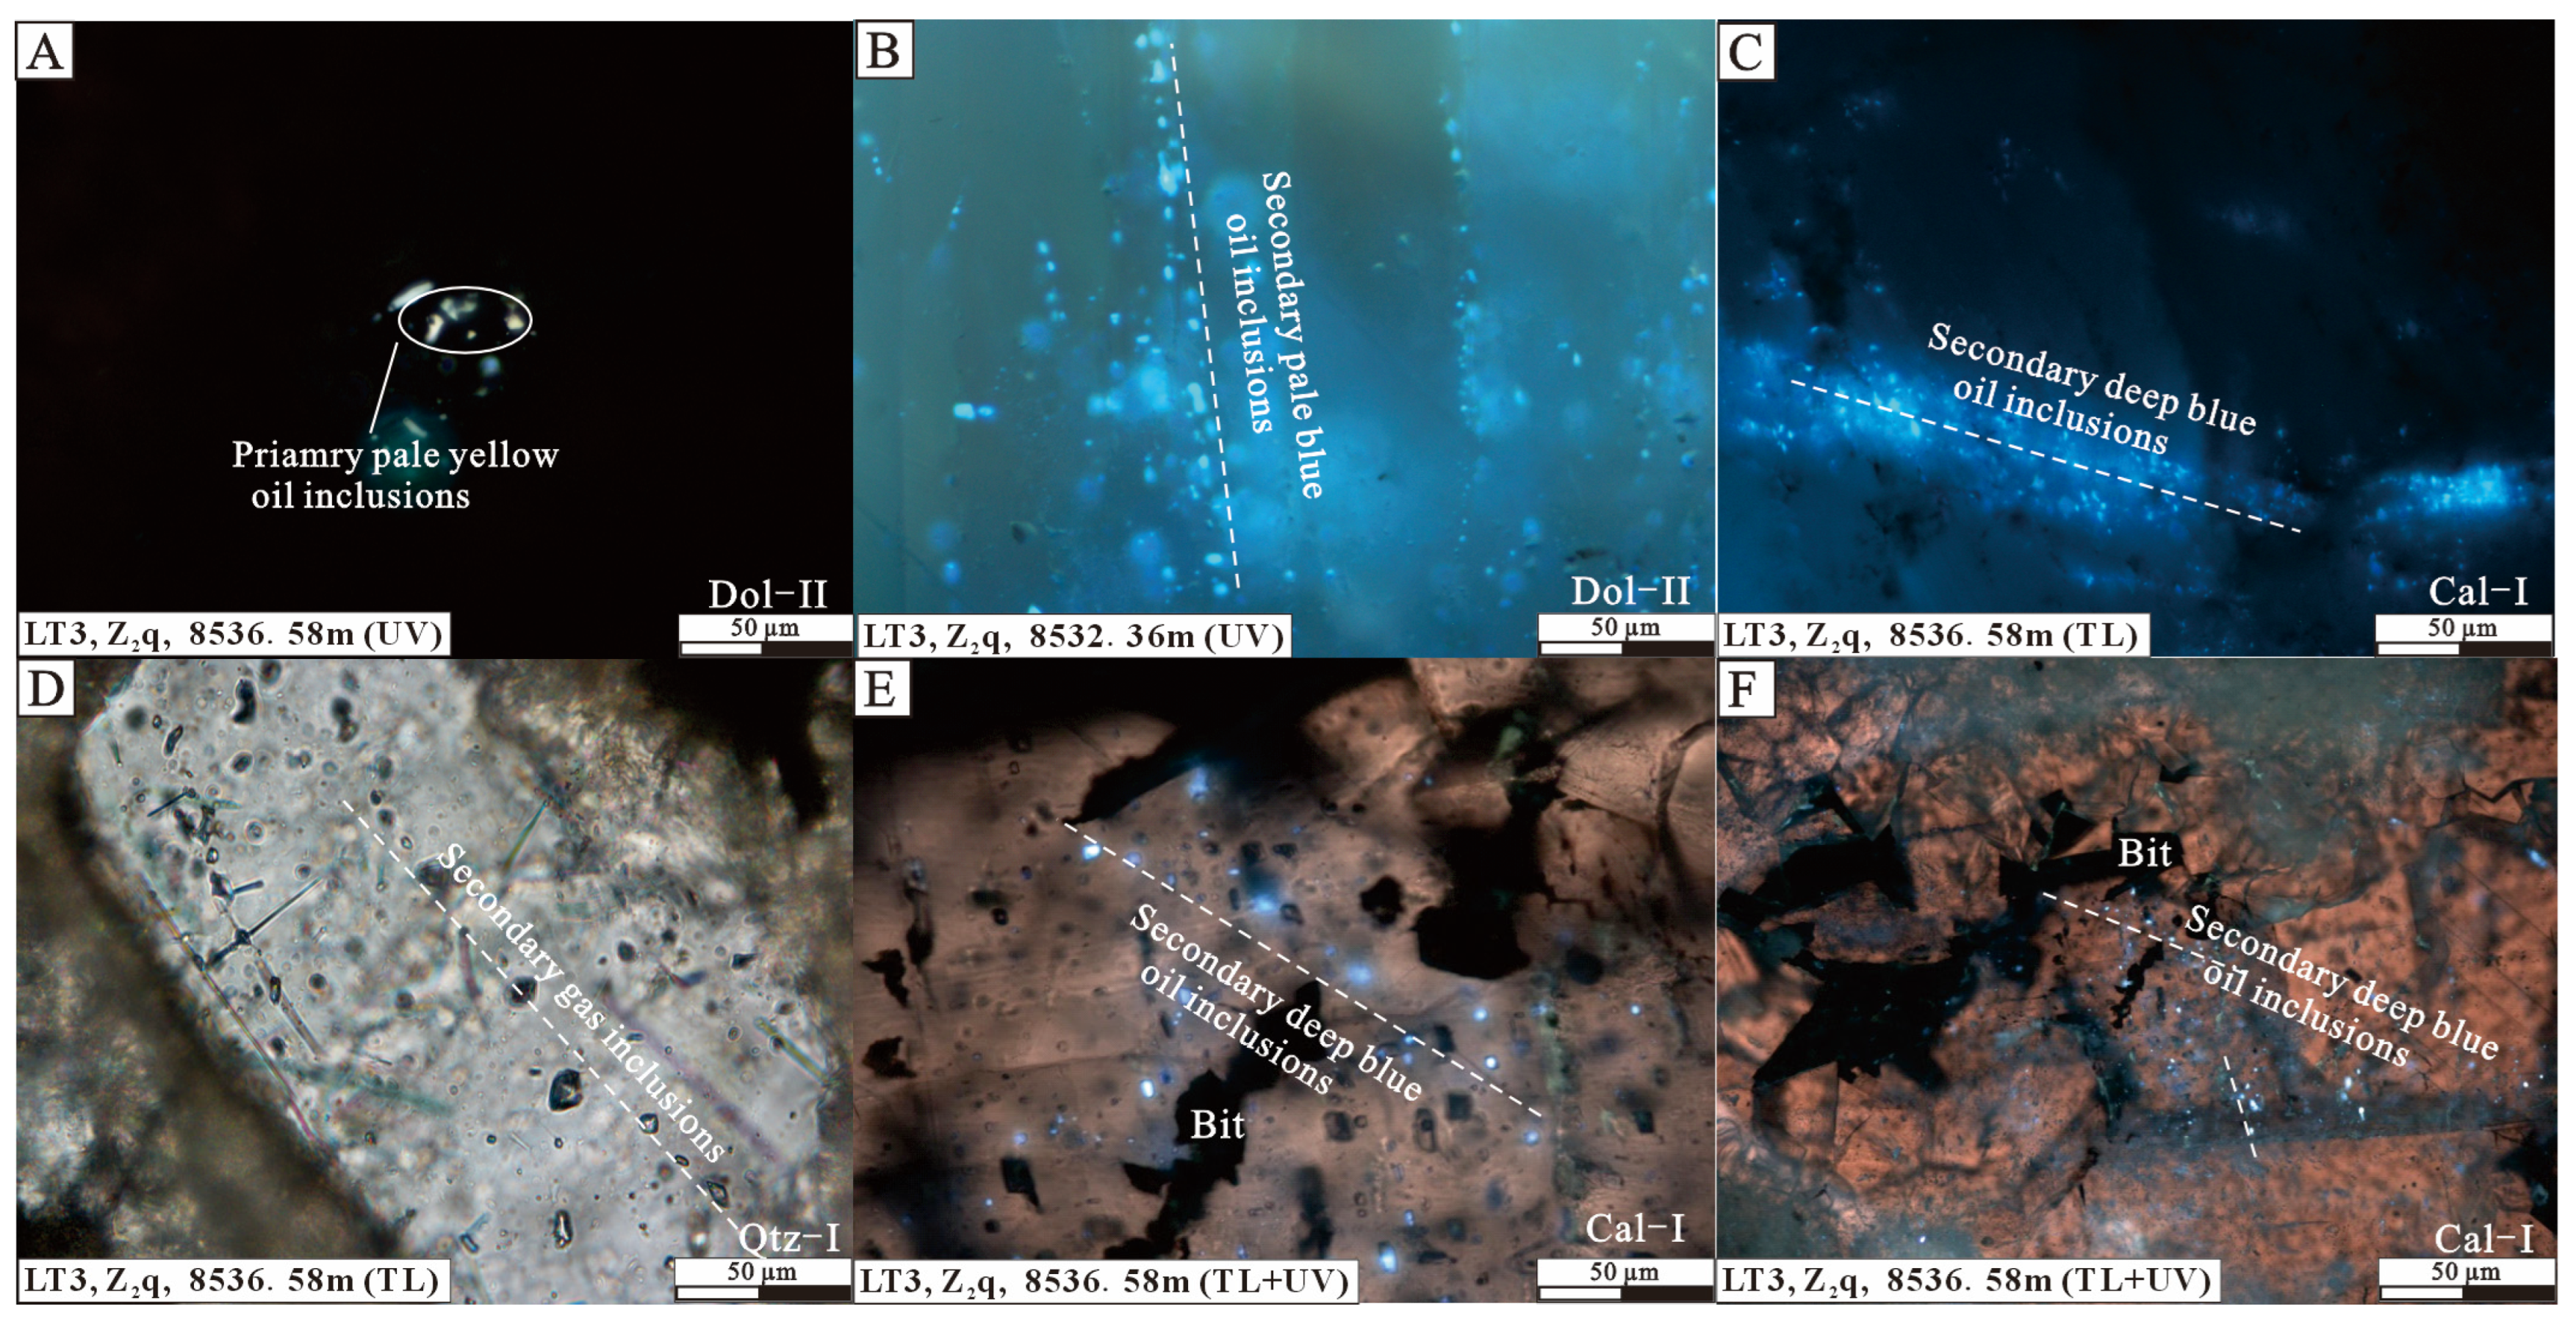
Fluid-inclusion analysis is a key technique for reconstructing the timing of hydrocarbon accumulation and tracing fluid evolution pathways. The microscopic records within inclusions carry critical information regarding hydrocarbon migration, accumulation, and adjustment in petroliferous basins. By integrating the paragenetic sequence of host minerals, the stages, occurrences, and phases of the inclusions can be clarified. Transmitted-light and fluorescence observations of fluid inclusions reveal that abundant primary and secondary oil inclusions developed in the Sinian Qigebulake Formation of Well LT3, with secondary oil inclusions being dominant (Figure 3). Almost no hydrocarbon inclusions were found in dolomite I. Dolomite II mainly captured primary pale-yellow oil inclusions, mostly elliptical or irregular in shape, with diameters generally ranging from 4 to 12 μm, occurring individually or in clusters (Figure 3A). Additionally, secondary pale-blue oil inclusions, primarily elliptical or rhombic and 2 to 10 μm in diameter, are observed distributed in bands or streaks along healed micro-fractures within dolomite II (Figure 3B). No low-maturity yellow-fluorescent inclusions were observed in calcite and quartz minerals. Instead, they predominantly host numerous secondary, gas–liquid two-phase deep-blue fluorescent oil inclusions (Figure 3C) or non-fluorescent single-phase gas inclusions (Figure 3D). These are mostly elliptical or elongated, with diameters typically between 4 and 16 μm, distributed in bands or streaks. Furthermore, within calcite or quartz minerals, the coexistence of deep-blue oil inclusions and bitumen can be observed (Figure 3E,F).

4.3. Fluorescence and Raman Spectroscopic Analysis

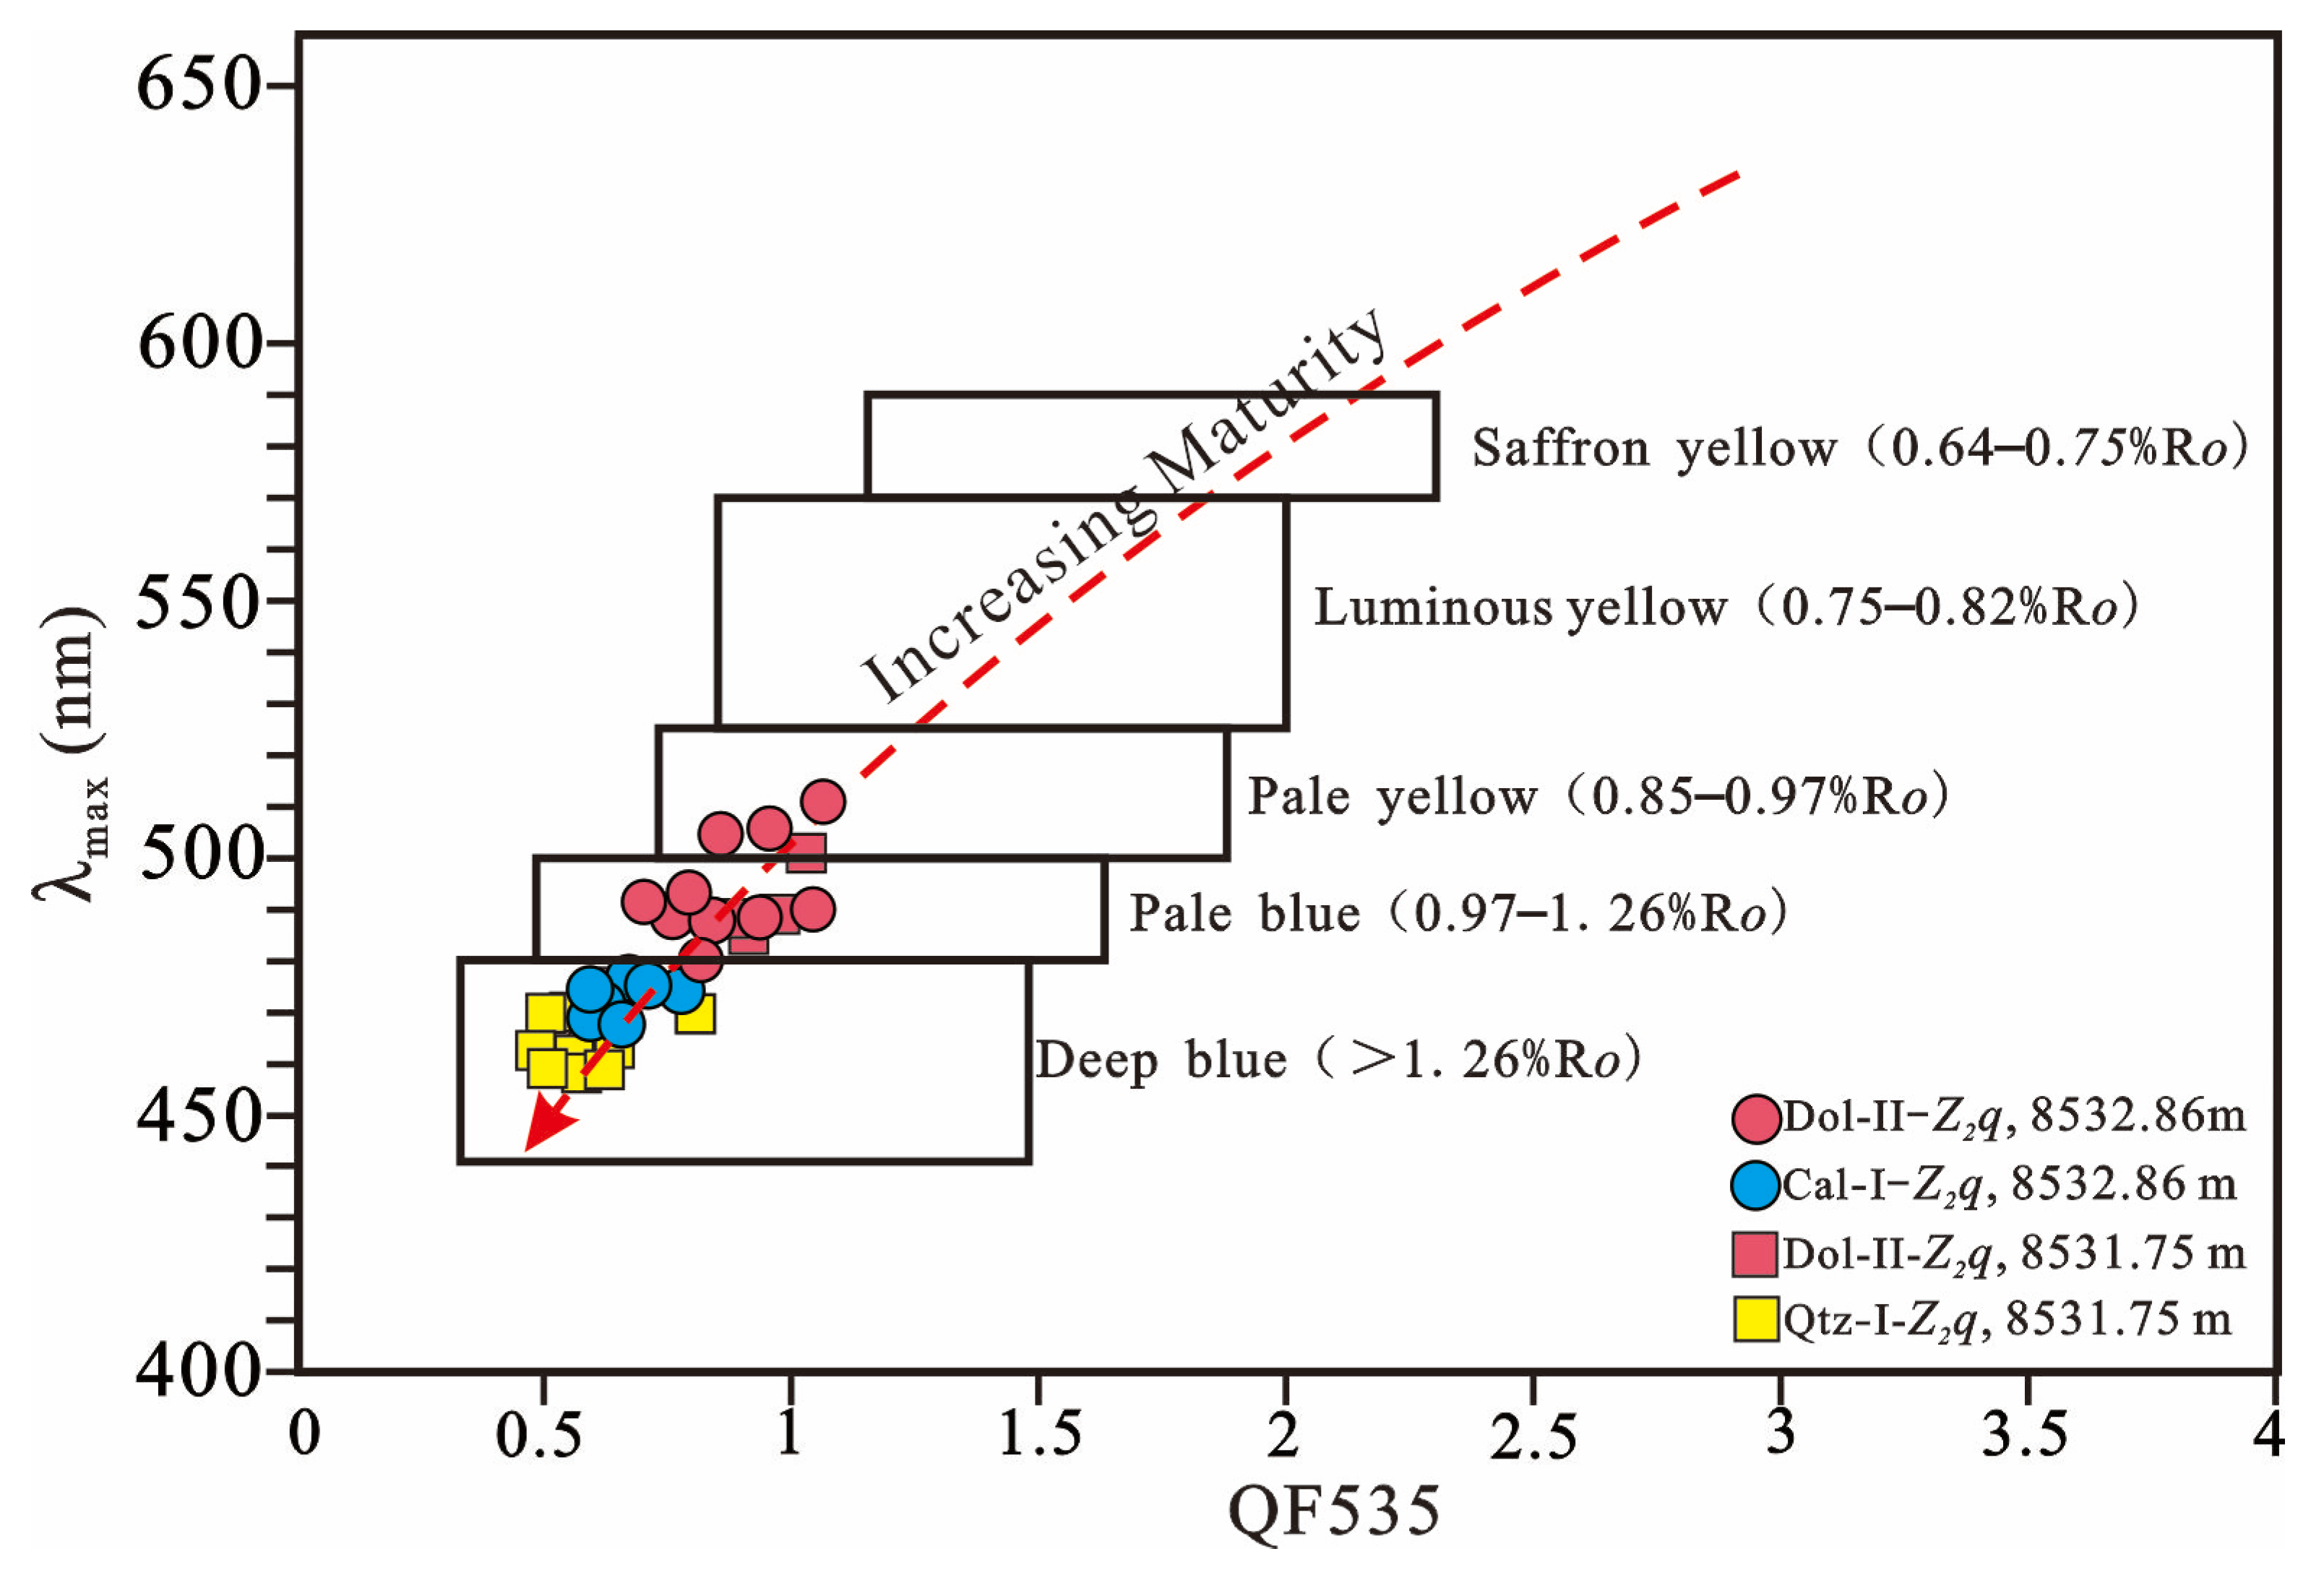
Based on petrographic observations, the significant variations in fluorescence color (from pale yellow to deep blue) of multi-stage oil inclusions intuitively reflect regular changes in their hydrocarbon composition and thermal maturity. To quantitatively characterize these changes, micro-fluorescence spectroscopy is widely employed, using specific spectral parameters to calibrate the maturity level of oil inclusions. The most broadly applied quantitative indicators are the maximum wavelength of the main peak (λmax) and the red–green quotient (QF535). Dolomite II captured primary pale-yellow and secondary pale-blue oil inclusions. The primary pale-yellow oil inclusions have λmax values of 505.5–510.1 nm and QF535 values of 0.9–1.1, corresponding to a vitrinite reflectance (Ro) of 0.85–0.97%. The secondary pale-blue oil inclusions display λmax values of 480.6–494.6 nm and QF535 values of 0.7–1.1, corresponding to an Ro of 0.97–1.26%. The oil inclusions in calcite I and quartz I are predominantly deep blue. Their λmax values range from 458.5 to 478.5 nm, and their QF535 values range from 0.45 to 0.8, indicating an Ro of >1.26% (Figure 4).
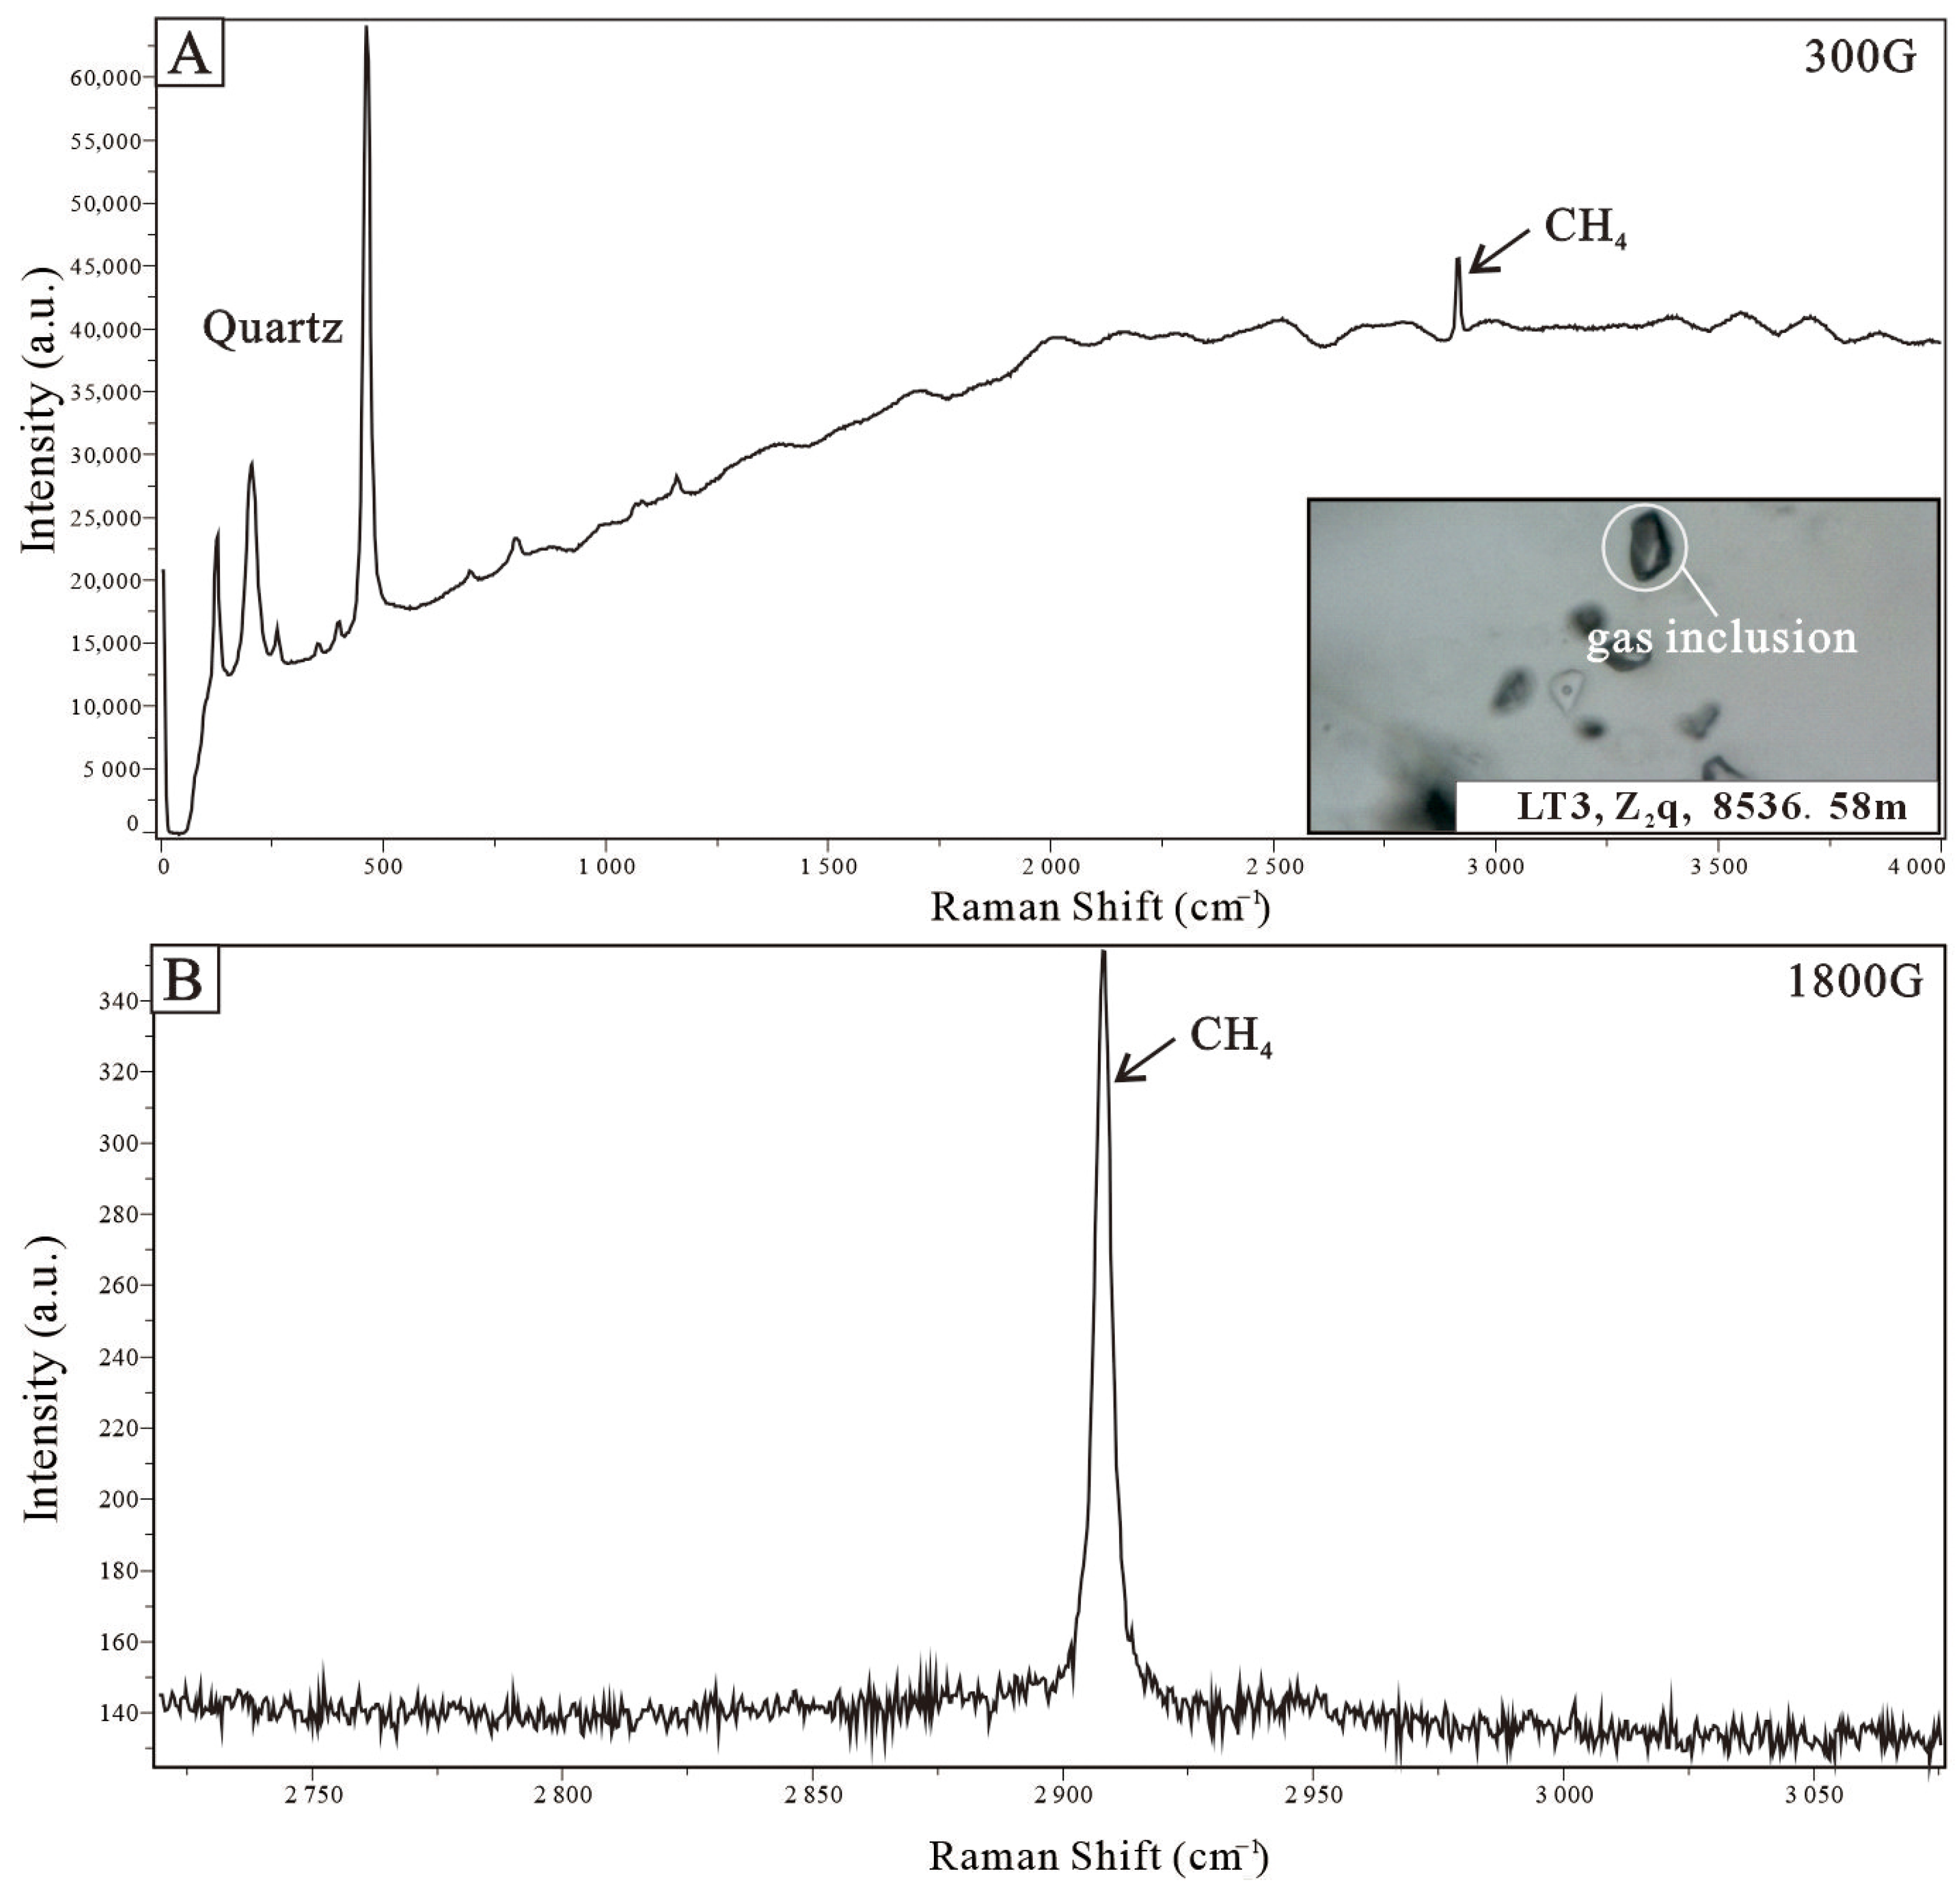
To further clarify the fluid phase characteristics during the gas reservoir charging process in the study area, in situ Raman spectroscopy was performed on the widespread secondary gas inclusions in calcite I and quartz I (Figure 5A). The results show that the gas phase components of these inclusions exhibit a prominent characteristic scattering peak for methane (CH4) at ~2917 cm−1 (Figure 5B), indicating that their gas composition is predominantly methane (Figure 5).

4.4. Rare Earth Element (REE) Characteristics

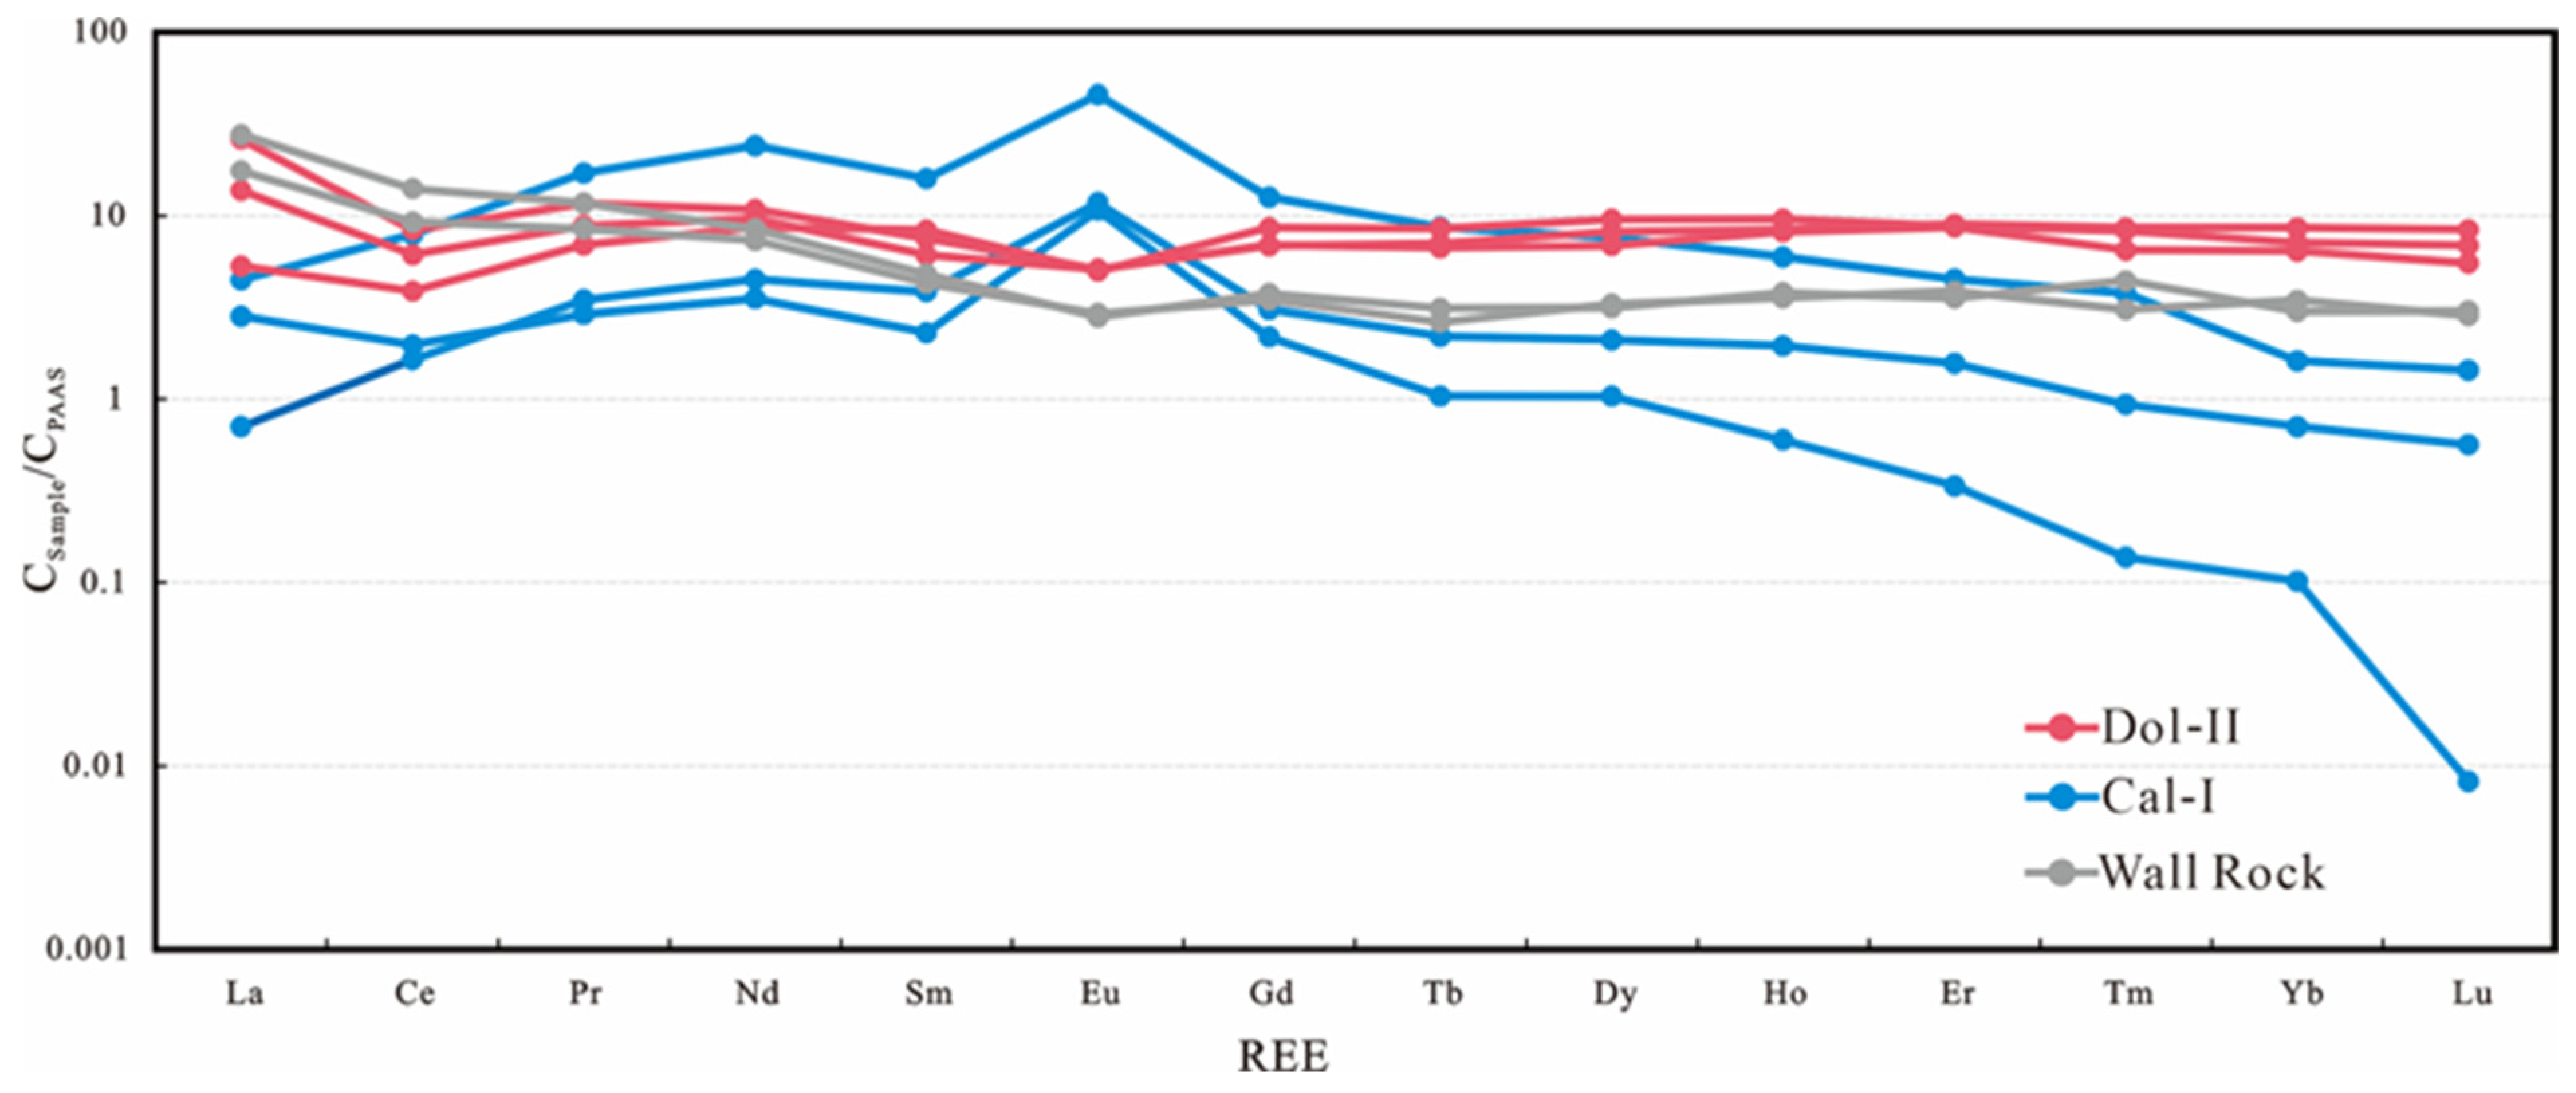
To reveal the fluid sources and formational environments of different diagenetic minerals in the Sinian Qigebulake Formation of Well LT3, this study conducted systematic measurements of major and trace element concentrations in dolomite II, calcite I, and adjacent wall rock samples (Table 2). The results indicate that the total rare earth element content (ΣREE) in dolomite II ranges from 37.99 to 45.08 ppm. It exhibits light rare earth element (LREE) depletion (LREE/HREE = 0.16–0.26), negative δCe anomalies (δCe = 0.45–0.56), slight positive δEu anomalies (δEu = 1.1–1.2), and Fe/Mn ratios ranging from 0.55 to 2.68. Calcite I has a ΣREE of 8.14–54.21 ppm, showing LREE enrichment (LREE/HREE = 1.06–2.06), negative δCe anomalies (δCe = 0.57–0.62), significant positive δEu anomalies (δEu = 4.91–7.21), and Fe/Mn ratios ranging from 0.81 to 0.98. The wall rocks have a ΣREE of 25.85–31.54 ppm, displaying LREE depletion (LREE/HREE = 0.37–0.44), negative δCe anomalies (δCe = 0.71–0.73), slight positive δEu anomalies (δEu = 1.01–1.16), and Fe/Mn ratios between 5.92 and 6.71 (Figure 6).

4.5. Carbon, Oxygen, and Strontium Isotope Compositions

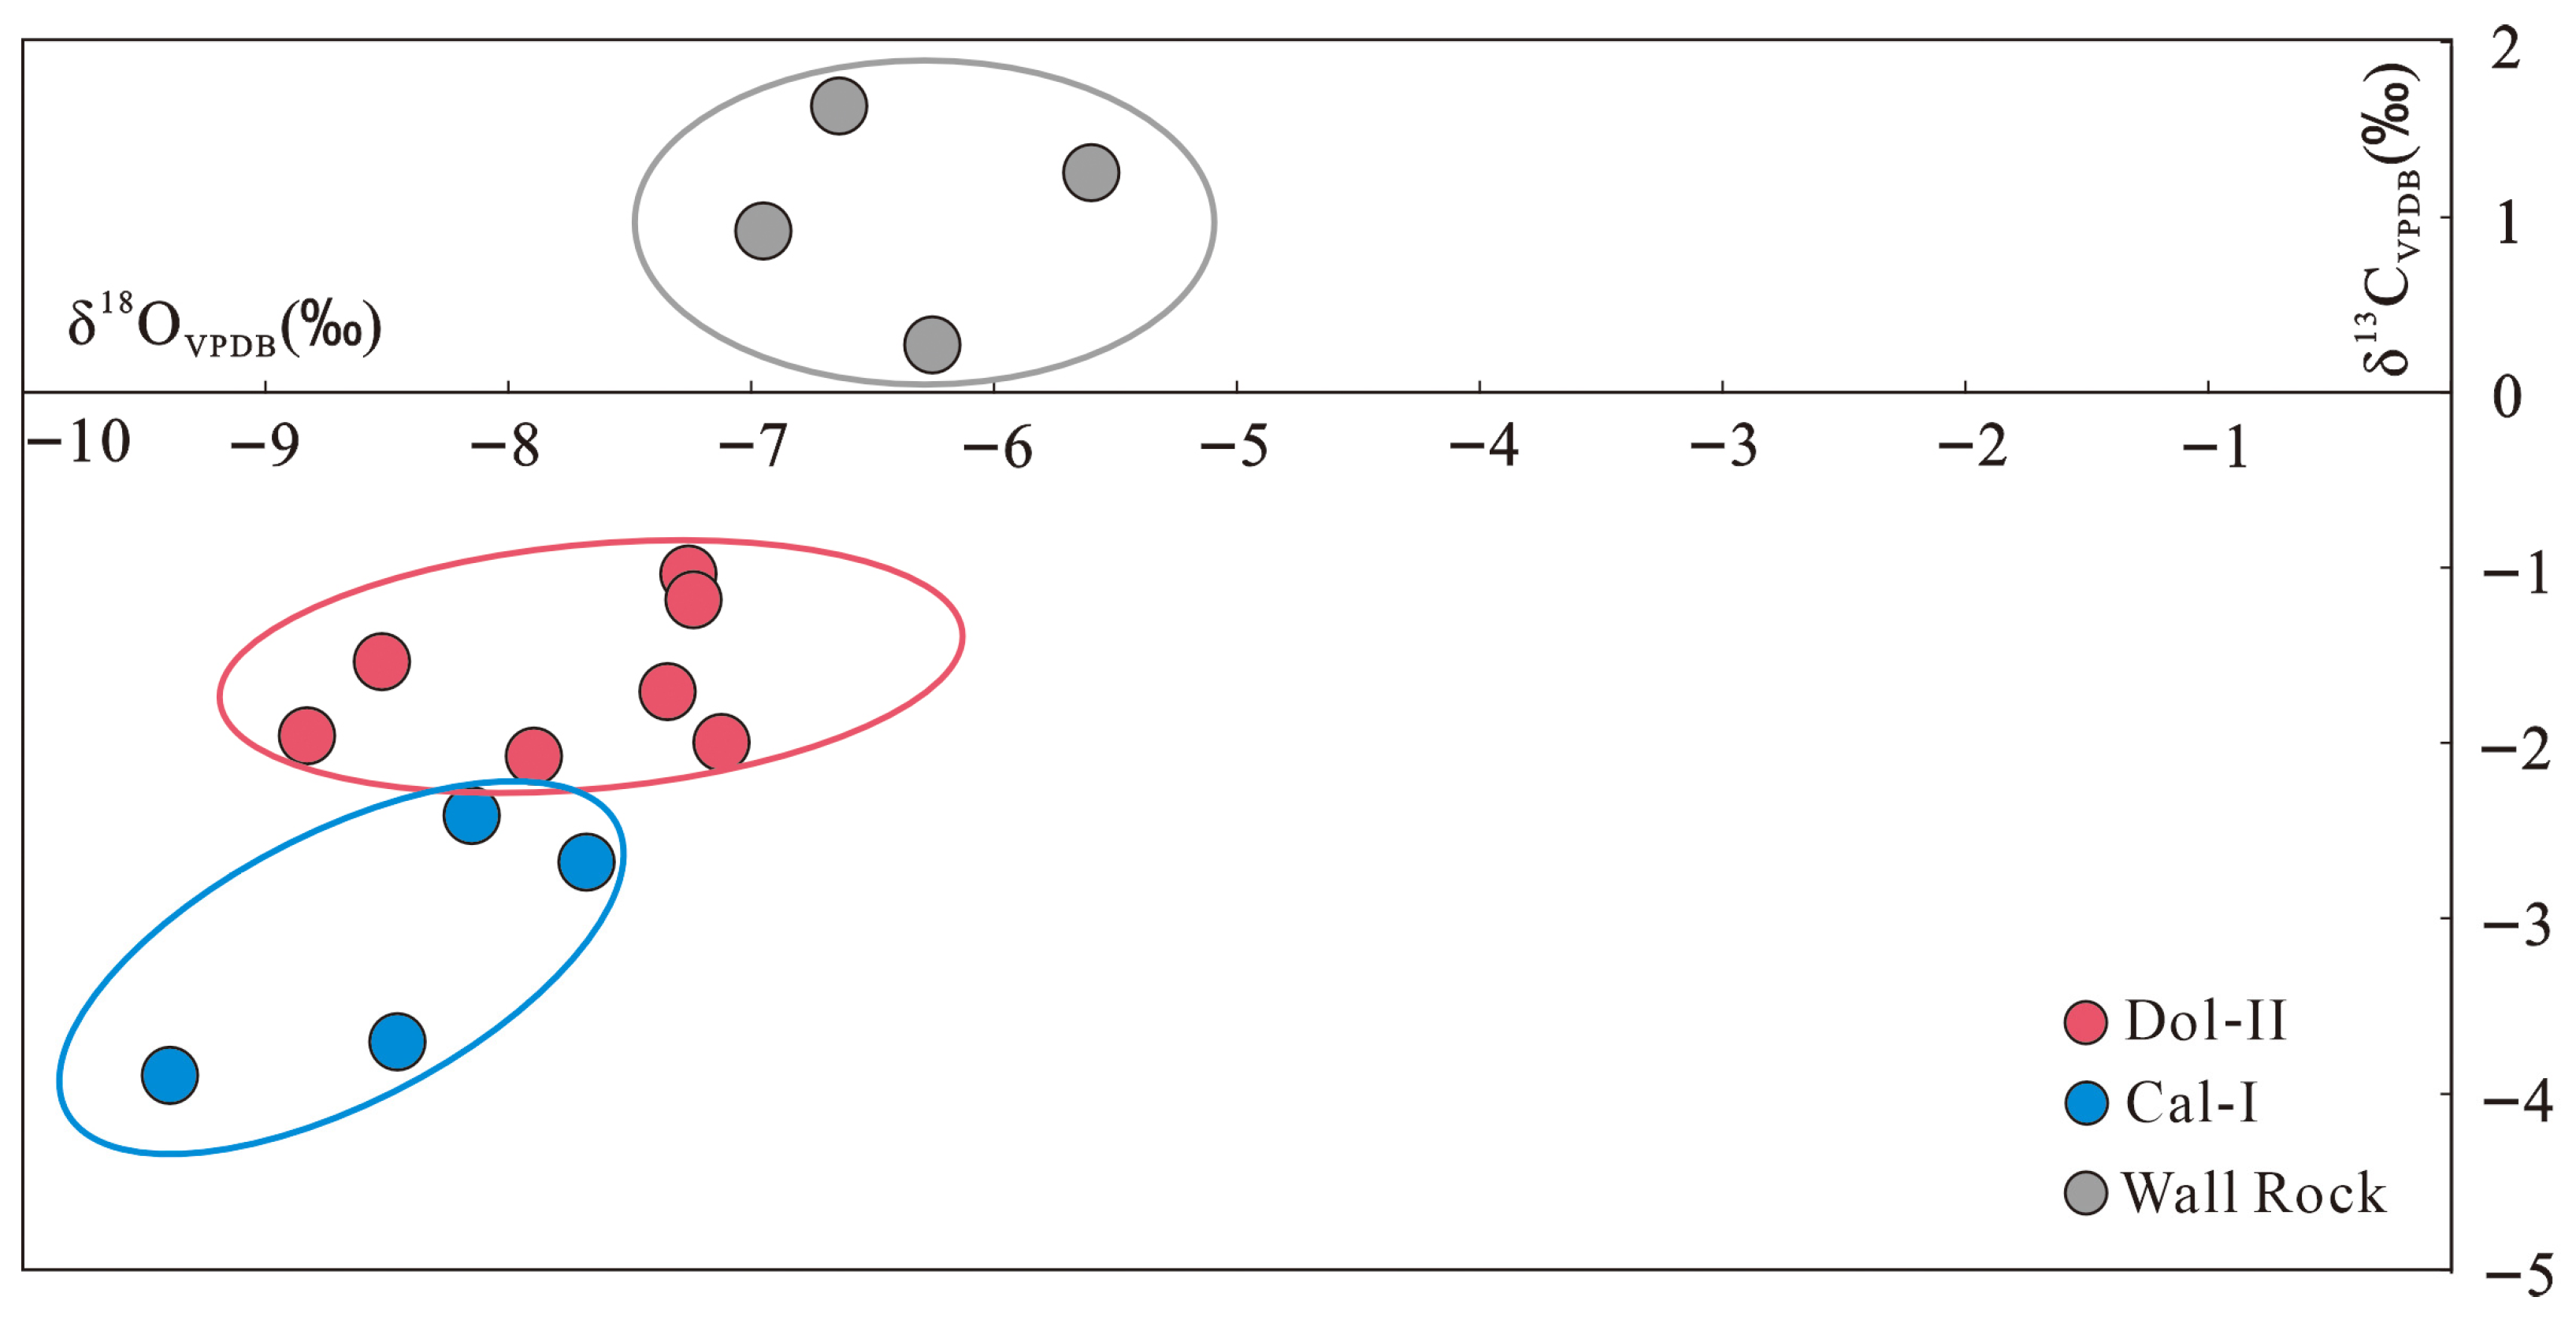
Analyses of stable carbon and oxygen isotope compositions were performed on dolomite II, calcite I, and wall rock samples from the Sinian Qigebulake Formation in Well LT3. The results show that in dolomite II, δ13CVPDB values range from −2.077‰ to −1.051‰, and δ18OVPDB values range from −8.836‰ to −7.125‰. In calcite I, δ13CVPDB values range from −2.423‰ to −3.885‰, and δ18OVPDB values range from −7.895‰ to −9.439‰. For the wall rocks, δ13CVPDB values range from 0.287‰ to 1.632‰, and δ18OVPDB values range from −5.595‰ to −6.95‰ (Figure 7).
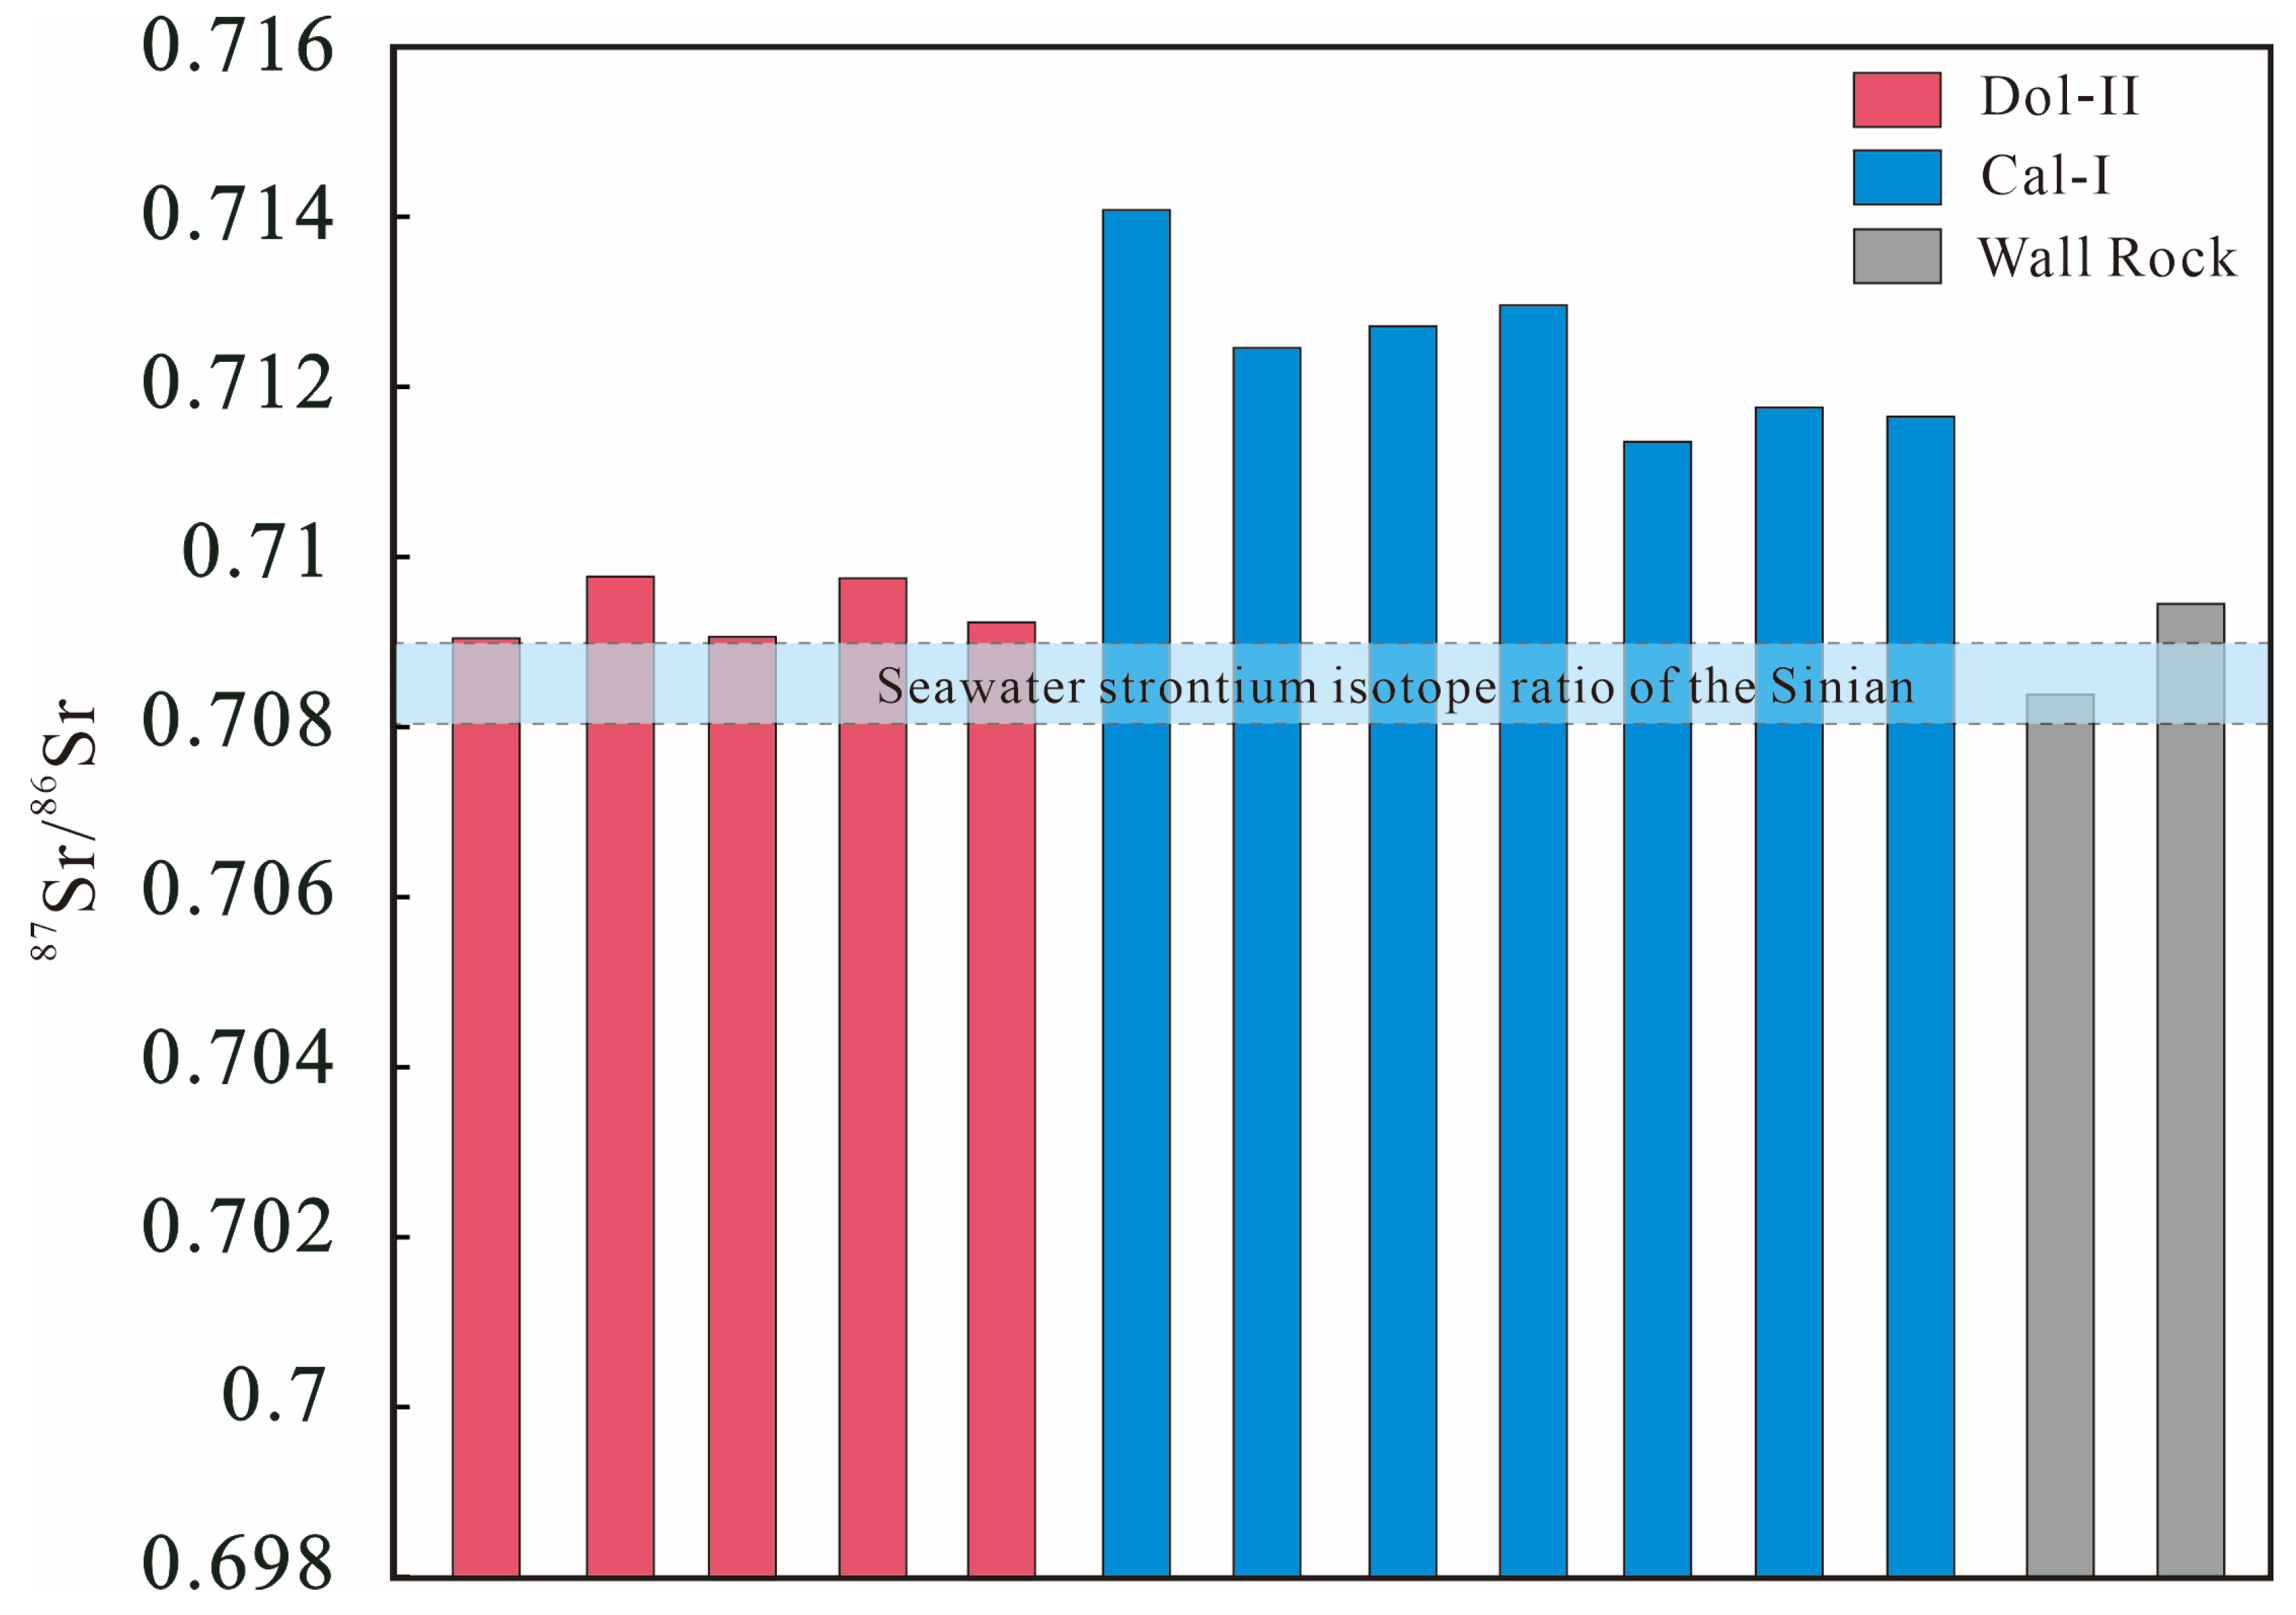
Concurrently, strontium isotope analyses were conducted on the same mineral development zones. In dolomite II, 87Sr/86Sr ratios range from 0.70918 to 0.70984, with an average of 0.70942. In calcite I, 87Sr/86Sr ratios range from 0.71161 to 0.71417, averaging 0.71256. In the wall rocks, 87Sr/86Sr ratios range from 0.7083 to 0.7101, averaging 0.7092 (Figure 8).

4.6. Fluid-Inclusion Homogenization Temperatures and Trapping Conditions

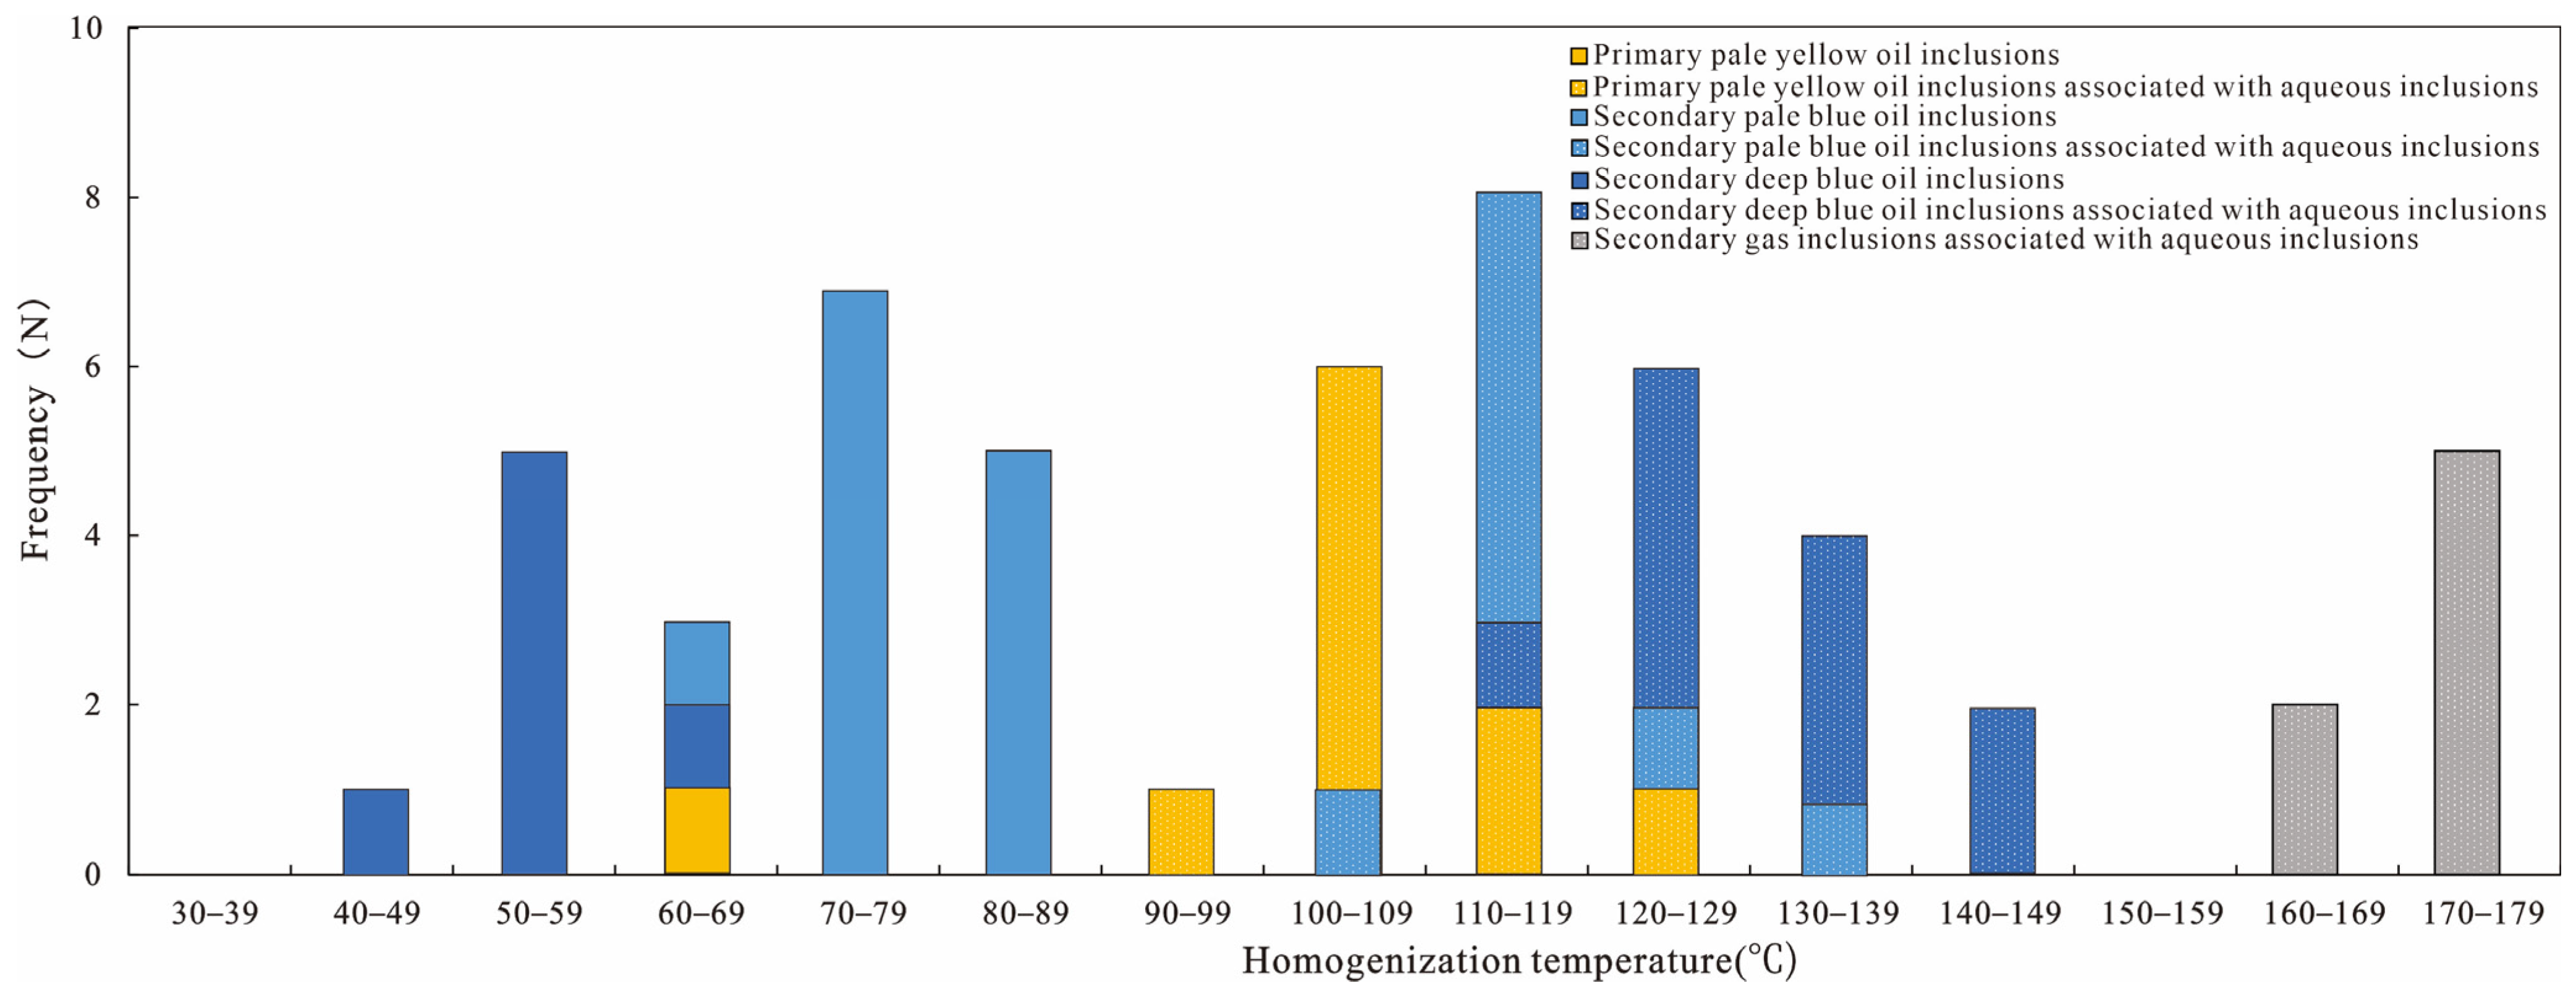
The homogenization temperatures were measured for the oil inclusions and their associated aqueous inclusions in different mineral stages. Dolomite II primarily hosts primary pale-yellow and secondary pale-blue oil inclusions. The Th of primary pale-yellow oil inclusions is mainly 60–69 °C, with associated aqueous inclusions mostly at 100–109 °C. The Th of secondary pale-blue oil inclusions is mainly 70–79 °C, with associated aqueous inclusions primarily between 110 and 119 °C. Calcite I and quartz I predominantly contain deep-blue oil inclusions and secondary gas inclusions. The Th of deep-blue oil inclusions ranges mainly from 50 to 59 °C, while their associated aqueous inclusions have Th values primarily between 120 and 129 °C. Aqueous inclusions associated with the gas inclusions show Th values mainly in the range of 170–179 °C (Figure 9).
Furthermore, to quantitatively reconstruct the paleo-pressure conditions during different geological periods, the trapping pressures of the multi-stage fluid inclusions were systematically determined based on the isochore intersection method (Table 3). The primary pale-yellow oil inclusions, representing the initial charging stage, record trapping pressures ranging from 33.2 to 40.6 MPa. For the mid-stage charging, the secondary pale-blue oil inclusions exhibit slightly higher trapping pressures of 41.9–45.6 MPa. As the reservoir entered the deep burial stage, the secondary deep-blue oil inclusions record a significant pressure increase to 61.4–64.4 MPa. Ultimately, the final-stage secondary methane gas inclusions (with a Raman shift near 2911.66 cm−1) record the highest paleo-pressure of approximately 79.98 MPa, reflecting the extreme pressure conditions during the Himalayan deep burial (Table 3).

4.7. In Situ U-Pb Dating of Carbonates

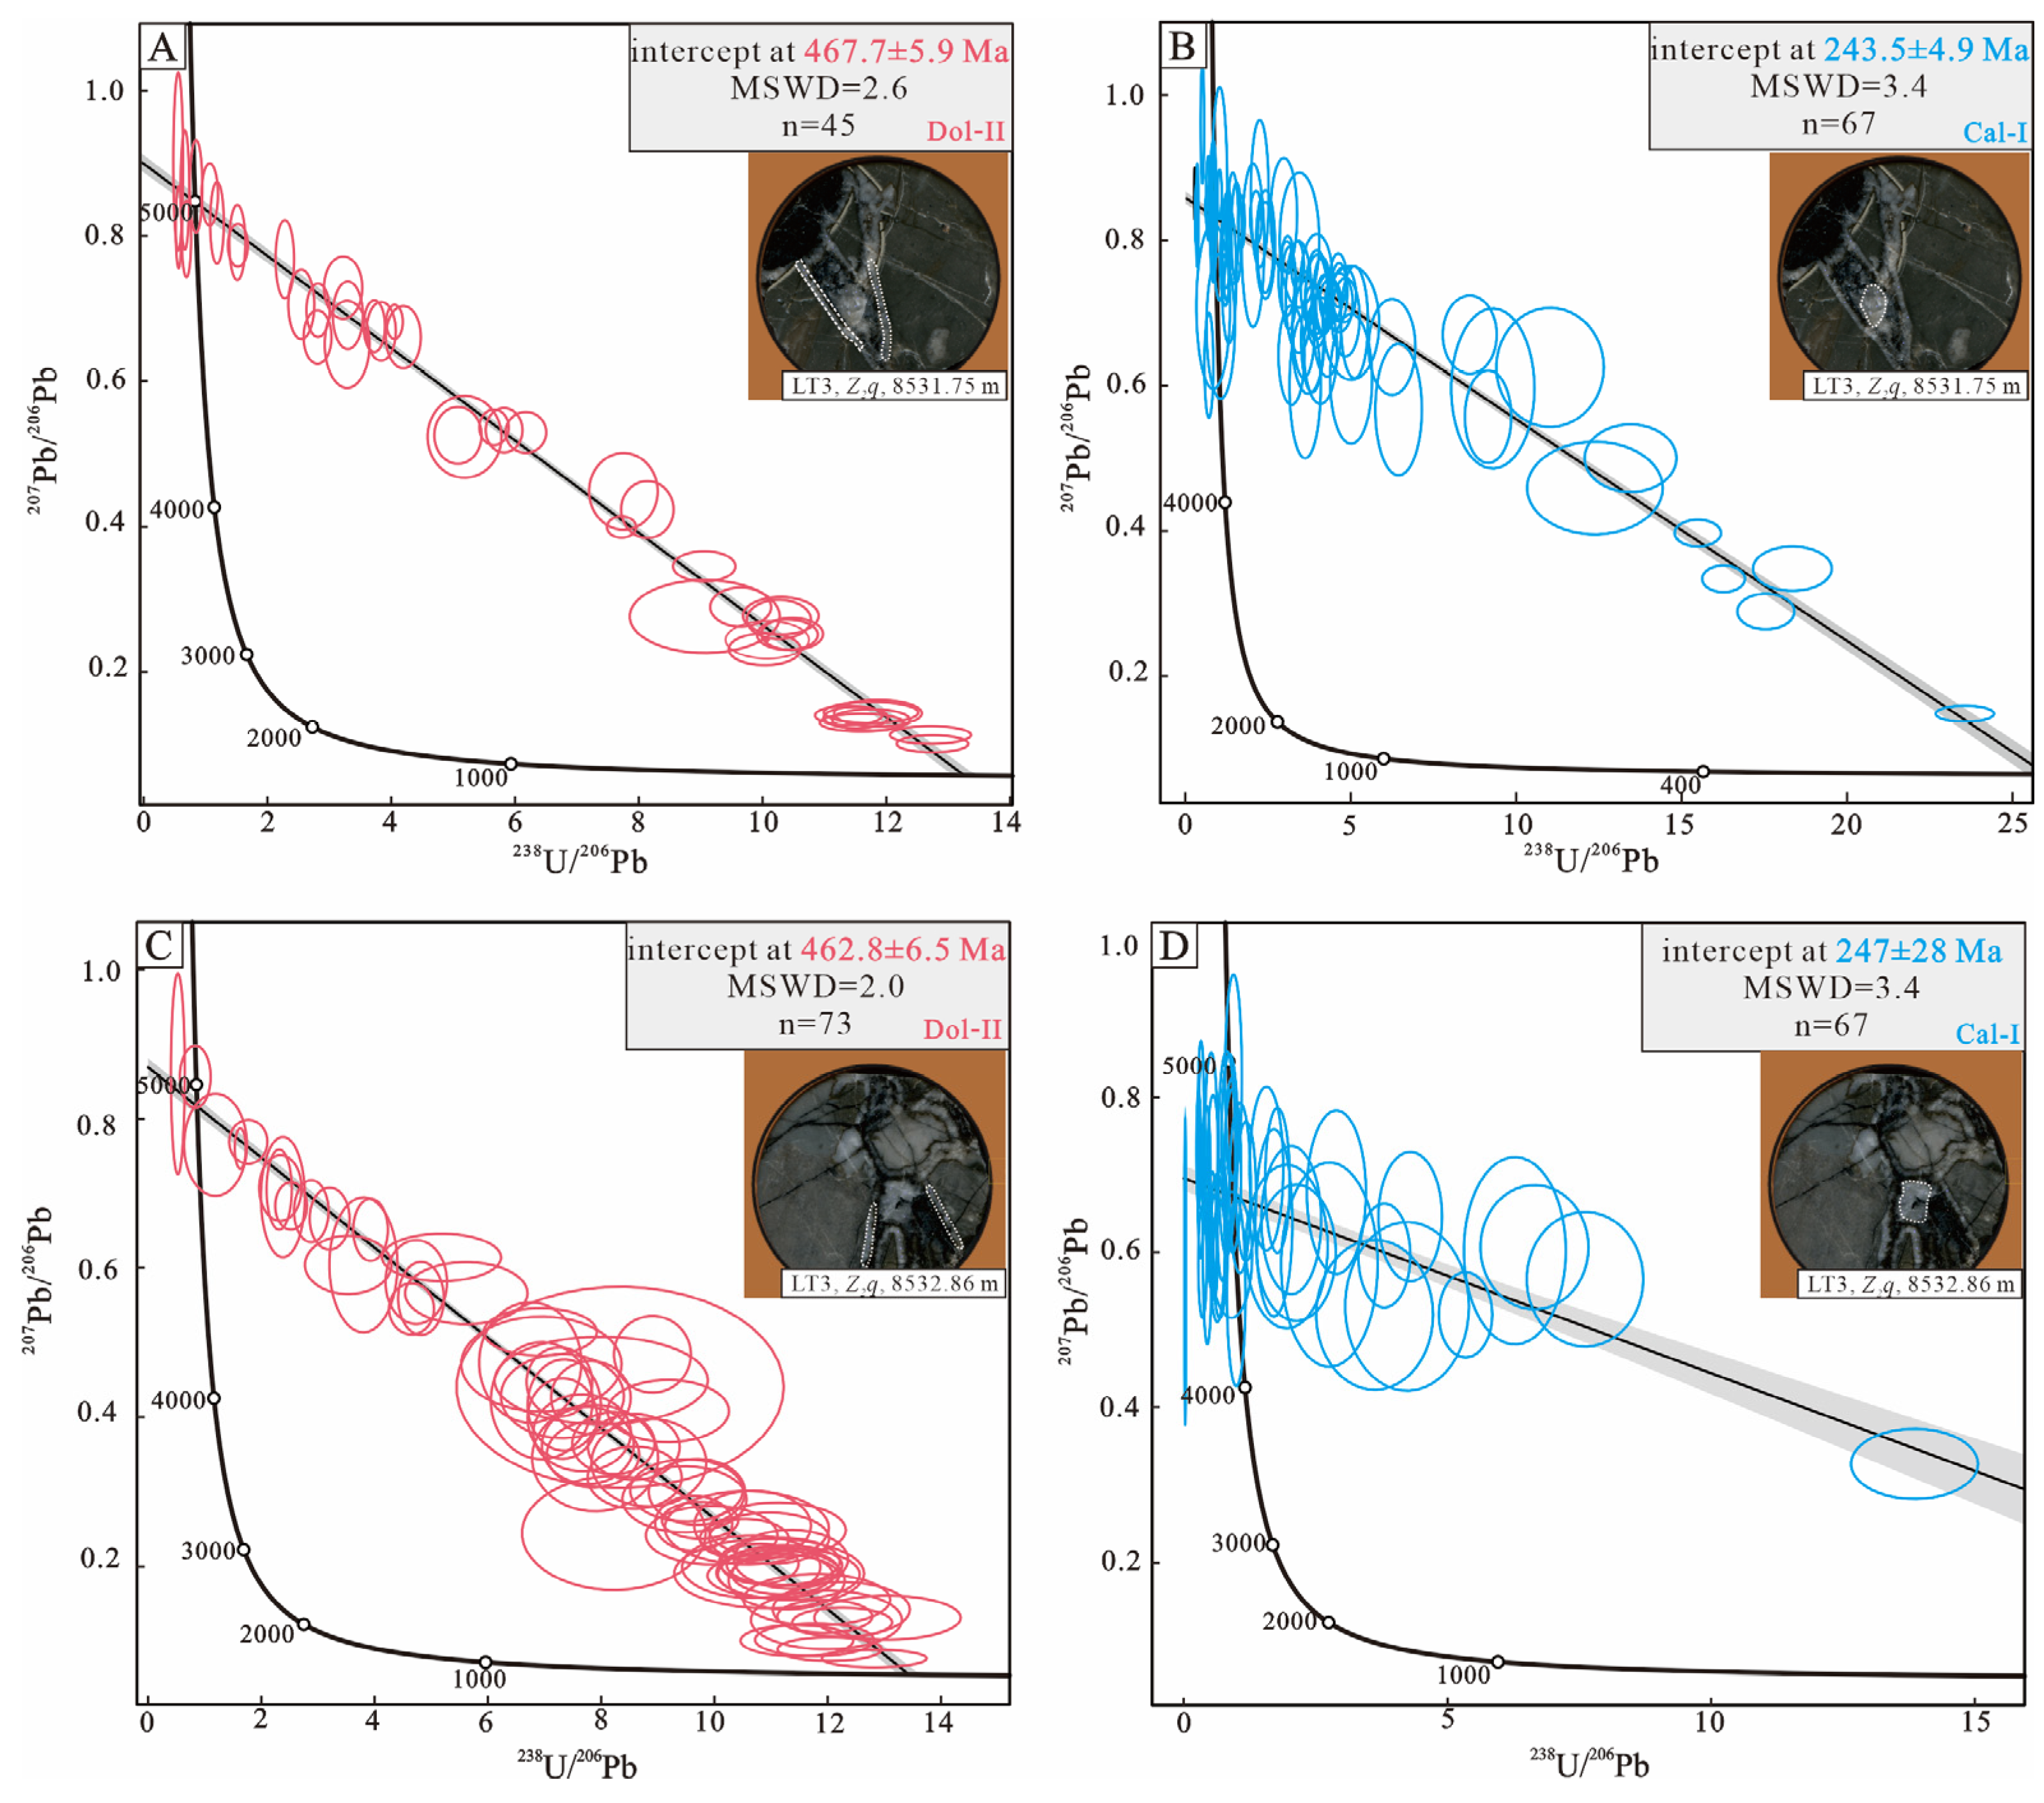
LA-ICP-MS in situ U-Pb dating results provide absolute time scales for vein development. Absolute U-Pb dating was conducted on different stages of dolomite and calcite veins (Figure 10).
The results indicate that the early dolomite II (Dol-II) at the fracture–vug margins yielded U-Pb isotopic ages of 467.7 ± 5.9 Ma and 462.8 ± 6.5 Ma, corresponding to the Middle Ordovician (Middle Caledonian) (Figure 10A,C) and the late-stage calcite I (Cal-I) filling the center yielded U-Pb isotopic ages of 243.5 ± 4.9 Ma and 247 ± 28 Ma, corresponding to the Early Triassic (Indosinian) (Figure 10B,D). Although the age of 247 ± 28 Ma exhibits a relatively large uncertainty, primarily caused by its extremely low uranium concentrations and high initial common lead contents, it is strongly supported by the high-precision age of 243.5 ± 4.9 Ma obtained from the other coeval sample, which ensures the reliability of this chronological constraint.

5. Discussion

5.1. Timing and Sources of Multi-Stage Fluid Activities

Integrating the results of micro-area trace elements, stable isotopes, and radiogenic isotopes, the authigenic mineral sequence in the Sinian Qigebulake Formation of Well LT3 records two distinct stages of fluid activity.
The early-stage dolomite II (Dol-II) veins, dated by U-Pb to the Middle Ordovician (~468–463 Ma), exhibit geochemical compositions closely resembling the Sinian marine wall rocks. Their REE patterns show LREE depletion and negative Ce anomalies, while their 87Sr/86Sr ratios (0.70918–0.70984, avg. 0.70942) align with the Sinian background (avg. 0.7092). This high degree of similarity indicates that Dol-II precipitated in a relatively closed system dominated by water–rock interaction [41,42]. These fluids were likely marine-origin formation waters from the overlying Lower Cambrian, which, along with initial hydrocarbon expulsion, migrated into the Sinian fracture–vug networks during the early deep-burial stage [43].
In contrast, the mid-stage calcite I (Cal-I) and associated quartz (Qtz-I) minerals, dated to the Early Triassic (~247–244 Ma), reveal a drastic environmental shift. Cal-I displays significant LREE enrichment, extremely strong positive Eu anomalies (δEu up to 7.21), and highly radiogenic strontium (87Sr/86Sr avg. 0.71256). Combined with a significant negative shift in δ18OVPDB (as low as −9.439‰), these signatures point to an influx of high-temperature, strongly reducing, Sr-rich hydrothermal fluids [44,45,46]. Furthermore, the significant spread in the REE distribution (e.g., the wide variation in total REE for Cal-I, ranging from 8.14 to 54.21 ppm) reflects the pronounced compositional heterogeneity inherent to these deep hydrothermal activities. This large variation is likely driven by dynamic water–rock interactions during rapid precipitation and multi-episodic, localized micro-pulses of hydrothermal fluids within the confined fracture–vug systems. Such dynamic subsurface processes naturally lead to micro-scale elemental variations even within the same mineral phase. Controlled by the periodic activation of deep strike-slip faults during the Early Triassic (Indosinian), these deep-seated fluids—likely enriched in radiogenic Sr through interaction with the crystalline basement—intruded the Sinian reservoirs. This hydrothermal pulse caused intense dissolution and reshaped early pore structures, providing critical physical pathways for the subsequent migration and adjustment of highly mature hydrocarbons [47,48,49].

5.2. Multi-Stage Hydrocarbon Accumulation History of the Sinian

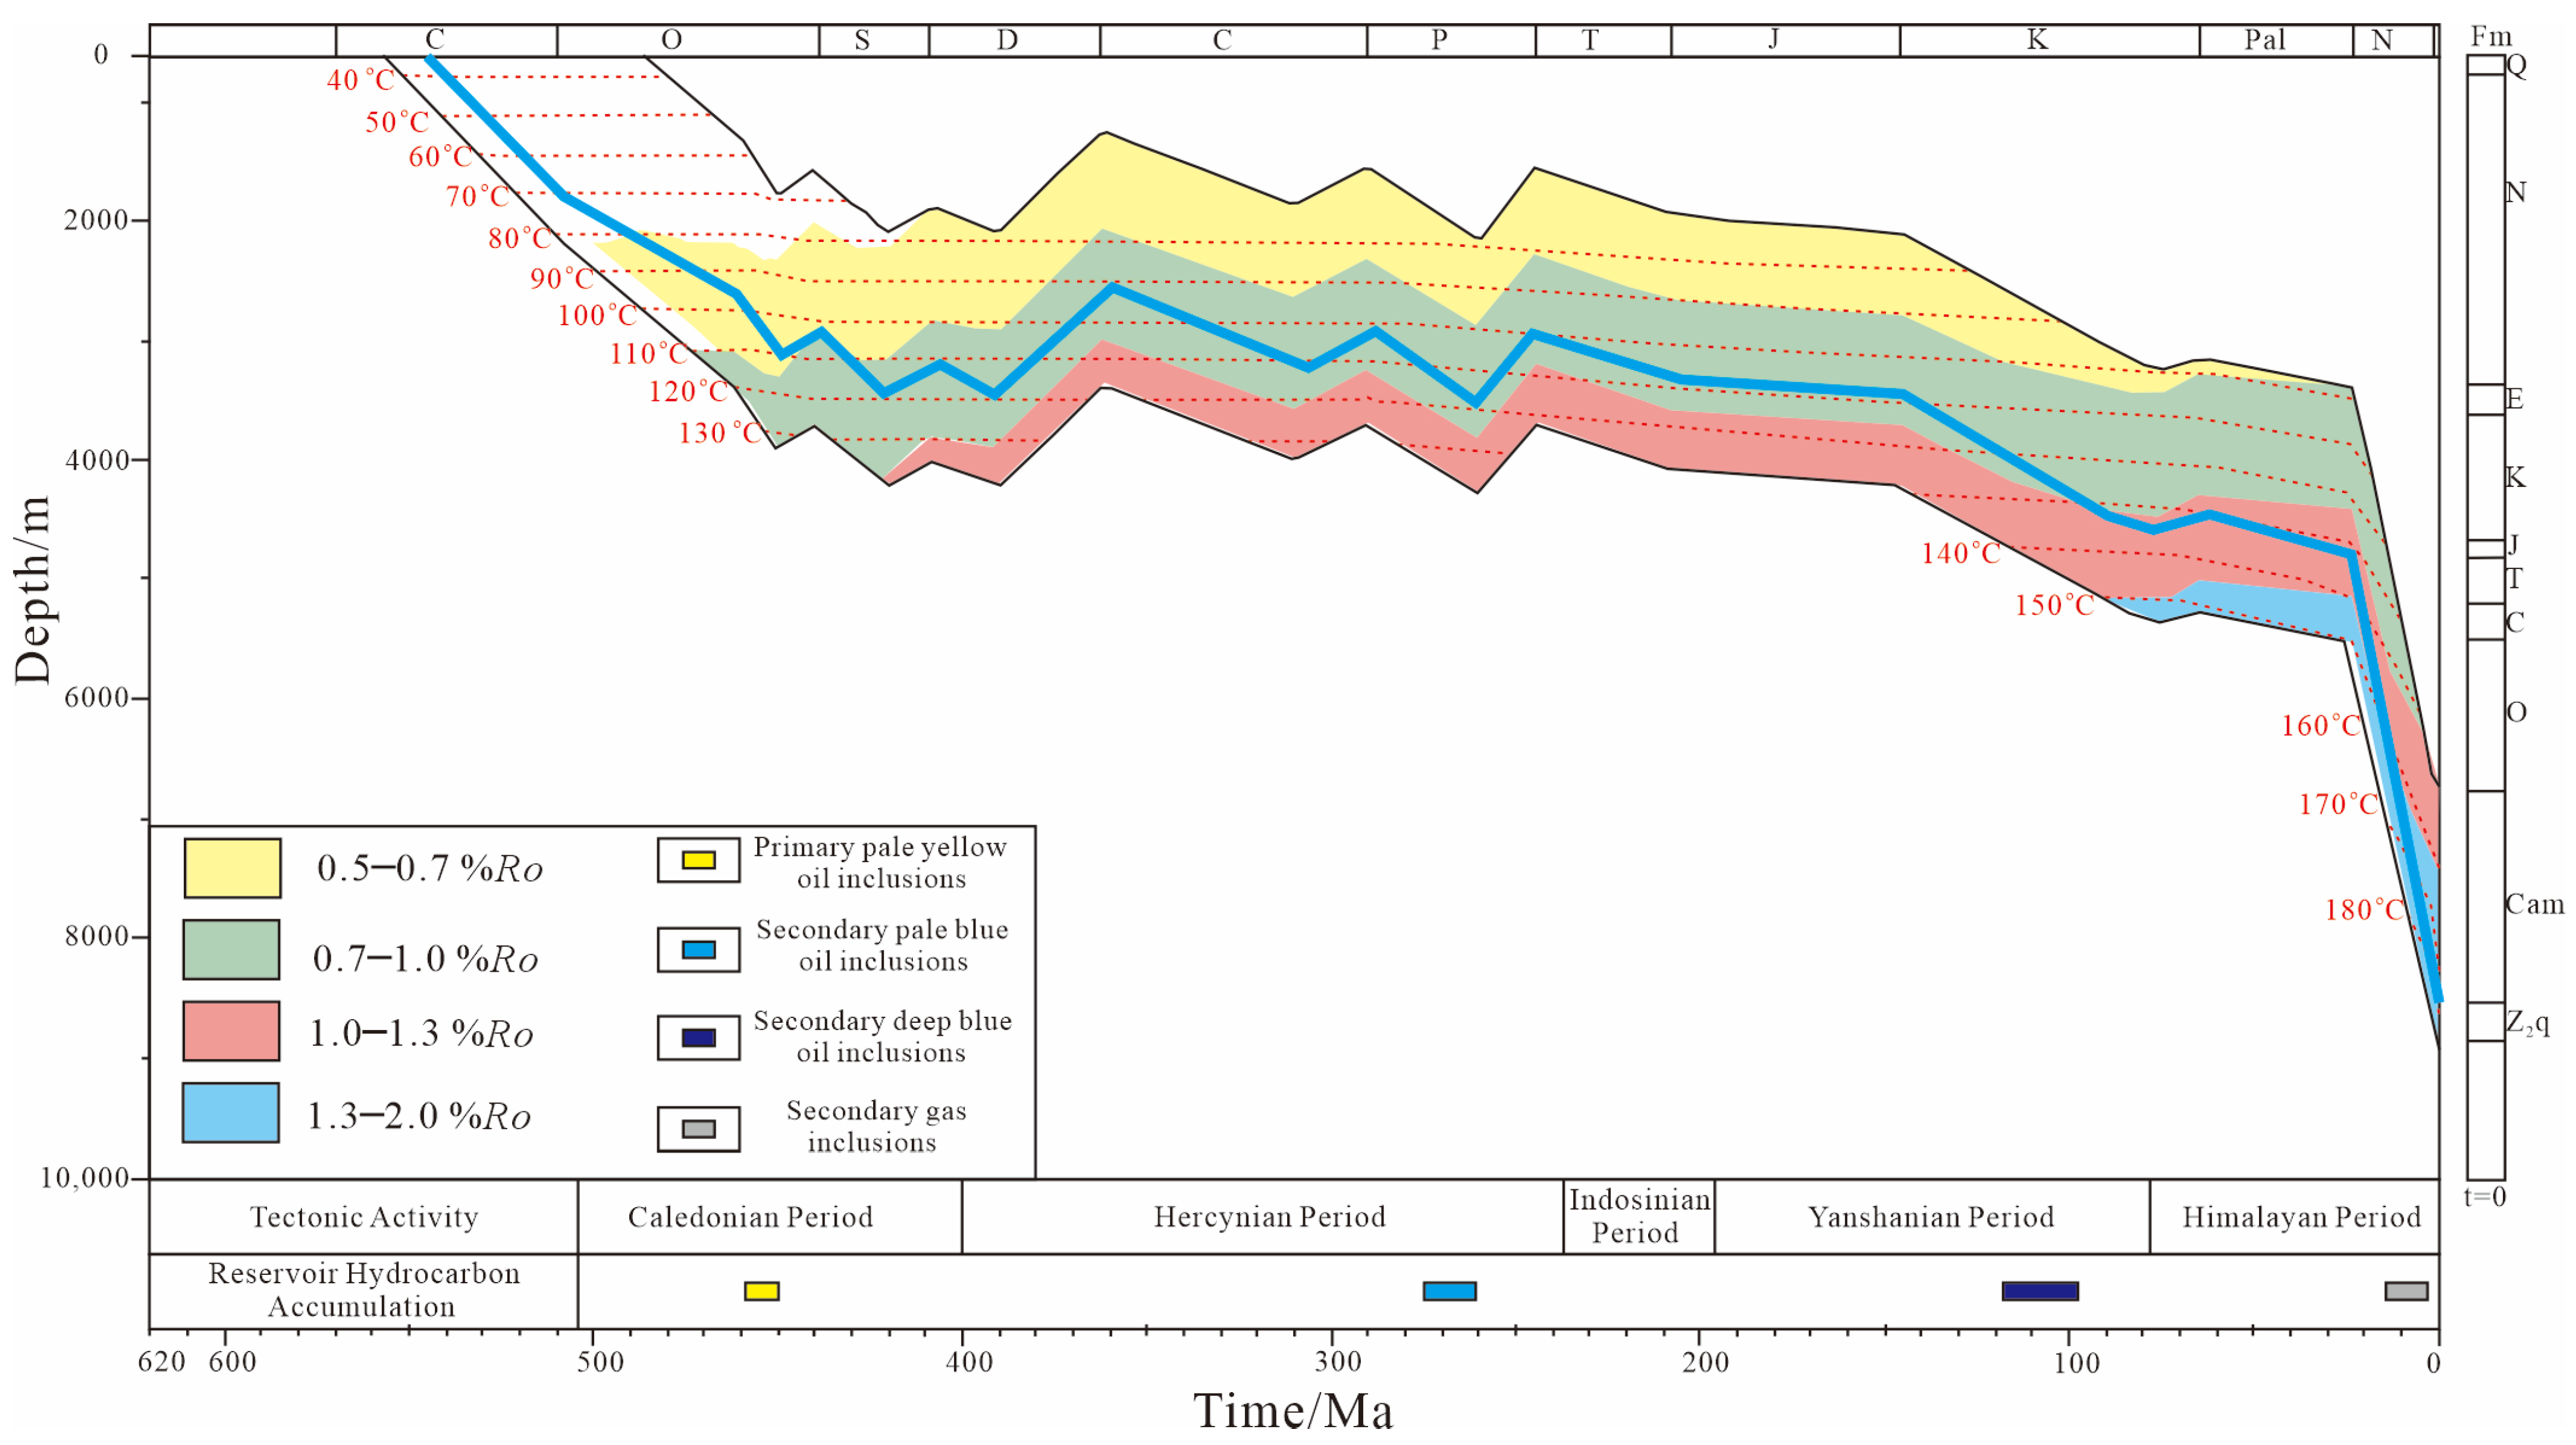
Fundamentally, this study is distinguished from previous generalized models by successful decoupling of the overprinted hydrothermal events. By combining with in situ U-Pb absolute dating, fluid-inclusion assemblages, and burial–thermal modeling, we demonstrate that the Sinian reservoirs in Well LT3 exhibit a four-stage hydrocarbon charging history. To quantitatively constrain the trapping conditions, the homogenization temperatures (Th) of aqueous inclusions coexisting with the corresponding oil/gas inclusions were utilized as the minimum trapping temperatures. By projecting these quantitative temperature constraints onto the established burial–thermal history curve (Figure 11), we systematically reconstructed the paleo-temperatures, paleo-depths, and geological timing for each charging episode. The fluid environment evolved from early diagenetic formation water to deep-seated hydrothermal sources, significantly influencing the accumulation process.
The first stage of hydrocarbon charging occurred during the Middle Caledonian (~468–463 Ma). As the basin subsided during the Middle Ordovician, the Lower Cambrian Yuertusi source rocks reached the oil generation threshold. At a paleo-depth of 3000–4000 m and paleo-temperatures of 100–109 °C, the Sinian reservoir received its initial charge of low-maturity oil, recorded as primary pale-yellow oil inclusions within Dol-II.
The second stage took place during the Late Hercynian (approx. 275–260 Ma). Deeper burial (4000–5000 m, 120–130 °C) pushed the source rocks to peak oil generation, leading to a large-scale secondary charging of medium-to-high-maturity oil, evidenced by secondary pale-blue oil inclusions (associated aqueous inclusions Th 110–119 °C) in Dol-II. Following this, the fluid system was influenced by high-temperature hydrothermal fluids during the Early Triassic (Indosinian, ~247–244 Ma). These fluids precipitated Cal-I and Qtz-I and modified the reservoir’s hosting media, setting the stage for later fluid adjustment without constituting an independent charging event.
The third stage involved the continuous charging of high-maturity oil during the Late Yanshanian (approx. 120–100 Ma). As the basin entered a foreland deep-burial stage (depths > 6000 m, 120–129 °C), highly mature oil was captured as deep-blue oil inclusions within the hydrothermal minerals (Cal-I and Qtz-I).
The fourth stage occurred during the Himalayan (approx. 40–0 Ma). Rapid burial and extreme temperatures triggered the in situ thermal cracking of retained crude oil into bitumen, which was accompanied by the charging of large volumes of dry gas from over-mature source rocks [50]. CH4-dominated gas inclusions associated with late-stage aqueous inclusions (Th 170–179 °C) represent this final phase, which finalized the present-day ultra-deep oil and gas distribution (Figure 11).

6. Conclusions

(1)
Multi-stage authigenic minerals developed within the fracture–vug systems of the Sinian Qigebulake Formation in Well LT3, following a paragenetic sequence of early dolomite (Dol-I), second-stage dolomite (Dol-II), a co-precipitated assemblage of calcite (Cal-I) and quartz (Qtz-I), and latest-stage solid bitumen (Bit).
(2)
Geochemical evidence reveals two distinct fluid sources: the early Dol-II veins (avg. 87Sr/86Sr 0.70942) share REE patterns and Sr isotopes with Sinian marine wall rocks, indicating a closed-system diagenetic fluid primarily sourced from Cambrian marine water; whereas the mid-stage Cal-I exhibits strong positive Eu anomalies, highly radiogenic 87Sr/86Sr ratios (avg. 0.71256), and negative δ18OVPDB values, indicating massive intrusion of deep-seated, high-temperature, Sr-rich hydrothermal fluids via strike-slip faults.
(3)
Fluid-inclusion assemblages differ significantly across minerals, with Dol-II predominantly capturing primary pale-yellow and secondary pale-blue oil inclusions, while the hydrothermal-stage Cal-I and Qtz-I mainly host secondary deep-blue oil inclusions and CH4-dominated gas inclusions.
(4)
The reservoir underwent a four-stage hydrocarbon charging history: initial low-maturity oil charging in the Middle Caledonian (~468–463 Ma); large-scale medium-maturity oil charging in the Late Hercynian (275–260 Ma); high-maturity oil charging in the Late Yanshanian (120–100 Ma); and final dry gas charging in the Himalayan (40–0 Ma), which was accompanied by the in situ thermal cracking of retained crude oil and widespread bitumen formation.

Author Contributions

P.W.: methodology, validation, investigation, writing—original draft. Y.Z.: methodology, data curation, validation, investigation, writing—original draft. Y.Y.: validation, project administration, supervision, writing—original draft. Y.H. (Yanlong Hu) (corresponding author): writing—review and editing, investigation, conceptualization, writing—original draft, visualization. Z.W. (Zhigang Wen) (corresponding author): writing—review and editing, conceptualization, methodology, writing—original draft, project administration, validation. Y.H. (Yahao Huang): methodology, writing—review and editing, conceptualization, data curation, software, writing—original draft. Z.W. (Zhongrui Wu): investigation, conceptualization, writing—original draft, formal analysis, resources. A.L.: investigation, methodology, data curation, writing—original draft, writing—review and editing. All authors have read and agreed to the published version of the manuscript.

Funding

This research was funded by the oil & gas major project “Key Technologies for Efficient Development of Ultra-Deep Carbonate Fracture-Vug Hydrocarbon Reservoirs” (Grant No. 2025ZD1402304), the Project “Fine Description and Stable Production Technology for Carbonate Reservoirs in Fuman Oilfield” (Grant No. T202408), and the Project “Differential Accumulation Processes and Enrichment Regularity of Hydrocarbon Reservoir Units in the FI17 Fault Zone, Tabei-Tazhong Area” (Contract No. 041025080106).

Institutional Review Board Statement

Not applicable.

Informed Consent Statement

Not applicable.

Data Availability Statement

The original contributions presented in this study are included in the article. Further inquiries can be directed to the corresponding authors.

Acknowledgments

The authors would like to thank the academic editors and anonymous reviewers for their constructive comments and suggestions. Technical and analytical support from all involved institutions is also gratefully acknowledged.

Conflicts of Interest

Authors Peng Wang, Yanyan Zhang and Yang Yang were employed by the PetroChina Tarim Oilfield Company. The remaining authors declare that the research was conducted in the absence of any commercial or financial relationships that could be construed as a potential conflict of interest.

References

  1. Zhao, H.; Wu, D.; Wang, K.; Jiang, S. Characteristics of Donghe Sandstone Transport Conductor in Hudson Oilfield, Tarim Basin and Its Oil and Gas Control Effect. Appl. Sci. 2024, 15, 17. [Google Scholar] [CrossRef]
  2. Tian, F.; Zheng, W.; Zhao, A.; Liu, J.; Liu, Y.; Zhou, H.; Cao, W. Seismic Identification and Characterization of Deep Strike-Slip Faults in the Tarim Craton Basin. Appl. Sci. 2024, 14, 8235. [Google Scholar] [CrossRef]
  3. Jia, C. Scientific and technological problems of deep and ultra-deep oil and gas exploration and development in petroliferous basins. J. China Univ. Pet. (Ed. Nat. Sci.) 2023, 47, 1–12. [Google Scholar]
  4. Zhang, S.; Wang, H.; Su, J.; Wang, X.; He, K.; Liu, Y. Control of Earth system evolution on the formation and enrichment of marine ultra-deep oil and gas in China. Pet. Explor. Dev. 2024, 51, 759–773. [Google Scholar] [CrossRef]
  5. Anjos, S.M.C.; Sombra, C.L.; Spadini, A.R. Petroleum exploration and production in Brazil: From onshore to ultra-deepwaters. Pet. Explor. Dev. 2024, 51, 912–924. [Google Scholar] [CrossRef]
  6. Dou, L.; Wen, Z.; Wang, Z.; He, Z.; Song, C.; Chen, R.; Yang, X.; Liu, X.; Liu, Z.; Chen, Y. Sedimentary build-ups of pre-salt isolated carbonate platforms and formation of deep-water giant oil fields in Santos Basin, Brazil. Pet. Explor. Dev. 2024, 51, 949–962. [Google Scholar] [CrossRef]
  7. Liu, Z.; Wu, K.; Wang, B.; Zhang, H.; Xu, K.; Wang, K. Evaluation of Fracture Effectiveness in Ultra-Deep Marine Carbonate Reservoirs of Fuman Oilfield, Tarim Basin. Appl. Sci. 2026, 16, 2511. [Google Scholar] [CrossRef]
  8. Su, J.; Wang, X.; Zhang, C.; Yang, X.; Li, J.; Yang, Y.; Zhang, H.; Fang, Y.; Yang, C.; Fang, C.; et al. Source and exploration potential of the ultra-deep Cambrian petroleum in Well XT-1, Tarim Basin, NW China. Pet. Explor. Dev. 2025, 52, 391–407. [Google Scholar] [CrossRef]
  9. Hu, Y.; Jia, C.; Chen, J.; Pang, X.; Jiang, L.; Wang, C.; Xiao, H.; Li, C.; Jin, Y. Restoration of hydrocarbon generation potential of the highly mature Lower Cambrian Yuertusi Formation source rocks in the Tarim Basin. Pet. Sci. 2025, 22, 588–606. [Google Scholar] [CrossRef]
  10. Zhou, H.; Gui, L.; Lu, X.; Chen, X.; Zhou, Y.; Wang, Y.; Yao, S.; Yu, X.; Yang, W. Timing of deep oil accumulations in the western part of the northern Tarim Basin: Records from fluid inclusions and carbonate U-Pb dating. Pet. Sci. 2025, 23, 1039–1052. [Google Scholar] [CrossRef]
  11. Cao, Z.; Ma, A.; Xu, Q.; Pan, Q.; Shang, K.; Feng, F.; Liu, Y. Geochemical characteristics and exploration significance of ultra-deep Sinian oil and gas from Well Tashen 5, Tarim Basin, NW China. Energy Geosci. 2024, 5, 100217. [Google Scholar] [CrossRef]
  12. Chen, L.; Zhang, H.; Cai, Z.; Cong, F.; Huang, S.; Tang, P. Characteristics and formation mechanisms of the unconformity-related paleokarst reservoirs in the Upper Sinian, Northwestern Tarim Basin, China. Mar. Pet. Geol. 2020, 120, 104559. [Google Scholar] [CrossRef]
  13. Zeng, L.; Song, Y.; Han, J.; Han, J.; Yao, Y.; Huang, C.; Zhang, Y.; Tan, X.; Li, H. Control of structure and fluid on ultra-deep fault-controlled carbonate fracture-vug reservoirs in the Tarim Basin, NW China. Pet. Explor. Dev. 2025, 52, 143–156. [Google Scholar] [CrossRef]
  14. Ni, X.; Shen, A.; Pan, W.; Zhang, R.; Yu, H.; Dong, Y.; Zhu, Y.; Wang, C. Geological modeling of excellent fracture-vug carbonate reservoirs: A case study of the Ordovician in the northern slope of Tazhong palaeouplift and the southern area of Tabei slope, Tarim Basin, NW China. Pet. Explor. Dev. 2013, 40, 444–453. [Google Scholar] [CrossRef]
  15. Zhang, Y.; Wang, P.; Wang, P.; Li, G.; Ding, Y.; Lei, Y.; Zhao, Q. Analysis of factors influencing H2S concentration in the Manshen area, Tarim Basin. Deep Undergr. Energy Sci. Technol. 2025, 1, 26–35. [Google Scholar]
  16. Huang, S.; Yang, G.; Zhang, H.; Lou, H.; Wang, X. Geological characteristics and resource potential of Cambrian-Ordovician deep marine shale gas reservoirs in the eastern Tarim area. Deep Undergr. Energy Sci. Technol. 2026, 2, 9–20. [Google Scholar]
  17. Yang, P.; Wu, G.; Ren, Z.; Zhou, R.; Zhao, J.; Zhang, L. Tectono-thermal evolution of Cambrian–Ordovician source rocks and implications for hydrocarbon generation in the eastern Tarim Basin, NW China. J. Asian Earth Sci. 2020, 194, 104267. [Google Scholar] [CrossRef]
  18. Peng, W.; Deng, S.; Zhang, J.; Huang, C.; Qiu, H.; Li, Y.; Liu, Y.; Liu, D. Genetic mechanism and main controlling factors of deep marine condensate reservoirs: A case study of the Shunbei No.4 fault zone in Tarim Basin, NW China. J. Nat. Gas Geosci. 2024, 9, 347–359. [Google Scholar] [CrossRef]
  19. Ni, C.; Hu, A.; Jin, T.; Duan, J.; Qiao, Z.; Chang, S.; Huang, Y.; Shen, A.; Chen, H. Application of new dating and temperature-measuring technologies in study of strike-slip fault-controlled reservoirs and hydrocarbon accumulation: A case study of Ordovician strata in non-foreland area of Tarim Basin, NW China. Pet. Explor. Dev. 2025, 52, 1501–1514. [Google Scholar] [CrossRef]
  20. Tang, P.; Yang, X.; Guo, F.; Tang, Y.; Wang, Y.; Yang, B.; Wang, W.; Chen, D. Evolution of multistage dolomitization fluids in the Upper Ediacaran Qigebrak Formation, northern Tarim Basin, China: Effects on reservoir formation. Pet. Sci. 2026; in press.
  21. Wu, G.; Kim, Y.S.; Su, Z.; Yang, P.; Ma, D.; Zheng, D. Segment interaction and linkage evolution in a conjugate strike-slip fault system from the Tarim Basin, NW China. Mar. Pet. Geol. 2020, 112, 104054. [Google Scholar] [CrossRef]
  22. Liseroudi, M.H.; Ardakani, O.H.; Pedersen, P.K.; Sanei, H. Fluid flow and water/rock interaction during the Early Triassic evolution of the western Canada sedimentary basin as revealed by carbonate diagenesis. Mar. Pet. Geol. 2022, 142, 105765. [Google Scholar] [CrossRef]
  23. Yang, H.; Wang, P.; Sun, C.; Wang, X.; Shi, M. Characteristics and genetic analysis of high-quality dolomite reservoirs at 10,000-meter depth in Well Shendi Take 1. Deep Undergr. Energy Sci. Technol. 2025, 1, 49–60. [Google Scholar]
  24. Wang, Q.; Zhu, Y.; Tang, Y.; Yang, G.; Sun, C.; Chen, C. Geological conditions and exploration potential of 10,000-meter ultra-deep oil and gas in the Tarim Basin. Deep Undergr. Energy Sci. Technol. 2025, 1, 36–48. [Google Scholar]
  25. Zhu, D.; Liu, Q.; Wang, J.; Peng, S.; You, D.; Zhang, J.; Ding, Q.; Wu, C. Differential fault-fluid alterations and reservoir properties in ultra-deep carbonates in the Tarim Basin, NW China. Appl. Geochem. 2024, 170, 106084. [Google Scholar] [CrossRef]
  26. Chen, S.; Zhang, Y.; Xie, Z.; Song, X.; Liang, X. Multi-stages of Paleozoic deformation of the fault system in the Tazhong Uplift, Tarim Basin, NW China: Implications for hydrocarbon accumulation. J. Asian Earth Sci. 2024, 265, 106086. [Google Scholar] [CrossRef]
  27. Xie, H.; Tian, J.; Hao, F.; Cong, F.; Li, Z.; Liu, Y.; Xiao, Z.; Tian, Z. The deep hydrocarbon accumulation process in the Tuoputai area, Tarim Basin: Constraints from calcite U-Pb and crude oil Re-Os dating. Geosci. Front. 2026, 17, 102327. [Google Scholar] [CrossRef]
  28. Hu, Z.; Feng, F.; Fang, C.; Cao, Z.; Wang, T.; Guo, K.; Li, Y.; Wang, S. Segmented evolution and exploration targets of the Cambrian platform margin in the Manxi area, Tarim Basin. Energy Geosci. 2025, 6, 100367. [Google Scholar] [CrossRef]
  29. Zeng, Q.; Sun, P.; Jiang, X.; Zhang, H.; Fang, Q.; Jiang, L. Early oil charging from Sinian shales in Ordovician carbonates of the Tabei Uplift, Tarim Basin: Evidence from biomarkers. Pet. Res. 2025, 10, 234–246. [Google Scholar] [CrossRef]
  30. Liu, J.; Chen, X.; Wu, C.; Yao, Y.; Yu, H.; Chen, X.; Zheng, X.; Zhuo, R. Deep structure and deformation features of the Kalpin Foreland Thrust Belt, Tarim Basin, NW China: Insights from three-dimensional P-wave velocity. J. Asian Earth Sci. 2026, 303, 107054. [Google Scholar] [CrossRef]
  31. Li, C.; Tao, X.; Liu, X.; Swennen, R.; Chen, X.; Huang, Y.; Zhang, Y.; Zhao, K.; Shen, C.; Hu, Z. Timing of hydrocarbon charging and reconstruction of its accumulation processes in a Cambrian subsalt dolomite reservoir (Tazhong Uplift, Tarim Basin, Western China). J. Asian Earth Sci. 2026, 303, 107034. [Google Scholar] [CrossRef]
  32. Zhu, G.; Zhang, S.; Su, J.; Huang, H.; Yang, H.; Gu, L.; Zhang, B.; Zhu, Y. The occurrence of ultra-deep heavy oils in the Tabei Uplift of the Tarim Basin, NW China. Org. Geochem. 2012, 52, 88–102. [Google Scholar] [CrossRef]
  33. Jia, C.; Ma, D.; Yuan, J.; Wei, G.; Yang, M.; Yan, L.; Tian, F.; Jiang, L. Structural characteristics, formation & evolution and genetic mechanisms of strike–slip faults in the Tarim Basin. Nat. Gas Ind. B 2022, 9, 51–62. [Google Scholar]
  34. Ma, B.; He, Y.; Chen, L.; Wu, G.; Dong, H.; Wang, J.; Yao, J.; Liu, X. Linkage, evolution and formation mechanism of the partially-thoroughgoing intra-cratonic conjugate strike-slip fault system in the northern Tarim Basin, NW China. J. Asian Earth Sci. 2025, 294, 106784. [Google Scholar] [CrossRef]
  35. Yang, S.; Wu, G.; Zhu, Y.; Zhang, Y.; Zhao, X.; Lu, Z.; Zhang, B. Key oil accumulation periods of ultra-deep fault-controlled oil reservoir in northern Tarim Basin, NW China. Pet. Explor. Dev. 2022, 49, 285–299. [Google Scholar] [CrossRef]
  36. Yan, L.; Wei, G.; Zhu, G.; Chen, Y.; Luo, C.; Yang, M.; Wang, S.; Du, D. Exploration field analysis and zone optimization of sinian, Tarim Basin, China. J. Nat. Gas Geosci. 2022, 7, 171–179. [Google Scholar] [CrossRef]
  37. Gao, Z.; Shi, J.; Lv, J.; Chang, Z. High-frequency sequences, geochemical characteristics, formations, and distribution predictions of the lower Cambrian Yuertusi Formation in the Tarim Basin. Mar. Pet. Geol. 2022, 146, 105966. [Google Scholar] [CrossRef]
  38. Shen, A.; Luo, X.; Hu, A.; Qiao, Z.; Zhang, J. Dolomitization evolution and its effects on hydrocarbon reservoir formation from penecontemporaneous to deep burial environment. Pet. Explor. Dev. 2022, 49, 731–743. [Google Scholar] [CrossRef]
  39. Huang, Y.H.; Wang, R.J.; Wen, Z.G.; Zhang, Y.T.; Cui, S.T.; Li, M.Q.; Wang, P.; He, T.H. Hydrocarbon accumulation process in deep and ultra-deep reservoirs of Fuman Oilfield, Tarim Basin. Acta Pet. Sin. 2024, 45, 947–960. [Google Scholar]
  40. Yi, L.; Liu, Z.; Chen, Z.; Li, M. Thermal maturity, source characteristics, and migration directions for the Ordovician oil in the Central Tabei Uplift, Tarim Basin: Insight from biomarker geochemistry. J. Pet. Sci. Eng. 2020, 189, 106975. [Google Scholar] [CrossRef]
  41. Huang, Y.; Tang, Y.; Li, M.; Hong, H.; Wu, C.; Zhang, J.; Lu, X.; Yang, X. Quantitative evaluation of geological fluid evolution and accumulated mechanism: In case of tight sandstone gas field in central Sichuan Basin. Pet. Sci. 2021, 18, 416–429. [Google Scholar] [CrossRef]
  42. Huang, Y.; He, Z.; He, S.; Tao, Z.; Liu, X.; Luo, T.; Guo, X.; Zhang, D.; Sun, Z.; Dong, T. Fluid geochemical response recorded in the alteration of marine carbonate reservoirs: The Silurian Shiniulan Formation, southeast Sichuan Basin, China. J. Pet. Sci. Eng. 2022, 208, 109625. [Google Scholar] [CrossRef]
  43. Xu, H.; Guo, X.; Cao, Z.; Alves, T.M.; Tao, Z.; Wang, B.; Chen, J.; Zuo, G.; Zhang, X.; Luo, T. Petroleum-charge history of Paleozoic carbonates in the Tahe oil field, Tarim Basin, northwestern China: Insights from oil geochemistry, fluid inclusion, and U-Pb dating. AAPG Bull. 2025, 109, 57–84. [Google Scholar] [CrossRef]
  44. Luo, T.; Guo, X.; He, Z.; Dong, T.; Tao, Z.; Yang, R.; Wang, K. Fluid evolution and gas enrichment in the Wufeng-Longmaxi shale reservoirs of the eastern Sichuan Basin, SW China. J. Asian Earth Sci. 2024, 259, 105905. [Google Scholar] [CrossRef]
  45. Luo, T.; Guo, X.; He, Z.; Tao, Z.; He, S.; Huang, Y.; Zhu, Y. Hydrocarbon accumulation and reconstruction in the Ediacaran Dengying carbonate reservoirs of the southeastern and central Sichuan Basin, SW China. J. Asian Earth Sci. 2024, 276, 106352. [Google Scholar] [CrossRef]
  46. Shao, D.; Zhang, T.; Milliken, K.L.; Zhou, S.; Li, J.; Li, Y.; Zhou, Q. Evolution of a microfracture network induced by hydrocarbon generation during experimental maturation of organic-rich lacustrine shale. Geology 2025, 53, 737–742. [Google Scholar] [CrossRef]
  47. Cong, F.; Tian, J.; Hao, F.; Wang, Q.; Kylander-Clark, A.R.C.; Cao, Z. In situ calcite U-Pb ages and absolute timing of oil charge events: A case study of ultra-deep carbonate reservoirs in the Shunbei oilfield, Tarim basin, Northwest China. J. Asian Earth Sci. 2024, 259, 105904. [Google Scholar] [CrossRef]
  48. Huang, B.; Ye, N.; Lu, Z.; Zhu, B.; Yang, Y.; Lin, P.; Li, P.; Zhang, X.; Li, Y.; Zhang, S. Paleo-fluid evolution in the Lower-Middle Ordovician carbonate reservoirs of the Shunbei area, Tarim Basin. Pet. Sci. 2025, 22, 2290–2306. [Google Scholar] [CrossRef]
  49. Wu, A.; Cao, J.; Zhang, J. Bedding-parallel calcite veins indicate hydrocarbon–water–rock interactions in the over-mature Longmaxi shales, Sichuan Basin. Mar. Pet. Geol. 2021, 133, 105303. [Google Scholar] [CrossRef]
  50. Li, S.; Guo, X.; Wang, B.; Cao, Z.; Xu, H.; Chen, J. Recognition of a hydrothermally linked oil accumulation process in the Tahe oil field, northwestern China, with organic geochemistry, Re-Os, and U-Pb geochronology. AAPG Bull. 2024, 108, 1485–1508. [Google Scholar] [CrossRef]
Figure 1. Regional tectonic location map and comprehensive stratigraphic column of Well LT3 in the Tarim Basin. (A) Tectonic units of the Tarim Basin showing the location of Well LT3; The red area in the inset map of China represents the Tarim Basin. (B) Stratigraphic column and core photographs of the Lower Cambrian Yuertusi Formation and Upper Sinian Qigebulake Formation.
Applsci 16 05006 g001
Figure 2. Microscopic petrological characteristics and paragenetic sequence of authigenic minerals in the Qigebulake Formation, Well LT3. (AD) Transmitted-light images showing the paragenetic sequence of Dol-I, Dol-II, Cal-I, Qtz-I, and bitumen; (E,F) Cathodoluminescence images showing the luminescence characteristics of different mineral generations.
Applsci 16 05006 g002
Figure 3. Microscopic characteristics of multi-stage fluid inclusions in the Qigebulake Formation, Well LT3. (A) Primary pale-yellow oil inclusions under UV light; (B) secondary pale-blue oil inclusions under UV light; (C) secondary deep-blue oil inclusions under UV light; (D) secondary gas inclusions under transmitted light; (E,F) coexistence of secondary deep-blue oil inclusions and bitumen under merged transmitted and UV light.
Applsci 16 05006 g003
Figure 4. Cross-plot of maximum fluorescence wavelength (λmax) versus red–green quotient (QF535) for oil inclusions.
Applsci 16 05006 g004
Figure 5. Laser Raman spectra of secondary gas inclusions. (A) Raman spectrum at 300 grooves/mm grating identifying the CH4 peak; (B) high-resolution Raman spectrum at 1800 grooves/mm grating detailing the CH4 peak.
Applsci 16 05006 g005
Figure 6. PAAS-normalized rare earth element (REE) partition patterns of authigenic minerals and wall rocks. The eight curves represent independent in situ analytical spots indicating their fundamental differences in paragenetic timing and formational fluid sources: dolomite II (n = 3), calcite I (n = 3), and wall rock (n = 2).
Applsci 16 05006 g006
Figure 7. Cross-plot of carbon (δ13CVPDB) and oxygen (δ18OVPDB) isotopes of authigenic minerals and wall rocks.
Applsci 16 05006 g007
Figure 8. Strontium isotope (87Sr/86Sr) compositions of authigenic minerals and wall rocks.
Applsci 16 05006 g008
Figure 9. Histogram of homogenization temperatures (Th) for multi-stage fluid inclusions.
Applsci 16 05006 g009
Figure 10. LA-ICP-MS in situ U-Pb Concordia diagrams for authigenic carbonate minerals. (A,C) U-Pb ages of Dol-II; (B,D) U-Pb ages of Cal-I.
Applsci 16 05006 g010
Figure 11. Burial–thermal history and multi-stage hydrocarbon accumulation model of the Sinian in Well LT3.
Applsci 16 05006 g011
Table 1. Summary of analytical tests conducted on samples from Well LT3, Sinian Qigebulake Formation. The symbol “√” indicates that the corresponding analysis was performed.
WellSample Depth/mReservoir TypeFormationTests Conducted
Petrographic ObservationFluid
Inclusion Petrography
Fluorescence
Spectroscopy
Raman
Spectroscopy
Rare
Earth
Elements
(REE)
C-O-Sr IsotopesFluid
Inclusion
Thermometry
Calcite U-Pb Dating
LT38531.75VugThe
Qigebulake Formation
8532.36Fracture
8532.86Vug
8533.15Fracture
8536.58Fracture
Table 2. PAAS-normalized rare earth element (REE) parameters of authigenic minerals and wall rocks.
LaCePrNdSmEuGdTbDyYHoErTmYbLuFe/MnΣREELa
/Ho
Y
/Ho
LREE
/HREE
δCeδEu
Dol-II0.080.050.090.130.170.270.300.340.440.630.480.520.540.520.491.4037.996.8335.630.190.521.17
Dol-II0.160.060.130.150.210.270.300.320.370.720.460.500.410.390.320.5545.0813.4442.450.260.451.07
Dol-II0.030.030.070.120.230.270.380.410.520.760.550.510.520.430.402.6838.442.3237.960.170.561.03
Cal-I0.000.010.040.060.110.630.140.110.110.260.110.090.060.040.030.9813.781.5164.921.390.605.21
Cal-I0.030.060.180.330.442.440.550.420.410.890.340.260.240.100.080.9354.213.1571.821.060.574.91
Cal-I0.020.020.030.050.060.570.100.050.060.090.030.020.010.010.000.818.1419.8174.642.060.627.21
Wall Rock0.110.070.090.100.120.160.150.130.180.290.200.220.190.210.176.7125.8520.6238.830.370.711.16
Wall Rock0.170.110.130.120.130.150.170.150.170.270.220.210.280.180.185.9231.5430.4534.250.440.731.01
Table 3. Microthermometric data and trapping pressures of multi-stage fluid inclusions in the Sinian Qigebulake Formation.
Inclusion TypeAssociated Aqueous Th (°C)Trapping Pressure (MPa)Charging Episode
Primary pale-yellow oil inclusions100–10933.2–40.6Middle Caledonian (Stage 1)
Secondary pale-blue oil inclusions110–11941.9–45.6Late Hercynian (Stage 2)
Secondary deep-blue oil inclusions120–12961.4–64.4Late Yanshanian (Stage 3)
Secondary gas inclusions (CH4)170–179~79.98Himalayan (Stage 4)
Disclaimer/Publisher’s Note: The statements, opinions and data contained in all publications are solely those of the individual author(s) and contributor(s) and not of MDPI and/or the editor(s). MDPI and/or the editor(s) disclaim responsibility for any injury to people or property resulting from any ideas, methods, instructions or products referred to in the content.