Article

Comparison of the Biceps and Triceps to Determine Metabolic Thresholds Using Muscle Oxygen Saturation in the Spinal Cord Injury Population: An Exploratory Study


by
Carlos Sendra-Pérez
1,2,
Clara Carrión-González
1,
Paula Wessling-Intriago
1,
Joaquín Martín Marzano-Felisatti
1,
Jose Ignacio Priego-Quesada
1,3,* and
Inmaculada Aparicio-Aparicio
1
1
Research Group in Sports Biomechanics (GIBD), Department of Physical Education and Sports, University of Valencia, St. Gascó Oliag, 3, 46010 Valencia, Spain
2
Department of Education and Specific Didactics, Jaume I University, 12071 Castellon, Spain
3
Research Group in Medical Physics (GIFIME), Department of Physiology, University of Valencia, Ave. Blasco Ibáñez, 15, 46010 Valencia, Spain
*
Author to whom correspondence should be addressed.
Appl. Sci. 2026, 16(10), 5009; https://doi.org/10.3390/app16105009
Submission received: 23 March 2026 / Revised: 13 May 2026 / Accepted: 13 May 2026 / Published: 18 May 2026
(This article belongs to the Special Issue Advances in Sports Medicine and Rehabilitation)

Abstract

This exploratory study aimed to compare the determination of metabolic thresholds using muscle oxygen saturation (SmO2) and gas exchange data during graded exercise testing in individuals with spinal cord injury. Nine participants (six males, three females) performed a graded exercise test on an arm-crank ergometer, with continuous measurements of breath-by-breath pulmonary gas exchange and SmO2 from the biceps brachii and triceps brachii. Thresholds were identified as gas exchange threshold (GET) and respiratory compensation point (RCP), and their SmO2 counterparts as MOT1 and MOT2. The results showed no differences between GET and MOT1 in either muscle (biceps: p = 0.14; triceps: p = 1.00), and similar results were observed between RCP and MOT2 for triceps brachii (p = 0.39) and biceps brachii (p = 0.12). Reliability analysis revealed good but non-significant agreement for the triceps brachii (ICC = 0.44–0.60), while the biceps brachii demonstrated very good agreement at GET (ICC = 0.78, p < 0.01) and excellent agreement at RCP (ICC = 0.81, p < 0.01), and Bland–Altman analyses confirmed no systematic bias between muscle sites. In conclusion, SmO2 may be a valid and promising variable for detection in individuals with spinal cord injury during ramp exercise testing. Both muscles showed agreement with pulmonary gas exchange, but the biceps brachii provided more consistent and reliable estimates, particularly for the second threshold. These preliminary findings suggest the use of near-infrared spectroscopy as a non-invasive technology for metabolic threshold detection in spinal cord injury populations.

1. Introduction

Spinal cord injury (SCI) is a neurological disorder that affects multiple aspects (e.g., motor function, vascular circulation, etc.) in thousands of individuals each year [1,2]. In recent decades, research on SCI has increasingly focused on molecular and cell therapies [3,4]. However, currently, there is no treatment or medication that can reverse the condition [3], and for this reason, individuals with SCI must carefully manage their lifestyle to alleviate its adverse effects [5]. Furthermore, SCI is also associated with an increased risk of developing secondary health conditions, partly due to a more sedentary lifestyle [5,6]. Despite these challenges, some individuals with SCI are capable of training at high intensities and work volumes, making proper training planning essential for enhancing performance and reducing injury risk [7,8].
Determining metabolic thresholds to identify exercise intensity domains (i.e., moderate, heavy and severe) is fundamental for training prescription [9]. The first threshold (also called the first ventilatory threshold or gas exchange threshold (GET)) is associated with a gradual increase in blood lactate concentration ([BLa]) and oxygen consumption (VO2), with predominant energy production via oxidative phosphorylation [9,10]. The second threshold (also called the second ventilatory threshold or respiratory compensation point (RCP)) is characterized by a breakpoint in the relationship between carbon dioxide production and oxygen, an exponential [BLa] increase, accumulation of fatigue-inducing metabolites, and higher recruitment of type II muscle fibers [10,11]. These metabolic thresholds are typically assessed through graded exercise testing (GXT), including ramp or step protocols [12]. Different physiological outcomes can be used for threshold determination (e.g., oxygen uptake and [BLa]) as it was suggested that these thresholds reflect integrated responses of multiple physiological systems [13,14,15]. For this reason, different instruments are used (mainly breath-by-breath pulmonary gas exchange and [BLa]), although with limitations such as elevated costs and invasiveness.
Near-infrared spectroscopy (NIRS) is a relatively recent and portable instrument that can measure oxygenated hemoglobin (oxy-HHb), deoxygenated hemoglobin (HHb), total hemoglobin (THb) and muscle oxygen saturation (SmO2) [16]. NIRS typically uses wavelengths between 700 and 850 nm to penetrate biological tissues [17]. It has been applied in both upper and lower limb muscles to determine the muscle oxygenation threshold (MOT) during GXT [18,19,20]. Recently, NIRS has been applied in SCI populations during GXT of arm-pedaling to determine lactate thresholds, showing a good reliability for the first threshold (intraclass correlation coefficient (ICC) of 0.46) and an excellent reliability for the second threshold (ICC = 0.82) [18]. However, that study was limited to the biceps brachii and used a discontinuous protocol (i.e., step protocol) with rest intervals, where thresholds were identified via [BLa]. Therefore, further research is needed to validate these findings and to investigate whether other muscle sites may yield better results. In this sense, the biceps and triceps brachii could be accessible places to measure SmO2, but it can be hypothesized that the biceps brachii could be a better choice due to its major role during power production [21] and because SCI inhibits the triceps brachii more [22].
The aim of this exploratory study was to compare the determination of metabolic thresholds (i.e., first and second thresholds) using breath-by-breath pulmonary gas exchange outcomes and SmO2 in the biceps brachii and triceps brachii during GXT, considering previous investigation [21,23,24]. Given the exploratory nature of the study and the limited sample size, it was hypothesized that both methods would show higher agreement for the second than the first threshold, and higher agreement for the biceps than the triceps brachii.

2. Materials and Methods

2.1. Participants

Nine participants (6 males and 3 females; high thoracic injury N = 3; low thoracic injury N = 5; spina bifida N = 1) with SCI visited the laboratory once to perform an incremental test. Table 1 shows the participants’ characteristics. They were recruited from local associations and through social media. All the participants met the following inclusion criteria: (i) age between 20 and 65 years; (ii) have not suffered any injury in the last three months; (iii) without pregnancy; and (iv) practice physical activity at least two times per week. Due to the impact of SCI on individuals, participants with this condition were required to have had the injury for at least one year. Participants suffering from cardiovascular or metabolic diseases were excluded from the study. All participants were informed about the procedures and objectives of the study prior to their participation and signed the written informed consent form before starting their participation in the study. The study was performed in agreement with the Declaration of Helsinki and was approved by the ethics committee of the University of Valencia (register number 1994739).

2.2. Protocol

The participants conducted GXT on an arm-crank ergometer (SciFit Pro1 Arm Ergometer; SCIFIT Systems Inc., Tulsa, OK, USA). A cardiologist supervised the test. The GXT started at 5 W with increments of 3 W every 30 s. Participants maintained a constant, self-selected cadence between 50 and 80 rpm (65 ± 15 rpm) during the GXT using an asynchronous arm-cranking technique, in which one arm performed the propulsive phase while the contralateral arm simultaneously performed the recovery phase. Cadence was self-selected by the participants within this range, given that it does not influence internal load variables [25]. Additionally, for participants with hand grip impairments, hands were secured to the ergometer. The test ended when the participants were at a cadence below 50 rpm for 10 s or the participant decided to give up the test. They were encouraged and supervised to maintain that cadence throughout the test. All the participants were instructed to avoid drinking alcohol or caffeine, eating large meals, smoking, and physical activity for 6 h before the test. The measurements were conducted under moderate environmental conditions (20 ± 1 °C room temperature and 39 ± 15% relative humidity).

2.3. Data Collection

Breath-by-breath pulmonary gas exchange and ventilation were continuously measured using a metabolic cart (Vyntus CPX, Vyaire Medical, Mettawa, IL, USA). The system was calibrated before each experiment using a gas mixture of known concentration and room air. Analysis of gas exchange data was performed using the Exercise Thresholds App (https://www.exercisethresholds.com/) [26]. This application was used to compute peak oxygen uptake (VO2peak) and the VO2 values at GET and RCP. The VO2peak considered the highest 20 s value computed from a rolling average. Two expert reviewers independently and visually identified GET and RCP using a multivariate approach facilitated by the application, as previously described [26]. In cases of disagreement, a third reviewer was consulted, and a consensus decision was reached [26].
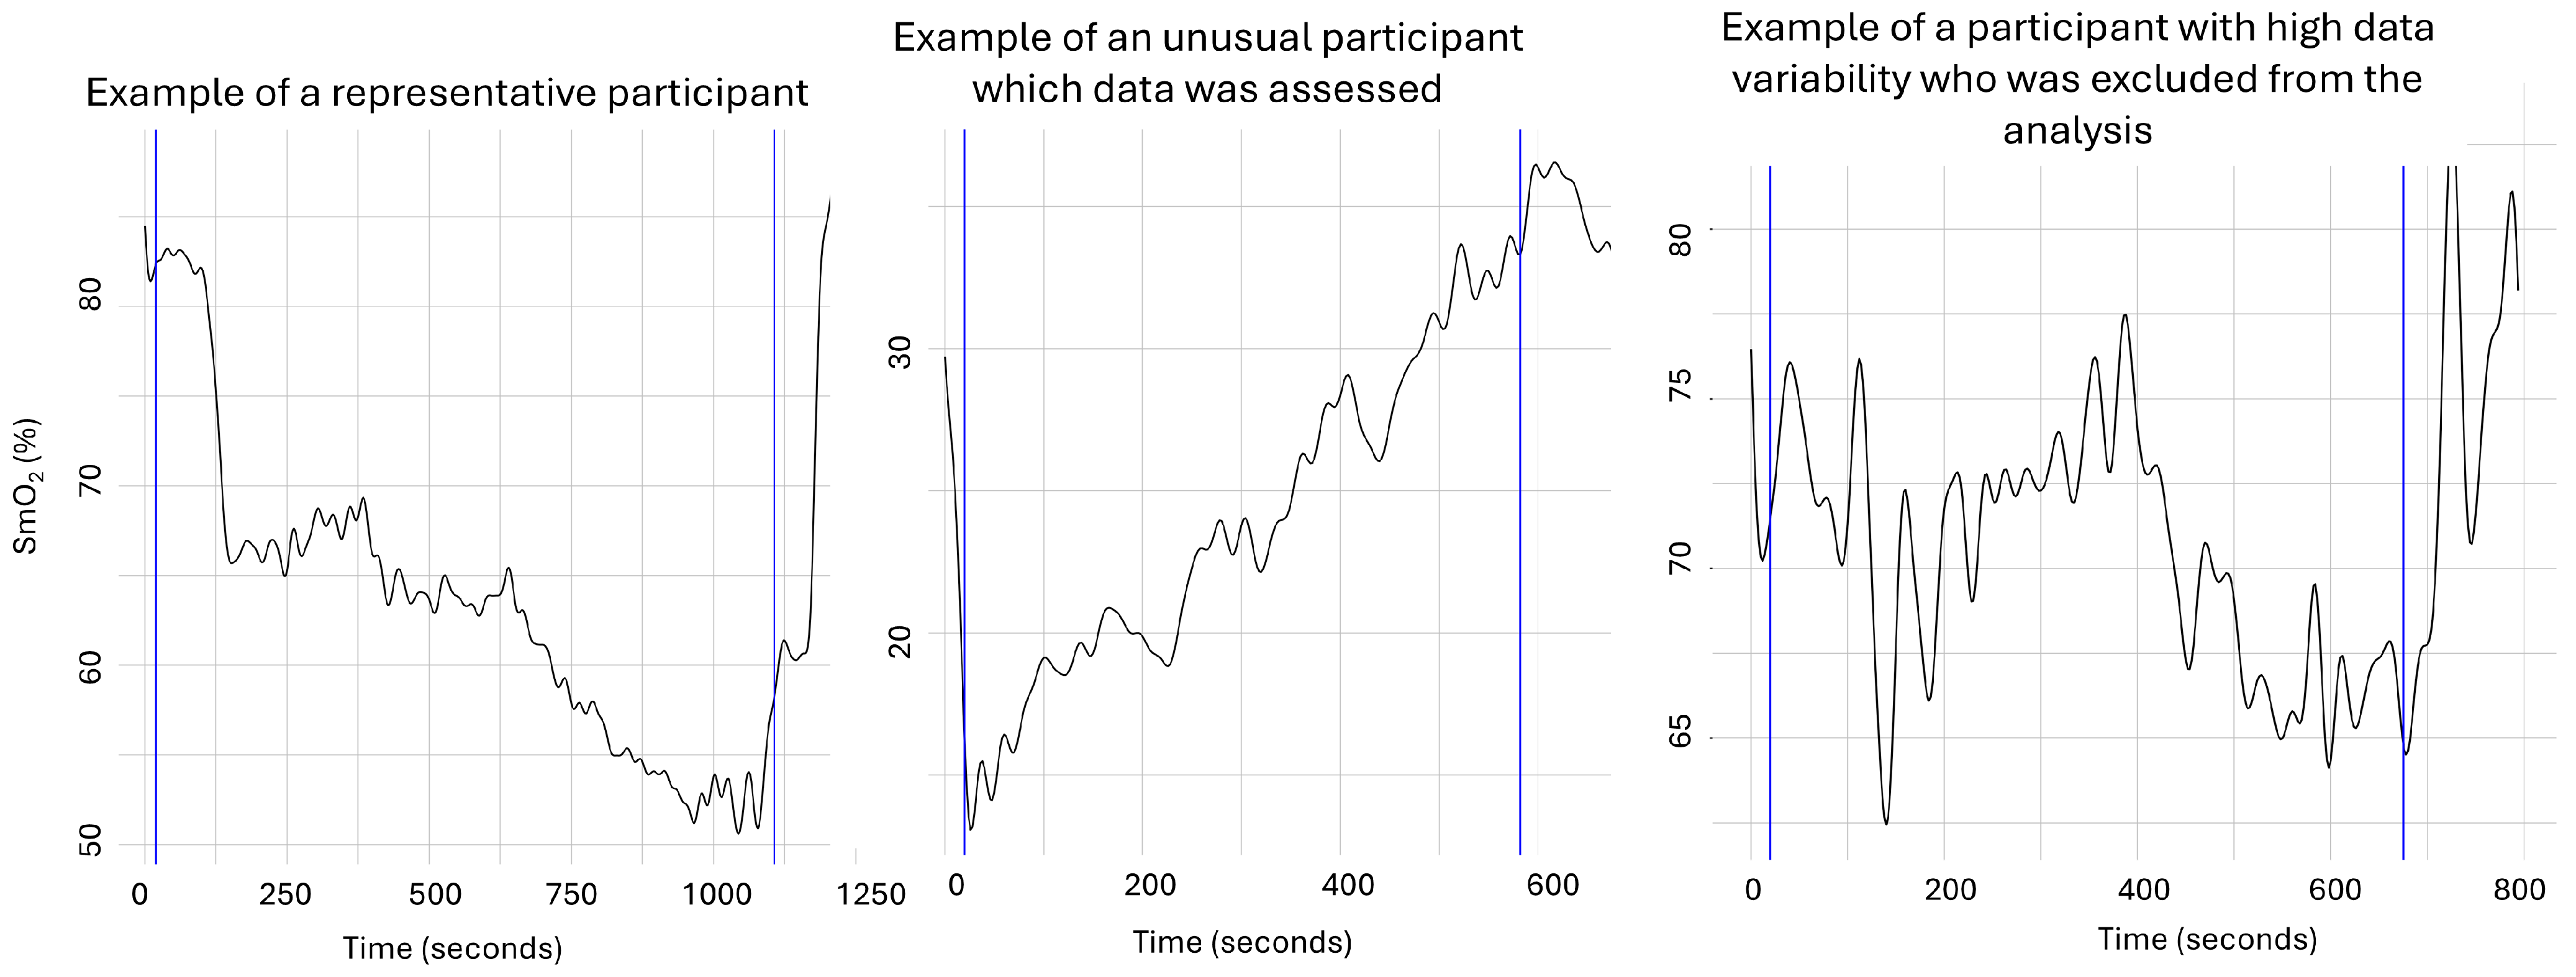
SmO2 (%) was determined using a portable NIRS device continuously during the test at a sampling frequency of 1 Hz (Moxy Monitor, Fortiori Design LLC, Minneapolis, MN, USA). The monitor was placed in the biceps brachii at the belly of the muscle, and for the triceps brachii at the long head on the line between the posterior crista of the acromion and the olecranon. Placement of monitors was based on the surface electromyography guidelines [27]. Both monitors were located on the non-dominant arm [28]. SmO2 data were pre-processed prior to threshold detection. First, a low-pass filter (cut-off frequency = 0.2 Hz) was applied to reduce high-frequency noise. Then, the variation in SmO2 was calculated relative to the mean value during the warm-up phase. Finally, the signal was inverted so that it exhibited an increasing pattern rather than a decreasing one. This transformation was necessary because the breakpoint detection algorithms implemented in the ‘lactater’ package are designed to identify thresholds in variables that increase with exercise intensity (e.g., blood lactate), and may fail when applied directly to decreasing signals. This approach has been previously used to enable the application of lactate-based mathematical methods to SmO2 data [29]. All SmO2 signals were visually inspected to identify potential technical artifacts, such as excessive noise or non-physiological fluctuations. Signals were not excluded based on the direction of the response (i.e., increases or decreases). Only one participant was excluded (from the initial sample size of 10 participants) due to an irregular signal pattern, characterized by large SmO2 oscillations at the beginning followed by an abrupt decrease, which prevented reliable breakpoint identification (Figure 1). Finally, the moment of the test when the thresholds occurred in seconds was determined using segmented regressions (i.e., LTP methods) [30] from the “lactater” package in RStudio, and then the VO2 value of this specific moment was obtained by a linear regression analysis interpolation.

2.4. Statistical Analysis

Statistical analysis was performed using RStudio (version 2025.05.1). The normality of the data was determined using Shapiro–Wilk test, observing a non-normal distribution for the VO2 value corresponding with the determination of MOT1 and GET. Because of the small sample size and the evidence of non-normality in some of the paired comparisons, Wilcoxon signed-rank tests with Bonferroni correction were used for all comparisons to maintain a consistent non-parametric statistical approach. The VO2 value corresponding with the determination of SmO2 breakpoints (MOT1 and MOT2) and GET and RCP were compared for the biceps and triceps. Cohen’s effect sizes with Edge correction (ESg) were calculated and classified as 0.2 to 0.4 (small), 0.5 to 0.7 (moderate), and >0.8 (large) [31]. The reliability between methods in each region was assessed by means of the intraclass correlation coefficient (ICC), based on a single rater measurement, absolute agreement, and a 2-way random-effect model. ICC values were classified as: 1.00 to 0.81 (excellent), 0.80 to 0.61 (very good), 0.60 to 0.41 (good), 0.40 to 0.21 (reasonable) and 0.20 to 0.00 (deficient) [32]. Bland–Altman plots were obtained for each group and method with mean bias, standard deviation, and 95% confidence intervals of mean bias [33]. In addition, the mean bias of both regions (biceps vs. triceps) was compared for GET and RCP using Student’s t-test and ES. The significance was established by p < 0.05.
Due to the exploratory nature of the study, a post hoc sensitivity analysis was performed using G*Power software (version 3.1.9.7, Universität Kiel, Kiel, Germany). The analysis was based on a Wilcoxon signed-rank test for paired samples, assuming an alpha level of 0.05, a statistical power of 90%, and the largest effect size observed in the pairwise comparisons.

3. Results

During GXT, participants reached peak VO2 values of 1581 ± 552 mL/min/kg, peak power outputs of 81 ± 25 W and peak heart rates of 151 ± 23 beats/min.
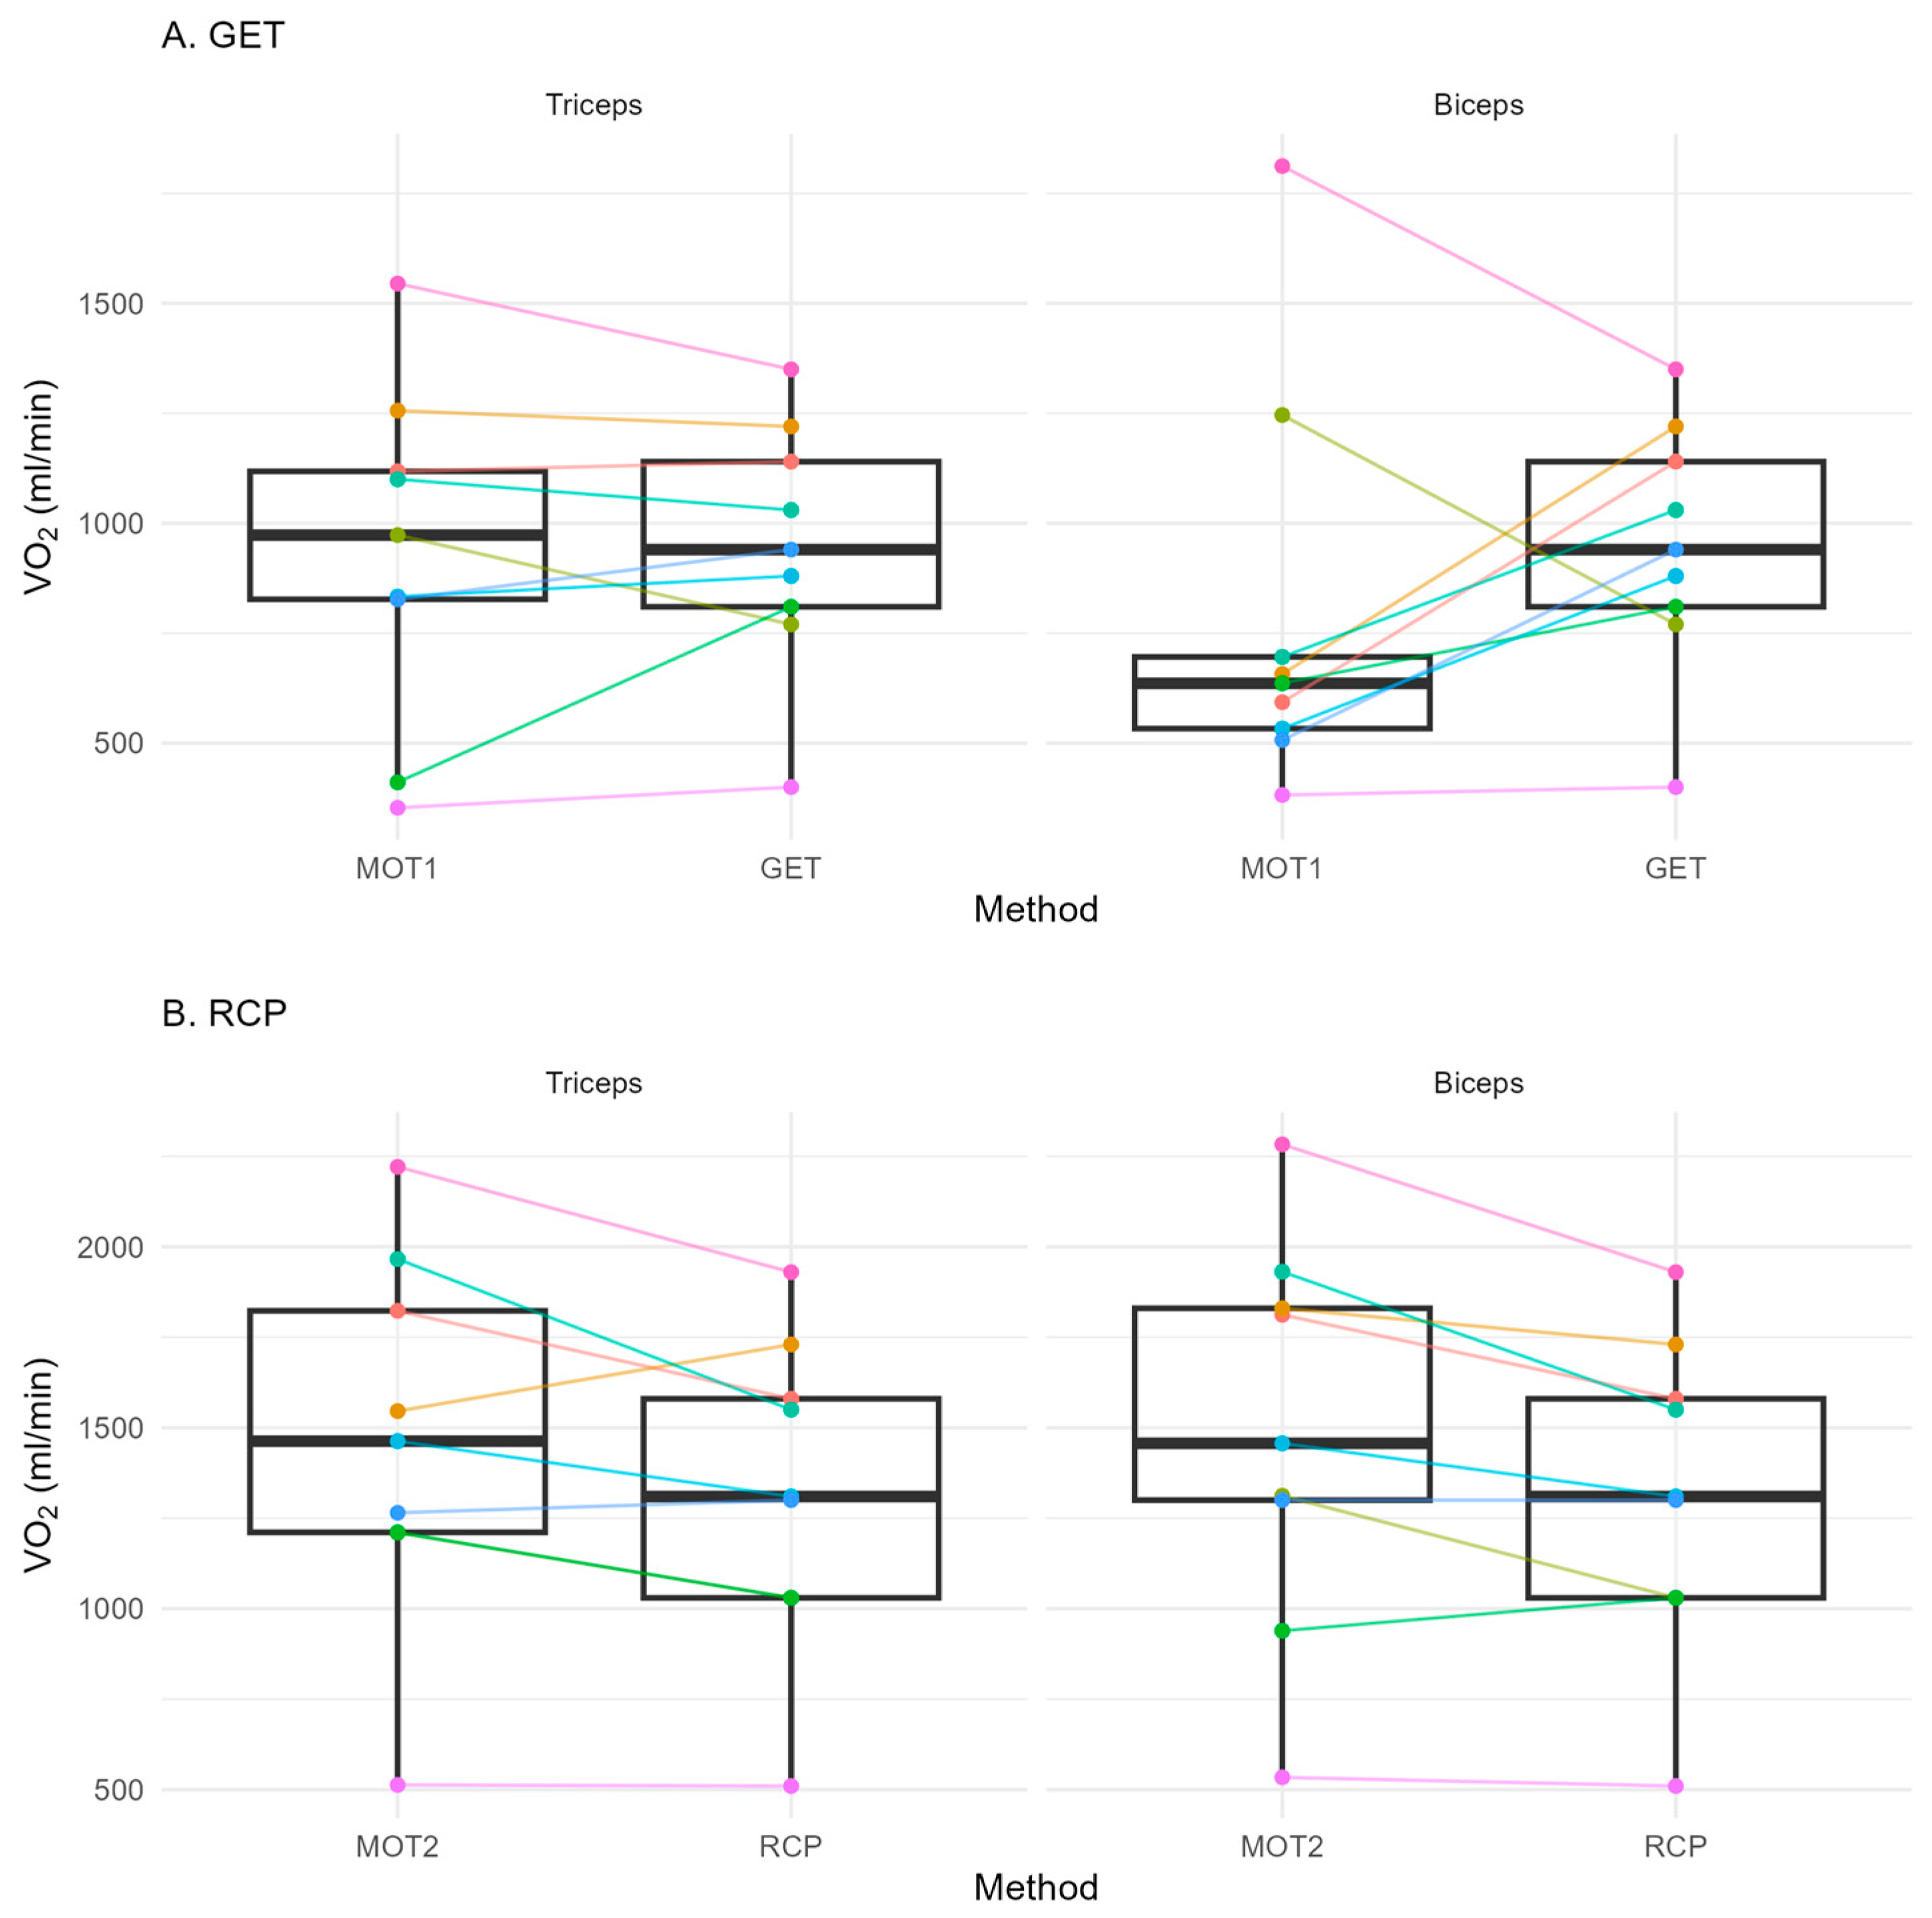
The VO2 values for GET and those associated with the SmO2 breakpoint (MOT1) did not differ for triceps brachii (p = 1.00 and ESg = 0.07) and biceps brachii (p = 0.54 and ESg = 0.37) (Figure 2A). Similar results were observed for VO2 between RCP and MOT2 for triceps brachii (p = 0.39 and ESg = 0.69) and biceps brachii (p = 0.12 and ESg = 0.87) (Figure 2B).
Table 2 shows the ICC analysis. Although triceps brachii presented a good agreement between methods at both thresholds, these values were not significant (p = 0.07 in both cases). In the case of the biceps brachii, the agreement between methods was very good at GET, and excellent at RCP.
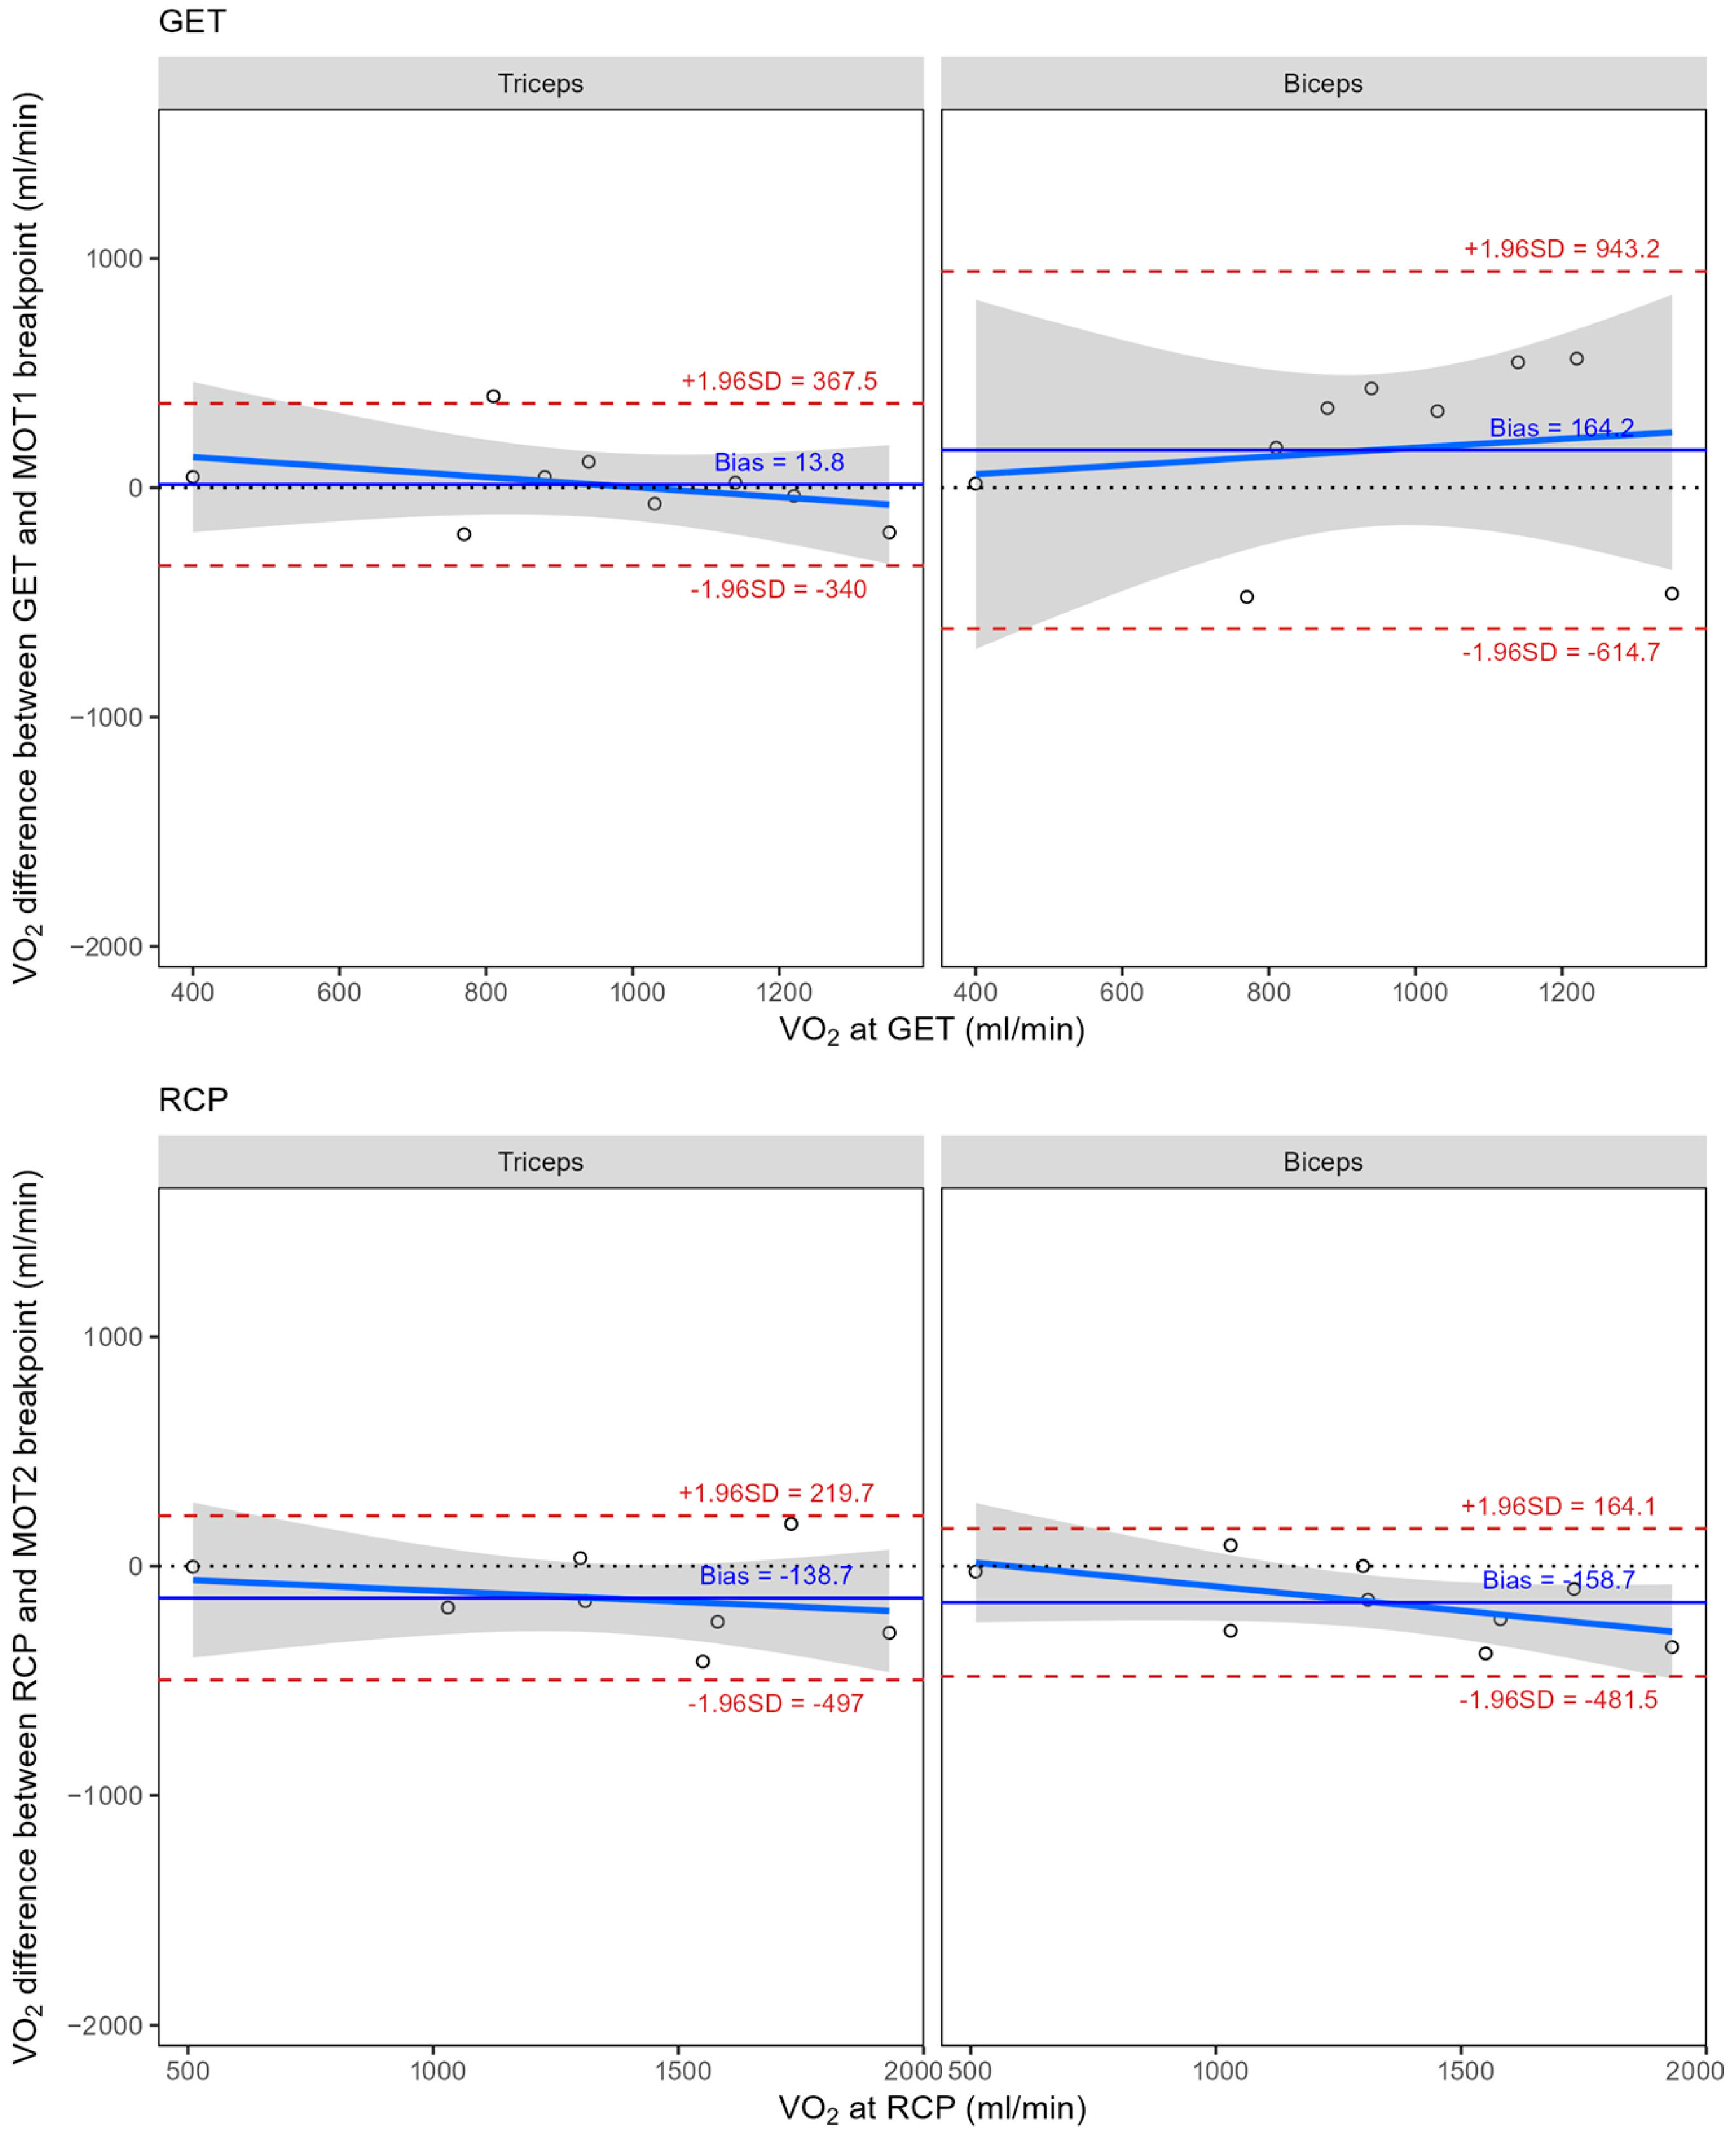
Figure 3 shows Bland–Altman plots. No differences were observed in the bias between triceps brachii and biceps brachii for GET (14 ± 181 mL·min−1 and 164 ± 397 mL·min−1, p = 0.23) and RCP (−139 ± 183 mL·min−1 and −159 ± 165 mL·min−1, p = 0.69).
The largest ESg observed in the pairwise comparisons was 0.69 for the biceps brachii and 0.87 for triceps brachii at RCP. Based on this effect size, the estimated sample size required to detect statistically significant differences with 90% power ranged from 14 to 21 participants.

4. Discussion

We aimed to compare the reliability of metabolic threshold detection using breath-by-breath pulmonary gas exchange outcomes and SmO2 between the biceps brachii and triceps brachii to determine which muscle provides more consistent measurements during GXT. The present findings show that NIRS reliably detected GET and RCP in both muscles (triceps brachii GET p = 1.00 and RCP p = 0.39; biceps brachii GET p = 0.54 and RCP p = 0.12). However, the biceps brachii showed higher agreement for both thresholds (p < 0.01): very good at GET (ICC = 0.78) and excellent at RCP (ICC = 0.81).
MOT1, which is related to GET, would represent the transition to predominantly aerobic metabolism and the initial accumulation of [BLa], whereas MOT2, related to RCP, would reflect higher recruitment of type II muscle fibers and rapid metabolite accumulation. Our MOT1 results showed a good agreement for the triceps and very good agreement for the biceps, with no significant differences between methods. This is in agreement with a recent meta-analysis observing a moderate concordance [24]. Moreover, [20] reported that MOT1 did not significantly differ from GET. However, it was suggested that the reliability of MOT2 is higher than MOT1 [24]. No significant differences were observed between MOT2 and RCP. However, the ICC analysis showed excellent agreement in the biceps brachii, higher than in the triceps brachii (ICC = 0.81, p < 0.01 vs. ICC = 0.60, p = 0.07), suggesting greater relative consistency in biceps brachii measurements. Nevertheless, visual inspection of Figure 2 indicates the presence of individual variability, with larger discrepancies in some participants.
When comparing ICC values previously reported in the SCI population in biceps brachii in MOT1 (ICC = 0.51) [23], our results were higher (ICC = 0.78). For MOT2, the biceps brachii showed excellent reliability, comparable to the previously reported values (ICC = 0.81 vs. ICC = 0.92), supporting the consistency of SmO2 measurements in detecting the second metabolic transition in SCI participants. In addition, it is worth noting that the study conducted by Sánchez-Jiménez et al. [18] and our study use the same methods for determining the thresholds (i.e., LTP methods). However, controversy persists regarding which model is the best for determining thresholds, although it is clear that the traditionally used thresholds at the same values of [BLa] for the whole population (i.e., 2 and 4 mmol·L−1) are not the most appropriate [34,35]. In our study, we employed LTP methods, as they identify breakpoints with a methodology similar to GET or RCP. While Sendra-Pérez et al. [29] recommended the Exponential Dmax method for determining the MOT2 in four muscles (i.e., vastus lateralis, gastrocnemius medialis, tibialis anterior and biceps femoris), they used it in cycling, with a non-injury population, with blood lactate concentration, and with a different ramp protocol, which can explain the different mathematical methods employed.
When comparing our findings with studies in non-SCI, the biceps brachii in SCI participants showed similar reliability values, especially for the second threshold [36,37]. For the first threshold, our ICC reflects greater reliability than the values observed by Feldmann et al. [20,36] (ICC = 0.78 vs. ICC = 0.57 and 0.56, respectively), which may be due to the GXT type, because Feldmann et al. [36] used a ramp test with increments of 20–25 W every minute and [20] employed a step test with increments between 30 and 50 W every 3 min. For the second threshold, our ICC of 0.81 was excellent, consistent with the ICC of 0.9 reported by previous studies [36,37]. However, it is important to take into account that this reliability can be different when using another device or type of analysis, as other studies reported lower values (ICC 0.38–0.57) [20,38]. Taken together, these comparisons indicate that MOT1 and MOT2 in SCI may show reliability comparable to that reported in non-SCI populations, although differences in population characteristics and study conditions should be considered.
Our results suggest that although both muscles can be used to detect metabolic thresholds, the biceps brachii may provide more consistent estimates for the second threshold, supporting its use as the preferred site for SmO2-based threshold determination in the SCI population. Some reasons explain the better results of this region. Its major role for power production during arm ergometry [21] and the least physiological alteration produced by the injury compared to the triceps [22] are important arguments for the type of population and GXT used. Moreover, the biceps presented lower values of adipose tissue in comparison with the triceps (8 vs. 16 mm), which is known to affect the quality of the NIRS signal [39]. Another factor that may have contributed to the differences observed between muscles is the potential influence of large blood vessels on the NIRS signal [40]. Although the biceps brachii may be more influenced by large superficial blood vessels due to the presence of the basilic and brachial veins, the greater adipose tissue thickness in the triceps brachii seems to have a larger negative effect on signal quality. In line with the literature, metabolic thresholds reflect integrated responses from multiple physiological systems [13,14], and the NIRS technique appears capable of capturing these metabolic transitions in the SCI population in arm muscles during GXT.
This study has some limitations that should be considered. The sample size was relatively small (n = 9). Recruitment of participants with SCI can be particularly challenging, as has also been highlighted in previous studies with this population through small samples [40]. Therefore, the results should be interpreted as exploratory and hypothesis-generating rather than confirmatory. In addition, the limited sample size did not allow for subgroup analyses (e.g., by sex, level of injury or adipose tissue thickness), which may be relevant given the variability in muscle oxygenation responses. Moreover, a substantial proportion of participants exceeded previously reported ATT limits of agreement (15 mm), which may introduce additional variability and limit the practical applicability of the approach [36]. This study should be considered as an exploratory study. The small sample, inherent to SCI research, may limit statistical power and increase variability, particularly affecting agreement analyses such as Bland–Altman. A post hoc sensitivity analysis suggested that a sample size between 14 and 21 participants would be required to detect moderate differences between methods with adequate statistical power. Accordingly, the present findings should be interpreted with caution, and future studies with larger samples are needed to confirm our results and explore these factors in more detail, and the effect of the GXT type on our results.

5. Conclusions

SmO2 may be a valid and promising variable for determining the GET (MOT1) and RCP (MOT2) during GXT on an arm-crank ergometer for the population with a SCI. In addition, the biceps brachii and triceps brachii showed a certain level of agreement with gas exchange, but the biceps brachii showed better agreement, particularly for the second threshold.

Author Contributions

Conceptualization, J.M.M.-F., J.I.P.-Q., C.S.-P. and I.A.-A.; methodology, J.I.P.-Q., C.S.-P. and I.A.-A.; formal analysis, J.I.P.-Q. and C.S.-P.; investigation, J.M.M.-F., J.I.P.-Q., C.S.-P., C.C.-G., P.W.-I. and I.A.-A.; data curation, J.M.M.-F., J.I.P.-Q., C.S.-P., C.C.-G., P.W.-I. and I.A.-A.; writing—original draft preparation, C.C.-G., J.I.P.-Q., C.S.-P. and I.A.-A.; writing—review and editing, J.M.M.-F., J.I.P.-Q., C.S.-P., C.C.-G., P.W.-I. and I.A.-A.; visualization, J.I.P.-Q., C.S.-P. and I.A.-A.; supervision, I.A.-A. and J.I.P.-Q. All authors have read and agreed to the published version of the manuscript.

Funding

The project was supported by Conselleria de Innovación, Universidades, Ciencia y Sociedad Digital of Generalitat Valenciana (Ref: CIGE/2021/133). J.M.M.-F.’s contribution was funded by a pre-doctoral grant from the Ministry of Universities of Spain, grant number FPU20/01060.

Institutional Review Board Statement

The study was conducted according to the guidelines of the Declaration of Helsinki and approved by the Ethics Committee of the University of Valencia (registry number 1994739).

Informed Consent Statement

Informed consent was obtained from all subjects involved in the study.

Data Availability Statement

The dataset generated and analyzed during the current study is available from the corresponding author upon reasonable request.

Acknowledgments

The authors would like to thank the participants for their voluntary participation in this study.

Conflicts of Interest

The authors declare no conflicts of interest.

References

  1. Lu, Y.; Shang, Z.; Zhang, W.; Pang, M.; Hu, X.; Dai, Y.; Shen, R.; Wu, Y.; Liu, C.; Luo, T.; et al. Global Incidence and Characteristics of Spinal Cord Injury since 2000–2021: A Systematic Review and Meta-Analysis. BMC Med. 2024, 22, 285. [Google Scholar] [CrossRef]
  2. Silva, N.A.; Sousa, N.; Reis, R.L.; Salgado, A.J. From Basics to Clinical: A Comprehensive Review on Spinal Cord Injury. Prog. Neurobiol. 2014, 114, 25–57. [Google Scholar] [CrossRef]
  3. Hosseini, S.M.; Borys, B.; Karimi-Abdolrezaee, S. Neural Stem Cell Therapies for Spinal Cord Injury Repair: An Update on Recent Preclinical and Clinical Advances. Brain 2024, 147, 766–793. [Google Scholar] [CrossRef]
  4. Li, C.; Luo, Y.; Li, S. The Roles of Neural Stem Cells in Myelin Regeneration and Repair Therapy after Spinal Cord Injury. Stem Cell Res. Ther. 2024, 15, 204. [Google Scholar] [CrossRef]
  5. Haldemann, M.; Stojic, S.; Eriks-Hoogland, I.; Stoyanov, J.; Hund-Georgiadis, M.; Perret, C.; Glisic, M. Exploring Lifestyle Components and Associated Factors in Newly Injured Individuals with Spinal Cord Injury. Spinal Cord 2024, 62, 708–717. [Google Scholar] [CrossRef]
  6. Peterson, M.D.; Berri, M.; Lin, P.; Kamdar, N.; Rodriguez, G.; Mahmoudi, E.; Tate, D. Cardiovascular and Metabolic Morbidity Following Spinal Cord Injury. Spine J. 2021, 21, 1520–1527. [Google Scholar] [CrossRef]
  7. Luiggi, M.; Richard, R.; Duquesne, V.; Joncheray, H. Social Risk Factors for an Injury in Paralympic Athletes: Examining Time to Access the Training Facility and Time to Prepare Before and After Training. Orthop. J. Sports Med. 2025, 13, 23259671251320986. [Google Scholar] [CrossRef] [PubMed]
  8. Øvstehage, V.; Sandbakk, S.B.; Kocbach, J.; Sandbakk, Ø. Exploring Key Factors Associated with Training Quality among Elite Para-Athletes. A Qualitative Study. Front. Sports Act. Living 2025, 7, 1561641. [Google Scholar] [CrossRef]
  9. Iannetta, D.; Inglis, E.C.; Mattu, A.T.; Fontana, F.Y.; Pogliaghi, S.; Keir, D.A.; Murias, J.M. A Critical Evaluation of Current Methods for Exercise Prescription in Women and Men. Med. Sci. Sports Exerc. 2020, 52, 466. [Google Scholar] [CrossRef] [PubMed]
  10. Jamnick, N.A.; Pettitt, R.W.; Granata, C.; Pyne, D.B.; Bishop, D.J. An Examination and Critique of Current Methods to Determine Exercise Intensity. Sports Med. 2020, 50, 1729–1756. [Google Scholar] [CrossRef] [PubMed]
  11. Binder, R.K.; Wonisch, M.; Corra, U.; Cohen-Solal, A.; Vanhees, L.; Saner, H.; Schmid, J.-P. Methodological Approach to the First and Second Lactate Threshold in Incremental Cardiopulmonary Exercise Testing. Eur. J. Cardiovasc. Prev. Rehabil. 2008, 15, 726–734. [Google Scholar] [CrossRef]
  12. Caen, K.; Pogliaghi, S.; Lievens, M.; Vermeire, K.; Bourgois, J.G.; Boone, J. Ramp vs. Step Tests: Valid Alternatives to Determine the Maximal Lactate Steady-State Intensity? Eur. J. Appl. Physiol. 2021, 121, 1899–1907. [Google Scholar] [CrossRef]
  13. Boone, J.; Barstow, T.J.; Celie, B.; Prieur, F.; Bourgois, J. The Interrelationship between Muscle Oxygenation, Muscle Activation, and Pulmonary Oxygen Uptake to Incremental Ramp Exercise: Influence of Aerobic Fitness. Appl. Physiol. Nutr. Metab. 2016, 41, 55–62. [Google Scholar] [CrossRef] [PubMed]
  14. Caen, K.; Bourgois, J.G.; Stassijns, E.; Boone, J. A Longitudinal Study on the Interchangeable Use of Whole-Body and Local Exercise Thresholds in Cycling. Eur. J. Appl. Physiol. 2022, 122, 1657–1670. [Google Scholar] [CrossRef] [PubMed]
  15. Keir, D.A.; Pogliaghi, S.; Murias, J.M. The Respiratory Compensation Point and the Deoxygenation Break Point Are Valid Surrogates for Critical Power and Maximum Lactate Steady State. Med. Sci. Sports Exerc. 2018, 50, 2375–2378. [Google Scholar] [CrossRef] [PubMed]
  16. Perrey, S.; Quaresima, V.; Ferrari, M. Muscle Oximetry in Sports Science: An Updated Systematic Review. Sports Med. 2024, 54, 975–996. [Google Scholar] [CrossRef]
  17. Hamaoka, T.; McCully, K.K. Review of Early Development of Near-Infrared Spectroscopy and Recent Advancement of Studies on Muscle Oxygenation and Oxidative Metabolism. J. Physiol. Sci. 2019, 69, 799–811. [Google Scholar] [CrossRef]
  18. Sánchez-Jiménez, J.L.; Sendra-Pérez, C.; de Anda, R.M.C.O.; Vazquez-Fariñas, M.; Priego-Quesada, J.I.; Aparicio-Aparicio, I. Muscle Oxygen Saturation to Determine Lactate Thresholds in Spinal Cord Injury Population. Int. J. Sports Med. 2025, 46, 1080–1086. [Google Scholar] [CrossRef]
  19. Sendra-Pérez, C.; Encarnacion-Martinez, A.; Salvador-Palmer, R.; Murias, J.M.; Priego-Quesada, J.I. Profiles of Muscle-Specific Oxygenation Responses and Thresholds during Graded Cycling Incremental Test. Eur. J. Appl. Physiol. 2025, 125, 237–245. [Google Scholar] [CrossRef]
  20. van der Zwaard, S.; Jaspers, R.T.; Blokland, I.J.; Achterberg, C.; Visser, J.M.; den Uil, A.R.; Hofmijster, M.J.; Levels, K.; Noordhof, D.A.; de Haan, A.; et al. Oxygenation Threshold Derived from Near-Infrared Spectroscopy: Reliability and Its Relationship with the First Ventilatory Threshold. PLoS ONE 2016, 11, e0162914. [Google Scholar] [CrossRef]
  21. Mulroy, S.J.; Farrokhi, S.; Newsam, C.J.; Perry, J. Effects of Spinal Cord Injury Level on the Activity of Shoulder Muscles during Wheelchair Propulsion: An Electromyographic Study1. Arch. Phys. Med. Rehabil. 2004, 85, 925–934. [Google Scholar] [CrossRef]
  22. Ribot-Ciscar, E.; Butler, J.E.; Thomas, C.K. Facilitation of Triceps Brachii Muscle Contraction by Tendon Vibration after Chronic Cervical Spinal Cord Injury. J. Appl. Physiol. 2003, 94, 2358–2367. [Google Scholar] [CrossRef] [PubMed]
  23. Sendra-Pérez, C.; Sanchez-Jimenez, J.L.; Marzano-Felisatti, J.M.; Encarnación-Martínez, A.; Salvador-Palmer, R.; Priego-Quesada, J.I. Reliability of Threshold Determination Using Portable Muscle Oxygenation Monitors during Exercise Testing: A Systematic Review and Meta-Analysis. Sci. Rep. 2023, 13, 12649. [Google Scholar] [CrossRef] [PubMed]
  24. Goosey-Tolfrey, V.L.; Alfano, H.; Fowler, N. The Influence of Crank Length and Cadence on Mechanical Efficiency in Hand Cycling. Eur. J. Appl. Physiol. 2008, 102, 189–194. [Google Scholar] [CrossRef] [PubMed]
  25. Keir, D.A.; Iannetta, D.; Mattioni Maturana, F.; Kowalchuk, J.M.; Murias, J.M. Identification of Non-Invasive Exercise Thresholds: Methods, Strategies, and an Online App. Sports Med. 2022, 52, 237–255. [Google Scholar] [CrossRef]
  26. Hermens, H.; Freriks, B.; Merletti, R.; Stegeman, D.; Blok, J.; Rau, G.; Klug, C.; Hägg, G.; Blok, W.J.; Hermens, H. European Recommendations for Surface Electromyography: Results of the SENIAM Project. Roessingh Res. Dev. 1999, 8, 13–54. [Google Scholar]
  27. Sendra-Pérez, C.; Priego-Quesada, J.I.; Murias, J.M.; Carpes, F.P.; Salvador-Palmer, R.; Encarnación-Martínez, A. Evaluation of Leg Symmetry in Muscle Oxygen Saturation during Submaximal to Maximal Cycling Exercise. Eur. J. Sport Sci. 2025, 25, e12230. [Google Scholar] [CrossRef]
  28. Sendra-Pérez, C.; Encarnación-Martínez, A.; Oficial-Casado, F.; Salvador-Palmer, R.; Priego-Quesada, J.I. A Comparative Analysis of Mathematical Methods for Detecting Lactate Thresholds Using Muscle Oxygenation Data during a Graded Cycling Test. Physiol. Meas. 2023, 44, 125013. [Google Scholar] [CrossRef]
  29. Hofmann, P.; Tschakert, G. Special Needs to Prescribe Exercise Intensity for Scientific Studies. Cardiol. Res. Pract. 2010, 2011, 209302. [Google Scholar] [CrossRef]
  30. Cohen, J. Statistical Power Analysis for the Behavioral Sciences, 2nd ed.; Lawrance Eribaum Associates: New York, NY, USA, 1988. [Google Scholar]
  31. Weir, J.P. Quantifying Test-Retest Reliability Using the Intraclass Correlation Coefficient and the SEM. J. Strength Cond. Res. 2005, 19, 231–240. [Google Scholar] [CrossRef]
  32. Bland, J.M.; Altman, D. Statistical Methods for Assessing Agreement between Two Methods of Clinical Measurement. Lancet 1986, 327, 307–310. [Google Scholar] [CrossRef]
  33. Faude, O.; Kindermann, W.; Meyer, T. Lactate Threshold Concepts. Sports Med. 2009, 39, 469–490. [Google Scholar] [CrossRef] [PubMed]
  34. Krishnan, A.; Guru, C.S.; Sivaraman, A.; Alwar, T.; Sharma, D.; Angrish, P. Newer Perspectives in Lactate Threshold Estimation for Endurance Sports—A Mini-Review. Cent. Eur. J. Sport Sci. Med. 2021, 35, 99–116. [Google Scholar] [CrossRef]
  35. Feldmann, A.; Ammann, L.; Gächter, F.; Zibung, M.; Erlacher, D. Muscle Oxygen Saturation Breakpoints Reflect Ventilatory Thresholds in Both Cycling and Running. J. Hum. Kinet. 2022, 83, 87–97. [Google Scholar] [CrossRef]
  36. Salas-Montoro, J.-A.; Mateo-March, M.; Sánchez-Muñoz, C.; Zabala, M. Determination of Second Lactate Threshold Using Near-Infrared Spectroscopy in Elite Cyclists. Int. J. Sports Med. 2022, 43, 721–728. [Google Scholar] [CrossRef]
  37. Batterson, P.M.; Kirby, B.S.; Hasselmann, G.; Feldmann, A. Muscle Oxygen Saturation Rates Coincide with Lactate-Based Exercise Thresholds. Eur. J. Appl. Physiol. 2023, 123, 2249–2258. [Google Scholar] [CrossRef] [PubMed]
  38. Niemeijer, V.M.; Jansen, J.P.; van Dijk, T.; Spee, R.F.; Meijer, E.J.; Kemps, H.M.C.; Wijn, P.F.F. The Influence of Adipose Tissue on Spatially Resolved Near-Infrared Spectroscopy Derived Skeletal Muscle Oxygenation: The Extent of the Problem. Physiol. Meas. 2017, 38, 539. [Google Scholar] [CrossRef]
  39. Seddone, S.; Ermini, L.; Policastro, P.; Mesin, L.; Roatta, S. Evidence That Large Vessels Do Affect near Infrared Spectroscopy. Sci. Rep. 2022, 12, 2155. [Google Scholar] [CrossRef]
  40. Zimmermann, G.; Bolter, L.-M.; Sluka, R.; Höller, Y.; Bathke, A.C.; Thomschewski, A.; Leis, S.; Lattanzi, S.; Brigo, F.; Trinka, E. Sample Sizes and Statistical Methods in Interventional Studies on Individuals with Spinal Cord Injury: A Systematic Review. J. Evid. Based Med. 2019, 12, 200–208. [Google Scholar] [CrossRef] [PubMed]
Figure 1. Examples of different raw muscle oxygen saturation signals. Blue lines show the start and finish of the incremental test.
Applsci 16 05009 g001
Figure 2. Box plots with individual responses (points and lines) of oxygen consumption values (VO2) when the gas exchange threshold (GET) and the respiratory compensation point (RCP) were determined by the breath-by-breath pulmonary gas exchange analyses, compared with the VO2 values when the muscle oxygen saturation breakpoint was determined (MOT1 and MOT2). Colour lines show individual responses.
Applsci 16 05009 g002
Figure 3. Bland–Altman plots to analyze the VO2 difference between gas exchange threshold (GET) or the respiratory compensation point (RCP) and the muscle oxygen saturation breakpoints determined (MOT1 and MOT2). The central continuous blue line represents the absolute average difference between instruments (bias), and the upper and lower red lines represent ±1.96 standard deviations (limits of agreement).
Applsci 16 05009 g003
Table 1. Mean ± standard deviation of sample characteristics.
CharacteristicAll Participants
Age (years old)48 ± 5
Height (m)1.69 ± 0.11
Body mass (kg)70.3 ± 19.4
Body mass index (kg/m2)24.16 ± 4.6
Day per week training (day/week)5 ± 2
Experience years (years)9 ± 5
Triceps skinfold (mm)15.1 ± 8.6
Biceps skinfold (mm)8.2 ± 5.2
Table 2. Intraclass correlation values (ICC) between VO2 when muscle oxygen saturation breakpoints were determined (MOT1 and MOT2) and VO2 at the gas exchange threshold (GET) and the respiratory compensation point (RCP).
ComparisonICC
Meanp-Value95CI% Low95CI% Upp
GET & MOT1 at Triceps Brachii0.440.07−0.170.83
GET & MOT1 at Biceps Brachii0.78<0.010.210.95
RCP & MOT2 at Triceps Brachii0.600.07−0.110.91
RCP & MOT2 at Biceps Brachii0.81<0.010.230.96
Disclaimer/Publisher’s Note: The statements, opinions and data contained in all publications are solely those of the individual author(s) and contributor(s) and not of MDPI and/or the editor(s). MDPI and/or the editor(s) disclaim responsibility for any injury to people or property resulting from any ideas, methods, instructions or products referred to in the content.