1. Introduction
1.1. Research Background
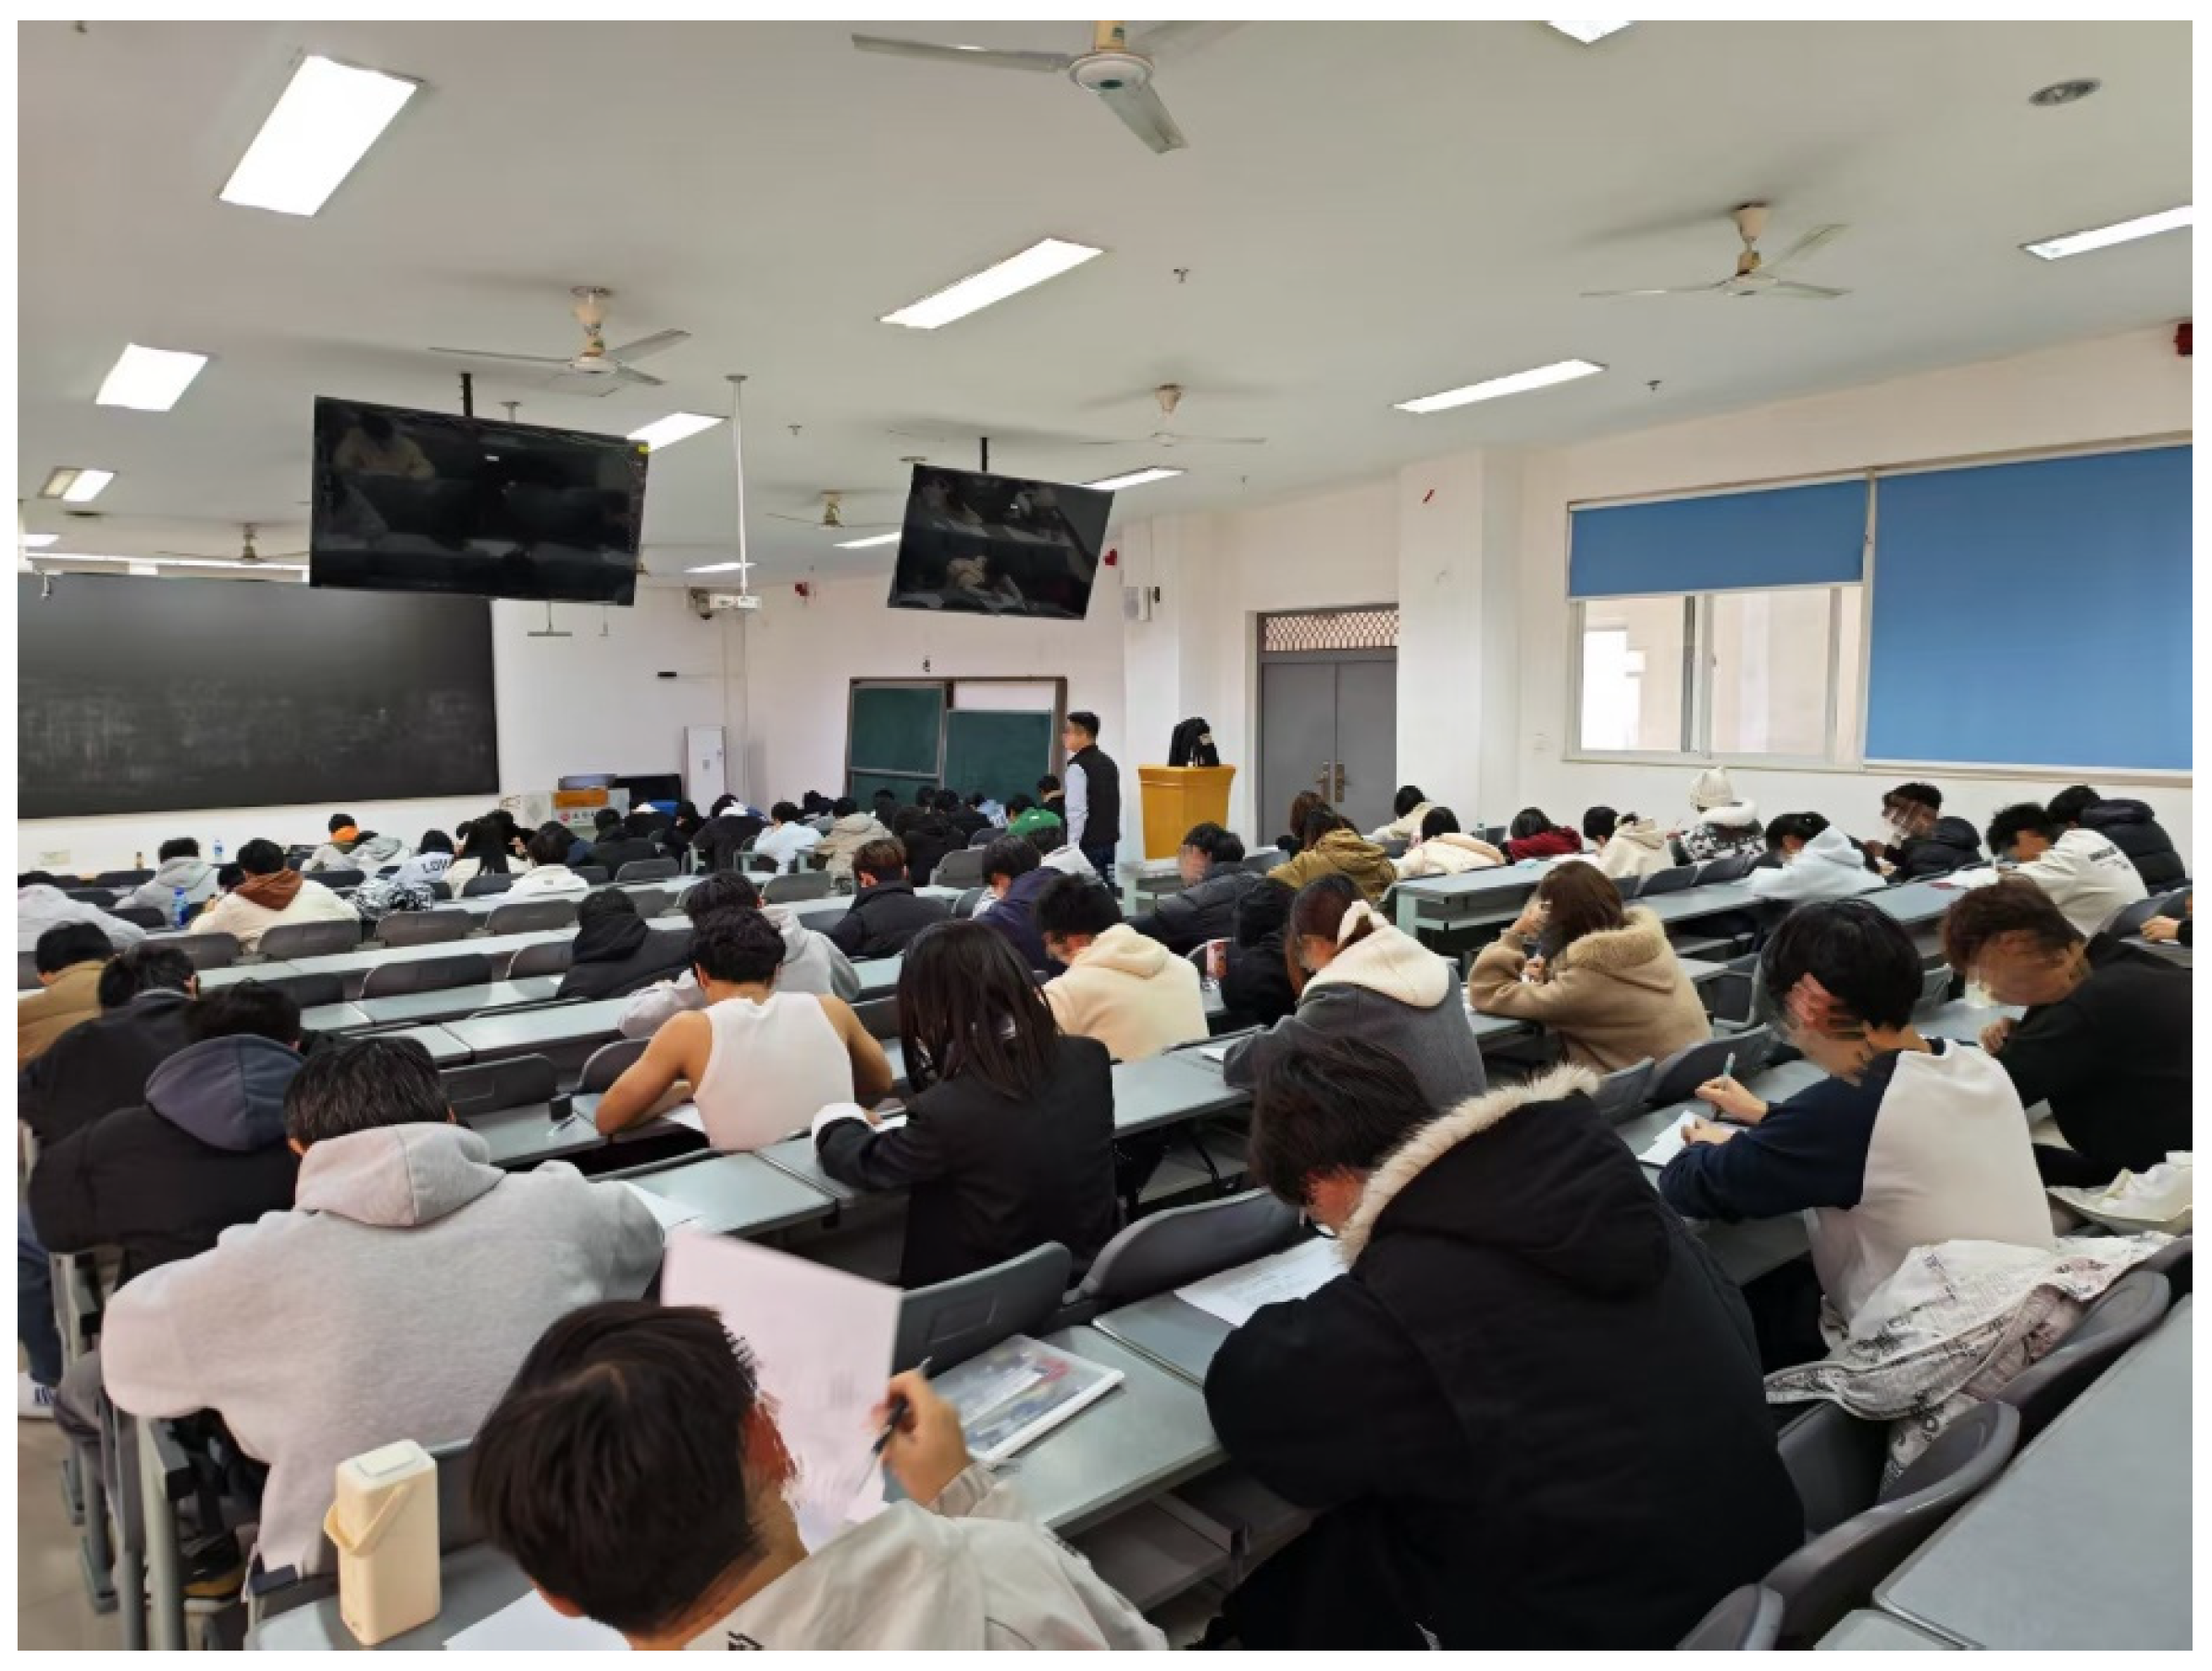
With the rapid expansion of higher education and the increasing functional complexity of university teaching buildings, evacuation safety in densely occupied educational environments has become a critical issue in both building design and safety management research. Teaching buildings, often multi-storey and densely populated during class transitions or large-scale examinations, present unique challenges for emergency evacuation, particularly when these spaces are temporarily repurposed as examination rooms (
Figure 1). Under such high-density conditions, congestion, visibility obstruction, and behavioural hesitation can severely reduce evacuation efficiency and compromise safety [
1].
Recent studies have highlighted that architectural attributes—including corridor width, stair geometry, exit distribution, and vertical circulation structure—significantly determine evacuation performance in large educational buildings [
2]. High-fidelity simulation platforms such as PyroSim and Pathfinder, when combined with Building Information Modelling (BIM), enable detailed modelling of smoke diffusion, crowd interaction, and multi-floor evacuation dynamics [
3,
4]. For example, Ding et al. developed a BIM-based real-time evacuation simulation system that integrates building data, fire dynamics, and evacuation platforms to optimize route planning in response to dynamic fire spread [
4]. In parallel, Yakhou et al. proposed a two-way data-flow framework linking BIM (Revit) and Pathfinder for evacuation design validation [
5].
Behavioral decision-making during evacuation is also receiving more attention. Advanced agent-based simulations now account for perception delay, stress, and spatial unfamiliarity. VR-based behavioral studies suggest that cognitive constraints under emergency conditions can significantly slow down response and alter route choices [
6]. Moreover, reinforcement-learning approaches are emerging: for instance, a radar-assisted SARSA algorithm has been used to mimic pedestrian decisions in real time under evolving fire scenarios [
7].
Although numerous studies have examined evacuation in high-density teaching buildings or exam-like classroom settings, these works primarily focus on physical crowding, exit configuration, or general classroom layouts. However, temporary examination-room environments involve additional organizational and behavioral characteristics that differ from ordinary high-density scenarios, including fixed seating grids, invigilator-controlled guidance, restricted pre-movement behavior, delayed reaction due to exam discipline, and temporary spatial adjustments made only during examination periods. Existing studies do not explicitly incorporate these exam-specific mechanisms into their indicator systems or evaluation frameworks. Therefore, rather than stating a general lack of research on high-density evacuation, this study focuses on the more specific and under-addressed issue of evacuation evaluation, considering the organizational, behavioral, and temporary spatial constraints unique to temporary examination-room conversions.
While BIM-based evacuation simulation and fire–evacuation coupling methods have been widely applied in recent studies, in the present work, such approaches serve only as theoretical references [
8,
9]. This paper does not conduct full-scale BIM or Pathfinder simulations. Instead, existing simulation findings are used to inform the selection of certain performance-related indicators (e.g., bottleneck likelihood, evacuation time ratios). The analytical contribution of this study lies in the development of a scenario-specific evaluation framework rather than the execution of new evacuation simulations.
1.2. Literature Review and Current Research Progress
Over the past five years, evacuation modelling has undergone substantial development, with increasing emphasis on behavioural realism, multi-source data integration, and dynamic environmental coupling. Agent-based simulation frameworks have evolved from simple flow models toward behaviour-aware and data-driven systems capable of representing perception, decision-making, and social interaction under emergency conditions [
10,
11]. Systematic reviews further underscore the importance of modelling communication, group dynamics, and cognitive variability—for example, Senanayake et al. provide a comprehensive review of agent-based evacuation tools and their behavioural underpinnings [
12], while Templeton et al. highlight the role of social behaviour and information sharing in evacuation simulations [
13].
At the building level, BIM-based evacuation simulations are now standard tools for testing spatial configurations. Research shows that evacuation performance is highly sensitive to factors such as stairwell dimensions, corridor length, exit placement, and connectivity in multi-storey educational buildings [
14,
15]. Furthermore, simulation studies coupling BIM with fire dynamics or path-planning tools show that staircase bottlenecks and vertical circulation remain critical constraints [
16,
17]. In addition, Godes et al. demonstrated that automated BIM-driven geometry optimization (e.g., via Dynamo) can reduce congestion and improve evacuation efficiency [
18].
Behavioral simulation has also become more sophisticated. Reinforcement-learning models are emerging: Huang et al. implemented a radar-assisted SARSA algorithm to dynamically guide pedestrians to safer routes under different fire heat-release rates and growth conditions [
7]. Other work applies machine learning and discrete-choice models to simulate how evacuees choose between alternative paths, factoring in risk perception, delay, and group behavior [
11]. Meanwhile, Zhang et al. developed an improved Social Force Model (ISFM) to simulate evacuation in multi-exit, multi-floor buildings, capturing realistic crowd compression and return flow patterns [
19].
Empirical scenario studies provide further context: in university teaching buildings, simulations under exam-like densities show that familiarity with space, crowding, and limited exit choice significantly affect evacuation times [
20].
Cross-domain research also reinforces the need for integrated, multi-objective planning frameworks. For example, Bi et al. apply real-time multi-objective route planning in underground mine fire scenarios using agent-based models and environmental sensing [
21]. In parallel, B. Wang et al. propose a two-way BIM framework that embeds fire-simulation data into design workflows to validate evacuation strategies early in the design phase [
22].
Methodologically, there is growing momentum toward hybrid evaluation approaches. While simulation remains dominant, techniques such as Grey Relational Analysis (GRA) and entropy weighting enable multi-criteria assessments that consider both quantitative and qualitative factors [
23]. More recently, Li et al. advanced dynamic coupled models that simulate the interactions among building geometry, fire progression, and human behavior, allowing for more realistic and robust safety evaluation [
24].
Despite these advances, gaps remain: few studies specifically address the temporary conversion of teaching buildings for examination use, with their distinctive high densities, stress levels, and examination-specific behavioural patterns. Moreover, the integration of behavioural insights with structured evaluation methods (such as GRA) remains limited in educational settings. Strengthening this behavioural–analytical linkage could significantly improve safety management and architectural design for high-stakes evacuation scenarios.
1.3. Research Gap and Objectives
Existing evacuation studies have extensively examined high-density classrooms, teaching buildings, and exam-like scenarios. However, these studies generally model density, spatial configuration, or generic behavioral assumptions, without addressing several exam-specific mechanisms, such as invigilator-directed movement, strict behavioral discipline, restricted communication, fixed seating geometry, and temporary layout modifications used only during examination periods. While related in density characteristics, these contexts are operationally and behaviorally distinct from permanent classroom environments. Therefore, the research gap addressed in this study is not the absence of evacuation research in dense teaching spaces, but the lack of integrated evaluation frameworks that incorporate the temporary organizational structure and behavioral constraints unique to examination-room conversions.
Although GRA has been applied to evacuation evaluation in several studies, existing models primarily target generic building types or rely on indicators related to architectural geometry and standard fire-safety facilities. These works do not incorporate exam-specific behavioural constraints—such as seated stationary occupants, delayed pre-movement until invigilator instruction, or aisle blockages caused by temporary desk layouts—nor do they include organizational factors unique to examination settings. Direct comparison with previous GRA-based evacuation evaluations shows that such indicators are absent in existing frameworks, underscoring the need for a scenario-specific system tailored to temporary examination rooms rather than a generic indicator set.
Therefore, rather than proposing a new mathematical method, this study introduces a scenario-specific, integrated evaluation framework that combines (i) an exam-oriented indicator system, (ii) simulation-informed performance metrics, and (iii) a hybrid AHP–entropy weighting mechanism tailored to temporary examination-room conditions.
To address these gaps, this study develops an integrated approach that incorporates findings from existing evacuation studies into a GRA-based evaluation framework, aiming to evaluate evacuation safety in temporary examination rooms of multi-storey teaching buildings. The objectives are to:
(1) Establish a multi-level indicator system that incorporates the structural, organizational, and behavioral characteristics specific to temporary examination-room evacuation.
(2) Integrate performance and management-related indicators—some of which are commonly obtained in institutional safety assessments—into a unified GRA-based evaluation framework.
(3) Quantitatively identify the key factors influencing evacuation safety and provide actionable recommendations for improving temporary examination-room management and spatial organization.
The main contributions of this study are threefold. (i) It establishes the first scenario-specific evacuation evaluation framework for temporary examination rooms in multi-storey teaching buildings, a context that has not been systematically addressed in the literature. (ii) It integrates agent-based evacuation simulation with a multi-level indicator system and a hybrid AHP–entropy weighting mechanism into a unified GRA-based evaluation framework. (iii) It develops an indicator system that incorporates exam-specific organizational, behavioral, and spatial-configuration characteristics that are absent from existing evacuation studies.
2. Construction of the Evaluation Indicator System
The indicator system in this study is not intended as an exhaustive checklist of all possible evacuation-related factors; rather, it is constructed through a theory-driven, hierarchical reasoning process based on three bodies of established knowledge:
(1) Building evacuation flow-capacity theory, which defines how geometric and facility conditions constrain evacuation throughput;
(2) Pre-evacuation and behavioral response models, which emphasize reaction delays, psychological constraints, compliance, and guided movement;
(3) Emergency management frameworks, which highlight the organizational roles, communication structures, and preparedness mechanisms that influence coordinated evacuation.
Grounded in these theoretical foundations, the indicator system is organized into six dimensions that correspond to the key mechanisms affecting evacuation in temporary examination-room settings. These dimensions are not arbitrarily combined; each represents a distinct class of constraints supported by prior research and emergency management principles:
(1) Building Structural Safety (C1) captures hard physical constraints—such as corridor width, stair capacity, exit distribution, and vertical flow paths—that determine maximum evacuation flow. These factors are foundational because they are mandated by codes and cannot be altered during an emergency.
(2) Evacuation Facilities and Environment (C2) reflects visibility, accessibility, and safety support conditions (signage, lighting, firefighting equipment), which directly influence evacuees’ ability to perceive routes and maintain stable flow. Their importance is well established in flow-efficiency and visibility-based evacuation models.
(3) Examination Room Organization and Management (C3) represents exam-specific organizational mechanisms, including invigilator allocation, responsibility assignment, and circulation control. These factors define the operational management structure, which has been shown to significantly influence pre-movement delay and route choice.
(4) Personnel Factors (C4) address individual behavioral constraints, such as density, response delay, special populations, and familiarity with evacuation knowledge. These stem from behavioral–cognitive evacuation theories and explain variations in pre-evacuation time and movement efficiency.
(5) Emergency Plan and Drills (C5) represent the preparedness dimension, corresponding to emergency-management theory, which highlights the role of planning and rehearsed procedures in reducing uncertainty and enhancing response coordination.
(6) Performance/Response Indicators (C6) provide simulation-derived outcome measures—including bottleneck formation and evacuation time ratios—linking the preceding structural, organizational, and behavioral factors to observable evacuation performance.
Each indicator in the proposed system was selected based on observed behavioural and spatial characteristics of temporary examination rooms. Structural indicators (C1) reflect temporary changes in corridor and aisle configurations introduced by examination layouts. Facility indicators (C2) capture lighting and signage conditions that directly affect seated occupants’ ability to initiate movement. Organizational indicators (C3) reflect the invigilator-controlled nature of evacuation initiation. Behavioural indicators (C4) represent compliance levels specific to examination scenarios. Emergency preparedness (C6) includes temporary room-level management procedures not present in ordinary classroom use. These exam-specific features justify the inclusion of additional indicators beyond those found in general classroom evacuation models.
Thus, the indicator framework is conceptually structured rather than mechanically aggregated. Each indicator category maps onto a specific mechanism supported by prior literature and evacuation science. The hierarchical structure (goal → criterion → indicator) ensures that each factor contributes to the overall evaluation through a traceable and theoretically justified pathway.
Furthermore, the relative weights assigned to indicators are guided by two principles:
(1) Code dominance, meaning physical constraints (C1–C2) receive higher weights due to their non-negotiable role in flow capacity;
(2) Behavioral and organizational influence, meaning management and behavioral indicators (C3–C4), contribute moderately as they shape response time and movement dynamics.
This theoretically grounded reasoning ensures that the indicator system is both comprehensive and structurally justified, reflecting the multi-mechanism nature of evacuation in temporary examination-room environments. The criterion layers and corresponding secondary indicators are summarized in
Table 1,
Table 2,
Table 3,
Table 4,
Table 5 and
Table 6.
To ensure the indicators are quantifiable and suitable for Grey Relational Analysis (GRA), priority was given to indicators whose maximum and minimum values could be determined based on standards or actual campus data, while certain qualitative indicators were quantified through expert scoring. Data collection combined field surveys and questionnaires: field surveys primarily obtained objective data on building dimensions, corridors, stairs, exits, and safety facilities, whereas questionnaires collected subjective assessments of candidates’ and staff’s knowledge of emergency evacuation, psychological state, and behavioral responses. Furthermore, reference maximum and minimum values for each indicator were determined through standard comparisons to provide a standardized sequence for Grey Relational Analysis. The specific steps of the GRA evaluation method are detailed below.
3. Steps of Grey Relational Analysis (GRA) Evaluation
3.1. Evaluation Steps
After defining the evaluation objectives and establishing the indicator system, the next step is to conduct a quantitative analysis of the evacuation safety of each teaching building used as a temporary examination room. The Grey Relational Analysis (GRA) method systematically evaluates the overall safety level of each examination room in terms of building facilities, personnel management, and emergency response by comparing each room’s indicators with the ideal safety state. To ensure that the evaluation process is scientific and operable, this study divides it into several steps. First, the reference and comparison sequences are determined to establish the correspondence between each room’s indicator data and the ideal state. Then, the data are standardized to allow comparability among indicators with different dimensions and measurement methods. Subsequently, the deviation sequences and grey relational coefficients are calculated to reflect the closeness of each indicator to the ideal state. Next, indicators are weighted and comprehensively analyzed to obtain the overall safety level of the examination room. Finally, the evaluation results are categorized into safety levels, and key influencing factors are identified to provide a basis for targeted improvement measures. This procedure is logical, straightforward, and comprehensively reflects the evacuation safety characteristics of temporary examination rooms. The detailed steps are as follows:
(1) Determine Evaluation Objects and Reference Sequence. The evaluation objects are teaching buildings temporarily converted into examination rooms at various universities (e.g., Campus A, Campus B). A reference sequence and comparison sequences are constructed. The reference sequence represents the ideal safety state, with each indicator taking the optimal value (e.g., corridor width meeting code standards, complete evacuation facilities, and emergency drills covering all personnel). The comparison sequence corresponds to the actual measured values or expert scores for each indicator after the building is temporarily converted into an examination room.
(2) Data Preprocessing (Standardization). Since the evaluation indicators have different units and scales, all indicator data need to be standardized. For “the larger, the better” indicators (e.g., corridor width, drill coverage rate), the following normalization formula is used:
For “the smaller, the better” indicators (e.g., crowd density, evacuation distance, candidate response delay), a reverse normalization formula is applied:
After standardization, all indicator values are mapped to the interval [0, 1], providing a uniform basis for subsequent calculations.
(3) Compute Deviation Sequence. The deviation sequence for each indicator is calculated to measure the difference between the evaluation object and the reference sequence:
This deviation reflects the extent to which the evaluation object deviates from each indicator in the examination venue. A smaller deviation indicates that the indicator is closer to the ideal state.
(4) Calculate Grey Relational Coefficient. Based on the deviation sequence, the grey relational coefficient for each indicator is calculated as:
In which the deviation values of all secondary indicators were first computed, after which the global minimum and maximum deviations were obtained as , . These values were used uniformly in the computation of the grey relational coefficients to ensure cross-criterion comparability. The distinguishing coefficient was set to .
(5) Determine Indicator Weights. To reflect the relative importance of each indicator for evacuation safety, weights
are assigned. Weights represent each indicator’s contribution to the overall safety status and are critical for the comprehensive evaluation. Methods for determining weights include equal weighting, entropy weighting, or expert scoring. For example, the entropy method can follow the procedures described in [
25], while expert scoring can follow the procedures in [
26]. Regardless of the method, the weights must satisfy
.
(6) Calculate the Comprehensive Grey Relational Grade. The grey relational coefficients of all indicators for each examination room are weighted and aggregated to obtain the comprehensive grey relational grade:
The overall grey relational grade at the goal layer can be denoted by Γ. The closer the grade is to 1, the higher the overall evacuation safety level of the examination room.
(7) Classification of Safety Levels. Based on the comprehensive grey relational grade, the safety level of each examination room is classified as shown in
Table 7.
By comparing the calculated grey relational grades, the safety levels of the examination rooms can be visually identified, and their weak points can be determined. Further analysis of the weighted contribution of each indicator can identify the most critical factors affecting safety, whether in building facilities, room layout, evacuation management, or personnel factors. Based on the evaluation results, targeted improvement measures can then be proposed.
3.2. Rationale for Selecting GRA
Several multi-criteria decision-making (MCDM) methods have been widely applied in engineering and risk evaluation, including MARCOS, MABAC, and VIKOR. MARCOS provides a compromise-based ranking framework, suitable for many engineering selection problems, by comparing alternatives against ideal and anti-ideal reference solutions [
27]. MABAC combined with SWARA and FMEA has been successfully applied to construction risk prioritization under uncertainty, demonstrating improved clarity and consistency in ranking risk factors [
28]. VIKOR focuses on identifying compromise solutions when criteria conflict, trading off group utility and individual regret [
29]. However, these methods typically require relatively complete datasets and precise normalization, which may not align well with evacuation safety evaluation, where empirical fire-incident data are limited, and information is uncertain.
In contrast, Grey Relational Analysis (GRA) is rooted in grey system theory, which is designed for systems with partially known information and high uncertainty [
30]. GRA quantifies the relational closeness between alternatives and benchmarks even under incomplete data, and it involves straightforward computation suitable for small-sample environments without requiring strict normalization assumptions [
31,
32]. For these reasons, GRA is selected in this study as the primary evaluation method.
3.3. Rationale for Using a Hybrid AHP–Entropy Weighting Method
In this study, the weighting process does not rely on AHP alone. Instead, a hybrid AHP–entropy mechanism is adopted to account for the mixed nature of the indicator system. Several newer subjective weighting approaches—such as BWM [
33], LBWA [
34], FUCOM [
35], and DIBR [
36]—were developed to reduce the number of pairwise comparisons and improve consistency. While these methods are efficient, they require structured preference inputs (e.g., identifying best and worst criteria a priori in BWM) or involve optimization procedures that may reduce transparency for practitioners.
The hybrid AHP–entropy method offers a suitable balance between interpretability and analytical rigor for this application. AHP is used to weight examination-management and behavioral indicators that rely heavily on expert knowledge, and its consistency ratio provides a straightforward reliability check. In contrast, the entropy method objectively determines the weights of simulation-based performance indicators by capturing their data-driven variability. Combining the two allows both subjective and objective information to be incorporated, reducing limitations associated with using either method alone and providing a more realistic representation of evacuation conditions in temporary examination rooms.
5. Case Calculation and Analysis
5.1. Case Background and Data Sources
To verify the feasibility of the proposed evaluation model, a three-story teaching building at a university was selected as a case study. All data used in
Table 8 are derived from actual field measurements, architectural floor plans, and official fire-safety inspection records, rather than hypothetical or idealized values. The research team conducted a detailed on-site survey during the building’s conversion into a temporary examination venue, using laser distance meters to measure corridor width, stair width, evacuation distance, and passage dimensions. Illuminance levels of emergency lighting were obtained using a calibrated digital lux meter. Information on firefighting facilities, emergency signage, and door operability was collected from the university’s 2024 fire-inspection log.
Qualitative indicators—such as behavioral constraints, responsibility clarity, and invigilator allocation—were recorded through structured interviews with exam coordinators and invigilators and validated by two emergency-management experts. The proportion of special populations and familiarity with evacuation procedures were derived from a questionnaire survey of 218 examinees on the examination day.
To avoid over-precision and to ensure consistency with national code reporting formats, some measured values were rounded to standard engineering intervals (e.g., corridor width reported as 1.5 m instead of 1.47 m; emergency lighting 80 lx instead of 82–85 lx). This rounding follows standard safety-inspection practice and does not affect the GRA calculations because normalization removes unit-based scale sensitivity. Therefore, all inputs in
Table 8 reflect real measured or officially documented values, and no hypothetical or arbitrarily assigned data were used. The complete raw dataset is available upon request for verification and reproducibility.
Based on the raw data of the aforementioned indicators, this study employs the Grey Relational Analysis (GRA) method. Following the steps of “data standardization → deviation sequence calculation → grey relational coefficient computation → weighted comprehensive evaluation,” the comprehensive grey relational grade of the building is obtained. This allows for the determination of its evacuation safety level and the identification of key influencing factors.
5.2. Determination of Indicator Weights
To ensure scientific validity and reproducibility, the weighting process adopts a transparent, structured procedure combining expert judgment and data-driven entropy weighting. A panel of 15 experts was invited, consisting of fire protection engineers (5), architectural designers (3), university emergency coordinators (3), and safety-management specialists (4), each with more than 10 years of professional experience in building fire safety, evacuation simulation, or emergency management. These experts were selected because they routinely participate in safety inspections or emergency planning for large-scale examinations in university teaching buildings.
The subjective weights were derived using the Analytic Hierarchy Process (AHP). Experts performed pairwise comparisons following the standard Saaty 1–9 scale, and all individual matrices were aggregated using the geometric-mean method. Consistency ratios (CRs) were verified to be below 0.10, indicating acceptable logical consistency. This process ensures that the subjective weights reflect a coherent and collectively validated understanding of evacuation priorities under examination-room conditions.
To reduce dependence on expert subjectivity, we adopted a combined weighting approach, integrating the AHP-derived subjective weights
with entropy weights
using Equation (6).
where
is the subjective AHP weight,
is the entropy weight, and 0.6 ensures expert knowledge remains influential while still incorporating objective data variability. Finally, all integrated weights were normalized to ensure
. This hybrid weighting strategy reduces dependence on purely subjective assessments while retaining essential expert insight. The resulting first-level indicator weights used in subsequent evaluation are presented in
Table 9.
The weights of second-level indicators are allocated according to their relative importance within each first-level indicator. After normalization, the final weights ensure that the sum of all second-level indicator weights equals 1.00. This weighting system reflects both the critical importance of building structure and facilities and the comprehensive role of organization, management, and emergency preparedness.
In addition to the integration of subjective (AHP) and objective (entropy) methods, the assignment of higher weights to certain criterion-layer indicators—such as Building Structural Safety (C1) and Evacuation Facilities and Environment (C2)—follows both regulatory principles and empirical evacuation research. Before calculating the comprehensive grey relational grade
Γ, all secondary-indicator weights were renormalized so that Σ
ωᵢ = 1.00. The apparent sum of approximately 0.96 in
Table 10 results from rounding to four decimal places for presentation, while the full-precision weights satisfy Σ
ωᵢ = 1.00.
First, according to national fire protection standards and building safety codes, factors such as corridor width, stair capacity, evacuation distance, and exit distribution constitute the primary physical constraints governing evacuation performance. These structural attributes fundamentally determine the maximum permissible flow rate and are non-adjustable during emergency events. Therefore, experts consistently considered them as core determinants of evacuation safety during the AHP pairwise comparison process.
Second, previous simulation-based studies (e.g., high-rise teaching buildings, multi-functional complexes) show that structural bottlenecks account for over 40–60% of total evacuation delay, while organizational and behavioral factors usually play a secondary or compensatory role. This empirical evidence guided experts to assign relatively higher importance to C1 and C2 compared to management (C3), personnel factors (C4), or emergency preparedness (C5).
Third, to ensure transparency, the expert group followed explicit decision rules during the AHP judgment process:
(1) Prioritize indicators that directly influence flow capacity and geometric constraints;
(2) Assign moderate weights to organizational and behavioral indicators that influence movement efficiency but cannot override hard physical boundaries;
(3) Assign lower weights to performance indicators (C6), which reflect outcomes rather than determinants.
The resulting initial AHP matrix exhibited high consistency (CR < 0.10), confirming that the experts shared a coherent underlying logic in their judgments. After integrating entropy-derived objective weights, the final weight distribution maintains the structural–facility dominance but reflects data variability across all indicators.
Thus, the higher weights of Building Structural Safety and Evacuation Facilities arise from (1) code-based fundamental constraints, (2) evidence from evacuation science, and (3) consistent expert judgments validated through AHP, ensuring both theoretical and empirical justification.
5.3. Evaluation Calculation Process
Since the indicators have different units and measurement directions, the raw data were first dimensionless-standardized. Based on the evaluation procedure described in
Section 3, the formulas were applied to the case data.
To enhance the transparency and reproducibility of the proposed procedure, a step-by-step calculation is illustrated here using the indicator C1-I1 “Evacuation corridor width” from the case study in
Table 8 and the corresponding results in
Table 10.
Step 1: Normalization. For C1-I1, the measured corridor width is 1.5 m, with a minimum reference value of 0.9 m and a maximum reference value of 2.0 m. Since this is a “larger-the-better” indicator, the normalized value is obtained as:
Step 2: Deviation sequence. The deviation from the ideal value (1.0) is then:
Step 3: Grey relational coefficient. Based on the standard GRA formulation, the grey relational coefficient for this indicator is computed as:
where
and
are the minimum and maximum deviations among all indicators, and
is the distinguishing coefficient. Substituting the corresponding values for this case yields:
Step 4: Weighted contribution to the overall grade. From
Table 10, the integrated weight of C1-I1 is
(The contribution of this indicator to the comprehensive grey relational grade is:
The same procedure is applied to all indicators listed in
Table 10, and the calculation results for all the indicators are summarized in
Table 10, which lists the standardized values
, deviations
, grey relational coefficients
, final weights
, and the weighted results
for each secondary indicator. As shown in
Table 10, indicators with standardized values much lower than 1.0 and relatively small grey relational coefficients (e.g., corridor width, evacuation distance, and emergency lighting effectiveness) are farther from the ideal safety state and can be regarded as potential weak links in the evacuation system. In contrast, indicators with standardized values close to 1.0 and high relational coefficients (e.g., completeness of the emergency plan, firefighting facilities, and signage) reflect aspects where the case building already performs well. This table therefore provides the numerical basis for identifying which indicators are most likely to form bottlenecks and which serve as positive contributors before aggregation at the goal layer.
The global deviation range used in
Table 10 was
computed from all secondary indicators. The distinguishing coefficient was uniformly set to
. All results in
Table 10 follow the rounding rule of four-decimal intermediate precision and three-decimal final reporting.
5.4. Safety Level Determination and Analysis
Based on the weight distribution in
Table 9 and the indicator-level results in
Table 10, the weighted contributions of all indicators were aggregated to obtain the comprehensive grey relational grade
Γ at the goal layer:
According to the calculation, the comprehensive grey relational grade of the teaching building in its temporary examination room configuration is Γ = 0.5956, corresponding to the “Moderate” to “Relatively Safe” level according to the grey relational grade classification standard. This indicates that the building’s overall evacuation safety performance is good, with relatively complete fire protection facilities and an emergency preparedness system capable of supporting effective evacuation under most routine emergency scenarios.
However, some key indicators scored relatively low, suggesting that local bottlenecks exist in terms of evacuation distance and corridor space, which constrain the improvement of the overall safety level. To make these patterns more explicit,
Table 11 summarizes the weighted contribution of each indicator to the final grade
Γ.
As shown in
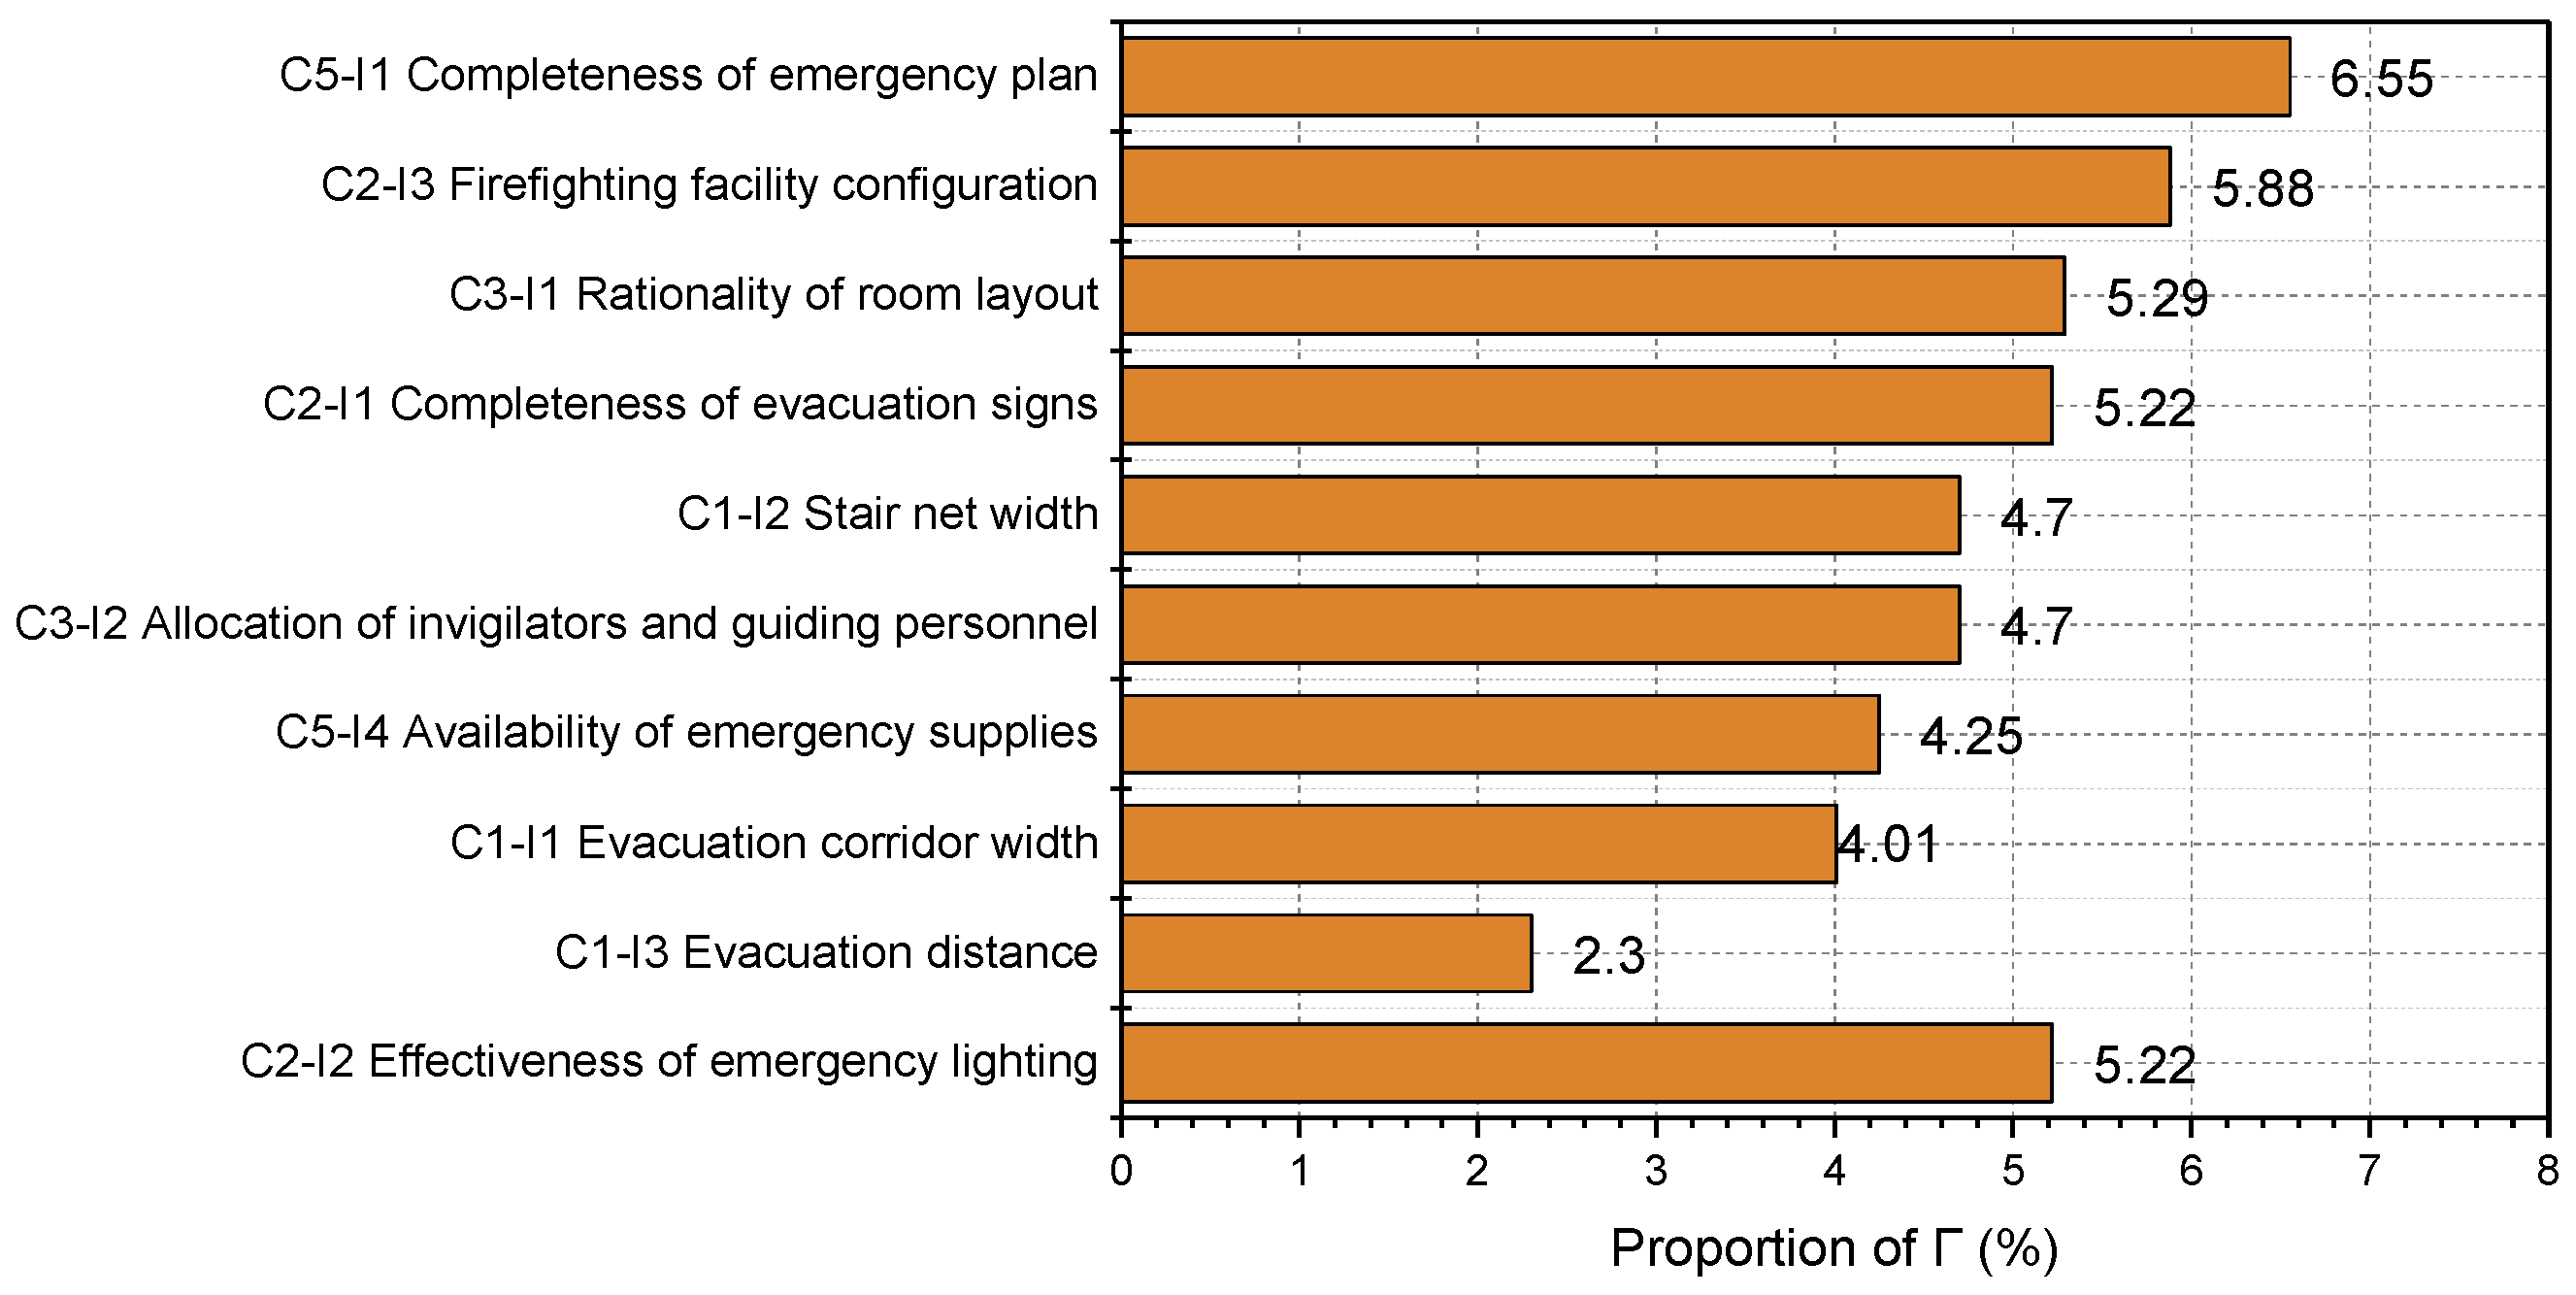
Figure 2, the top eight indicators contribute approximately 40% to the comprehensive grey relational grade, indicating that a few key factors have a significant impact on the overall evacuation safety level. Among them, the completeness of the emergency plan (C5-I1) and the provision of fire protection facilities (C2-I3) are the primary positive driving factors, contributing 6.55% and 5.88%, respectively. This suggests that the building performs well in terms of institutional safeguards and fire equipment provision, which forms the main support for its overall evacuation safety performance at the boundary between the “Moderate” and “Relatively Safe” levels. The rationality of the examination room layout (C3-I1) and the completeness of evacuation signage (C2-I1) follow closely, with contributions of 5.29% and 5.22%, respectively, indicating that effective spatial organization and visual guidance can significantly improve evacuation efficiency for candidates.
On the other hand, corridor width (C1-I1), evacuation distance (C1-I3), and emergency lighting effectiveness (C2-I2) scored relatively low, representing the main bottlenecks limiting the improvement of the safety level. For example, the standardized value of corridor width is only 0.545, with a grey relational coefficient of 0.435 and a corresponding contribution of 0.0239. In an emergency involving high-density examination rooms, this indicator could become the dominant factor for congestion risk. The standardized value of evacuation distance (C1-I3) is only 0.333, indicating that some seats are located too far from exits, and evacuation paths are uneven. The standardized value for emergency lighting effectiveness (C2-I2) is 0.396, suggesting that some emergency lights are aged or insufficiently illuminated, which may cause evacuation delays under smoke or low-light conditions. To quantify the potential effects of improvement measures, scenario simulation analyses were conducted for these key indicators. The results are presented in
Table 12. The numerical adjustments in Scenarios A, A1, A2, and B represent feasible improvement levels informed by typical campus building standards (e.g., corridor widening ranges, emergency lighting requirements) and are intended as hypothetical enhancement scenarios to illustrate the sensitivity of the GRA evaluation rather than as exact architectural design proposals.
To clarify the calculation procedure, all improvement scenarios in
Table 12 were obtained by re-evaluating the modified indicators using exactly the same GRA steps as in the baseline case. After the hypothetical adjustments, the indicator values were re-normalized using Equations (1) and (2), the deviation sequences and grey relational coefficients were recomputed according to Equations (3) and (4), and the final safety grade
Γ was derived from Equation (5). The integrated weights in
Table 10 were kept unchanged without renormalization, since the scenarios affect only indicator performance, not their relative importance. The Δ
Γ values represent the difference between each scenario’s grade and the baseline
Γ = 0.5956.
The results in
Table 12 show that targeted improvements to key bottleneck indicators yield clear and measurable enhancements in the overall evacuation safety level. With the updated baseline comprehensive grey relational grade of
Γ = 0.5956, all simulated scenarios demonstrate varying degrees of positive impact.
Scenario A, which simultaneously improves corridor width and evacuation distance, produces the most substantial enhancement with ΔΓ = +0.0159, raising the overall score to 0.6115, thereby moving the examination room notably closer to the middle range of the “Relatively Safe” category. This indicates that spatial optimization strategies—particularly widening key corridors and reducing excessive evacuation distances—have the most immediate and effective influence on evacuation performance.
Scenario A1 focuses solely on improving corridor width. The improvement of the standardized value from 0.545 to 0.80 results in ΔΓ = +0.0111, increasing the overall grade to 0.6067. This suggests that insufficient corridor width is one of the most pronounced bottlenecks in the existing configuration, and moderate architectural adjustments could effectively alleviate congestion risks during peak evacuation periods.
Scenario A2, which only optimizes evacuation distance (0.333 → 0.60), yields a smaller yet meaningful improvement of ΔΓ = +0.0049, raising Γ to 0.6005. Although the effect is less pronounced than that of corridor widening, improving evacuation distance still contributes positively to overall safety by balancing spatial accessibility and reducing path-length disparities across the examination room.
Scenario B focuses on emergency lighting enhancement, raising its standardized value from 0.396 to 0.80. This leads to ΔΓ = +0.0081, resulting in a post-improvement grade of 0.6037. The result highlights the importance of visibility assurance in crowded examination settings, where aging or insufficient emergency lighting may significantly delay reaction time during emergencies.
Overall, the scenario analysis demonstrates that both spatial optimization (corridor width, evacuation distance) and facility improvement (emergency lighting) play essential roles in improving evacuation effectiveness. The combined improvement strategy (Scenario A) offers the largest safety gain, while even single-factor enhancements can bring the safety level closer to the upper bound of the “Relatively Safe” range. These findings offer practical guidance for facility managers, suggesting that prioritizing corridor expansion, improving emergency illumination, and reducing evacuation-path disparities can significantly strengthen the evacuation safety performance of temporary examination venues.
5.5. Robustness and Sensitivity Analysis
To evaluate the robustness of the proposed GRA-based safety assessment model, a series of sensitivity tests were conducted on both the indicator weights and the weighting schemes. Specifically, three types of analyses were performed:
- (i)
independent perturbation of each indicator weight by ±10% followed by renormalization,
- (ii)
comparison of four different weighting schemes—pure AHP, pure entropy, integrated AHP–entropy, and an equal-weight vector, and
- (iii)
examination of the resulting variation in the comprehensive grey relational grade Γ.
The results show that under the ±10% perturbation of all indicator weights, the comprehensive grade Γ varies only within the narrow range of 0.613–0.627, indicating that moderate fluctuations in the weight vector do not materially affect the final evaluation. Similarly, when replacing the baseline AHP–entropy hybrid weights with pure AHP, pure entropy, or equal-weight schemes, the calculated Γ values remain within the “Relatively Safe” category.
Overall, these results confirm that the proposed GRA-based evaluation model exhibits strong robustness and stability. The safety grade assigned to the case building remains essentially unchanged under a wide range of perturbation conditions, supporting the reliability of the model’s assessment outcomes.
5.6. Discussion and Comparison with Previous Studies
The evacuation simulation and GRA results obtained for the temporary examination rooms show that corridor width, aisle layout between desks, and door flow efficiency are the dominant factors influencing total evacuation time. This pattern is consistent with findings from evacuation studies of teaching buildings and lecture halls. Li et al. (2017) reported that stair and corridor geometry has a significant effect on evacuation times in a three-storey classroom building, with simulation results closely matching drill data [
37]. Spearpoint (2011) also demonstrated that effective door width and occupant flow capacity are key determinants of total evacuation time in lecture theatre-type occupancies [
38].
From the perspective of spatial configuration, our identification of aisle and exit bottlenecks aligns with agent-based simulations of classrooms and lecture halls, which showed that exit symmetry and positioning strongly affect congestion and clearance time [
39]. Lian et al. (2023) quantified the sensitivity of evacuation performance to traffic space design parameters in teaching buildings and found that corridor width has a much stronger influence on evacuation time than staircase width [
15], which is in line with the high weight assigned to corridor- and aisle-related indicators in our GRA evaluation.
In terms of classroom layout, the influence of desk arrangement and local density on the evacuation efficiency in temporary examination rooms is comparable to the trends observed by Yaman (2025), who examined different classroom arrangements and showed that certain traditional row-and-column configurations can yield shorter evacuation times under specific conditions [
40]. At the campus scale, Gao et al.(2023) showed that optimizing evacuation routes and organizational measures in a university building complex can reduce evacuation time by 15–20% [
41], supporting the implication of our results that managerial and organizational improvements (e.g., invigilator guidance, pre-defined movement routes) can effectively enhance evacuation performance in temporary examination rooms.
Overall, these comparisons indicate that the evacuation patterns identified in this study—such as the critical role of corridor/aisle width, exit configuration, and exam-specific organizational factors—are consistent with previously reported findings for educational buildings, while extending them to the specific context of temporary examination rooms. It should be noted that this comparison is conceptual rather than quantitative, as no drill-time datasets or simulation outputs were available for numerical calibration in this study.
5.7. External Validity Check
Ideally, validation of an evacuation safety evaluation model should rely on full-scale data from real fire incidents. However, in university teaching buildings, major fire emergencies are extremely rare, and detailed incident records are generally not publicly accessible due to ethical and safety considerations. Therefore, direct validation against real-incident evacuation data is not feasible for this study. To compensate for this limitation, multiple indirect but practical sources of real-world evidence were employed to assess the external validity of the proposed model.
First, the theoretical evacuation time was calculated according to national code requirements, providing the baseline threshold for acceptable evacuation performance. Second, three full-building evacuation drills conducted in 2023–2024 in the same teaching building provided empirical measurements of the actual evacuation performance. Third, drill-based evacuation studies of comparable educational buildings reported in the literature were examined to determine consistency between empirical findings and the evaluation results of this study.
Table 13 summarizes the comparison between the theoretical evacuation time, the average measured drill evacuation time, and the performance indicator C6-I1 used in the GRA model. The empirical ratio
(1.14) falls within a similar range as the value of indicator C6-I1 used in the GRA model. Moreover, both the drill outcomes and the theoretical evacuation requirements correspond to the “Moderate–Relatively Safe” classification, consistent with the comprehensive grey relational grade (
Γ = 0.5956). This alignment across theoretical standards, real-world drill data, and empirical findings reported in the literature provides indirect but credible support for the external validity of the proposed evaluation model.
5.8. Improvement Recommendations
Based on the quantitative analysis and scenario analysis above, the following measures are recommended to further enhance the evacuation safety of teaching buildings temporarily converted into examination rooms:
Optimize evacuation corridors and spatial layout. According to Scenario A, widening main evacuation corridors to a net width of over 1.8 m and adjusting classroom layouts to limit the maximum evacuation distance to within 35 m could increase the goal-layer comprehensive grey relational grade by approximately 0.0159, raising Γ from 0.5956 to 0.6115. It is recommended to add temporary exits or enable backup safety doors at the ends of each floor corridor to shorten evacuation paths and disperse pedestrian flow.
Strengthen emergency lighting and signage maintenance. As shown in Scenario B, increasing emergency lighting effectiveness from 0.396 to 0.8 could yield an approximate improvement of ΔΓ = 0.0081, raising Γ to 0.6037. Before converting teaching buildings into examination rooms, emergency lighting brightness and battery status should be thoroughly inspected. Backup batteries, motion-sensing fixtures, and illuminated signage should be installed to ensure visibility under fire or power outage conditions.
Improve examination room organization and personnel management. Based on the weighted contribution results, the allocation of invigilators and evacuation guides (C3-I2) contributes approximately 4.70% to the overall safety grade. It is recommended to station evacuation guides at each stairwell and major corridor intersection, establish clear responsibilities for emergency evacuation, and conduct targeted training and drills before examinations.
Enhance emergency drills and update emergency plans. Although the completeness of the emergency plan (C5-I1) reaches the maximum standardized value of 1.0, regular evacuation drills are essential to maintaining long-term effectiveness. At least one on-site drill should be conducted each semester, followed by post-drill evaluations to refine the emergency plan. Repeated drills improve route familiarity and reduce pre-movement delays during real emergencies.
Control examination room occupancy and support special populations. It is recommended to maintain student density below 1.0 person/m2, provide seats near exits for candidates with mobility limitations, and assign personnel to assist them. Reducing occupancy not only lowers congestion risk but also indirectly improves performance in indicators related to evacuation distance and crowd flow.
Establish a dynamic safety assessment mechanism. Schools should implement a long-term monitoring system and periodically re-evaluate evacuation safety using the GRA-based framework. Continuous assessment supports dynamic tracking of improvement effects and enables data-driven optimization of campus safety management.
In conclusion, by prioritizing corridor widening and layout optimization, improving lighting and signage systems, and strengthening organizational drills and personnel management, the comprehensive grey relational grade of the teaching building can be raised from 0.5956 to approximately 0.61 under feasible improvement scenarios. While this does not yet reach the “Safe” level (Γ ≥ 0.8), it represents a meaningful enhancement of both static safety performance and dynamic emergency response capability, offering a quantitative foundation for evacuation safety management in temporary examination settings.
6. Conclusions
This study developed a structured GRA-based evaluation model to assess evacuation safety in university teaching buildings temporarily converted into examination rooms. The revised calculation shows that the case building achieves a comprehensive grey relational grade of Γ = 0.5956, placing it at the boundary between the “Moderate” and “Relatively Safe” levels. Fire protection facilities, emergency planning, and rational room layout provide a solid baseline of safety, while corridor width, evacuation distance, and emergency lighting remain the principal factors constraining further improvement. Scenario-based calculations indicate that targeted interventions in these areas—particularly widening key corridors, optimizing evacuation paths, and enhancing lighting—can measurably increase the overall safety grade. The improvement scenarios presented in this study illustrate the potential use of the GRA framework but do not claim universal applicability; broader validation across multiple buildings is required.
The study contributes to the literature in two ways. First, it proposes a comprehensive and quantifiable indicator system tailored to the unique behavioral and spatial characteristics of temporary examination-room evacuation, which differ substantially from typical teaching or high-rise building scenarios. Second, it demonstrates the applicability of GRA for integrating mixed qualitative–quantitative variables under conditions of incomplete information, offering a transparent and practical decision-support tool for campus safety managers. Despite these contributions, the study has limitations. Certain behavioral and organizational indicators rely on simplified scoring due to the lack of real-world incident data, and the analysis is based on a single building, which may constrain generalizability. Future research could expand the sample size, incorporate behavioral simulation outputs, or explore hybrid multi-criteria decision-making approaches to enhance evaluation precision.
Furthermore, the model could not be directly calibrated against real fire-incident data, as such records are extremely scarce in university teaching buildings and are generally not publicly accessible. Consequently, the study relied on evacuation code benchmarks and real-world drill data as indirect validation sources. In addition, because the evaluation was conducted on a single teaching building, the generalizability of the findings is limited. Future research should incorporate larger drill datasets, controlled full-scale experiments, or applications across multiple buildings with diverse spatial layouts to further strengthen external validation and assess the broader applicability of the proposed framework.
Overall, the proposed framework offers both theoretical value and managerial guidance, supporting data-informed decision-making to improve evacuation safety in temporary examination environments.