Article

Investigation of Mechanical and Fresh Properties of Ultra-High-Performance Concrete Incorporating Second-Generation Superplasticizers

1
Department of Water and Environmental Engineering, Faculty of Civil Engineering, Shahrood University of Technology, Shahrood P.O. Box 3619995161, Iran
2
Department of Civil Engineering, University of Guilan, Rasht P.O. Box 419961377, Iran
3
Department of Civil Engineering, Allameh Mohaddes Nouri University, Nour P.O. Box 4641859558, Iran
4
Arup Resilience, Security & Risk, 3 Piccadilly Pl, Manchester M1 3BN, UK
5
Department of Civil and Environmental Engineering and Construction, University of Nevada, Las Vegas, NV 89154, USA
*
Authors to whom correspondence should be addressed.
Appl. Sci. 2025, 15(9), 5133; https://doi.org/10.3390/app15095133
Submission received: 26 January 2025 / Revised: 2 May 2025 / Accepted: 3 May 2025 / Published: 5 May 2025
(This article belongs to the Special Issue Sustainable Concrete Materials and Resilient Structures)

Abstract

:
Ultra-high-performance concrete (UHPC) has been following economic and environmental trends for the past two decades. Limited research has been conducted on the significance of superplasticizers in UHPC products, despite the high costs they entail for projects. The current study assesses UHPC based on rheological properties and mechanical characteristics considering different factors. In this study, the effects of different levels of superplasticizer derived from sulfonated naphthalene formaldehyde (SNF: 0.7%, 0.8%, and 0.9%), silica fume (SF: 15%, 20%, and 25%), and the water-to-binder ratio (w/b: 0.18, 0.20, and 0.22) were examined. Fresh tests such as slump flow, Vicat needle, and squeezing, as well as hardened tests like compressive strength, flexural strength, and electrical resistivity, were conducted. In the analysis, an artificial neural network (ANN) model and a fuzzy logic (FL) model were employed to forecast compressive strength results at 7 and 28 days. The results indicated that a higher SF dosage reduced slump flow and set time, whereas the opposite was observed for SNF and the w/b ratio. Three distinct behaviors were identified in the squeezing flow test findings: (1) specific elastic behavior and low plasticity, (2) extensive plastic behavior and significant dilatancy, and (3) heightened responsiveness to compressive flow rate and material ratio. SNF demonstrated promise in enhancing compressive, flexural, and electrical strength. The prediction models suggested that the FL (error range 3.18–4.36%) and ANN (0.74–1.03%) models performed well in predicting compressive strength at 7 and 28 days. The encouraging findings from this study set the stage for further sustainable and cost-effective construction methods.

1. Introduction

Ultra-high-performance concrete (UHPC) stands out among construction materials as an extraordinary marvel that surpasses conventional constraints [1]. UHPC has key characteristics like a high particle packing density (0.825–0.855), a low water-to-binder ratio (0.15–0.25), steel fiber content exceeding 2%, and suitable chemical admixtures [2]. In this respect, UHPC has transformed the construction sector by offering attributes like outstanding strength, excellent durability, acceptable ductility, and crack resistance, enabling the construction of lighter, more flexible, and visually appealing structures [1,3]. The outstanding performance of UHPC has resulted in its use in various construction projects, ranging from bridges and high-rise buildings to architectural marvels [4,5,6]. Over the past three decades, UHPC has undergone four phases of evolution [2]: (1) laboratory-only production with vacuum mixing and heat curing (before the 1980s), (2) the use of MDF and DSP cement to reach a compressive strength of 200 to 345 MPa (in the early 1980s), (3) the addition of steel fibers to reduce the fragility of this kind of concrete (in the mid-1980s), and (4) the introduction of superplasticizers and the creation of RPC, which marked a significant advancement for UHPC (in the 1990s). The production of UHPC has shown a new trend since 2000, which includes reducing CO2 emissions and reducing initial costs.
The rheological properties of UHPC, such as viscosity and yield stress, are critical to its performance and are often evaluated using methods like the squeeze flow test. This test is particularly effective for assessing mortars under compression, with studies demonstrating strong correlations between squeeze flow and rotational rheometry results [7,8]. Because of the low water-to-binder (w/c) ratio and the high quantity of fine particles like silica fume, quartz sand, and fibers, UHPC is more viscous than normal concrete [9]. This makes the particles stickier and more resistant to flow, resulting in a stiffer and less fluid mixture [10]. The high viscosity can have negative effects on the workability, fiber distribution, and curing of UHPC, so it is essential to use appropriate additives, such as superplasticizers, to make the mixture more fluid and dispersed [11]. Superplasticizers are generally classified into four groups based on their chemical structure [12]: (1) lignosulfonates (SP), (2) sulfonated naphthalene formaldehyde condensate (SNF), (3) sulfonated melamine formaldehyde condensate (SMF), and (4) polycarboxylates (PCE). Figure 1 depicts details on the mechanism of action, chemical structure, and generation of each Superplasticizer. Beyond superplasticizers, advancements in material science—such as nano-absorbers for electromagnetic wave shielding [13,14,15] and sustainable low-carbon composites [16,17]—highlight the broader potential of tailored material design in enhancing UHPC performance.
The tests used to assess concrete’s mechanical properties can be problematic due to their time-consuming nature, high costs, and reliance on laborious, intensive work [18,19,20]. Moreover, the results might be uncertain because of varying laboratory conditions or human error [18,21]. In this regard, to more precisely assess the mechanical properties of concrete, the focus has been placed on techniques like artificial neural networks (ANNs) and fuzzy logic (FL). Various researchers have demonstrated the effectiveness of ANNs and FL in studying the mechanical properties of UHPC [22,23,24].
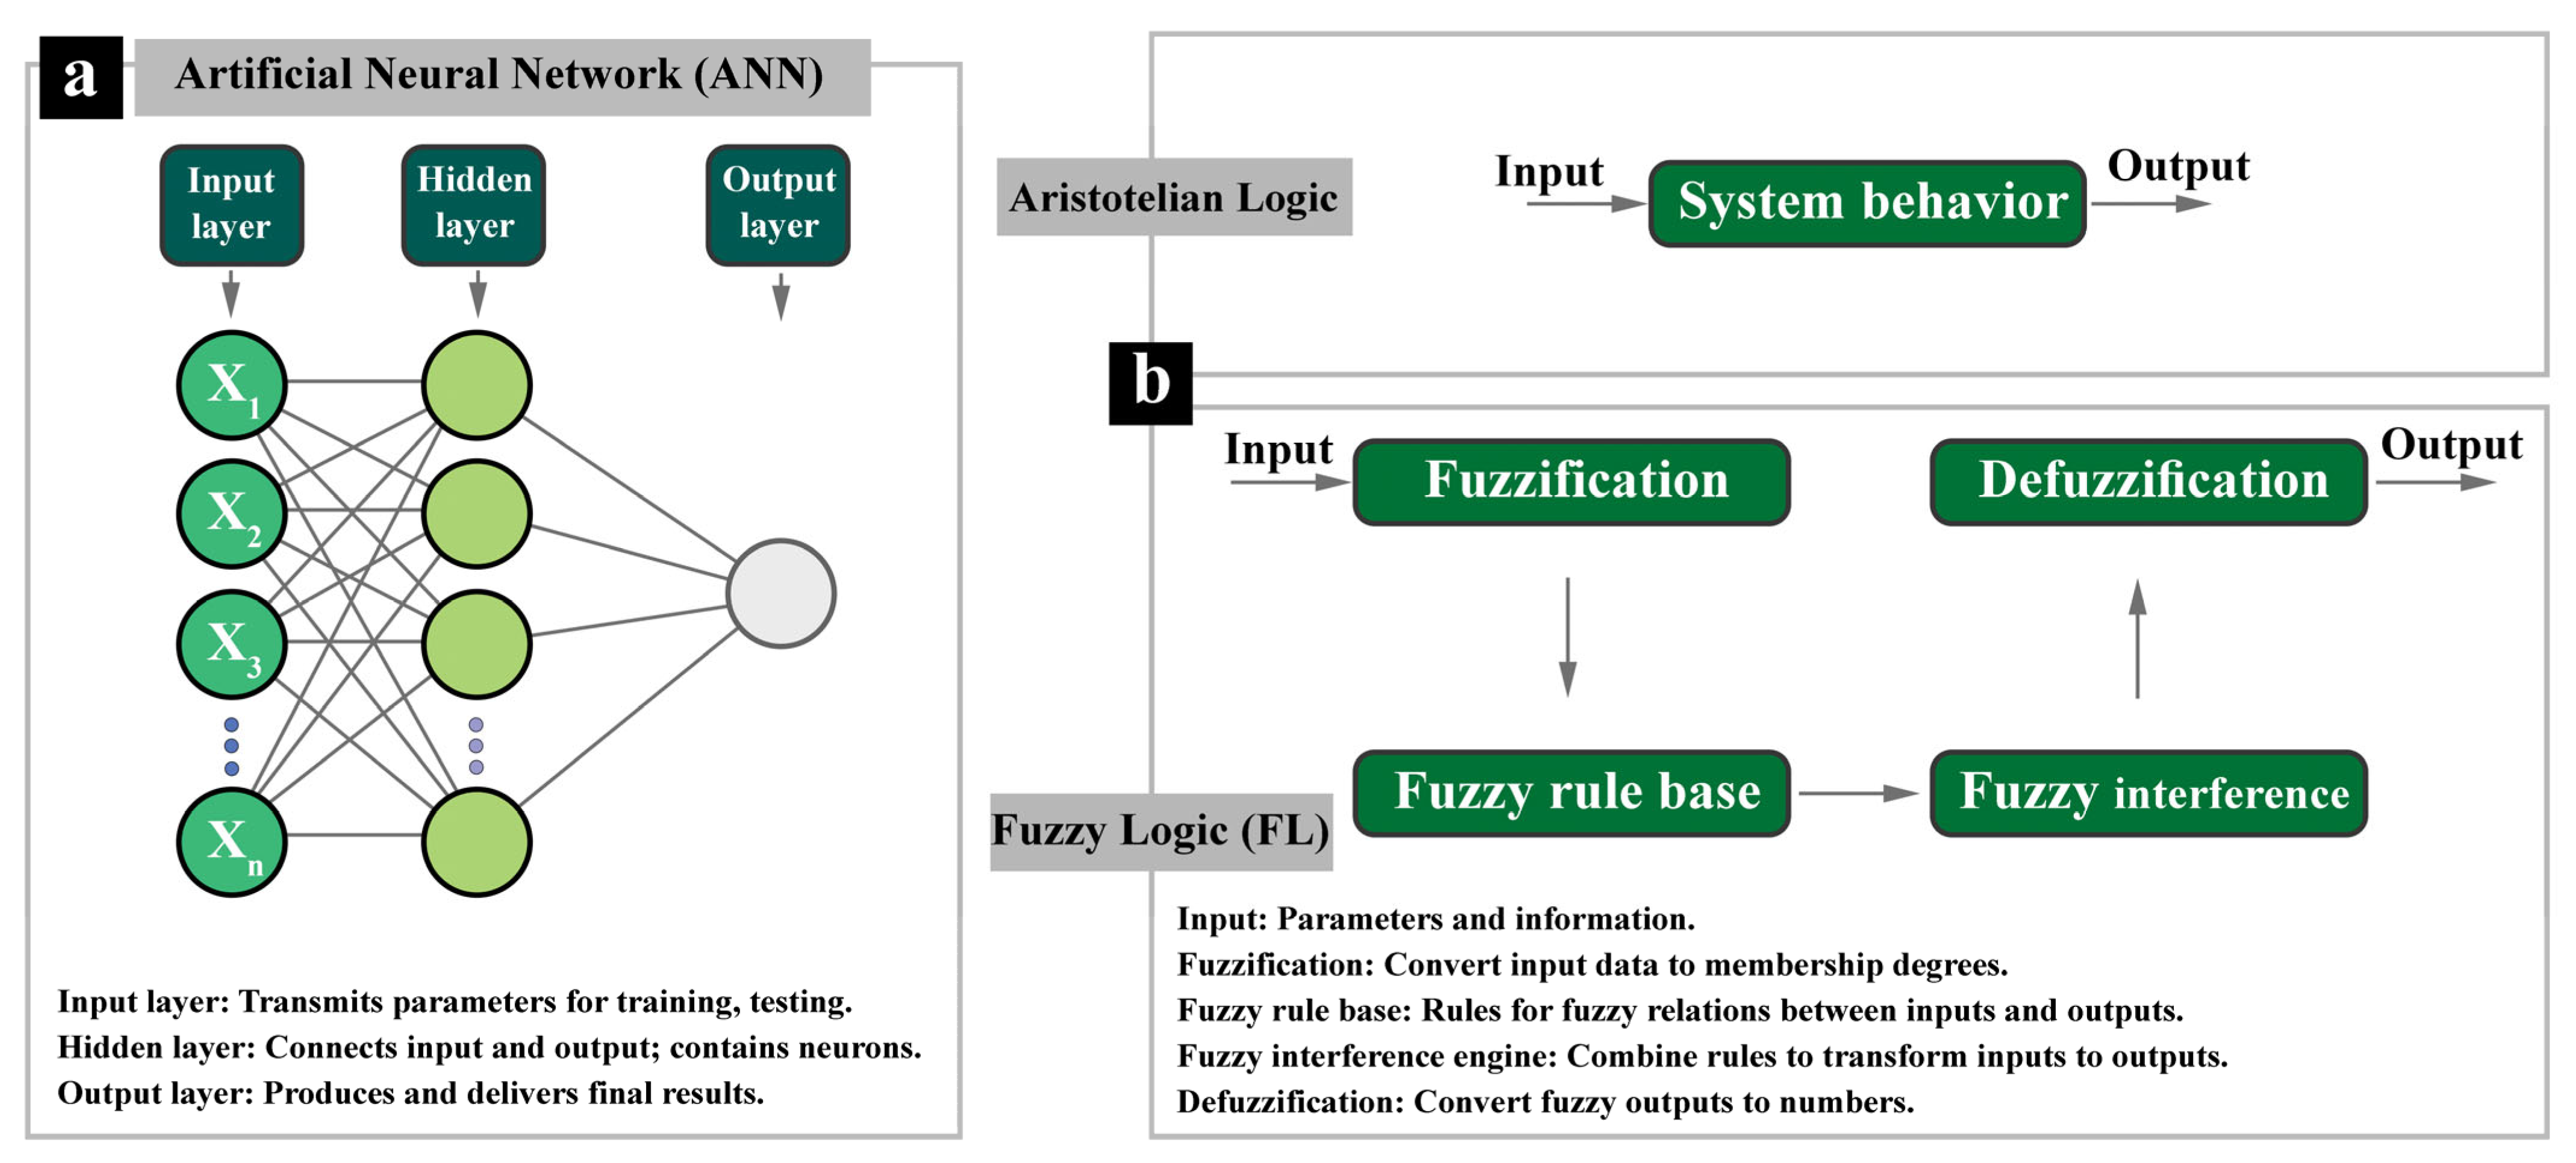
ANN, inspired by the biological nervous system, aims to process information similarly to the human brain [25,26,27,28,29]. ANN allows the modeling of nonlinear relationships between input and output [30]. The three layers of ANN are the input layer, the hidden layer, and the output layer [30]. In the ANN modeling process, determining the number of hidden layers and neurons is a crucial stage. A high number of hidden layers increases training duration, whereas a low count (insufficient) results in the model lacking resources to tackle intricate, nonlinear issues [30]. Figure 2a illustrates an ANN structure.
The concept of fuzzy sets was initially introduced by Professor Lotfi A. Zadeh [31]. In contrast to Aristotelian logic, which operates with binary values of 0 or 1, FL allows for the selection of values ranging between 0 and 1 for a given variable [32,33,34,35]. Data ambiguity, statistical variance, inadequate data, statistical inference, and limited understanding of variable relationships in a field are some of the factors that highlight the importance of fuzzy logic. Since the inception of FL, this concept has evolved and remains widely utilized across various engineering disciplines. FL effectively represents human knowledge and experience through mathematical equations, enabling the analysis of intricate real-world issues. It operates on ‘if-then’ rules to facilitate communication between input and output variables [18,36]. FL is mainly used in situations that involve uncertainty. To create fuzzy inference systems, fuzzy implication operators and a combination of fuzzy relations are used. The application of this method in predicting problems related to UHPC has been repeatedly investigated, and positive results have been obtained [22,23,37]. Figure 2b illustrates a schematic comparison between Aristotelian logic and fuzzy logic.

2. Literature Review

2.1. Literature on Superplasticizers

Researchers are currently analyzing how superplasticizers interact with various components of UHPC to address potential challenges arising from inadequate interaction. This includes studying the behavior of superplasticizers concerning cement particles, fine aggregates, and other additives. Most research on superplasticizer use in UHPC focuses on third-generation products. Second-generation products have been overshadowed by third-generation ones, leading to less attention on their potential. Lowering costs and meeting regulatory requirements with second-generation products are positive signs for incorporating UHPC as a target.
Zhang et al. [38] investigated the preferential adsorption of two superplasticizers (one containing only carboxyl groups and one containing both carboxyl and phosphate groups) on cement and silica fume. The research indicated that the carboxyl-containing PCE demonstrated higher adsorption potential on the cement surface, influencing the flow spread of the cement paste. Additionally, the carboxyl- and phosphate-containing PCE showed a higher affinity for adsorption on silica fume at lower concentrations, while at higher concentrations, it exhibited a strong adsorption capacity on both cement and silica fume. Li et al. [39] reported that the dispersing efficacy of PCE-type superplasticizers was intrinsically dependent on their chemical composition and justified the significant effect of chemical structure on the rheological properties of the pastes by an exponential correlation. They attributed the retardation effect (which affects concrete’s setting time) to two factors: PCE molecules adsorbed onto cement particles and those within the aqueous phase. It was reported that factors like the type and dosage of SP caused chemical shrinkage of paste only in the initial 24 h. Wang et al. [40] found that enhancing the water-to-binder ratio and superplasticizer dosage increased flowability in fresh cement mortar, resulting in reduced yield stress. They noted that adjusting the superplasticizer dosage had no impact on plastic viscosity. According to Teng et al. [41], combining PCE-SP with nano-clay resulted in enhanced flexural toughness (by 45%), increased flexural strength (by 30%), a slight boost in compressive strength, and decreased porosity in UHPC samples. Other studies, like Yu et al. [42] and Tuan et al. [43], also found that rheological indices increased and free water decreased when nano or micro silica was combined with a superplasticizer [44,45]. Murugesan et al. [46] evaluated the efficacy of three distinct superplasticizer variants (namely SNF, SMF, and PCE) incorporated into UHPC at dosages of 0%, 0.5%, 1%, 1.5%, and 2%. The findings indicated that the mixtures containing PCE-SP outperformed those with sulfonated superplasticizers in terms of water reduction capacity, retention of workability, and mechanical strength.

2.2. Literature on Numerical Methods

ANNs and FL have gained significant popularity as innovative and effective tools in scientific and engineering research, particularly in the analysis and prediction of concrete behavior. Ramkumar et al. [47] investigated the application of ANNs in optimizing the mix design of self-consolidating concrete (SCC). Their study focused on the properties of SCC, particularly reinforcement with fibers and the utilization of agricultural and industrial waste as partial cement replacements. The authors reported that some studies indicate a confidence level of approximately 0.9995 for ANN predictions, with significantly lower errors than linear regression. Balf et al. [48] explored the application of ANNs in conjunction with data envelopment analysis (DEA) for designing SCC mixes containing fly ash. The ANN served as a comparative model to validate the DEA approach, which estimated efficiency based on input parameters such as superplasticizers and aggregates. The study indicated that the ANN model correlated well with the experimental results, enhancing the understanding and optimization of SCC mix design. Ly et al. [49] developed a deep neural network (DNN) model to predict the compressive strength of rubber concrete. A comprehensive database was utilized, with input parameters related to binders and aggregates and compressive strength as the output. They reported that DNN outperformed other neural network architectures across various performance metrics, demonstrating superior accuracy compared to existing machine learning methods. Liu and Zhang [50] compared the performance of two ANN models in predicting explosive spalling in polypropylene fiber-reinforced concrete subjected to elevated temperatures. One model was based on concrete mix proportions, while the other was based on concrete strength. The results, obtained from training datasets of 306 and 300 tests, showed that both models achieved high prediction accuracies, with ANN1 attaining 100% accuracy and ANN2 reaching 90%, indicating the effectiveness of ANNs in assessing the risk of explosive spalling. Biswas et al. [51] developed a hybrid ANN model to predict the compressive strength of SCC, considering factors such as cement replacement and aggregate types. The ANN, optimized using the Runge–Kutta optimization algorithm, achieved high prediction accuracy (R2 = 0.933 for training and R2 = 0.9203 for testing), surpassing the performance of traditional models. Feature importance and Taylor diagram analyses further supported the effectiveness of the ANN as a predictive tool for the mechanical properties of SCC. Khan et al. [52] proposed an ANN model optimized using the Levenberg–Marquardt backpropagation algorithm to predict compressive strength in both normal and high-strength concrete. By evaluating 1637 samples with eight input variables, the study optimized the model’s architecture. K-fold cross-validation confirmed its reliability, and the statistical results were promising. The ANN demonstrated significant accuracy and efficiency, revealing that cement content and superplasticizers had a notable impact on compressive strength. Shafaie et al. [53] introduced an FL system to predict the shear bond strength of fiber-reinforced self-consolidating concrete (FRSCC). They reported high prediction accuracy, with R2 values reaching up to 0.96 depending on the applied t-norms. The study highlighted the potential of FL in guiding the precise selection of pozzolan and optimizing mechanical performance. Abbas et al. [54] presented an FL numerical model designed to predict the complete stress–strain behavior of hybrid fiber-reinforced concrete (HFRC). Using data from 27 mixes (including 18 self-made and 9 collected from the literature), the FL model exhibited strong predictive capabilities compared to existing equations. The model was particularly suitable for HFRC, with strengths ranging from 60 to 90 MPa, encompassing both metallic and non-metallic fibers. Demir [55] compared a fuzzy modeling approach with traditional methods for determining the elastic modulus of normal and high-strength concrete. The study demonstrated that the fuzzy modeling approach provides a simpler and more effective way to evaluate the elastic modulus by combining multiple parameters. Al-Swaidani et al. [18] employed both ANNs and FL to predict the efficiency factor (EF) and durability indicator (DI) of nano natural pozzolana (NNP) as a cement replacement. Key input variables included the curing time, NNP content, particle size, water/binder (w/b) ratio, and superplasticizer dosage. They concluded that the ANN model exhibited higher accuracy than FL. For EF prediction via ANN, they achieved R2 and mean absolute percentage error (MAPE) values of 0.992 and 18.5, respectively, outperforming both FL and multiple linear regression (MLR). The application of ANN and FL methods has shown great promise in improving our understanding of concrete and driving significant performance gains. These techniques offer the potential for substantial time and cost savings, as well as a reduced environmental impact.

3. Significance of the Investigation

In recent years, being economically and environmentally friendly has become one of the key requirements for UHPC. Hence, this study aimed to explore UHPC based on the following aspects:
  • Economic aspect
    Superplasticizer is a crucial material in the production of UHPC. However, its high cost in large projects has led to a search for more economically efficient approaches. Research has primarily focused on evaluating third-generation superplasticizers, while the potential of second-generation superplasticizers for UHPC has been largely overlooked, with limited studies conducted.
    The results of ANN and FL models were compared with the results of experimental tests (which are costly and time-consuming)
  • Environmental aspect
    Various percentages (15%, 20%, and 25%) of silica fume were studied as a partial substitute for cement.
  • Industrial application
    The key practical aspect of this study was the construction workshop for prefabricated parts production. To efficiently create parts in the workshop, quick molding and removal from the mold are essential. Speed (enhancing construction pace) and cost reduction are crucial in such workshops. The second-generation superplasticizer (naphthalene-based) holds promise, with a shorter processing time and lower cost than the third-generation alternative (polycarboxylate-based), offering potential time and cost savings.
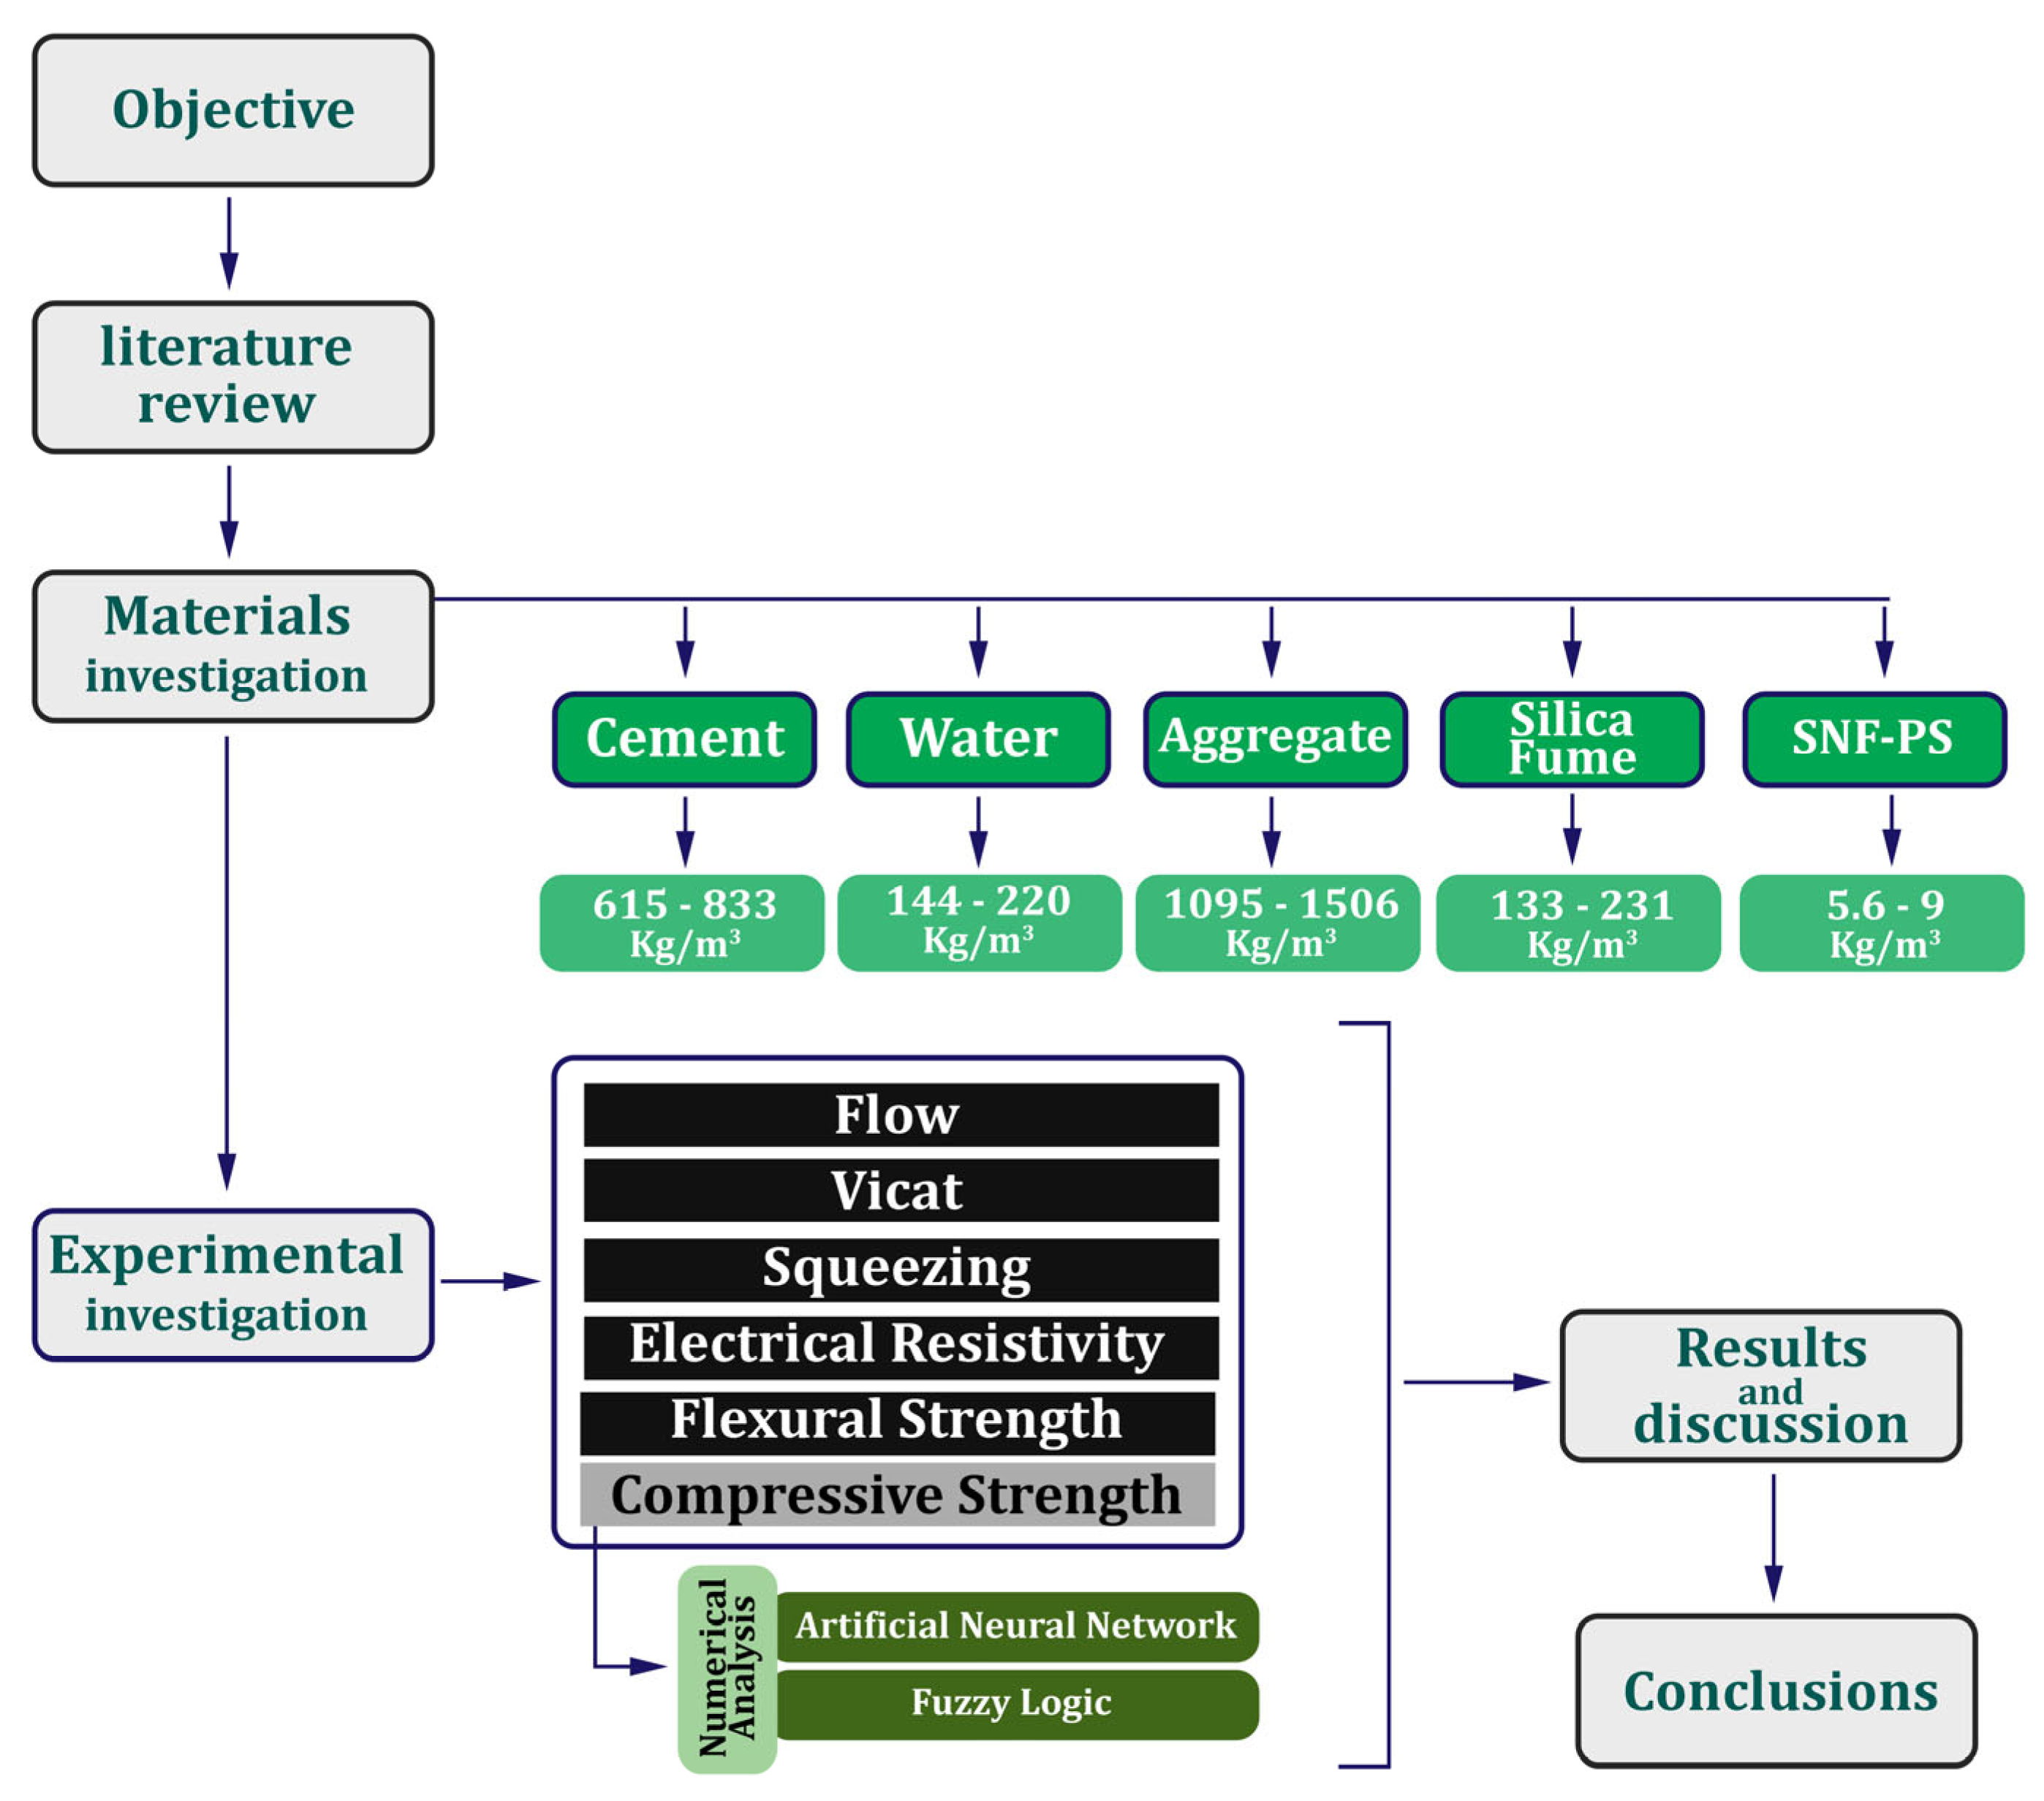
Figure 3 delineates the methodological framework employed in the present study.

4. Materials and Test Methods

4.1. Materials

The constituents utilized in this investigation comprised (1) cement, (2) aggregates, (3) water, (4) superplasticizer, and (5) silica fume. Type II cement, sourced from the Hegmatan Cement Factory (Hamadan, Iran) and conforming to the ASTM C150 [56] standard, was utilized. The properties of the employed cement are delineated in Table 1. The silica fume (SF) was produced by the Ferroalloys Company (Tehran, Iran) according to the ASTM C1240 [57] standard. The specifications of the SF are presented in Table 2. River sand, which was sieved through #30 mesh (finer than 600 microns) in compliance with ASTM C778 [58], was utilized in the fabrication of the designated concrete. Table 3 delineates the characteristics of the sand employed. The superplasticizer, denoted as M200R and manufactured by Shimisakhteman Company (Tehran, Iran), conformed to the ASTM C494 [59] standard. The properties of the superplasticizer are listed in Table 4.

4.2. Mix Designs

The UHPC mix designs employed in this study are presented in Table 5. To fulfill the research objectives, the mix designs were categorized into two distinct groups, labeled A and B. Group A’s focus was directed toward determining the optimal proportion of silica fume (SF), while group B’s mixtures were analyzed to ascertain the influences of superplasticizer (SNF) and the water-to-binder (w/b) ratio. For SF, three varying ratios—20%, 25%, and 30% (relative to the weight of cement)—were examined. Concurrently, SNF-SP was incorporated at 0.7%, 0.8%, and 0.9% (in terms of binder weight). Furthermore, the w/b ratio was strategically varied at 0.18, 0.2, and 0.22 to evaluate its impact.
The mix designs in this table are classified into three series—series 1, 2, and 3—which present total binder contents of 800, 900, and 1000 kg/m3, respectively.

4.3. Test Methods

This study employed various tests to evaluate the properties of the fresh and hardened UHPC mixtures. Details regarding the specific tests conducted are presented in Table 6.
  • The flowability of the fresh concrete was measured using a standard flow table (ASTM C230 [60]) in accordance with the ASTM C1437 [61] standard.
  • The setting time was determined using the Vicat needle test (ASTM C191 [62]). The test procedure involved pouring the concrete mix into a mold and smoothing the surface. The Vicat needle was then introduced into the sample at predetermined intervals (starting at 30 min after mixing) to measure the depth of penetration. The initial setting time was recorded when the penetration depth fell below 25 mm, and the test continued until the needle penetration reached zero, indicating the final setting.
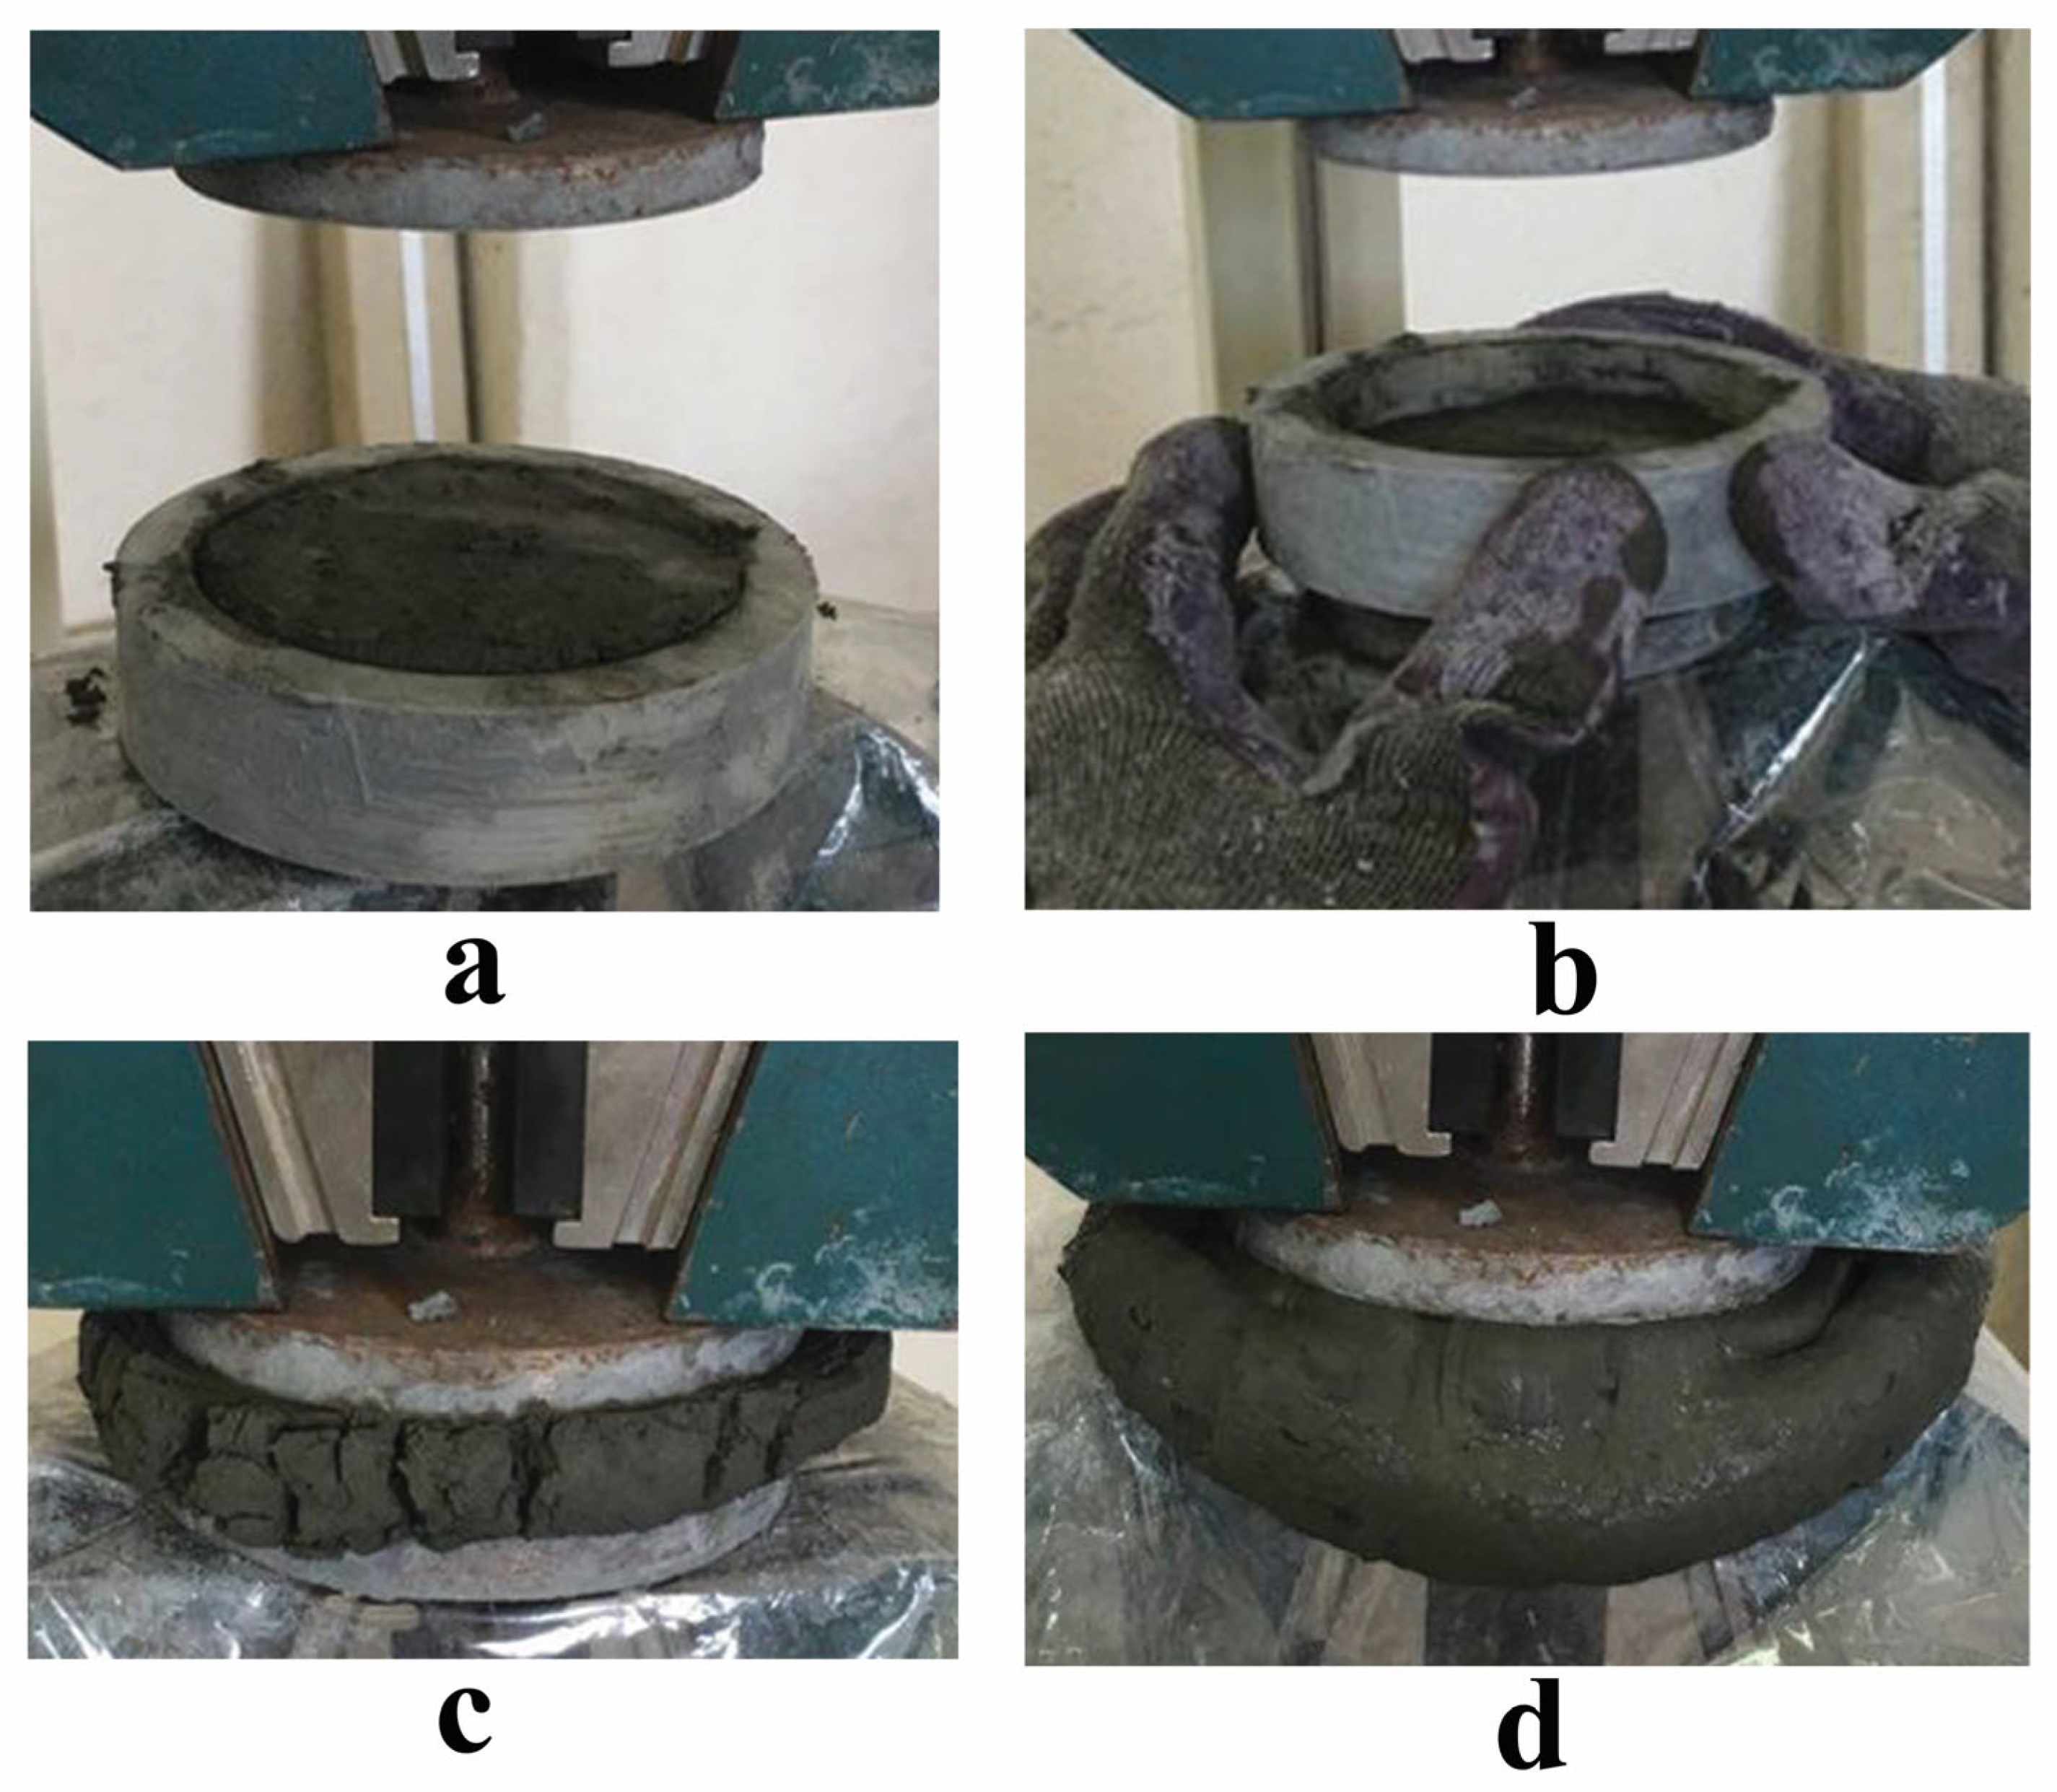
  • The squeezing test, adapted from the work of Cardoso et al. [63], was employed to characterize the basic rheological properties of the fresh concrete. This test utilized a universal testing machine equipped with two grooved steel disks (diameter: 6 cm) positioned 21.5 cm apart within the clamps. An excess amount of concrete mix was placed between the disks, ensuring a uniform distribution. Excess material around the disks was removed with a spatula. Subsequently, the concrete was subjected to constant loading rates of 30 mm/min and 3000 mm/min, and the resulting load–displacement curve was recorded. A visual representation of the squeezing test setup is presented in Figure 4.
  • Dry unit weight and water absorption were determined in accordance with ASTM C642 [64] on three specimens from each mixture.
  • Electrical resistivity was measured at 28 days using the AASHTO TP119 [65] procedure on three samples per mix.
  • Compressive strength was assessed at 7 and 28 days on 5 cm × 5 cm × 5 cm cube specimens following ASTM C109 [66].
  • Flexural strength was determined at 28 days on 4 cm × 4 cm × 16 cm prism specimens, as per ASTM C348 [67].
Table 6. Details of tests.
Hardened TestFresh Test
TestStandardCuringTestStandard
Compressive strengthASTM C109 [66]7, 28FlowASTM C1437 [61]
Electrical ResistivityAASHTO TP119 [65]28Vicat (Setting Time)ASTM C191 [62]
Dry Unit WeightASTM C642 [64]28SqueezingCardoso et al. [63]
Water AbsorptionASTM C642 [64]28CubePrism
Flexural strengthASTM C348 [67]28Applsci 15 05133 i001Applsci 15 05133 i002

5. Prediction Models

5.1. Artificial Neural Network (ANN)

Artificial neural networks (ANNs) are computational models inspired by the structure and function of biological neural networks. ANNs excel at modeling non-linear relationships between inputs and outputs, making them a valuable tool for predicting complex phenomena in concrete material science. In this study, an artificial neural network featuring a forward multi-layered perceptron structure was utilized. The backpropagation training algorithm employed the Levenberg–Marquardt (LM) algorithm optimization method, along with the scaled conjugate gradient (SCG) algorithm. The LM algorithm partitioned input and output vectors into training, validation, and test datasets. The SCG algorithm, by eliminating the need for second derivative calculations, ensured convergence to the quadratic function minimum, thus bypassing the time-intensive linear search process. The study’s input variables included cement, silica fume, water, and naphthalene-based superplasticizer. Table 7 presents a report on the characteristics of these input and output variables.
To determine the optimal number of layers and neurons in the hidden layer of an artificial neural network, the learning and error method was utilized. The stop criterion for network training was selected as the mean squared error (MSE) (Equation (1)), representing the mean squared difference between the model’s predicted value (network output) and the actual target value.
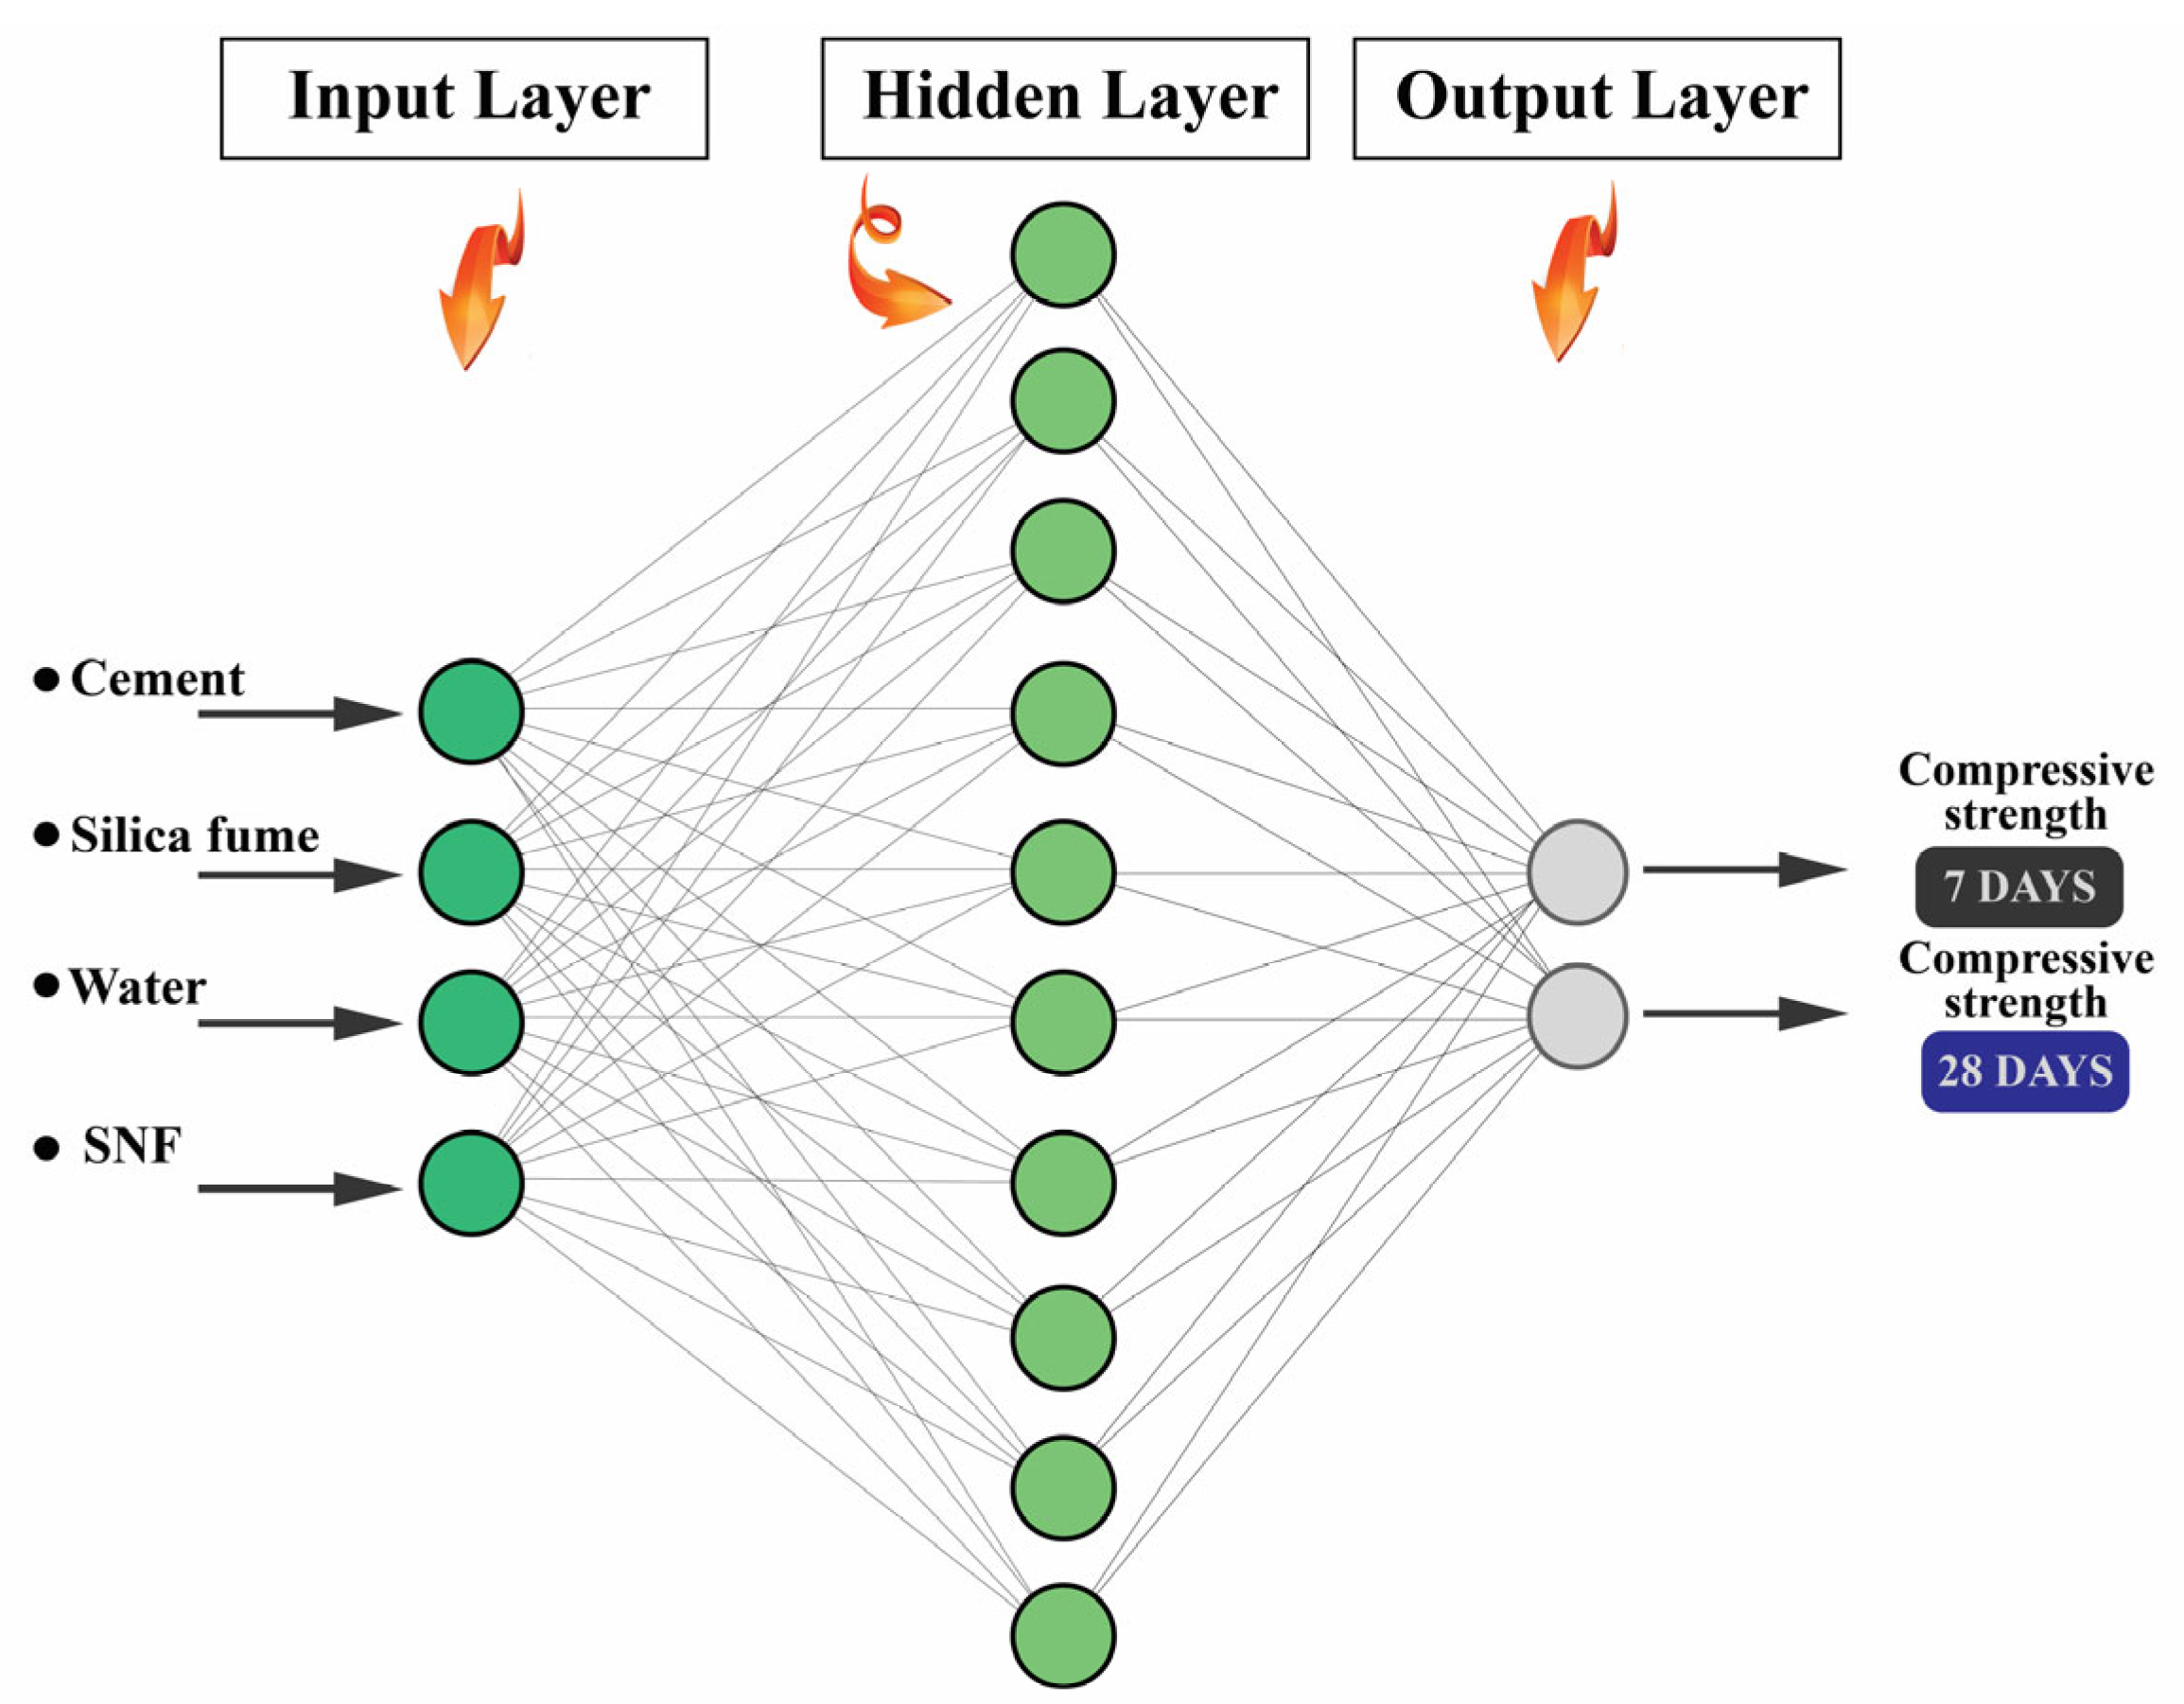
The R2 value indicates the extent and strength of the relationship and dependency between the network’s output value and the target, always ranging between 1 and −1 (Equation (2)). The closer the value is to 1, the stronger the relationship between the network’s output and the target value. In this study, 10 neurons were chosen in the hidden layer to forecast the compressive strength at 7 and 28 days. Thus, the neural network’s configuration in this study is 4–10–2: 4 inputs, 10 neurons in the hidden layer, and 2 outputs. Figure 5 depicts the overall architecture of the artificial neural network modeled in this study.
M S E = j = 0 P i = 0 N d i j y i j 2 N × P ,
R 2 = 1 i = 1 N y i y ^ i 2 i = 1 N y i y ¯ i 2 ,
In Equations (1) and (2), the parameters are defined as follows: MSE (mean squared error) measures the average squared difference between the predicted values (yᵢⱼ) and the actual observed values (dᵢⱼ) across all samples, where N represents the total number of samples and P denotes the number of predictors or observations per sample. On the other hand, R2 (coefficient of determination) evaluates the proportion of variance in the dependent variable (yᵢ) that is predictable from the independent variables. In the numerator, ∑(yᵢŷᵢ)2 captures the sum of squared residuals, while the denominator ∑(yᵢȳᵢ)2 accounts for the total variance, with ŷᵢ representing predicted values and ȳᵢ denoting the mean of observed values. Higher R2 values indicate better model performance, while lower MSE corresponds to smaller prediction errors. Also, The R values indicate the extent and strength of the relationship and dependency between the network’s output value and the target, always ranging between 1 and −1 (Equation (2)). The closer the value is to 1, the stronger the relationship between the network’s output and the target value.

5.2. Fuzzy Logic (FL)

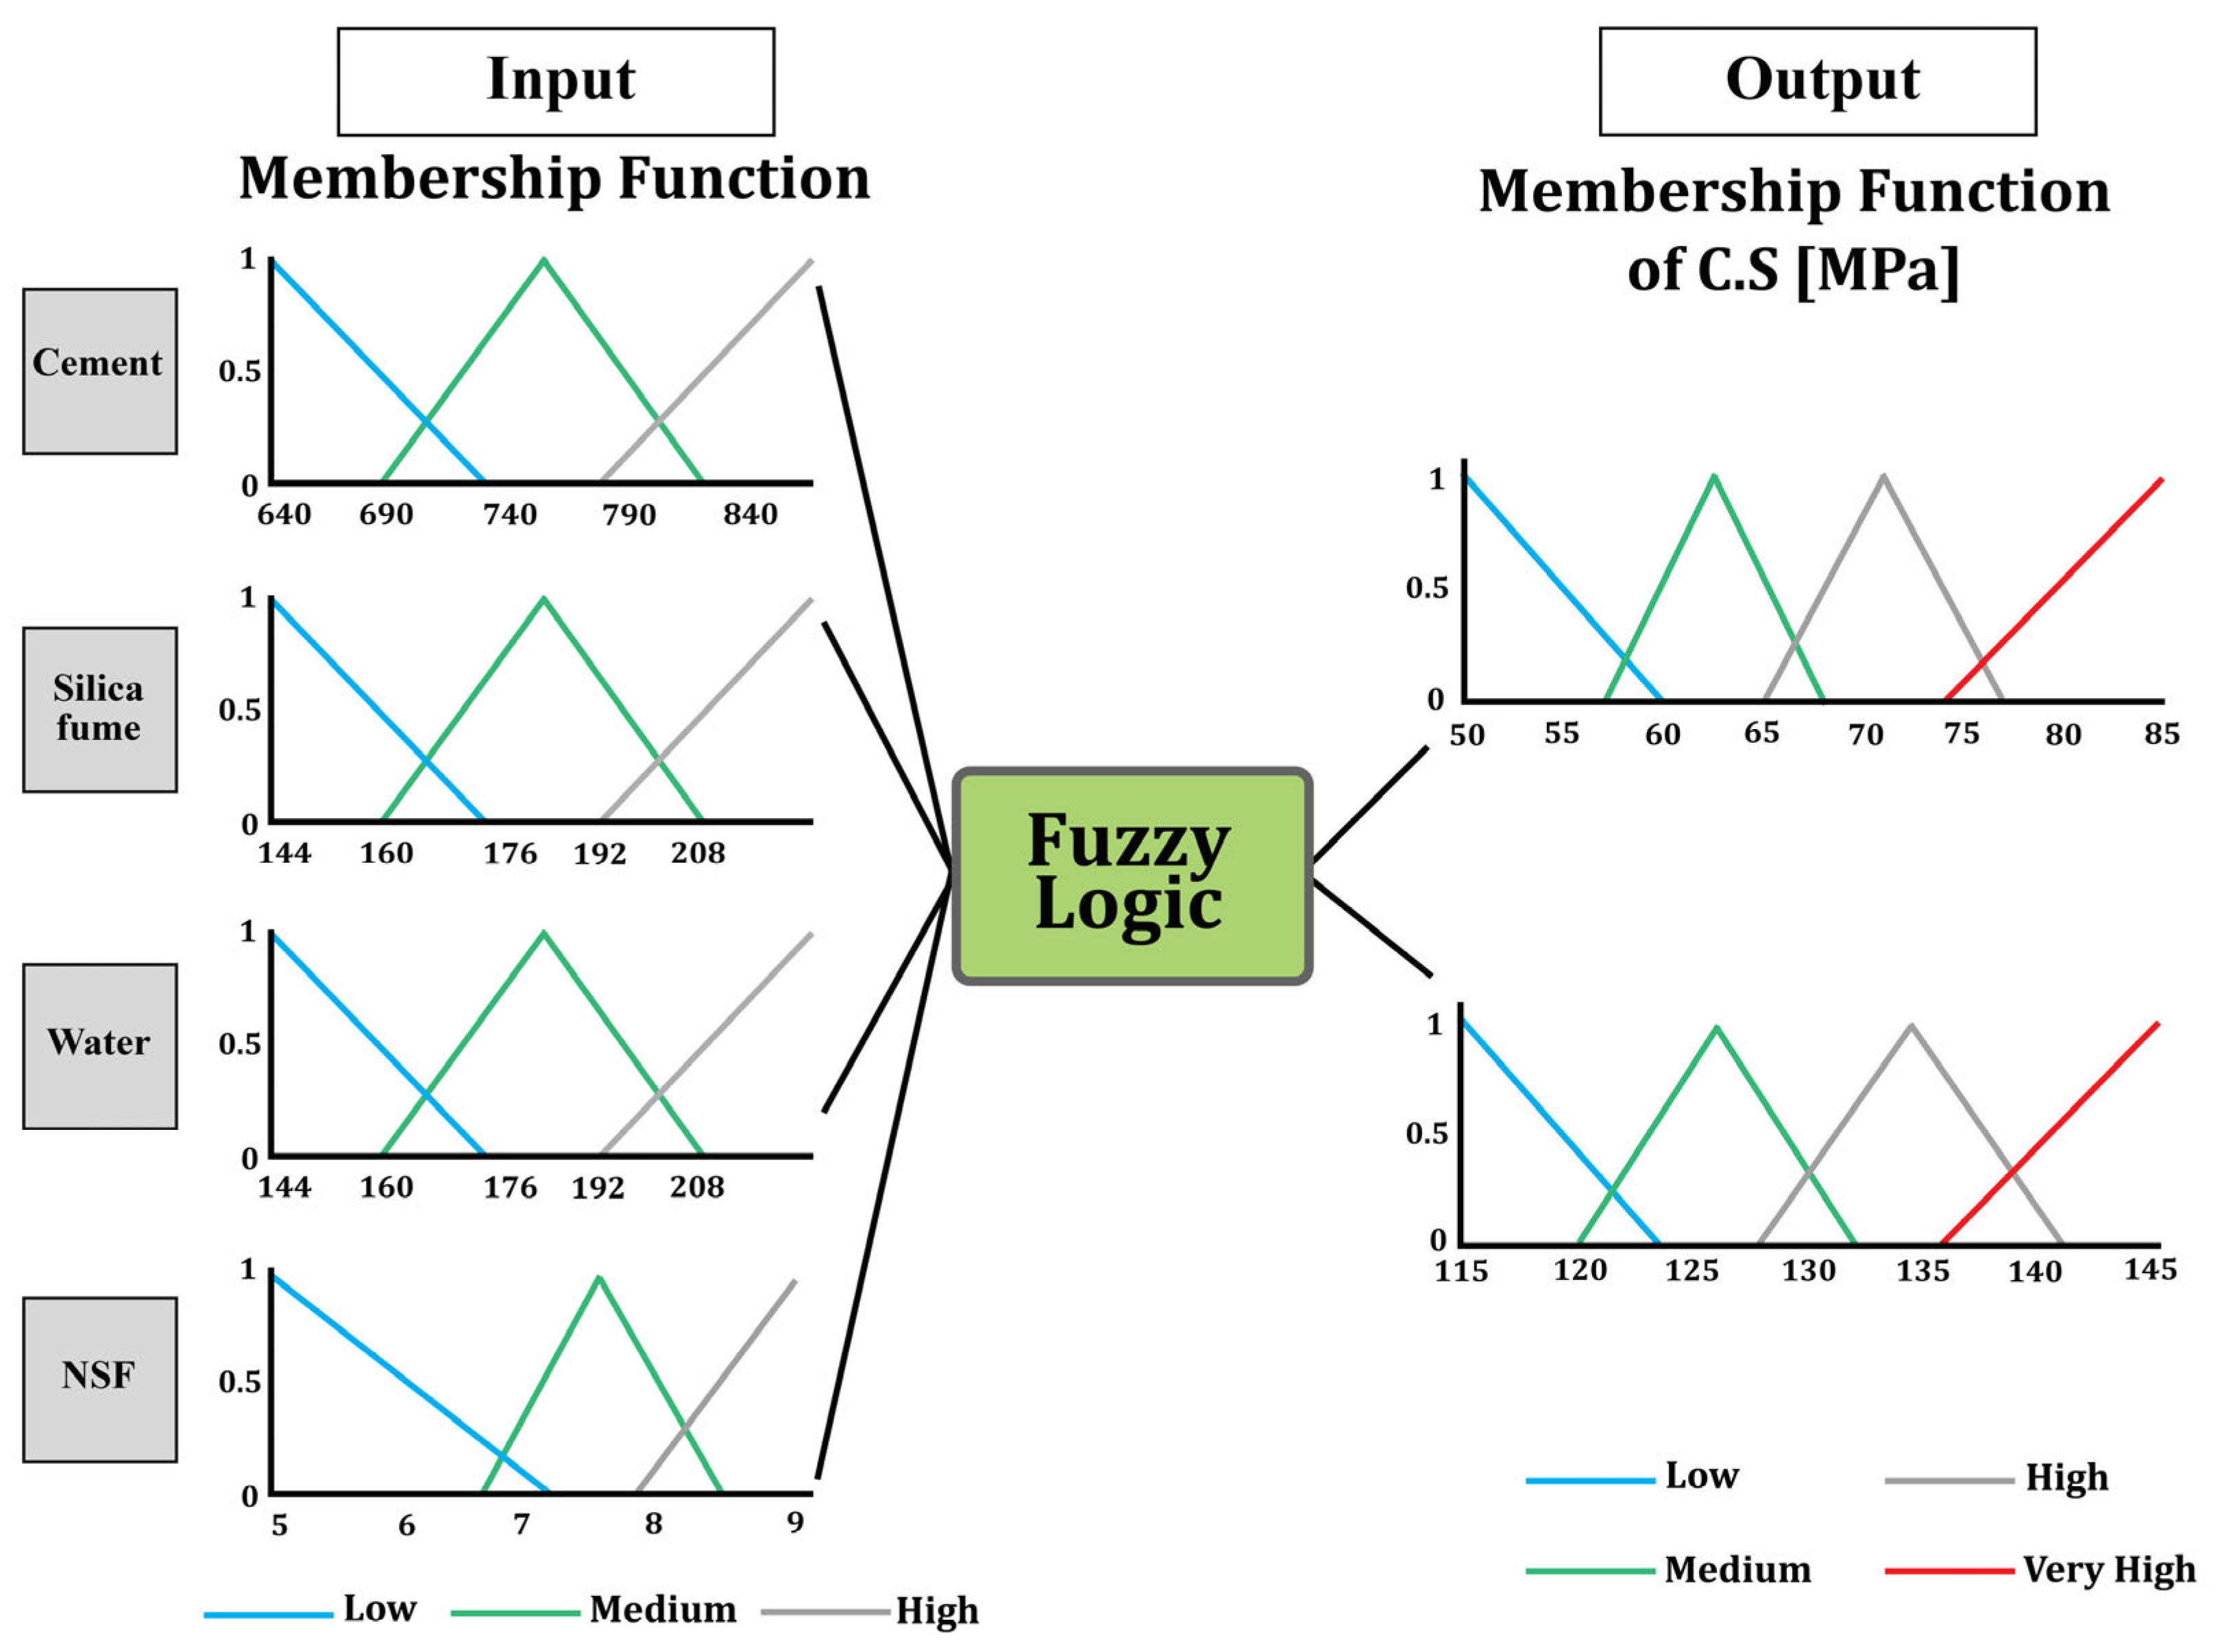
Fuzzy logic (FL), as introduced in Section 2, provides a framework for reasoning with imprecise or uncertain information. Unlike traditional Boolean logic, FL allows for degrees of membership, enabling the representation of linguistic variables and the creation of rule-based systems that mimic human decision-making. In this study, we leveraged FL to predict the compressive strength of UHPC based on the mix design parameters. The FL model used four input variables to predict the compressive strength values (7 and 28 days) from experimental tests. Developed with the FL toolbox in MATLAB vR2024a, it utilized a rule-based if-then form for prediction. Since there are no mathematical equations in the FL model, the rule based on the elements expressed in the if-then form was used for prediction. Mamdani’s inference system uses fuzzy sets as the result of the law, and the output of each law is nonlinear and fuzzy. The inputs for the system are categorized into four distinct groups: cement, silica fume, water, and NSF. These inputs were fuzzified into four gradations: low (L), medium (M), high (H), and very high (VH). The outputs are divided into two groups: 7-day compressive strength and 28-day compressive strength. Table 8 shows the details of the inputs and outputs of the FL model. Triangular membership functions, chosen for their simplicity, were constructed based on experience. The triangular shape can be considered the easiest shape to implement compared to others [22]. Figure 6 shows a schematic view of the FL model for this study.

6. Results and Discussion

6.1. Fresh Tests

6.1.1. Slump Flow Test

Figure 7 shows the results of the slump flow test. The slump flow test indicated acceptable filling ability; the higher the slump flow, the greater the concrete’s ability to fill the mold. Examining the mixtures of group A shows that the increase in SF substitution caused a decrease in slump flow. A decrease in workability with an increase in SF content has also been reported in other studies [68,69]. In series 1 mixtures, increasing SF from 15% to 20% caused a decrease in slump flow by almost 3%, and increasing SF to 25% resulted in a reduction of about 6%. Examining the mixtures of series 2 also shows a 2.92% and 5% decrease in slump flow when SF was increased to 20% and 25%, respectively. The series 3 mixtures also experienced 3.32% and 5.62% reductions in slump flow when SF was increased to 20% and 25%, respectively. SF, an exceptionally fine material (approximately 100 times smaller than cement particles) [70,71], effectively fills the voids between cement grains and larger aggregates when its dosage is increased. This phenomenon enhances the packing density of the concrete mix [70]. While this improvement translates to increased strength and durability, it can also lead to a stiffer mix. Furthermore, SF undergoes a chemical reaction with calcium hydroxide within the concrete matrix, resulting in the formation of additional calcium silicate hydrate gel (C-S-H). This reaction consumes free water in the mixture, potentially leading to a further reduction in slump flow [72,73,74,75].
Increasing the w/b ratio from 0.18 to 0.22 increased the slump flow. In this regard, the comparison of the SF15WB18N08 and SF15WB22N08 mixtures showed that in the mixtures of series 1, an increase in slump flow of about 11.9% was recorded; in the mixtures of series 2, an increase of about 13% was recorded; and in the mixtures of series 3, an increase of about 9.4% was recorded. The presence of water in a mixture acts to diminish interparticle friction, facilitating enhanced particle mobility [76]. This phenomenon translates to a reduction in cohesiveness and an increase in fluidity, consequently resulting in a higher slump flow value [76].
Increasing SNF from 0.7 to 0.9 increased the slump flow. Therefore, slump flow was increased by 10.9%, 8.9%, and 8.6%, respectively, in the mixtures of series 1, 2, and 3 due to the increase in SNF. Superplasticizers, a class of surface-active agents, are proficient at dispersing cement particles. Their mechanism of action is twofold. First, due to their inherent electrostatic charge, superplasticizers adsorb onto the surface of cement particles, inducing electrostatic repulsion that hinders particle agglomeration [76,77,78]. Second, superplasticizers effectively reduce the surface tension of the water layer naturally surrounding cement particles. This phenomenon facilitates enhanced particle mobility by minimizing resistance to interparticle movement [76,77,78].
The main trends observed in the slump flow results indicate that increasing silica fume (SF) content reduces workability across all mix series, with greater SF levels (20–25%) leading to up to a 5–6% reduction in slump flow. Conversely, increasing the water-to-binder ratio from 0.18 to 0.22 improved slump flow by up to 13%. Additionally, increasing the superplasticizer dosage (SNF from 0.7% to 0.9%) led to an 8–11% rise in slump flow.

6.1.2. Vicat Needle Test (Setting Time)

As illustrated in Figure 8, increasing the dosage of SF from 15% to 20% led to a corresponding decrease in setting time. This effect was quantified by reductions of 4.5% and 19% in the initial and final setting times, respectively. Furthermore, increasing the SF dosage from 15% to 25% resulted in a more pronounced reduction in setting time, ranging from 13% to 33%. This phenomenon can be attributed to the acceleration of the hydration process caused by the presence of SF due to its fineness, chemical reactivity, and ability to enhance microstructural densification, all of which contribute to the faster setting of UHPC.
An increase in the w/b ratio from 0.18 to 0.22 demonstrably extended the setting times, as observed in the increased initial set time by 38% and final set time by more than 90% (Figure 8). This phenomenon can be attributed to the dilution effect of a higher water content. As the w/b ratio increases, the concentration of cement particles within the mix is reduced. This translates into a decrease in the probability of contact between particles, consequently slowing down the hydration reactions essential for setting. The hydration process is a chemical reaction between water and cement that forms the binding compounds responsible for concrete hardening. When the water content surpasses the binder content (including cement and supplementary cementitious materials like silica fume), the cement particles become more dispersed, hindering their interaction and subsequent hydration [79,80,81].
As observed, increasing the SNF dosage from 0.7% to 0.9% resulted in corresponding extensions of setting time, with increases of 52% and 74% in the initial set time and final set time, respectively (Figure 8). This phenomenon can be ascribed to the multifaceted interplay between chemical and physical processes induced by the incorporation of superplasticizers within the concrete matrix. Expounding further, a higher dosage of superplasticizer promotes superior dispersion of cement particles, thereby enhancing the workability of the mix. However, this improved workability comes at the expense of a modified hydration process, ultimately leading to a prolonged setting time for the concrete [82]. Superplasticizers, particularly second-generation types like SNF, alter the hydration process by dispersing cement particles and delaying their interaction with water. This dispersion reduces the rate at which hydration products form, slowing the buildup of the initial structure needed for setting. Additionally, by improving workability without adding extra water, superplasticizers reduce early particle clustering, which further delays the formation of calcium silicate hydrate (C-S-H) gel, resulting in an extended setting time [83,84].
In contrast, increasing silica fume (SF) content significantly reduced both initial and final setting times. Raising the water-to-binder ratio (w/b) from 0.18 to 0.22 prolonged the setting time markedly by up to 90% for final setting. Additionally, higher superplasticizer (SNF) dosage also led to longer setting times, by up to 74%.

6.1.3. Squeezing Flow Test

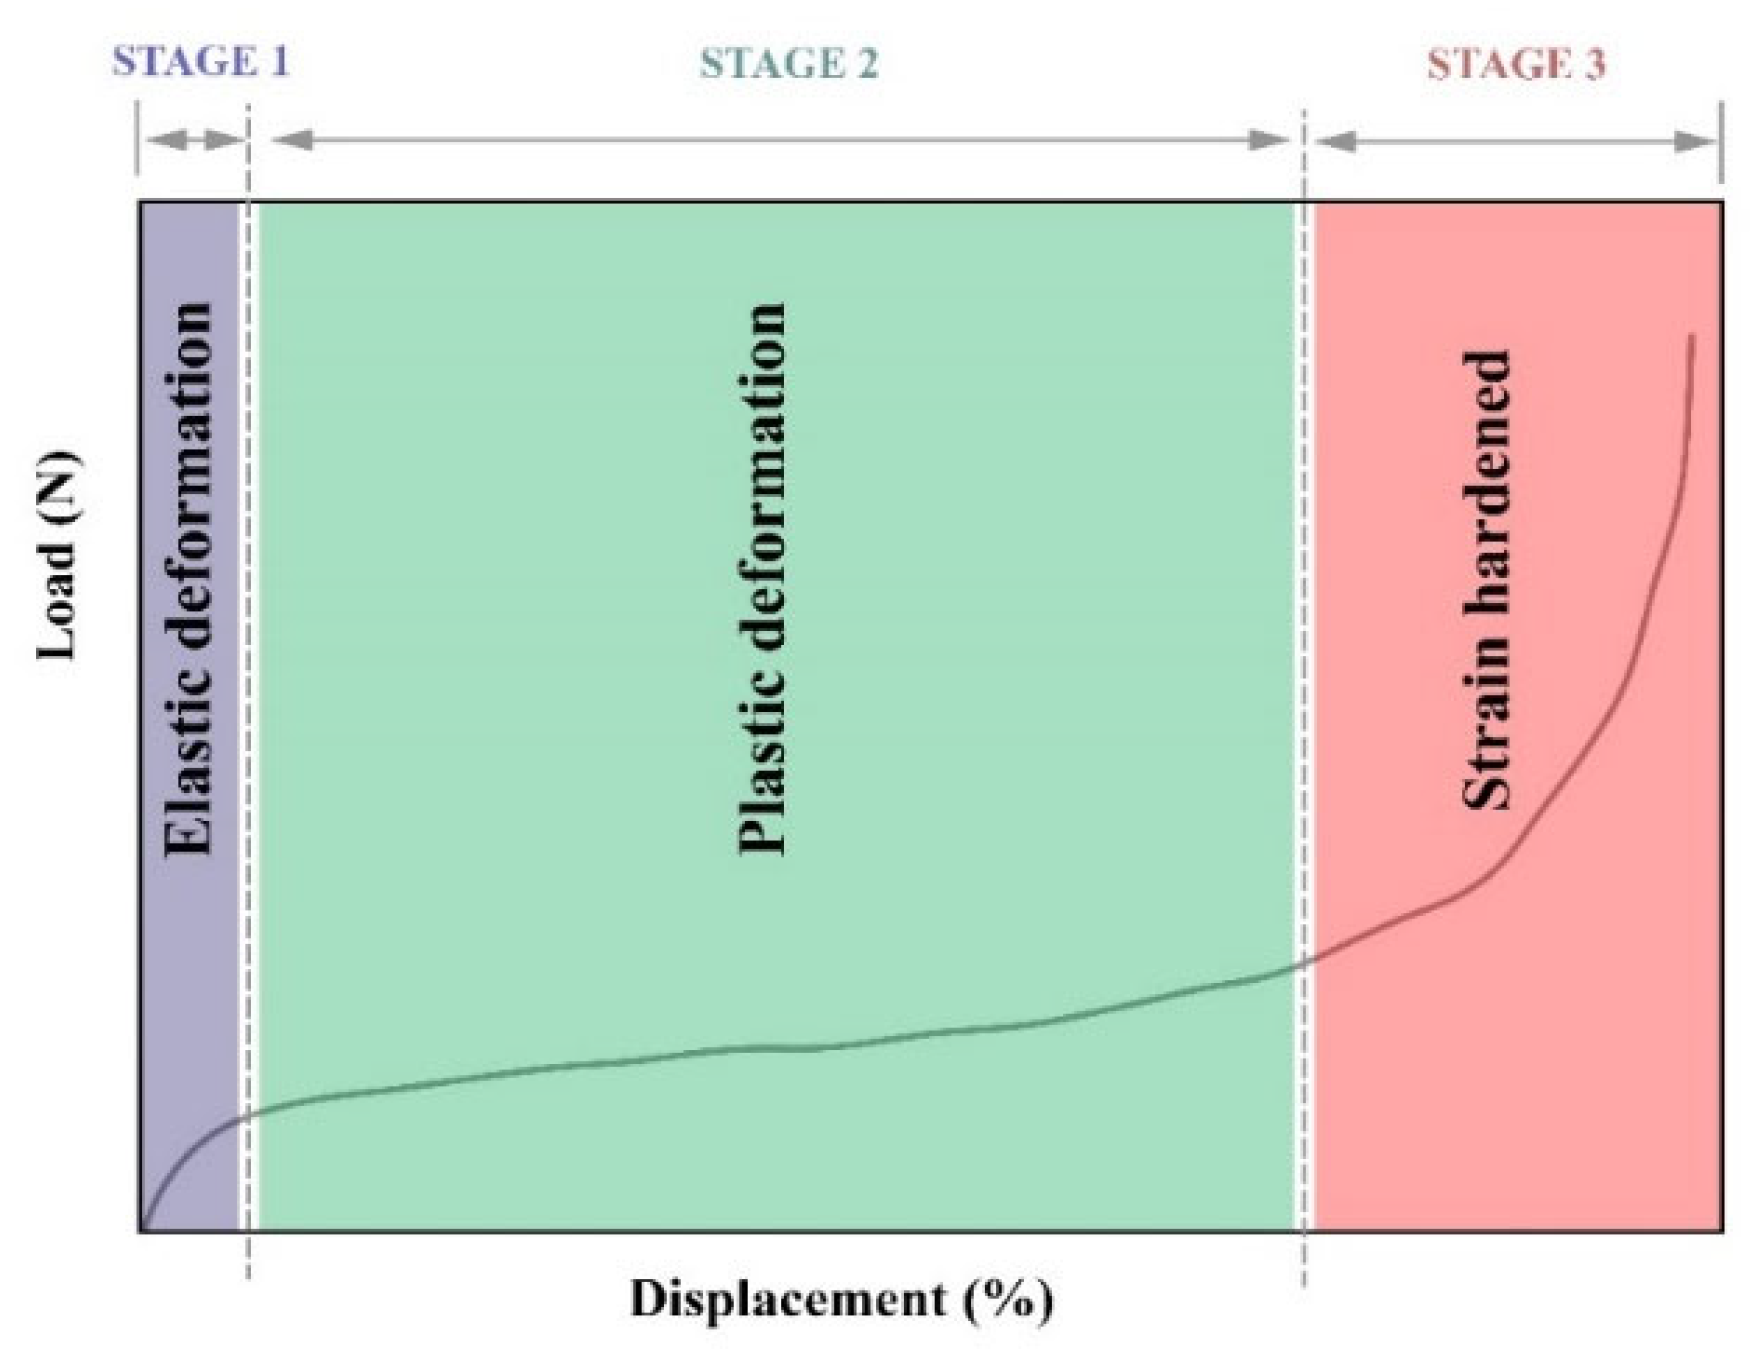
According to prior research [63,85], the load–displacement curve schematic from the squeezing test comprises three stages, as depicted in Figure 9. Consequently, the assessment of various pastes in this study was conducted based on these three stages.

Examining the Effect of w/b and SF

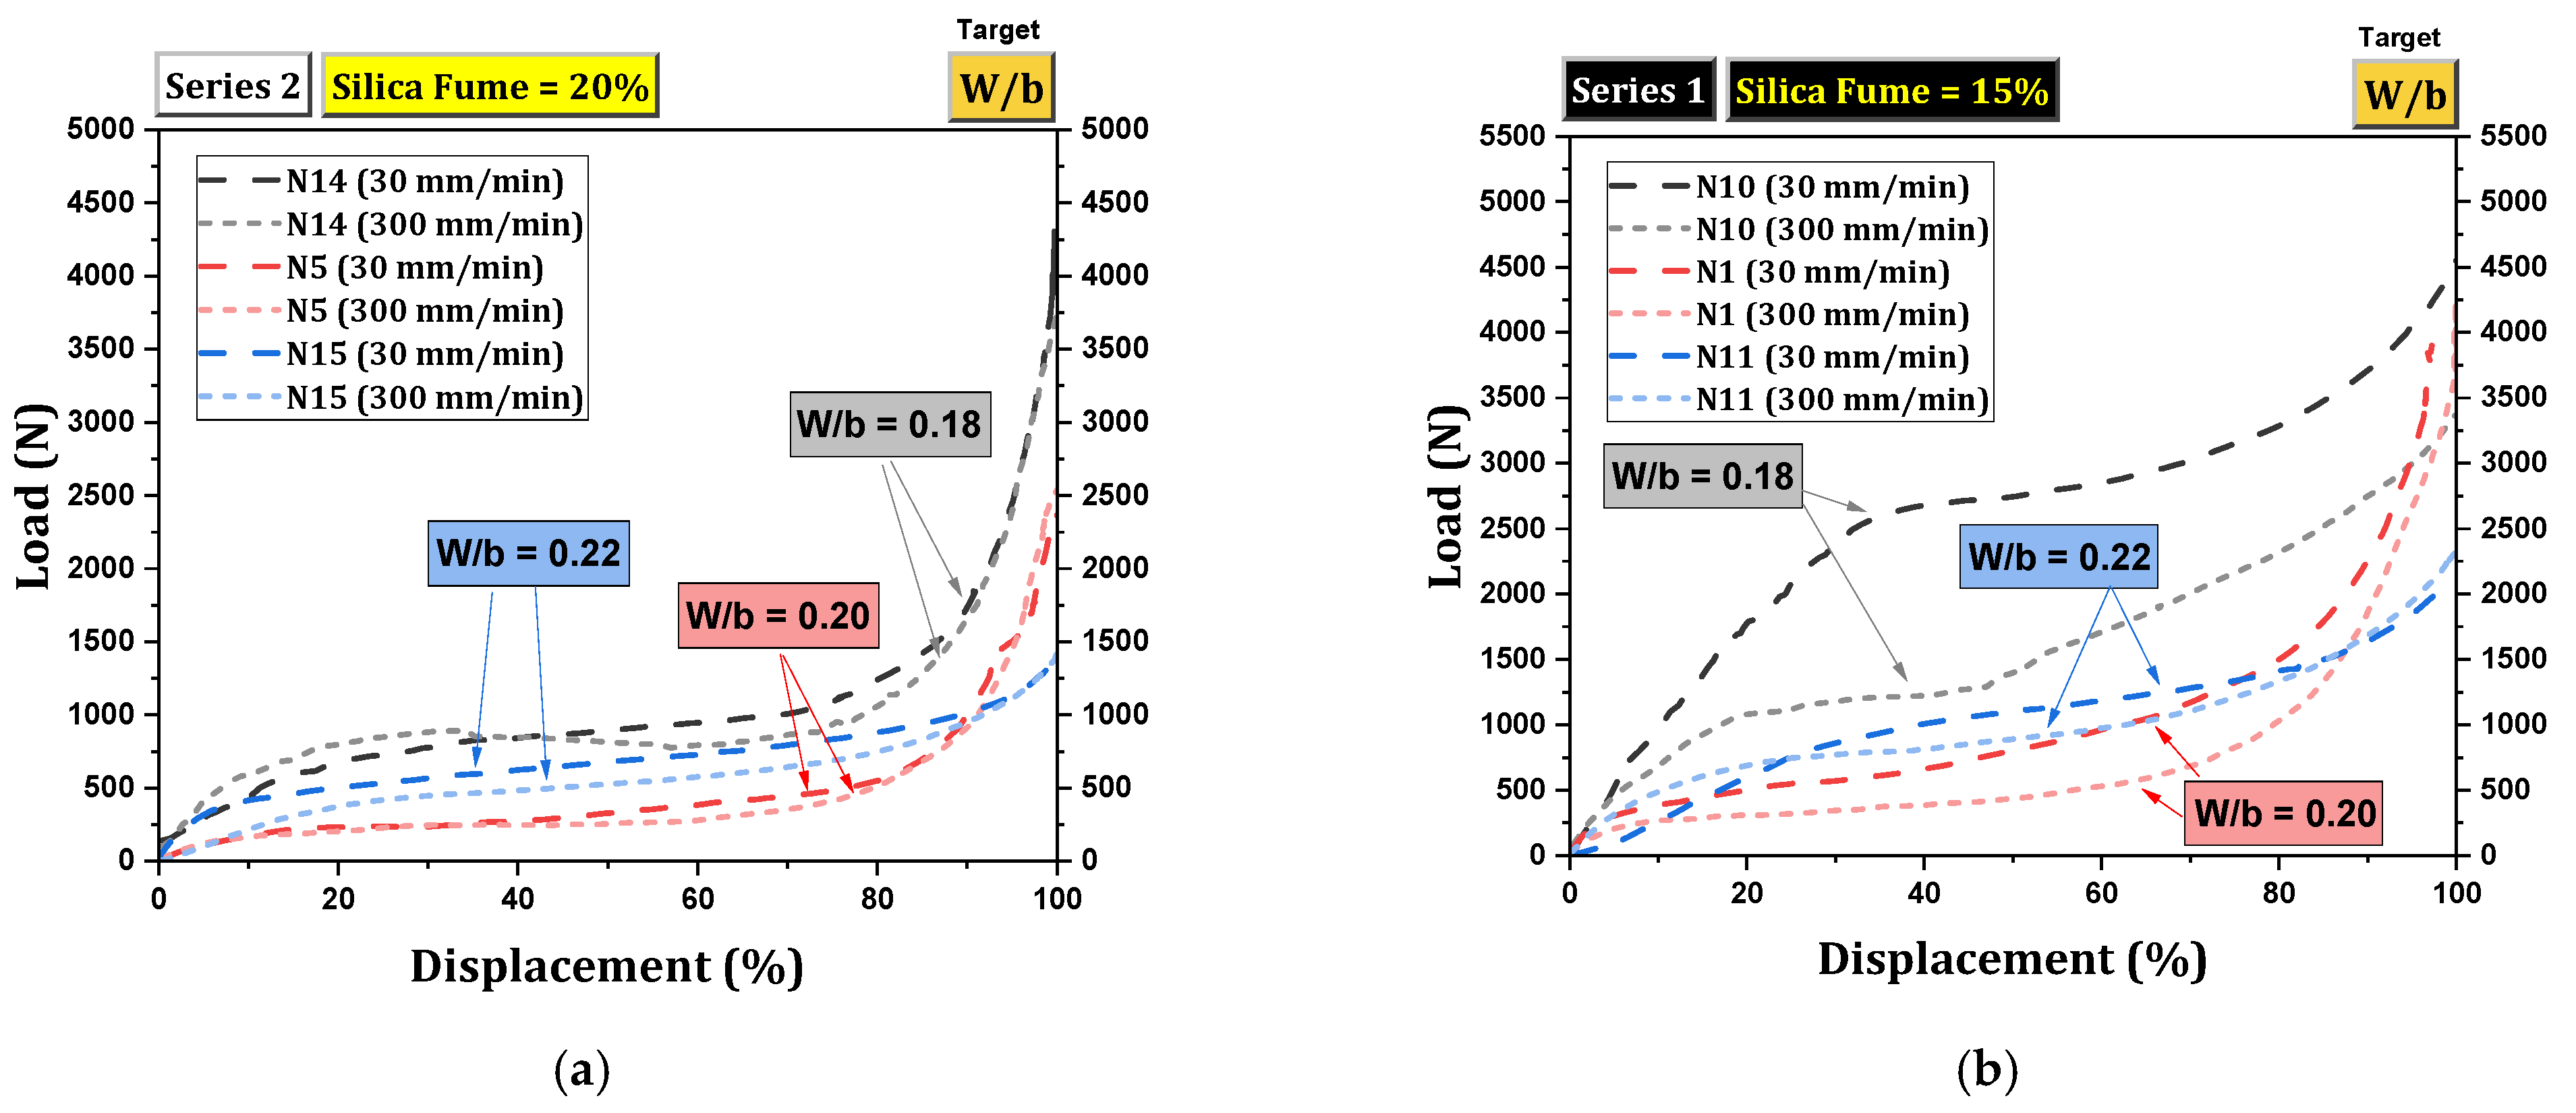
Figure 10 shows the behavior of series 1 (Figure 10a) and series 2 (Figure 10b) pastes regarding the effect of the w/b ratio. According to Figure 10a, the analysis of the behavior of the pastes during the squeezing flow test reveals that all pastes exhibit three stages (elastic deformation, plastic deformation, and strain hardening). Pastes with higher w/b ratios are positioned lower than others, thus necessitating less compression load. Examining pastes with higher w/b ratios reveals a broader plastic stage. Conversely, pastes with lower w/b ratios (0.18) exhibit a shorter stage II due to drier conditions, advancing to stage III more quickly. Increasing the amount of water in the paste increases the likelihood of the dilatancy effect and results in a broader plastic phase [63,86,87,88]. Additionally, the higher water content in the paste reduces fluid viscosity, impacting the interaction between superplasticizer particles and plate gaps. Pastes with higher w/b ratios have a shorter I phase, while pastes with lower w/b ratios exhibit a more pronounced I phase. Additionally, increased water content in the paste reduces the likelihood of experiencing stage III.
According to Figure 10b, in series 2, pastes with higher water content have a broader stage II and a shorter elastic stage. Pastes with a w/b ratio of 0.18 exhibit all three stages but with a shorter plastic stage. Pastes with higher water content exhibit partial strain hardening in a small portion of their plastic behavior.
A comparison between Figure 10a,b shows that the inclusion of SF in cement paste results in a more consistent behavior and enhances flowability, thereby lowering the need for compression force.

Examining the Effect of SNF and SF

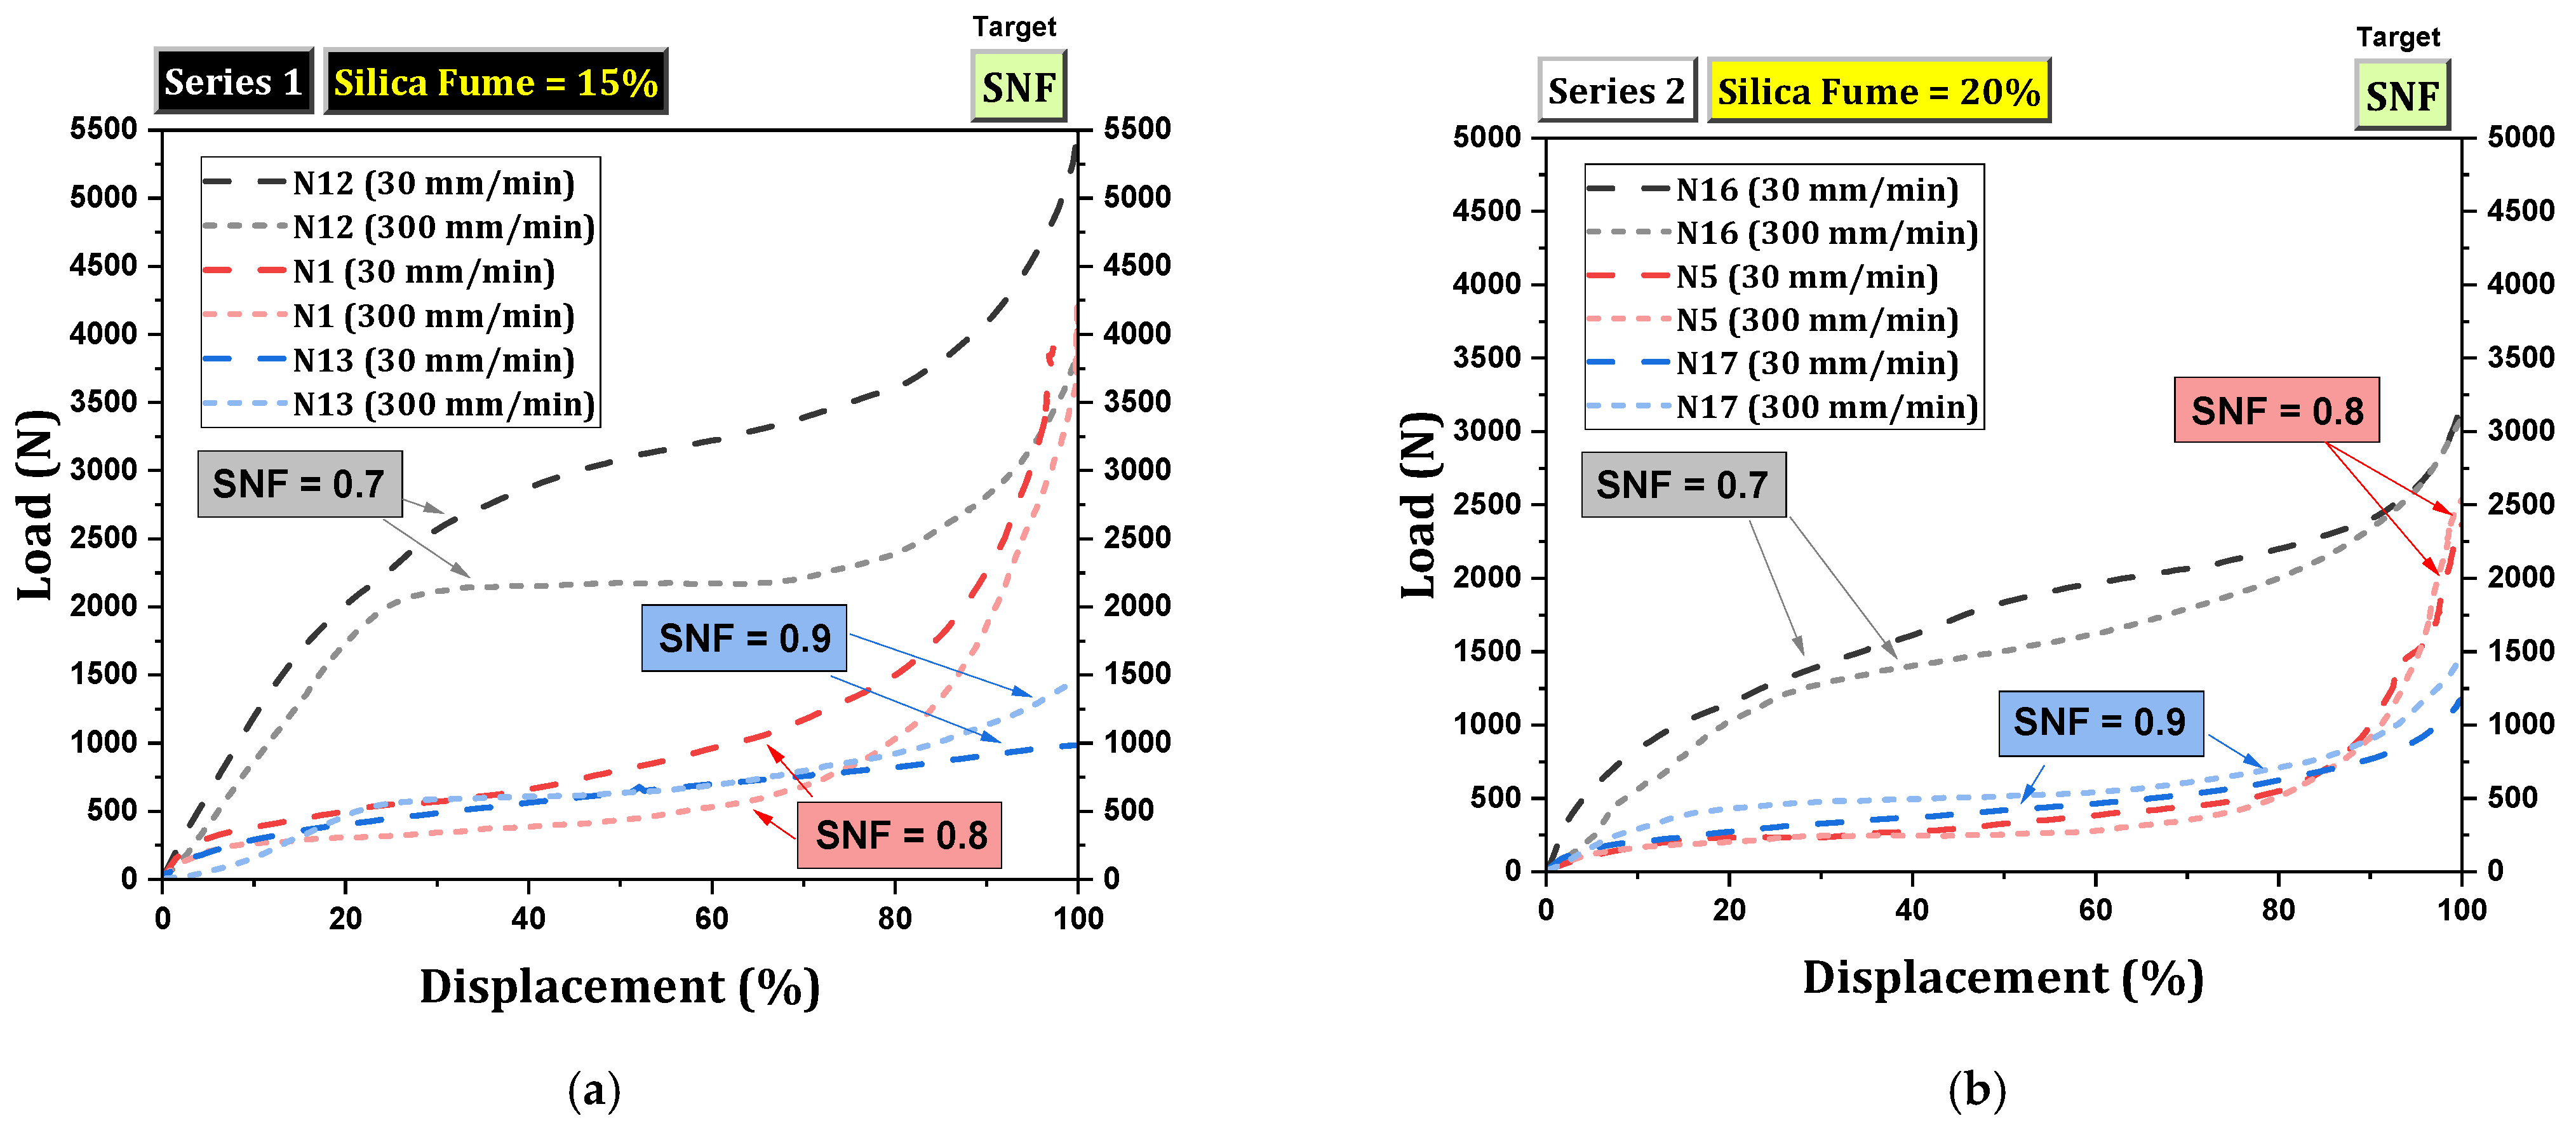
Figure 11 illustrates the behavior of series 1 (Figure 11a) and 2 (Figure 11b) pastes concerning the impact of SNF dosage. Based on Figure 11a, the analysis of pastes shows that nearly all of them exhibit three stages. Lowering the SNF dosage appears to raise the necessary compression load. Pastes with a higher SNF dosage lead to greater displacement. The plastic stage (stage II) is broader in pastes with higher SNF doses. Conversely, pastes with a lower SNF dose exhibit a distinct stage I. An increase in SNF results in higher liquidity levels. The likelihood of encountering stage III decreases as the SNF dosage increases.
Based on Figure 11b, pastes with dosages below SNF undergo all three stages, but the elastic stage is not visible in pastes with dosages of 0.8% or 0.9%. Additionally, pastes with SNF dosage require more compression force and enter the hardening stage earlier than other pastes. Mixtures with higher SNF dosages show a broader plastic paste.
Comparing Figure 11a,b reveals that the rise in SF results in the relocation of the paste curves to a lower position. Essentially, the presence of SF in cement paste enhances fluidity, reducing the required compression force to reach the objective. In summary, the enhanced performance of series 2 (with 20% SF) stems from optimized microstructural packing, controlled water distribution, stronger early cohesion, and reduced internal friction, all of which contribute to more uniform flow behavior and lower compression requirements across varying SNF and w/b ratio conditions.

6.2. Hardened Tests

6.2.1. Electrical Resistivity

Figure 12 displays the results of electrical resistivity for various UHPC mixtures. Increasing SF to more than 15% in series 1 mixtures led to a rise in electrical resistance. Similarly, in series 2 and 3 mixtures, increasing SF enhanced electrical resistance. However, it is noteworthy that the increasing electrical resistance trend contradicts compressive resistance. Consequently, the authors undertook a more thorough investigation of this issue, which was previously unexplored. The conflict between compressive resistance and electrical resistivity, attributed to SF, may stem from two factors (to be elaborated on in the subsequent text): (1) SF filling C-S-H layers and (2) the inherent structure of SF.
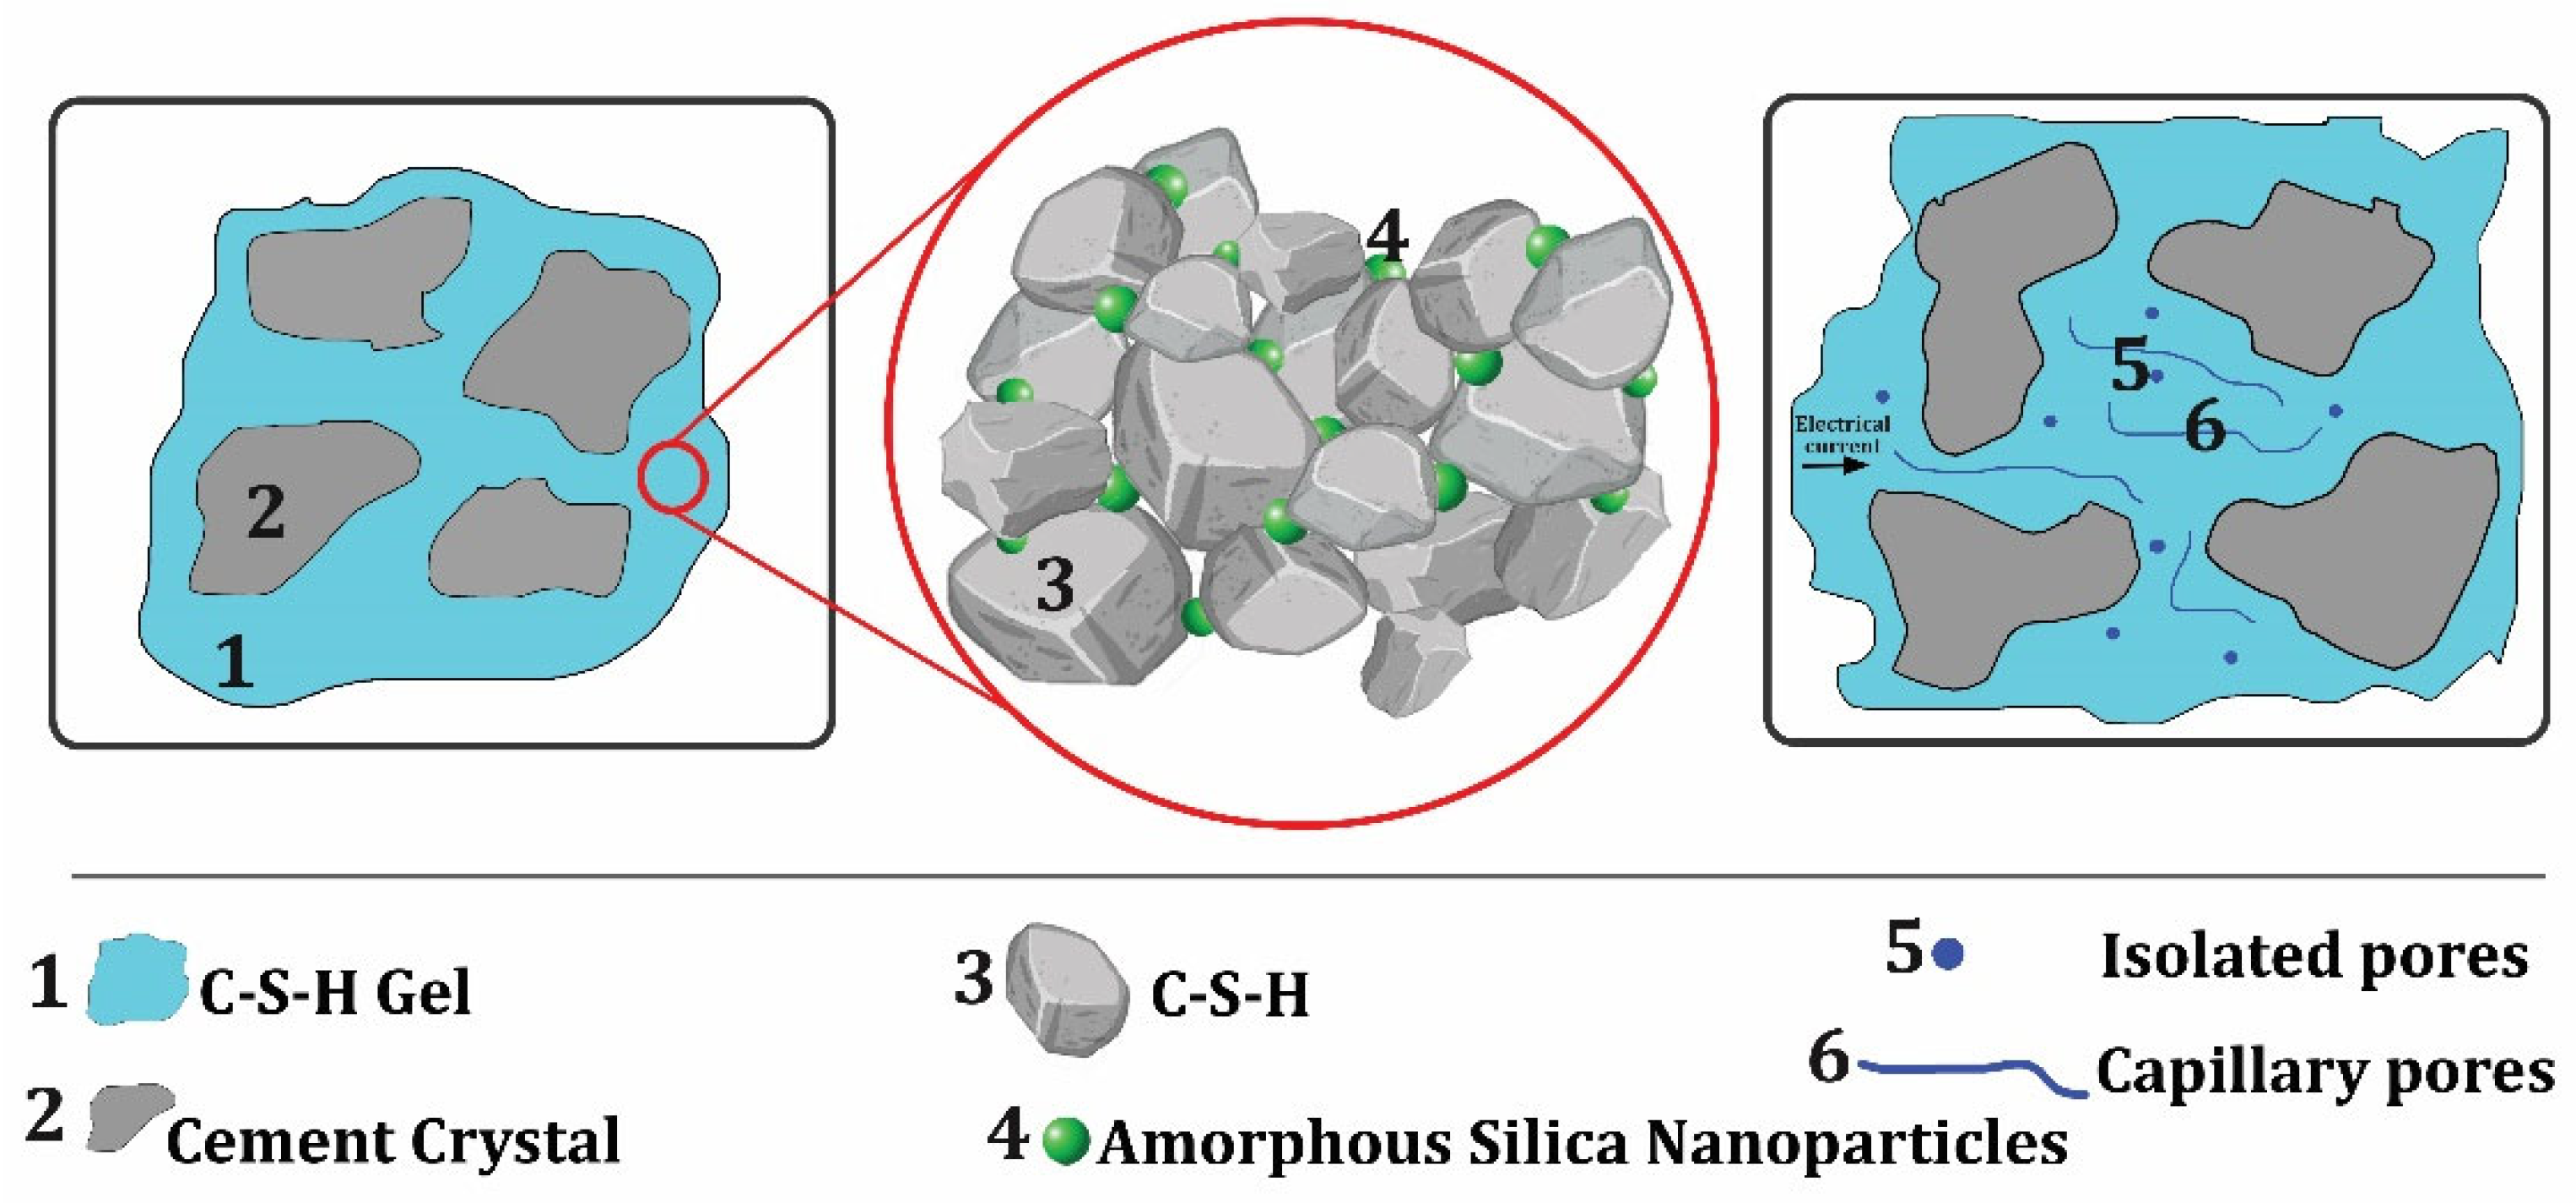
The optimal dose of SF in UHPC is generally considered to be around 15–20%, according to previous studies. Exceeding this optimal dose results in a decrease in the expected C-S-H value of the mixture. In UHPC, some of the cement exists as crystalline particles, with only a small portion of real cement being hydrated to form C-S-H. Therefore, using SF at higher doses increases the distance between particles, posing a challenge for C-S-H formation and ultimately weakening resistance. Although using SF at a high dose reduces resistance in UHPC, it also increases electrical resistance. The C-S-H structure consists of layers with capillary paths between them that conduct and transmit a small electric current. These capillary paths facilitate 3D spatial communication. Increasing SF fills these capillary paths, reducing the distance between layers, disrupting the spatial communication, and decreasing compressive strength due to reduced layer adhesion (Figure 13). As a result, the concrete becomes more brittle, with a glass-like fracture pattern. Conversely, lower SF percentages allow for more flexible layers in the UHPC structure, preventing glass fractures. On the other hand, the filling between the layers increases the electrical resistance due to closed capillary paths and greatly increased density. However, this increase in density does not necessarily strengthen the structure.
Figure 12 reveals that increasing the w/b ratio from 0.18 to 0.22 (i.e., increasing water content in the mixture) leads to a decrease in electrical resistance (consistent with the compressive resistance trend). A higher w/b ratio results in more water in the mixture and increases the volume of pores in the concrete after hydration. These pores serve as small pathways for ion movement, aiding electricity flow and decreasing resistance [89,90,91,92,93].
The increase in SNF from 0.7% to 0.9% signifies a rise in density and an enhancement in electrical resistance (Figure 12), aligning with the trend of compressive strength. When superplasticizers are incorporated into concrete, they enhance workability by dispersing cement particles, thereby decreasing the thickness of the water layer surrounding them. This decrease boosts the packing density of the cement particles, resulting in a denser microstructure. Consequently, the route of electric current within the concrete becomes more circuitous, elevating electrical resistance. Furthermore, these additives can alter concrete’s pore structure, diminishing pore network connectivity and further elevating electrical resistance [83,94,95].

6.2.2. Flexural Strength

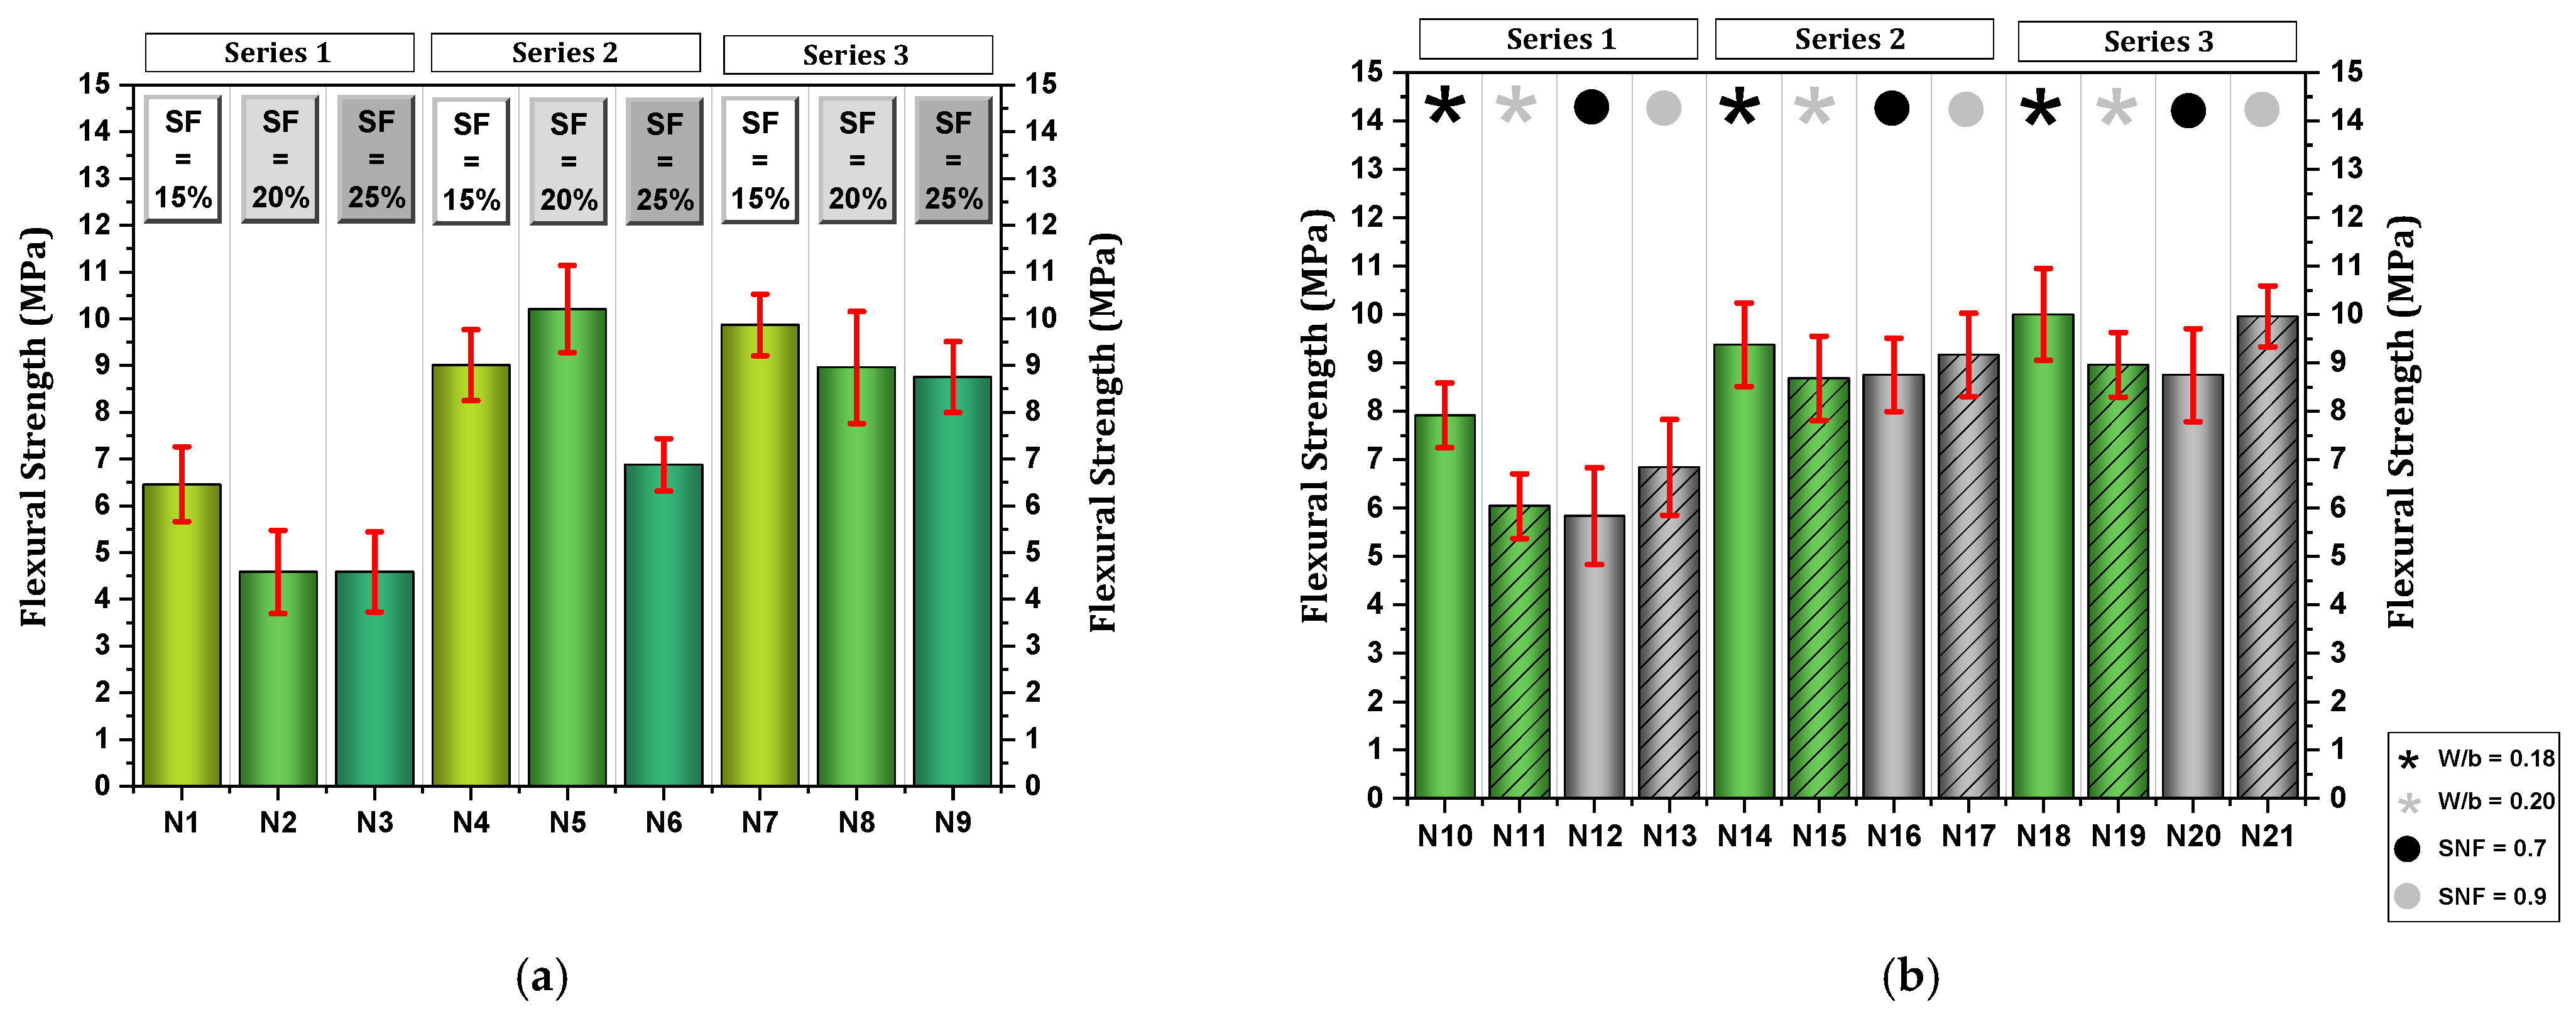
Figure 14 displays the flexural strength outcomes of the mixtures in group A (SF effect) and group B (optimal SF-based, investigating w/b and SNF effects). In Figure 14a, it is observed that as the SF content increases, the flexural strength of series 1 decreases. The highest bending strength in series 1 was recorded in the mix with 15% SF (6.46 MPa). Examining series 2 mixtures reveals that raising SF from 15% to 20% leads to a 13% increase in flexural strength. In contrast, elevating SF from 15% to 25% caused a 23% decrease in flexural strength. In series 3, increasing SF from 15% to 20% resulted in a 9% reduction in flexural strength, and increasing SF from 15% to 25% resulted in an 11% reduction in flexural strength. The reduction in bending strength due to higher SF doses can be attributed to several factors [96,97,98]: (1) SF particles are extremely fine, leading to a high specific surface area. This results in increased water demand. Insufficient water results in a drier cement mix. (2) Higher SF content may reduce efficiency, making it harder to achieve proper density. (3) Excessive SF can cause uneven particle distribution in the cement paste, hindering the formation of calcium silicate hydrate (C-S-H) gel. (4) SF, by absorbing excess water, may deplete the water available for concrete hydration, disrupting the process. (5) Increasing SF dosage can weaken the interfacial transition zone (ITZ) between aggregate and cement paste. For series 1, 2, and 3, the best SF percentages for achieving maximum flexural strength are 15%, 20%, and 15%, respectively.
According to Figure 14b, the flexural strength of mixtures with increasing w/b ratios (from 0.18 to 0.22) shows a decreasing trend. Therefore, the rise in the w/b ratio in the mixtures of series 1, 2, and 3 led to 23%, 7.4%, and 10.4% reductions in flexural strength, respectively. A higher water-to-binder ratio results in more water in the mixture, potentially increasing porosity. Excess water also reduces the concentration of cement particles, decreasing the level of hydration. Consequently, fewer cement particles are accessible to create the robust bonds essential for achieving high flexural strength [99,100].
The increase in SNF from 0.7 to 0.9% enhanced bending strength (Figure 14b). Comparing SF15WB20N07 and SF15WB20N09 blends reveals a 17%, 4.8%, and 13% rise in flexural strength in series 1, 2, and 3, respectively, attributed to the higher SNF dosage. The improvement in flexural strength through SNF can be considered a result of the potential of SNF to create better alignment of the concrete microstructure [46,101]. In other words, the complete hydration of cement particles is ensured by reducing water content, improving particle dispersion, and providing optimal particle packing [46,101].
Figure 15 illustrates the impact of the w/b ratio and SNF on flexural strength. As shown in Figure 15a, a rise in the w/b ratio from 0.18 to 0.22 resulted in a decrease in flexural strength. Series 3 mixtures exhibited the highest flexural strength relative to the w/b ratio. In Figure 15b, it is shown that as the SNF ratio increased from 0.7 to 0.9, the flexural strength also increased. Series 3 mixtures exhibited the highest flexural strength based on the SNF ratio.

6.2.3. Compressive Strength

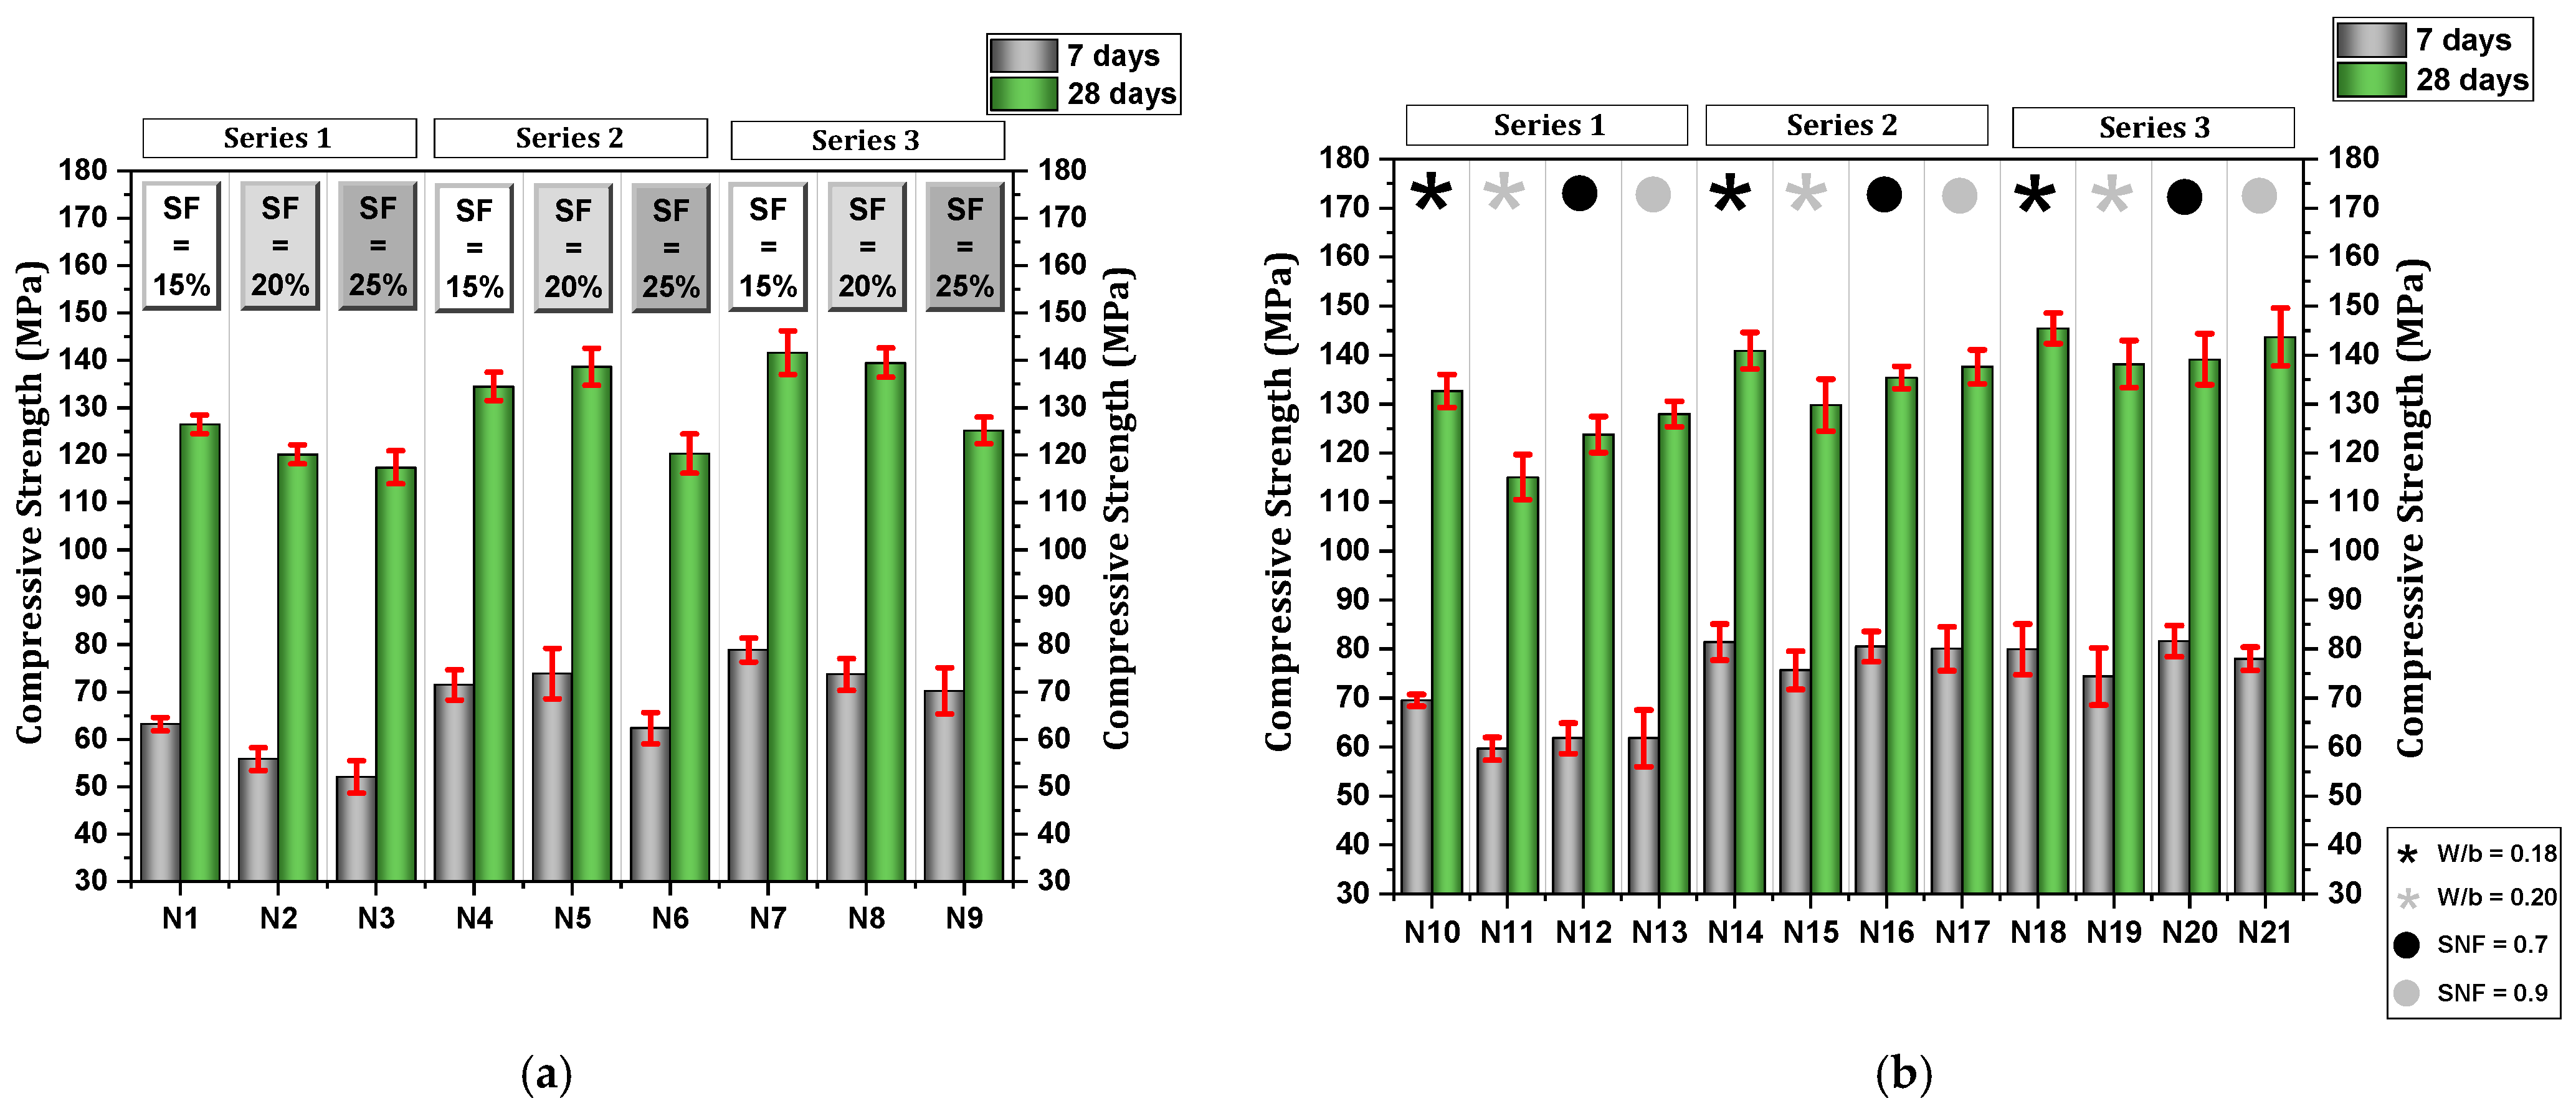
Figure 16 displays the average compressive strength results at 7 and 28 days for group A mixtures (SF effect) and group B mixtures (optimized SF with varying w/b ratios and SNF effects). Based on Figure 16a, the compressive strength decreased at 7 and 28 days with higher SF replacement. For series 1 mixtures, increasing SF from 15% to 20% resulted in approximately 11% and 5% decreases in compressive strength at 7 and 28 days, respectively. The decrease in compressive strength with the increase in SF from 15% to 25% was also shown in series 1 mixtures, resulting in a 7% decrease in strength at 28 days. In series 2 mixtures, as the SF substitution rose from 15% to 20%, the compressive strength increased by 3% and 1% at 7 and 28 days, respectively. However, surpassing 20% SF replacement led to a decrease in strength. Elevating SF substitution from 15% to 25% resulted in a roughly 12% decrease in compressive strength at both 7 and 28 days. Series 3 mixtures showed a 6.5% strength reduction at 7 days and about 1.5% at 28 days when SF substitution increased from 15% to 20%. Furthermore, raising SF substitution from 15% to 25% in series 3 mixtures led to an 11% decrease in compressive strength. An excessive concentration of SF in concrete can adversely affect its compressive strength through multiple mechanisms. The incorporation of a high dosage of SF necessitates augmented water content to preserve workability, engendering a dichotomy [102,103,104,105]: (1) the addition of water elevates the w/b ratio, undermining the concrete’s integrity, and (2) the omission of water compromises the mix’s efficiency, culminating in inadequate compaction and increased porosity. Elevated levels of SF can induce heightened viscosity within the mix, impeding cohesive properties and leading to the entrapment of air voids [106]. Although SF is known to enhance the microstructural compactness of concrete, an overabundance may result in over-densification, thereby obstructing the hydration process and the structural evolution of the concrete, consequently diminishing its strength [107,108]. Based on the compressive strength (7 and 28 days) of mixtures in series 1, 2, and 3, the ideal SF dosages were determined to be 15%, 20%, and 15%, respectively.
Figure 16b depicts the compressive strength of the mixtures at 7 and 28 days, considering the effects of the w/b ratio and SNF. The efficacy of SF in enhancing compressive strength is demonstrably linked to the w/b ratio. Generally, a lower w/b ratio translates into higher strength. However, improper adjustment of the w/b ratio when incorporating SF can compromise its effectiveness, leading to reduced compressive strength [109]. Increasing the w/b ratio from 0.18 to 0.22 resulted in a decrease in compressive strength. Comparing SF15WB18N08 and SF15WB22N08 mixtures revealed a reduction in compressive strength of approximately 13% for series 1, around 8% for series 2, and about 5% for series 3. Cement plays a crucial role in reacting with water to initiate a hydration reaction. This process results in the formation of a robust network of C-S-H gel, essential for concrete strength. A higher w/b ratio indicates more water relative to the binder (cement and other pozzolans). Excess water dilutes the cement paste, reducing the material for the vital C-S-H gel. With more water, not all cement particles may fully hydrate, leading to unreacted cement and weaker bonds in the concrete structure [100].
Increasing the SNF dosage from 0.7% to 0.9% also increased compressive strength. Comparing SF15WB20N07 and SF15WB20N09 mixtures reveals a 1.5 to 3.5% increase in compressive strength due to higher SNF substitution. SNF acts in the cement mixture by dispersing and separating cement particles and reducing internal friction. Also, SNF improves the contact between cement particles and water, which provides the basis for more complete hydration and results in a strong structure. On the other hand, the SNF used can reduce segregation (where coarse aggregates are separated from the cement paste) by creating more uniform areas in the concrete [94,110,111,112,113].
In contrast, increasing SF from 15% to higher levels generally led to reduced compressive strength at both 7 and 28 days, particularly beyond the optimal dosage. While small additions (up to 20%) may improve strength slightly in some series, excessive SF (25%) consistently results in strength losses. The optimal SF content for maximum strength was found to be 15% for series 1 and 3 and 20% for series 2. Raising the w/b ratio from 0.18 to 0.22 caused a notable decrease in compressive strength across all series. Furthermore, increasing SNF from 0.7% to 0.9% resulted in modest strength gains (1.5–3.5%).
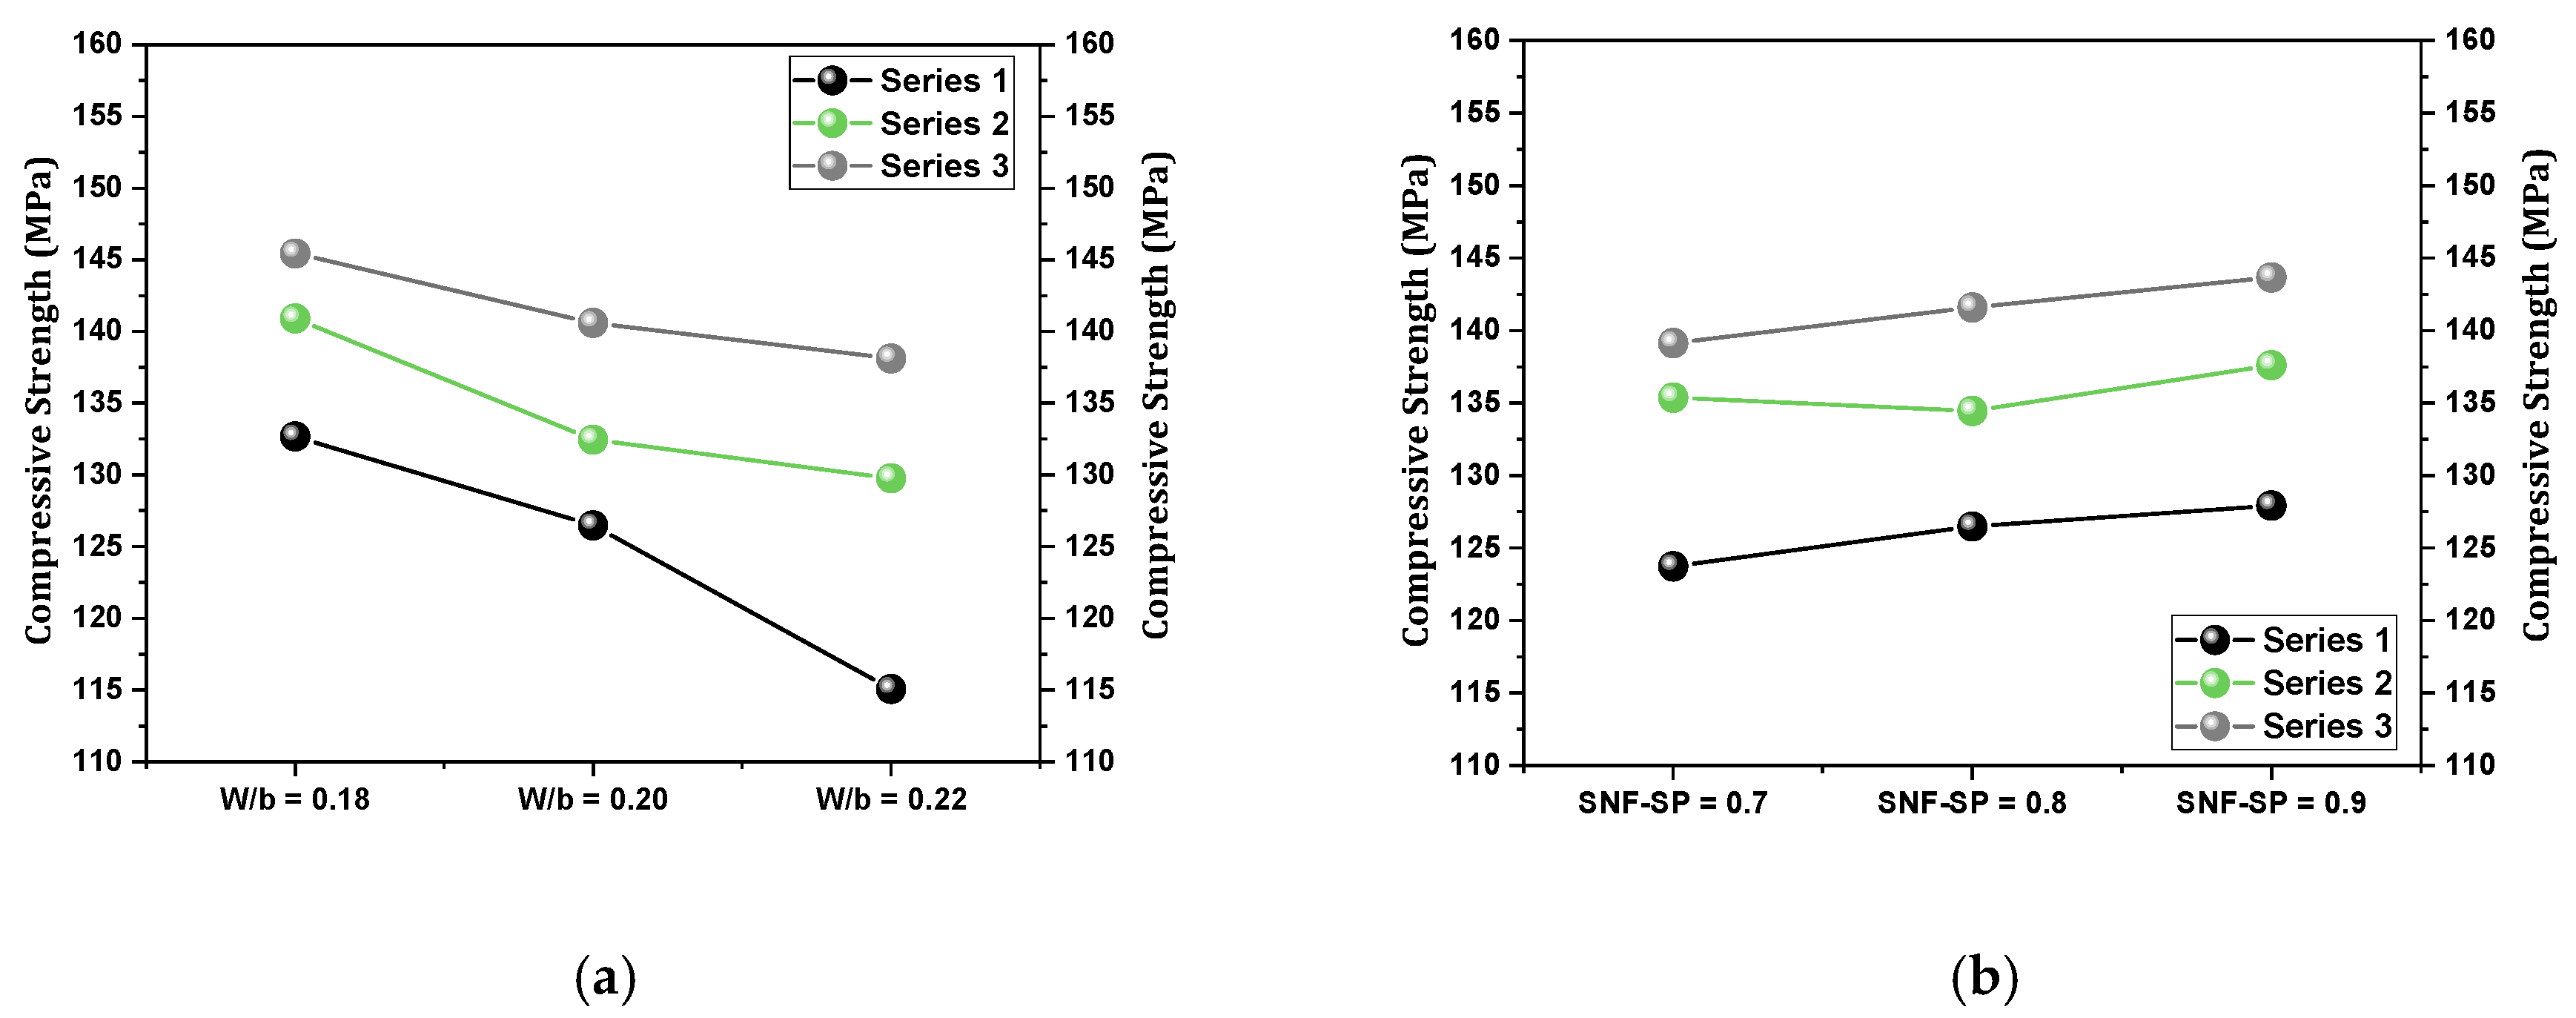
Figure 17 illustrates the impact of the w/b ratio and SNF on compressive strength. As shown in Figure 17a, as the w/b ratio rises from 0.18 to 0.22, compressive strength decreases. Series 3 mixtures exhibit the highest bending strength relative to the w/b ratio. According to Figure 17b, as the SNF ratio increases from 0.7 to 0.9, compressive strength rises. Series 3 mixtures show the highest compressive strength concerning the SNF ratio.

6.3. Analysis and Prediction of the Results with Artificial Neural Network (ANN) and Fuzzy Logic (FL)

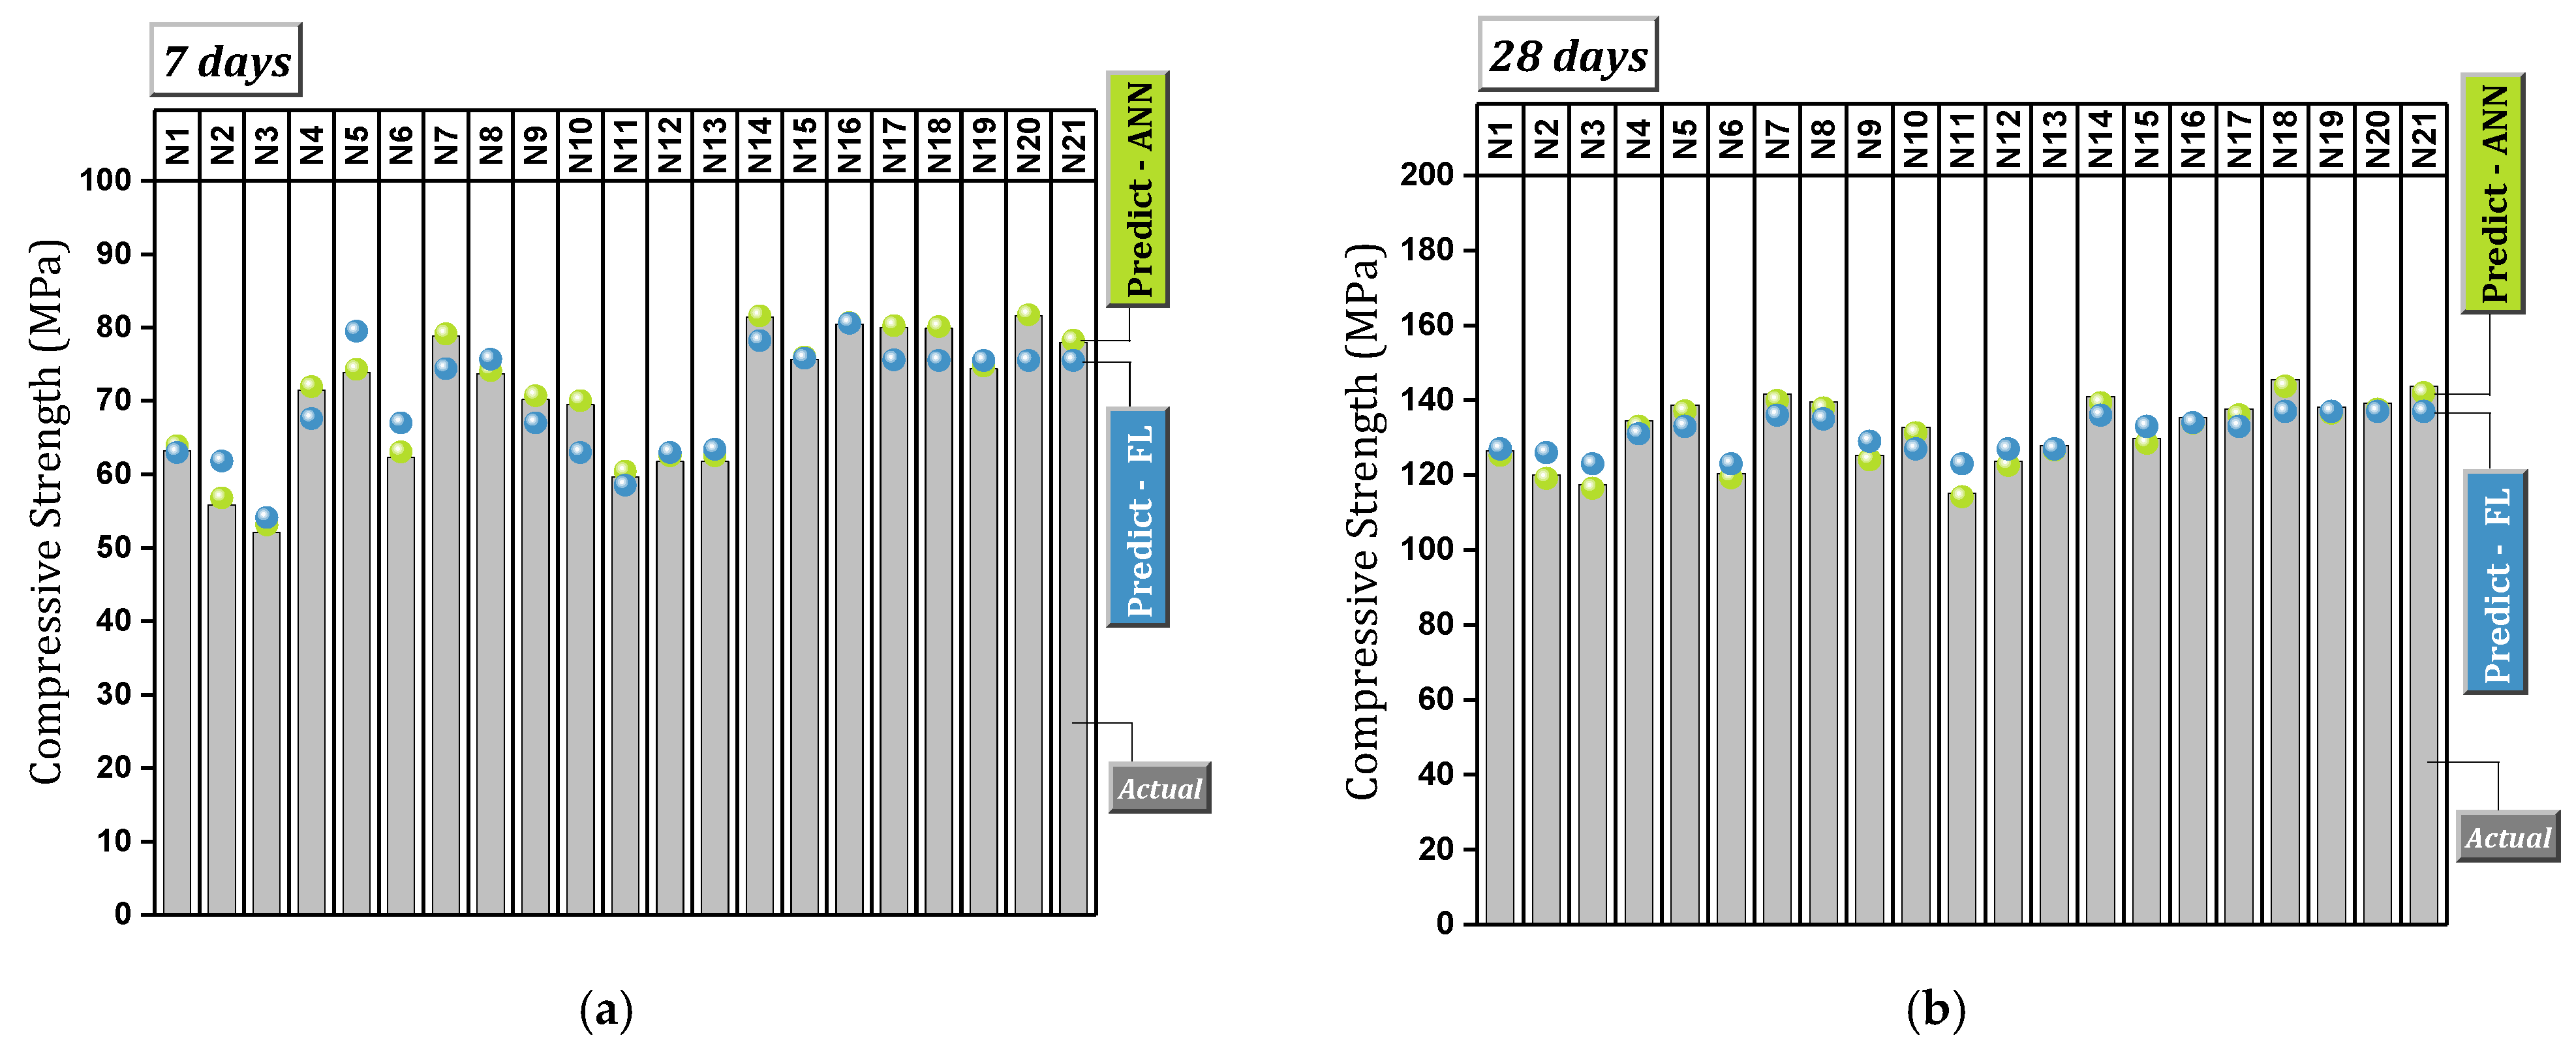
Compressive strength at 7 and 28 days was assessed using ANN and FL models. After training the ANN model with various algorithms (LM and SCG) and different types of neuron arrangements in the hidden layer, the best neuron arrangement in the hidden layer was determined for each algorithm. The LM algorithm with 10 neurons in the hidden layer showed the highest correlation coefficient. Figure 18 illustrates the compressive strength outcomes at 7 days (Figure 18a) and 28 days (Figure 18b), obtained through actual and predicted results by the ANN and FL algorithms. The prediction error relative to the real results is depicted in Figure 19 for the 7-day (Figure 19a) and 28-day (Figure 19b) compressive strength.
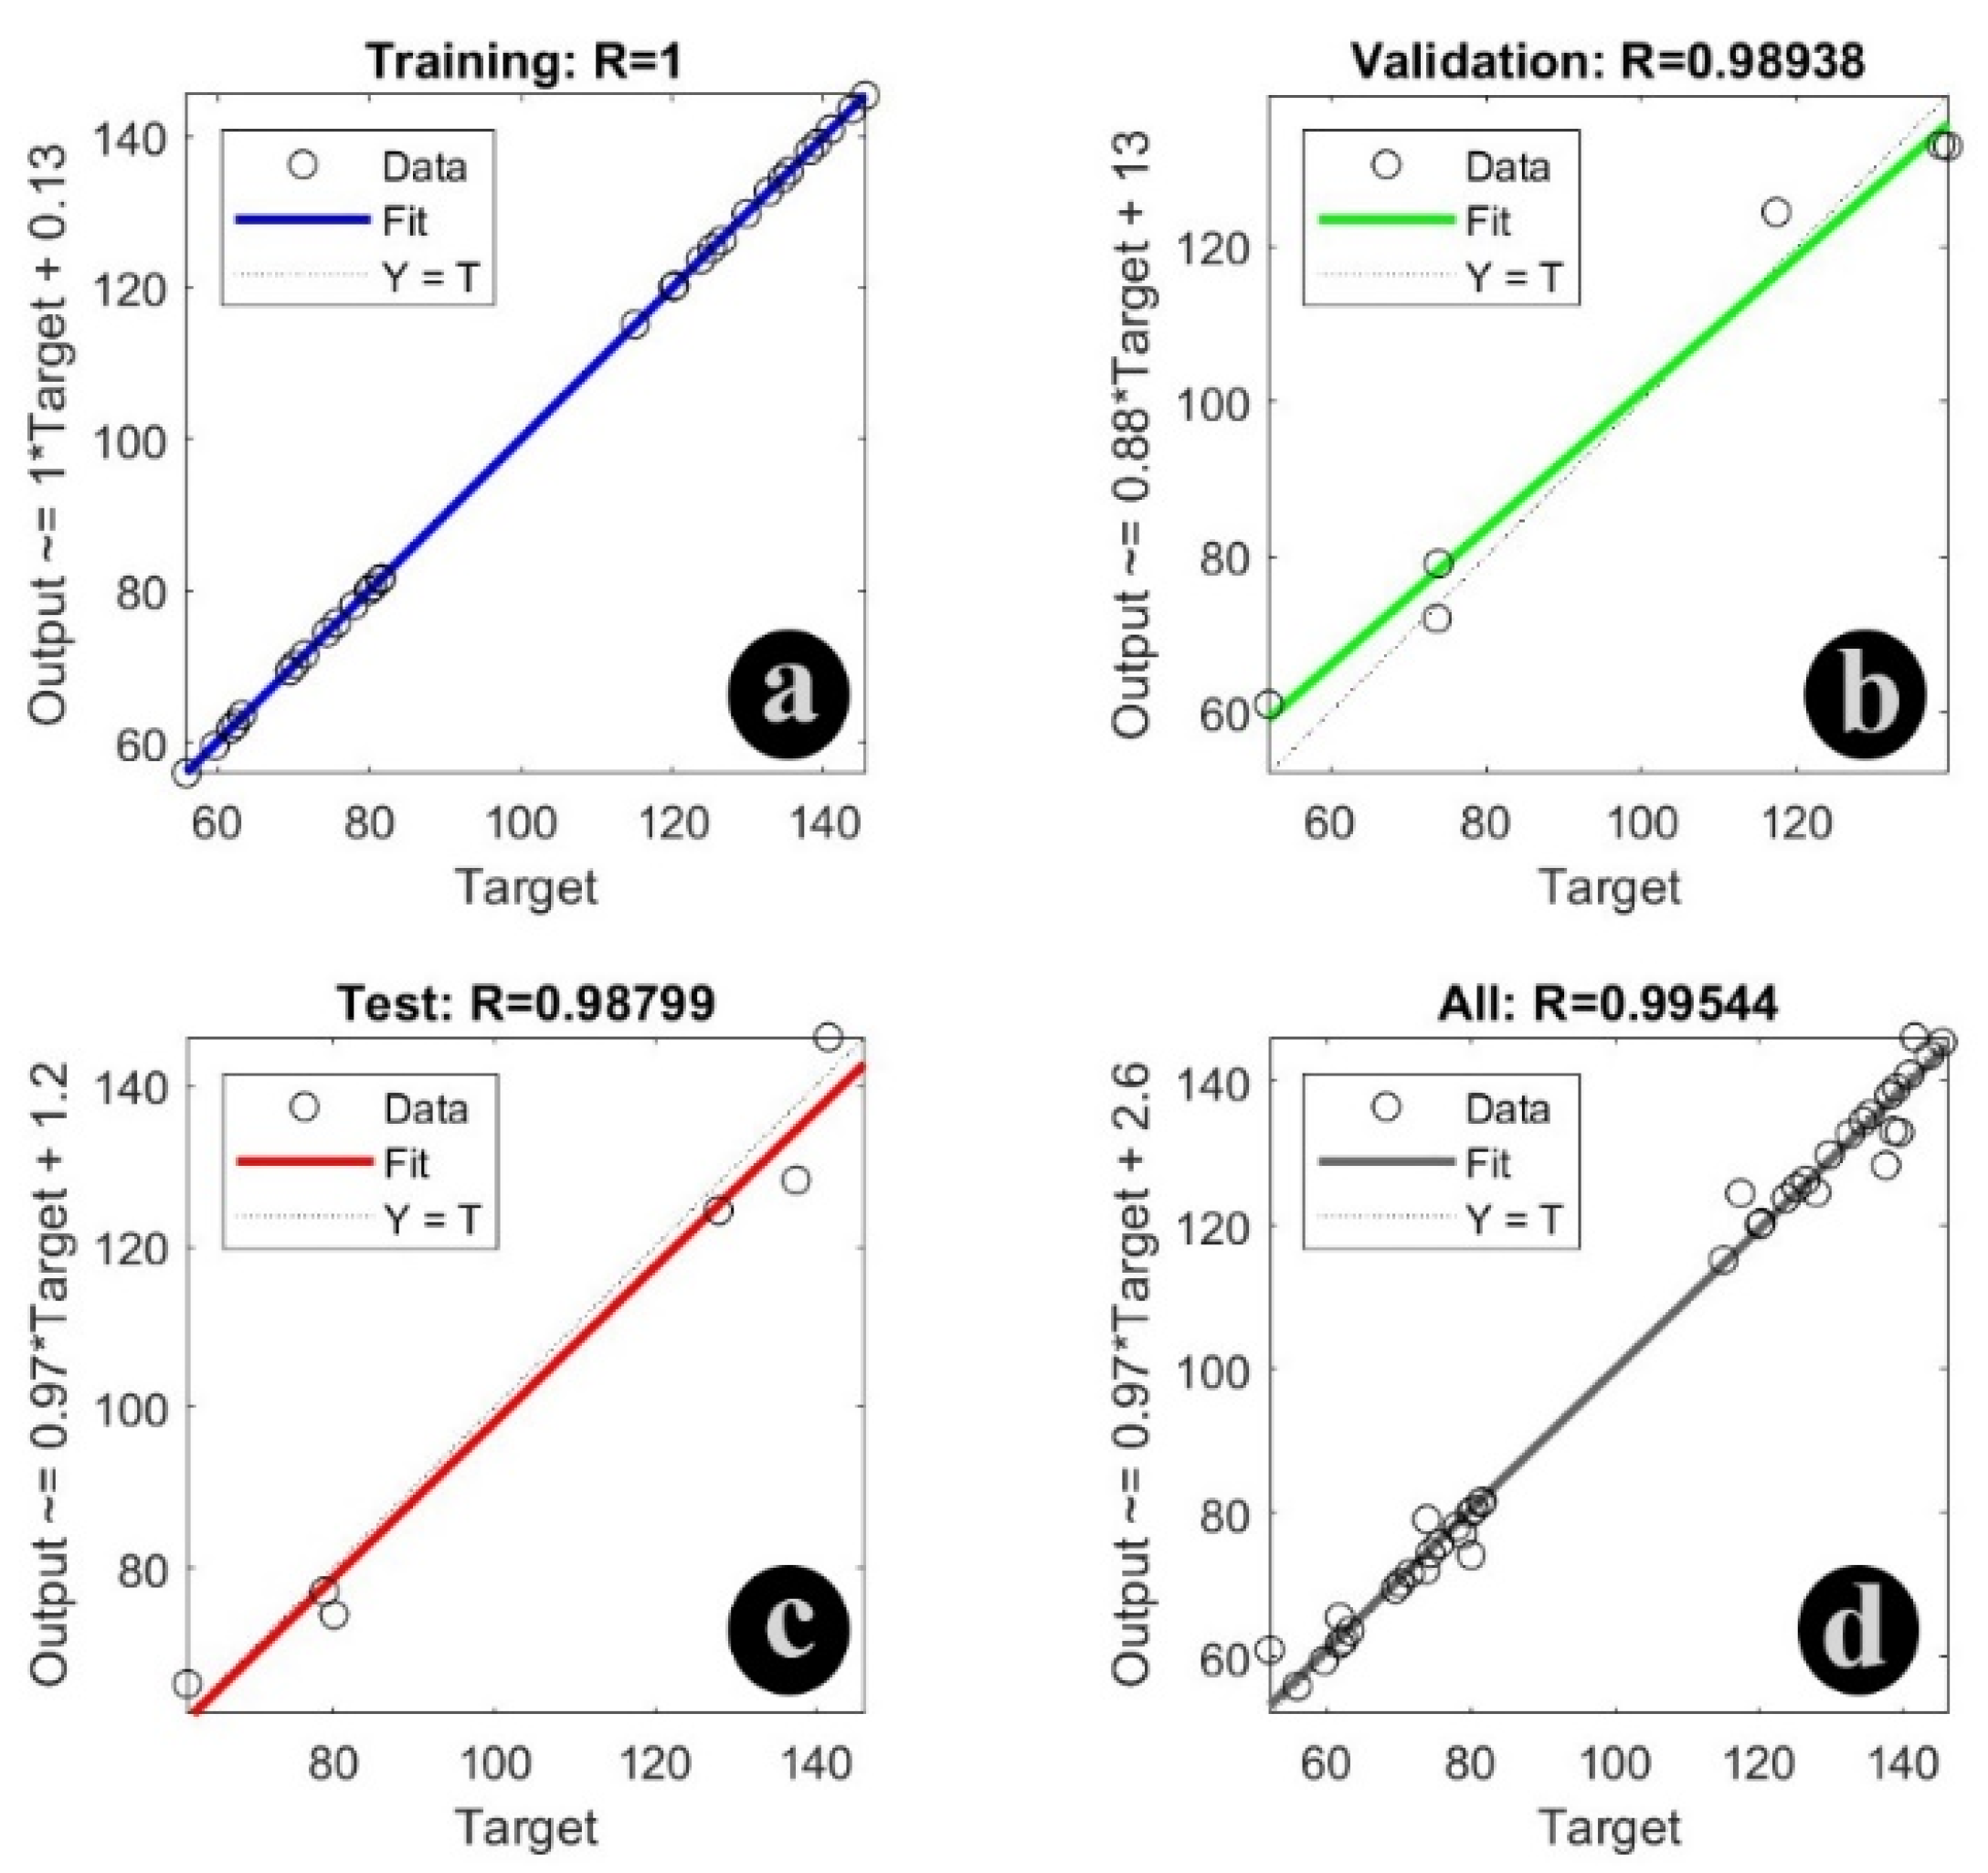
The FL model had an average error rate of 4.36% for predicting 7-day compressive strength and 3.18% for predicting 28-day compressive strength. On the other hand, the average error in the ANN model was lower, suggesting that the results derived from the ANN model are more closely aligned with reality. Specifically, the ANN model achieved 0.74% in 7-day compressive strength prediction and 1.03% in 28-day compressive strength prediction (Figure 19). Figure 20 depicts the performance of the ANN model across training, validation, testing, and all datasets. It demonstrates the strong predictive capability of the ANN model in aligning with the experimental results, as indicated by the regression coefficient (>0.95).
Despite the satisfactory performance of both prediction models utilized in this study, the perceptron neural network model of the LM algorithm with a 2–10–4 architecture demonstrates superior performance compared to the FL model.

7. Conclusions

This study evaluated the fresh and mechanical performance of ultra-high-performance concrete (UHPC) mixtures incorporating varying replacement levels of silica fume (SF), sodium naphthalene formaldehyde (SNF) as a second-generation superplasticizer, and different water-to-binder (w/b) ratios. The key findings are summarized as follows:
  • Fresh Properties
    Increasing SF content from 15% to 25% led to reduced slump flow and shorter setting times, mainly due to reduced free water and accelerated hydration. Conversely, increasing the w/b ratio improved slump flow and extended setting time by enhancing particle mobility.
    A higher SNF dosage (from 0.7% to 0.9%) significantly improved both slump flow and setting time, demonstrating effective dispersion of cement particles and reduced agglomeration.
    Squeeze flow testing revealed three distinct paste behaviors:
    Low workability mixes with high stiffness and rapid transition to strain hardening;
    Highly flowable mixes exhibiting extended plastic phases and higher dilatancy;
    Transitional mixes highly sensitive to variables like flow rate and composition, affecting displacement trends.
  • Mechanical characteristics
    Increasing the SF dose led to the closure of capillary paths and enhanced density, resulting in higher electrical resistance. The rise in the w/b ratio provided a conducive substrate for ion movement, leading to reduced electrical resistance. Higher SNF substitution enhanced cement particle packing density and raised electrical resistance.
    Increasing SF dosage from 15% to 25% reduced compressive and flexural strength due to uneven cement particle distribution, hydration disruption, and ITZ weakening. A higher w/b ratio also decreased strength by limiting the material for C-S-H gel formation. However, raising the SNF dosage from 0.7% to 0.9% improved UHPC strength by promoting complete hydration and reducing internal friction.
    The ANN model with 4-10-2 architecture presented an acceptable performance, according to the regression coefficient of >0.98. Also, the good performance of the FL model should not be overlooked. The error rate of the fuzzy logic model resulted in a range of 3.18–4.36%, while the error rate recorded for the ANN model was much lower (0.74–1.03%).
  • Benefits and Limitations of Second-Generation Superplasticizers
    Naphthalene-based superplasticizers have the potential to improve workability without compromising strength while also improving particle dispersion for a denser, more homogeneous microstructure. However, their limitations include potential slump loss over time due to rapid adsorption on cement particles, reduced effectiveness in low-temperature conditions, and incompatibility with some cement types, which can lead to delayed setting or strength gain issues. Additionally, they may not provide the same level of flow retention as newer polycarboxylate ether (PCE)-based alternatives, making them less ideal for highly complex UHPC applications requiring prolonged workability. Nevertheless, using this type of economic superplasticizer for relatively expensive concrete mixtures like UHPC may present a partial solution for further industrial application of this material.
  • Recommended Mix Design
    • Among the tested mixes, the most balanced performance was observed for:
    • SF20WB20N09: 20% SF, w/b = 0.20, SNF = 0.9%.
    • This mixture exhibited high flexural and compressive strength, suitable setting time, and adequate slump flow, making it the recommended formulation for UHPC in practical applications.
  • Industrial perspective
    The study focused exclusively on second-generation SNF-based superplasticizers, and the conclusions remain within this scope. The results demonstrate that optimized SNF dosages (0.9%) can produce UHPC mixes with satisfactory fresh behavior and mechanical strength, suggesting the continued viability of SNF in cost-sensitive or prefabrication settings where flowability and early strength are critical. While third-generation superplasticizers offer enhanced performance, SNF is still a cost-effective and functional alternative, especially for applications not requiring extreme workability.

Author Contributions

This study is the result of the joint work of the authors. Conceptualization, A.S. and M.M.M.; methodology, A.S. and M.M.M.; software, A.S. and M.M.M.; validation, S.T., A.S. and M.M.M., S.E.R. and M.K.; formal analysis, A.S. and M.M.M.; investigation, S.T., J.B., A.S. and M.M.M.; resources, S.T., J.B., A.S. and M.M.M.; data curation, J.B., A.S. and M.M.M.; writing—original draft preparation, J.B., A.S. and M.M.M.; writing—review and editing, A.S., M.M.M., S.E.R. and M.K.; visualization, M.M.M.; supervision, A.S. and M.M.M.; project administration, A.S. and M.M.M. All authors have read and agreed to the published version of the manuscript.

Funding

This research received no external funding.

Institutional Review Board Statement

Not applicable.

Informed Consent Statement

Not applicable.

Data Availability Statement

The original contributions presented in this study are included in the article. Further inquiries can be directed to the corresponding authors.

Conflicts of Interest

Author Sam Rigby was employed by the company Arup Resilience, Security & Risk. The remaining authors declare that the research was conducted in the absence of any commercial or financial relationships that could be construed as a potential conflict of interest.

References

  1. Li, J.; Wu, Z.; Shi, C.; Yuan, Q.; Zhang, Z. Durability of Ultra-High Performance Concrete—A Review. Constr. Build. Mater. 2020, 255, 119296. [Google Scholar] [CrossRef]
  2. Du, J.; Meng, W.; Khayat, K.H.; Bao, Y.; Guo, P.; Lyu, Z.; Abu-obeidah, A.; Nassif, H.; Wang, H. New Development of Ultra-High-Performance Concrete (UHPC). Compos. Part B Eng. 2021, 224, 109220. [Google Scholar] [CrossRef]
  3. Mohammad Nezhad Ayandeh, M.H.; Ghodousian, O.; Mohammad Nezhad, H.; Mohtasham Moein, M.; Saradar, A.; Karakouzian, M. Steel Slag and Zeolite as Sustainable Pozzolans for UHPC: An Experimental Study of Binary and Ternary Pozzolan Mixtures under Various Curing Conditions. Innov. Infrastruct. Solut. 2024, 9, 265. [Google Scholar] [CrossRef]
  4. Shao, Y.; Nguyen, W.; Bandelt, M.J.; Ostertag, C.P.; Billington, S.L. Seismic Performance of High-Performance Fiber-Reinforced Cement-Based Composite Structural Members: A Review. J. Struct. Eng. 2022, 148, 03122004. [Google Scholar] [CrossRef]
  5. Yang, C.; Okumus, P. Ultrahigh-Performance Concrete for Posttensioned Precast Bridge Piers for Seismic Resilience. J. Struct. Eng. 2017, 143, 03122004. [Google Scholar] [CrossRef]
  6. Hung, C.-C.; El-Tawil, S.; Chao, S.-H. A Review of Developments and Challenges for UHPC in Structural Engineering: Behavior, Analysis, and Design. J. Struct. Eng. 2021, 147, 03121001. [Google Scholar] [CrossRef]
  7. Cardoso, F.A.; John, V.M.; Pileggi, R.G.; Banfill, P.F.G. Characterisation of Rendering Mortars by Squeeze-Flow and Rotational Rheometry. Cem. Concr. Res. 2014, 57, 79–87. [Google Scholar] [CrossRef]
  8. Cardoso, F.A.; Grandes, F.A.; Sakano, V.K.; Rego, A.C.A.; Lofrano, F.C.; John, V.M.; Pileggi, R.G. Experimental Developments of the Squeeze Flow Test for Mortars. In Rheology and Processing of Construction Materials; RILEM Bookseries; Springer: Cham, Switzerland, 2020; Volume 23. [Google Scholar]
  9. Soltani, A.; Tarighat, A.; Rostami, R.; Tavakoli, D.; Moradi, A. Investigation of Mechanical Properties of Concrete with Clinoptilolite and Silica Fume Using Taguchi Method. Innov. Infrastruct. Solut. 2024, 9, 77. [Google Scholar] [CrossRef]
  10. Ullah, R.; Qiang, Y.; Ahmad, J.; Vatin, N.I.; El-Shorbagy, M.A. Ultra-High-Performance Concrete (UHPC): A State-of-the-Art Review. Materials 2022, 15, 4131. [Google Scholar] [CrossRef]
  11. Heidari, A.; Tavakoli, D. Performance of Ceramic Tile Powder as a Pozzolanic Material in Concrete. Int. J. Adv. Mater. Sci. 2012, 3, 1–11. [Google Scholar]
  12. Kujawa, W.; Olewnik-Kruszkowska, E.; Nowaczyk, J. Concrete Strengthening by Introducing Polymer-Based Additives into the Cement Matrix-a Mini Review. Materials 2021, 14, 6071. [Google Scholar] [CrossRef] [PubMed]
  13. Lei, D.; Yu, L.; Wang, S.; Li, Y.; Jia, H.; Wu, Z.; Bao, J.; Liu, J.; Xi, X.; Su, L. A State-of-the-Art on Electromagnetic and Mechanical Properties of Electromagnetic Waves Absorbing Cementitious Composites. Cem. Concr. Compos. 2025, 157, 105889. [Google Scholar] [CrossRef]
  14. Li, Y.; Dong, C.; Wang, S.; Lei, D.; Yin, B.; Cui, Y.; Wang, Y.; Li, R. Micro-Macro Regulating Heterogeneous Interface Engineering in 3D N-Doped Carbon Fiber/MXene/TiO 2 Nano-Aerogel for Boosting Electromagnetic Wave Absorption. Nano Res. 2025, 18, 94907169. [Google Scholar] [CrossRef]
  15. Lei, D.; Liu, C.; Wang, S.; Zhang, P.; Li, Y.; Yang, D.; Jin, Y.; Liu, Z.; Dong, C. Multiple Synergistic Effects of Structural Coupling and Dielectric-Magnetic Loss in Promoting Microwave Absorption of Bark-Derived Absorbers. Adv. Compos. Hybrid. Mater. 2025, 8, 158. [Google Scholar] [CrossRef]
  16. Lei, D.; Jia, H.; Yu, L.; Li, Y.; Wu, Z.; Wang, B.; Zhou, A.; Qin, L.; Sun, J.; Wang, W.; et al. Recent Developments in Low-Carbon Engineered Cementitious Composites (ECC). J. Build. Eng. 2025, 100, 111734. [Google Scholar] [CrossRef]
  17. Li, Y.; Liu, Z.; Lu, Y.; Yang, M.; Zhang, P.; Lei, D.; Liu, C.; Wang, S.; Dong, C. Surface Energy Induced Microstructural Engineering of Bio-Derived N-Doped Carbon Fibers Anchored by CoNi Nanoparticles for Superior Microwave Absorption. Adv. Compos. Hybrid. Mater. 2025, 8, 176. [Google Scholar] [CrossRef]
  18. al-Swaidani, A.M.; Khwies, W.T.; al-Baly, M.; Lala, T. Development of Multiple Linear Regression, Artificial Neural Networks and Fuzzy Logic Models to Predict the Efficiency Factor and Durability Indicator of Nano Natural Pozzolana as Cement Additive. J. Build. Eng. 2022, 52, 104475. [Google Scholar] [CrossRef]
  19. Rostami, J.; Rasekhi Sahneh, A.; Sedighardekani, R.; Latifinowsoud, M.; Rostami, R.; Kaltaei, A.; Sanaei Ataabadi, H.; Bahrami, N.; Mahmoudy, S.A.; Khandel, O. Influence of Phase Change Material and Nano Silica Aerogel Aggregates on the Characteristics of Cementitious Composite: An Experimental and Predictive Study. J. Build. Eng. 2024, 82, 108148. [Google Scholar] [CrossRef]
  20. Heyran Najafi, M.R.; Saradar, A.; Mohtasham Moein, M.; Karakouzian, M. Investigation Mechanical Characteristics and Permeability of Concrete with Pozzolanic Materials: A Sustainable Approach. Multiscale Multidiscip. Model. Exp. Des. 2024, 7, 5051–5078. [Google Scholar] [CrossRef]
  21. Moein, M.M.; Moein, A.M.; Saradar, A.; Rigby, S.E.; Tazari, H.; Karakouzian, M. Mechanical Properties of Portland Cement Concrete Mixed with Different Doses of Recycled Brick Powder and Steel Fiber. Heliyon 2025, 11, e41900. [Google Scholar] [CrossRef]
  22. Tayfur, G.; Erdem, T.K.; Kırca, Ö. Strength Prediction of High-Strength Concrete by Fuzzy Logic and Artificial Neural Networks. J. Mater. Civ. Eng. 2014, 26, 04014079. [Google Scholar] [CrossRef]
  23. Yuan, Y.; Yang, M.; Shang, X.; Xiong, Y.; Zhang, Y. Predicting the Compressive Strength of UHPC with Coarse Aggregates in the Context of Machine Learning. Case Stud. Constr. Mater. 2023, 19, e02627. [Google Scholar] [CrossRef]
  24. Behforouz, B.; Tavakoli, D.; Gharghani, M.; Ashour, A. Bond Strength of the Interface between Concrete Substrate and Overlay Concrete Containing Fly Ash Exposed to High Temperature. Structures 2023, 49, 183–197. [Google Scholar] [CrossRef]
  25. Song, H.; Ahmad, A.; Farooq, F.; Ostrowski, K.A.; Maślak, M.; Czarnecki, S.; Aslam, F. Predicting the Compressive Strength of Concrete with Fly Ash Admixture Using Machine Learning Algorithms. Constr. Build. Mater. 2021, 308, 125021. [Google Scholar] [CrossRef]
  26. Sadrmomtazi, A.; Sobhani, J.; Mirgozar, M.A. Modeling Compressive Strength of EPS Lightweight Concrete Using Regression, Neural Network and ANFIS. Constr. Build. Mater. 2013, 42, 205–216. [Google Scholar] [CrossRef]
  27. Mohtasham Moein, M.; Rahmati, K.; Mohtasham Moein, A.; Saradar, A.; Rigby, S.E.; Akhavan Tabassi, A. Employing Neural Networks, Fuzzy Logic, and Weibull Analysis for the Evaluation of Recycled Brick Powder in Concrete Compositions. Buildings 2024, 14, 4062. [Google Scholar] [CrossRef]
  28. Mohtasham Moein, M.; Rahmati, K.; Mohtasham Moein, A.; Rigby, S.E.; Saradar, A.; Karakouzian, M. Utilizing Construction and Demolition Waste in Concrete as a Sustainable Cement Substitute: A Comprehensive Study on Behavior Under Short-Term Dynamic and Static Loads via Laboratory and Numerical Analysis. J. Build. Eng. 2024, 97, 110778. [Google Scholar] [CrossRef]
  29. Sobhani, J.; Ejtemaei, M.; Sadrmomtazi, A.; Mirgozar, M.A. Modeling flexural strength of EPS lightweight concrete using regression, neural network and ANFIS. Int. J. Optim. Civil Eng. 2019, 9, 313–329. [Google Scholar]
  30. Wang, S.; Xia, P.; Chen, K.; Gong, F.; Wang, H.; Wang, Q.; Zhao, Y.; Jin, W. Prediction and Optimization Model of Sustainable Concrete Properties Using Machine Learning, Deep Learning and Swarm Intelligence: A Review. J. Build. Eng. 2023, 80, 108065. [Google Scholar] [CrossRef]
  31. Zadeh, L.A. Fuzzy Sets. Inf. Control 1965, 8, 338–353. [Google Scholar] [CrossRef]
  32. Başyigit, C.; Akkurt, I.; Kilincarslan, S.; Beycioglu, A. Prediction of Compressive Strength of Heavyweight Concrete by ANN and FL Models. Neural Comput. Appl. 2010, 19, 507–513. [Google Scholar] [CrossRef]
  33. Soltanifar, M.; Sharafi, H.; Hosseinzadeh Lotfi, F.; Pedrycz, W.; Allahviranloo, T. Introduction to Fuzzy Logic. In Studies in Systems, Decision and Control; Springer: Cham, Switzerland, 2023; Volume 471. [Google Scholar]
  34. Zadeh, L.A. Is There a Need for Fuzzy Logic? Inf. Sci. 2008, 178, 2751–2779. [Google Scholar] [CrossRef]
  35. Mirgozar Langaroudi, M.A.; Mohtasham Moein, M.; Saradar, A.; Karakouzian, M. Investigation of the Mechanical Properties and Durability of Fiber-Reinforced Geopolymer Mortars Containing Metakaolin and Glass Powder. Infrastruct. 2025, 10, 25. [Google Scholar] [CrossRef]
  36. Saridemir, M. Predicting the Compressive Strength of Mortars Containing Metakaolin by Artificial Neural Networks and Fuzzy Logic. Adv. Eng. Softw. 2009, 40, 920–927. [Google Scholar] [CrossRef]
  37. Topçu, I.B.; Saridemir, M. Prediction of Compressive Strength of Concrete Containing Fly Ash Using Artificial Neural Networks and Fuzzy Logic. Comput. Mater. Sci. 2008, 41, 305–311. [Google Scholar] [CrossRef]
  38. Zhang, Q.; Shu, X.; Yang, Y.; Wang, X.; Liu, J.; Ran, Q. Preferential Adsorption of Superplasticizer on Cement/Silica Fume and Its Effect on Rheological Properties of UHPC. Constr. Build. Mater. 2022, 359, 129519. [Google Scholar] [CrossRef]
  39. Li, P.P.; Yu, Q.L.; Brouwers, H.J.H. Effect of PCE-Type Superplasticizer on Early-Age Behaviour of Ultra-High Performance Concrete (UHPC). Constr. Build. Mater. 2017, 153, 740–750. [Google Scholar] [CrossRef]
  40. Wang, R.; Gao, X.; Huang, H.; Han, G. Influence of Rheological Properties of Cement Mortar on Steel Fiber Distribution in UHPC. Constr. Build. Mater. 2017, 144, 65–73. [Google Scholar] [CrossRef]
  41. Teng, L.; Jin, M.; Du, J.; Khayat, K.H. Synergetic Effect of Viscosity Modifying Admixtures and Polycarboxylate Ether Superplasticizer on Key Characteristics of Thixotropic UHPC for Bonded Bridge Deck Overlay Rehabilitation. Case Stud. Constr. Mater. 2024, 20, e02739. [Google Scholar] [CrossRef]
  42. Yu, R.; Spiesz, P.; Brouwers, H.J.H. Effect of Nano-Silica on the Hydration and Microstructure Development of Ultra-High Performance Concrete (UHPC) with a Low Binder Amount. Constr. Build. Mater. 2014, 65, 140–150. [Google Scholar] [CrossRef]
  43. Van Tuan, N.; Ye, G.; Van Breugel, K.; Fraaij, A.L.A.; Bui, D.D. The Study of Using Rice Husk Ash to Produce Ultra High Performance Concrete. Constr. Build. Mater. 2011, 25, 2030–2035. [Google Scholar] [CrossRef]
  44. Ahmadi, S.M.; Honarbakhsh, A.; Zhiani, R.; Tavakoli, D. Effects of KCC-1/Ag Nanoparticles on the Mechanical Properties of Concrete. Int. J. Eng. 2022, 35, 1388–1397. [Google Scholar] [CrossRef]
  45. Heidari, A.; Tavakoli, S.; Tavakoli, D. Reusing Waste Ceramic and Waste Sanitary Ware in Concrete as Pozzolans with Nano-Silica and Metakaolin. Int. J. Sustain. Constr. Eng. Technol. 2019, 10, 55–67. [Google Scholar] [CrossRef]
  46. Murugesan, A.; Umapathi, N.; Mohamed Ismail, A.A.; Srinivasan, D. Compatibility Matrix of Superplasticizers in Ultra-High-Performance Concrete for Material Sustainability. Innov. Infrastruct. Solut. 2023, 8, 260. [Google Scholar] [CrossRef]
  47. Ramkumar, K.B.; Kannan Rajkumar, P.R.; Noor Ahmmad, S.; Jegan, M. A Review on Performance of Self-Compacting Concrete—Use of Mineral Admixtures and Steel Fibres with Artificial Neural Network Application. Constr. Build. Mater. 2020, 261, 120215. [Google Scholar] [CrossRef]
  48. Balf, F.R.; Kordkheili, H.M.; Kordkheili, A.M. A New Method for Predicting the Ingredients of Self-Compacting Concrete (SCC) Including Fly Ash (FA) Using Data Envelopment Analysis (DEA). Arab. J. Sci. Eng. 2021, 46, 4439–4460. [Google Scholar] [CrossRef]
  49. Ly, H.-B.; Nguyen, T.-A.; Thi Mai, H.-V.; Tran, V.Q. Development of Deep Neural Network Model to Predict the Compressive Strength of Rubber Concrete. Constr. Build. Mater. 2021, 301, 124081. [Google Scholar] [CrossRef]
  50. Liu, J.C.; Zhang, Z. Neural Network Models to Predict Explosive Spalling of PP Fiber Reinforced Concrete under Heating. J. Build. Eng. 2020, 32, 101472. [Google Scholar] [CrossRef]
  51. Biswas, R.; Kumar, M.; Singh, R.K.; Alzara, M.; El Sayed, S.B.A.; Abdelmongy, M.; Yosri, A.M.; Yousef, S.E.A.S. A Novel Integrated Approach of RUNge Kutta Optimizer and ANN for Estimating Compressive Strength of Self-Compacting Concrete. Case Stud. Constr. Mater. 2023, 18, e02163. [Google Scholar] [CrossRef]
  52. Qayyum Khan, A.; Ahmad Awan, H.; Rasul, M.; Ahmad Siddiqi, Z.; Pimanmas, A. Optimized Artificial Neural Network Model for Accurate Prediction of Compressive Strength of Normal and High Strength Concrete. Clean. Mater. 2023, 10, 100211. [Google Scholar] [CrossRef]
  53. Shafaie, V.; Ghodousian, O.; Ghodousian, A.; Cucuzza, R.; Movahedi Rad, M. Integrating Push-out Test Validation and Fuzzy Logic for Bond Strength Study of Fiber-Reinforced Self-Compacting Concrete. Constr. Build. Mater. 2024, 425, 136062. [Google Scholar] [CrossRef]
  54. Abbas, Y.M.; Iqbal Khan, M. Prediction of Compressive Stress–Strain Behavior of Hybrid Steel–Polyvinyl-Alcohol Fiber Reinforced Concrete Response by Fuzzy-Logic Approach. Constr. Build. Mater. 2023, 379, 131212. [Google Scholar] [CrossRef]
  55. Demir, F. A New Way of Prediction Elastic Modulus of Normal and High Strength Concrete-Fuzzy Logic. Cem. Concr. Res. 2005, 35, 1531–1538. [Google Scholar] [CrossRef]
  56. ASTM C150/C150M-19a; Standard Specification for Portland Cement. ASTM International: West Conshohocken, PA, USA, 2019.
  57. ASTM C1240; Standard Specification for Silica Fume Used in Cementitious Mixtures. ASTM International: West Conshohocken, PA, USA, 2020.
  58. ASTM C778; Standard Specification for Standard Sand. ASTM International: West Conshohocken, PA, USA, 2017.
  59. ASTM C494; Standard Specification for Chemical Admixtures for Concrete. ASTM International: West Conshohocken, PA, USA, 2019.
  60. ASTM C230/230M-21; Standard Specification for Flow Table for Use in Tests of Hydraulic Cement. ASTM International: West Conshohocken, PA, USA, 2021.
  61. ASTM C1437; Standard Test Method for Flow of Hydraulic Cement Mortar. ASTM International: West Conshohocken, PA, USA, 2013.
  62. ASTM C191-08; Standard Test Methods for Time of Setting of Hydraulic Cement by Vicat Needle. ASTM International: West Conshohocken, PA, USA, 2008.
  63. Cardoso, F.A.; John, V.M.; Pileggi, R.G. Rheological Behavior of Mortars under Different Squeezing Rates. Cem. Concr. Res. 2009, 39, 748–753. [Google Scholar] [CrossRef]
  64. ASTM-C642-13; Standard Test Method for Density, Absorption, and Voids in Hardened Concrete. ASTM International: West Conshohocken, PA, USA, 2013.
  65. AASHTO TP 119; Standard Method of Test for Electrical Resistivity of a Concrete Cylinder Tested in a Uniaxial Resistance Test. American Association of State Highway and Transportation Officials: Washington, DC, USA, 2015.
  66. ASTM C109/C109M-20b; Standard Test Method for Compressive Strength of Hydraulic Cement Mortars (Using 2-in. or [50 Mm] Cube Specimens). ASTM International: West Conshohocken, PA, USA, 2020.
  67. ASTM C348-21; Standard Test Method for Flexural Strength of Hydraulic-Cement Mortars. ASTM International: West Conshohocken, PA, USA, 2021.
  68. Ali, K.; Qureshi, M.I.; Saleem, S.; Khan, S.U. Effect of Waste Electronic Plastic and Silica Fume on Mechanical Properties and Thermal Performance of Concrete. Constr. Build. Mater. 2021, 285, 122952. [Google Scholar] [CrossRef]
  69. Sharma, M.; Behera, P.; Saha, S.; Mohanty, T.; Saha, P. Effect of Silica Fume and Red Mud on Mechanical Properties of Ferrochrome Ash Based Concrete. Mater. Today Proc. 2022, 60, 55–61. [Google Scholar] [CrossRef]
  70. Fidjestol, P. ACI 234R-06: Guide for the Use of Silica Fume in Concrete; American Concrete Institute: Mumbai, MH, USA, 2006; Volume 96. [Google Scholar]
  71. Saradar, A.; Rezakhani, Y.; Rahmati, K.; Johari Majd, F.; Mohtasham Moein, M.; Karakouzian, M. Investigating the Properties and Microstructure of High-Performance Cement Composites with Nano-Silica, Silica Fume, and Ultra-Fine TiO2. Innov. Infrastruct. Solut. 2024, 9, 84. [Google Scholar] [CrossRef]
  72. Gleize, P.J.P.; Müller, A.; Roman, H.R. Microstructural Investigation of a Silica Fume-Cement-Lime Mortar. Cem. Concr. Compos. 2003, 25, 171–175. [Google Scholar] [CrossRef]
  73. Jo, B.W.; Chakraborty, S.; Lee, S.T.; Lee, Y.S. Durability Study of Silica Fume-Mortar Exposed to the Combined Sulfate and Chloride-Rich Solution. KSCE J. Civ. Eng. 2019, 23, 356–366. [Google Scholar] [CrossRef]
  74. Bahrami, N.; Zohrabi, M.; Mahmoudy, S.A.; Akbari, M. Optimum Recycled Concrete Aggregate and Micro-Silica Content in Self-Compacting Concrete: Rheological, Mechanical and Microstructural Properties. J. Build. Eng. 2020, 31, 101361. [Google Scholar] [CrossRef]
  75. Sadrmomtazi, A.; Langeroudi, M.A.M.; Fasihi, A.; Haghi, A.K. An Investigation on Effect of Using PP Fibers and Different Cementitious Materials on Mechanical Properties of EPS Concrete. In Proceedings of the 3rd International Conference on Concrete and Development, Tehrant, Iran, 27–29 April 2009. [Google Scholar]
  76. Huynh, P.T.; Bui, P.T.; Ogawa, Y.; Kawai, K. Effect of Water-to-Binder Ratio on Cementing Efficiency Factor of Fly Ash Regarding Compressive Strength of Concrete. In ICSCEA 2019: Proceedings of the International Conference on Sustainable Civil Engineering and Architecture; Lecture Notes in Civil Engineering; Springer: Singapore, 2020; Volume 80. [Google Scholar]
  77. Melo, K.A.; Repette, W.L. Optimization of Superplasticizer Content in Self-Compacting Concrete. In Measuring, Monitoring and Modeling Concrete Properties; Springer: Dordrecht, The Netherlands, 2007. [Google Scholar]
  78. Kawai, T.; Okada, T. Effect of Superplasticizer and Viscosity-Increasing Admixture on Properties of Lightweight Aggregate Concrete; ACI Special Publication; American Concrete Institute: Farmington Hills, MI, USA, 1989; Volume SP-119. [Google Scholar]
  79. Zhang, G.; Wang, S.; Wang, B.; Zhao, Y.; Kang, M.; Wang, P. Properties of Pervious Concrete with Steel Slag as Aggregates and Different Mineral Admixtures as Binders. Constr. Build. Mater. 2020, 257, 119543. [Google Scholar] [CrossRef]
  80. Wang, G.; Kong, Y.; Sun, T.; Shui, Z. Effect of Water-Binder Ratio and Fly Ash on the Homogeneity of Concrete. Constr. Build. Mater. 2013, 38, 1129–1134. [Google Scholar] [CrossRef]
  81. Verma, M.; Dev, N. Effect of Liquid to Binder Ratio and Curing Temperature on the Engineering Properties of the Geopolymer Concrete. Silicon 2022, 14, 1743–1757. [Google Scholar] [CrossRef]
  82. Xun, W.; Wu, C.; Leng, X.; Li, J.; Xin, D.; Li, Y. Effect of Functional Superplasticizers on Concrete Strength and Pore Structure. Appl. Sci. 2020, 10, 3496. [Google Scholar] [CrossRef]
  83. Yousuf, F.; Wei, X.; Tao, J. Evaluation of the Influence of a Superplasticizer on the Hydration of Varying Composition Cements by the Electrical Resistivity Measurement Method. Constr. Build. Mater. 2017, 144, 25–34. [Google Scholar] [CrossRef]
  84. Ma, B.; Ma, M.; Shen, X.; Li, X.; Wu, X. Compatibility between a Polycarboxylate Superplasticizer and the Belite-Rich Sulfoaluminate Cement: Setting Time and the Hydration Properties. Constr. Build. Mater. 2014, 51, 47–54. [Google Scholar] [CrossRef]
  85. Min, B.H.; Erwin, L.; Jennings, H.M. Rheological Behaviour of Fresh Cement Paste as Measured by Squeeze Flow. J. Mater. Sci. 1994, 29, 1374–1381. [Google Scholar] [CrossRef]
  86. Lai, M.H.; Binhowimal, S.A.M.; Hanzic, L.; Wang, Q.; Ho, J.C.M. Dilatancy Mitigation of Cement Powder Paste by Pozzolanic and Inert Fillers. Struct. Concr. 2020, 21, 1164–1180. [Google Scholar] [CrossRef]
  87. Lai, M.H.; Lao, W.C.; Tang, W.K.; Hanzic, L.; Wang, Q.; Ho, J.C.M. Dilatancy Swerve in Superplasticized Cement Powder Paste. Constr. Build. Mater. 2023, 362, 129524. [Google Scholar] [CrossRef]
  88. Daukšys, M.; Skripkiunas, G. Investigation of Dilatancy Mechanism of Portland Cement Paste. Constr. Build. Mater. 2015, 83, 53–61. [Google Scholar] [CrossRef]
  89. Medeiros, R.A.; Lima, M.G. Electrical Resistivity of Unsaturated Concrete Using Different Types of Cement. Constr. Build. Mater. 2016, 107, 11–16. [Google Scholar] [CrossRef]
  90. Faraj, R.H.; Ahmed, H.U.; Rafiq, S.; Sor, N.H.; Ibrahim, D.F.; Qaidi, S.M.A. Performance of Self-Compacting Mortars Modified with Nanoparticles: A Systematic Review and Modeling. Clean. Mater. 2022, 4, 100086. [Google Scholar] [CrossRef]
  91. Cosoli, G.; Mobili, A.; Tittarelli, F.; Revel, G.M.; Chiariotti, P. Electrical Resistivity and Electrical Impedance Measurement in Mortar and Concrete Elements: A Systematic Review. Appl. Sci. 2020, 10, 9152. [Google Scholar] [CrossRef]
  92. Pourahmadi, H.; Arabani, S.; Sadrmomtazi, A.; Langaroudi, M.A.M.; Khoshkbijari, R.K.; Amooie, M. Durability of Self-Compacting Lightweight Aggregate Concretes (LWSCC) as Repair Overlays ARTICLE INFO ABSTRACT. J. Rehabil. Civ. Eng. 2017, 5, 101–113. [Google Scholar]
  93. Sadrinejad, I.; Madandoust, R.; Ranjbar, M.M. The Mechanical and Durability Properties of Concrete Containing Hybrid Synthetic Fibers. Constr. Build. Mater. 2018, 178, 72–82. [Google Scholar] [CrossRef]
  94. AlHassan, M.K.; Nasser, M.S.; Onaizi, S.A.; Hussein, I.A.; Hassan, M.K. Production of High-Performance Concrete through the Addition of New Generation of Superplasticizers: A Comprehensive Review on the Electrokinetics and Rheological Behaviors. Emergent Mater. 2023, 7, 403–441. [Google Scholar] [CrossRef]
  95. Liao, Y.; Wei, X. Penetration Resistance and Electrical Resistivity of Cement Paste with Superplasticizer. Mater. Struct. 2014, 47, 563–570. [Google Scholar] [CrossRef]
  96. Toutanji, H.A.; El-Korchi, T. The Influence of Silica Fume on the Compressive Strength of Cement Paste and Mortar. Cem. Concr. Res. 1995, 25, 1591–1602. [Google Scholar] [CrossRef]
  97. Shafieyzadeh, M. Prediction of Flexural Strength of Concretes Containing Silica Fume and Styrene-Butadiene Rubber (SBR) with an Empirical Model. J. Inst. Eng. (India) Ser. A 2015, 96, 349–355. [Google Scholar] [CrossRef]
  98. Beshkari, M.; Amani, B.; Rahmati, K.; Mohtasham Moein, M.; Saradar, A.; Karakouzian, M. Synergistic Effects of Pozzolan and Carbon Fibers on the Performance of Self-Consolidating Concrete under Plastic Shrinkage and Dynamic Loading. Innov. Infrastruct. Solut. 2024, 9, 160. [Google Scholar] [CrossRef]
  99. He, T.; Xiang, W.; Zhang, J.; Hu, C.; Zhang, G.; Kou, B. Influence of Water-Binder Ratio on the Mechanical Strength and Microstructure of Arch Shell Interface Transition Zone. Buildings 2022, 12, 491. [Google Scholar] [CrossRef]
  100. Yang, Y.; Gao, X.; Deng, H.; Yu, P.; Yao, Y. Effects of Water/Binder Ratio on the Properties of Engineered Cementitious Composites. J. Wuhan. Univ. Technol. Mater. Sci. Ed. 2010, 25, 298–302. [Google Scholar] [CrossRef]
  101. Gagné, R.; Boisvert, A.; Pigeon, M. Effect of Superplasticizer Dosage on Mechanical Properties, Permeability, and Freeze-Thaw Durability of High-Strength Concretes with and without Silica Fume. ACI Mater. J. 1996, 93, 111–120. [Google Scholar] [CrossRef]
  102. Adebanjo, A.U.; Shafiq, N.; Razak, S.N.A.; Kumar, V.; Farhan, S.A.; Singh, P.; Abubakar, A.S. Design and Modeling the Compressive Strength of High-Performance Concrete with Silica Fume: A Soft Computing Approach. Soft Comput. 2023, 28, 6059–6083. [Google Scholar] [CrossRef]
  103. Eren, Ö.; Çelik, T. Effect of Silica Fume and Steel Fibers on Some Properties of High-Strength Concrete. Constr. Build. Mater. 1997, 11, 373–382. [Google Scholar] [CrossRef]
  104. Nabighods, K.; Saradar, A.; Mohtasham Moein, M.; Mirgozar Langaroudi, M.A.; Byzyka, J.; Karakouzian, M. Evaluation of Self-Compacting Concrete Containing Pozzolan (Zeolite, Metakaolin & Silica Fume) and Polypropylene Fiber against Sulfate Attacks with Different PH: An Experimental Study. Innov. Infrastruct. Solut. 2023, 9, 1. [Google Scholar] [CrossRef]
  105. Mousavinejad, S.H.G.; Saradar, A.; Jabbari, M.; Moein, M.M. Evaluation of Fresh and Hardened Properties of Self-Compacting Concrete Containing Different Percentages of Waste Tiles. J. Build. Pathol. Rehabil. 2023, 8, 81. [Google Scholar] [CrossRef]
  106. Xiaofeng, C.; Shanglong, G.; Darwin, D.; McCabe, S.L. Role of Silica Fume in Compressive Strength of Cement Paste, Mortar, and Concrete. ACI Mater. J. 1992, 89, 375–387. [Google Scholar] [CrossRef]
  107. Yogendran, V.; Langan, B.W.; Haque, M.N.; Ward, M.A. Silica Fume in High-Strength Concrete. ACI Mater. J. 1987, 84, 124–129. [Google Scholar] [CrossRef]
  108. Zareei, S.A.; Ameri, F.; Shoaei, P.; Bahrami, N. Recycled Ceramic Waste High Strength Concrete Containing Wollastonite Particles and Micro-Silica: A Comprehensive Experimental Study. Constr. Build. Mater. 2019, 201, 11–32. [Google Scholar] [CrossRef]
  109. Burhan, L.; Ghafor, K.; Mohammed, A. Modeling the Effect of Silica Fume on the Compressive, Tensile Strengths and Durability of NSC and HSC in Various Strength Ranges. J. Build. Pathol. Rehabil. 2019, 4, 19. [Google Scholar] [CrossRef]
  110. Govin, A.; Bartholin, M.C.; Schmidt, W.; Grosseau, P. Combination of Superplasticizers with Hydroxypropyl Guar, Effect on Cement-Paste Properties. Constr. Build. Mater. 2019, 215, 595–604. [Google Scholar] [CrossRef]
  111. Matias, D.; De Brito, J.; Rosa, A.; Pedro, D. Mechanical Properties of Concrete Produced with Recycled Coarse Aggregates—Influence of the Use of Superplasticizers. Constr. Build. Mater. 2013, 44, 101–109. [Google Scholar] [CrossRef]
  112. Shi, C.; He, T.S.; Zhang, G.; Wang, X.; Hu, Y. Effects of Superplasticizers on Carbonation Resistance of Concrete. Constr. Build. Mater. 2016, 108, 48–55. [Google Scholar] [CrossRef]
  113. Malhotra, V.M. Effect of Repeated Dosages of Superplasticizers on Slump, Strength and Freeze-Thaw Resistance of Concrete. Matériaux Constr. 1981, 14, 79–89. [Google Scholar] [CrossRef]
Figure 1. Types of superplasticizers based on chemical structure.
Applsci 15 05133 g001
Figure 2. Structure of ANN and FL. (a) Artificial Neural Network. (b) Fuzzy Logic.
Applsci 15 05133 g002
Figure 3. Methodology.
Applsci 15 05133 g003
Figure 4. The squeezing test: (a) filling the ring mold, (b) removing the mold, (c) squeezing a high-viscosity mixture, and (d) squeezing a low-viscosity mixture.
Applsci 15 05133 g004
Figure 5. Architecture of ANN models for prediction of compressive strength (7 and 28 days).
Applsci 15 05133 g005
Figure 6. Displaying inputs and outputs in the FL model.
Applsci 15 05133 g006
Figure 7. Slump flow test results for series 1, 2, and 3 mixtures.
Applsci 15 05133 g007
Figure 8. Vicat needle test (setting time) results for series 1 mixtures.
Applsci 15 05133 g008
Figure 9. Different stages of the load–displacement curve under the squeezing test.
Applsci 15 05133 g009
Figure 10. Load–displacement curves for the squeeze flow test—checking the effect of w/b: (a) series 1; (b) series 2.
Applsci 15 05133 g010
Figure 11. Load–displacement curves for the squeeze flow test—checking the effect of SNF: (a) Series 1; (b) Series 2.
Applsci 15 05133 g011
Figure 12. Results of electrical resistivity for series 1, 2, and 3 mixtures.
Applsci 15 05133 g012
Figure 13. Mechanism of high-dose SF in UHPC.
Applsci 15 05133 g013
Figure 14. Results of flexural strength (28 days): (a) effect of SF; (b) effect of w/b and SNF.
Applsci 15 05133 g014
Figure 15. Flexural strength under the influence of (a) changes in the w/b ratio; (b) changes in the dosage of SNF.
Applsci 15 05133 g015
Figure 16. Results of compressive strength (7 and 28 days): (a) effect of SF; (b) effect of w/b ratio and SNF.
Applsci 15 05133 g016
Figure 17. Compressive strength under the influence of (a) changes in the w/b ratio; (b) changes in the dosage of SNF.
Applsci 15 05133 g017
Figure 18. Comparison of compressive strength results from prediction models (ANN and FL) and actual testing: (a) 7 days; (b) 28 days.
Applsci 15 05133 g018
Figure 19. Prediction error by ANN and FL models compared to reality: (a) 7 days; (b) 28 days.
Applsci 15 05133 g019
Figure 20. Performance of the artificial neural network (ANN) model based on (a) training, (b) validation, (c) test, and (d) all datasets.
Applsci 15 05133 g020
Table 1. Chemical and physical characteristics of the cement.
Chemical PropertiesPhysical Properties
SiO221.27Compressive strength
(MPa)
3 days20.1
Al2O31.127 days28.2
Fe2O34.0328 days40.3
CaO62.95Setting time (min)Initial154
MgO1.55Final195
SO32.26Longitudinal expansion 1.5 mm-0.08%
Na2O0.49
K2O0.65Specific surface
(cm2/gr)
2910
C3A6.30
Table 2. Chemical and physical characteristics of the silica fume.
Chemical PropertiesPhysical Properties
SiO289.26Physical stateamorphous
Al2O34.95
Fe2O31.8Particle size (typical)<1 µm
CaO0.87
MgO1.1ColorLight gray
Na2O0.5
K2O0.66Specific surface (cm2/gr)21,000
Table 3. Sand grading.
Sieve SizeASTM C778 [58]This Study
mmNo.
1.1816100100
0.63010096–100
0.4254067.565–75
0.3502820–30
0.151003.50–4
Table 4. Specifications of superplasticizer.
Technical Features
Generation 2
Physical StateLiquid
ColorBrown
Specific weight1.2 ± 0.02 kg/lit
PH8 ± 1
Chlorides (PPM)500 max
Chemical BaseModified sodium naphthalene sulfonate compounds
Table 5. UHPC mix designs.
Mix No.GroupDesign CodeCementSilica FumeWaterw/bS.P.AggregateDry Unit Weight (kg/m3)Final Water Absorption (%Wt.)
(kg/m3)%
N1A1-SF15WB20N08696104151600.26.4147920833.42
N21-SF20WB20N08667133201600.26.4146320743.24
N31-SF25WB20N08640160251600.26.4144820642.99
N42-SF15WB20N08783117151800.27.2133320673.47
N52-SF20WB20N08750150201800.27.2131520513.15
N62-SF25WB20N08720180251800.27.2129820422.82
N73-SF15WB20N08870131152000.28.0118520453.21
N83-SF20WB20N08833167202000.28.0116620243.26
N93-SF15WB20N08800200252000.28.0114820152.88
N10B1-SF15WB18N08696104151440.26.4152221143.02
N111-SF15WB22N08696104151760.26.4143720653.64
N121-SF15WB20N07696104151600.25.6148120973.51
N131-SF15WB20N09696104151600.27.2147720903.31
N142-SF20WB18N08750150201620.27.2136220813.03
N152-SF20WB22N08750150201980.27.2126720263.23
N162-SF20WB20N07750150201800.26.3131720543.23
N172-SF20WB20N09750150201800.28.1131220513.1
N183-SF15WB18N08870131151800.28.0123820533.33
N193-SF15WB22N08870131152200.28.0113220063.29
N203-SF15WB20N07870131152000.27.0118820283.37
N213-SF15WB20N09870131152000.29.0118320263.09
Note: A = silica fume optimization; B = SNF and w/b ratio study; and 1, 2, 3 = binder content (800, 900, and 1000 kg/m3).
Table 7. Characteristics of the independent and dependent variables.
Independent variables (kg/m3)
Min.Max.Averg.SD.
Cement (C)64087076375.3
Silica fume (SF)104200137.2426.58
Water (W)14422018019.44
Sulphonated naphthalene formaldehyde (SNF)697.20.832
Dependent variables (MPa)
MinMaxAverg.SD.
Compressive strength—7 days52.0881.6070.7629.1
Compressive strength—28 days115.07145.44132.059.13
Table 8. Range of input and output values and corresponding linguistic gradation.
InputFuzzy MFRange
Cement (kg/m3)“L” (Low)635–732
“M” (Medium)686–824
“H” (High)778–890
Silica fume (kg/m3)“L” (Low)140–174
“M” (Medium)159–212
“H” (High)193–225
Water (kg/m3)“L” (Low)140–174
“M” (Medium)159–212
“H” (High)193–225
NSF (kg/m3)“L” (Low)4.5–7.1
“M” (Medium)6.6–8.4
“H” (High)7.8–9.5
OutputFuzzy MFRange
Compressive strength (MPa)—7 Days“L” (Low)45–60
“M” (Medium)57–68
“H” (High)65–77
“V.H” (Very High)74–90
Compressive strength (MPa)—28 Days“L” (Low)110–123
“M” (Medium)120–132
“H” (High)128–141
“V.H” (Very High)136–150
Disclaimer/Publisher’s Note: The statements, opinions and data contained in all publications are solely those of the individual author(s) and contributor(s) and not of MDPI and/or the editor(s). MDPI and/or the editor(s) disclaim responsibility for any injury to people or property resulting from any ideas, methods, instructions or products referred to in the content.