
Towards Industrial Implementation: Experimental Campaign Based on Variations in Temperature, Humidity, and CO2 Concentration in Forced Carbonation Reactions of Recycled Aggregates

 ,
,  ,
,  ,
,  , and
, and
Abstract
:1. Introduction
2. Materials and Methodology
2.1. Materials

| Waste | Rc (%) | Ru (%) | Rb (%) | Ra (%) | Rg (%) | X (%) | Fl (%) | Classification According to EN 933-11 [24]—[25] * (as per the Results Obtained in Laboratory) |
|---|---|---|---|---|---|---|---|---|
| MRA-RP1 | 42.5 | 27.5 | 21.7 | 9.6 | 0.2 | 0.8 | Fl5- | Rc declared Rcug70 Rb30- Ra10- Rg2- X1- Fl5- |
| MRA-RP2 | 61.5 | 26.7 | 9.2 | 0.2 | 0.0 | 2.4 | Fl5- | Rc50 Rg2- Rcug70 Rb10- Ra1- X1- Fl5- |
| MRA-RP3 | 37.4 | 16.3 | 26.6 | 6.2 | 6.9 | 6.7 | Fl5- | Rc declared Rg2- Rcug70 Rb 30- Ra1- X1- Fl5- |
| RCA-RP1 | 57.8 | 28.4 | 12.4 | 0.0 | 0.2 | 0.4 | Fl5- | Rc50 Rg2- Rcug70 Rb30- Ra1- X1- Fl5- |
| RCA-RP2 | 89.0 | 10.6 | 0.4 | 0.0 | 0.0 | 0.0 | Fl5- | Rc70 Rcug90 Rb10- Ra1- Rg2- X1- Fl5- |
| RCA-IW | 90.4 | 9.6 | 0.0 | 0.0 | 0.0 | 0.0 | Fl5- | Rc90 Rcug90 Rb10- Ra1- Rg2- X1- Fl5- |
| CA-L | 90.7 | 9.3 | 0.0 | 0.0 | 0.0 | 0.0 | Fl5- | Rc90 Rcug90 Rb10- Ra1- Rg2- X1- Fl5- |
| Identified Minerals | MRA-RP1 | MRA-RP2 | MRA-RP3 | RCA-RP1 | RCA-RP2 | RCA-IW | CA-L |
|---|---|---|---|---|---|---|---|
| Muscovite | + | + | + | + | + | + | n.d. |
| Ettringite | n.d. | n.d. | + | + | + | + | n.d. |
| Gypsum | + | n.d. | + | + | + | + | + |
| Kaolinite | + | + | + | + | + | + | n.d. |
| Microcline | ++ | ++ | ++ | ++ | ++ | ++ | + |
| Albite | ++ | ++ | ++ | + | ++ | + | n.d. |
| Quartz | +++ | +++ | +++ | +++ | +++ | +++ | +++ |
| Calcite | +++ | +++ | +++ | +++ | +++ | +++ | +++ |
| Hydrocalumite | n.d. | n.d. | n.d. | + | n.d. | + | n.d. |
| Portlandite | n.d. | n.d. | n.d. | ++ | + | ++ | + |
| RA Type | Designation | Portlandite Content (%) | Cement Paste Content (%) | Origin (Collected at) |
|---|---|---|---|---|
| Mixed recycled aggregate (MRA) | MRA-RP1 | 0 | 5.7 | Recycling plant |
| MRA-RP2 | 0 | 8.3 | Recycling plant | |
| MRA-RP3 | 0 | 5.0 | Recycling plant | |
| Recycled concrete aggregate (RCA) | RCA-IW1 | 2.1 | 12.2 | Concrete producer |
| RCA-RP1 | 0.1 | 7.8 | Recycling plant | |
| RCA-RP2 | 0.4 | 12.0 | Recycling plant | |
| Control concrete aggregate (CA) | CA-L | 0.6 | 12.2 | Concrete produced in laboratory |
2.2. Methodology
3. Influencing Parameters on CO2 Capture by RA
3.1. Effect of Temperature (23 °C, 40 °C, and 60 °C)
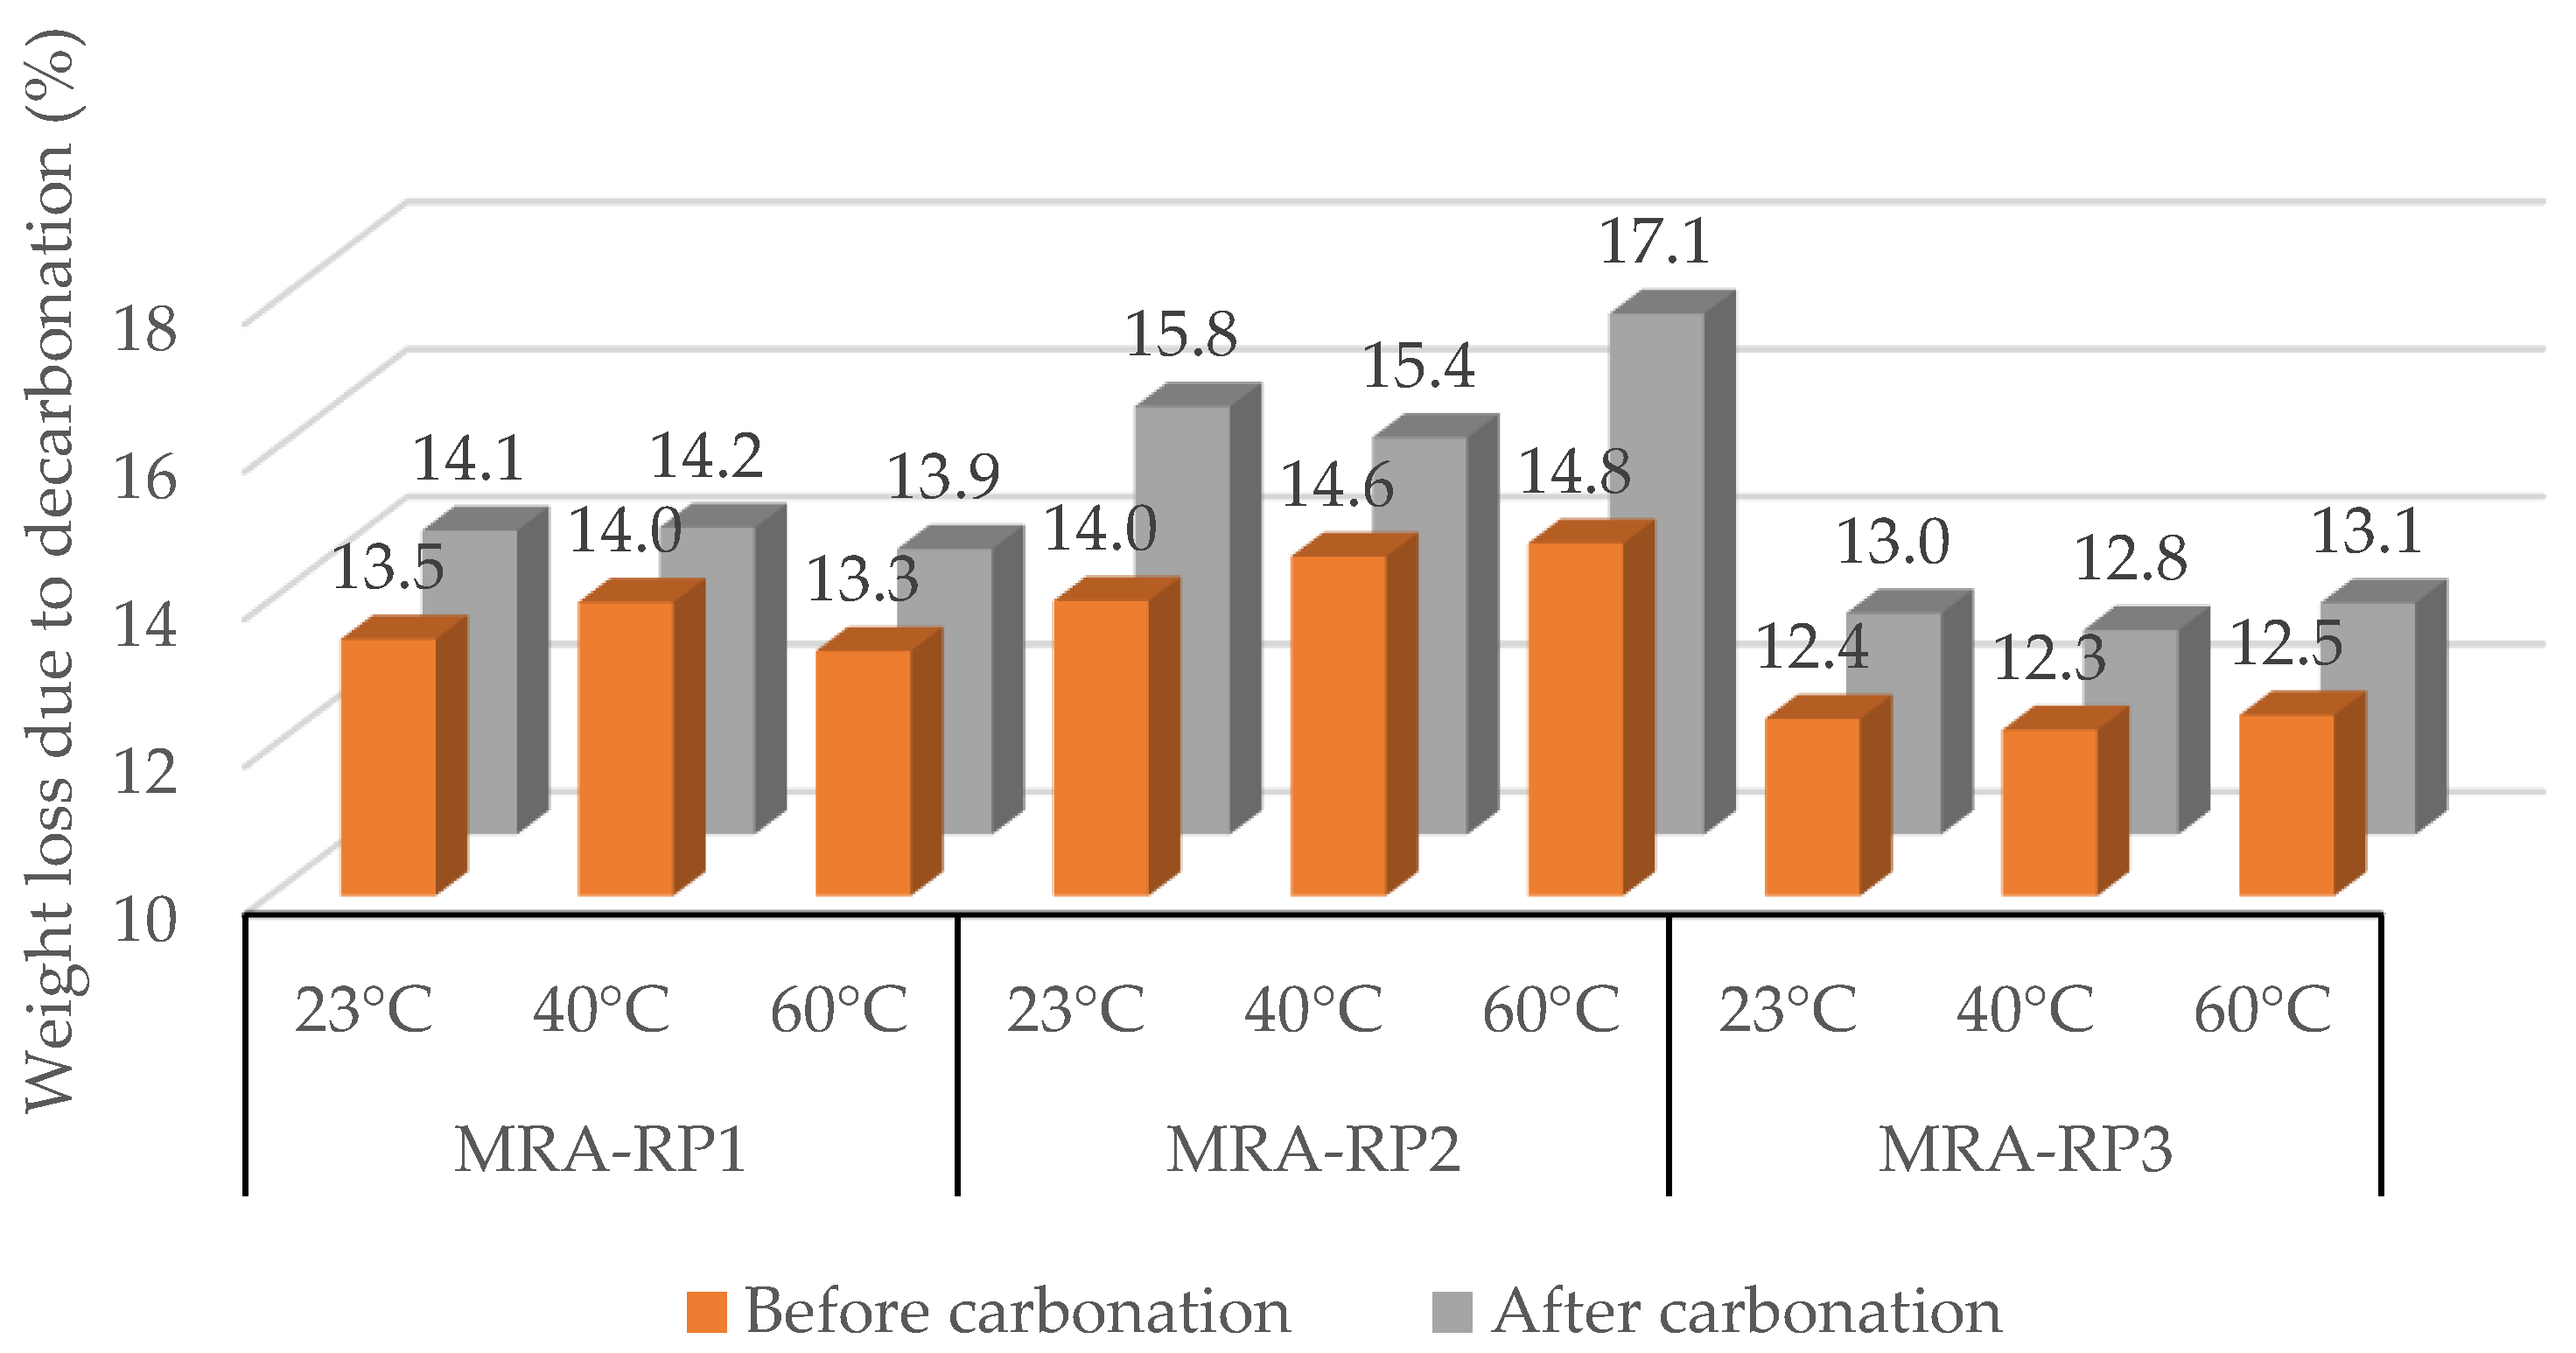
3.1.1. Mixed Recycled Aggregates (MRAs)
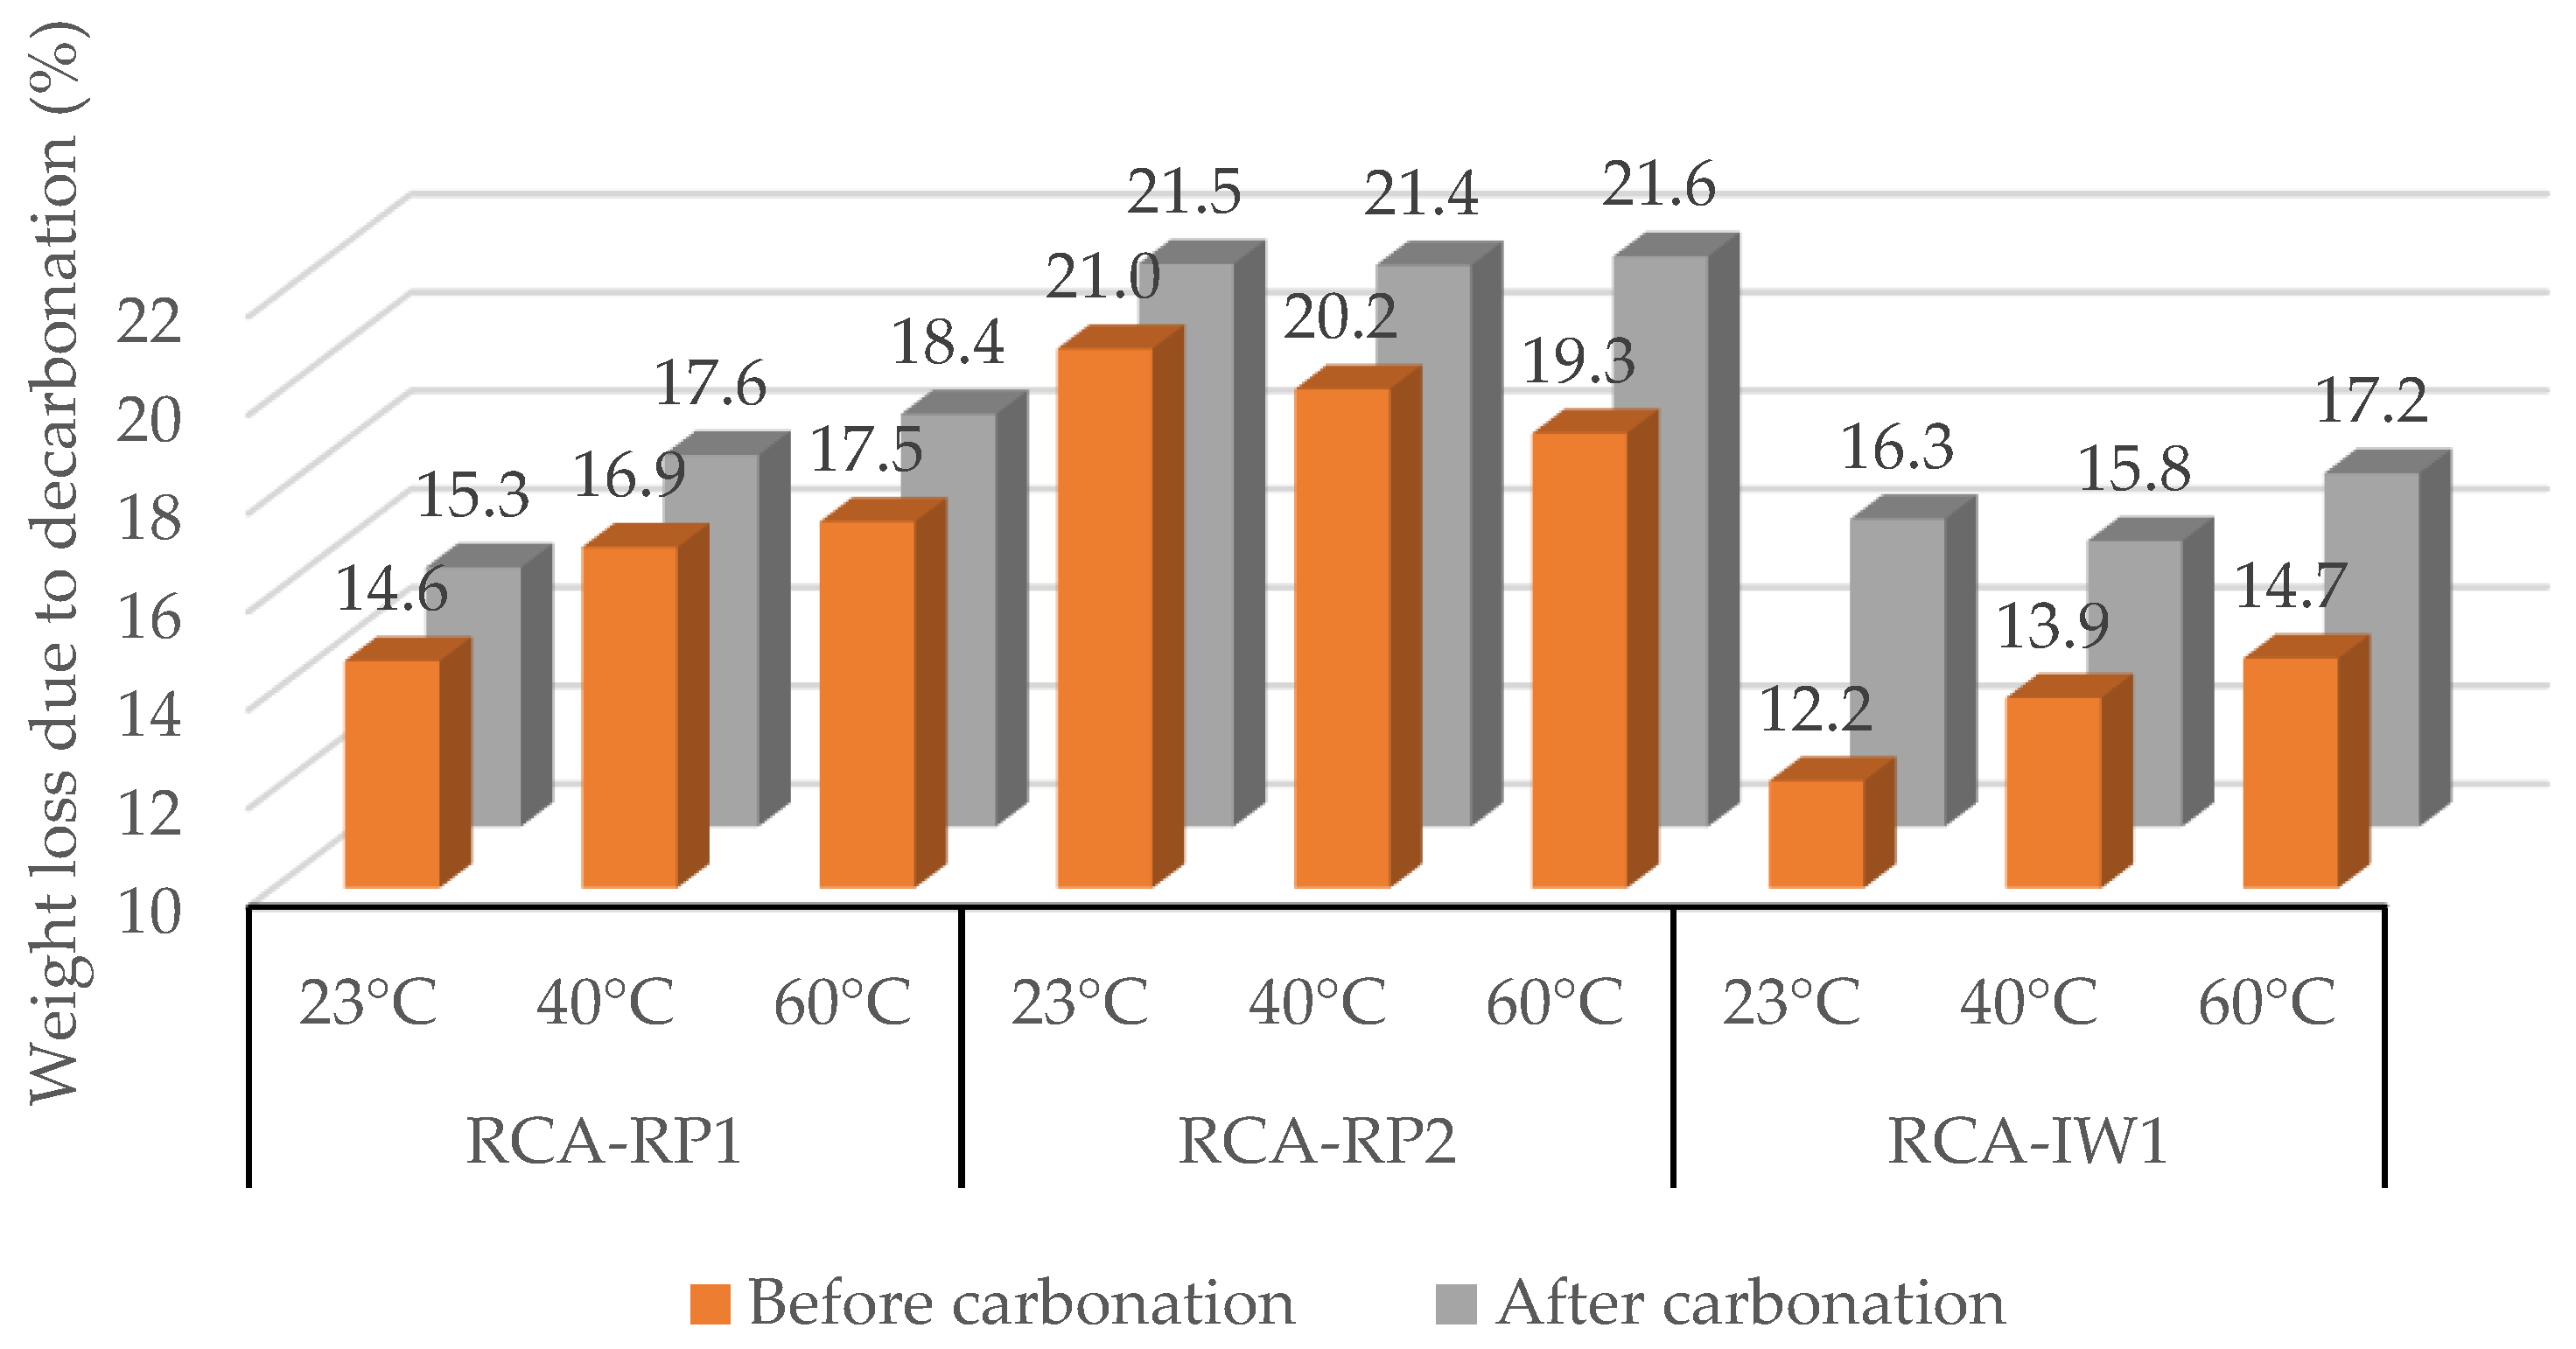
3.1.2. Recycled Concrete Aggregates (RCAs)
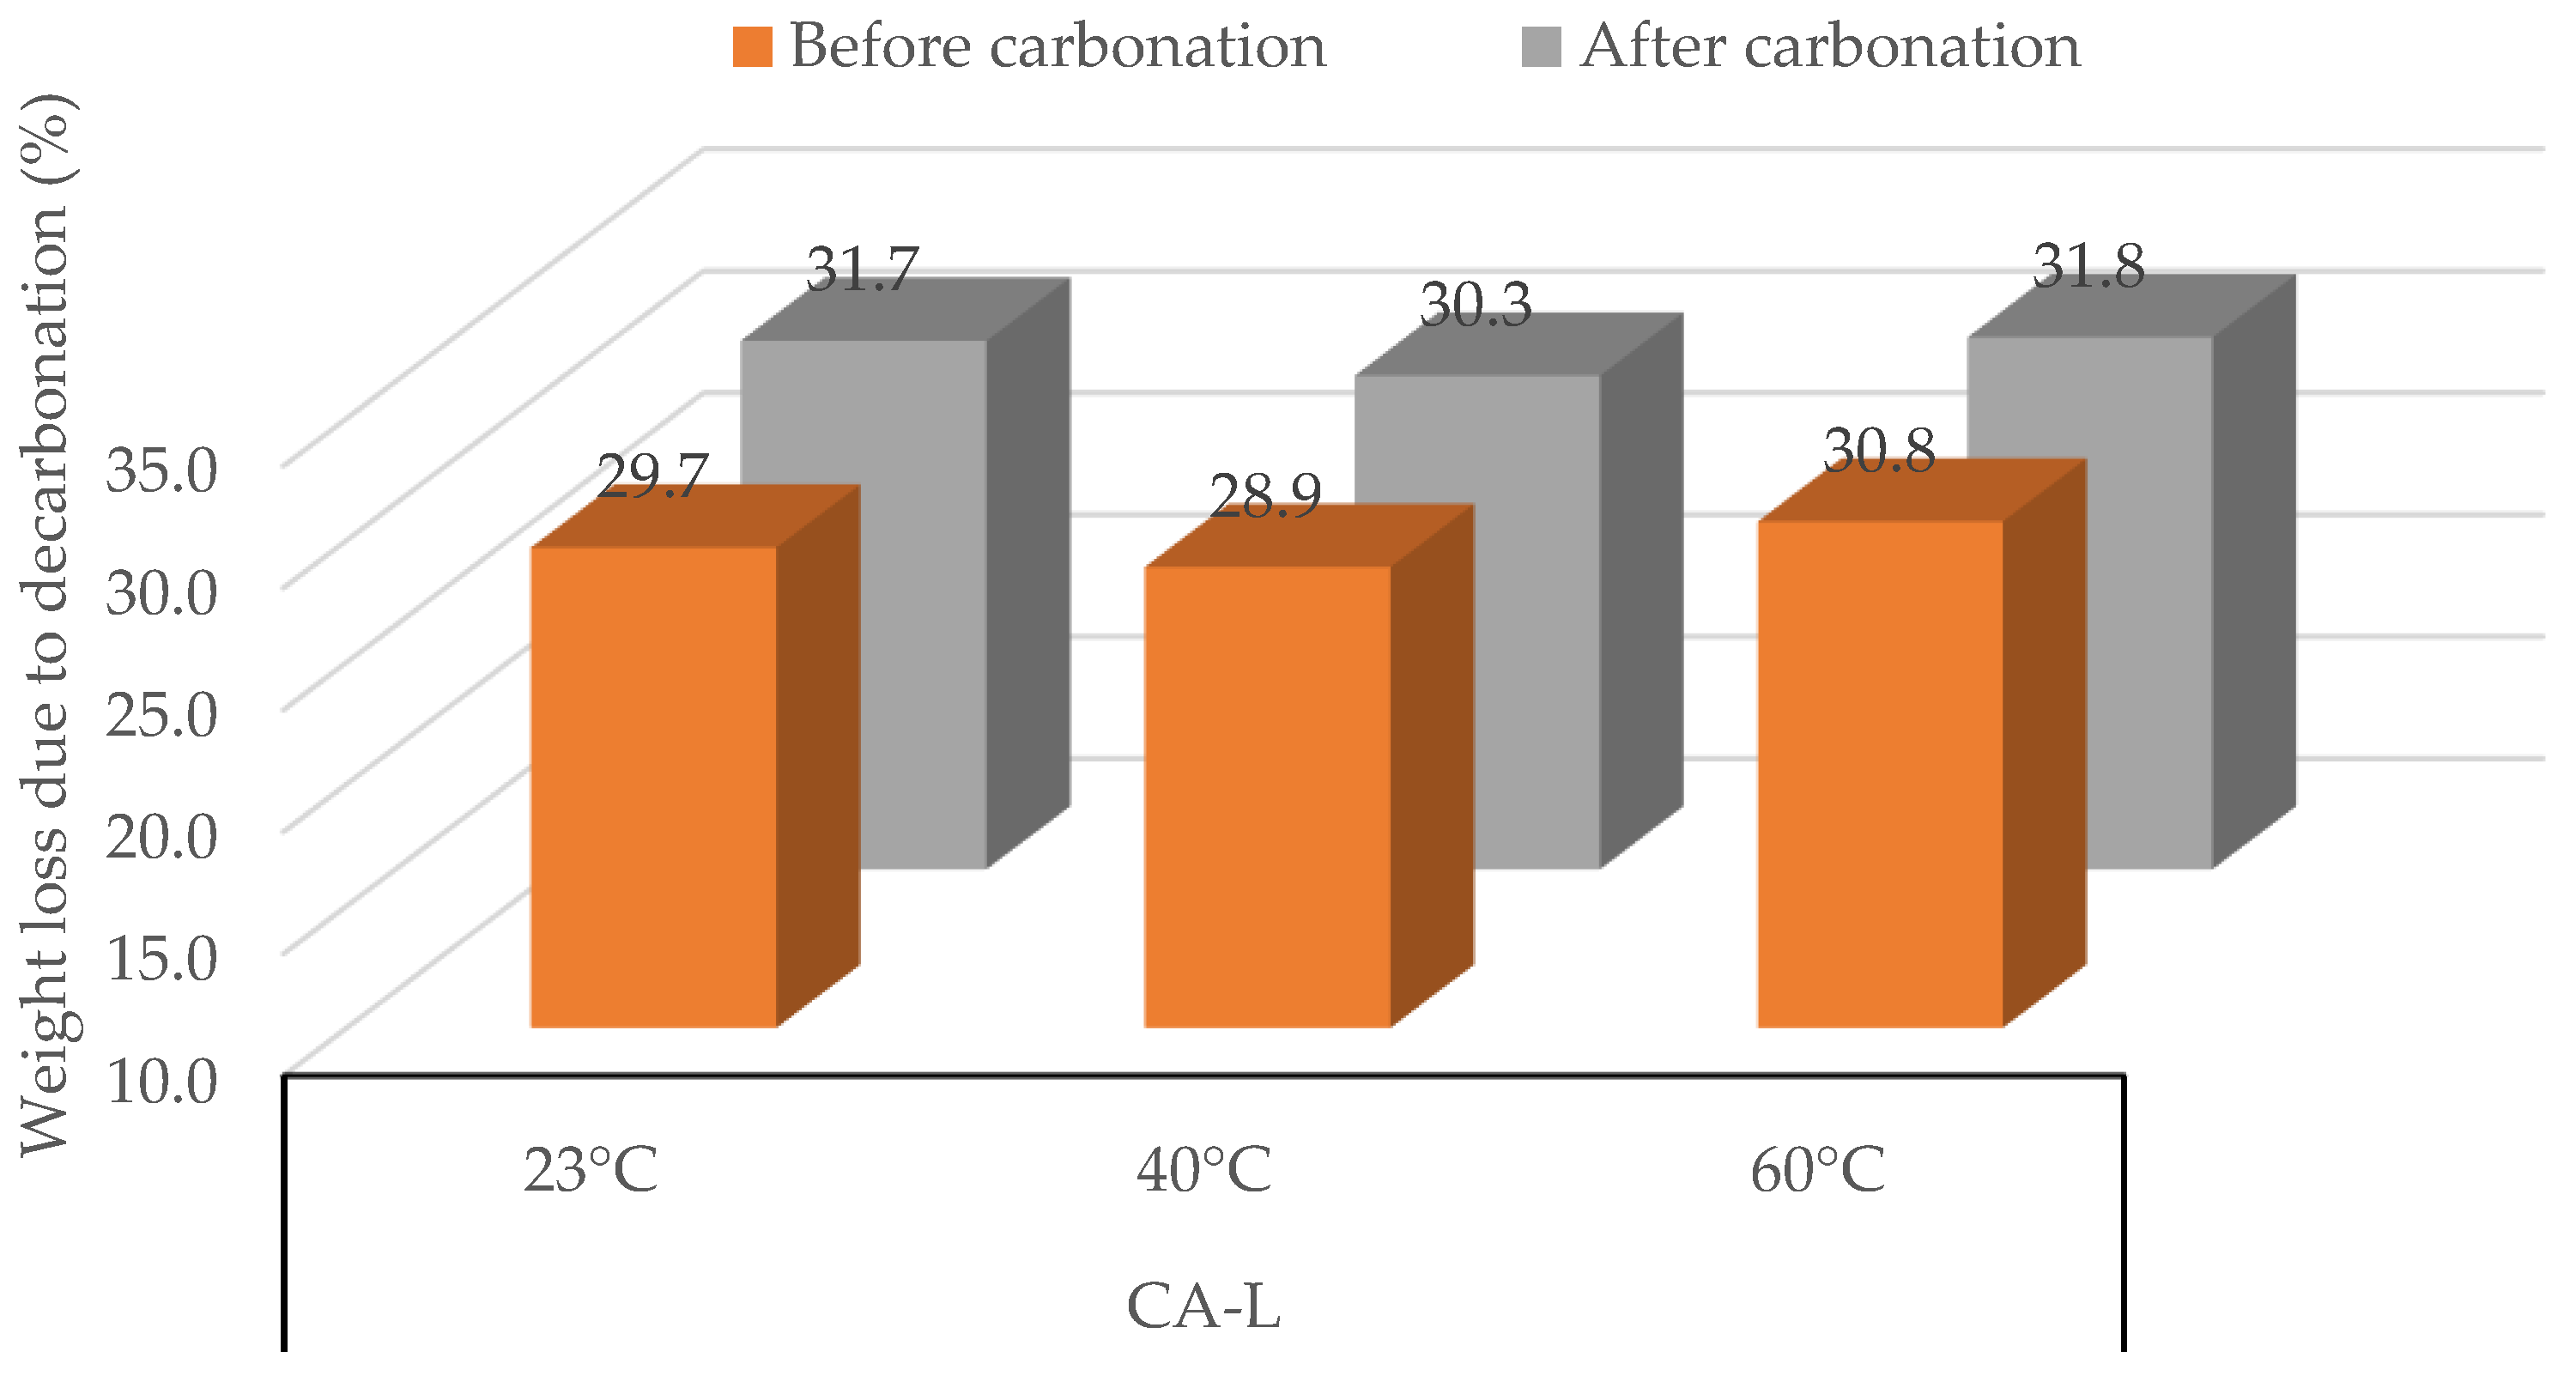
3.1.3. Concrete Aggregate (CA-L)
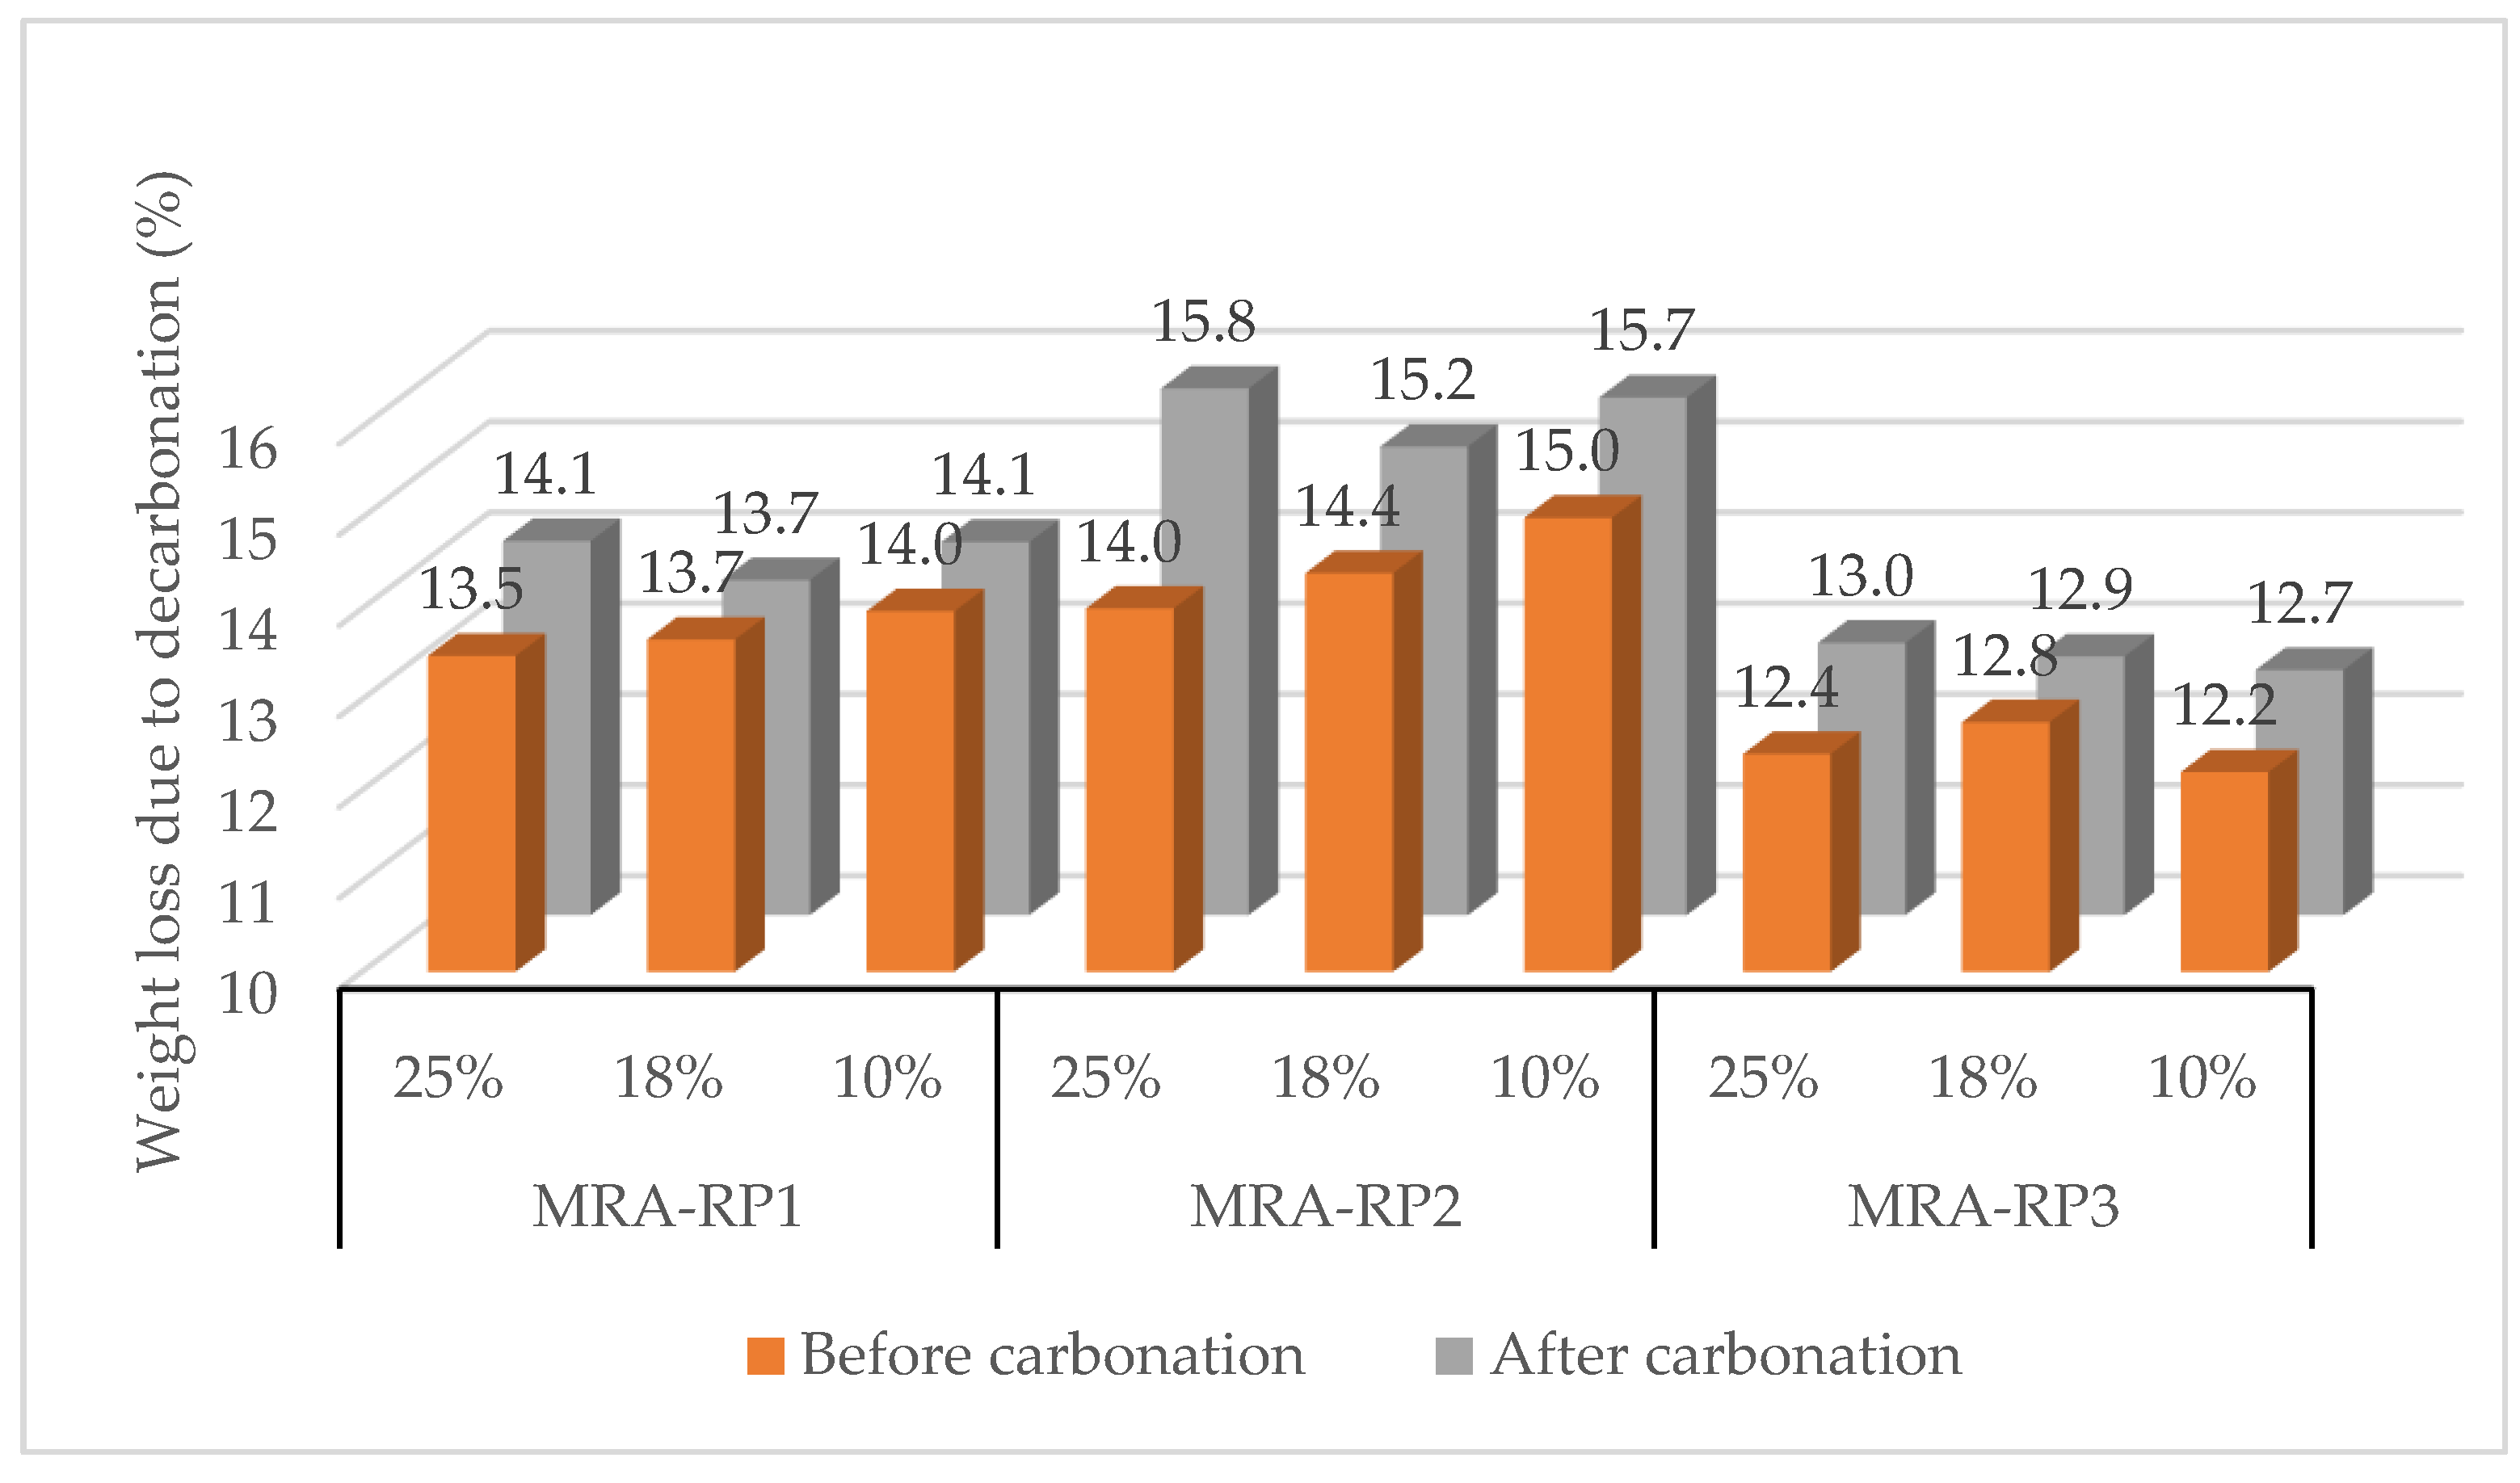
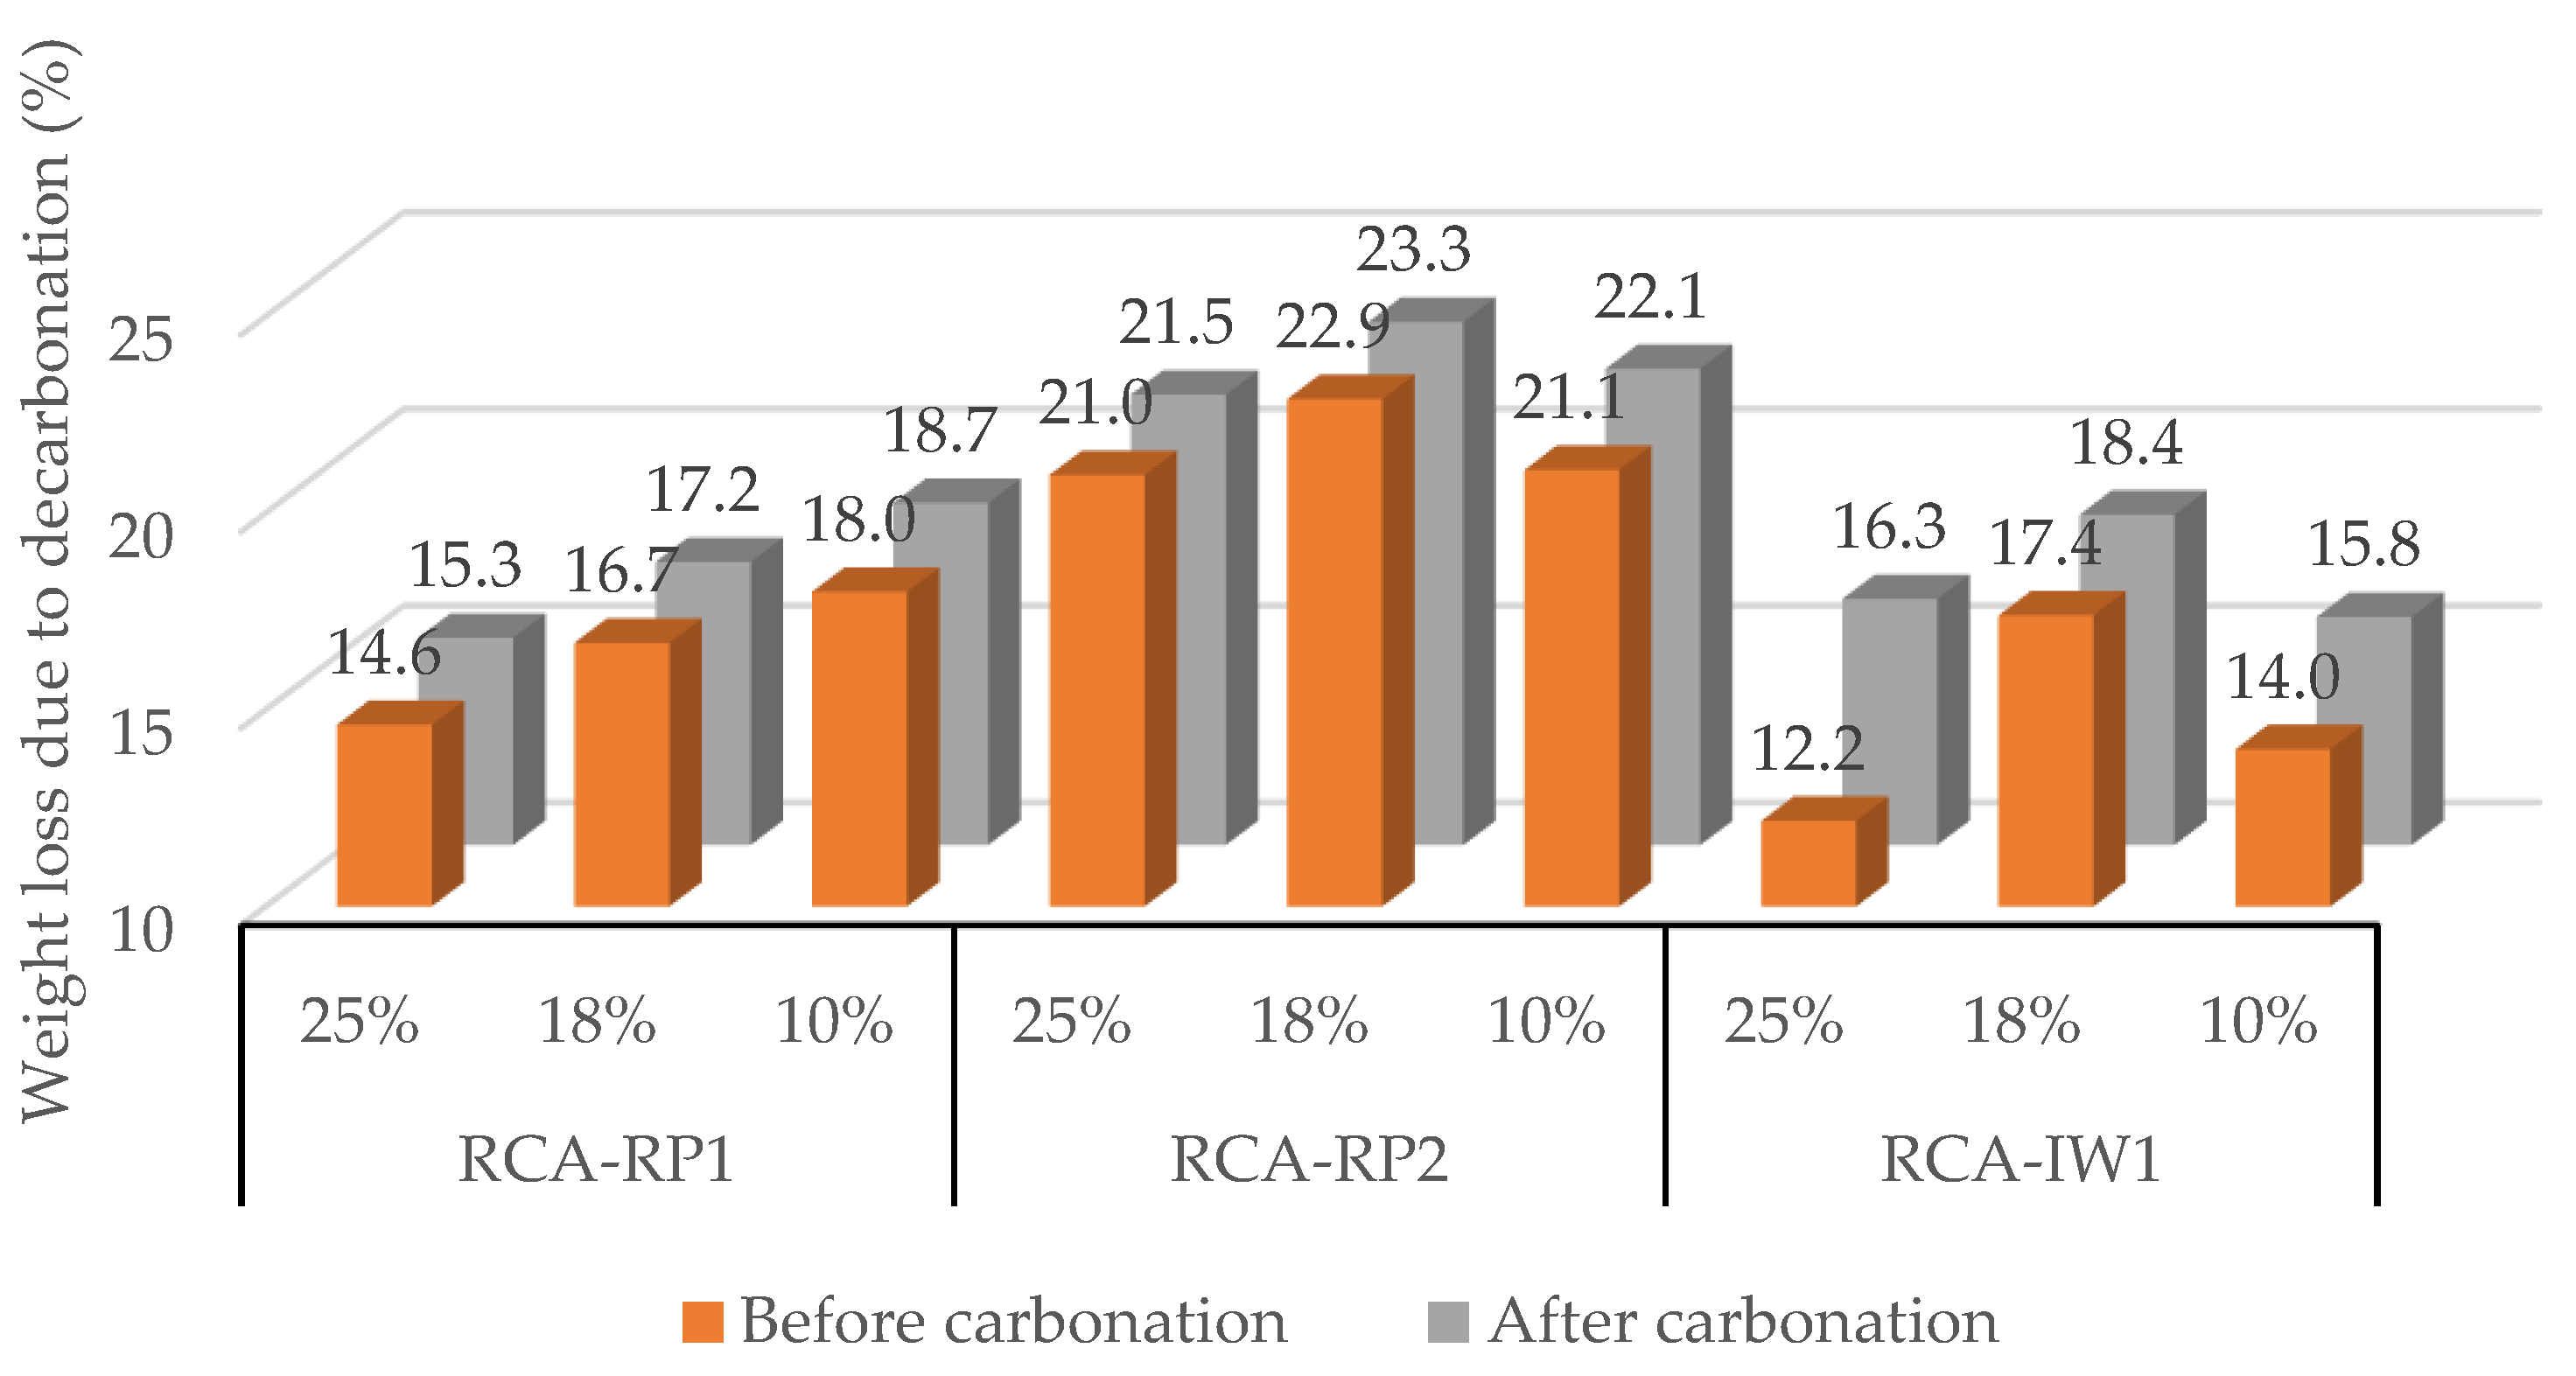
3.2. Effect of CO2 Concentration (10%, 18%, and 25%)
3.2.1. Mixed Recycled Aggregates (MRAs)
3.2.2. Recycled Concrete Aggregates (RCAs)
3.2.3. Concrete Aggregate (CA-L)
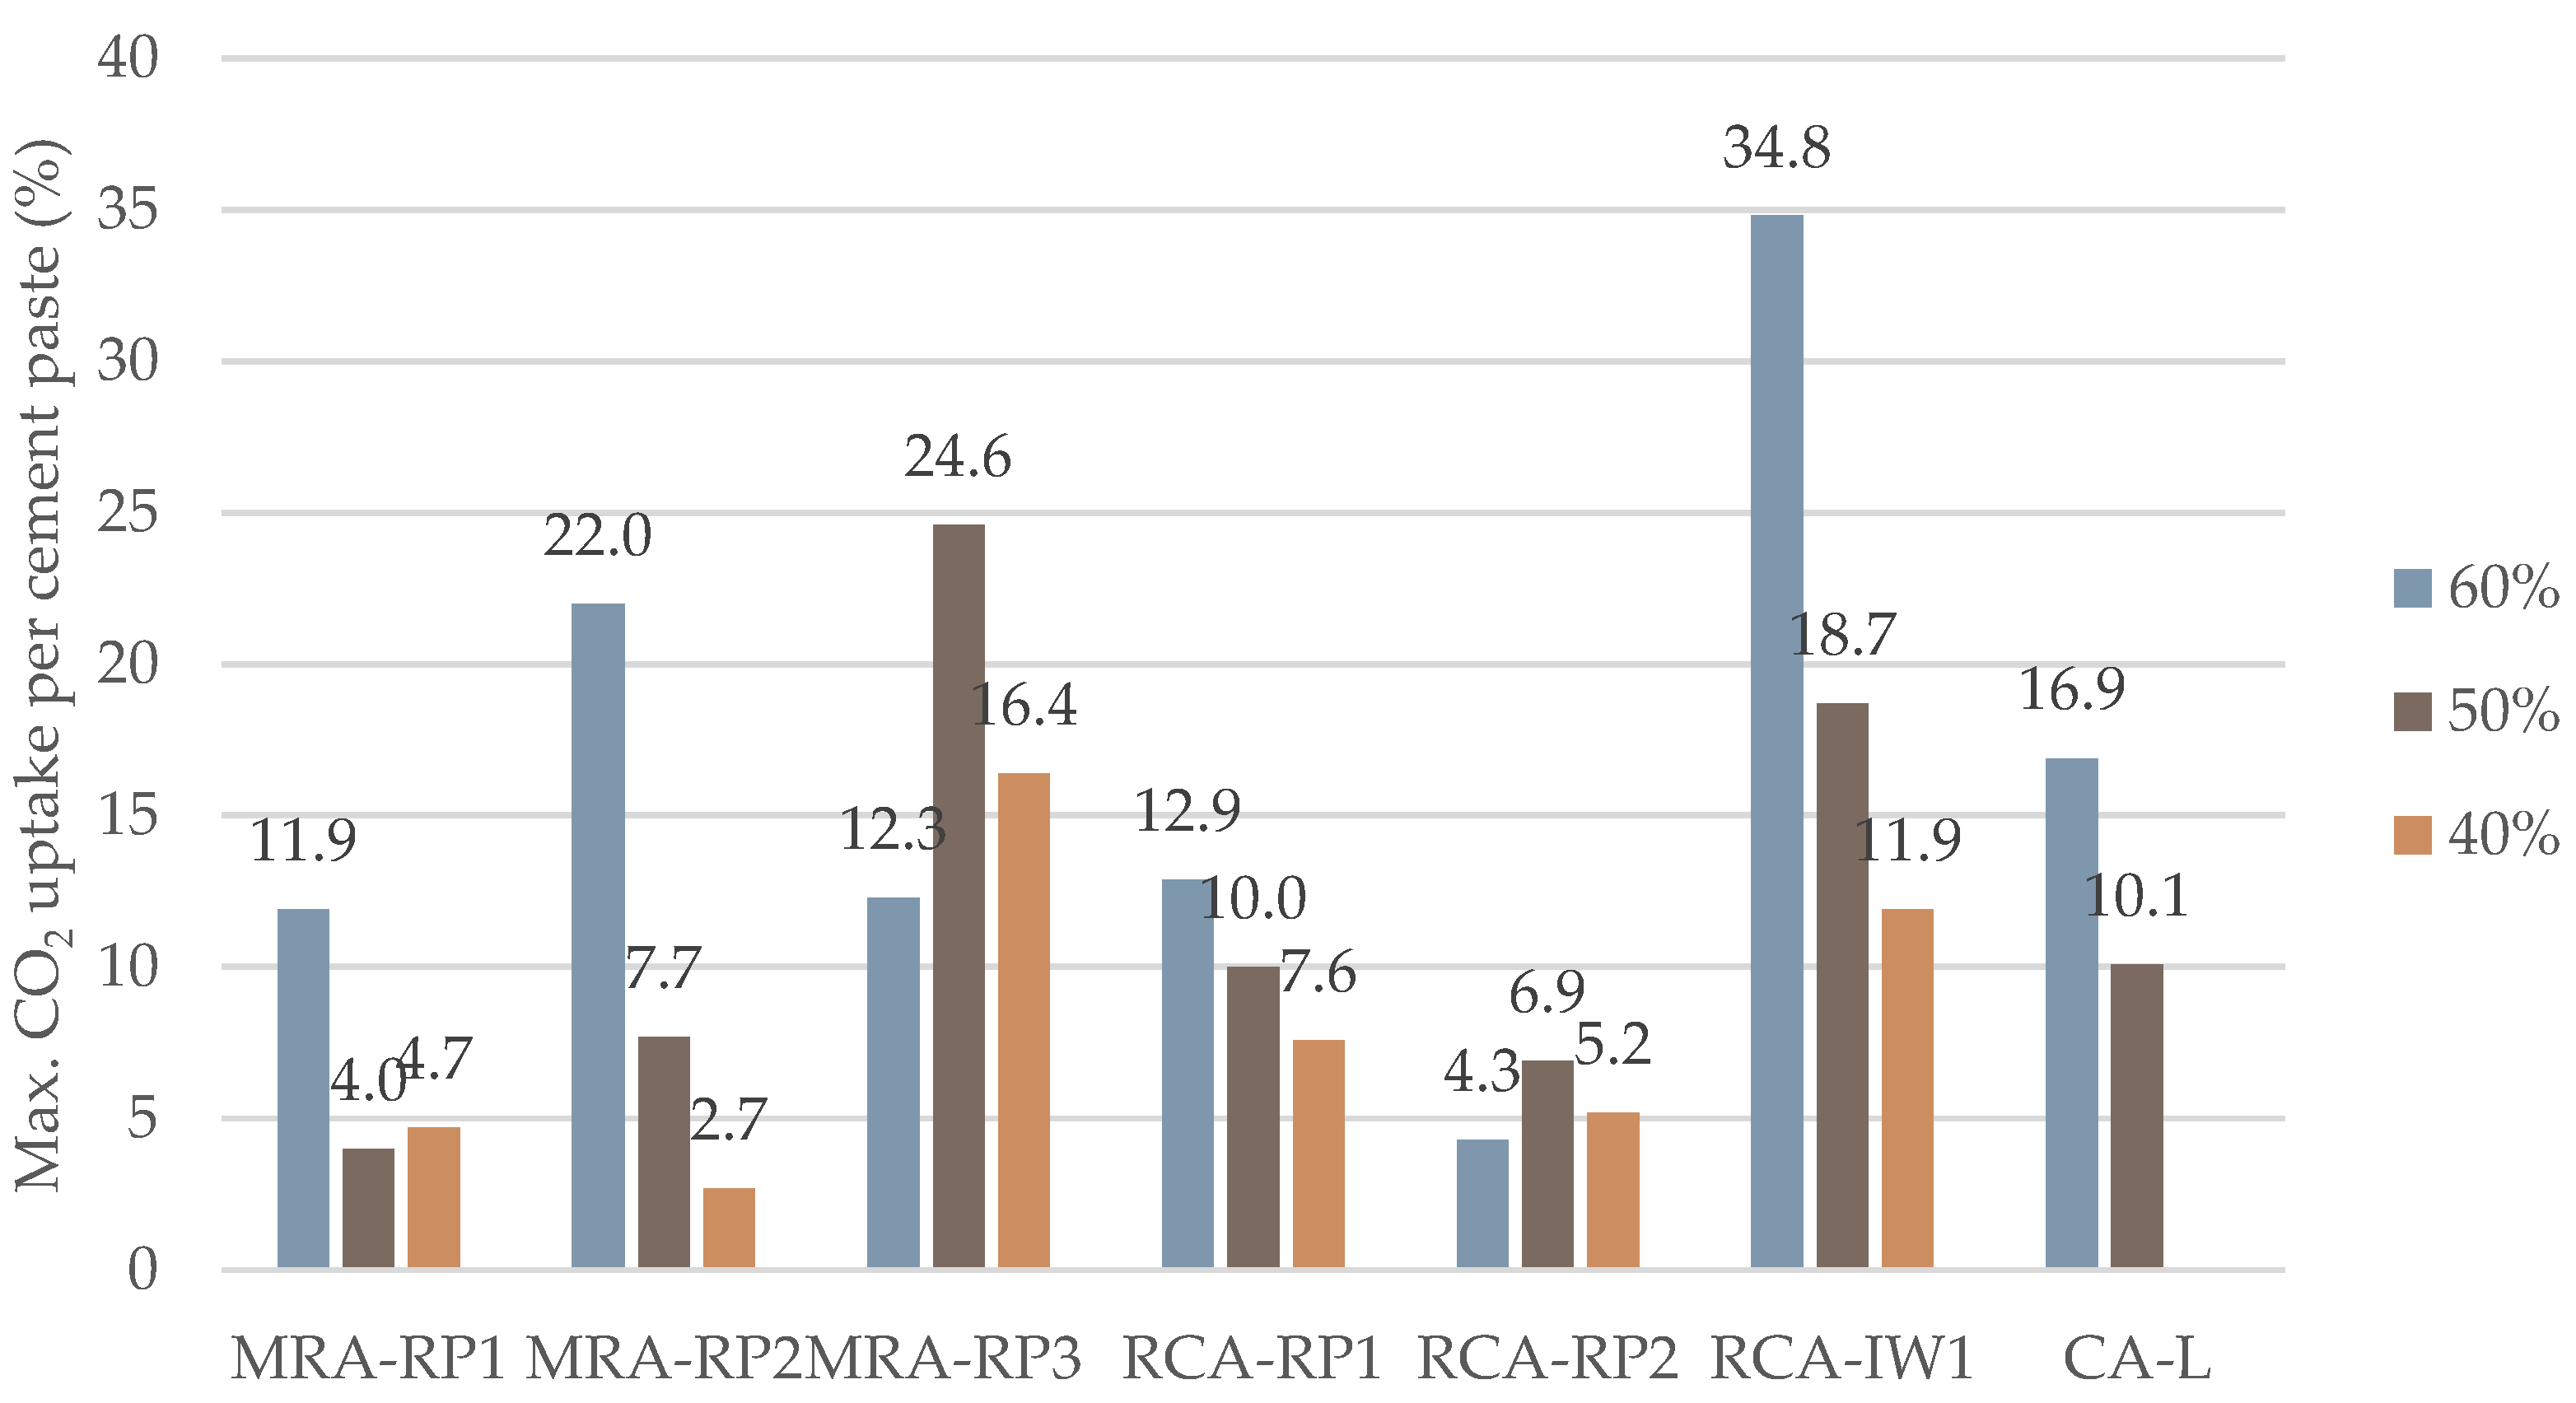
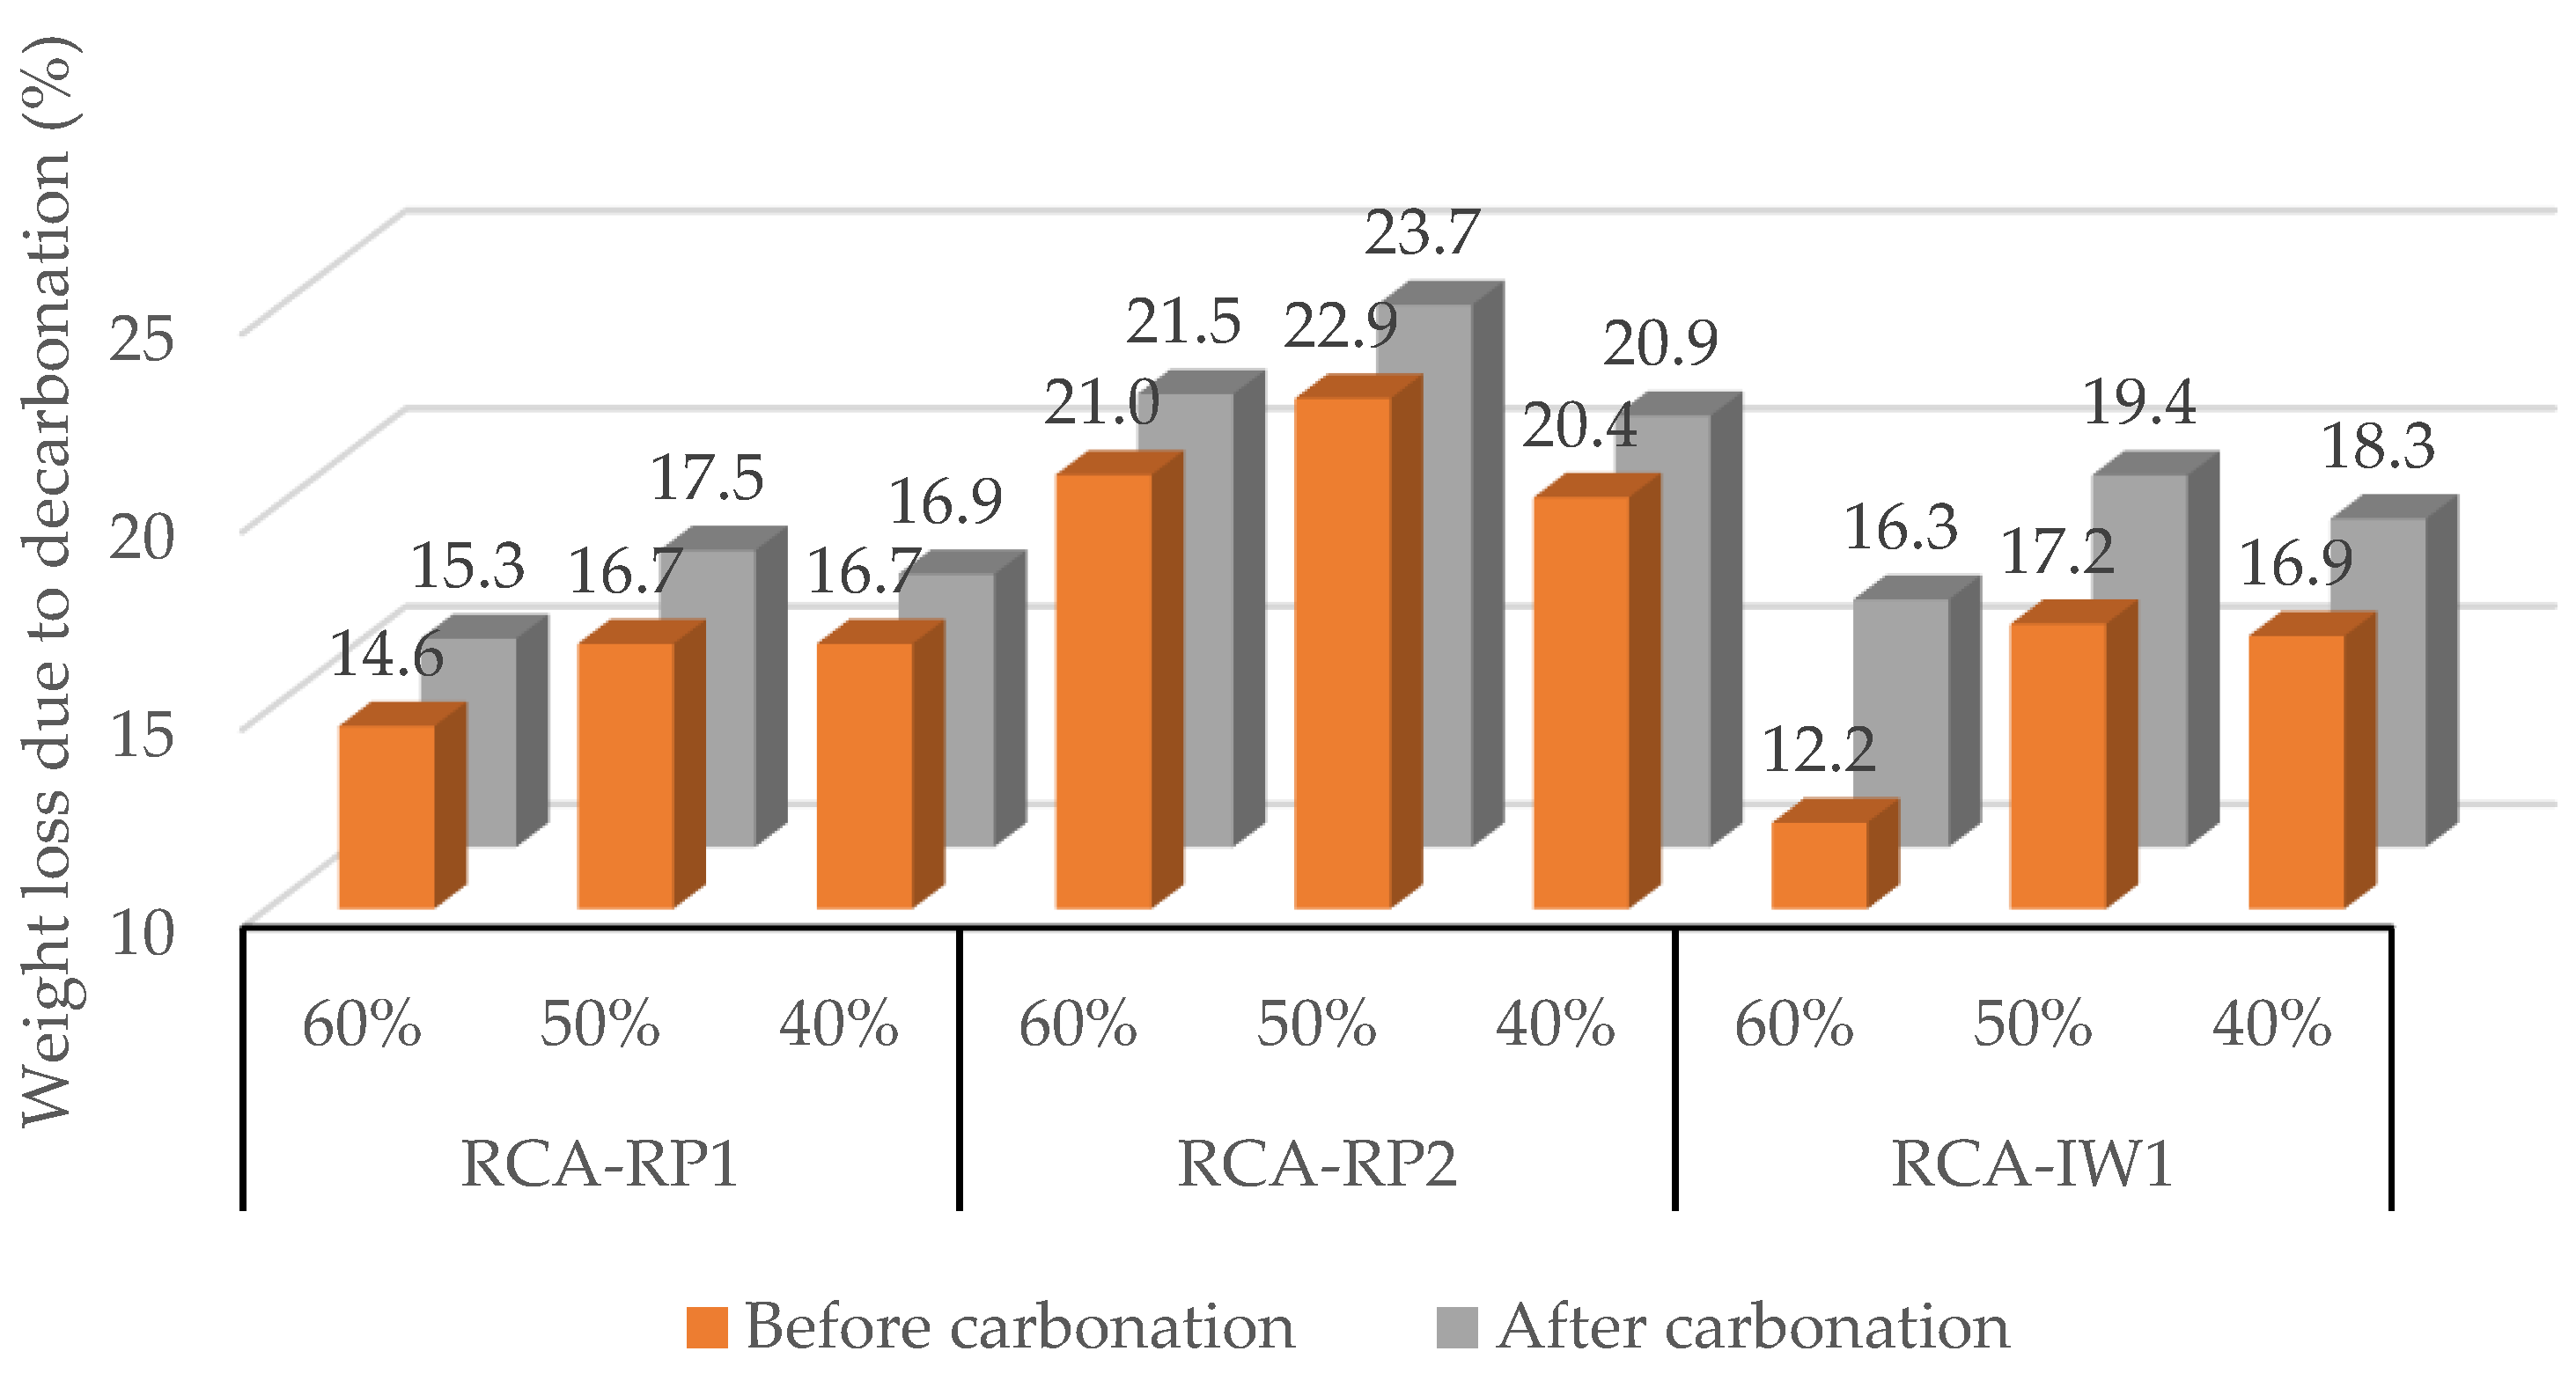
3.3. Effect of Relative Humidity (40%, 50%, and 60%)
3.3.1. Mixed Recycled Concrete Aggregates (MRAs)
3.3.2. Recycled Concrete Aggregates (RCAs)
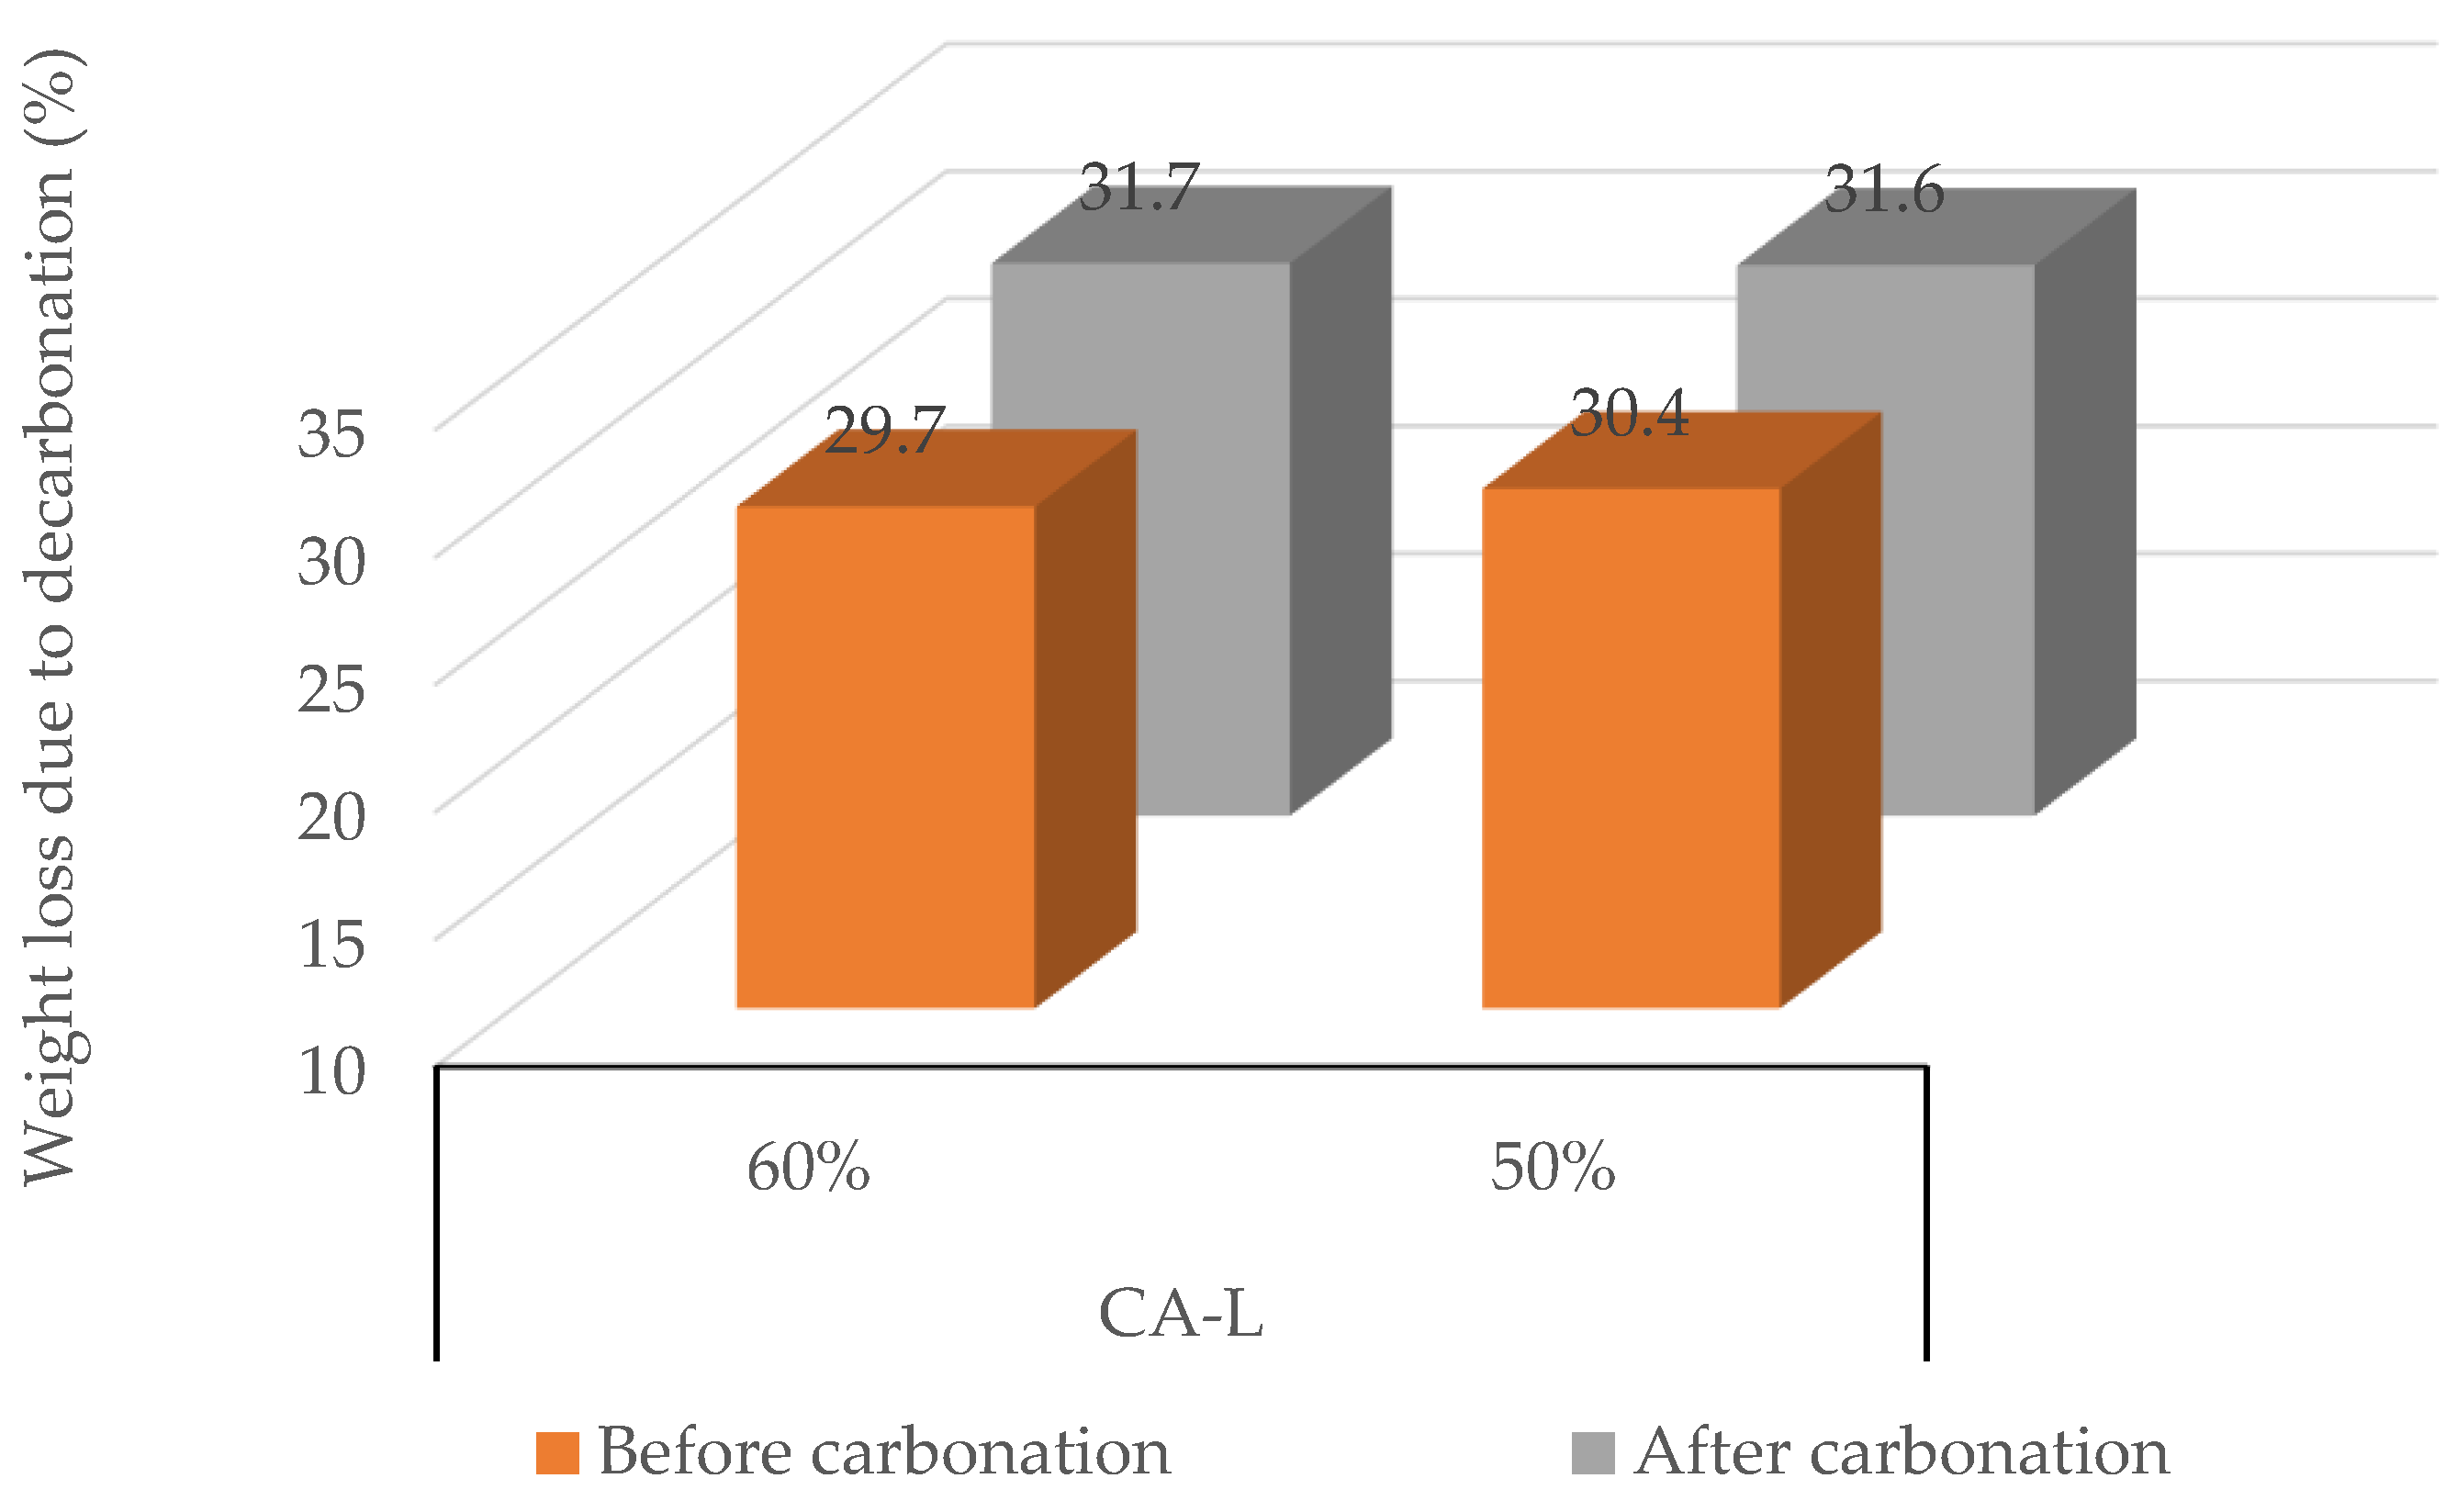
3.3.3. Concrete Aggregate (CA-L)
4. Conclusions
- -
- Firstly, higher carbonation temperatures, mainly at 60 °C, lead to higher CO2 uptake in shorter periods of exposure for most MRAs. Increasing the temperature shows promise for industrial applications, especially for RAs with higher initial CO2 absorption potential.
- -
- Secondly, the CO2 concentration plays a significant role in the carbonation process. Environments richer in CO2, especially at 25%, promote higher CO2 uptake. As the concentration of CO2 in the environment increased, both types of aggregates demonstrated a greater ability to sequestrate CO2. This finding indicates that higher CO2 levels during carbonation treatments may improve the carbon capture potential of both RCA and MRA.
- -
- Third, a reduction in carbonation relative humidity below 60% consistently results in reduced CO2 absorption for most RAs studied (MRA, RCA, and CA-L). Lower humidity limits water availability, which is crucial for the carbonation reaction, leading to a decrease in CO2 uptake. However, not all cases exhibit a prolonged reaction time. In conclusion, this study offers valuable insights for the industrial application of forced carbonation in RAs.
Author Contributions
Funding
Institutional Review Board Statement
Informed Consent Statement
Data Availability Statement
Acknowledgments
Conflicts of Interest
Abbreviations
| CO2 | Carbon dioxide |
| IEA | International Energy Agency |
| CaCO3 | Calcium carbonate |
| C-S-H | Calcium silicate hydrate |
| RA | Recycled aggregate |
| RH | Relative humidity |
| CDW | Construction and demolition waste |
| CA-L | Control concrete aggregate |
| MRA-RP1 | Mixed recycled aggregate from recycling plant 1 |
| MRA-RP2 | Mixed recycled aggregate from recycling plant 2 |
| MRA-RP3 | Mixed recycled aggregate from recycling plant 3 |
| RCA-RP1 | Recycled concrete aggregate from recycling plant 1 |
| RCA-RP2 | Recycled concrete aggregate from recycling plant 4 |
| RCA-IW1 | Recycled concrete aggregate from concrete producer |
| RCA | Recycled concrete aggregate |
| Rc | Cementitious material content |
References
- International Energy Agency (IEA). Technology Roadmap—Low-Carbon Transition in the Cement Industry. Cement Sustainability Initiative (CSI). 2018. Available online: https://www.iea.org/reports/technology-roadmap-low-carbon-transition-in-the-cement-industry (accessed on 16 October 2024).
- Holban, E.; Deák, G.Y.; Daescu, V.; Diacu, E.; Daescu, A.I.; Tanase, G.S.; Marinescu, P.; Sirbu, C.; Paceagiu, J. Ways to reduce CO2 emissions and energetic consumption at clinker producing under Romanian specific conditions. J. Environ. Prot. Ecol. 2015, 16, 479–488. [Google Scholar]
- Imbabi, M.S.; Carrigan, C.; McKenna, S. Trends and developments in green cement and concrete technology. Int. J. Sustain. Built Environ. 2012, 1, 194–216. [Google Scholar] [CrossRef]
- Gomes, R.I.; Bastos, D.; Farinha, C.B.; Pederneiras, C.M.; Veiga, R.; de Brito, J.; Faria, P.; Silva, A.S. Mortars with cdw recycled aggregates submitted to high levels of CO2. Infrastructures 2021, 6, 159. [Google Scholar] [CrossRef]
- Peter, M.A.; Muntean, A.; Meier, S.A.; Böhm, M. Competition of several carbonation reactions in concrete: A parametric study. Cem. Concr. Res. 2008, 38, 1385–1393. [Google Scholar] [CrossRef]
- Cui, H.; Tang, W.; Liu, W.; Dong, Z.; Xing, F. Experimental study on effects of CO2 concentrations on concrete carbonation and diffusion mechanisms. Constr. Build. Mater. 2015, 93, 522–527. [Google Scholar] [CrossRef]
- Xu, Z.; Zhang, Z.; Huang, J.; Yu, K.; Zhong, G.; Chen, F.; Chen, X.; Yang, W.; Wang, Y. Effects of temperature, humidity and CO2 concentration on carbonation of cement-based materials: A review. Constr. Build. Mater. 2022, 346, 128399. [Google Scholar] [CrossRef]
- Thiery, M.; Villain, G.; Dangla, P.; Platret, G. Investigation of the carbonation front shape on cementitious materials: Effects of the chemical kinetics. Cem. Concr. Res. 2007, 37, 1047–1058. [Google Scholar] [CrossRef]
- Vogler, N.; Drabetzki, P.; Lindemann, M.; Kühne, H.C. Description of the concrete carbonation process with adjusted depth-resolved thermogravimetric analysis. J. Therm. Anal. Calorim. 2021, 147, 6167–6180. [Google Scholar] [CrossRef]
- Šavija, B.; Luković, M. Carbonation of cement paste: Understanding, challenges, and opportunities. Constr. Build. Mater. 2016, 117, 285–301. [Google Scholar] [CrossRef]
- Infante Gomes, R.; Brazão Farinha, C.; Veiga, R.; de Brito, J.; Faria, P.; Bastos, D. CO2 sequestration by construction and demolition waste aggregates and effect on mortars and concrete performance—An overview. Renew. Sustain. Energy Rev. 2021, 152, 111668. [Google Scholar] [CrossRef]
- Fernández Bertos, M.; Simons, S.J.R.; Hills, C.D.; Carey, P.J. A review of accelerated carbonation technology in the treatment of cement-based materials and sequestration of CO2. J. Hazard. Mater. 2004, 112, 193–205. [Google Scholar] [CrossRef]
- Gomes, R.I.; Bastos, D.; Farinha, C.B.; Veiga, R.; de Brito, J.; Faria, P.; Silva, A.S.; Bogas, A. Carbonation Potential of Recycled Aggregates from Construction and Demolition Waste. In Proceedings of the Fib Symposium 2021—Concrete Structures: New Trends for Eco-Efficiency and Performance, Lisbon, Portugal, 14–16 June 2021. [Google Scholar]
- Bastos, D.; Brazão Farinha, C.; Maia Pederneiras, C.; Veiga, R.; Bogas, J.A.; Infante Gomes, R.; Santos Silva, A. Pathway to Carbon Neutrality in the Cement Industry: CO2 Uptake by Recycled Aggregates from Construction and Demolition Waste. Appl. Sci. 2024, 14, 5224. [Google Scholar] [CrossRef]
- Liu, P.; Chen, Y.; Yu, Z. Effects of temperature, relative humidity and CO2 concentration on concrete carbonation. Mag. Concr. Res. 2019, 72, 936–947. [Google Scholar] [CrossRef]
- Humbert, P.S.; Castro-Gomes, J.P.; Savastano, H. Clinker-free CO2 cured steel slag based binder: Optimal conditions and potential applications. Constr. Build. Mater. 2019, 210, 413–421. [Google Scholar] [CrossRef]
- Pu, Y.; Li, L.; Wang, Q.; Shi, X.; Luan, C.; Zhang, G.; Fu, L.; El-Fatah Abomohra, A. Accelerated carbonation technology for enhanced treatment of recycled concrete aggregates: A state-of-the-art review. Constr. Build. Mater. 2021, 282, 122671. [Google Scholar] [CrossRef]
- Silva, R.V.; Neves, R.; De Brito, J.; Dhir, R.K. Carbonation behaviour of recycled aggregate concrete. Cem. Concr. Compos. 2015, 62, 22–32. [Google Scholar] [CrossRef]
- Wang, D.; Noguchi, T.; Nozaki, T. Increasing efficiency of carbon dioxide sequestration through high temperature carbonation of cement-based materials. J. Clean. Prod. 2019, 238, 117980. [Google Scholar] [CrossRef]
- Gholizadeh-Vayghan, A.; Bellinkx, A.; Snellings, R.; Vandoren, B.; Quaghebeur, M. The effects of carbonation conditions on the physical and microstructural properties of recycled concrete coarse aggregates. Constr. Build. Mater. 2020, 257, 119486. [Google Scholar] [CrossRef]
- Farinha, C.; Pederneiras, C.M.; Gomes, R.I.; Bastos, D.; Veiga, R. Life Cycle Carbon Assessment of Mortars with Carbonated and Non-Carbonated Recycled Aggregates. Appl. Sci. 2024, 14, 7442. [Google Scholar] [CrossRef]
- EN 197-1; Cement Composition, Specifications and Conformity Criteria for Common Cements. iTeh: Newark, DE, USA, 2011.
- Nedeljković, M.; Visser, J.; Nijland, T.G.; Valcke, S.; Schlangen, E. Physical, chemical and mineralogical characterization of Dutch fine recycled concrete aggregates: A comparative study. Constr. Build. Mater. 2021, 270, 121475. [Google Scholar] [CrossRef]
- EN 933-11; Tests for Geometrical Properties of Aggregates—Part 11: Classification Test for the Constituents of Coarse Recycled Aggregate. European Committee for Standardization (CEN): Brussels, Belgium, 2011.
- EN 1015-1; Methods of Test for Mortar for Masonry—Part 1: Determination of Particle Size Distribution (by Sieve Analysis). iTeh: Newark, DE, USA, 1998.
- Bednarska, D.; Wieczorek, A.; Grymin, W.; Materak, K.; Koniorczyk, M. On the processes causing the alteration of cement-based materials while drying: Differential scanning calorimetry as a reliable tool for indirect microstructural analysis. J. Build. Eng. 2022, 59, 105073. [Google Scholar] [CrossRef]
- LNEC E 403; Análise Mineralógica por Difratometria de Raios X. LNEC: Lisboa, Portugal, 1993.
- Vaitkus, A.; Merkys, A.; Grazulis, S. Validation of the Crystallography Open Database using the Crystallographic Information Framework. J. Appl. Crystallogr. 2021, 54, 661–672. [Google Scholar] [CrossRef] [PubMed]
- Quirós, M.; Gražulis, S.; Girdzijauskaitė, S.; Merkys, A.; Vaitkus, A. Using SMILES strings for the description of chemical connectivity in the Crystallography Open Database. J. Cheminform. 2018, 10, 23. [Google Scholar] [CrossRef] [PubMed]
- Merkys, A.; Vaitkus, A.; Butkus, J.; Okulič-Kazarinas, M.; Kairys, V.; Gražulis, S. COD::CIF::Parser: An error-correcting CIF parser for the Perl language. J. Appl. Crystallogr. 2016, 49, 292–301. [Google Scholar] [CrossRef] [PubMed]
- Gražulis, S.; Merkys, A.; Vaitkus, A.; Okulič-Kazarinas, M. Computing stoichiometric molecular composition from crystal structures. J. Appl. Crystallogr. 2015, 48, 85–91. [Google Scholar] [CrossRef]
- Gražulis, S.; Daškevič, A.; Merkys, A.; Chateigner, D.; Lutterotti, L.; Quirós, M.; Serebryanaya, N.R.; Moeck, P.; Downs, R.T.; Le Bail, A. Crystallography Open Database (COD): An open-access collection of crystal structures and platform for world-wide collaboration. Nucleic Acids Res. 2012, 40, 420–427. [Google Scholar] [CrossRef]
- Graulis, S.; Chateigner, D.; Downs, R.T.; Yokochi, A.F.T.; Quirós, M.; Lutterotti, L.; Manakova, E.; Butkus, J.; Moeck, P.; Le Bail, A. Crystallography Open Database—An open-access collection of crystal structures. J. Appl. Crystallogr. 2009, 42, 726–729. [Google Scholar] [CrossRef]
- Downs, R.T.; Hall-Wallace, M. The American Mineralogist crystal structure database. Am. Mineral. 2003, 88, 247–250. [Google Scholar] [CrossRef]
- Wang, L.; Zhou, Y.; Shi, W. Random crowd-induced vibration in footbridge and adaptive control using semi-active TMD including crowd-structure interaction. Eng. Struct. 2024, 306, 117839. [Google Scholar] [CrossRef]
- Brazão Farinha, C.; Pederneiras, C.M.; Bastos, D.; Infante Gomes, R.; Veiga, R.; Santos Silva, A.; Martins, I. CDW as sources of CO2 absorption. In Proceedings of the V International Conference Progress of Recycling in the Built Environment, Weimar, Germany, 10–12 October 2023; pp. 227–234. [Google Scholar]
- Galan, I.; Glasser, F.P.; Baza, D.; Andrade, C. Assessment of the protective effect of carbonation on portlandite crystals. Cem. Concr. Res. 2015, 74, 68–77. [Google Scholar] [CrossRef]
- Ngala, V.T.; Page, C.L. Effects of Carbonation on Pore Structure and Diffusional Properties of Hydrated Cement Pastes. Cem. Concr. Res. 1997, 27, 995–1007. [Google Scholar] [CrossRef]
- Drouet, E.; Poyet, S.; Le Bescop, P.; Torrenti, J.M.; Bourbon, X. Carbonation of hardened cement pastes: Influence of temperature. Cem. Concr. Res. 2019, 115, 445–459. [Google Scholar] [CrossRef]
- Liang, C.; Pan, B.; Ma, Z.; He, Z.; Duan, Z. Utilization of CO2 curing to enhance the properties of recycled aggregate and prepared concrete: A review. Cem. Concr. Compos. 2020, 105, 103446. [Google Scholar] [CrossRef]
- Liu, P.; Yu, Z.; Chen, Y. Carbonation depth model and carbonated acceleration rate of concrete under different environment. Cem. Concr. Compos. 2020, 114, 103736. [Google Scholar] [CrossRef]
- Lu, Z.; Tan, Q.; Lin, J.; Wang, D. Properties investigation of recycled aggregates and concrete modified by accelerated carbonation through increased temperature. Constr. Build. Mater. 2022, 341, 127813. [Google Scholar] [CrossRef]
- Li, G.; Yuan, Y.; Du, J.; Ji, Y. Determination of the apparent activation energy of concrete carbonation. J. Wuhan Univ. Technol. Mater. Sci. Ed. 2013, 28, 944–949. [Google Scholar] [CrossRef]
- Li, L.; Wu, M. An overview of utilizing CO2 for accelerated carbonation treatment in the concrete industry. J. CO2 Util. 2022, 60, 102000. [Google Scholar] [CrossRef]
- Zajac, M.; Król, M.; Bullerjahn, F.; Deja, J. Effect of temperature on carbon dioxide mineralisation in recycled cement paste. Adv. Cem. Res. 2022, 35, 384–395. [Google Scholar] [CrossRef]
- Montes-Hernandez, G.; Daval, D.; Chiriac, R.; Renard, F. Growth of nanosized calcite through gas-solid carbonation of nanosized portlandite under anisobaric conditions. Cryst. Growth Des. 2010, 10, 4823–4830. [Google Scholar] [CrossRef]
- Visser, J.H.M. Influence of the carbon dioxide concentration on the resistance to carbonation of concrete. Constr. Build. Mater. 2014, 67, 8–13. [Google Scholar] [CrossRef]
- Leemann, A.; Moro, F. Carbonation of concrete: The role of CO2 concentration, relative humidity and CO2 buffer capacity. Mater. Struct. Constr. 2017, 50, 30. [Google Scholar] [CrossRef]
- Sereng, M.; Djerbi, A.; Metalssi, O.O.; Dangla, P.; Torrenti, J.M. Improvement of recycled aggregates properties by means of CO2 uptake. Appl. Sci. 2021, 11, 6571. [Google Scholar] [CrossRef]
- Huang, K.; Li, A.; Xia, B.; Ding, T. Prediction on CO2 uptake of recycled aggregate concrete. Front. Struct. Civ. Eng. 2020, 14, 746–759. [Google Scholar] [CrossRef]
- Leemann, A.; Winnefeld, F.; Münch, B.; Tiefenthaler, J. Accelerated carbonation of recycled concrete aggregates and its implications for the production of recycling concrete. J. Build. Eng. 2023, 79, 107779. [Google Scholar] [CrossRef]
- Houst, Y.F.; Wittmann, F.H. Depth profiles of carbonates formed during natural carbonation. Cem. Concr. Res. 2002, 32, 1923–1930. [Google Scholar] [CrossRef]
- López-Arce, P.; Gómez-Villalba, L.S.; Martínez-Ramírez, S.; Álvarez de Buergo, M.; Fort, R. Influence of relative humidity on the carbonation of calcium hydroxide nanoparticles and the formation of calcium carbonate polymorphs. Powder Technol. 2011, 205, 263–269. [Google Scholar] [CrossRef]
- Galan, I.; Andrade, C.; Castellote, M. Natural and accelerated CO2 binding kinetics in cement paste at different relative humidities. Cem. Concr. Res. 2013, 49, 21–28. [Google Scholar] [CrossRef]
- Elsalamawy, M.; Mohamed, A.R.; Kamal, E.M. The role of relative humidity and cement type on carbonation resistance of concrete. Alexandria Eng. J. 2019, 58, 1257–1264. [Google Scholar] [CrossRef]
- Sereng, M.; Djerbi, A.; Omikrine-Metalssi, O.; Dangla, P.; Torrenti, J.M. Effect of water contents of recycled concrete aggregates on carbonation kinetic. In Proceedings of the 12th Fib International PhD Symposium in Civil Engineering, Prague, Czech Republic, 29–31 August 2018; pp. 1177–1184. [Google Scholar]


| Aggregate Type | Designation | Origin (Collected at) | Location |
|---|---|---|---|
| Mixed recycled aggregate (MRA) | MRA-RP1 | Recycling plant 1 | Pero Pinheiro, Portugal |
| MRA-RP2 | Recycling plant 2 | Figueira da Foz, Portugal | |
| MRA-RP3 | Recycling plant 3 | Seixal, Portugal | |
| Recycled concrete aggregate (RCA) | RCA-IW1 | Concrete producer | Alhanda, Portugal |
| RCA-RP1 | Recycling plant 1 | Pero Pinheiro, Portugal | |
| RCA-RP2 | Recycling plant 4 | Bucelas, Portugal | |
| Control concrete aggregate (CA) | CA-L | Concrete produced in laboratory | Lisbon, Portugal |
| CO2 Maximum Uptake (%)/Carbonation Period (h) | ||||||||
|---|---|---|---|---|---|---|---|---|
| MRA-RP1 | MRA-RP2 | MRA-RP3 | RCA-RP1 | RCA-RP2 | RCA-IW1 | CA-L | ||
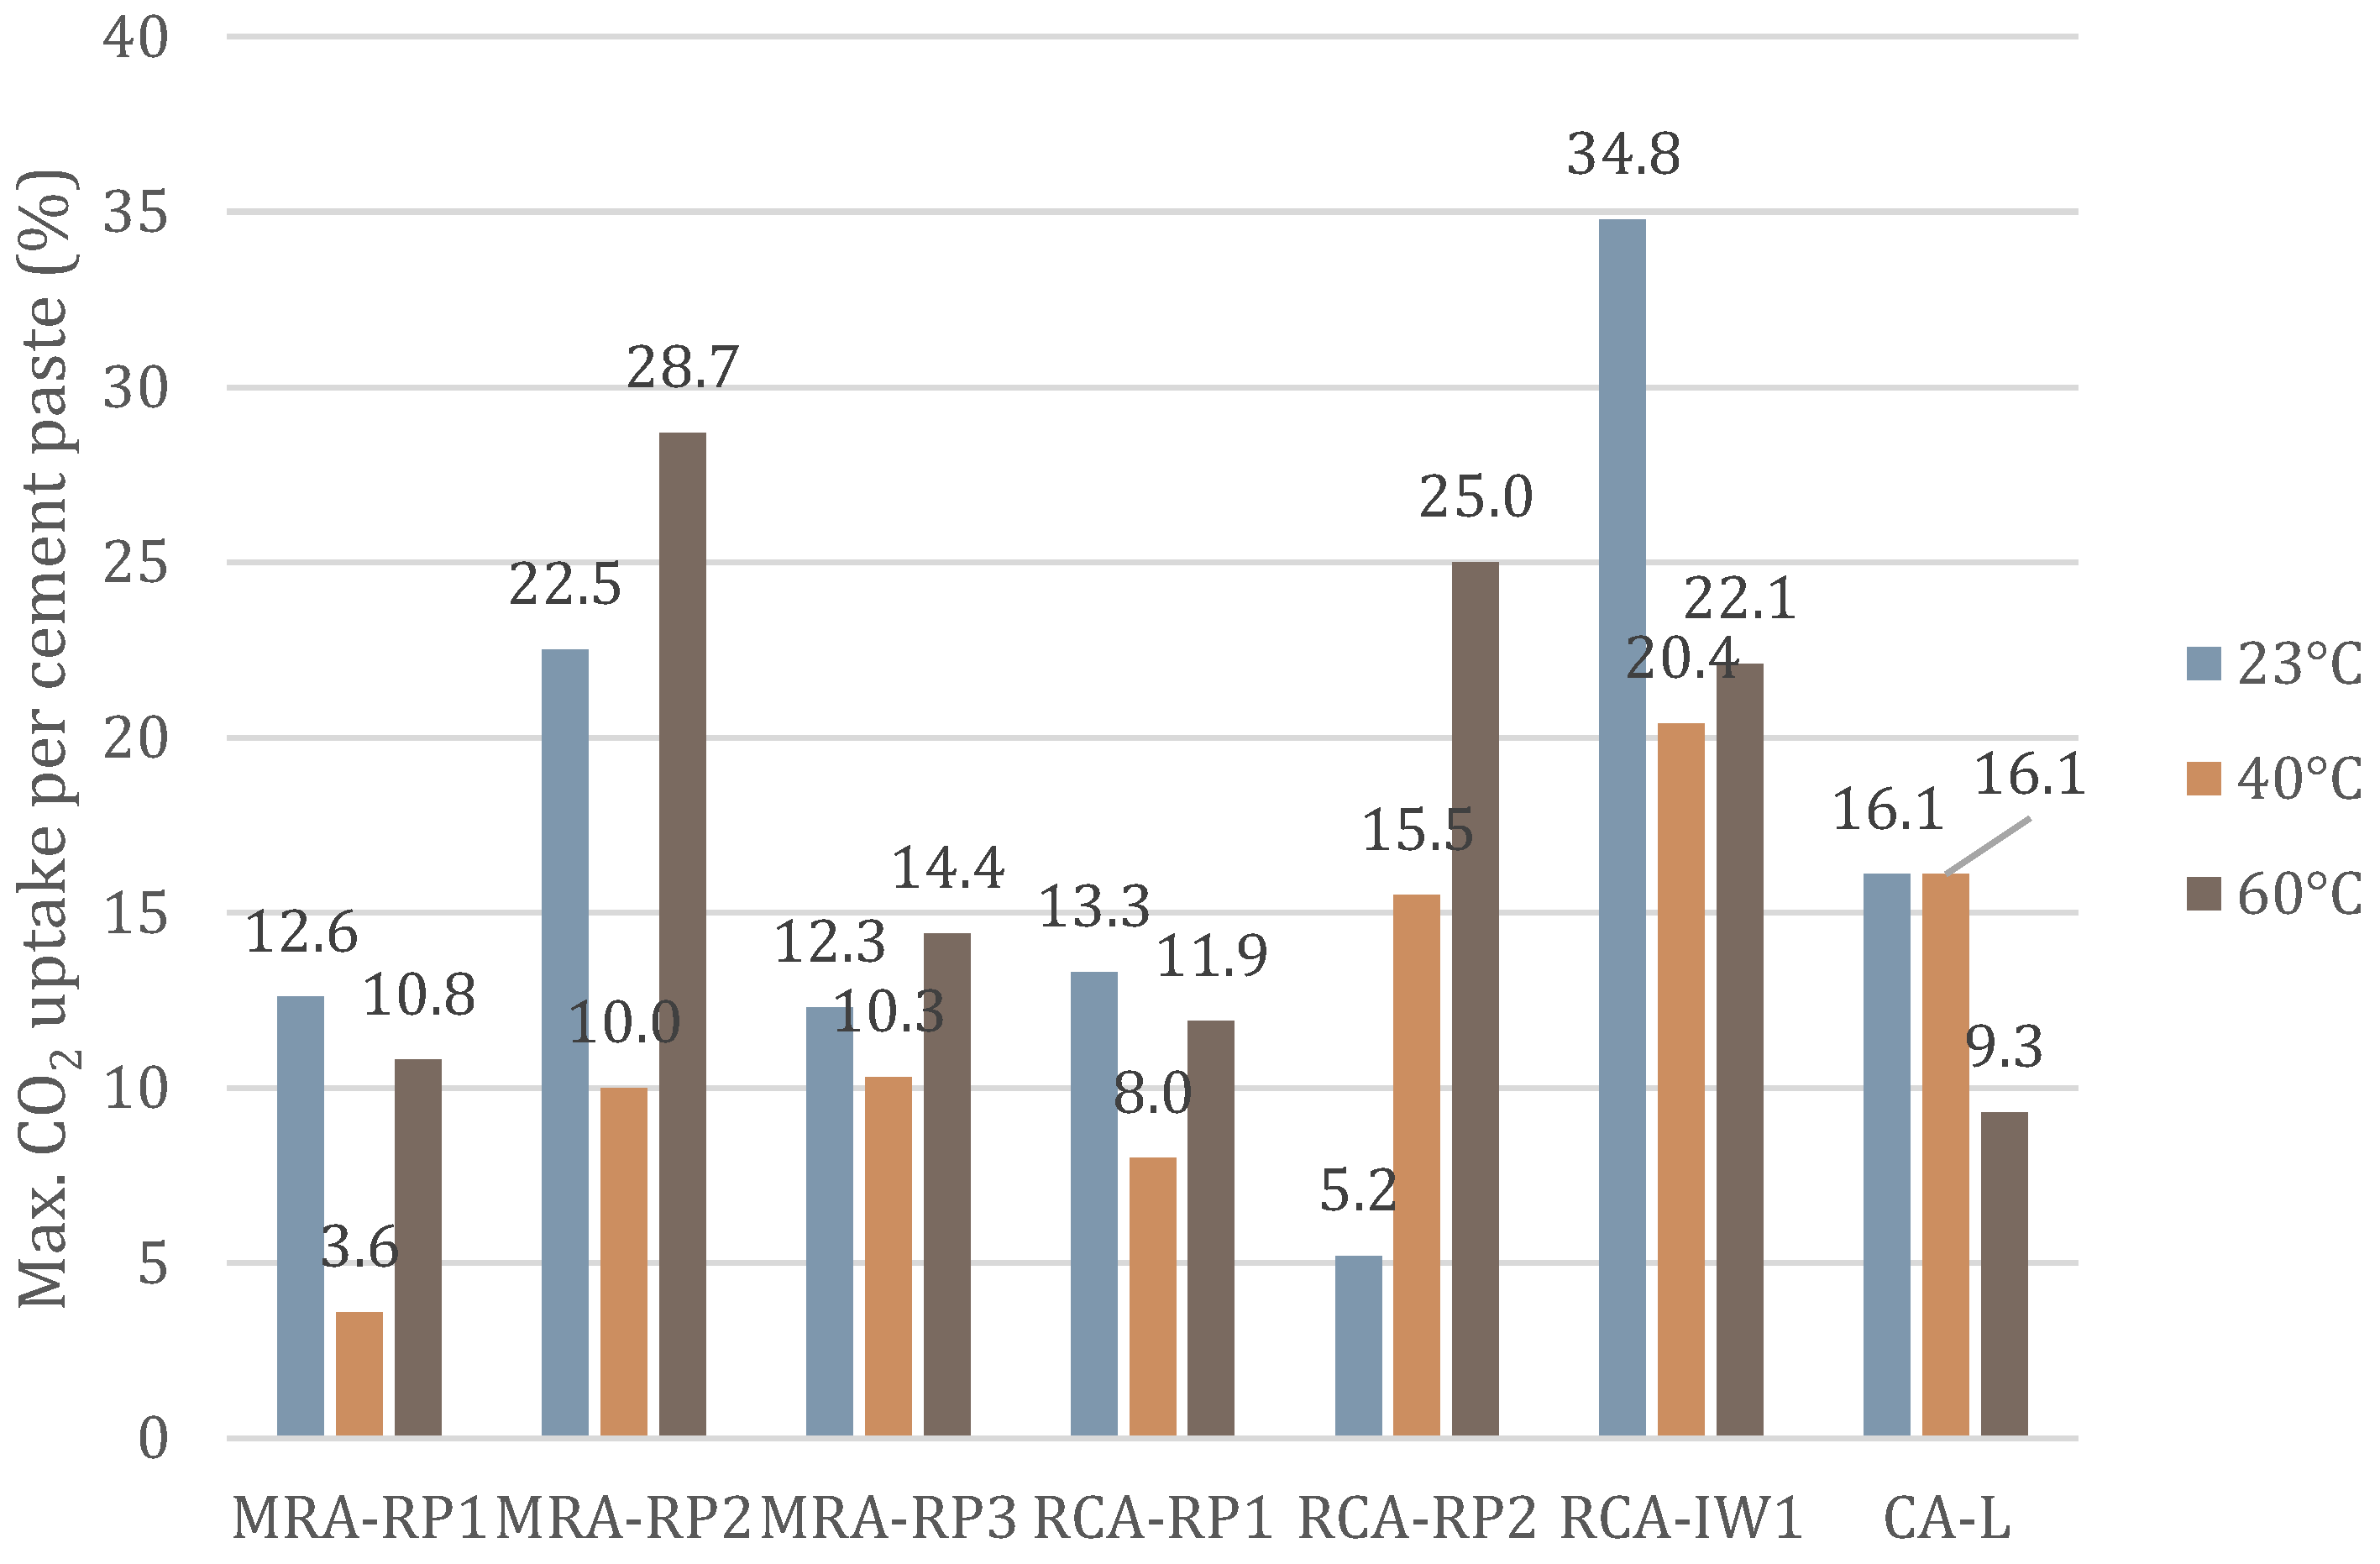
| Temperature | 23 °C | 12.6%/5 h | 22.5%/5 h | 12.3%/12 h | 13.3%/12 h | 5.2%/5 h | 34.8%/12 h | 16.9%/5 h |
| 40 °C | 3.6%/3 h | 10.0%/3 h | 10.3%/8 h | 8.0%/8 h | 15.5%/3 h | 20.4%/5 h | 16.1%/3 h | |
| 60 °C | 10.8%/2 h | 28.7%/1 h | 14.4%/2 h | 11.9%/3 h | 25.0%/1 h | 22.1%/3 h | 9.3%/3 h | |
| CO2 Maximum Uptake (%)/ Carbonation Period (h) | ||||||||
|---|---|---|---|---|---|---|---|---|
| MRA-RP1 | MRA-RP2 | MRA-RP3 | RCA-RP1 | RCA-RP2 | RCA-IW1 | CA-L | ||
| [CO2] | 10% | 1.8%/10 h | 7.5%/12 h | 10.3%/24 h | 9.3%/5 h | 9.5%/12 h | 14.4%/5 h | 18.6%/12 h |
| 18% | - | 10.0%/5 h | 2.1%/24 h | 8.0%/5 h | 3.4%/18 h | 13.6%/8 h | 5.1%/12 h | |
| 25% | 12.6%/5 h | 22.5%/5 h | 12.3%/12 h | 13.3%/12 h | 5.2%/12 h | 34.8%/12 h | 16.9%/5 h | |
| CO2 Maximum Uptake (%)/ Carbonation Period (h) | ||||||||
|---|---|---|---|---|---|---|---|---|
| MRA-RP1 | MRA-RP2 | MRA-RP3 | RCA-RP1 | RCA-RP2 | RCA-IW1 | CA-L | ||
| RH | 40% | 4.7%/18 h | 2.7%/12 h | 16.4%/12 h | 7.6%/12 h | 4.3%/3 h | 11.9%/3 h | - |
| 50% | 4.0%/18 h | 7.7%/12 h | 24.6%/12 h | 10.0%/5 h | 6.9%/3 h | 18.7%/8 h | 10.1%/5 h | |
| 60% | 11.9%/5 h | 22.0%/5 h | 12.3%/5 h | 12.9%/12 h | 5.2%/12 h | 34.8%/12 h | 16.9%/5 h | |
Disclaimer/Publisher’s Note: The statements, opinions and data contained in all publications are solely those of the individual author(s) and contributor(s) and not of MDPI and/or the editor(s). MDPI and/or the editor(s) disclaim responsibility for any injury to people or property resulting from any ideas, methods, instructions or products referred to in the content. |
© 2025 by the authors. Licensee MDPI, Basel, Switzerland. This article is an open access article distributed under the terms and conditions of the Creative Commons Attribution (CC BY) license (https://creativecommons.org/licenses/by/4.0/).
Share and Cite
Bastos, D.; Brazão Farinha, C.; Pederneiras, C.M.; Veiga, R.; Bogas, J.A.; Infante Gomes, R.; Santos Silva, A. Towards Industrial Implementation: Experimental Campaign Based on Variations in Temperature, Humidity, and CO2 Concentration in Forced Carbonation Reactions of Recycled Aggregates. Appl. Sci. 2025, 15, 5005. https://doi.org/10.3390/app15095005
Bastos D, Brazão Farinha C, Pederneiras CM, Veiga R, Bogas JA, Infante Gomes R, Santos Silva A. Towards Industrial Implementation: Experimental Campaign Based on Variations in Temperature, Humidity, and CO2 Concentration in Forced Carbonation Reactions of Recycled Aggregates. Applied Sciences. 2025; 15(9):5005. https://doi.org/10.3390/app15095005
Chicago/Turabian StyleBastos, David, Catarina Brazão Farinha, Cinthia Maia Pederneiras, Rosário Veiga, José Alexandre Bogas, Ricardo Infante Gomes, and António Santos Silva. 2025. "Towards Industrial Implementation: Experimental Campaign Based on Variations in Temperature, Humidity, and CO2 Concentration in Forced Carbonation Reactions of Recycled Aggregates" Applied Sciences 15, no. 9: 5005. https://doi.org/10.3390/app15095005
APA StyleBastos, D., Brazão Farinha, C., Pederneiras, C. M., Veiga, R., Bogas, J. A., Infante Gomes, R., & Santos Silva, A. (2025). Towards Industrial Implementation: Experimental Campaign Based on Variations in Temperature, Humidity, and CO2 Concentration in Forced Carbonation Reactions of Recycled Aggregates. Applied Sciences, 15(9), 5005. https://doi.org/10.3390/app15095005