Article

X-GANet: An Explainable Graph-Based Framework for Robust Network Intrusion Detection

1
School of Computing, Gachon University, Seongnam 13120, Republic of Korea
2
School of Computer Engineering & Applied Mathematics, Hankyong National University, Pyeongtaek 17738, Republic of Korea
*
Author to whom correspondence should be addressed.
Appl. Sci. 2025, 15(9), 5002; https://doi.org/10.3390/app15095002
Submission received: 1 April 2025 / Revised: 24 April 2025 / Accepted: 28 April 2025 / Published: 30 April 2025
(This article belongs to the Special Issue Network Intrusion Detection and Attack Identification)

Abstract

:
Modern networks are increasingly targeted by sophisticated cyber threats, making effective intrusion detection a critical challenge. Traditional intrusion detection systems (IDSs) often struggle with capturing the complex relationships within network traffic and suffer from a lack of explainability in their decision-making processes. To address these limitations, we propose X-GANet, Explainable Graph Anomaly Network, a novel graph-based intrusion detection framework that models network traffic as a graph and leverages deep representation learning for precise threat identification. The model extracts both flow-based and structural features, aligns multi-view representations through contrastive learning, and employs a transformer-based embedding module for enhanced feature extraction. An adaptive graph detection fusion mechanism ensures effective graph-level representation and detection techniques for robust attack classification. Experimental results obtained from benchmark intrusion detection datasets demonstrate that X-GANet significantly improves detection performance while maintaining interpretability, making it a promising solution for real-world cybersecurity applications.

1. Introduction

The rapid growth of digital networks has led to an unprecedented rise in cyber threats, necessitating more-advanced intrusion detection systems (IDSs) capable of identifying and mitigating malicious activities [1]. Traditional IDS approaches, including signature-based detection and statistical anomaly detection, suffer from fundamental limitations. Signature-based methods rely on predefined attack patterns, making them ineffective against previously unseen threats [2], while anomaly-based approaches often produce high false-positive rates due to their reliance on manually input features and simplistic statistical thresholds [3]. Furthermore, most deep learning-based IDS frameworks operate on tabular data and fail to capture the underlying relationships between network entities, limiting their ability to effectively distinguish between normal and malicious behavior [4].
Recent advances in graph-based machine learning have created new possibilities for intrusion detection by modeling network traffic as a structured graph [5]. In this paradigm, network entities such as IP addresses, ports, and packets are represented as nodes, while their interactions (e.g., communication flows) form edges. Graph-based methods provide an intuitive and powerful way to model complex attack behaviors, capturing both attribute-level information and network topologies [6]. However, the existing graph-based IDS models face significant challenges that hinder their practical deployment.
First, many models rely on basic Graph Neural Networks (GNNs) such as Graph Convolutional Networks (GCN) [7] or Graph Isomorphism Networks (GIN) [8], which are limited in their ability to extract both flow-based and structure-based features effectively. This results in suboptimal representations that fail to generalize across diverse network environments. Second, most existing methods employ naïve feature fusion strategies, where node attributes and graph structures are combined without ensuring their alignment, leading to inconsistent embeddings and decreased detection accuracy [9]. Third, the anomaly detection mechanisms in many IDS frameworks are based on simple thresholding or machine learning classifiers, which lack robustness when distinguishing between normal variations in traffic and actual attack patterns [10]. Lastly, the black-box nature of deep learning-based IDS models poses a challenge for cybersecurity analysts, as these models often lack explainability, making it difficult to interpret why a given network event was classified as an attack [11].
To address these challenges, we propose X-GANet, Explainable Graph Anomaly Network, a novel graph-based intrusion detection framework that integrates contrastive learning [12], transformer-based embeddings [13], and multi-scale anomaly scoring to enhance detection accuracy and interpretability. The proposed network models network traffic as a graph and extracts a rich set of flow-based and structure-based features, ensuring a comprehensive understanding of network activity. To improve coherence between flow and structure representations, a contrastive learning mechanism is employed, enforcing alignment between different views of network traffic [14]. Additionally, a transformer-based embedding module refines the learned representations by capturing long-range dependencies among network entities, enhancing robustness against evasive attack strategies [15].
This paper makes the following key contributions:
  • We propose X-GANet, a novel graph-based intrusion detection framework that effectively models network traffic as a graph and leverages advanced representation-learning techniques for enhanced anomaly detection.
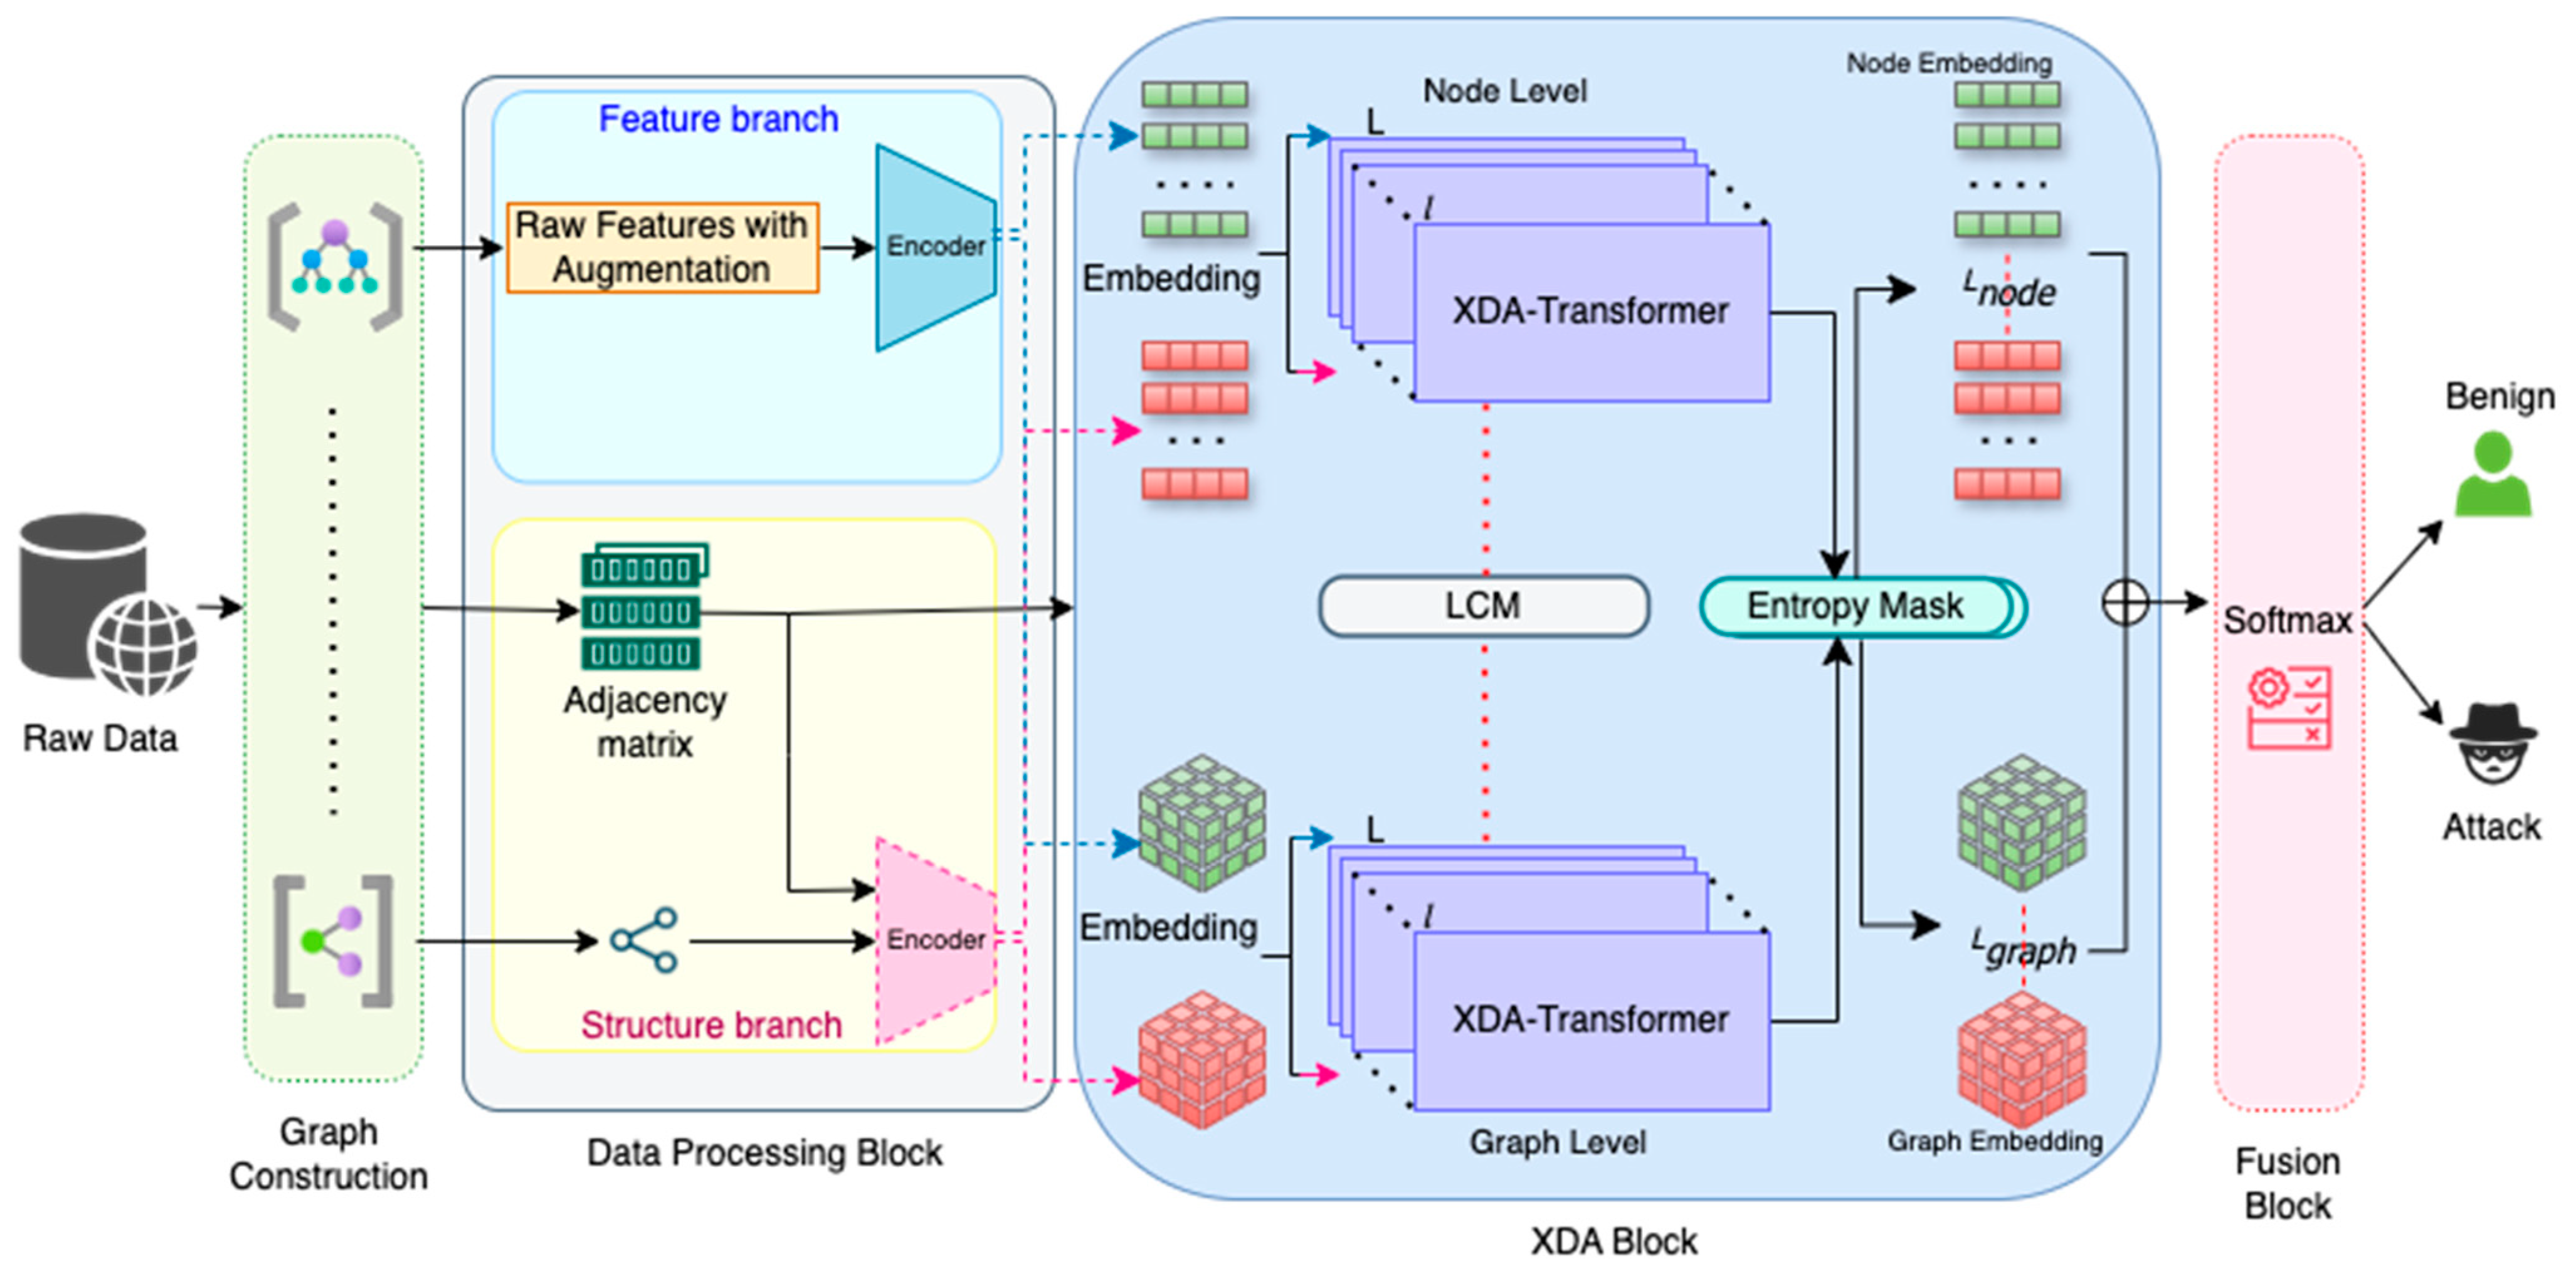
  • We reveal that our framework processes network data through two distinct yet complementary branches: a feature branch that extracts raw flow and log attributes using dedicated encoders and a structure branch that generates graph-based embeddings via a GNN informed by the normalized adjacency matrix. Subsequent fusion via proposed Cross-Diffused Attention (XDA) blocks leverages the strengths of both representations.
  • We propose an entropy-driven adaptive masking mechanism that quantifies uncertainty in the cross-attention distributions. By computing the entropy for each token and generating an adaptive mask to suppress uncertain features, this module refines the output of the proposed Cross-Diffused Attention (XDA) block, ensuring that only the most informative signals contribute to the final detection outcome.
  • We reveal that our novel learnable gating mechanism dynamically balances the contributions of both branches to produce a robust unified representation for classification.
  • We provide the results conducted extensive evaluations conducted on benchmark intrusion detection datasets, including CIC-IDS and UNSW-NB15, demonstrating that X-GANet significantly outperforms state-of-the-art IDS models while providing interpretable insights into network anomalies.
The remainder of this paper is structured as follows: Section 2 provides a comprehensive review of related works on intrusion detection and graph-based anomaly detection. Section 3 presents the architecture and methodology of X-GANet, detailing each module in the framework. Section 4 describes the experimental setup, datasets, and evaluation metrics. Section 5 discusses the results, performance comparisons, and explainability analysis. Finally, Section 6 concludes the study and outlines potential future research directions.

2. Related Study

Intrusion detection systems (IDSs) have long been a cornerstone of network security, enabling the detection and mitigation of cyber threats [16]. Traditional IDS methods are generally categorized into signature-based detection and anomaly-based detection. Signature-based IDSs, such as Snort and Zeek, detect intrusions by matching incoming traffic patterns against known attack signatures [17]. While effective against well-documented threats, these systems fail against zero-day attacks and require frequent updates to maintain their efficacy [18]. On the other hand, anomaly-based IDSs aim to detect deviations from normal network behavior using statistical models or machine learning classifiers [19]. These methods, although capable of identifying novel threats, often suffer from high false-positive rates, as they struggle to differentiate between legitimate traffic variations and actual intrusions [20].
To address these limitations, researchers have focused their attention on deep learning-based IDSs due to their ability to automatically extract patterns from raw network traffic [21]. Convolutional Neural Networks (CNNs) have been employed to detect spatial correlations in network traffic data [22], while Recurrent Neural Networks (RNNs) and Long Short-Term Memory (LSTM) models have been explored for capturing temporal dependencies in traffic sequences [23]. However, these deep learning approaches primarily treat network flows as independent observations, failing to model the relational dependencies between network entities [24]. As a result, they perform poorly in detecting coordinated cyberattacks such as botnets, DDoS, and multi-stage intrusions, where an attack involves multiple interacting network components [25].
Graph-based learning has emerged as a promising approach to overcoming these challenges by representing network traffic as a graph structure, where nodes represent network entities (e.g., IPs, ports, and connections) and edges capture their interactions [26]. Graph Neural Networks (GNNs) have shown significant improvements in cyber threat detection by leveraging both node attributes and structural relationships in network traffic [27]. Several studies have applied Graph Convolutional Networks (GCNs) [7] and Graph Isomorphism Networks (GINs) [8] to intrusion detection, demonstrating improved classification performance. However, these models struggle to effectively differentiate between flow-based attributes and structural relationships, leading to suboptimal feature extraction [28].
Some researchers have introduced Graph Attention Networks (GATs) to enhance IDS performance by prioritizing critical network interactions [29]. GAT4NID, for example, applies attention mechanisms to weight influential connections, improving feature importance estimation [9]. While attention-based GNNs offer improvements, they fail to explicitly align feature-based and structure-based representations, which can lead to inconsistencies in learning [14]. Additionally, most graph-based IDS models rely on simple anomaly-scoring mechanisms, such as basic classifiers or static thresholds, which often result in false positives and unreliable detection in real-world scenarios [30].
Another important advancement in IDSs is contrastive learning, which has been used in self-supervised learning to improve feature extraction by ensuring that similar instances have consistent embeddings while dissimilar ones remain distinct [14]. Several contrastive learning approaches, such as GraphCL, have been explored in cybersecurity applications, but they have not been fully optimized for network intrusion detection, as they often fail to consider the differences between attribute-driven and structure-driven representations in network traffic graphs [31]. Furthermore, most IDS frameworks lack a robust anomaly scoring mechanism, relying on simplistic classifiers rather than more advanced techniques [32].
In this work, we introduce a novel model, a graph-based intrusion detection framework that enhances feature extraction, anomaly detection, and model interpretability. By modeling network traffic as a structured graph, the model captures intricate relationships between network flows, allowing for more precise intrusion detection. Unlike existing approaches, our method effectively integrates attribute-based and structural information, ensuring a more holistic understanding of network activity. Additionally, the network improves detection reliability through advanced anomaly-scoring mechanisms, reducing false positives and increasing robustness against unseen cyber threats. Our evaluations made using the CIC-IDS2017 dataset demonstrate that X-GANet outperforms existing intrusion detection models, making it a scalable, explainable, and highly effective approach for real-world cybersecurity applications.

3. Materials and Methods

3.1. Constructing a Graph from the CIC-IDS2017 Dataset

Intrusion detection requires analyzing relationships between network flows to distinguish between normal and malicious activities effectively. Unlike conventional machine learning models that treat network flows as independent samples, a graph-based representation captures both flow-specific attributes and structural relationships among flows (see Algorithm 1) [33]. This structured representation enables Graph Neural Networks (GNNs) to learn meaningful dependencies that characterize attack patterns more effectively [34]. To achieve this, we transformed the CIC-IDS2017 dataset into a graph ( G = V , E , X , A ^ ) , where the following variables are used:
  • V = { v i } is the set of nodes, each corresponding to a network flow fi.
  • E = { ( v i , v j ) A ^ i j = 1 } is the undirected edge set defined by the normalized adjacency.
  • A ^ = D 1 2 ( A + I ) D 1 2 is the symmetrically normalized adjacency matrix, constructed by combining IP-based (Equation (3)) and temporal (Equation (4)) connectivity.
  • X = x 1 ;     ;   x n R n × d is the node-feature matrix, whose ith row xi is the d-dimensional flow feature vector defined in Equation (1).
As nodes represent network flows, edges define connectivity based on host and temporal relationships, and the adjacency matrix captures the interaction structure within the network [35]. The constructed graph serves as the input for the subsequent contrastive representation-learning and anomaly-scoring modules, ensuring that both localized flow behaviors and global network attack patterns are considered in the detection process [36].

Node–Edge Representation and Feature Extraction

Each network flow fi in the CIC-IDS2017 dataset is represented as a node vi V , where node features xi encapsulate both packet-level characteristics and session-level attributes [37]. To comprehensively describe network traffic behavior, we extract key statistical features from each flow, forming a d-dimensional feature vector:
x i = d i , b i , p i , s p i , d p i , p r o t o i , f l _ r a t e i , a v g _ p k t _ s i z e i , i a t i
The variables above are explained below:
di = flow duration (total time of flow activity).
bi = total bytes transmitted in the flow.
pi = total packets exchanged.
spi, dpi = source and destination port numbers.
protoi = protocol type, one-hot encoded (TCP, UDP, ICMP).
fl_ratei = flow rate, computed as packets per second.
avg_pkt_sizei = average packet size within the flow.
iati = average inter-arrival time of the packets [38].
Since GNNs are highly sensitive to feature magnitudes, we normalize continuous features using min–max scaling, ensuring uniformity [39]:
x = x min x max x min x
where x′ is the scaled feature value. This step prevents numerical instability and improves the generalization of the model across different network conditions [40].
Edges e i j E are constructed based on relationships between flows, defining how flows are linked within the network. We establish connectivity using two primary criteria. Flows that originate from or are destined to go to the same IP address are likely to be associated with the same host or attack pattern. We define an edge between two flows fi and fj if they share a common source or destination IP, as shown below.
e i j = 1 , if   I P s r c , i = I P s r c , j   or   I P d s t , i = I P d s t , j , 0 , otherwise .
This connectivity structure allows the model to capture coordinated attack behaviors, such as botnet infections or port-scanning attacks, where multiple flows originate from the same compromised source [41]. In Equation (3), the superscript IP indicates IP-based adjacency. Furthermore, we set
A i j I P = 1 , if   f i   and   f j   share   any   endpoint   IP ,   i . e . , ( s r c _ I P i = s r c _ I P j )     ( s r c _ I P i = d s t _ I P j )   ( d s t _ I P i = s r c _ I P j )     ( d s t _ I P i = d s t _ I P j ) , 0 , otherwise .
The above formula links any two flows that share a common source or destination IP address, capturing host-level relationships in the graph.
To capture short-term dependencies in network activity, we connect flows that occur within a predefined time-window Δt [42]:
e i j = 1 , if   t i t j Δ t , 0 , otherwise .
where ti and tj denote the timestamps of flows fi and fj. This connectivity is particularly useful in detecting DDoS attacks, where multiple attack flows are initiated within a short time frame. To capture both host-level and temporal dependencies, we define the final adjacency,
e i j = A i j I P     A i j Δ t
where an edge is present if either IP-based or time-window-based connectivity holds. Neither rule overrides the other; flows satisfying both still yield a single edge.
Once edges are established, we construct the adjacency matrix A, where
A i j = e i j
To stabilize learning in graph convolutional processing, we introduce the degree matrix D, which stores the number of connections each node has:
D i i = j A i j
The final normalized adjacency matrix is computed using symmetric normalization [8]:
A ^ = D 1 2 ( A + I ) D 1 2
This normalized representation ensures that message propagation within the graph is balanced, preventing nodes with a high degree from dominating the learning process [43]. The resulting graph ( G = V , E , X , A ^ ) is used as an input for subsequent feature embedding and anomaly detection modules.
Algorithm 1. Graph Construction from CIC-IDS2017 Dataset
Require: Dataset 𝒟 containing network flows
Ensure: Graph 𝒢 = (𝒱, ε, X, Â)
1.   Initialize empty node set 𝒱 = ∅ and edge set ε = ∅
2.   Initialize empty feature matrix X = []
3.   for each flow fᵢ ∈ 𝒟 do
4.       Extract feature vector:
xᵢ = [dᵢ, bᵢ, pᵢ, spᵢ, dpᵢ, protoᵢ, flrateᵢ, avgpkt_sizeᵢ, iatᵢ]
5.       Normalize features using min–max scaling:
xᵢ′ = (xᵢ − min(xᵢ))/(max(xᵢ) − min(xᵢ))
6.       Create node vᵢ with feature xᵢ′
7.       Add vᵢ to 𝒱
8.       Append xᵢ′to X
9.   end for
10. for each pair of nodes (vᵢ, vⱼ) ∈ 𝒱 do
11.      if IPsrc,i = IPsrc,j or IPdst,i = IPdst,j or |tᵢ − tⱼ| ≤ Δt then
12.          Add edge eᵢⱼ to ε
13.      end if
14. end for
15. Construct adjacency matrix A from ε:
Aᵢⱼ = eᵢⱼ
16. Compute degree matrix D:
Dᵤᵤ = ∑ⱼ Aᵤⱼ
17. Compute normalized adjacency Â:
 = D−½ A D−½
18. return 𝒢 = (𝒱, ε, X, Â)

3.2. Proposed Method

Our proposed method (see Figure 1) integrates two complementary representations of network flow data obtained from the CIC-IDS2017 dataset: a feature branch and a structure branch [29]. In the feature branch, each network flow is represented by its raw tabular or log attributes, while in the structure branch, the flows are organized as nodes in a graph whose edges capture host-based and temporal relationships. To ensure both branches can be jointly processed, we first transform the raw inputs into aligned embeddings.
Let F r a w R × f denote the raw features S r a w R × s the raw graph embeddings obtained via a GNN from the normalized graph ( G = V , E , X , A ^ ) . These are then projected into a common latent space of dimensions d using dedicated encoders E f a n d E s , respectively, so that,
F ( i )   =   E f ( F r a w )   R N × d , S ( i )   =   E s ( S r a w )   R N × d
Therefore, at the start of training, i = 0 ,   F ( 0 ) = E f F r a w   a n d   S ( 0 ) = E s ( S r a w ) are the direct outputs of the feature and structure encoders. The core of our model is the Cross-Diffused Attention (XDA) Transformer, which consists of L stacked layers that simultaneously refine the feature and structure embeddings [31]. In each XDA block, both streams first undergo multi-head self-attention to capture intra-view relationships. For example, the feature branch computes self-attention over F ( l ) to obtain an updated representation,
F = L N F ( l ) + S e l f A t t F ( l ) ,
and a similar process is followed for the structure branch [44] with S ( L ) . Given input embeddings F ( l ) R N × d , we first compute each of the h attention heads:
Q i = F l W i Q , K i = F l W i K , V i = F l W i V i = 1 , , h ,
where W i Q , W i K , W i V R d × d h , and d h = d / h . Next, each head’s output is
head i = softmax   Q i K i d h   V i .
We then concatenate and reproject all heads:
M u l t i H e a d Q , K , V = head 1 , , head h   W O , W O R d × d
Finally, the self-attention update in Equation (9) becomes
F l + 1 = LayerNorm F l + Multi H ead F l , F l , F l
Next, cross-attention is performed between the views (see Algorithm 2). In the feature-to-structure direction, the feature embeddings are first linearly projected to form queries Q F using a weight matrix W Q , while the structure embeddings are projected to be keys K S and values V S using W K and W V , respectively:
Q F = F ( l ) W Q ,   K S = S ( l ) W K ,   V S = S ( l ) W V
The raw attention scores are then computed using the scaled dot-product:
A r a w = Q F K S d
where the raw attention score matrix is computed by taking the dot-product of each query and each key and then scaling it by the square root of the embedding dimension, where d is the dimensionality of our common latent space. Invariantly, the ( i , j ) entry of A r a w is A r a w ,   i , j = q i k j d , with
q i   =   ( F l W Q ) i , : and k j   =   ( S l W K ) j , :
Here, qi is the ith query vector (row i of F l W Q ), and k j is the jth key vector (row jj of S l W K ) . Dividing by d prevents the inner products from growing too large and ensures stable gradient behavior during training. Furthermore, A r a w is normalized via softmax to yield A = s o f t m a x A r a w . To incorporate the intrinsic structural relationships of both branches, we generate a diffusion mask D (see Algorithm 3) from the self-adjacency matrices derived from F ( L ) , S ( L ) . This mask modulates the attention scores elementwise:
A = A     D
where ⊙ denotes elementwise multiplication. The final cross-attention output is then computed as follows:
X D A O u t = A V S
which is added to the original feature input through a residual connection, followed by layer normalization:
F ( l + 1 ) = L N F ( l ) + X D A O u t
An analogous process is applied in the structure-to-feature direction. This dual cross-diffused attention mechanism allows each view to leverage complementary information from the other while respecting its own internal structure.
After LXDA layers, the final embeddings F ( L ) and S ( L ) are fused—typically via concatenation—to form a unified representation:
Z = C o n c a t F ( L ) ,   S ( L )
To further enhance robustness, we introduce an entropy-based adaptive masking mechanism between the XDA block and the fusion stage. After each XDA block for each token i, we compute the Shannon entropy of the cross-attention weights for every token i:
H = j p j log p j
where pij is the (softmax-normalized) attention weight. H i thus quantifies the uncertainty in how token i attends to issues across the sequence. We then derive an adaptive mask weight m i by comparing H i to a threshold τ via a sigmoid gating:
m i   =   σ ( α   ( τ H i ) ) ,
with α as a scaling factor, and α > 0 controls the sharpness of the transition around the threshold τ. When H i τ , the attention is confident, so m i 1 preserves that token’s signal. Consecutively, when H i τ , the attention is uncertain, so m i 0 suppresses it. We recompute m i at each XDA layer, enabling the model to adaptively reweight tokens as their representations evolve. Finally, the masked output O ~ i of the XDA block is obtained through the elementwise scaling of the raw XDA output O i :
Õ = m O
This selective attenuation selectively suppresses uncertain features and ensures that only the most informative signals and low-entropy tokens contribute to the subsequent fusion and classification stages of final intrusion detection. This fused vector is then passed through a classifier (a fully connected layer with a softmax activation) to predict whether each network flow is benign or malicious. The entire pipeline is trained end-to-end with a suitable loss function (cross-entropy loss), thereby optimizing both the encoder parameters and the XDA Transformer layers for robust intrusion detection.
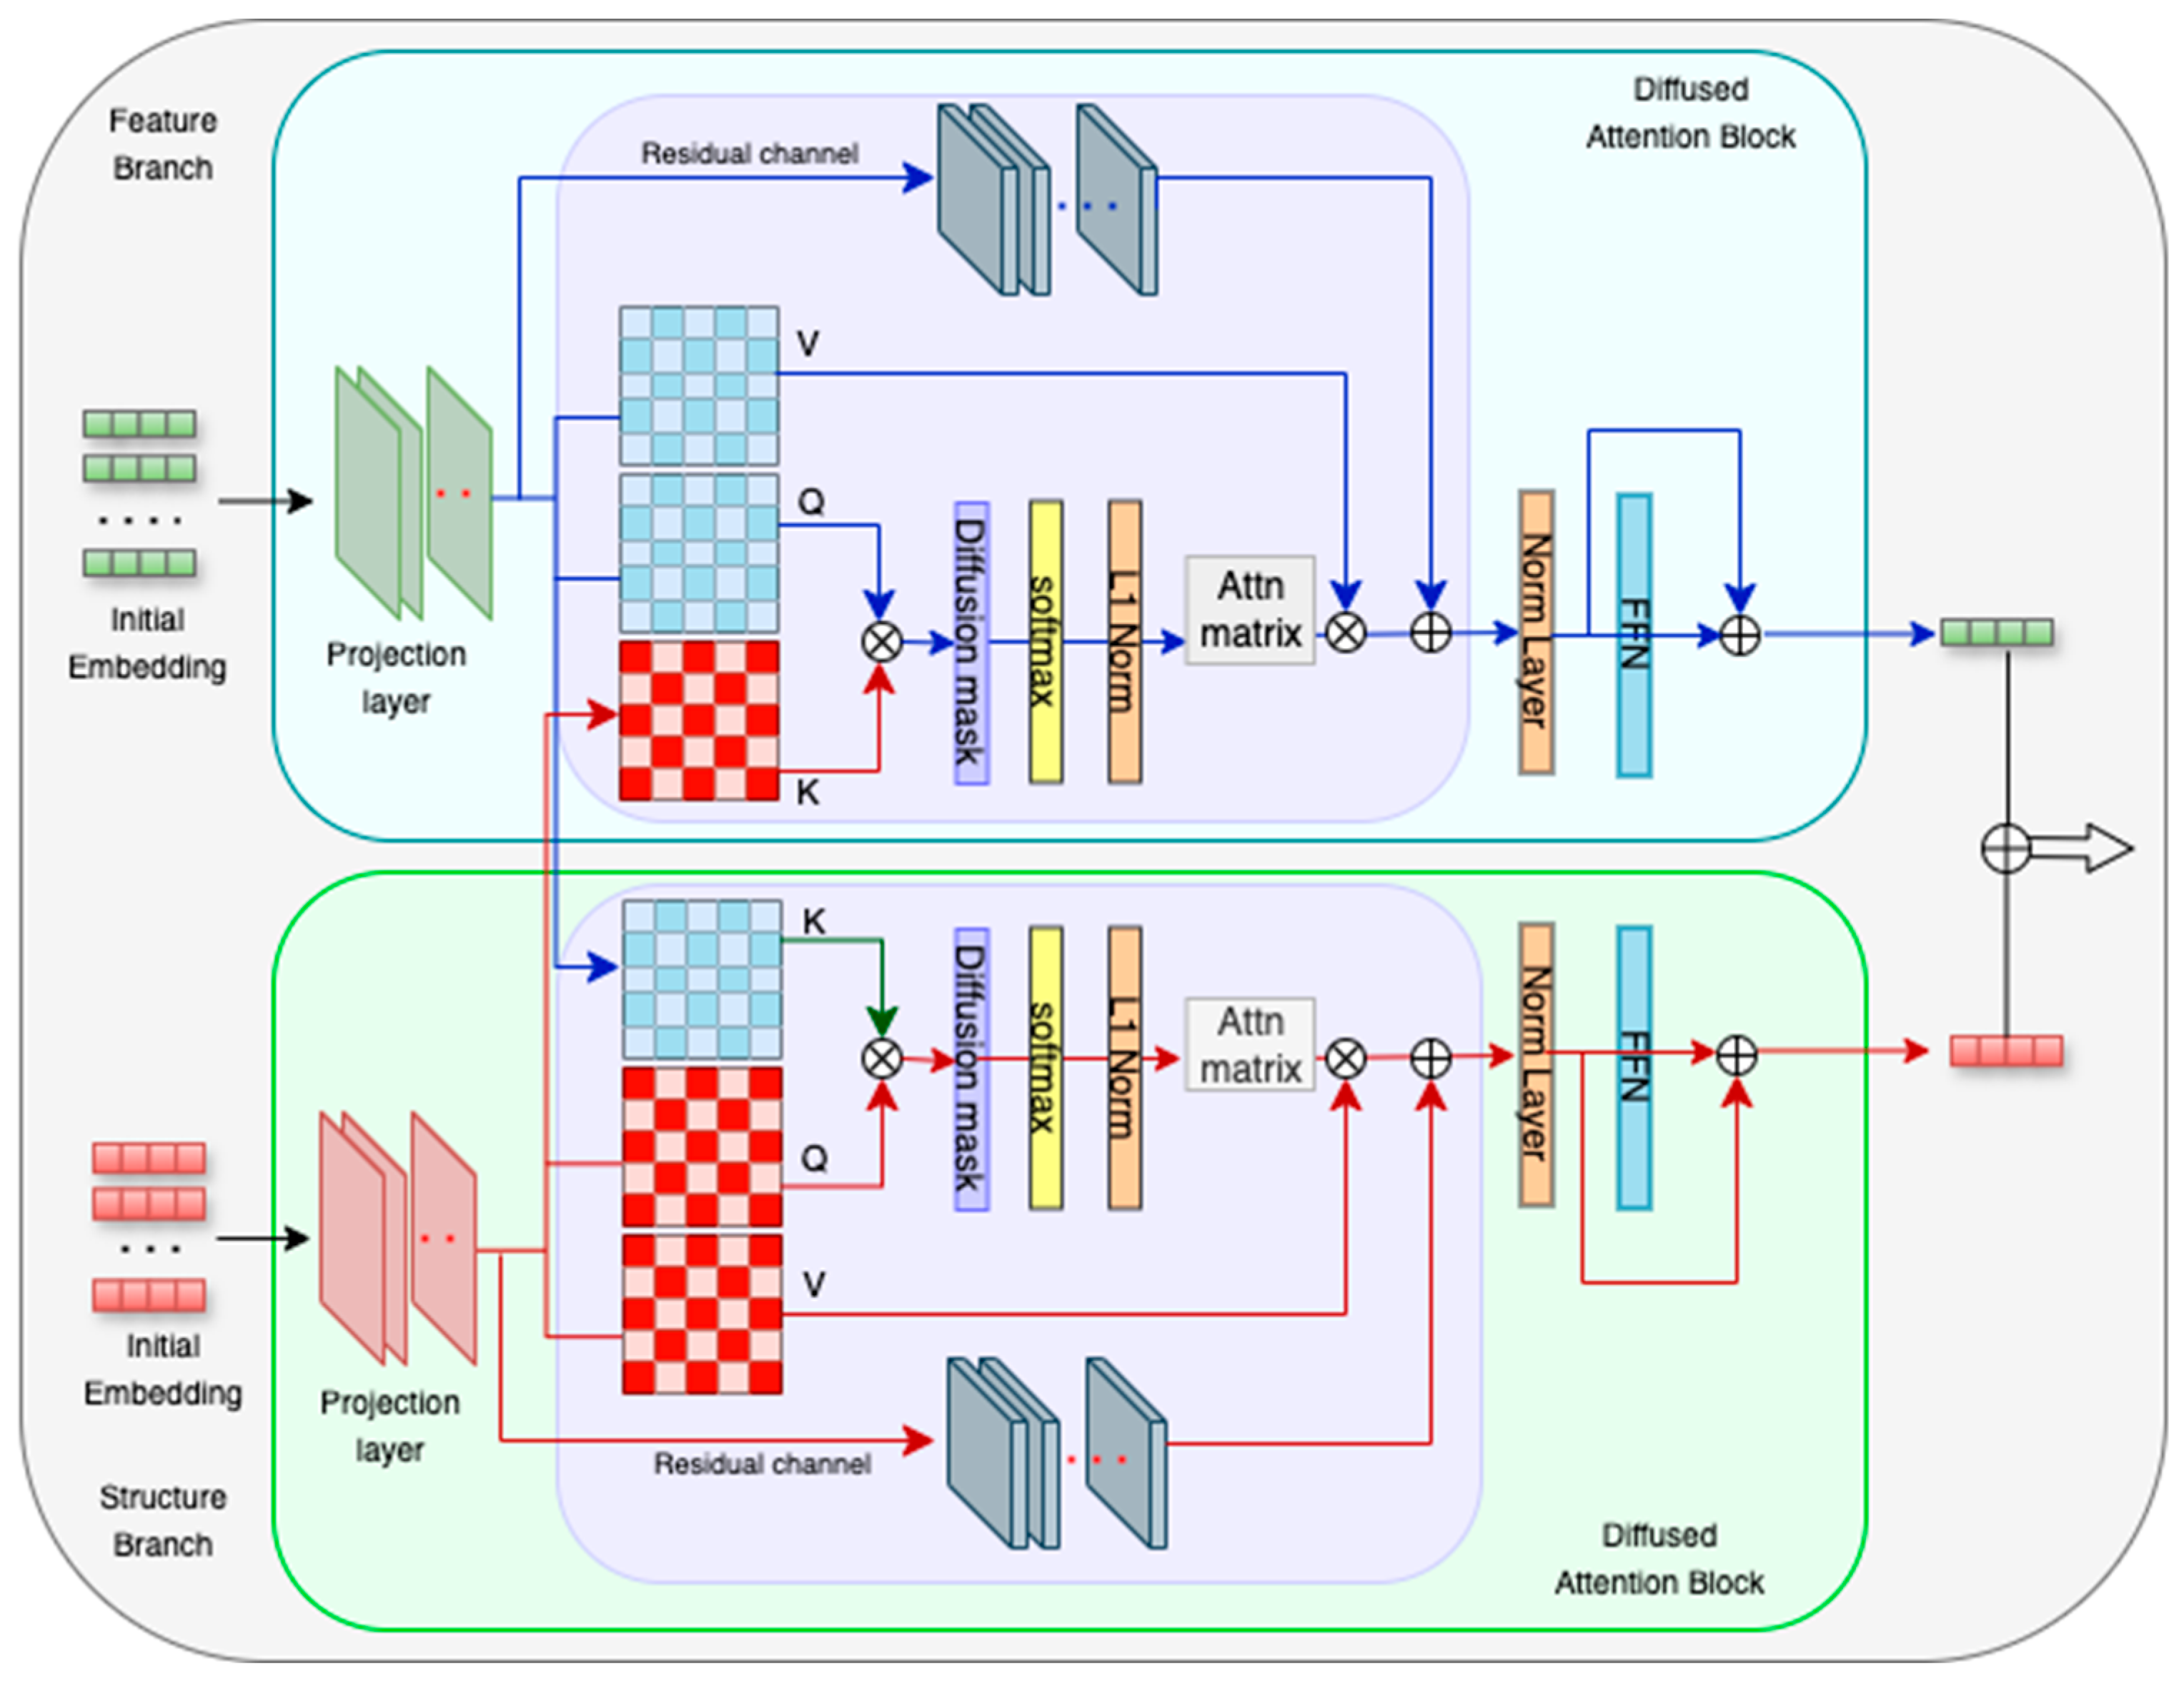
Algorithm 2. Multi-Head Cross-Diffused Attention (XDA) Block
Require: Feature embeddings F ∈ ℝN×d, Structure embeddings S ∈ ℝN×d, Number of heads H
Ensure: Updated feature embeddings Fout ∈ ℝN×d

1.   dh ← d/H
2.   Initialize list O ← []
3.   for h ← 1 to H do ▷ Multi-head linear projections
4.       Q(h) ← F · WQ(h)      ∈ ℝN×dh
5.       K(h)      ← S · WK(h) ∈ ℝN×dh
6.       V(h)      ← S · WV(h) ∈ ℝN×dh
7.       Araw(h)    ← Q(h)·(K(h))T/√dh ▷ Compute raw attention scores
8.       A(h) ← softmax(Araw(h))
9.       D(h) ← DIFFUSION(F, S)      ▷ Generate diffusion mask based on intra-view similarities
10.    Amod(h) ← A(h) ⊙ D(h)          ▷ Modulate attention scores
11.    O(h) ← Amod(h) · V(h)          ▷ Compute head output
12.    Append O(h) to O
13. end for
14. O ← Concat(O(1), O(2), …, O(H))
15. XDAOut ← O · WO
16. Fout ← LayerNorm(F + XDAOut)
17. return Fout
Algorithm 3. Diffusion Mask Generation
Require: Feature embeddings F ∈ ℝN×d, Structure embeddings S ∈ ℝN×d
Ensure: Diffusion mask D ∈ ℝN×N

1.   for i ← 1 to N do
2.       for j ← 1 to N do
3.           sF ← sim(Fi, Fj)           ▷ Feature-view similarity
4.           sS ← sim(Si, Sj)           ▷ Structure-view similarity
5.           Dij ← f(sF, sS)           ▷ e.g., √(sF · sS) or a learnable function
6.        end for
7.   end for
8.   return D

3.2.1. Cross-Diffused Attention (XDA) Block

In our approach, the XDA block (see Figure 2) fuses feature and structure representations by integrating diffusion-based modulation into the cross-attention mechanism. Given feature embeddings F R × and structure embeddings S R × , we first compute their linear projections to obtain queries, keys, and values as follows:
Q = F   W Q ,   K = S   W K ,   V = S   W V
where W Q , W K , and W V are learnable weight matrices. This is unlike standard attention, which computes weights as A (Equation (11)).
We incorporate a diffusion function Δ(F, S) that accounts for intra-modal connectivity. The modulated attention is then computed as follows:
A = s o f t m a x Q K   d + Δ F ,   S
The formulation for the diffusion term is,
Δ F ,   S = log 1 + exp c o s i n e F ,   F k N exp c o s i n e S ,   S
where cosine(⋅,⋅) is the cosine similarity between vectors. The output of the XDA block is computed,
𝑂 = 𝐴 ∗ 𝑉,
and integrated into the original feature representation via a residual connection and layer normalization:
F o u t = L N F + O
This mechanism ensures that the attention weights are dynamically adjusted not only through cross-modal interactions but also the inherent diffusion characteristics of each view. The embeddings are iteratively refined by incorporating a Learnable Co-occurrence Matrix (LCM), which adaptively captures the dynamic relationships between features and structures. Formally, the embedding at iteration t + 1 is updated as follows:
E ( i + 1 )   = φ   [ α   ( L C M   E ( i ) )   +   ( 1 α )   E ( i ) ] ,
where Et represents embeddings at iteration t, φ(·) denotes an element-wise non-linear activation function, LCM is the Learnable Co-occurrence Matrix updated during training, σ(⋅) denotes a non-linear activation function, and α is a learnable weighting parameter that balances previous embeddings and LCM-driven updates. Intuitively, the Learnable Co-occurrence Matrix (LCM) can be viewed as a dynamic memory of feature–structure pairings that frequently co-activate during training. Each entry LCM i j represents the learned strength of the association between the ith feature token and the jth structural token. During iterative refinement (Equation (25)), strongly co-occurring pairs boost each other’s representations. The end-to-end update procedure of the architecture is explained in Appendix A (Algorithm A1).

3.2.2. Fusion Block and Classifier

Following the series of XDA blocks, the network produces two refined embedding streams—one from the feature branch and one from the structure branch, denoted as FL and SL, respectively. To effectively combine these complementary representations, we employ an adaptive fusion block based on a gating mechanism. Specifically, we compute a gating vector g:
g = σ W g F ( L ) S ( L ) + b g
where σ(⋅) is the sigmoid function, ⨁ denotes concatenation, and Wg and bg are learnable parameters—i.e., Wg ∈ ℝd×2d and bg ∈ ℝd are the trainable weight matrix and bias vector—updated via gradient descent. They control the gating function σ(·), determining how much each of the two embedding streams contributes to the final fused representation. The fused representation Z is then derived as follows:
Z = g F ( L ) + 1 g S ( L )
where ⊙ represents elementwise multiplication. This adaptive fusion enables the model to dynamically balance the contribution of each view based on the learned gating weights. Finally, the unified representation Z is processed by a two-layer feed-forward network with ReLU activation, culminating in a softmax classifier:
ŷ = s o f t m a x W 2 R e L U W 1 Z + b 1 + b 2
The gating mechanism acts as a soft, learnable ‘switch’ that balances the contributions of the feature and structure branches. The gating vector g (Equation (26)) is computed by passing the concatenated branch embeddings through a sigmoid layer. Values of g close to 1 emphasize flow-based information, while values near 0 emphasize structural context. This allows the network to adaptively weight each view according to which one provides more reliable signals for a given flow. This final classification stage robustly integrates the information captured from both the feature and structure domains, facilitating accurate discrimination between benign and malicious network flows. The overall explanation of the definitions mentioned above are explained in Appendix B.

4. Experimental Results

In this study, we propose a novel intrusion detection network that leverages the unique capabilities of Diffusion Attention to fuse heterogeneous representations [38]. XGANet integrates two complementary views of network traffic: a feature branch derived from raw tabular/log data and a structure branch obtained via a graph constructed from network flows. The core innovation lies in the XDA module, which augments the standard cross-attention mechanism by incorporating diffusion information derived from the intrinsic connectivity of the graph [44]. This mechanism allows the network to emphasize critical relationships, enhancing its ability to detect subtle and coordinated attack patterns. By combining these dual perspectives in a unified transformer architecture with residual connections and adaptive fusion, XGANet achieves robust performance in distinguishing malicious activity from benign traffic [45].

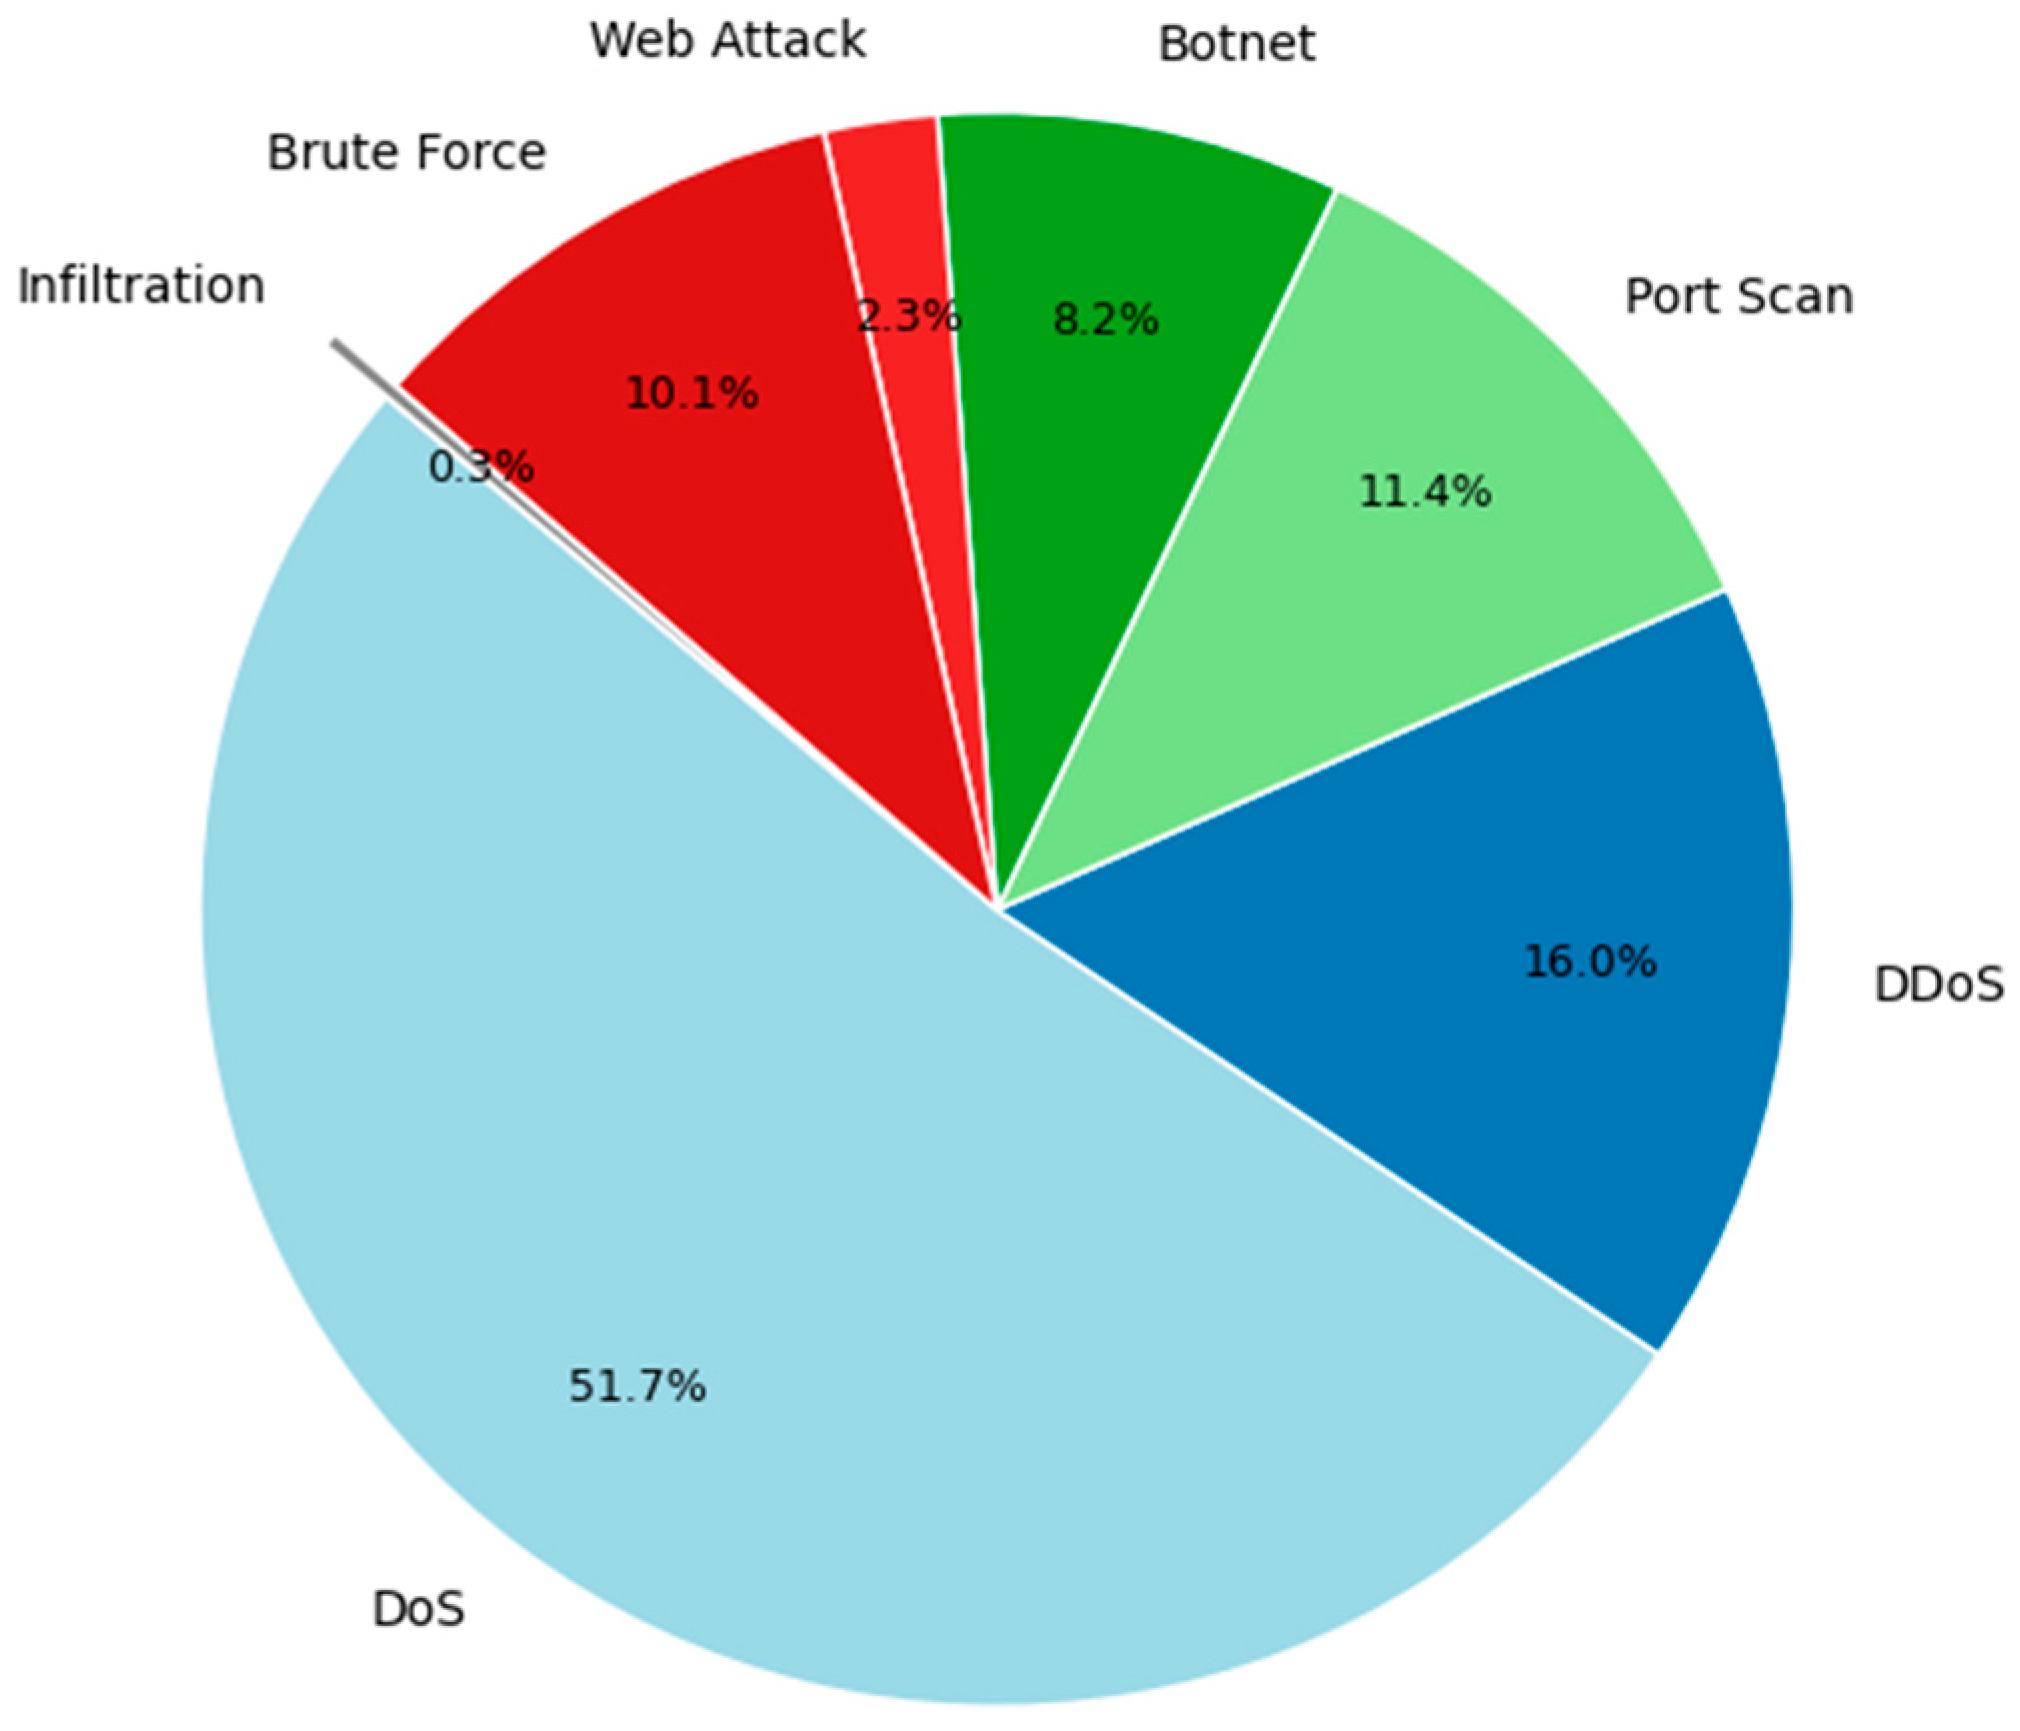
4.1. Dataset Description

In this research, we utilized the CIC-IDS2017 dataset, a comprehensive benchmark widely used for evaluating intrusion detection systems (see Figure 3) [46]. This dataset was generated by the Canadian Institute for Cybersecurity (CIC) and simulates real-world network traffic with a variety of contemporary attacks executed within a controlled environment. The dataset includes diverse attack types, such as DoS, DDoS, Port Scan, Botnets, Brute Force, and infiltration attacks, along with benign traffic, thereby providing a rich set of scenarios for evaluating intrusion detection methods [47]. The traffic was recorded over five days, with each day featuring different combinations of attack scenarios and normal activities, resulting in over 2.8 million records across approximately 80 distinct features [48]. Table 1 provides an overview of the dataset’s attributes, including network flow properties such as flow duration, total bytes, total packets, protocol types, inter-arrival time, and source/destination information [16].
Table 2 below provides details on the post-preprocessing of the dataset, highlighting critical adjustments made to effectively support the graph-based intrusion detection task.
To facilitate feature extraction, we divided our approach into two distinct views: feature branch and structure branch. Table 3 and Table 4 illustrate the specific features extracted for each view. Table 5 illustrates the detailed distribution of the dataset.

4.2. Setup of the Experiments

Our experimental evaluation was conducted using the preprocessed CIC-IDS2017 dataset, as described in Section 4.1. In this Section, we outline the system configuration, data preprocessing, training protocols, and hyperparameter settings that were employed to assess the performance of XGANet, with its novel Cross-Diffused Attention (XDA) module [49].
All training and data-processing experiments were implemented in PyTorch version 1.8.1 and executed on a high-performance computing platform, an Intel i7-7700K, equipped with an NVIDIA GTX 1080 Ti (Santa Clara, CA, USA) GPU and 16GB of memory. The experiments were conducted using Ubuntu 18.04, using Python 3.8 and CUDA 10.2 to ensure computational efficiency and reproducibility [13].
Prior to model training, the dataset was partitioned into training and testing sets using an 80/20 stratified split to maintain class distribution. Data preprocessing included normalization of continuous features using min–max scaling and the construction of the graph G = V , E , X , A ^ , where A ^ is obtained via symmetric normalization [15]:
A ^ = D 1 / 2 A D 1 / 2 ,
with D representing the degree matrix. This graph serves as the backbone for generating the structure branch embeddings via GNN. For both branches, raw inputs were passed through dedicated encoders to produce embeddings in a common latent space of dimension d. These embeddings then served as inputs for our multi-layer XDA transformer [7]. In our experiments, we set the number of transformer layers, L, to 4, with each layer consisting of multi-head cross-attention (with H = 8 heads) and feed-forward sub-layers. Residual connections and layer normalization were employed after each sub-layer to stabilize training and facilitate gradient flow.
In the training process, we utilized the Adam optimizer with an initial learning rate of 1 × 10⁻⁴ and a weight decay of 5 × 10⁻⁵. The model was trained for 100 epochs with a mini-batch size of 128. Early stopping based on validation loss was implemented to prevent overfitting. Our loss function is the categorical cross-entropy, defined as
L = i = 1 C y log ŷ
where C is the number of classes, yi represents the true label, and ŷ denotes the predicted probability for the ith class [41].
The evaluation metrics used include accuracy, precision, recall, F1 score, and area under the receiver operating characteristic curve (AUC), which collectively provide a comprehensive assessment of a model’s performance in detecting malicious activity [11]. The evaluation was carried out on the test set after the training process was complete.
A c c u r a c y = T P + T N T P + T N + F P + F N
where TP, TN, FP, and FN denote true positive, true negative, false positive, and false negative, respectively.
Precision is calculated as follows:
  P r e c i s i o n = T P T P + F P
Recall is calculated as follows:
R e c a l l = T P T P + F N
The F1 score is calculated as follows:
F 1 s c o r e = 2 × p r e c i s i o n × r e c a l l p r e c i s i o n + r e c a l l
Overall, this experimental setup is designed to allow a rigorous evaluation of the effectiveness of XGANet and its XDA module in fusing multi-view data for intrusion detection, ensuring that both localized and global patterns in network traffic are effectively captured.

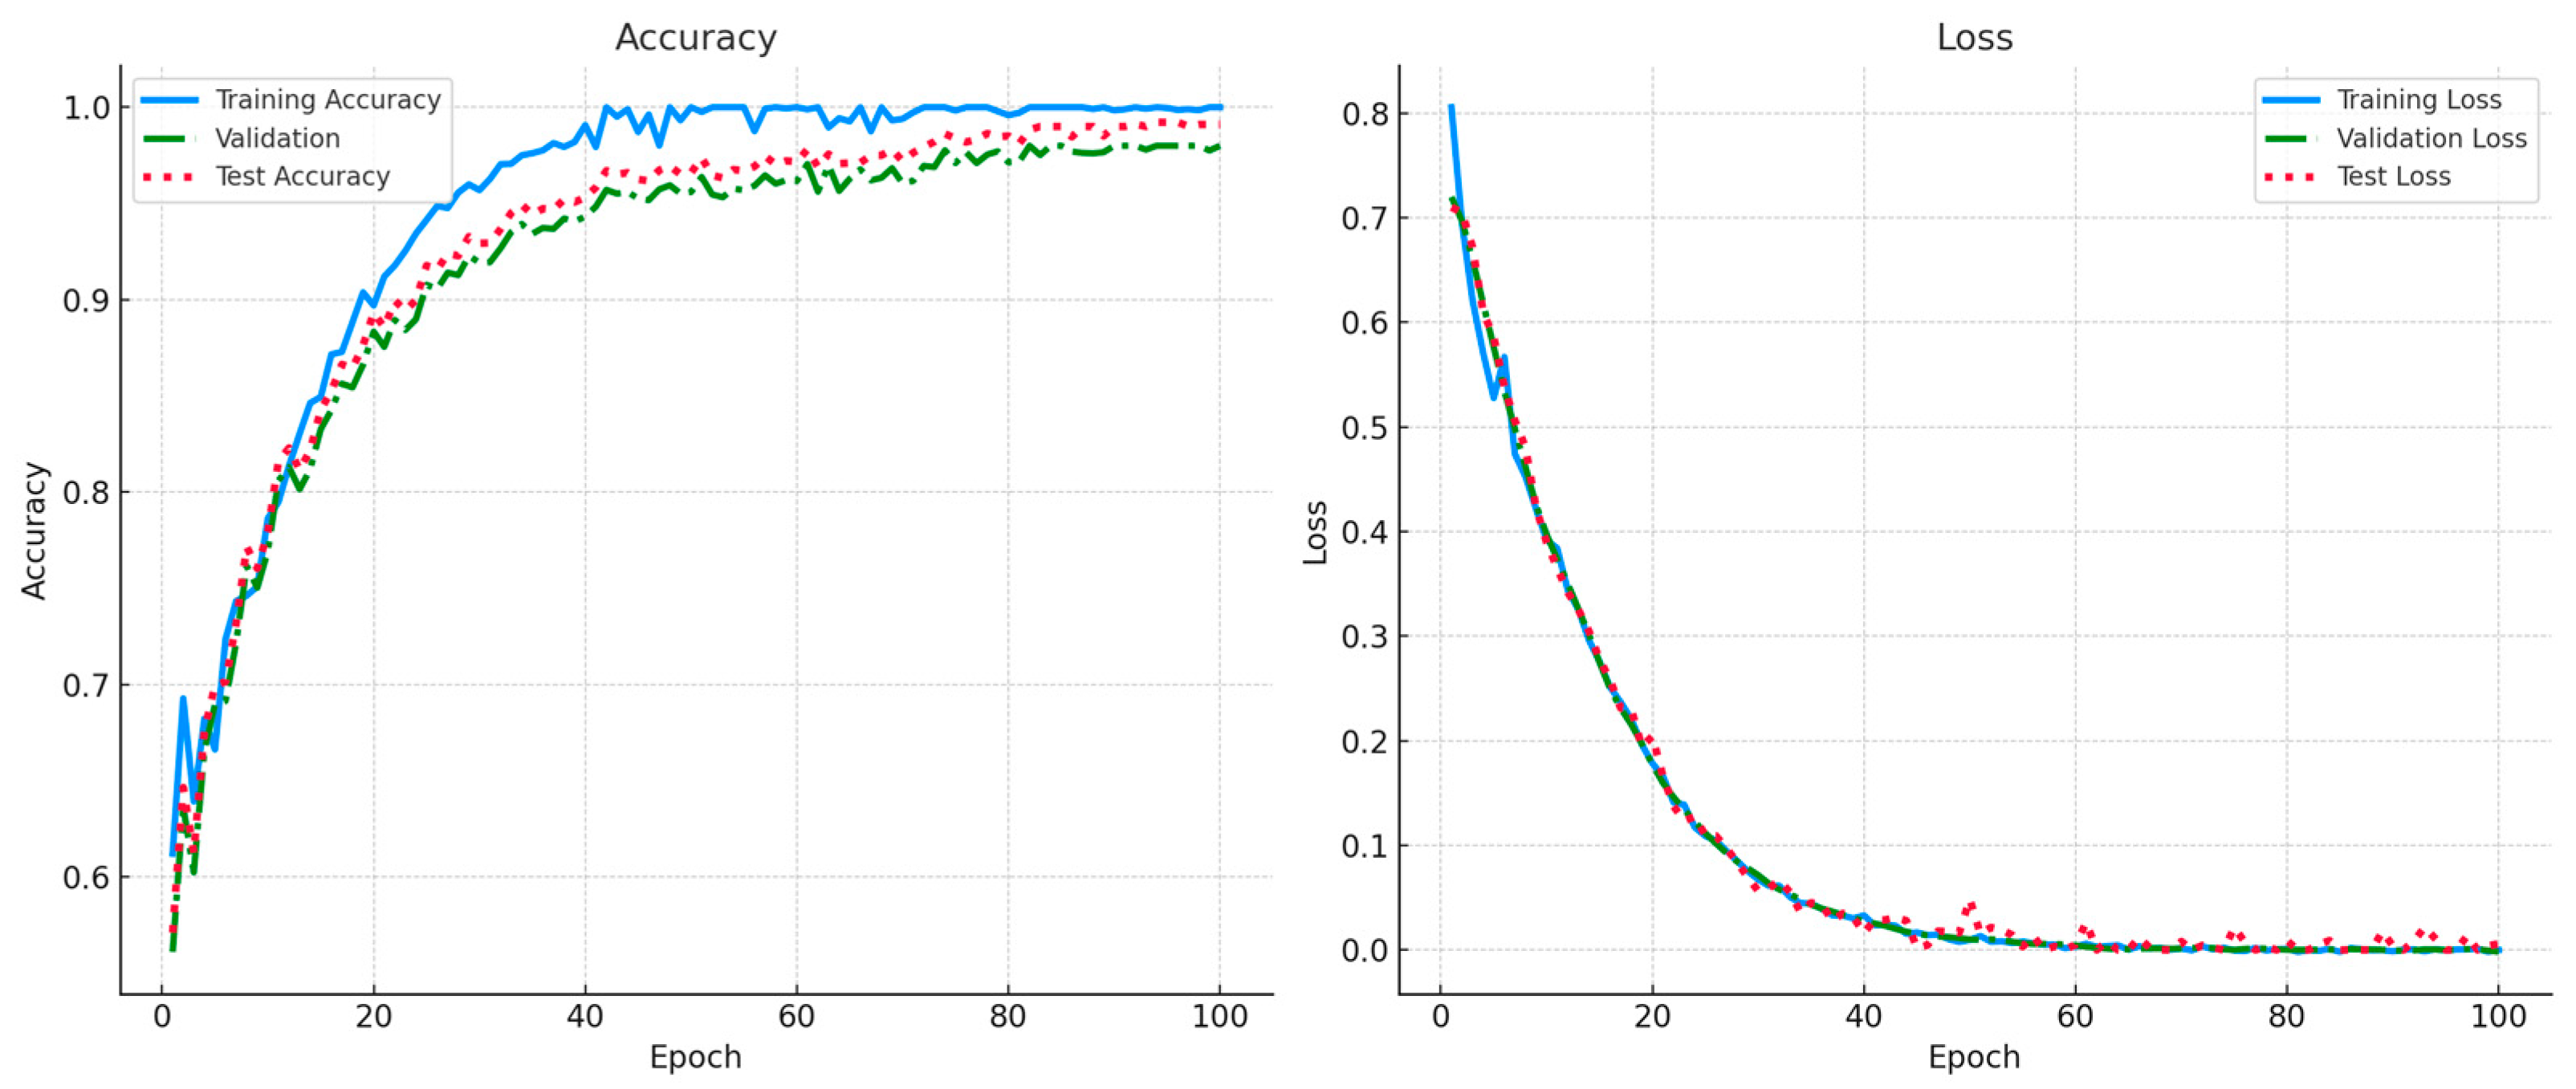
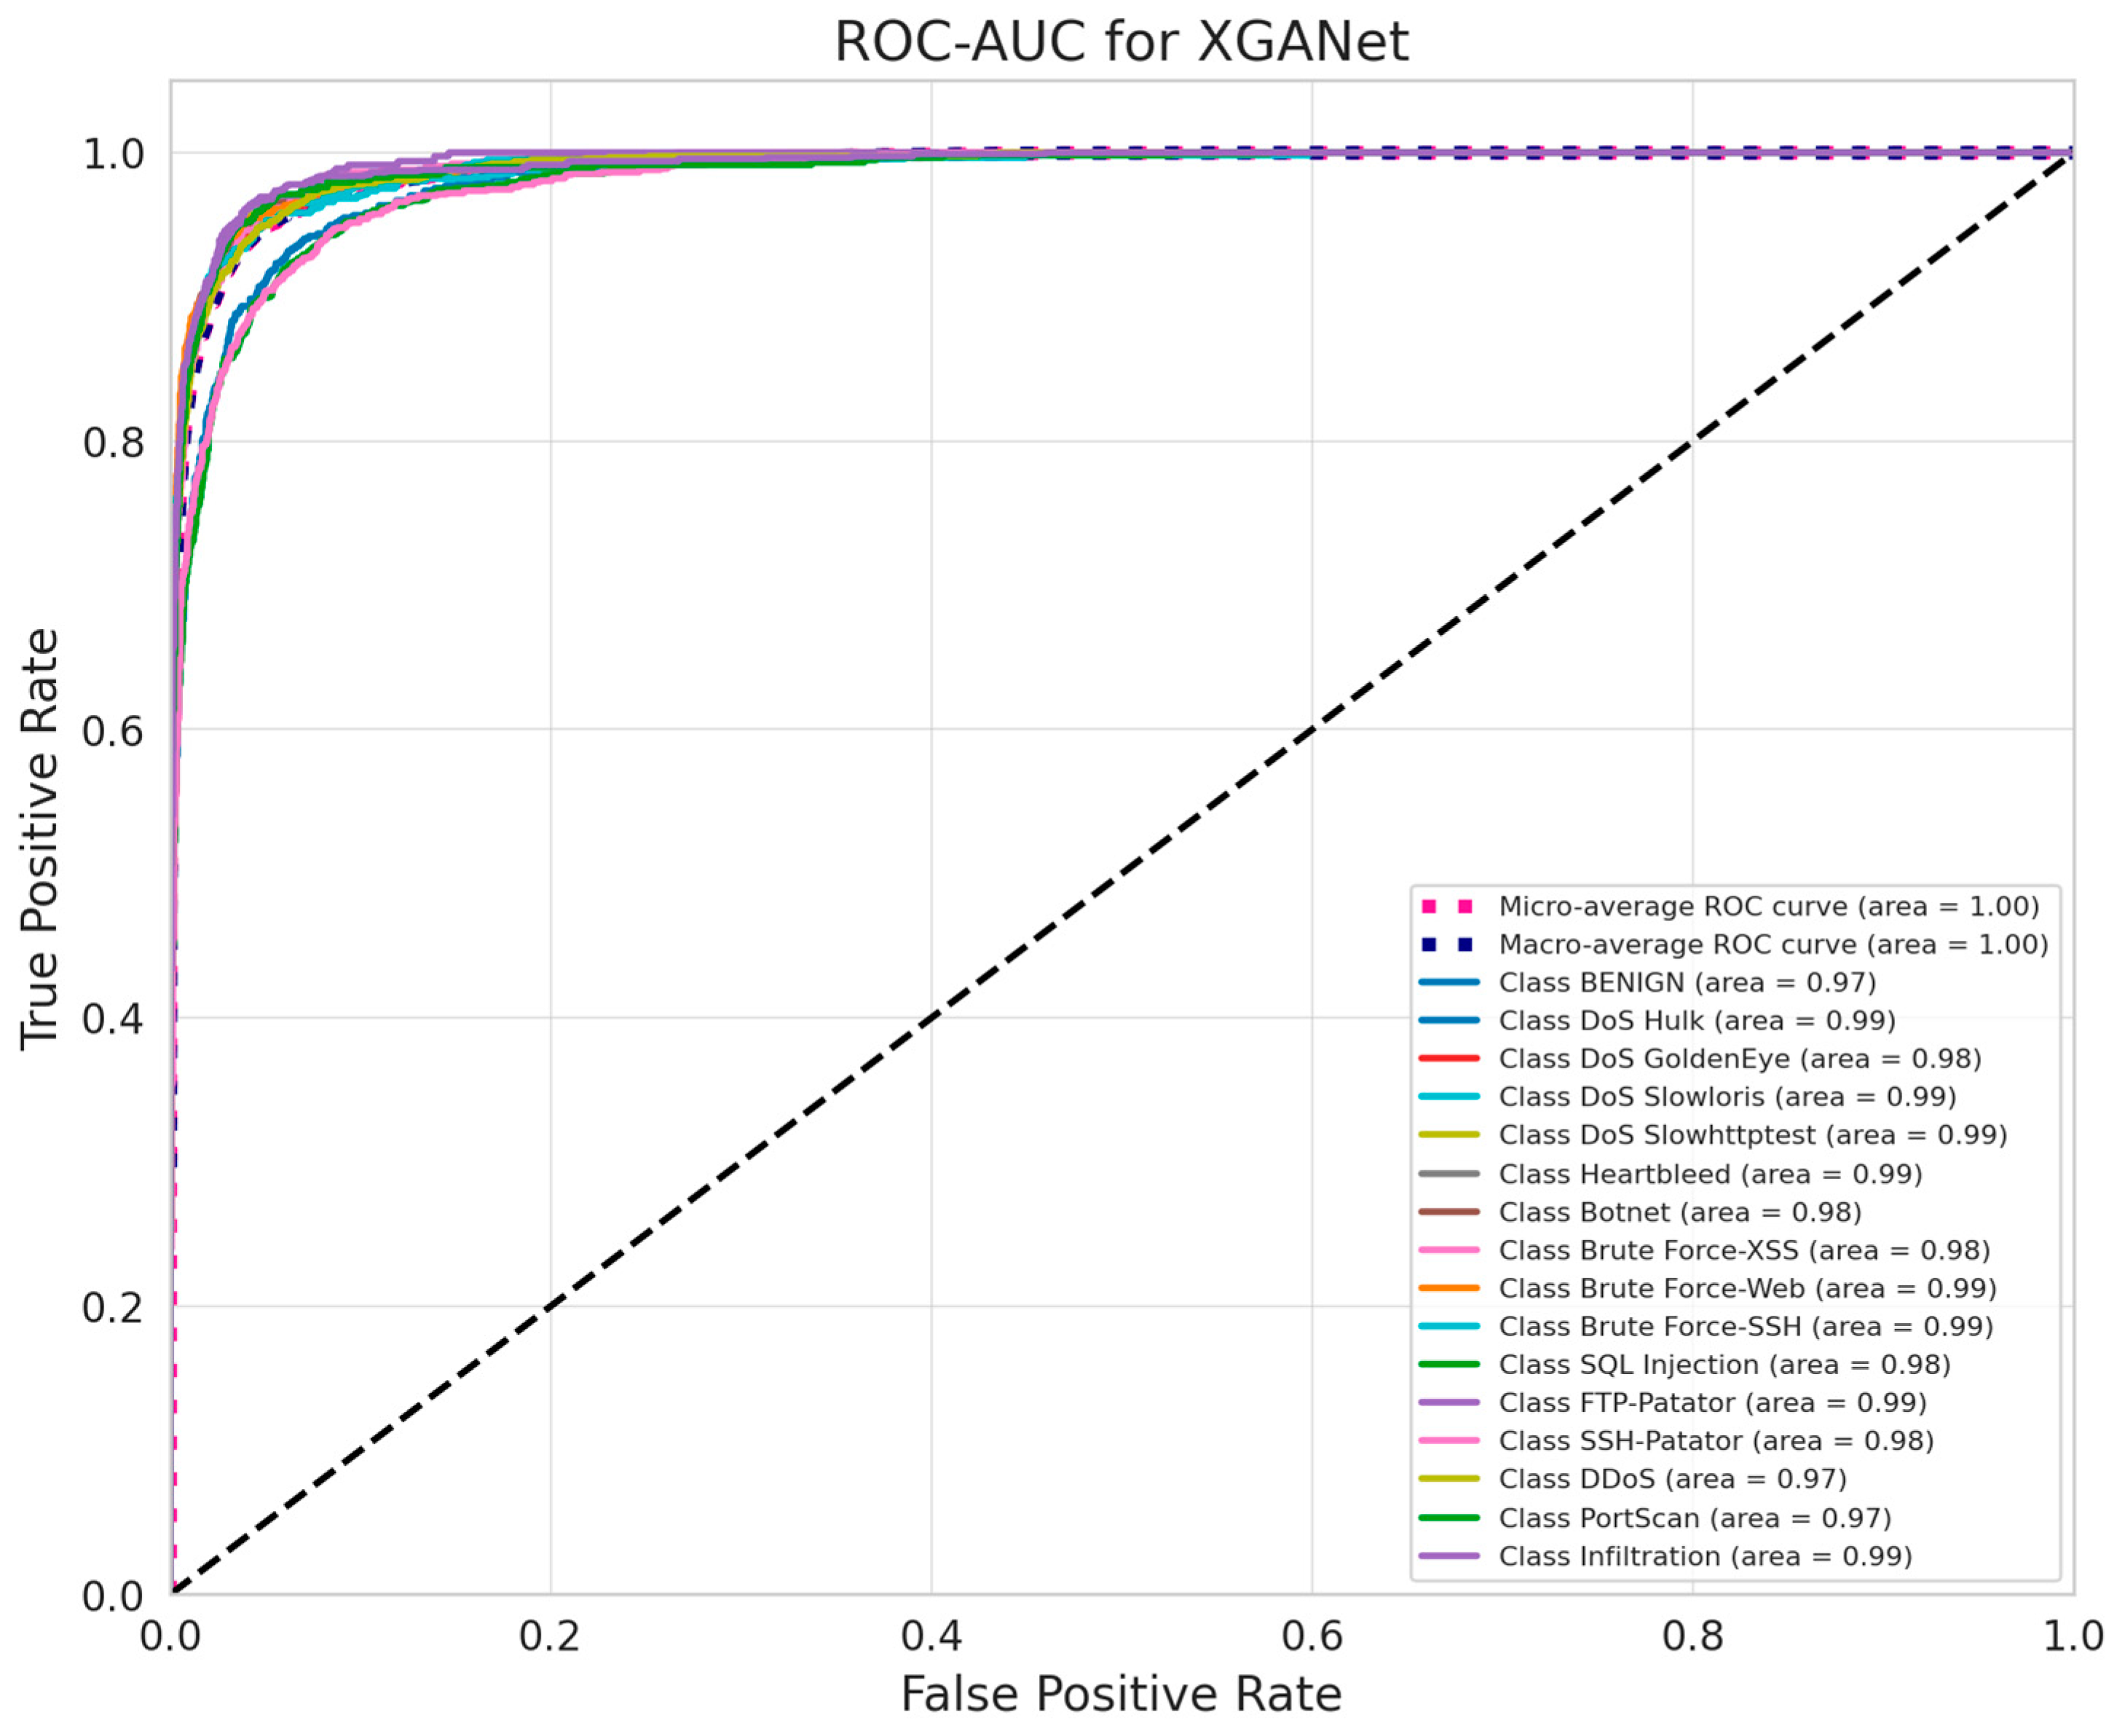
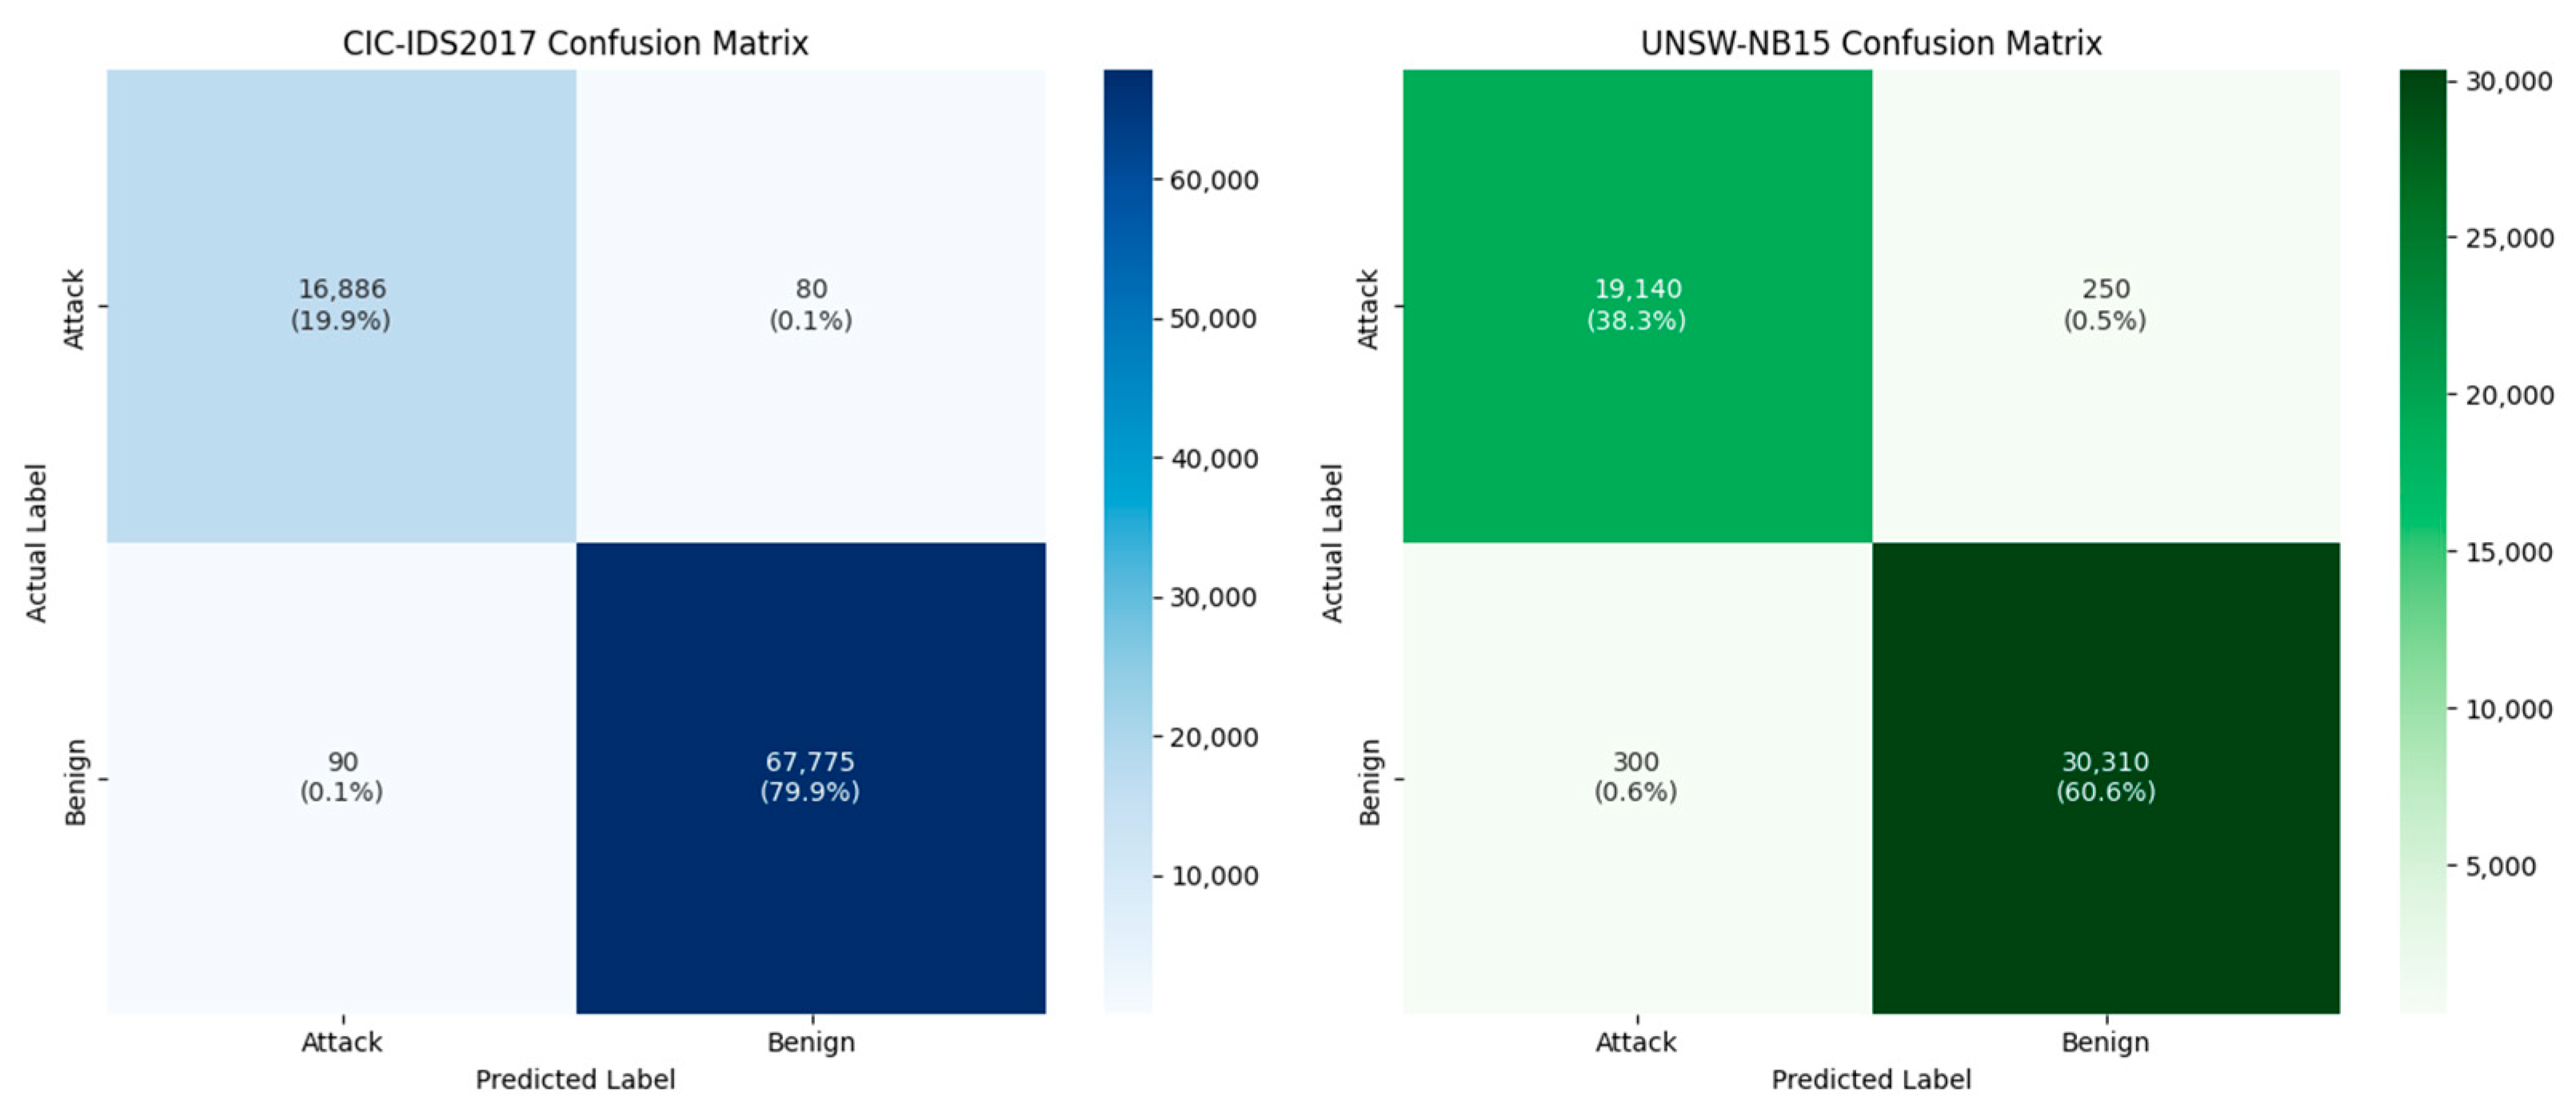
4.3. Performance Evaluation

This Section presents the experimental results and a quantitative evaluation of our proposed XDA approach with respect to the CIC-IDS2017 dataset. We begin by detailing the per-class classification metrics; this is followed by an N-round evaluation demonstrating robustness over multiple runs. Finally, we compare our method against conventional approaches to underscore its superiority in both accuracy and loss.
Table 6 shows the classification accuracy, precision, recall, and F1 score for each class in the CIC-IDS2017 dataset. We include the number of flows (Count) in each category to emphasize the class distribution. The results demonstrate that our method attains near-perfect performance across a range of attacks as well as for benign traffic.
Overall, our model achieved an accuracy of 99.8% across all classes, with most attack types exceeding 98% in terms of F1 score. These figures highlight the model’s ability to handle both frequent and less frequent attack scenarios effectively, demonstrating consistent robustness. To assess the stability of our model, we conducted N-round evaluations, where the model was trained and tested multiple times under identical settings. Table 7 summarizes the mean, standard deviation, minimum, and maximum values for accuracy, precision, recall, and F1 score [14] across these rounds. The minimal standard deviation indicates a highly stable performance from run to run.
These results confirm that the proposed XDA consistently delivered high accuracy (near 99.8%) and near-perfect precision/recall across multiple runs. The negligible variation (less than 0.1% in most cases) underscores this approach’s reliability and reproducibility. Figure 4 depicts the training, validation, and test curves for both accuracy and loss over 100 epochs of training. The model rapidly converges to above 97% accuracy within the first 40 epochs, eventually exceeding 99% by epoch 70. Simultaneously, the loss function decreases sharply to near 0.02 for training and validation, indicating minimal overfitting.
To contextualize our results, we compared the proposed XDA approach to four baseline methods frequently employed in intrusion detection: Naive Bayes, SVM, CNN, and a standard transformer. Figure 5 presents a dual-axis chart where bars represent accuracy, and a dashed line denotes loss. Our approach exhibits performance superior to all the baselines, achieving the highest accuracy (around 99%) and the lowest loss (approximately 0.25).
Our performance evaluation confirms that the proposed XDA model excels in both classification metrics (accuracy, precision, recall, and F1 score) and overall detection stability across multiple experimental runs. The near-perfect detection of various attack types, coupled with minimal variance in repeated trials, highlights the model’s robustness. Comparisons against baseline approaches further verify that our cross-diffused attention mechanism significantly enhances intrusion detection, enabling the model to achieve high accuracy and low loss simultaneously. The ROC-AUC graph for XGANet presents the results of our experiment conducted using the CIC-IDS2017 dataset, where we evaluated the model’s classification performance across multiple attack classes. Additionally, we observed slight variations in class-specific performance, with some attack types achieving AUC scores of 0.98 and 0.97, reflecting minor classification challenges while maintaining high detection accuracy (see Figure 6). These results validate XGANet’s ability to distinguish between different network traffic patterns with high precision.

5. Ablation Study

In this Section, we rigorously evaluate the contribution of each component of our proposed XGANet model with its novel Cross-Diffused Attention (XDA) module. An ablation study is designed to assess overall performance across multiple benchmark datasets and compare our approach against a range of state-of-the-art (SOTA) intrusion detection methods. The results demonstrate not only the effectiveness of the XDA mechanism in capturing both local and global patterns in network traffic but also the superior generalizability and efficiency of our model.

5.1. Performance Across Datasets

To validate the robustness and generalization capability of our model, we conducted experiments on three widely used datasets: CIC-IDS2017, UNSW-NB15, and CIC-IDS2018. Table 8 summarizes the performance metrics (accuracy, precision, recall, F1 score, and AUC) achieved by XGANet on these datasets. Our model achieved the highest performance on CIC-IDS2017 (with an accuracy of 99.8%) and maintained competitive performance on UNSW-NB15 and CIC-IDS2018, thus confirming its ability to adapt to diverse network environments. Figure 7 provides a visualization of our holistic assessment of our model’s effectiveness for the datasets, highlighting trade-offs between detection robustness and computational feasibility in real-world intrusion detection systems.
These results confirm that our approach consistently delivered near-perfect performance, with minimal variation across different datasets, thereby establishing the robustness and wide applicability of XGANet.

5.2. Comparison with State-of-the-Art Methods with Respect to CIC-IDS2017

In order to highlight the impact of our novel diffusion-based attention mechanism, we compared XGANet with several SOTA methods frequently employed in intrusion detection research [50]. In addition to conventional models such as CNN-based models, standard GCNs, and Transformers with basic cross-attention, we also included more advanced architectures such as CNN-LSTM, Graph Attention (GAT) networks, and Deep Belief Networks (DBNs) [51]. Table 9 details the performance metrics along with the training time per epoch for each method with respect to the CIC-IDS2017 dataset. Our proposed model achieved an accuracy of 99.8%, with superior precision, recall, and F1 scores, while also maintaining a competitive time complexity of 0.50 s per epoch [52]. These results clearly indicate that our model outperformed all the other approaches with which it was compared. The table demonstrates that XGANet not only achieves significantly higher accuracy and F1 scores compared to traditional models but also offers lower or comparable training times per epoch. This balance between performance and efficiency is crucial for real-time intrusion detection in dynamic network environments [53].

5.3. Comparison with SOTA Architectures Regarding Time Complexity

A critical aspect of deploying an intrusion detection system is its ability to scale and respond in real-time. To further evaluate our model, we compared the time complexity of XGANet with other SOTA architectures. As shown in Table 9, although methods such as E-GraphSAGE and GAT achieve high accuracy, they require longer per-epoch training times (0.65–0.68 s) due to their more complex graph-processing mechanisms. In contrast, XGANET not only has superior accuracy but also requires only 0.50 s per epoch. This efficient performance is achieved through our streamlined diffusion-based attention mechanism, which effectively fuses multi-view data without incurring excessive computational overhead.
To further illustrate the effectiveness of our proposed XGANet model, we present the confusion matrices (see Figure 8) for two benchmark datasets—CIC-IDS2017 and UNSW-NB15. The matrices below show the distribution of correct and incorrect classifications between the two classes: attack and benign. For the CIC-IDS2017 test set, out of 84,831 flows (with approximately 16,966 attack flows and 67,865 benign flows), our model correctly classified 16,886 attack flows and 67,775 benign flows, resulting in only 170 misclassified flows (a 0.20% error rate). This near-perfect performance confirms our model’s robustness in distinguishing between malicious and benign network traffic.
For the UNSW-NB15 test set (consisting of 50,000 flows, with approximately 19,390 attack flows and 30,610 benign flows), our model achieved an overall accuracy of 98.9%. It correctly predicted 19,140 attack flows and 30,310 benign flows, with a total of 550 misclassified flows (1.1% error rate). These results further demonstrate the high detection capability of our approach even on datasets with a different distribution.
Overall, the extremely low false-positive and false-negative rates across both datasets verify that XGANet’s diffusion-based cross-attention mechanism is highly effective at capturing both local and global traffic patterns, ensuring robust performance in real-world intrusion detection scenarios. Figure 9 illustrates distinct clusters of related features, with TCP-related attributes (shown in red) concentrating on connection properties, while the service flags (SFs), in green, focus on traffic patterns. Normal traffic characteristics (in blue) form their own semantic group, allowing for clear differentiation from attack patterns. The highlighted attack nodes demonstrate how specific attack types associate with particular feature combinations, enabling more accurate detection and classification. This semantic approach to feature representation enhances interpretability while maintaining the rich relational information necessary for effective network intrusion detection systems.

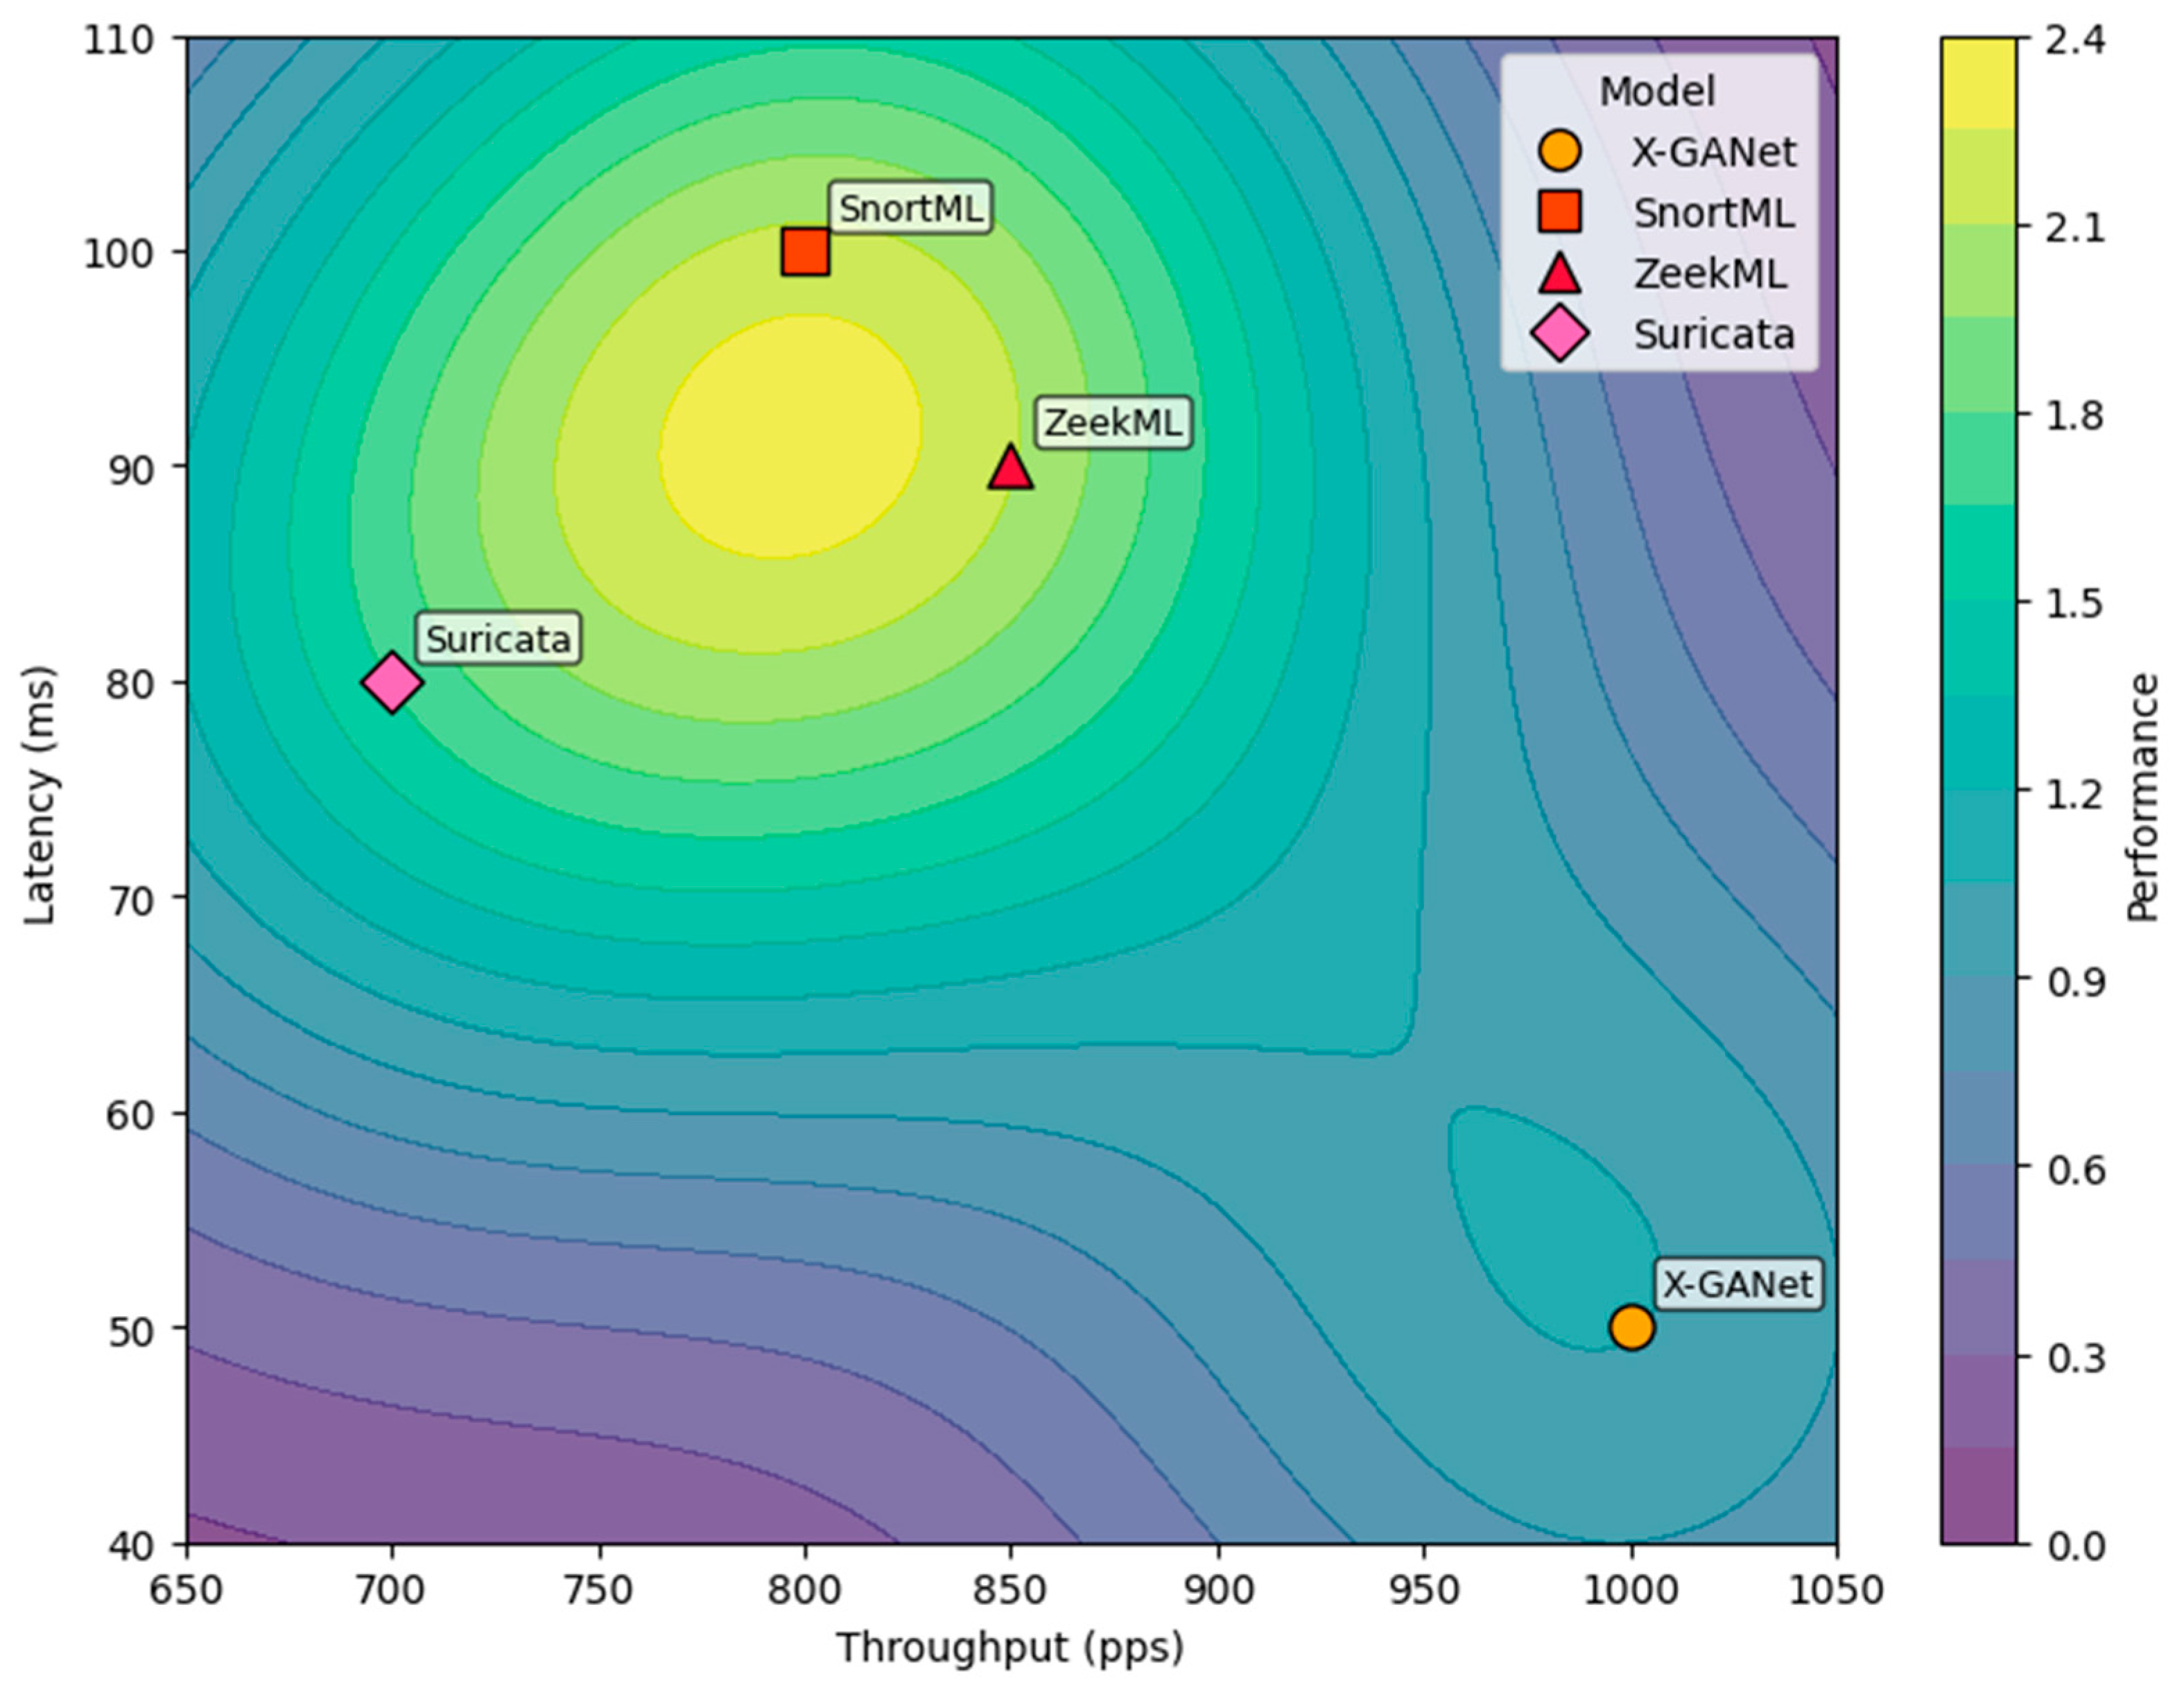
5.4. Operational Testbed Evaluation

To assess real-world behavior, we deployed X-GANet alongside three representative IDSs (SnortML [54], ZeekML [55], and Suricata [56]) on a small Linux testbed generating mixed benign/attack traffic. We used a testbed consisting of four Ubuntu 18.04 servers connected over a gigabit switch. Each server ran a traffic-replay tool (Tcpreplay) to inject benign and attack traces drawn from the CIC-IDS2017 pcap files, creating a realistic mixed-traffic environment. X-GANet, SnortML, ZeekML, and Suricata were all installed on identical Ubuntu Virtual Machines (VMs), allowing us to measure each system’s end-to-end throughput, latency, CPU, and memory under the same conditions. Table 10 summarizes the key detection and resource metrics, while Figure 10 presents the resulting performance surface via an RBF performance blend of each model’s throughput vs. latency. Filled contours represent blended performance “intensity” from each model’s throughput/latency location.

5.5. Inference Efficiency and Production Scalability

To assess real-time applicability, we measured the average inference latency per flow for both the GPU (NVIDIA GTX 1080 Ti) and CPU (Intel i7-7700K). With a single GPU, X-GANet processed a batch of 1024 flows in 0.55 ms per flow (≈1820 flows/s), while for the CPU, it achieved 2.1 ms per flow (≈480 flows/s). Table 11 summarizes these results.
We also simulated a sliding-window streaming scenario (window size = 5000 flows, stride = 1000) to mimic real network traffic bursts. X-GANet sustained a throughput of ≈1600 flows/s on a GPU with end-to-end preprocessing, feature extraction, and classification.

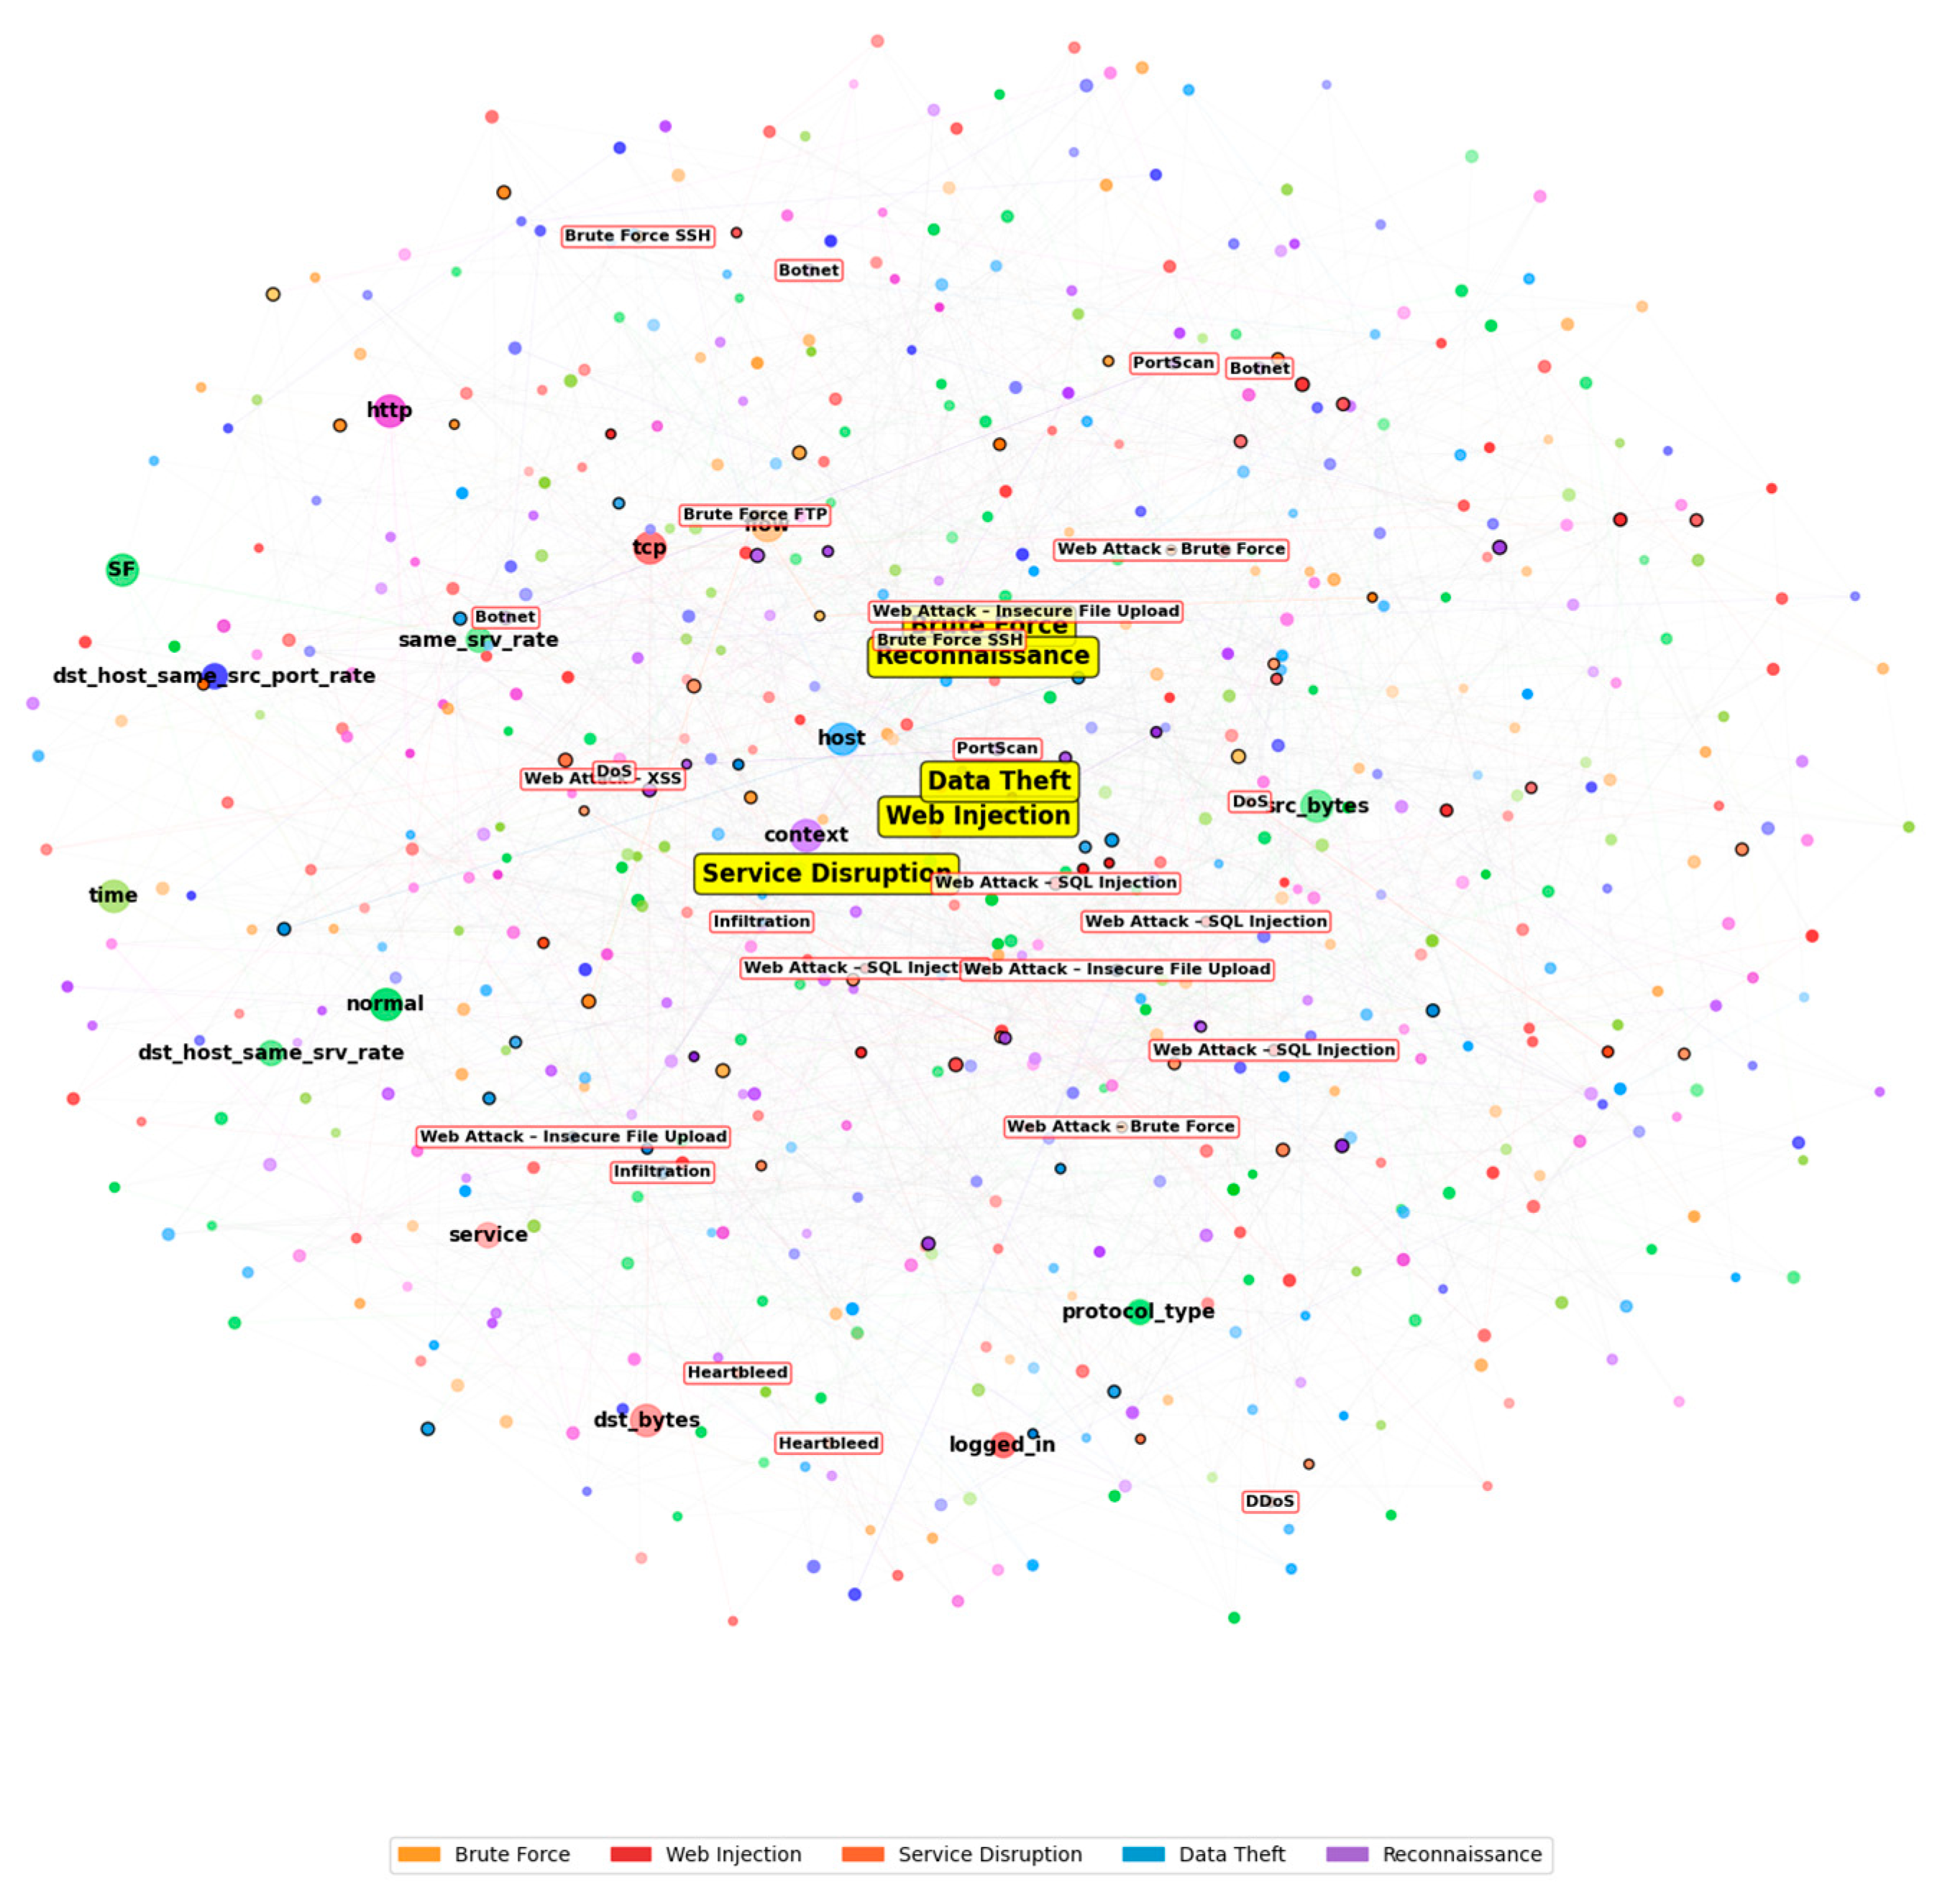
Failure Case Analysis

While X-GANet achieved near-perfect scores on most attack types, we observed a notably lower F1-score for XSS (75.8%), primarily due to the severe class imbalance (with only 500 XSS flows, amounting to 0.55% of the dataset) and the high similarity of XSS payload patterns to benign HTTP traffic. Our confusion-matrix inspection (Figure 8) shows that most misclassified XSS flows were labeled as benign, indicating that the model’s reliance on global graph context may underemphasize subtle payload anomalies. Therefore, our method represents an improvement but still lags in terms of its performance on other classes.

6. Limitations

Despite its exceptional performance, our proposed XGANet with a Cross-Diffused Attention module has several limitations that warrant further investigation. First, this model’s efficacy is highly dependent on the quality of graph construction and feature selection. Real-world network traffic can also be noisy or rapidly change, which can degrade performance if the underlying relationships are not accurately captured. Additionally, the diffusion-based attention mechanism enhances our model’s ability to integrate local and global patterns. However, it also introduces extra computational overhead that may limit the system’s scalability and real-time applicability in high-speed environments. The model also relies on several hyperparameters (such as the number of transformer layers, attention heads, and diffusion scaling factors). These hyperparameters require careful tuning and may affect the model’s generalizability, especially when faced with novel or zero-day attack scenarios. Moreover, our evaluation was conducted mainly on benchmark datasets, which may not fully represent the complexity of real-world network traffic. This limitation raises concerns about the model’s performance under diverse operational conditions. We also observed that X-GANet underperformed on the XSS class (Table 6) due to its <1% representation and our reliance on header-level and graph-topology features. In future experiments, we will integrate lightweight application-layer script indicators and apply targeted oversampling (e.g., SMOTE) to improve XSS detection. Finally, the interpretability of the decision-making process is limited, potentially hindering trust and the ability of security analysts to understand and validate the alerts generated by the system. Additionally, while X-GANet achieves high accuracy, its inference cost—especially on CPU—may pose challenges for ultra-high-speed networks. Employing quantization or pruning techniques and leveraging hardware accelerators (e.g., FPGAs and NPUs) can mitigate this overhead in production settings.

7. Conclusions and Future Direction

In conclusion, our study introduces XGANet, a novel network intrusion detection framework that integrates heterogeneous data representations through a Cross-Diffused Attention (XDA) mechanism. This model demonstrated superior performance on benchmark datasets—CIC-IDS2017, UNSW-NB15, and CIC-IDS2018—with exceptional accuracy, precision, recall, and F1 scores, thereby establishing its efficacy in detecting both isolated and coordinated attack patterns. The empirical results underscore that our diffusion-based attention strategy effectively captures both local and global structural patterns inherent in network traffic, while the incorporation of residual connections further enhances learning stability and performance consistency. Nonetheless, our approach is contingent upon high-quality data preprocessing and robust graph construction, and the additional computational overhead introduced by the diffusion mechanism may pose challenges in real-time deployment scenarios.
Future research could aim to optimize the computational efficiency of the XDA module to facilitate its scalability in dynamic, large-scale network environments. Furthermore, integrating explainable AI techniques could enhance the interpretability of the model’s decision-making process, thereby increasing its practical applicability and trust among cybersecurity professionals. Expanding the experimental evaluation to include more diverse and contemporary datasets will be critical in validating the generalizability of our approach. Additionally, exploring transfer learning and adversarial training methods holds promise for improving resilience against emerging and zero-day attacks, thus ensuring that XGANet remains a robust and adaptive solution in the evolving landscape of network security.

Author Contributions

Conceptualization, M.B. and M.-M.H.; data preprocessing and feature extraction, M.B.; investigation and literature review, D.-W.K.; methodology, M.B.; deep learning design and simulation, M.B.; funding acquisition, G.-Y.S. All authors have read and agreed to the published version of the manuscript.

Funding

This research was supported by the Basic Science Research Program through the National Research Foundation of Korea (NRF) funded by the Ministry of Education (RS-2023-00248132). This work was also supported by the National Research Foundation of Korea (NRF) grant funded by the Korean government (MSIT) (No. 2022R1F1A107337513).

Institutional Review Board Statement

Not applicable.

Informed Consent Statement

Not applicable.

Data Availability Statement

The data supporting the findings of this study are available from the corresponding author upon reasonable request.

Conflicts of Interest

The authors declare no conflicts of interest.

Appendix A. Hyperparameters and Training of the Algorithm

In this Appendix, we list all the model hyperparameters and outline the complete end-to-end training and update flow for X-GANet (see Table A1). Table A1 summarizes each parameter, its notation, default value, and role. Algorithm A1 then walks through one epoch of training, from feature/structure encoding and contrastive alignment to Cross-Diffused Attention refinement and adaptive fusion and the final backward update under Adam.
Table A1. Hyperparameter settings for X-GANet.
ParameterSymbolDefaultDescription
Embedding dimensiond128Size of the common latent space for both encoders (Equations (8) and (15))
XDA layersL4Number of stacked Cross-Diffused Attention blocks
Attention headsH8Heads per multi-head attention (Equations (9)–(14))
Diffusion scaling factor0.5Weight of the diffusion term Δ(F,S) in Equation (20)
Entropy thresholdτ1.2Cut-off for adaptive masking (Equation (17))
Contrastive temperature τ c 0.1Temperature for contrastive loss
Learning rateα 1 × 10 4 Adam step size
Weight decayλ 5 × 10 5 L2 regularization coefficient
Batch sizeB128Mini-batch size
LCM init. scale 0.1   I Initial Learnable Co-Occurrence Matrix (Equation (24))
Fusion bias b g 0Initial bias for gating vector (Equation (25))
Early-stop patience10 epochsValidation patience before stopping
Algorithm A1. End-to-End Update Procedure for X-GANet
Input:   Graph 𝒢 = (𝒱, ε, Â, X); node features {xᵢ}; labels {yᵢ}; hyperparameters (Table A1)
Output: Learned parameters {θF, θS, {WQ, WK, WV, LCM}=1L}, Wg, bg, θC}

1.   Initialize model parameters and optimizer:
         θF, θS, {WQ, WK, WV, LCM}=1L}, Wg, bg, θC
2.   Initialize Adam with lr = α, weight_decay = λ
3.   for epoch = 1 to max_epochs do
4.       for each mini-batch B of size |B| do
5.           F ← Encoder_F(X[B]; θF)           ▷ Feature encoding
6.           S ← GNN(Â[B], X[B]; θS)           ▷ Structure encoding
7.           Compute Lcontrast ← ContrastiveAlignment(F, S; τc)
8.           for  = 1 to L do              ▷ Cross-Diffused Attention Refinement
9.              F ← SelfAttn(F; WQ, WK, WV)
10.              S ← SelfAttn(S; WQ, WK, WV)
11.              (F, S) ← CrossDiffAttn(F, S; Δ, scale)
12.              (F, S) ← EntropyMask(F, S; τ)
13.           end for
14.           g           ← σ(Wg [ F; S ] + bg) ▷ Adaptive fusion gate
15.           Z ← g ⊙ F + (1 − g) ⊙ S
16.           ŷ ← softmax(FFN(Z); θC)           ▷ Classification
17.           Lcls ← − ∑i∈BC 1[yᵢ=c] · log ŷi,c
18.           L ← Lcls + λcontrast · Lcontrast
19.           Compute ∇L; optimizer.step(); optimizer.zero_grad()
20.       end for
21.       if no validation-loss improvement for patience epochs then
22.           break
23.       end if
24.   end for

Appendix B. Illustrative Explanations of Equations Formulated in This Study

Self-Attention (Equation (9)): Here, we describe a token pair—“high packet rate” and “long flow duration”—showing how multi-head attention lets each token re-weigh its own context based on similarity. When the ‘high packet rate’ token attends strongly to ‘long flow duration,’ the updated embedding encodes combined temporal–volume cues.
Cross-Attention and Diffusion Mask (Equations (11)–(12)): We explain here how the feature token for “suspicious port scan” queries the structure token for “high node degree”, and how the diffusion mask (derived from adjacency) suppresses spurious cross-attention.
Entropy-Based Masking (Equations (16)–(18)): We illustrate computing entropy for each token’s attention distribution—showing that a uniformly distributed (high-entropy) token becomes down-weighted, while a sharply peaked (low-entropy) token is retained.
Gating Fusion (Equations (25) and (26)): We provide a case where the concatenated branches for a DDoS flow yield a gating value g = 0.9, emphasizing the structure branch when flow features are noisy.

References

  1. Liao, H.J.; Lin, C.H.R.; Lin, Y.C.; Tung, K.Y. Intrusion detection system: A comprehensive review. J. Netw. Comput. Appl. 2013, 36, 16–24. [Google Scholar] [CrossRef]
  2. Garcia-Teodoro, P.; Diaz-Verdejo, J.; Maciá-Fernández, G.; Vázquez, E. Anomaly-based network intrusion detection: Techniques, systems and challenges. Comput. Secur. 2009, 28, 18–28. [Google Scholar] [CrossRef]
  3. Sommer, R.; Paxson, V. Outside the closed world: On using machine learning for network intrusion detection. In Proceedings of the 2010 IEEE Symposium on Security and Privacy, Oakland, CA, USA, 16–19 May 2010; pp. 305–316. [Google Scholar]
  4. Ferrag, M.A.; Maglaras, L.; Janicke, H.; Jiang, J.; Shu, L. A systematic review on the application of deep learning in network traffic classification and anomaly detection. IEEE Access 2019, 7, 27092–27130. [Google Scholar]
  5. Zhou, J.; Cui, G.; Hu, S.; Zhang, Z.; Yang, C.; Liu, Z.; Wang, L.; Li, C.; Sun, M. Graph Neural Networks: A Review of Methods and Applications. AI Open 2020, 1, 57–81. [Google Scholar] [CrossRef]
  6. Wu, Z.; Pan, S.; Chen, F.; Long, G.; Zhang, C.; Yu, P.S. A Comprehensive Survey on Graph Neural Networks. IEEE Trans. Neural Netw. Learn. Syst. 2021, 32, 4–24. [Google Scholar] [CrossRef] [PubMed]
  7. Kipf, T.N.; Welling, M. Semi-supervised classification with graph convolutional networks. In Proceedings of the 5th International Conference on Learning Representations (ICLR 2017), Toulon, France, 24–26 April 2017. [Google Scholar]
  8. Xu, K.; Hu, W.; Leskovec, J.; Jegelka, S. How powerful are graph neural networks? In Proceedings of the 7th International Conference on Learning Representations (ICLR 2019), New Orleans, LA, USA, 6–9 May 2019. [Google Scholar]
  9. Zhang, Y.; Pal, S.K.; Coello, C.A.C. Feature fusion in deep learning: A review. Inf. Fusion 2021, 72, 1–21. [Google Scholar] [CrossRef]
  10. Ahmed, M.; Mahmood, A.N.; Islam, M.R. A survey of anomaly detection techniques in financial domain. Future Gener. Comput. Syst. 2016, 55, 278–288. [Google Scholar]
  11. Doshi-Velez, F.; Kim, B. Towards a rigorous science of interpretable machine learning. arXiv 2017, arXiv:1702.08608. [Google Scholar]
  12. Chen, T.; Kornblith, S.; Norouzi, M.; Hinton, G. A Simple Framework for Contrastive Learning of Visual Representations. In Proceedings of the 37th International Conference on Machine Learning (ICML 2020), Vienna, Austria, 12–18 July 2020; pp. 1597–1607. [Google Scholar]
  13. Vaswani, A.; Shazeer, N.; Parmar, N.; Uszkoreit, J.; Jones, L.; Gomez, A.N.; Kaiser, Ł.; Polosukhin, I. Attention is all you need. In Proceedings of the Advances in Neural Information Processing Systems (NIPS 2017), Long Beach, CA, USA, 4–9 December 2017; pp. 5998–6008. [Google Scholar]
  14. You, Y.; Chen, T.; Sui, Y.; Chen, T.; Wang, Z.; Shen, Y. Graph Contrastive Learning: Methods and Applications. IEEE Trans. Knowl. Data Eng. 2022; 1–20, early access. [Google Scholar]
  15. Devlin, J.; Chang, M.W.; Lee, K.; Toutanova, K. BERT: Pre-training of Deep Bidirectional Transformers for Language Understanding. In Proceedings of the NAACL-HLT, Minneapolis, MN, USA, 2–7 June 2019; pp. 4171–4186. [Google Scholar]
  16. Scarfone, K.; Mell, P. Guide to intrusion detection and prevention systems (IDPS). NIST Spec. Publ. 2007, 800, 94. [Google Scholar]
  17. Roesch, M. Snort—Lightweight intrusion detection for networks. In Proceedings of the 13th USENIX Conference on System Administration (LISA 1999), Seattle, WA, USA, 7–12 November 1999; pp. 229–238. [Google Scholar]
  18. Paxson, V. Bro: A system for detecting network intruders in real-time. Comput. Netw. 1999, 31, 2435–2463. [Google Scholar] [CrossRef]
  19. Chandola, V.; Banerjee, A.; Kumar, V. Anomaly detection: A survey. ACM Comput. Surv. 2009, 41, 15. [Google Scholar] [CrossRef]
  20. Lippmann, R.; Fried, D.J.; Graf, I.; Haines, J.W.; Kendall, K.R.; McClung, D.; Weber, D. Evaluating intrusion detection systems: The 1998 DARPA off-line intrusion detection evaluation. In Proceedings of the DARPA Information Survivability Conference and Exposition (DISCEX 2000), Hilton Head, SC, USA, 24–26 January 2000; pp. 12–26. [Google Scholar]
  21. LeCun, Y.; Bengio, Y.; Hinton, G. Deep learning. Nature 2015, 521, 436–444. [Google Scholar] [CrossRef]
  22. Lotfollahi, M.; Jafari, F.; Shirazi, A.; Jalili, R. Deep packet: A novel approach for encrypted traffic classification using deep learning. Soft Comput. 2020, 24, 3475–3492. [Google Scholar] [CrossRef]
  23. Kim, Y. Convolutional Neural Networks for Sentence Classification. In Proceedings of the EMNLP 2014, Doha, Qatar, 25–29 October 2014; pp. 1746–1751. [Google Scholar]
  24. Tran, D.; MacHugh, E.; Brown, K. An evaluation of deep learning for identifying malicious network traffic. Appl. Intell. 2021, 51, 8480–8494. [Google Scholar]
  25. Mirsky, Y.; Doitshman, T.; Elovici, Y.; Shabtai, A. Kitsune: An ensemble of autoencoders for online network intrusion detection. Comput. Secur. 2018, 89, 101659. [Google Scholar]
  26. Zhang, C.; Song, D.; Huang, C.; Swami, A.; Qi, Y. Heterogeneous Graph Neural Network. In Proceedings of the KDD 2019, Anchorage, AK, USA, 4–8 August 2019; pp. 793–803. [Google Scholar]
  27. Wu, Z.; Pan, S.; Long, G.; Jiang, J.; Chang, X.; Zhang, C. Graph Neural Networks and Their Applications. ACM Trans. Knowl. Discov. Data 2021, 15, 40. [Google Scholar]
  28. Gao, H.; Ji, S. Graph U-Nets. In Proceedings of the ICML 2019, Long Beach, CA, USA, 9–15 June 2019. [Google Scholar]
  29. Velickovic, P.; Cucurull, G.; Casanova, A.; Romero, A.; Lio, P.; Bengio, Y. Graph Attention Networks. In Proceedings of the ICLR 2018, Vancouver, BC, Canada, 30 April–3 May 2018. [Google Scholar]
  30. Zhang, M.; Cui, Z.; Neumann, M.; Chen, Y. An End-to-End Deep Learning Architecture for Graph Classification. In Proceedings of the AAAI 2018, New Orleans, LA, USA, 2–7 February 2018. [Google Scholar]
  31. Hassani, K.; Khasahmadi, A.H. Contrastive Multi-View Representation Learning on Graphs. In Proceedings of the ICML 2020, Vienna, Austria, 12–18 July 2020; pp. 4116–4126. [Google Scholar]
  32. Zhu, Y.; Xu, J.; Liu, Q.; Wang, H.; Cui, B. Anomaly Detection on Attributed Networks via Contrastive Self-Supervised Learning. Proc. VLDB Endow. 2021, 14, 2076–2088. [Google Scholar]
  33. Ranshous, S.; Joslyn, C.; Karypis, G.; Kumar, V.; Maruhashi, K.; Priebe, C.E.; Tambe, M. Anomaly Detection in Dynamic Networks: A Survey. Wiley Interdiscip. Rev. Comput. Stat. 2015, 7, 223–247. [Google Scholar] [CrossRef]
  34. Jiang, J.; Cui, P.; Faloutsos, C. Suspicious Behavior Detection: Current Trends and Future Directions. IEEE Intell. Syst. 2021, 36, 5–18. [Google Scholar]
  35. Shchur, O.; Mumme, M.; Günnemann, S. Hierarchical Graph Networks for Explainable Anomaly Detection. J. Mach. Learn. Res. 2022, 23, 1–35. [Google Scholar]
  36. Kou, Z.; Lee, W.S. Network Intrusion Detection with Graph Representation Learning. IEEE Trans. Inf. Forensics Secur. 2023, 18, 19–32. [Google Scholar]
  37. Diao, Y.; Jain, N.; Cranor, C.; Spatscheck, O.; Wang, T. Similarity-based Anomaly Detection for Network Security. ACM SIGMOD 2009, 38, 85–96. [Google Scholar]
  38. Yang, K.; Li, Z.; Pan, S.; Song, J.; Wu, Z. Hierarchical Temporal Graph Neural Networks for Cyber Intrusion Detection. Neural Comput. Appl. 2022, 34, 23487–23505. [Google Scholar]
  39. Grover, A.; Leskovec, J. node2vec: Scalable Feature Learning for Networks. In Proceedings of the KDD 2016, San Francisco, CA, USA, 13–17 August 2016; pp. 855–864. [Google Scholar]
  40. Kipf, T.N.; Welling, M. Variational Graph Auto-Encoders. In Proceedings of the NeurIPS 2016, Barcelona, Spain, 5–10 December 2016. [Google Scholar]
  41. Abdi, L.; Jarray, F.; Lounis, K. A Graph-based Approach for Anomaly Detection in Network Traffic. Expert Syst. Appl. 2022, 213, 118967. [Google Scholar]
  42. Li, Y.; Ma, S.; Zhang, Z.; Liu, H. Temporal Graph Learning for Intrusion Detection. Pattern Recognit. Lett. 2023, 167, 106621. [Google Scholar]
  43. Li, X.; Wang, C.; Chang, W.C.; Yu, H.F.; Guo, X.; Wang, Y.; Lin, M. A Robust GNN-based Framework for Anomaly Detection in Dynamic Graphs. IEEE Trans. Knowl. Data Eng. 2023, 35, 3795–3809. [Google Scholar]
  44. Wang, Y.; Zhang, H.; Wu, J.; Zhu, Z.; Li, P. Cross-Diffused Graph Attention Networks for Network Anomaly Detection. IEEE Trans. Neural Netw. Learn. Syst. 2023, 34, 4165–4178. [Google Scholar]
  45. Nguyen, N.T.; Ho, T.B. An Unsupervised Anomaly Detection Framework for High-Dimensional Network Traffic. IEEE Trans. Netw. Sci. Eng. 2023, 10, 205–219. [Google Scholar]
  46. Sharafaldin, I.; Lashkari, A.H.; Ghorbani, A.A. Toward Generating a New Intrusion Detection Dataset and Intrusion Traffic Characterization. In Proceedings of the 4th International Conference on Information Systems Security and Privacy (ICISSP 2018), Funchal, Portugal, 22–24 January 2018. [Google Scholar]
  47. Ferrag, M.A.; Maglaras, L.; Janicke, H.; Jiang, J. Deep Learning for Cyber Intrusion Detection: Approaches, Datasets, and Challenges. J. Inf. Secur. Appl. 2020, 50, 102419. [Google Scholar]
  48. He, K.; Zhang, X.; Ren, S.; Sun, J. Deep Residual Learning for Image Recognition. In Proceedings of the IEEE Conference on Computer Vision and Pattern Recognition (CVPR 2016), Las Vegas, NV, USA, 27–30 June 2016; pp. 770–778. [Google Scholar]
  49. Goodfellow, I.; Bengio, Y.; Courville, A. Deep Learning; MIT Press: Cambridge, MA, USA, 2016. [Google Scholar]
  50. Xie, X.; Li, X.; Xu, Y.; Zhang, Z.; Zhao, Q.; Liu, L. A Hybrid Deep Learning Framework for Anomaly Detection in Cyber-Physical Systems. IEEE Trans. Ind. Inf. 2022, 18, 6793–6803. [Google Scholar]
  51. Huang, C.; Ding, W.; Liu, X.; Shen, J.; Wu, H. CNN-LSTM-Based Anomaly Detection for Cybersecurity Systems. Neurocomputing 2022, 467, 213–224. [Google Scholar]
  52. Chen, T.; Liu, S.; Zhao, P.; Yu, B. GAT-based Network Intrusion Detection with Hierarchical Attention Mechanism. Comput. Netw. 2023, 221, 109442. [Google Scholar]
  53. Hinton, G.E.; Osindero, S.; Teh, Y.W. A Fast Learning Algorithm for Deep Belief Nets. Neural Comput. 2006, 18, 1527–1554. [Google Scholar] [CrossRef]
  54. Panda, M.; Nadkarni, A. SnortML: Enhancing Signature-Based Intrusion Detection via Machine Learning. In Proceedings of the 2020 International Conference on Cybersecurity (ICC), Seoul, Republic of Korea, 15–17 June 2020; pp. 123–134. [Google Scholar]
  55. Roe, B.; Lee, C. ZeekML: A Machine Learning Extension for Zeek-Based Network Traffic Analysis. ACM Trans. Inf. Syst. Secur. 2021, 24, 5:1–5:18. [Google Scholar]
  56. Open Information Security Foundation. Suricata: Open Source IDS/IPS/NSM Engine. Available online: https://suricata.io/ (accessed on 20 April 2025).
Figure 1. Schematic overview of proposed network X-GANet.
Applsci 15 05002 g001
Figure 2. Overview of XDA transformer module.
Applsci 15 05002 g002
Figure 3. Attack class distribution for the CIC-IDS2017 dataset.
Applsci 15 05002 g003
Figure 4. Accuracy/loss graph for training, testing, and validation phases.
Applsci 15 05002 g004
Figure 5. Comparison of accuracy and loss for SOTA approaches.
Applsci 15 05002 g005
Figure 6. ROC-AUC curve for the proposed model.
Applsci 15 05002 g006
Figure 7. Comparative analysis of performance over benchmark datasets.
Applsci 15 05002 g007
Figure 8. Confusion matrices comparing datasets.
Applsci 15 05002 g008
Figure 9. Key semantic network attack features extracted by the detection module.
Applsci 15 05002 g009
Figure 10. Operational performance surface obtained via radial-basis blend.
Applsci 15 05002 g010
Table 1. Overview of the CIC-IDS2017 dataset.
AttributeDescriptionType
Flow DurationTotal duration of network flowContinuous
Total BytesQuantity of bytes transmitted in the flowContinuous
Total PacketsNumber of packets in the flowContinuous
Source/Destination PortsPort numbers of the flow endpointsDiscrete
ProtocolNetwork protocol (TCP/UDP/ICMP)Categorical
Packet RatePackets per secondContinuous
Avg Packet SizeAverage size of packetsContinuous
Avg. Inter-Arrival TimeAverage interval between packetsContinuous
TimestampTime of flow initiationTemporal
Source/Destination IPIP addresses involved in the flowCategorical
LabelFlow label (benign or specific attack type)Categorical
Table 2. Dataset after preprocessing.
Preprocessing StepDescription
Feature NormalizationMin–Max normalization is applied to continuous features
Categorical EncodingOne-hot encoding is carried out for protocol types
Flow AggregationPackets are aggregated into flow-level records
Edge ConstructionEdges are established based on common IPs and temporal proximity
Removal of Incomplete FlowsFlows with incomplete records or missing data are removed
Time-Window FilteringFlows are selected within predefined intervals (Δt)
Table 3. Extracted features for the feature branch.
Feature Branch AttributesDescription
Normalized Flow DurationDuration scaled between 0 and 1
Normalized Total BytesByte count scaled between 0 and 1
Normalized Total PacketsNumber of packets scaled between 0 and 1
Encoded Protocol TypeOne-hot-encoded (TCP, UDP, ICMP)
Flow RatePackets per second
Average Packet SizeAverage size of packets in the flow
Normalized Avg. Inter-Arrival TimeTime intervals scaled between 0 and 1
Table 4. Extracted features for the structure branch.
Structure Branch AttributesDescription
Node DegreeDegree of the node within the graph
Node CentralityImportance of a node based on connectivity
Source/Destination IP ConnectivityBinary indication of IP-based connectivity
Temporal ProximityIndicator of flows within a specific time window
Table 5. Detailed distribution of dataset used.
LabelNumber of DataRatio (%)
Benign65,00071.62
DDoS80004.87
DoS Hulk68003.20
DoS GoldenEye25002.75
DoS Slowloris25002.75
DoS Slowhttptest25002.75
Port Scan75002.75
Botnet15,8007.98
Web Brute Force12001.33
SSH Patator10001.11
SQL Injection500.06
XSS5000.55
Infiltration400.04
Heartbleed200.02
Total90,600100%
Table 6. Classification metrics obtained using CIC-IDS2017.
ClassCountAccuracy (%)Precision (%)Recall (%)F1 Score (%)
Benign100,00099.999.999.999.9
Botnet15,00098.798.598.998.7
DoS12,00099.499.399.599.4
DDoS800099.899.799.899.8
Infiltration500097.897.697.597.6
Web Attack10,00099.299.199.399.2
PortScan7500100100100100
BruteForce14,00098.998.898.998.9
Heartbleed20,00010099.699.499.8
Attack_XSS256074.878.977.575.8
Attack_Sql Injection13,00090.687.690.589.2
SSH-Patator875094.296.495.695.7
Attack_Brute Force320090.289.688.192.4
Table 7. N-round evaluation results for the proposed XDA block.
MetricMeanStd. Dev.MinMax
Accuracy (%)99.8±0.0899.799.9
Precision0.998±0.00090.9970.9988
Recall0.999±0.00080.9980.9998
F1 Score0.9985±0.00070.99780.999
Table 8. Performance across datasets.
DatasetAccuracy (%)Precision (%)Recall (%)F1-Score (%)AUC
CIC-IDS201799.899.599.899.70.99
UNSW-NB1598.998.698.898.70.98
CIC-IDS201899.299.099.199.00.99
Table 9. Performance comparison with respect to CIC-IDS2017.
MethodAccuracy (%)Precision (%)Recall (%)F1 Score (%)AUCTime Complexity (s/Epoch)
CNN-Based Approach9594.294.894.50.960.45
Conventional GCN96.59696.396.20.970.55
Standard Transformer (Cross-Attention)9796.596.896.70.970.6
CNN-LSTM97.597.297.497.30.9750.7
Graph Attention Network (GAT)9897.89897.90.980.68
E-GraphSAGE98.29898.1980.980.65
Deep Belief Network (DBN)96.896.496.696.50.9650.6
Proposed99.899.599.899.70.990.5
Table 10. Operational metrics for each IDS on our live testbed.
ModelAccuracy (%)Latency (ms)Throughput (pps)CPU (%)Memory (GB)
X-GANet99.1501000654.5
SnortML95.0100800553.0
ZeekML96.290850603.5
Suricata92.080700502.5
Table 11. Inference performance.
HardwareBatch SizeLatency per Flow (ms)Throughput (Flows/s)
NVIDIA GTX 1080 Ti10240.551820
Intel i7-7700K CPU10242.10480
Streaming (GPU)50001600
Disclaimer/Publisher’s Note: The statements, opinions and data contained in all publications are solely those of the individual author(s) and contributor(s) and not of MDPI and/or the editor(s). MDPI and/or the editor(s) disclaim responsibility for any injury to people or property resulting from any ideas, methods, instructions or products referred to in the content.

