Abstract
Selenium-rich foods play a crucial role in human health and hold significant economic value for agricultural products. However, many regions in China are experiencing selenium deficiency, which has led to an increased demand for Se-rich agricultural products. This study focused on Nanzhang County, a key area within the “Organic Valley” of Hubei Province, China. We employed fuzzy weights-of-evidence, backpropagation neural network, and support vector regression models to predict optimal planting zones for Selenium-rich crops. A comparative analysis indicated that the backpropagation neural network model provided the highest prediction accuracy (R2 = 0.77), identifying Selenium-rich crop zones covering 68.87% of the aera, where Selenium-rich crops made up 86.67% of all samples. Notably, the backpropagation neural network yielded excellent performance for rice and rapeseed, with R2 values of 0.95 and 0.99, respectively. The findings also indicate that the Selenium content in crops is closely linked to Selenium levels in the soil and is significantly influenced by synergistic and antagonistic interactions with other elements. This study provides scientific support for the cultivation of selenium-rich crops. It plays a positive role in promoting the development of the local selenium-rich industry and the sustainable utilization of soil selenium resources.
1. Introduction
Selenium (Se) is one of the essential trace elements for the human body [1,2]. It exerts biological functions such as antioxidation, anti-inflammation, anticancer activity, immune enhancement, and anti-aging, primarily through its role as a cofactor in selenoproteins, particularly glutathione peroxidase, which protects cells from oxidative damage by detoxifying lipid peroxides [3,4,5]. Prolonged Se deficiency in humans can lead to well-known endemic diseases, such as Keshan disease and Kashin-Beck disease, by impairing cardiovascular function and increasing the risk of myocardial infarction [6,7]. China is a country with soils severely deficient in Se, with an uneven distribution of Se resources, resulting in varying degrees of Se deficiency across most regions [8,9]. The primary source of Se for the human body is the consumption of Se-rich products [10,11,12]. Thus, Se-rich foods are not only essential for meeting daily Se intake but are also increasingly in demand due to heightened health awareness, leading to expanding market opportunities and rising economic value [9,13].
Located in Xiangyang City, Hubei Province, Nanzhang County is one of the three core towns of Xiangyang’s “Organic Valley” [14]. Situated in the transitional zone between the Jing Mountains and the Jianghan Plain, Nanzhang County enjoys natural ecological resources nurtured by a northern subtropical monsoon climate [15], providing unique conditions for the development of organic Se-rich agricultural products. Delineating optimized planting zones for Se-rich crops in Nanzhang County and employing precision agricultural practices to improve the quality and yield of local Se-rich products will enhance their market competitiveness and promote the development of regional specialty agriculture.
Moreover, scientifically planning Se-rich crop planting zones can ensure the sustainable utilization of soil resources, fostering the long-term growth of the Se-rich product industry [16,17]. Concurrently, by identifying areas suitable for Se-low crop cultivation, measures such as soil improvement, crop variety selection, precision fertilization, and irrigation can be implemented to effectively develop Se-deficient soils, enhance Se content in crops, and significantly alleviate Se deficiency in certain regions, potentially driving the growth of the Se-rich product industry [18,19].
In previous studies, multivariate linear regression (MLR) models have been mainly used to predict the Se crop content [20,21]. Geochemical data reveal that the relationship between Se crop content and soil properties is characterized by nonlinearity and emergent behaviors, where complex interactions between various factors give rise to outcomes that cannot be predicted simply by analyzing the individual components [22], limiting the applicability of traditional linear regression methods in this field.
In recent years, the rapid development of fuzzy weights-of-evidence (FWofE) models and machine learning (ML) techniques has provided effective solutions to address these challenges. The FWofE model can quantitatively analyze the spatial relationships between the distribution of Se-rich crops and environmental influencing factors, enabling accurate predictions of Se-rich crop distribution. Comparative studies of ML approaches and multiple regression methods have demonstrated that ML techniques achieve higher accuracy and applicability in predicting Se crop content [21,23]. Unlike the MLR method, ML methods such as backpropagation neural network (BP-NN) and support vector regression (SVR) can capture nonlinear relationships, emergent behaviors, and high-dimensional interactions among variables [24,25]. In summary, compared to the MLR approach, FWofE, BP-NN, and SVR are particularly advantageous for modeling the intricate and nonlinear relationships between Se crop content and soil physicochemical properties, thereby supporting more precise predictions.
This study aimed to analyze the geochemical data of crops and their corresponding root soils in Xiaoyan Town, Nanzhang County (China), to identify key geochemical characteristics of root soils strongly correlated with Se crop content. The FWofE, BP-NN, and SVR methods were employed to predict the distribution of Se-rich crops and to delineate optimal planting zones within the study area. Additionally, SHAP (SHapley Additive exPlanations) and PDPs (Partial Development Plots) were applied to provide model interpretability, adding a novel perspective often overlooked in similar studies. Ultimately, Se-rich optimal planting zones for wheat, rice, rapeseed, and tea were delineated, providing planting recommendations and scientific support for the development of Se-rich agriculture in the region.
2. Study Area and Data
2.1. Study Area
The Nanzhang County is located within 111°26′–112°9′ E and 31°13′–32°1′ N, with a total area of 3859 km2. The main exposed strata in the region include the Silurian, Permian, Triassic, Cretaceous, Paleogene, and Quaternary, among which the Triassic is the most extensive and constitutes the primary strata in the study area. The region’s soil types include paddy soil, purple soil, calcareous soil, and yellow-brown earth. The spatial distribution of calcareous soil largely coincides with that of the Triassic, making it the most widely distributed soil type. As a result, the study area experiences severe rocky desertification [26].
2.2. Sample Data
The collection and geochemical analysis of soil and crop samples were conducted by the Eighth Geological Brigade of the Hubei Geological Survey. Sampling and element analysis followed the standards outlined in the “Specifications for Soil Geochemical Survey (DZ/T 0145-2017)” and the “Specifications for Geochemical Land Quality (DZ/T 0295-2016)” [27,28]. The specific processes for soil and crop sample collection and analysis are detailed below:
2.2.1. Soil Samples
In Xiaoyan Town, Nanzhang County, surface soil samples were collected using a combination of grid and polygonal sampling based on a predetermined sampling map. A handheld GPS device was used to pinpoint sampling locations, with an average sampling density of 4.10 points/km2. Surface soil samples and duplicate samples were collected from the 0 to 20 cm soil layer, removing debris such as weeds, roots, stones, bricks, and fertilizer clumps. To enhance representativeness, a primary sampling point was selected as the fixed location, and 3–5 subsamples were collected within a 50 m radius and combined into a single sample.
Soil sample processing included drying, sieving, packing, completing sample submission forms, assigning sample IDs, and submitting samples for analysis. Surface soil samples were air-dried, sieved through a 20-mesh sieve, and sent to the laboratory for analysis. In total, 29 elements were analyzed, including Se, Cd, Hg, As, Pb, Cu, Zn, Cr, Ni, Mo, Mn, B, N, Co, I, F, Sr, Ge, P, Corg, S, Cl, Fe, Na, K, Ca, Mg, Si, and Al. Besides, pH was measured as well.
2.2.2. Crop Samples
Crop samples were primarily collected during the harvest season. Grain samples were taken from multiple points within the sampling site and mixed in equal proportions to create a composite sample, and the dry weight of the final sample was maintained at no less than 200 g. For fresh samples with 80–90% water content, the fresh weight was estimated to be 5–10 times the dry weight. Field-collected fresh samples had a minimum weight of 2000 g. After threshing and homogenization, grain samples were divided into subsamples using the grid method and quartering method, resulting in a final sample weight of approximately 250 g for small grains and 500 g for larger grains.
In total, wheat, rice, rapeseed, tea leaf, tobacco leaf, potato, and corn samples were collected, along with corresponding root soil samples. The geochemical analysis for crop samples included 21 elements: K, Fe, S, Ca, P, Mg, Cu, Zn, Mn, F, Ni, Se, Mo, Co, Cr, As, Cd, Pb, Hg, Si, and Sr. The root soil samples were analyzed for 20 elements, including K, Fe, S, Ca, P, Mg, Cu, Zn, Mn, F, Ni, Se, Mo, Co, Cr, As, Cd, Pb, Hg, and Si; besides, pH was measured as well.
2.3. Se Soil Content
An iterative method was applied to remove outliers in the original Se soil data that exceeded X + 3S or fell below X − 3S (where X and S are the mean and standard deviation of the original Se soil data, respectively). This process ensured that all data values fell within the range of X + 3S and X − 3S, forming a background dataset [29]. Geochemical parameters such as mean, median, standard deviation, and coefficient of variation (CV) were calculated for Se soil content before and after outlier removal to describe the central tendency and dispersion of Se soil content [30]. The average Se soil content in the study area was compared with the national background values to evaluate the enrichment and distribution characteristics of Se soil in the region.
The Se soil content in the study area ranged from 0.105 to 5.653 mg/kg, with an average of 0.347 mg/kg, which was higher than the national background value. This indicates an enrichment of Se soil. Since the maximum Se content far exceeded the average, the coefficient of variation was used to describe the degree of dispersion in Se soil content and to analyze the distribution of high Se values. The CV for Se in the raw data was 0.72, which decreased to 0.24 after outlier removal, resulting in a CV ratio of 3. This substantial change in CV indicates a high degree of dispersion in Se soil content, with a notable number of high-value areas and regions exhibiting elevated Se soil levels [31].
A Se soil content distribution map was created using kriging interpolation based on the processed data (Figure 1a). Accordingly, as shown in Figure 1b, Se soil content was categorized into five levels [2,13]: Se-deficient (<0.125 mg/kg), Se-marginal (0.125–0.175 mg/kg), Se-sufficient (0.175–0.4 mg/kg), Se-rich (0.4–3.0 mg/kg), and Se-excessive (>3.0 mg/kg). The distribution map shows that Se soil content follows a clear zonal pattern, aligning closely with the distribution of geological strata and parent materials. The Permian is identified as the primary Se-rich strata, contributing to a large area of Se-rich soils in the study region.
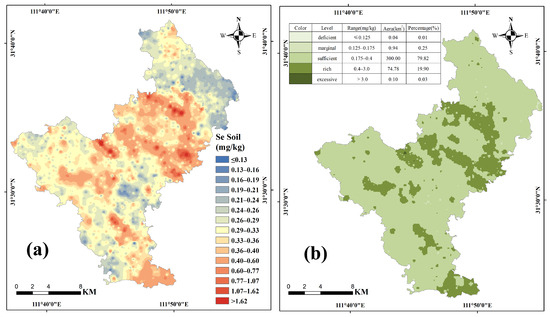
Figure 1.
Xiaoyan Town, Nanzhang County: (a) distribution map of Se soil content and (b) classified map of Se soil content.
2.4. Se Crop Content
The collected crop samples included wheat, rice, rapeseed, tea leaves, tobacco leaves, potatoes, and corn. Table A1 summarizes the average Se content in different crop types. Rice grain, wheat, rapeseed, and tea leaves exhibited Se content within a reasonable range. Crop samples with extremely low (e.g., potato: 0.004 mg/kg; corn: below detection limit) or unusually high Se content (e.g., rice root: 9.94 mg/kg) were excluded to avoid skewing the modeling process. The remaining crop samples were utilized to predict the Se content distribution in the study area and to delineate optimal planting zones for Se-rich crops.
3. Methods
3.1. Fuzzy Weights-of-Evidence (FWofE)
Cheng and Agterberg (1999) improved upon the conventional weights-of-evidence model by introducing the FWofE model, which is a logarithmic, linear model under the Bayesian probability framework [32]. It updates prior probabilities by calculating posterior probabilities under certain conditions, enabling the superposition and analysis of predictor variables for a target variable to generate posterior probability distribution maps. Compared to the traditional weights-of-evidence model, the FWofE model addresses the loss of information caused by discretized layers, effectively characterizing the spatial relationships between evidence layers and targets such as mineral deposits or crops. This results in improved prediction accuracy [13,33]. In recent years, the FWofE model has been widely applied in fields such as mineral prospecting and crop planting planning, achieving promising results (e.g., Zhang et al., 2016; Xie et al., 2023) [13,34].
The FWofE model defines evidence layers as fuzzy sets through a multivalued fuzzy membership function (MSF) and quantifies their fuzziness by calculating membership degrees. This approach enables the processing of multi-class evidence layers. Using MSF to fit training samples, the evidence weights are computed. The computational workflow of the FWofE model involves the following steps: preliminary screening of evidence layers, construction of the FWofE model, calculation of weights for evidence factors, analysis of evidence factor weights and contrasts to determine which evidence layers to retain, plotting the ratio of evidence factor contrast C to its standard deviation S(C), calculation of multi-value membership functions for evidence factors, derivation of fuzzy weights and posterior probabilities for evidence factors [33,35].
3.2. Machine Learning (ML)
Unlike the FWofE model, which identifies Se-rich crop zones based on probabilistic inference, the ML methods predict Se crop content to delineate optimal planting zones.
In recent years, ML methods have been widely applied to solve various geoscientific problems, such as mineral prospecting, crop planting planning, and groundwater quality assessment, yielding promising results [36,37,38]. Among these, BP-NN and SVR have demonstrated excellent performance in addressing nonlinear problems [24]. In this study, both BP-NN and SVR were used as models to predict and delineate optimal planting zones for Se-rich crops.
3.2.1. Backpropagation Neural Network (BP-NN)
The BP-NN model, based on the error backpropagation algorithm, is one of the most successful and widely used artificial neural networks. The BP-NN is a multilayer network composed of an input layer, one or more hidden layers, and an output layer connected by nodes. Training a BP-NN involves two main processes: forward propagation of input data and backward propagation of errors. Through iterative learning, the BP-NN continuously adjusts the connection weights and thresholds between input and hidden layer nodes, as well as between hidden and output layer nodes. Using the gradient descent method, the network minimizes the mean square error (MSE) between the actual output and the desired output. Hidden layer weights and biases are updated via backpropagation, enabling the multilayer feedforward network to establish appropriate linear or nonlinear relationships between input and output layers [25,39,40].
To enhance the BP-NN’s capability in handling nonlinear problems, the ReLU activation function was selected for neuron activation due to its ability to mitigate gradient vanishing and maximize neuron efficiency. The ReLU function is expressed as:
where W and b are the trainable parameter matrix and vector composed of neuron weights and biases.
3.2.2. Support Vector Regression (SVR)
SVR, an extension of the support vector machine for regression tasks, employs an ϵ-insensitive loss function, making it well-suited for nonlinear regression analysis problems. The core idea of SVR is to fit the data as closely as possible without violating the boundary conditions. The algorithm aims to find a hyperplane from the given data points, determine the closest relationship between support vectors and the hyperplane, and describe them using a function.
Finding the optimal fitting curve often requires tuning hyperparameters such as ϵ, γ, and C, as well as selecting a kernel function. The radial basis function (RBF) kernel was chosen for this study due to its superior performance in handling nonlinear problems, low model complexity, and fewer required parameters. The RBF kernel is expressed as:
where Xm is the center of the m-th kernel function, and σm is the width of the m-th kernel function.
The SVR workflow involves mapping input vectors into a feature space, calculating the dot product of input vectors using the kernel function, assigning weights to the results, and summing them to obtain the output [41,42].
3.2.3. Evaluation of the Prediction Models
In this study, both BP-NN and SVR were implemented as nonlinear regression models to predict optimal planting zones for Se-rich crops. Therefore, the coefficient of determination (R2), mean absolute error (MAE), and root mean square error (RMSE) were selected as evaluation metrics to assess the prediction performance of the BP-NN and SVR models. The closer R2 is to 1, the closer the predicted values are to the true values, indicating higher correlation and better interpretability of the prediction results. The formulas for R2, MAE, and RMSE are, respectively, as follows [16,43]:
where N is the total number of samples, is the predicted Se content of the i-th crop sample, is the mean Se content of the crop samples, and is the true Se content of the i-th crop sample.
4. Results and Discussion
4.1. Factors Affecting Se Crop Content
Studies have shown that total Se soil content, Se speciation and bioavailability, soil physicochemical properties (e.g., pH, Eh, SOM), and the synergistic or antagonistic interactions between Se and other soil elements are key factors that affect Se uptake by crops [43]. Because this study primarily used data on crop and root soil element contents and pH, the following discussion is focused on the synergistic and antagonistic effects of Se with other elements, as well as the impact of soil pH on Se crop content.
Research indicates that elements such as Mn, Mo, and Cu exhibit synergistic effects with Se, while P, S show antagonistic effects [44,45]. For instance, SO42− and PO43−, as competitive ions, inhibit Se absorption by crops. Therefore, the presence of P, S reduces Se crop uptake [8,46].
In soils, the bioavailability of different Se species is generally in the following order [47]: selenate > organic selenium > selenite > elemental selenium > selenides. Soil pH and Eh significantly influence the distribution of Se species. Selenate is typically found in alkaline surface soils, whereas selenite is more common in acidic subsoils. Therefore, Se crop content generally increases with higher soil pH [8]. Additionally, total Se soil content remains a critical factor affecting Se crop content.
To analyze the correlation between Se crop content and root soil indicators in the study area, we calculated Pearson correlation coefficients for 130 paired samples of Se crop content and root soil indicators, and a heatmap was generated (Figure 2).
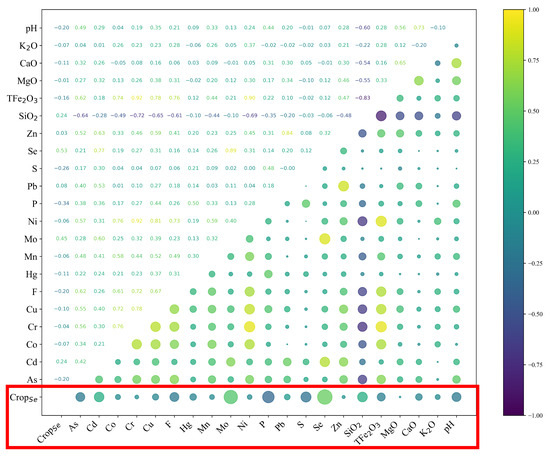
Figure 2.
Heat map of correlation between Se crop and root soil elements.
The analysis revealed significant positive correlations between Se crop content and root soil Cd, Mo, Se, and SiO2 (p < 0.01), as well as significant negative correlations with P and S (p < 0.01). Among these, the findings for Se, P, and S align well with previous research conclusions [44,46]. The high correlation between root soil Se and Mo (r = 0.89, p < 0.01) and Cd (r = 0.77, p < 0.01) indicates that Mo and Cd are commonly enriched in Se-rich soils in the study area, suggesting that Se crop content is positively correlated with root soil Mo and Cd. Therefore, in subsequent model construction, data on these elements were prioritized as evidence layers or training data.
4.2. Prediction of Optimal Planting Zones for Se-Rich Crops
4.2.1. Fuzzy Weights-of-Evidence
A common challenge in applying the FWofE model for prediction lies in the selection of evidence layers. In this study, the selection of evidence layers for the FWofE method and training data layers for ML models was guided by the correlation analysis results and previous research findings. Because numerous root soil indicators are related to Se crop content, factor analysis was first performed to reduce dimensionality. To avoid the closure effect of the root soil data, the data should be opened by log-ratio transformation before performing factor analysis. Because the centered log-ratio (CLR) transformation preserves the correlation structure between components and is computationally straightforward, it was applied to process the root-zone soil data [48,49]. The parameters and diagnostic metrics of the factor analysis are presented in Table A2. The resulting factor loadings are shown in Table 1, where Factor3 has high negative loadings on Mo and Se, while Factor4 has high negative loadings on P and S. According to the correlation analysis results, Factor3 contains information on root soil elements that are positively correlated with Se crop content, while Factor4 contains information on root soil elements that are negative correlated with Se crop content. Therefore, Factor3 and Factor4 were identified as significantly correlated with Se crop content.

Table 1.
Factor loadings of root soil elements and pH.
Based on the actual conditions of the study area and FWofE experiments, the final evidence layers included the factor score distribution maps of Factor3 and Factor4, as well as the 500-m nine-ring buffers of the study area’s main geological strata (Silurian, Permian, Triassic, Cretaceous, and Paleogene) (Figure 3).
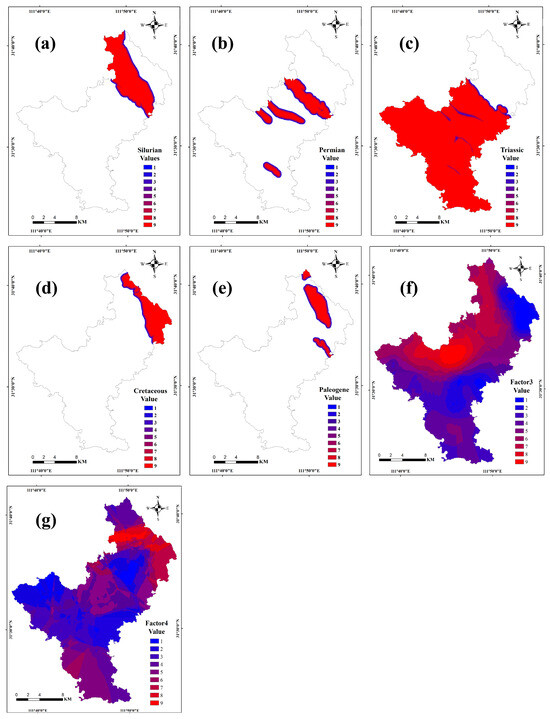
Figure 3.
Evidence layers used in the FWofE methods ((a): 500-m nine-ring buffers of Silurian; (b): 500-m nine-ring buffers of Permian; (c): 500-m nine-ring buffers of Triassic; (d): 500-m nine-ring buffers of Cretaceous; (e): 500-m nine-ring buffers of Paleogene; (f): distribution map of Factor3 scores; (g): distribution map of Factor4 scores).
Before building the FWofE model, it was necessary to identify Se-rich crop samples. This required setting a threshold to distinguish Se-rich crops, making threshold determination a key step in the modeling process. Due to the availability of standardized Se thresholds only for Se-rich rice according to national regulations and due to the absence of national standards for other crops (which follow regional standards, such as DBS42-002-2022, issued by Hubei Health Commission, China), this study faced challenges in defining consistent criteria for Se-rich crops [50]. Moreover, the regional thresholds for Se-rich crops were set too high, resulting in a scarcity of Se-rich crop samples in the study area. Considering these factors, the Se threshold for Se-rich rice defined by the “Selenium-Enriched Rice” (GB/T 22499-2008) standard was adopted as the basis for training data in the FWofE model. Crops with Se content ranging from 0.040 to 0.300 mg/kg were considered Se-rich for the purpose of this study [51].
Using the FWofE model, eigenvalues and Student’s t-distribution values for each evidence layer were calculated, and a schematic diagram illustrating the selection of fuzzy weights was generated. The multivalued fuzzy membership function (MSF) was assigned for each evidence layer, after which the fuzzy weights of the evidence layers were calculated accordingly. The fuzzy weights of the evidence layers are shown in Table A3. By integrating multiple evidence layers, the posterior probabilities of Se-rich crops were calculated, and a posterior probability map of Se-rich crops in the study area was produced. The workflow of the constructed FWofE model is shown in Figure 4a.
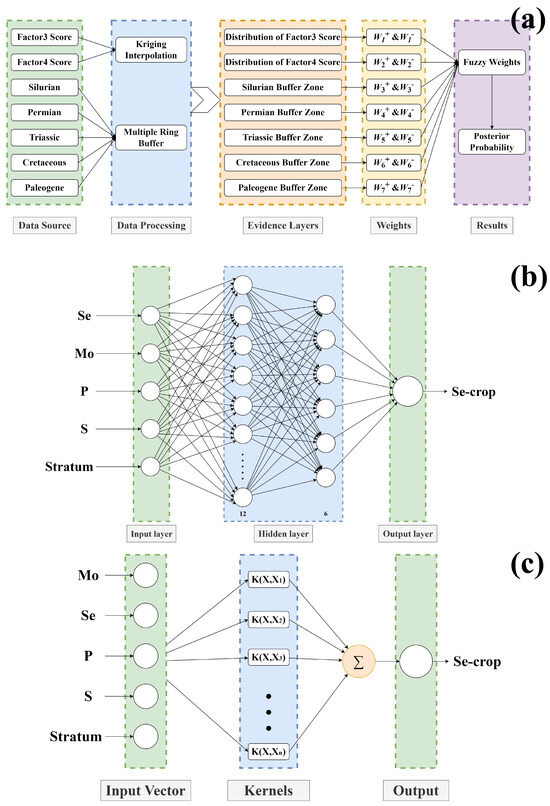
Figure 4.
Schematic diagram of the FWofE (a), BP-NN (b), and SVR (c) model.
Using the geometric interval method [13], the posterior probability map of Se-rich crops was divided into three zones: Se-low crop planting zones, second-class Se-rich crop planting zones, and first-class Se-rich crop planting zones (Figure 5a). This division delineated the optimized planting zones for Se-rich crops in the study area. According to Figure 5a, the areas covered by first-class Se-rich crop planting zones, second-class Se-rich crop planting zones, and Se-low crop planting zones were 27.97 km2, 188.37 km2, and 159.49 km2, accounting for 7.44%, 50.12%, and 42.44% of the study area, respectively.
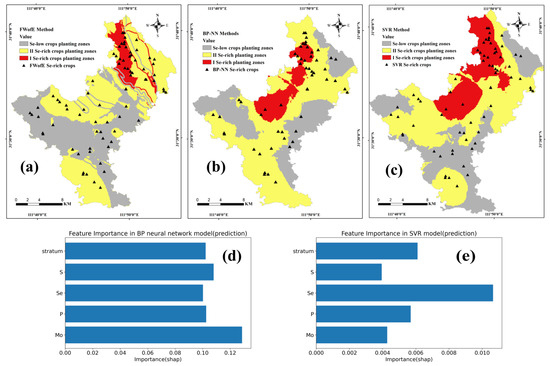
Figure 5.
Graded maps of the prediction results and bar chart of the importance of indicators to the prediction results ((a): graded map of the FWofE model prediction results; (b): graded map of the BP-NN model prediction results; (c): graded map of the SVR model prediction results; (d): barchart of the importance of input features to the prediction results in the BP-NN model; (e): bar chart of the importance of input features to the prediction results in the SVR model).
The prediction results of the FWofE model showed significant spatial correlations with the distributions of geological strata and soil types. First-class Se-rich crop planting zones were primarily concentrated in the northeastern part of the study area, coinciding with the distribution of Silurian sandstone and yellow-brown earth. Conversely, Se crop content was relatively lower in calcareous soil areas. This conclusion aligns with the findings of Liu et al. (2024) [52].
4.2.2. Machine Learning
Similar to the FWofE model, one limitation of ML lies not only in the opacity of its intermediate processes but also in the significant impact of feature selection on prediction accuracy. Before constructing models to predict Se crop content using ML algorithms, preprocessing training data and carefully selecting root soil indicators are essential steps. The crop data were normalized using the max-min normalization method as training data. Root soil indicators used in BP-NN and SVR models were selected based on correlation analysis results and model training performance.
From the correlation analysis and geological background, the BP-NN and the SVR model used Mo, Se, P, S, and crop geological strata (the geological strata at the location where the crop samples were collected) as input features. The distributions of the root soil content for Se, Mo, P, and S are shown in Figure A1.
In the BP-NN modeling, Mo, Se, P, S, and crop geological strata were used as input layer features, with Se crop content as the output variable. The hyperparameters of the BP-NN model were determined through an empirical approach based on the error curves of the training and testing sets, with the aim of avoiding overfitting. The model included two hidden layers, with 12 neurons in the first layer and 6 neurons in the second, and the complete hyperparameters are provided in Table A4. A training-validation error curve method was applied to monitor model performance and avoid overfitting. The schematic diagram of the BP-NN is shown in Figure 4b. The BP-NN model was used to predict Se crop content, and interpolation was applied to generate a distribution map of Se content in the study area. The prediction showed Se crop content ranged from 0.034 to 0.116 mg/kg. The geometric interval method was used to classify Se crop contents into three levels [13]: Se-low crop planting zones, second-class Se-rich crop planting zones, and first-class Se-rich crop planting zones (Figure 5b). Based on the geometric interval classification of the predicted Se content, the boundary between Se-low crop planting zones and second-class Se-rich crop zones was used as the threshold (0.045 mg/kg) to identify Se-rich crops. First-class Se-rich crop planting zones, second-class Se-rich crop planting zones, and Se-low crop planting zones covered 44.72 km2, 214.18 km2, and 116.97 km2, accounting for 11.90%, 56.98%, and 31.12% of the study area, respectively.
First-class Se-rich crop planting zones were concentrated in the north and northeast of the study area, displaying a significant positive spatial correlation with root soil Se and Mo content and a significant negative spatial correlation with P and S content. These results were consistent with the results of Pearson correlation analysis. To enhance the interpretability of the model, SHAP values were used to assess the importance of each input variable in the BP-NN model [53,54]. In addition, Partial Dependence Plots (PDPs) were introduced to further illustrate the effect of individual variables on the prediction outcomes, thus complementing SHAP by providing insights into the effect direction [55]. The SHAP value bar chart (Figure 5d) revealed that Mo contributed most to the prediction (SHAP = 0.1286), while other features had slightly lower contributions. The PDPs revealed (Figure 6) that Se shows a clear positive effect on the predictions, while Mo, P, S, and stratum exhibit overall negative trends. The PDP trend of Mo appears opposite to its actual effect in predictions, possibly due to its uneven spatial distribution, which may limit the PDP’s ability to reflect its true impact.
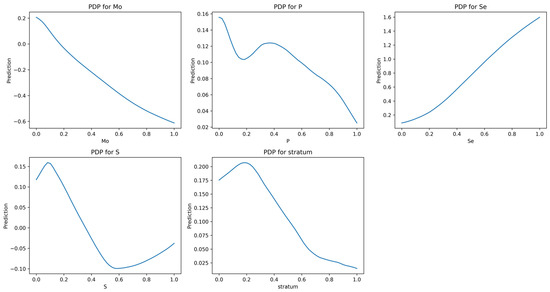
Figure 6.
The PDP presentation of input features the BP-NN model.
Similarly, the SVR model used the same set of input vectors to predict Se crop content. The hyperparameters of the SVR model were determined by using the grid search approach. A radial basis function (RBF) kernel was selected as the kernel function, and the complete hyperparameters are provided in Table A4. A learning curve method was used to monitor model performance and avoid overfitting. The schematic diagram of the SVR model is shown in Figure 4c. Using the SVR model, Se crop content was predicted, and interpolation was applied to generate a Se crop content distribution map for the study area. The prediction indicated Se content ranged from 0.036 to 0.112 mg/kg. The geometric interval method was used to classify Se content into three levels [13]; the boundary between Se-low crop planting zones and second-class Se-rich crop zones was used as the threshold (0.044 mg/kg) to identify Se-rich crops. First-class Se-rich crop planting zones, second-class Se-rich crop planting zones, and Se-low crop planting zones covered 77.60 km2, 176.80 km2, and 121.46 km2, accounting for 20.65%, 47.04%, and 32.32% of the study area, respectively (Figure 5c).
The first-class Se-rich crop planting zones predicted by SVR were generally consistent with those predicted by the BP-NN, with the main difference being the larger area predicted by SVR. SHAP values were also calculated to assess feature importance in the SVR model. The SHAP value bar chart (Figure 5e) showed that root soil Se content had the highest contribution to prediction (SHAP = 0.0086). The PDPs revealed (Figure 7) that Se has a clear positive impact on the predictions, while Mo, P, S, and stratum exhibit overall negative trends. Compared to the BP-NN model, the SVR model has a potentially limited ability to capture complex nonlinear interactions.
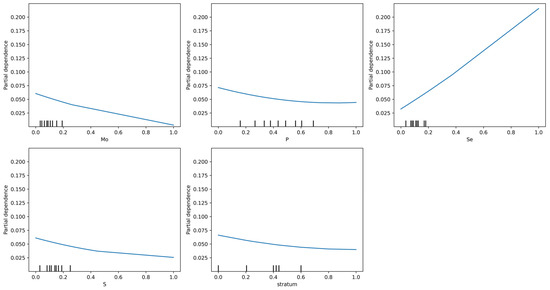
Figure 7.
The PDP presentation of input features of the SVR model.
The performance of the two ML models was evaluated using the coefficient of determination (R2), mean absolute error (MAE) and root mean square error (RMSE). The BP-NN achieved an R2 of 0.77, an MAE of 0.0148, and an RMSE of 0.0191, while the SVR model achieved an R2 of 0.71, an MAE of 0.0157, and an RMSE of 0.0218. Both models demonstrated comparable parameters, low prediction errors, and high fitting accuracy, indicating acceptable reliability of the predictions.
Additionally, we compared the performance of our models with those reported in previous studies. For example, Ma et al. (2022) applied both an artificial neural network (ANN) and a multiple linear regression (MLR) model for similar prediction tasks, reporting R2 values of 0.77 for ANN and 0.67 for MLR. In comparison, our BP-NN and SVR models achieved R2 values of 0.77 and 0.71, respectively, indicating not only comparable performance with existing ANN models but also notable improvements over traditional regression methods such as MLR [20].
4.2.3. Model Comparison and Discussion
In the process of predicting and delineating optimal planting zones for Se-rich crops in the study area, three models were employed: FWofE, BP-NN, and SVR. The Se-rich crop thresholds used by these models were 0.040 mg/kg, 0.045 mg/kg, and 0.044 mg/kg, respectively. A statistical comparison of the study areas classified as Se-low crop planting zones, second-class Se-rich crop planting zones, and first-class Se-rich crop planting zones, along with the number of Se-rich crop samples within each zone, is presented in Table 2.
Table 2.
Statistical summary of prediction results of the FWofE, BP-NN, and SVR models.
As shown in Table 2, the percentage of Se-rich crop samples within the Se-rich crop planting zones delineated by the FWofE, BP-NN, and SVR models were 74.75%, 86.67%, and 74.68%, respectively. The BP-NN exhibited the highest spatial concordance between the predicted Se-rich crop planting zones and the distribution of Se-rich crop samples. The FWofE model predicted smaller Se-rich crop planting zones, whereas the SVR model predicted larger zones. Based on the statistical and comparative analysis, the BP-NN was determined to be the most effective model for predicting and delineating optimal planting zones for Se-rich crops in the study area.
In Se-deficient regions, applying Se fertilizers has proven effective in increasing Se crop content [5,56]. For areas where Se crop content is low, applying Se fertilizers could be a viable solution. The graded results indicate that certain areas in the study region have low Se crop content. By applying Se fertilizers in Se-low crop planting zones and optimizing the use of Se-rich crop planting zones, the yield and quality of local Se-rich crops can be enhanced, thereby promoting the development of Se-rich agricultural products in the region.
4.3. Prediction of Optimal Planting Zones for Se-Rich Wheat, Rice, Rapeseed, and Tea
The above prediction of Se-rich crop planting zones across multiple crops does not provide specific planting recommendations for individual Se-rich crops. Therefore, this section focuses on predicting optimal planting zones for four widely cultivated crops in the study area: wheat, rice, rapeseed, and tea. These crops are grown in drylands, paddy fields, tea gardens, and forested areas, with varying land-use practices such as crop rotation and land-use function changes. As such, the areas covered by drylands, paddy fields, tea gardens, and forested regions were selected as the prediction zones for Se-rich crops.
In the previous prediction of Se-rich crop planting zones, the BP-NN model demonstrated the best performance, with Se-rich crop samples accounting for 86.67% of the predicted Se-rich planting zones. This percentage was higher than that of the FWofE and SVR models, highlighting the BP-NN’s ability to effectively handle small-sample datasets and nonlinear relationships. Consequently, the BP-NN model was adopted to predict Se-rich planting zones for wheat, rice, rapeseed, and tea separately. Correlation analysis was conducted for Se content and corresponding root soil indicators for each crop, and based on the results (Figure 8), root soil Se, As, Pb, Mg, Hg, and geological strata were selected as input features for wheat; Hg, Mn, Si, pH, and geological strata for rice; Cd, Mo, Se, Ni, and geological strata for rapeseed; and P, S, Si, Ca, Cu, Fe, and geological strata for tea. The hyperparameters of the BP-NN model were also determined through an empirical approach based on the error curves of the training and testing sets, with the aim of avoiding overfitting, and the complete hyperparameters are provided in Table A4.
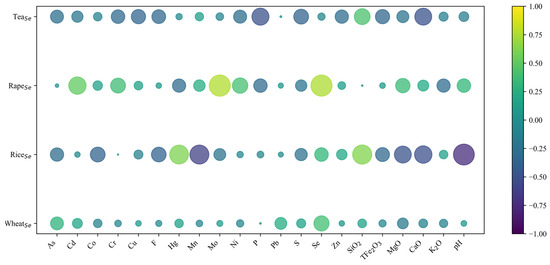
Figure 8.
Heat map of correlation between Se of the four kinds of crops (wheat, rice, rapeseed, and tea) and root soil elements.
Using the previously constructed BP-NN model, Se content was predicted for wheat, rice, rapeseed, and tea, and distribution maps for each crop’s Se content were generated. The prediction results showed Se content ranges of 0.031–0.096 mg/kg for wheat, 0.025–0.071 mg/kg for rice, 0.016–0.286 mg/kg for rapeseed, and 0.033–0.127 mg/kg for tea. The prediction results were graded into Se-low planting zones, second-class Se-rich planting zones and first-class Se-rich planting zones using the Jenks Natural Breaks (Figure 9) [13]. The threshold for identifying Se-rich crops was defined as the boundary between Se-low and second-class Se-rich planting zones, as determined by this classification. Accordingly, Se-rich thresholds for wheat, rice, rapeseed, and tea were set at 0.047 mg/kg, 0.040 mg/kg, 0.068 mg/kg, and 0.071 mg/kg, respectively. The areas of Se-rich planting zones were 241.48 km2 (68.30%) for wheat, 213.35 km2 (60.35%) for rice, 245.59 km2 (69.46%) for rapeseed, and 179.47 km2 (50.76%) for tea.
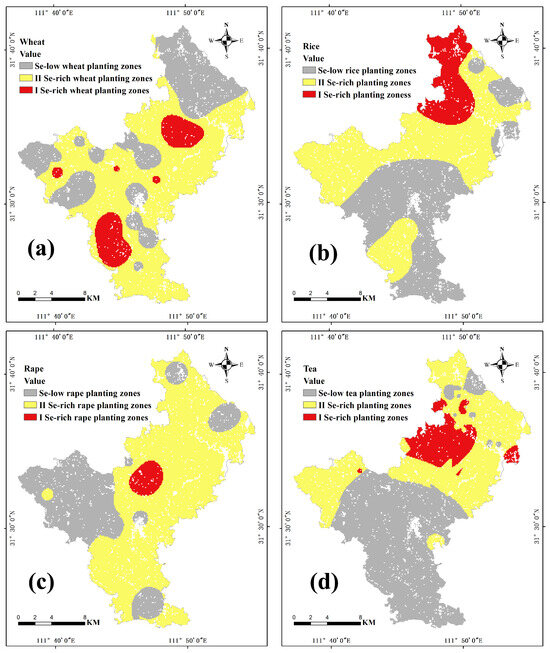
Figure 9.
Graded map of the prediction results of wheat (a), rice (b), rapeseed (c), and tea (d).
The BP-NN model’s evaluation metrics were calculated for each crop to assess the interpretability of the predicted Se-rich planting zones. For wheat, the MAE was 0.0096, the RMSE was 0.0129, and R2 was 0.64; for rice, the MAE was 0.0035, the RMSE was 0.0037, and R2 was 0.95; for rapeseed, the MAE was 0.0055, the RMSE was 0.0067, and R2 was 0.99; and for tea, the MAE was 0.0110, the RMSE was 0.0147, and R2 was 0.71. These metrics indicate that the prediction errors for rice and rapeseed were minimal, while the interpretability of the results (based on R2) was very high for these two crops. The prediction performance for tea was acceptable, whereas the prediction for wheat was less accurate. The superior prediction performance for rice and rapeseed may be attributed to the correlation analysis results: the selected indicators for these two crops had higher correlation coefficients ( > 0.5) and were more distinct from other indicators, whereas the correlation coefficients for wheat were relatively low ( < 0.4).
The Se-rich planting zones delineated for rice, rapeseed, and tea using the BP-NN model provide planting recommendations for these crops in Xiaoyan Town, Nanzhang County. Se-rich rapeseed optimized planting zones were associated with soils containing high levels of Mo, Se, Mn, and Cu. Se-rich rice and tea-optimized planting zones were primarily distributed in areas underlain by Silurian strata, characterized by acidic soils. According to Wang et al. (2024), Se-rich tea thrives in acidic soils because tea plants have a higher affinity for selenite. Se-rich rice, on the other hand, is suited to slightly acidic soils, likely due to the concentration of paddy fields in these regions [5].
Additionally, the mobility of Se species differs by soil type: selenate in alkaline soils is prone to leaching due to its high mobility, whereas selenite in acidic soils tends to accumulate due to its lower mobility [57]. Based on these findings, rapeseed is best planted in soils with high Mo, Se, and Mn content, while rice and tea are better suited for acidic soils. Appropriate fertilization strategies should also be implemented to reduce heavy metal content in crops and improve the yield and quality of Se-rich products.
5. Conclusions
This study analyzed Se crop content and corresponding root soil data in Xiaoyan Town, Nanzhang County, employing FWofE, BP-NN, and SVR methods to delineate regions with different Se content levels and identify optimized planting zones for Se-rich crops. These findings provide scientific evidence and planting guidelines for the rational cultivation and sustainable development of Se-rich crops in the area, promoting the development of the local Se-rich industry.
The study’s main objective was to develop a reliable model for predicting Se-rich planting zones. Among the FWofE, BP-NN, and SVR models, the BP-NN model demonstrated the best predictive performance. The RMSE and R2 of the BP-NN model verified by the test data were 0.0191 and 0.77, respectively. Additionally, the correct classification rate of the BP-NN model reached 86.67%. Specific predictions for Se-rich planting zones for wheat, rice, rapeseed, and tea were also made, with the model’s R2 values indicating that the predictions for rice (0.95) and rapeseed (0.99) were the most reliable.
The correlation analysis and spatial analyses revealed certain patterns consistent with previous research on factors influencing Se uptake by crops. Elements that were significantly positively correlated with Se showed overlapping spatial distributions with Se-rich crop planting zones, reflecting their synergistic effects on Se uptake. Conversely, elements with significant negative correlations exhibited an opposite spatial distribution, indicating their antagonistic effects.
Based on these findings, targeted cultivation recommendations are proposed. For Se-rich crop planting zones, appropriate chemical treatments or adjustments to soil physicochemical properties should be implemented to avoid the accumulation of elements that antagonize Se, ensuring the long-term sustainability of Se-rich crop cultivation. For Se-low crop planting zones, applying exogenous Se fertilizers, adjusting soil pH, and modifying redox conditions can enhance Se bioavailability in the soil and increase Se content in crops.
Importantly, the prediction results can assist farmers in selecting optimal areas for Se-rich crop cultivation, improving yield quality and income. Local planners may also use these results for agricultural zoning, soil management, and policy-making aimed at sustainable land use and Se-rich food production.
However, a limitation of this study is that the model does not incorporate Se bioavailability data, which could provide a more comprehensive understanding of Se uptake and improve predictions. Future work could integrate more data and extend the analysis to more crops and regions to validate model applicability.
Author Contributions
Conceptualization, J.L. and S.X.; methodology, J.L. and S.X.; software, J.L., W.Z., W.W. and H.S.; validation, W.Y., W.W. and H.S.; formal analysis, J.L.; investigation, W.Y.; data curation, J.L.; writing—original draft preparation, J.L. and W.Y.; writing—review and editing, S.X. and E.J.M.C.; visualization, J.L. and W.Z.; supervision, J.L. and S.X. All authors have read and agreed to the published version of the manuscript.
Funding
This research was financially supported by the New geochemical exploration technology for shallow-covered landscapes in desert Gobi and alpine steppes (No. 2024ZD1002400) under the subproject “Geochemical intelligent prospecting prediction and software development for copper-nickel and gold deposits” (No. 2024ZD1002406) and the Geochemical evaluation of land quality in Nanzhang County, Hubei Province (No. HBJTD20160101).
Institutional Review Board Statement
Not applicable.
Informed Consent Statement
Not applicable.
Data Availability Statement
The original contributions presented in this study are included in the article. Further inquiries can be directed to the corresponding author.
Acknowledgments
We are very thankful for all the editors and reviewers who have helped us improve the manuscript.
Conflicts of Interest
The authors declare no conflicts of interest.
Appendix A
Table A1.
The average Se content in different crop types.
Table A1.
The average Se content in different crop types.
| Crop | Wheat | Rice Grain | Rice Root | Rapeseed | Tea Leaf | Tobacco Leaf | Potato | Corn |
|---|---|---|---|---|---|---|---|---|
| Se content (mg/kg) | 0.048 | 0.059 | 9.94 | 0.073 | 0.08 | 0.04 | 0.004 | below detection limit |
Table A2.
Factor analysis parameters and diagnostic metrics.
Table A2.
Factor analysis parameters and diagnostic metrics.
| Item | Description |
|---|---|
| KMO value | 0.676 |
| Bartlett’s test | p = 0.000 |
| Factor extraction criterion | Eigenvalues > 1 |
| Rotation method | Varimax |
Table A3.
Fuzzy weights of the evidence layers.
Table A3.
Fuzzy weights of the evidence layers.
| Factor3 | class | 2 | 3 | 4 | 5 | 6 | 7 | 8 | 9 | |
| weight | −0.2 | −0.2 | −0.2 | −0.2 | −0.2 | 0.39 | 0.39 | 0.39 | ||
| Factor4 | class | 1 | 2 | 3 | 4 | 5 | 6 | 7 | 8 | 9 |
| weight | −0.11 | −0.11 | −0.11 | −0.11 | 0.18 | 0.18 | 0.18 | 0.18 | 0.18 | |
| Silurian | class | 3 | 4 | 5 | 6 | 7 | 8 | 9 | ||
| weight | −1.21 | −1.21 | −1.21 | 0.79 | 0.86 | 0.86 | 0.86 | |||
| Permian | class | 7 | 8 | 9 | ||||||
| weight | −2.26 | −2.26 | −0.15 | |||||||
| Triassic | class | 1 | 2 | 3 | 4 | 5 | 6 | 7 | 8 | 9 |
| weight | 0.48 | 0.48 | 0.48 | 0.48 | −0.34 | −0.35 | −0.35 | −0.35 | −0.35 | |
| Cretaceous | class | 1 | 2 | 3 | 4 | 5 | 6 | 7 | 9 | |
| weight | 0.54 | 0.54 | 0.54 | 0.54 | 0.34 | 0.34 | 0.34 | 0.34 | ||
| Paleogene | class | 1 | 2 | 3 | 4 | 5 | 6 | 7 | 8 | 9 |
| weight | 0.97 | 0.97 | 0.97 | 0.97 | 0.1 | −0.26 | −0.26 | −0.26 | −0.26 |
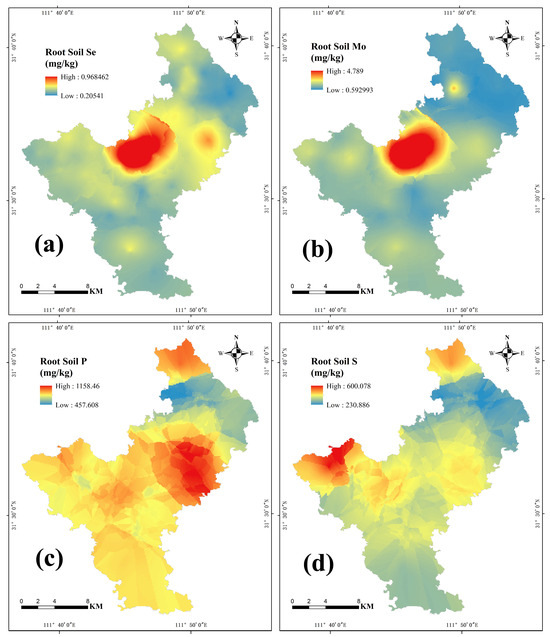
Figure A1.
The distributions of root soil elements ((a): Se, (b): Mo, (c): P, and (d): S).
Table A4.
The hyperparameters of the models.
Table A4.
The hyperparameters of the models.
| BP-NN | SVR | ||||||
|---|---|---|---|---|---|---|---|
| Hyperparameters | Crops | Wheat | Rice | Rapeseed | Tea | Hyperparameters | Crops |
| epoch | 3637 | 1815 | 1096 | 1115 | 589 | C | 100 |
| learning rate | 0.001 | 0.001 | 0.1 | 0.003 | 0.004 | epsilon | 0.000001 |
| hidden layer size | 12, 6 | gamma | 0.01 | ||||
| activation | ReLU | kernel | rbf | ||||
| loss function | MSELoss | ||||||
References
- Mao, J.; Pop, V.J.; Bath, S.C.; Vader, H.L.; Redman, C.W.; Rayman, M.P. Effect of low-dose selenium on thyroid autoimmunity and thyroid function in UK pregnant women with mild-to-moderate iodine deficiency. Eur. J. Nutr. 2016, 55, 55–61. [Google Scholar] [CrossRef] [PubMed]
- Dinh, Q.T.; Cui, Z.; Huang, J.; Tran, T.A.T.; Wang, D.; Yang, W.; Zhou, F.; Wang, M.; Yu, D.; Liang, D. Selenium distribution in the Chinese environment and its relationship with human health: A review. Environ. Int. 2018, 112, 294–309. [Google Scholar] [CrossRef] [PubMed]
- Pecoraro, B.M.; Leal, D.F.; Frias-De-Diego, A.; Browning, M.; Odle, J.; Crisci, E. The health benefits of selenium in food animals: A review. J. Anim. Sci. Biotechnol. 2022, 13, 58. [Google Scholar] [CrossRef] [PubMed]
- Doaei, S.; Mardi, A.; Zare, M. Role of micronutrients in the modulation of immune system and platelet activating factor in patients with COVID-19; a narrative review. Front. Nutr. 2023, 10, 1207237. [Google Scholar] [CrossRef]
- Wang, K.; Fang, Q.; He, P.; Tu, Y.; Liu, Z.; Li, B. Unveiling the potential of selenium-enriched tea: Compositional profiles, physiological activities, and health benefits. Trends Food Sci. Technol. 2024, 145, 104356. [Google Scholar] [CrossRef]
- Genchi, G.; Lauria, G.; Catalano, A.; Sinicropi, M.S.; Carocci, A. Biological activity of selenium and its impact on human health. Int. J. Mol. Sci. 2023, 24, 2633. [Google Scholar] [CrossRef]
- Werkneh, A.A.; Gebretsadik, G.G.; Gebru, S.B. Review on environmental selenium: Occurrence, public health implications and biological treatment strategies. Environ. Chall. 2023, 11, 100698. [Google Scholar] [CrossRef]
- Natasha; Shahid, M.; Niazi, N.K.; Khalid, S.; Murtaza, B.; Bibi, I.; Rashid, M.I. A critical review of selenium biogeochemical behavior in soil-plant system with an inference to human health. Environ. Pollut. 2018, 234, 915–934. [Google Scholar] [CrossRef]
- Ren, X.; Wang, Y.; Sun, J.; Liang, K.; Zhu, H.; Li, Y.; Gao, J.; Zhang, Y.; Huang, S.; Zhu, D. Legal Standards for Selenium Enriched Foods and Agricultural Products: Domestic and International Perspectives. Nutrients 2024, 16, 3659. [Google Scholar] [CrossRef]
- Navarro-Alarcon, M.; Cabrera-Vique, C. Selenium in food and the human body: A review. Sci. Total Environ. 2008, 400, 115–141. [Google Scholar] [CrossRef]
- Huang, Y.; Wang, Q.; Gao, J.; Lin, Z.; Banuelos, G.S.; Yuan, L.; Yin, X. Daily dietary selenium intake in a high selenium area of Enshi, China. Nutrients 2013, 5, 700–710. [Google Scholar] [CrossRef]
- Zhang, L.; Song, H.; Guo, Y.; Fan, B.; Huang, Y.; Mao, X.; Liang, K.; Hu, Z.; Sun, X.; Fang, Y.; et al. Benefit-risk assessment of dietary selenium and its associated metals intake in China (2017–2019): Is current selenium-rich agro-food safe enough? J. Hazard. Mater. 2020, 398, 123224. [Google Scholar] [CrossRef] [PubMed]
- Xie, S.; Wan, X.; Dong, J.; Wan, N.; Jiang, X.; Carranza, E.J.M.; Wang, X.; Chang, L.; Tian, Y. Quantitative prediction of potential areas likely to yield Se-rich and Cd-low rice using fuzzy weights-of-evidence method. Sci. Total Environ. 2023, 889, 164015. [Google Scholar] [CrossRef] [PubMed]
- Bai, J. Research on Problems and Countermeasures of Organic Agriculture Development in Nanzhang County. Master’s Thesis, Central China Normal University, Wuhan, China, 2020. (In Chinese with English Abstract). [Google Scholar]
- Yan, J.; Tang, J. Study on the development pattern of geologic hazards and influencing factors in Nanzhang County. China Constr. 2023, 8, 118–120. (In Chinese) [Google Scholar]
- Liu, X.; Ma, Q.; Song, Z.; Ye, Z.; Zhai, X.; Zhang, M.; Zhang, L.; Wang, Q. Research on the spatial pattern distribution of soil selenium using machine learning methods integrating geographic proximity in complex terrain. J. Soils Sediments 2024, 24, 2776–2790. [Google Scholar] [CrossRef]
- Zhang, L.; Gao, R.; Zhang, H.; Luo, X.; Song, Z. Study on the Influence of Consumers’ Purchase Intention of Selenium-Rich Agricultural Products. Appl. Sci. 2023, 13, 1859. [Google Scholar] [CrossRef]
- Dinh, Q.T.; Wang, M.; Tran, T.A.T.; Zhou, F.; Wang, D.; Zhai, H.; Peng, Q.; Xue, M.; Du, Z.; Bañuelos, G.S. Bioavailability of selenium in soil-plant system and a regulatory approach. Crit. Rev. Environ. Sci. Technol. 2019, 49, 443–517. [Google Scholar] [CrossRef]
- Mora, M.; Durán, P.; Acuña, J.; Cartes, P.; Demanet, R.; Gianfreda, L. Improving selenium status in plant nutrition and quality. J. Soil Sci. Plant Nutr. 2015, 15, 486–503. [Google Scholar] [CrossRef]
- Ma, X.; Yang, Z.; Yu, T.; Guan, D.X. Probability of cultivating Se-rich maize in Se-poor farmland based on intensive field sampling and artificial neural network modelling. Chemosphere 2022, 309, 136690. [Google Scholar] [CrossRef]
- Zhang, L.; Yu, T.; Zheng, G.; Tang, Q.; Peng, M.; Li, C.; Hou, Q.; Yang, Z. Using machine learning to predict selenium content in crops: Implications for soil health and agricultural land utilization in longevity regions. Sci. Total Environ. 2025, 964, 178520. [Google Scholar] [CrossRef]
- Falegnami, A.; Tomassi, A.; Gunella, C.; Amalfitano, S.; Corbelli, G.; Armonaite, K.; Fornaro, C.; Giorgi, L.; Pollini, A.; Caforio, A.; et al. Defining conceptual artefacts to manage and design simplicities in complex adaptive systems. Heliyon 2024, 10. [Google Scholar] [CrossRef] [PubMed]
- Guo, R.; Ren, R.; Wang, L.; Zhi, Q.; Yu, T.; Hou, Q.; Yang, Z. Using machine learning to predict selenium and cadmium contents in rice grains from black shale-distributed farmland area. Sci. Total Environ. 2024, 912, 168802. [Google Scholar] [CrossRef]
- Hagenauer, J.; Helbich, M. A geographically weighted artificial neural network. Int. J. Geogr. Inf. Sci. 2022, 36, 215–235. [Google Scholar] [CrossRef]
- Huang, B.Y.; Lu, Q.X.; Tang, Z.X.; Tang, Z.; Chen, H.P.; Yang, X.P.; Zhao, F.J.; Wang, P. Machine learning methods to predict cadmium (Cd) concentration in rice grain and support soil management at a regional scale. Fundam. Res. 2024, 4, 1196–1205. [Google Scholar] [CrossRef] [PubMed]
- Zheng, J.; Yang, J.; Liu, X.; Chen, X.; Zhou, W.; Cao, G.; Wang, M. Study on Ecological Restoration Countermeasures for Typical Karst Rocky Desertification Areas in the Middle Reach of Yangtze River—Study on the Development Laws and Influencing Factors of Geological Hazards in Nanzhang County, Xiangyang City, Hubei Province, as an Example. J. Huanggang Norm. Univ. 2021, 41, 27–30. (In Chinese) [Google Scholar]
- DZ/T 0145-2017; Code of Practice for Soil Geochemical Survey. Ministry of Land and Resources of the People’s Republic of China: Beijing, China, 2017; p. 42.
- DZ/T 0295-2016; Specification of Land Quality Geochemical Assessment. Ministry of Land and Resources of the People’s Republic of China: Beijing, China, 2016; p. 57.
- Zhao, W.; Cui, S.; Zou, X.; Tang, C.; Xia, J.; Jin, S. Geochemical characteristics of stream sediments and metallogenic prognosis of Heku area, Hunan Province. Geol. China 2014, 41, 638–647, (In Chinese with English Abstract). [Google Scholar]
- Moharana, P.C.; Jena, R.K.; Kumar, N.; Singh, R.S.; Rao, S.S. Assessment of soil organic and inorganic carbon stock at different soil depths after conversion of desert into arable land in the hot arid regions of India. Carbon Manag. 2021, 12, 153–165. [Google Scholar] [CrossRef]
- Bai, Y.; Chen, K.X.; Chen, C.; Li, F.L.; Zhang, J.C.; Wei, L.X.; Si, K.F.; Zheng, X.W.; Hu, Y.F.; Wu, Y.; et al. Stream sediment geochemistry and prospecting targets in Harper, Liberia. Geophys. Geochem. Explor. 2024, 48, 382–392, (In Chinese with English Abstract). [Google Scholar] [CrossRef]
- Cheng, Q.; Agterberg, F. Fuzzy weights of evidence method and its application in mineral potential mapping. Nat. Resour. Res. 1999, 8, 27–35. [Google Scholar] [CrossRef]
- Deng, J.; Zhan, M.G.; Zhou, W.J.; Wu, S.; Huang, N.; Zhang, R.; Xie, S. Quantitative prediction of mineral resources in typical gold deposits in Guangxi, China using a fuzzy weights of evidence method. J. Geomech. 2021, 27, 374–390, (In Chinese with English Abstract). [Google Scholar] [CrossRef]
- Zhang, Z.; Zuo, R.; Xiong, Y. A comparative study of fuzzy weights of evidence and random forests for mapping mineral prospectivity for skarn-type Fe deposits in the southwestern Fujian metallogenic belt, China. Sci. China Earth Sci. 2016, 59, 556–572. [Google Scholar] [CrossRef]
- Cheng, Q.; Chen, Z.; Ali, K. Application of Fuzzy Weights of Evidence Method in Mineral Resource Assessment for Gold in Zhenyuan District, Yunnan Province, China. Earth Sci.-J. China Univ. Geosci. 2007, 32, 175–184, (In Chinese with English Abstract). [Google Scholar] [CrossRef]
- Xie, S.; Huang, N.; Deng, J.; Wu, S.; Zhan, M.; Carranza, E.J.M.; Zhang, Y.; Meng, F. Quantitative prediction of prospectivity for Pb–Zn deposits in Guangxi (China) by back-propagation neural network and fuzzy weights-of-evidence modelling. Geochem. Explor. Environ. Anal. 2022, 22, geochem2021-085. [Google Scholar] [CrossRef]
- Adeniyi, O.D.; Brenning, A.; Maerker, M. Spatial prediction of soil organic carbon: Combining machine learning with residual kriging in an agricultural lowland area (Lombardy region, Italy). Geoderma 2024, 448, 116953. [Google Scholar] [CrossRef]
- Singha, S.; Pasupuleti, S.; Singha, S.S.; Singh, R.; Kumar, S. Prediction of groundwater quality using efficient machine learning technique. Chemosphere 2021, 276, 130265. [Google Scholar] [CrossRef] [PubMed]
- Shao, W.; Guan, Q.; Tan, Z.; Luo, H.; Li, H.; Sun, Y.; Ma, Y. Application of BP-ANN model in evaluation of soil quality in the arid area, northwest China. Soil Tillage Res. 2021, 208, 104907. [Google Scholar] [CrossRef]
- Wang, Y.; Yang, Z.; Chen, G.; Zhan, L.; Zhang, M.; Zhou, M.; Sheng, W. Influencing factors of selenium transformation in a soil-rice system and prediction of selenium content in rice seeds: A case study in Ninghua County, Fujian Province. Environ. Sci. Pollut. Res. Int. 2024, 31, 995–1006. [Google Scholar] [CrossRef]
- Abdollahpour, S.; Kosari-Moghaddam, A.; Bannayan, M. Prediction of wheat moisture content at harvest time through ANN and SVR modeling techniques. Inf. Process. Agric. 2020, 7, 500–510. [Google Scholar] [CrossRef]
- Paidipati, K.K.; Chesneau, C.; Nayana, B.; Kumar, K.R.; Polisetty, K.; Kurangi, C. Prediction of rice cultivation in India—Support vector regression approach with various kernels for non-linear patterns. Agriengineering 2021, 3, 182–198. [Google Scholar] [CrossRef]
- Wang, Y.; Yu, T.; Yang, Z.; Bo, H.; Lin, Y.; Yang, Q.; Liu, X.; Zhang, Q.; Zhuo, X.; Wu, T. Zinc concentration prediction in rice grain using back-propagation neural network based on soil properties and safe utilization of paddy soil: A large-scale field study in Guangxi, China. Sci. Total Environ. 2021, 798, 149270. [Google Scholar] [CrossRef]
- Yang, H.; Yang, X.; Ning, Z.; Kwon, S.Y.; Li, M.L.; Tack, F.M.G.; Kwon, E.E.; Rinklebe, J.; Yin, R. The beneficial and hazardous effects of selenium on the health of the soil-plant-human system: An overview. J. Hazard. Mater. 2022, 422, 126876. [Google Scholar] [CrossRef] [PubMed]
- Chauhan, R.; Awasthi, S.; Tripathi, P.; Mishra, S.; Dwivedi, S.; Niranjan, A.; Mallick, S.; Tripathi, P.; Pande, V.; Tripathi, R.D. Selenite modulates the level of phenolics and nutrient element to alleviate the toxicity of arsenite in rice (Oryza sativa L.). Ecotoxicol. Environ. Saf. 2017, 138, 47–55. [Google Scholar] [CrossRef]
- Zhou, X.; Yang, J.; Kronzucker, H.J.; Shi, W. Selenium Biofortification and Interaction With Other Elements in Plants: A Review. Front. Plant Sci. 2020, 11, 586421. [Google Scholar] [CrossRef] [PubMed]
- Fordyce, F.M. Selenium deficiency and toxicity in the environment. In Essentials of Medical Geology: Revised Edition; Springer: Berlin/Heidelberg, Germany, 2012; pp. 375–416. [Google Scholar]
- Darabi-Golestan, F.; Hezarkhani, A. Evaluation of elemental mineralization rank using fractal and multivariate techniques and improving the performance by log-ratio transformation. J. Geochem. Explor. 2018, 189, 11–24. [Google Scholar] [CrossRef]
- Mi, T.; Hao, L.; Zhao, X.; Lu, J.; Zhao, Y. The Study of Stream Sediment Geochemical Data Processing by Using k-Means Algorithm and Centered Logratio Transformation—An Example of a District in Hunan, China. Geochem. Int. 2018, 56, 1233–1244. [Google Scholar] [CrossRef]
- DBS42/002-2022; Selenium Content Requirement for Organic Selenium Enriched Foods. Health Commission of Hubei Province: Wuhan, China, 2022.
- GB/T 22499-2008; Rich Selenium Paddy. State General Administration of the People’s Republic of China for Quality Supervision and Inspection and Quarantine, Standardization Administration of the People’s Republic of China: Beijing, China, 2008; p. 8.
- Liu, R.; Zhou, W.; Yu, D.; Shang, G.; Zhou, Y.; Xu, Z.; Tang, D.; Cui, H.; Liao, C. Spatial distribution and enrichment characteristics of selenium in paddy soil and rice around the Dongting Lake. Environ. Pollut. 2024, 359, 124552. [Google Scholar] [CrossRef]
- Lundberg, S.M.; Lee, S.I. A unified approach to interpreting model predictions. Adv. Neural Inf. Process. Syst. 2017, 30. [Google Scholar] [CrossRef]
- Antonini, A.S.; Tanzola, J.; Asiain, L.; Ferracutti, G.R.; Castro, S.M.; Bjerg, E.A.; Ganuza, M.L. Machine Learning model interpretability using SHAP values: Application to Igneous Rock Classification task. Appl. Comput. Geosci. 2024, 23, 100178. [Google Scholar] [CrossRef]
- Kazemi, F.; Asgarkhani, N.; Jankowski, R. Optimization-based stacked machine-learning method for seismic probability and risk assessment of reinforced concrete shear walls. Expert Syst. Appl. 2024, 255, 124897. [Google Scholar] [CrossRef]
- Ros, G.; Van Rotterdam, A.; Bussink, D.; Bindraban, P.S. Selenium fertilization strategies for bio-fortification of food: An agro-ecosystem approach. Plant Soil 2016, 404, 99–112. [Google Scholar] [CrossRef]
- De Feudis, M.; D’Amato, R.; Businelli, D.; Guiducci, M. Fate of selenium in soil: A case study in a maize (Zea mays L.) field under two irrigation regimes and fertilized with sodium selenite. Sci. Total Environ. 2019, 659, 131–139. [Google Scholar] [CrossRef] [PubMed]
Disclaimer/Publisher’s Note: The statements, opinions and data contained in all publications are solely those of the individual author(s) and contributor(s) and not of MDPI and/or the editor(s). MDPI and/or the editor(s) disclaim responsibility for any injury to people or property resulting from any ideas, methods, instructions or products referred to in the content. |
© 2025 by the authors. Licensee MDPI, Basel, Switzerland. This article is an open access article distributed under the terms and conditions of the Creative Commons Attribution (CC BY) license (https://creativecommons.org/licenses/by/4.0/).