Article

Enhancing Prospecting Target Prediction Precision: A Multi-Source Data Mining Approach in Gansu’s Beishan Area

1
Faculty of Land Resources Engineering, Kunmig University of Science and Technology, Kunming 650093, China
2
Gansu Geological Big Data Engineering Research Center, Lanzhou 730000, China
3
Geological Survey of Gansu Province, Lanzhou 730000, China
4
149th Team, Gansu Coal Geology Bureau, Lanzhou 730020, China
*
Authors to whom correspondence should be addressed.
Appl. Sci. 2025, 15(10), 5430; https://doi.org/10.3390/app15105430
Submission received: 26 March 2025 / Revised: 30 April 2025 / Accepted: 8 May 2025 / Published: 13 May 2025
(This article belongs to the Special Issue Recent Advances in Geochemistry)

Abstract

:
The success of geological prospecting depends on the accuracy of target area prediction. Traditional qualitative research methods rooted in theoretical frameworks have shown significant limitations, especially in their inability to fully exploit the latent value of existing geological information. Applying big data concepts and methodologies to geological information mining has emerged as an effective way to improve the accuracy of prospecting target prediction. This study is founded on the core principle of geoscience big data: to “uncover correlations within data to address geological issues”. Taking geochemical prospecting and aeromagnetic data from the Beishan area in Gansu Province as a case in point, this study emphasizes the significance of meticulous data processing in averting potential errors. A suite of prospecting models was developed through multi-source data mining to identify potential gold deposits. Notably, aeromagnetic data were innovatively employed for the first time to predict the occurrence of non-magnetic minerals, which are primarily structurally altered rock-type and quartz vein-type gold deposits. The developed prospecting model was used to predict metallogenesis in the Beishan area of Gansu Province. The prospecting target area was delineated, accounting for 3.67% of the study area. Verification using field sampling data revealed that the actual mineralization rate in the level-I target area reached 52.6%. The research results suggest that this approach can substantially enhance the accuracy of prospecting target area prediction.

1. Introduction

In recent years, big data have been successfully utilized in finance, the internet, medicine, logistics, and media [1,2,3], but their practical application is relatively weak [4,5,6]. The essence of big data is a new way of thinking: deeply mining data to study correlations between data, extract valuable information, solve scientific and technological problems, and approach the event itself with the highest probability [7]. Big data are triggering a profound revolution in the field of geoscience [8,9]. Academicians Zhao Pengda and Guo Huadong have repeatedly emphasized the important viewpoint that “The concept of ‘big data’ represents a novel scientific research idea and method grounded in theoretical science”. The difference between the prediction of mineral prospecting target areas based on ore genesis theory and the in-depth mining of geological information (data) lies in the former studying the causal relationship of the ore-formation process, whereas the latter focuses on the correlation between mineral prospecting information (data) [1,10,11,12].
The accuracy of predicting the target area for prospecting determines the effectiveness of the prospecting efforts [13,14,15,16]. As geological prospecting advances, the quantity of mineral deposits uncovered using traditional predictive prospecting concepts (theory-driven) and methodologies (examining cause-and-effect relationships) is diminishing [17,18,19,20,21]. The application of big data thinking (data-driven) and methods (correlation analysis) has resulted in the construction of quantitative prediction models. There is now a consensus within the industry that existing geological and mineral deposit information (data) can be harnessed to improve the accuracy of prospecting target area predictions [22,23,24,25,26,27,28,29,30,31,32]. The element Au occurs naturally in the form of particles, with a low and uneven distribution. This leads to some gold deposits (points) not displaying corresponding abnormal occurrences of the element Au. This increases the difficulty of geological prospecting and metallogenic prediction research through elemental anomalies. The geochemical sampling and testing process inherently constrains the capacity to accurately reflect information on Au abundance due to representativeness and other factors. This diminishes the applicability of the data. Consequently, some Au deposits (points) lack corresponding geochemical anomalies for implausible phenomena [33,34,35]. In response to the aforementioned issues, this paper uses the Beishan area of Gansu Province as a case study. Guided by the concept of “data-driven” geological big data, the approach emphasizes the reduction of noise in raw data and the restoration of geochemical information through the in-depth mining of geochemical and magnetic data in the area. The concept of using geophysical and geochemical data to develop predictive models has been employed to quantitatively identify prospective areas for gold deposits. This approach has shown notable success in enhancing the precision of target area prediction, offering promising insights into the integration of geophysical and geochemical data in gold prospecting.

2. Geology and Data

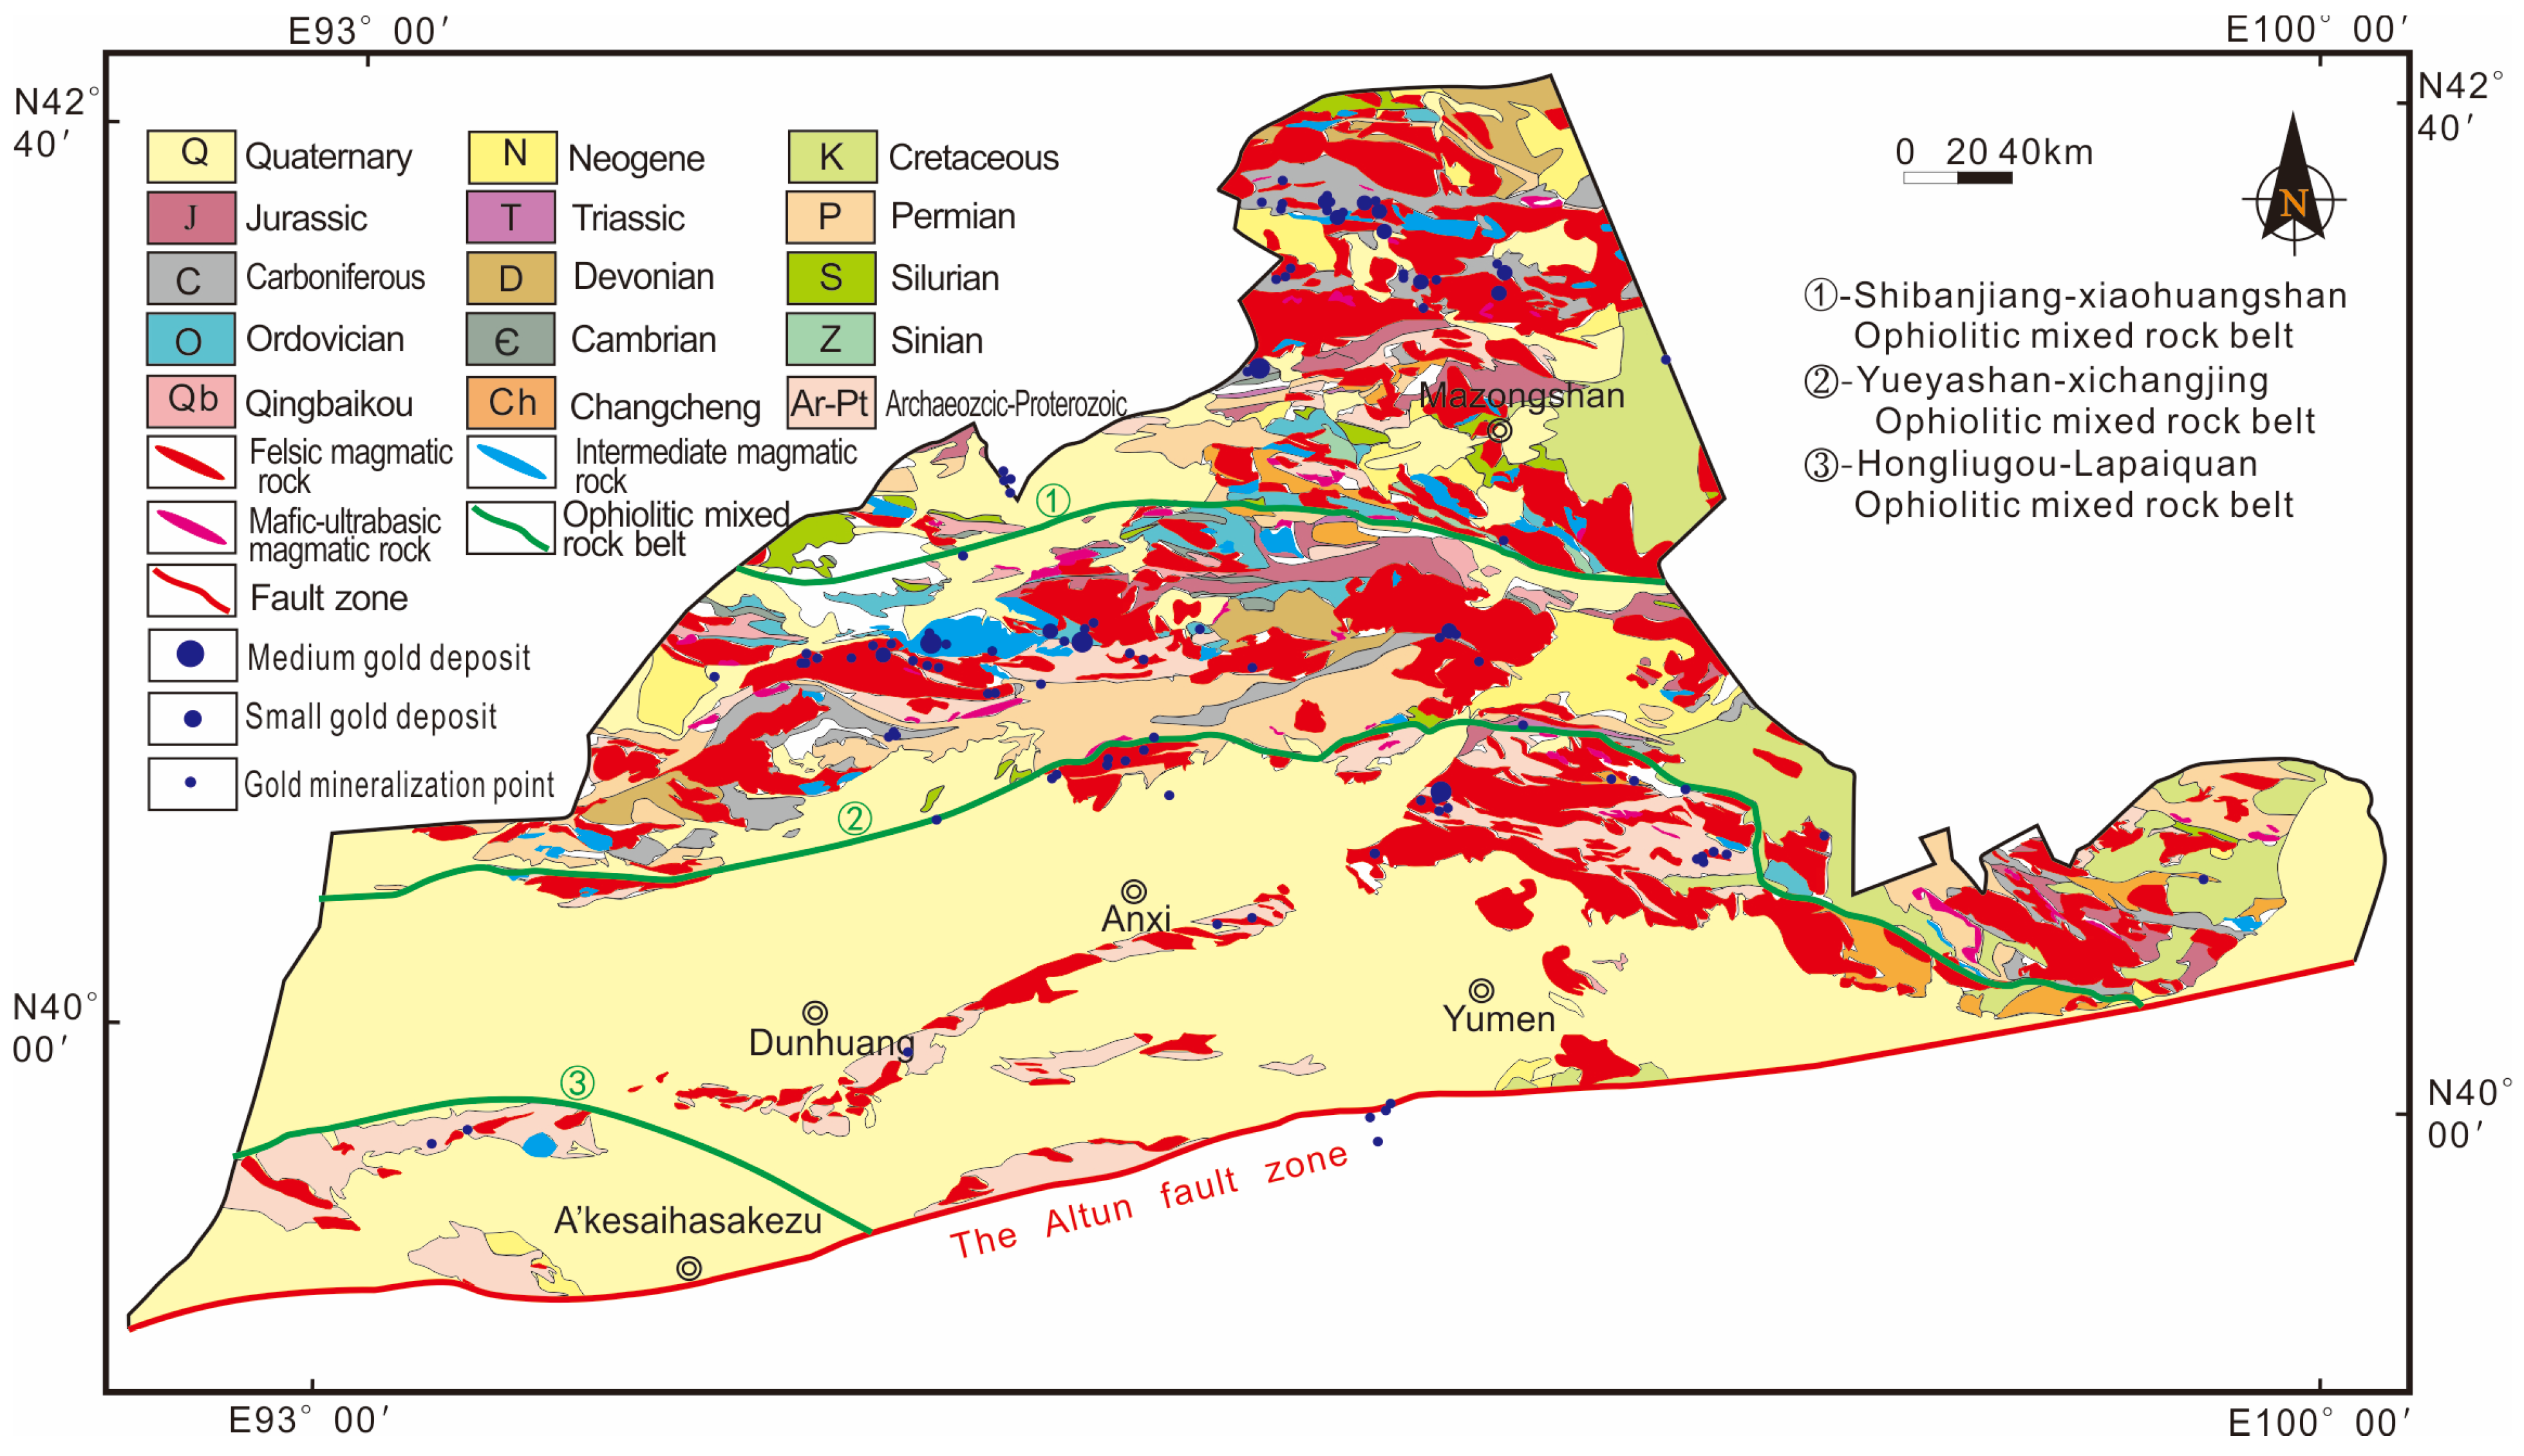
2.1. Geological Setting

The Beishan area in Gansu Province is a significant metallogenic zone in Northwest China. It is situated at the convergence of the three ancient continental systems of Kazakhstan, Siberia, and Tarim. It exhibits a complex geological structure, frequent magmatic activity, and strong metamorphism (Figure 1). The area is of particular interest regarding the formation of gold, copper, iron, lead–zinc, tungsten, vanadium, uranium, nickel, and other ores in China [36,37,38,39,40]. The stratigraphy in the Beishan area is fully developed, and strata from the Archean to the Cenozoic are all exposed in the area. The exposed strata mainly include the Neoarchean–Paleoproterozoic Dunhuang Group, the Changchengian Qianluzigou Group, and the Gudongjing Group [41]. There are also the Jixianian Pingtoushan Formation; the Qingbaikouan Dahuoluoshan Formation; the Nanhua–Sinian Xichangjing Group; the Cambrian Shuangyingshan Formation and Xishuangyingshan Formation; the Ordovician Luoyachuanshan Formation; Huaniushan Group; Xilinkebo Formation; Baiyunshan Formation; the Silurian Heijianshan Formation and Gongpoquan Group; the Devonian Sangejing Formation and Dundunshan Group; the Carboniferous Hongliuyuan Formation; Jijitai Formation; Baishan Formation and Saozishan Formation; the Permian Shuangbaotang Formation; Fangshankou Formation; Jinta Formation and Hongyanjing Formation; the Triassic Erduanjing Formation; the Neogene Kuquan Formation; and the Quaternary System [42]. As exemplified in the Beishan metallogenic belt of Gansu Province, the gold mineralization systems are dominantly classified into quartz vein-type, structural altered rock-type, and magmatic–hydrothermal-type deposits. These gold deposits are typically controlled by ductile shear zones and fault systems, with mineralization closely associated with Paleozoic magmatic activities and regional metamorphic–hydrothermal processes [43,44,45]. Copper deposits in this region primarily manifest as porphyry-type, magmatic–hydrothermal-type, and sedimentary–metamorphic-type mineralization. Notably, the porphyry copper deposits are genetically linked to the Late Paleozoic (Hercynian) intermediate–acidic intrusive complexes, while sedimentary–metamorphic copper ores are hosted in Proterozoic to Carboniferous marine sedimentary sequences subjected to subsequent tectonic reworking [46,47]. This metallogenic belt is characterized by its wealth of mineral species, the variety of deposit types, and the prevalence of large-scale deposits. It possesses considerable economic value and holds significant potential for scientific research. The stratigraphic succession in the Beishan area has undergone extensive geological evolution, encompassing distinct evolutionary phases that span two primary geotectonic units: the southern margin of the Tianshan–Xingmeng Orogenic System (I) and the eastern sector of the Tarim Block (III) [48,49,50]. The region showcases a diverse paleogeographic environment and a perpetually changing land–sea distribution pattern. It also exhibits a high degree of intrusive rock development, with an exposed area of approximately 20,480 km2, which constitutes 19% of the total North Mountain region area. These rocks have been formed over an extensive timespan, from the Proterozoic to the Jurassic, and encompass a diverse range of rock types, from ultramafic to granitoid. A majority of these rocks are granitoids, originating from the Silurian to Permian periods [51,52,53]. The Beishan region in Gansu Province boasts favorable metallogenic conditions, abundant mineral resources, a diverse array of minerals, and a relatively comprehensive range of mineral types [43,44,45]. However, the composition is complex, the sizes vary, and the overall level of exploration remains relatively low. By the end of 2023, a total of 62 distinct solid mineral species had been identified within the Beishan region of Gansu Province, with a total of 622 locations—including mineralization points—having been documented. Among these, 115 gold deposits (points) have been discovered, with the primary formation type being hydrothermal deposits from the late Paleozoic, Mesoproterozoic, Archean–Proterozoic, and early Paleozoic eras, followed by structural altered rock-type, volcanic rock-type, and sedimentary–metamorphic-type deposits [54,55,56].

2.2. Data Sources

The datasets for this study are detailed as follows: Regional geological data consist of Geological and mineral resources map of Gansu Province (1:1,000,000), tectonic phase map of Gansu Province (1:1,000,000), and a total of 32 sets of regional geological maps and descriptions at a scale of 1:200,000 covering the entire Beishan area. Mineral geological data consist of a total of 32 sets of 1:200,000 mineral geological maps and descriptions covering the entire Beishan area of Gansu Province, 10 sheets of 1:50,000 regional geological data, 15 sheets of 1:50,000 mineral prospecting survey data, approximately 30 detailed geological and mineral resources investigation documents, the mineral database of Gansu Province, and mineral data from the geological records of Gansu Province. Geochemical exploration data consist of a 1:200,000 regional geochemical database for the Beishan area of Gansu Province, containing stream sediment samples’ locations and test results for 39 elements, including Au, Cu, U, Th, Ag, Mo, Sn, W, As, Sb, Bi, and Hg, for a total of 29,783 data points. Aeromagnetic data consist of 2,512,247 aerial magnetic measurement points in the Beishan area of Gansu Province at scales of 1:50,000 and 1:100,000.

3. Methodology

3.1. Research Ideas and Research Procedures

3.1.1. Research Ideas

A quantitative optimization of Au mineralized targets in the Beishan area of Gansu Province was conducted, based on the fundamental premise of the geoscience big data “theory of change-driven model to data-driven model”. A database of mineral deposit and mineralization point information is constructed based on the characteristics of mineral distribution in the study area. A quantitative study of the correlation between results and variables (information and conditions) is conducted using a proven mathematical model (multivariate statistical analysis) and an inference model (artificial intelligence and machine learning), which are combined with a 1:200,000 stream sediment survey and aeromagnetic data in the study area. This method can accurately determine the degree of similarity between “prediction units” (areas where mineral deposits have not yet been discovered) and “ore-bearing units” (areas where mineral deposits have been found). This enables the correlation between multiple parameters and geological elements to be revealed, the potential value of data information to be harnessed, the efficiency and accuracy of target area selection to be enhanced, and comprehensive geological surveys and quantitative target area selection for regional mineral prospecting to be conducted more effectively.

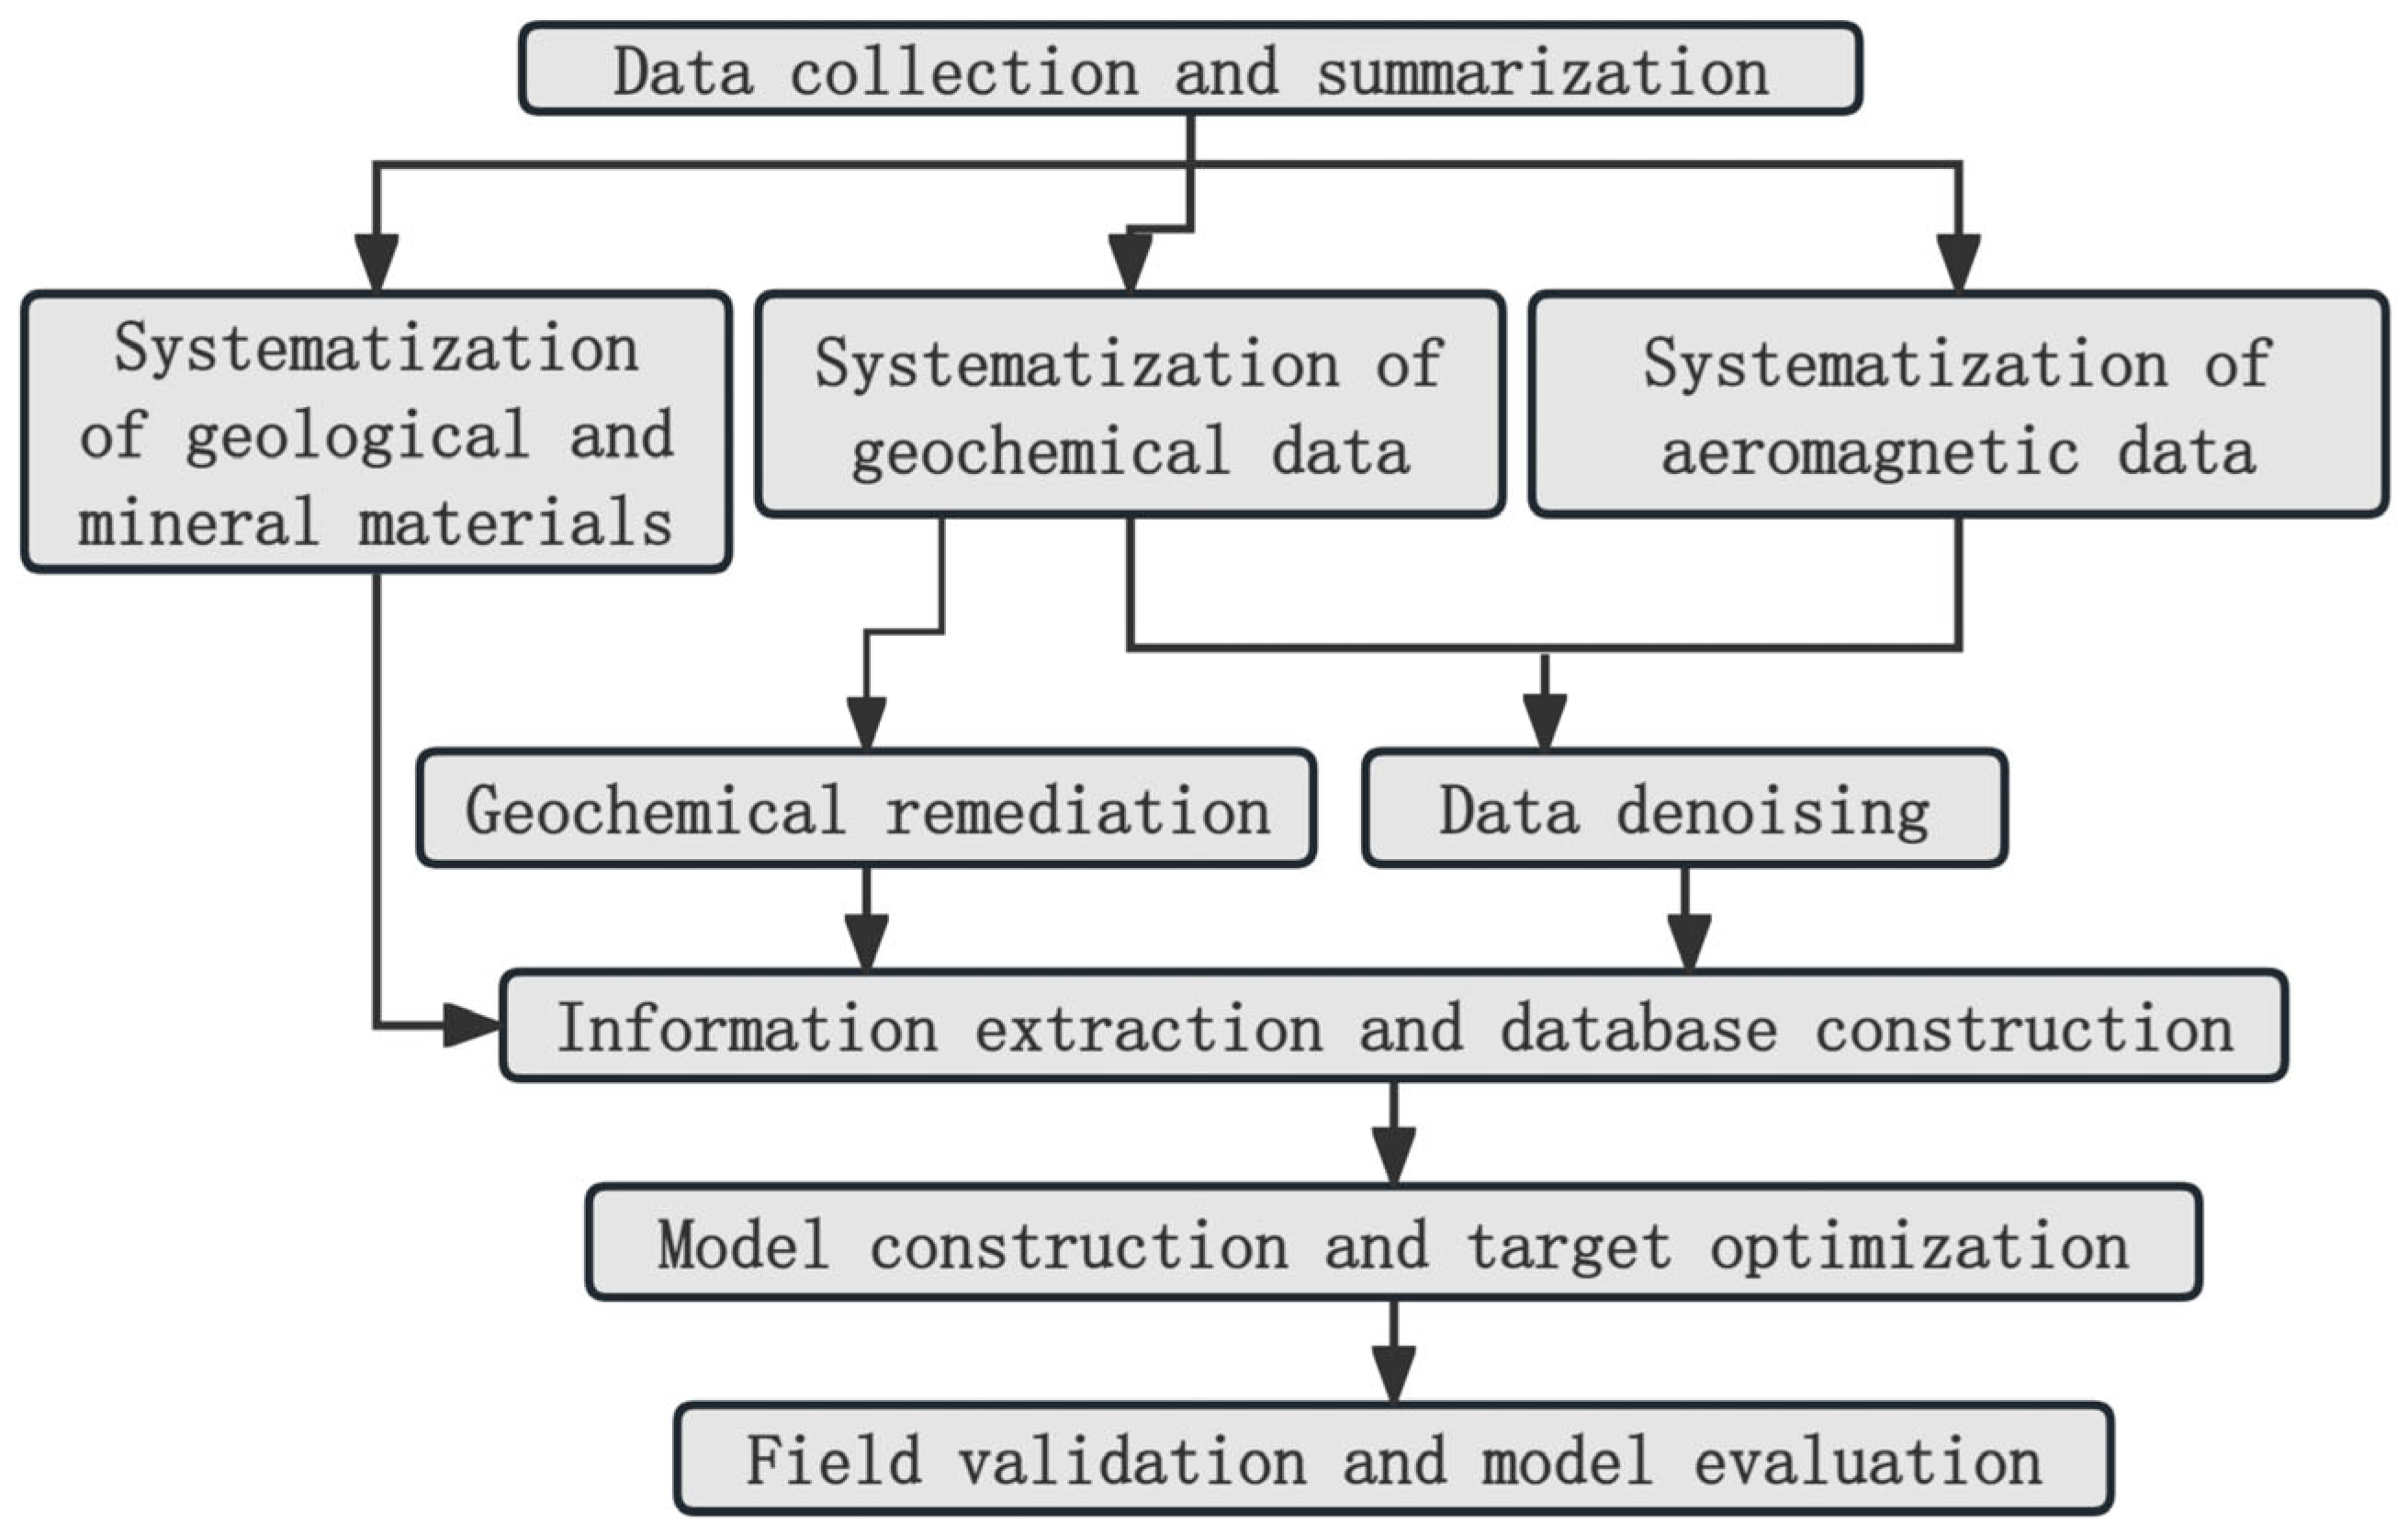
3.1.2. Research Procedures

By fully utilizing the computing, searching, and processing capabilities of computers, it is possible to achieve a rough approximation of the quantitative optimization of regional mineral prospecting target areas, based on big data concepts and methods. This can be accomplished through the following steps (Figure 2):
  • The objective is to compile and categorize data related to regional and mineral surveys and mineral resources within the specified study area, at varying scales, including 1:50,000 and 1:200,000. These data must be organized and classified according to a standardized geological background information system. Subsequently, a database of information on the principal gold deposits (points) within the Beishan area should be established, based on statistical analysis.
  • The geochemical data at a scale of 1:200,000 and aeromagnetic data of various scales were processed individually, leading to the creation of separate geochemical and aeromagnetic databases. These databases were then combined in readiness for mathematical modeling.
  • A comprehensive investigation into the relationship between regional geophysical and geochemical exploration data and the Au deposits (points) previously identified in the study area is necessary. This will involve developing a conditional correlation model, associating predicted deposits (points) with geophysical and geochemical exploration units, and creating a database of optimal models that incorporate known ore-bearing units.
  • SPSS Statistics Trial Version (20), which is the software provided by IBM China Headquarters located in Shanghai, China, was utilized to construct the quantitative preferred series model for the Au mine regional mineral exploration target area, employing specification units, sample units, and anomaly units, respectively.
  • Utilizing the data from the optimal results, a map of optimal prospecting targets is constructed, providing comprehensive information on predicted mineral species within the study area. The relevant parameters undergo statistical analysis, and the target area is subsequently verified in the field to evaluate the effectiveness and optimization of the optimal model.

3.2. Raw Data Processing

In big data research, the quality of the raw data directly determines the accuracy and validity of the results [1,57,58]. Due to the various errors that may exist in the raw data, these errors can directly affect the accuracy of the results of big data research if not properly processed. Therefore, noise reduction processing of raw data is particularly important.

3.2.1. Raw Data Noise Reduction Processing

A total of 29,783 geochemical samples were collected from 29 map sheets of 1:200,000 hydrogeological sediment surveys in the Beishan area of Gansu Province. Each sample underwent analysis for 39 geochemical elements. Given that these data were collected by various units over different years, significant systematic errors exist for the same element across different map sheets. To enhance the accuracy of the preferred target area, it is essential to conduct noise reduction, including determining the lower limit of anomalies and frame-by-frame adjustment on the original data.
To ascertain the lower threshold of anomalies within the raw data, the research team employed the concept of “machine vision” and independently devised the “linear approximation” method and algorithmic model software. This enabled them to accurately compute the lower limit of positive anomalies and the upper limit of negative anomalies for each element within each map frame of the study area simultaneously, significantly enhancing the precision and efficiency of calculating critical parameters. The “geochemical data sub-frame adjustment software” was utilized to simultaneously adjust the 39 elements measured in the 1:200,000-scale water system sediment survey in the study area to regional background reference. Additionally, the “geophysical data sub-frame adjustment software” was employed to conduct sub-frame adjustment processing on aeromagnetic data from various periods, survey areas, and scales across the entire region, ensuring the aeromagnetic data were standardized within the scope of the research area.

3.2.2. Information Extraction

The process of extracting mineral information is as follows: A total of 115 Au deposits (points) were identified in the selected area based on the aforementioned mineral geological data. The gold mineralization systems are dominantly classified into quartz vein-type, structural altered rock-type, and magmatic–hydrothermal-type deposits. These gold deposits are typically controlled by ductile shear zones and fault systems, with mineralization closely associated with Paleozoic magmatic activities and regional metamorphic–hydrothermal processes. Of these, 109 Au deposits (points) are located within the 1:200,000 stream sediment survey area. This study extracts 20-dimensional information on these deposits, including their location, stratum, structure, magmatic rock characteristics, ore body characteristics, ore-bearing structure (rock), resource quantity, and data source for each deposit (point). This allows basic geology to be utilized by a computer. The deposits, mineralization locations, stratigraphy, structural features, magmatic rocks, ore body characteristics, ore-bearing structures (rocks), resources (reserves), data sources, and other 20-dimensional information were extracted and subjected to mathematical statistical analysis using a computer.
The extraction of geochemical information is as follows: The geochemical data from the 1:200,000 water system sediment survey in the Beishan area underwent processing, resulting in the formation of 24,715 units (samples) through gridding at a 2 km × 2 km resolution. The background upper limit, lower limit, background value, median (mean) value, background difference rate, standard deviation, variation coefficient, skewness, kurtosis, upper limit difference rate, lower limit rate of change, goodness of fit, number of iterations, number of samples, and overall maximum and minimum values were extracted. The values, arithmetic mean, standard deviation, coefficient of variation, number of samples, and other statistical parameters were calculated for each geochemical parameter. A total of 33 geochemical parameters were considered. A stepwise regression simulation model was constructed for the Au element and other related elements. The fitted theoretical value Auh of Au was calculated to enhance the potential value of geochemical prospecting information in the quantitative and optimal research of regional prospecting target areas.
Extraction of aeromagnetic information: The aeromagnetic survey data, collected during various periods, were leveled and processed. Data points that intersected and overlapped with different datasets were cropped, adhering to the principle of prioritizing the dataset with the largest scale. This resulted in 2,512,247 effective physical measurement points.
Integration of geophysical and geochemical exploration data: To facilitate the simultaneous quantitative processing of geophysical and geochemical exploration data within the study area, the maximum (ΔTd) and minimum (ΔTx) values of the aeromagnetic data, after adjustment, were selected as the new aeromagnetic parameters. These parameters were positioned at the center of the coordinate points of the chemical exploration data and extended 2 km on each side. This selection takes into account both positive and negative aeromagnetic anomalies, as well as the characteristics of the aeromagnetic gradient zone. After the sorting process, a “Basic database of Au mineral exploration information (24,715 × 42)” was created for the study area, consisting of 24,715 samples and 42 variables (39 measured values of chemical elements, 1 fitted value of Au element Auh, and 2 aeromagnetic parameters).

3.2.3. Restoration of Au Geochemical Information

The geochemical map of the Au element, following the adjustment of the research area, is divided into five categories: extremely high anomaly, high anomaly, medium anomaly, low anomaly, and background. A statistical analysis of the distribution frequency of the 109 Au deposits (points) within the research area across different areas and the area percentage of different partitions is presented in Figure 3. As illustrated in Figure 3, (1) 42.6% of the Au deposits (points) are distributed in the Au anomaly area, but they are not closely related to the medium and high anomalies; (2) 95.5% of the Au deposits (points) are distributed in the low-anomaly area and background area, which collectively occupy 81.6% of the total area of the study area. A mere 4.5% of the Au deposits (points) are situated within the medium- and high-Au-element anomaly areas. It is evident that the use of Au element anomaly information alone is insufficient for the effective reduction of the prospecting target area. (3) If the prospecting target area is only studied based on Au element anomalies, nearly 57.4% of the information will be lost. The above conclusion demonstrates that it is challenging to effectively conduct research on optimizing Au prospecting target areas in the study area by solely examining Au and related element anomalies. Consequently, this study has rectified the Au geochemical information.
Considering the absence of natural chemical reactions that can decompose elemental Au particles into an ionic state, the Au element in dispersed flow predominantly exists in an extremely uneven metallic state and is present in granular form. Considering the representativeness of field sampling and assay sampling, along with the geographical location (water system location) of the gold deposit, the surface landscape, weathering conditions, and other comprehensive factors, it has not been observed that 57.4% of the Au deposits (points) in the study area lack corresponding Au element anomalies. According to relevant geochemical theories, all metallogenesis involves the enrichment of a series of related elements. Elements associated with Au metallogenesis, including Ag, As, Sb, Hg, Cu, and Bi, are typically evenly distributed in the water system sediments in ionic states. Consequently, these elements must share a specific relationship with the Au element. The authors utilized samples with anomalous Au values, along with the entire sample set from the region, to develop a stepwise regression simulation model (Auh) for Au and other related elements (Table 1). The numbers in the model represent the weights of each element or variable within the model. The elements listed in Table 1 were selected using the correlation analysis method in statistics. As shown in Table 1, elements such as Bi, Pb, Cu, Zn, Sb, SiO2, and Y show a positive correlation with Auh, while elements such as Zn, K2O, La, and Be exhibit a negative correlation with Auh.
Auh = 2 . 76 + Bi × 0 . 76 + Pb × 0 . 02 + Cu × 0 . 02 Zn × 0 . 01 + Sb × 0 . 07 + SiO 2 × 0 . 01 + Y × 0 . 02 K 2 O × 0 . 10 + B × 0 . 004 La × 0 . 01 + Th × 0 . 02 Be × 0 . 05 Na 2 O × 0 . 251 Li × 0 . 004 MgO × 0 . 01 + CaO × 0 . 01 + Au × 0 . 002 Nb × 0 . 004 U × 0 . 01 Fe 2 O 3 × 0 . 01 + Al 2 O 3 × 0 . 005 Mo × 0 . 01
The theoretical value of the Au element (Auh) is calculated using the entire sample in the research area to compensate for the loss of information due to sampling representativeness and other accidental factors, thereby increasing the correspondence between Au element anomalies and existing Au deposits (points), and enhancing the potential value of geochemical prospecting information in the quantitative optimization of prospecting target areas within Au-mining regions. Geochemical maps for Au and Auh fitting values were constructed separately, dividing the areas into five regions: extremely high anomaly, high anomaly, medium anomaly, low anomaly, and background. The frequency of occurrence of the 109 Au deposits (points) within the region was determined, as was the percentage of the region’s area occupied by each of the different anomaly regions. It is noteworthy that out of the identified Au mineralization points in the region, only 2 were not located within the geochemical anomaly area of the Au element or the Auh fitting value. In other words, 98.2% of the Au occurrences (points) in the entire region fall at least within the anomalous area of Au or Auh element fitting value. Therefore, it is believed that the Auh fitting value effectively compensates for the impact of the extremely uneven distribution of Au element in the water system sediment on the accuracy of the quantitative optimization of the target area for regional mineral exploration. This result has been well-validated in the subsequent stages of the metallogenic optimization model.

3.2.4. Specification of Unit Division

Centering on the 109 known Au deposits (points) in the region, a grid is divided, with each deposit (point) having a side length of 2 km. It is established that anomalous samples exhibiting Au elements or Auh fitting values within the grid have been identified as containing mineral samples. The mean value of each variable (element) within the grid is taken as the parameter (variable) of the known ore-bearing unit. The “Basic Database of Au Mineralization Exploration Information (24,715 × 42)” is combined with the “Modeling Database of Au Mineralization Exploration Information (24,824 × 42)” to form a comprehensive repository of information on Au mineralization exploration. This database encompasses 109 known ore-bearing units, representing 0.44% of the total.

4. Results and Discussion

4.1. Construction of a Quantitative Optimization Model for Prospecting Target Areas

Taking the “Au mineralized geophysical information modelling database (24,824 × 42)” as the research object, the relevant statistical analysis modules in SPSS Statistics Trial Version (20) are organically combined with corresponding algorithms to construct a series of “Quantitative optimization models for Au mineralized areas and prospecting target areas in the Beishan area of Gansu Province based on geophysical and geochemical information specifications”. The set of models consists of three models.
1.
Model I
A random selection of the 4943 ore-free units (units approximately 20% of the whole units) and 109 known ore-bearing units were processed using a stepwise discriminant model in SPSS software to construct the “Quantitative Optimization Model for Regional Prospecting Targets for Au Mineralization in the Beishan Area of Gansu Province I”. The model and its parameters are presented in Table 2.
R 1 = SiO 2 × 0 . 208 + Δ Tx × 0 . 004 + Δ Td × 0 . 003 + Al 2 O 3 × 0 . 267 + Na 2 O × 0 . 251 + Ti × 0 . 0006 + Ba × 0 . 0008 Pb × 0 . 03 V × 0 . 014 Au × 0 . 04 + CaO × 0 . 06 19 . 44
R1: Value of the specification unit identification function (model I).
R 0 = NA × R ¯ A + NB × R ¯ B NA + NB
where R0 is the discrimination threshold; NA and NB are the number of units in A (population with minerals) and B (population to be judged), respectively; R ¯ A and R ¯ B are the mean value of the discrimination function values for units A and B [59].
If R ¯ A > R ¯ B, when R1 > R0, the research unit is judged to be population A (preferably with ore), and when R1 < R0, the research unit is judged to be population B (preferably without ore). If R ¯ A < R ¯ B, the result is reversed [60,61].
The results of model I’s optimization are as follows: The aforementioned discriminant function (model I) is used to calculate the discriminant value (R1) for each research unit within the “Au Mineralization Prospecting Information Specification Unit Modeling Database (24,824 × 42)” in the Beishan region. The discrimination threshold is set at R0 = −1.98. Units with R1 < R0 are deemed to be ore-bearing units of preference. Model I identifies 467 preferred units as ore-bearing units of preference, of which 60 are known ore-bearing units, representing 12.85% of the total number of ore-bearing units of preference. This figure is 29.2 times higher than the proportion of units with minerals (ratio of known ore-bearing units to total projected units) (0.44%).
2.
Model II
We identified 467 preferred units in model I and removed them from the units. Then, 4943 ore-free units without minerals and 109 known ore-bearing units were randomly selected. Using a stepwise discriminant model in SPSS software, we constructed the “Quantitative Optimization Model for Regional Prospecting Targets for Au Mineralization in the Beishan Area of Gansu Province II”. The parameters of the model are shown in Table 2.
R 2 = SiO 2 × 0 . 216 Au × 0 . 119 + Zr × 0 . 012 + CaO × 0 . 064 + Sr × 0 . 002 + MgO × 0 . 153 + Mn × 0 . 001 Δ Td × 0 . 002 20 . 08
The results of model II’s optimization are as follows: The discriminant function (model II) presented in Table 2 is employed to calculate the discriminant value (R2) of each research unit within the “Au mineralization exploration information modeling database” (24,824 × 42), which encompasses the Beishan area. The discriminant threshold value is R0, which is −0.89. Units with an R2 value less than this are deemed to be ore-bearing units. Model II identifies 665 research units as preferred ore-bearing units, of which 78 are known ore-bearing units, representing 11.73% of the total number of preferred ore-bearing units. This figure is 26.66 times higher than the proportion of units with minerals (0.44%).
3.
Model III
Following the removal of the ore-bearing units of preference identified by models I and II, 4943 ore-free units and 109 known ore-bearing units were randomly selected and processed using the stepwise discriminant model in SPSS software. This formed the basis of the “Quantitative Optimization Model for Prospecting Target Areas for Au Mineralization Information in the Beishan Area of Gansu Province III”. The model parameters are presented in Table 2.
R 3 = Auh × 1 . 821 Y × 0 . 126 + Al 2 O 3 × 0 . 341 + Δ Tx × 0 . 002 + V × 0 . 026 + B × 0 . 022 + CaO × 0 . 105 Pb × 0 . 029 Sr × 0 . 002 + Cu × 0 . 042 + 0 . 18
The results of model III’s optimization are as follows: The discriminant function (model III) in Table 2 is used to calculate the discriminant value (R3) of each research unit in the “Au mineral exploration information specification unit modeling database (24,824 × 42)” in the Beishan area. R0 = −1. 41 is the critical value of the discriminant, and R3 < R0 determines that the research unit is a preferred ore-bearing unit, and model III identified 550 research units as preferred ore-bearing units, of which 21 are known ore-bearing units, accounting for 3.81% of the total number of preferred ore-bearing units, which is 8.68% higher than the proportion of units with minerals (0.44%).

4.2. Discussion of the Model’s Validity

1.
The effectiveness of optimal model I:
Mathematical validity analysis:
The F-test is represented by the following equation [62,63,64]:
Fp = N A + N B P 1 ( N A + N B 2 ) P × N A × N B N A + N B D 2
where FP is the F-distribution value calculated by the discriminant function (model); F0.01 is the theoretical value of the F-distribution table (obtained by checking the F-test table) at the significance level of 0.01 (1% error); A and B are the two discriminant classification populations (A—discriminant ore-bearing unit population; B—discriminant non-ore-bearing unit population); NA and NB are the sample sizes of the two populations, respectively; D2 = R ¯ A − R ¯ B (Marth distance); and P is the first degree of freedom (number of variables). When FP > F0.01, the two total samples are significantly different, and the constructed discriminant function (model) is effective in discriminating between unknown samples. In Table 2, FP = 16.26, which is much larger than F0.01 = 3, indicating that the constructed discriminant model is highly effective. Preferred model I in Table 2 has a positive prediction rate of 82.2% for ore-bearing units and 98.3% for non-ore-bearing units. This model identifies 82.2% of the known ore-bearing units as preferred ore-bearing units. Therefore, the authors believe that this model can be used to reliably identify the mineralization of all research units [65,66,67].
Analysis of the effectiveness of the target area optimization results: Optimal model I identified 467 exploration units as preferred ore-bearing units, of which 60 were known ore-bearing units, with a mineralized unit ratio of up to 12.85%, which is 29.2 times higher than the proportion of units with minerals (0.44%). Utilizing preferred model I to optimize each exploration unit can result in 55.05% of known ore-bearing units being distributed within 1.88% of the exploration units, significantly reducing the size of the preferred target area for regional prospecting.
The researcher ranks each preferred mineral unit in ascending order of R1 value and divides it into three levels using the “golden section” method [68]. We provide a summary of the preferred statistical parameters at all levels, as presented in Table 3. A total of 89 preferred ore-bearing units have been identified in level I, of which 24 are known ore-bearing units, representing 26.97% of all units. This figure is 61.29 times higher than the proportion of units with minerals (0.44%). A total of 144 level-II preferred ore-bearing units have been identified, of which 28 are known ore-bearing units. This represents 19.44% of the total, which is 44.18 times higher than the proportion of units with minerals (0.44%). A total of 233 preferred ore-bearing units have been identified in level III, of which 8 known ore-bearing units have been confirmed. This represents a known ore-bearing unit proportion of 3.43%, which is 7.8 times higher than the proportion of units with minerals (0.44%) (Table 3). Consequently, the model constructed in this study is highly effective in quantitatively optimizing the prospecting target area for the Au deposit in the Beishan region of Gansu Province.
2.
The effectiveness of optimal model II
Mathematical validity analysis: The results of the “F-test” for preferred model II are shown in Table 2. FP = 6.45, which is much greater than F0.01 = 3, indicating that the constructed discriminant model is highly effective. Table 2 shows that optimal model II has a positive prediction rate of 100% for the ore-bearing units and 88.1% for the non-ore-bearing units. This model identifies 100% of the known ore-bearing units as preferred ore-bearing units, and it is considered that the model has a high reliability for identifying the ore-bearing characteristics of all the exploration units.
Analysis of the validity of the preferred results: Preferred model II identified 665 exploration units as preferred ore-bearing units, of which 78 were known to contain minerals, with a proportion of ore-bearing units as high as 11.73%, which is 26.66 times higher than the proportion of units with minerals (0.44%). Using preferred model II to optimize each exploration unit, 71.6% of the known ore-bearing units can be distributed into 2.68% of the exploration units, significantly reducing the size of the preferred target area for regional prospecting.
The preferred ore-bearing units are sorted in ascending order of R2 value from small to large and divided into three levels using the “golden section” method. The statistical parameters of the preferred units at each level are summarized (Table 4).
There are 127 level-I preferred ore-bearing units, of which 20 are known ore-bearing units, accounting for 15.74% of the total. This is 35.79 times higher than the proportion of units with minerals (0.44%) and means that 15.74% of the known ore-bearing units are spread over only 0.51% of the exploration units. There are 205 preferred ore-bearing units in level II, of which 35 are known ore-bearing units, accounting for 17.07% of the total. This is 38.71 times higher than the proportion of units with minerals (0.44%). There are 332 preferred ore-bearing units in level III, of which 23 are known ore-bearing units, and the Ratio of known ore-bearing units to preferred units is 6.92%, which is 15.72 times higher than Proportion of units with minerals (0.44%) (Table 4). Therefore, the model constructed in level II is highly effective in quantitatively selecting target areas for prospecting Au deposits in the Beishan area of Gansu Province.
3.
The effectiveness of optimal model III
Mathematical validity analysis: The results of the F-test for optimal model III are shown in Table 2. FP = 0.47, which is much smaller than F0.01 = 3, The constructed discriminant model is mathematically ineffective (optimal model I for F-test calculation and parameters). In Table 2, preferred model III has a positive prediction rate of 85.7% for the ore-bearing units and a positive prediction rate of 94.6% for the non-ore-bearing units. This model identifies 85.7% of the known ore-bearing units as preferred ore-bearing units, and it is considered that the model has a high reliability in regard to identifying the mineralization of each exploration unit. However, due to its poor F-test result, its preferred results should be used with caution.
Analysis of the validity of the preferred results: Optimal model III identified 550 research units as preferred ore-bearing units, including 21 known ore-bearing units, with a ratio of known ore-bearing units of 3.81%, which is 8.68 times higher than the proportion of units with minerals (0.44%). Using preferred model III to optimize each research unit can result in 19.3% of the known ore-bearing units being distributed in 2.2% of the research units, which to some extent narrows the scope of the preferred target area for regional prospecting.
The preferred ore-bearing units are arranged in ascending order of R3 value, from smallest to largest, and divided into three categories using the “golden section” method. The summary of the preferred statistical parameters at each level is presented in Table 5.
There are 105 preferred ore-bearing units at level I, of which 6 are known ore-bearing units, representing 5.71% of the total. This is 12.98 times higher than the proportion of units with minerals (0.44%), with 5.71% of known ore-bearing units spread over only 0.42% of the exploration units. There are 170 preferred ore-bearing units in level II, of which 4 are known ore-bearing units, and the proportion of known ore-bearing units is 2.35%, which is 5.34 times higher than the proportion of units with minerals (0.44%). There are 275 preferred ore-bearing units in level III, of which 11 are known ore-bearing units, and the proportion of known ore-bearing units is 4%, which is 9.09 times higher than the proportion of units with minerals (0.44%) (Table 5). Therefore, the constructed model III has a certain effect on the quantitative optimization of the prospecting target area for Au deposits in the Beishan area of Gansu Province.
4.
Discussion of a series of models for the optimization of prospecting target areas in the Au mining area
In models I and II, Fp > F0.01, which means that models I and II are highly effective in a statistical sense. Although Fp < F0.01 in model III, each of the three models has a very high positive prediction rate for both sample types. Furthermore, the proportion of ore-bearing units in each model and classification is greater than the proportion of units with minerals (0.44%). Therefore, all three models are considered to have a very good optimization effect. The results of the validity test, the optimization outcomes, and the analysis of the ore-bearing rate in each classification of each model indicate that model I displays the most optimal results, model II is the second most optimal, and model III exhibits relatively poor optimization effects. The application of the optimization results of each model should be treated differently.
Optimal models I, II, and III are all based on the theoretical foundation of mathematical statistics. The determination of each model is based on the correlation between different variables and the existing Au deposits (points) in the area. This approach eliminates the influence of subjective human factors and the uncertainties and differences inherent in geological and metallogenic theories. Of the 109 known ore-bearing units in the entire region, 102 known ore-bearing units (representing 93.6% of the total) are distributed across the three preferred models. It is postulated that 93.6% of the ore-bearing units in the entire region can be clearly delineated into three categories within the 42-dimensional space (comprising 39 geochemical elements, 2 aeromagnetic variables, and 1 fitted value of the Au element).
Preferred model I: A total of 60 known ore-bearing units are highly separated from other non-ore-bearing units in 10 dimensional spaces, such as SiO2, ΔTx, ΔTd, Al2O3, and Au. Typical mineral deposits include the Xiaoxi Gong medium-sized gold deposit in Subei County and the Laojin Chang medium-sized gold deposit in Guazhou County (Table 2). Further study is required to determine whether this type of Au deposit has a different genesis than other Au deposits in the study area. However, it is evident that there are notable differences in regional prospecting research based on regional geophysical and geochemical information, which serves as a valuable reference for more in-depth research on the genesis of regional Au deposits and regional prospecting.
Moreover, the individual contributions of parameter variables such as SiO2, Al2O3, Na2O, ΔTx, and ΔTd in preferred model I are markedly greater than the contribution of the Au element. This may indicate that Au deposits (points) in the study area are predominantly formed in the fractured granite belt, and that a majority of Au element anomalies do not result in the output of Au deposits (points). The coefficient of the Au variable in preferred model I is negative, and its individual contribution to the model is 1.84%. A preliminary investigation indicates that there is no evident correlation between the elevated geochemical anomaly of the Au element and the delineation of an Au ore target area. However, this observation merely reflects the fact that 69% of Au deposits (points) are situated in low-anomaly regions, and 9.6% of Au deposits (points) are even distributed in negative anomaly areas. Therefore, this paper argues that the anomalous Au element and associated combined anomalies alone cannot be used to optimally study regional Au metallogenesis. This conclusion requires attention and further in-depth research in future metallogenic optimization studies.
Preferred model II: A total of 78 known ore-bearing units are distributed within this category of preferred ore-bearing units. Typical mineral deposits include the Xiaocaohu small gold deposit in Anxi County (carlin-type) and the Xinjinchang small gold deposit in Xihu Township (structural altered rock-type), Anxi County (Table 2). The individual contribution of Au to the model in this model is as high as 18.6%, and its coefficient is negative. Combined with its R0 = −0.89 (which is negative), it is believed that the ore-bearing units identified by this model are more likely to be associated with higher Au element anomalies.
Preferred model III: Only six known ore-bearing units are distributed among the preferred level-I ore-bearing units. Typical mineral deposits include the Jinchanggou gold deposit in Subei County and the Jingoujing gold deposit in Anxi County (Table 2). The Auh variable in this model alone contributes 15.3% to the model, and its coefficient is negative. Combined with its R0 = −1.41 (negative), it is believed that the adjustment and restoration of the Au element of the regional geochemical information have solved the problem of some Au deposits (points) not having corresponding Au element anomalies. At the same time, it confirms the irreplaceable and important role of the Auh parameter in the quantitative optimization of prospecting target areas, providing new ideas and methods for future research in the processing of geochemical information and optimization of metallogenesis.
5.
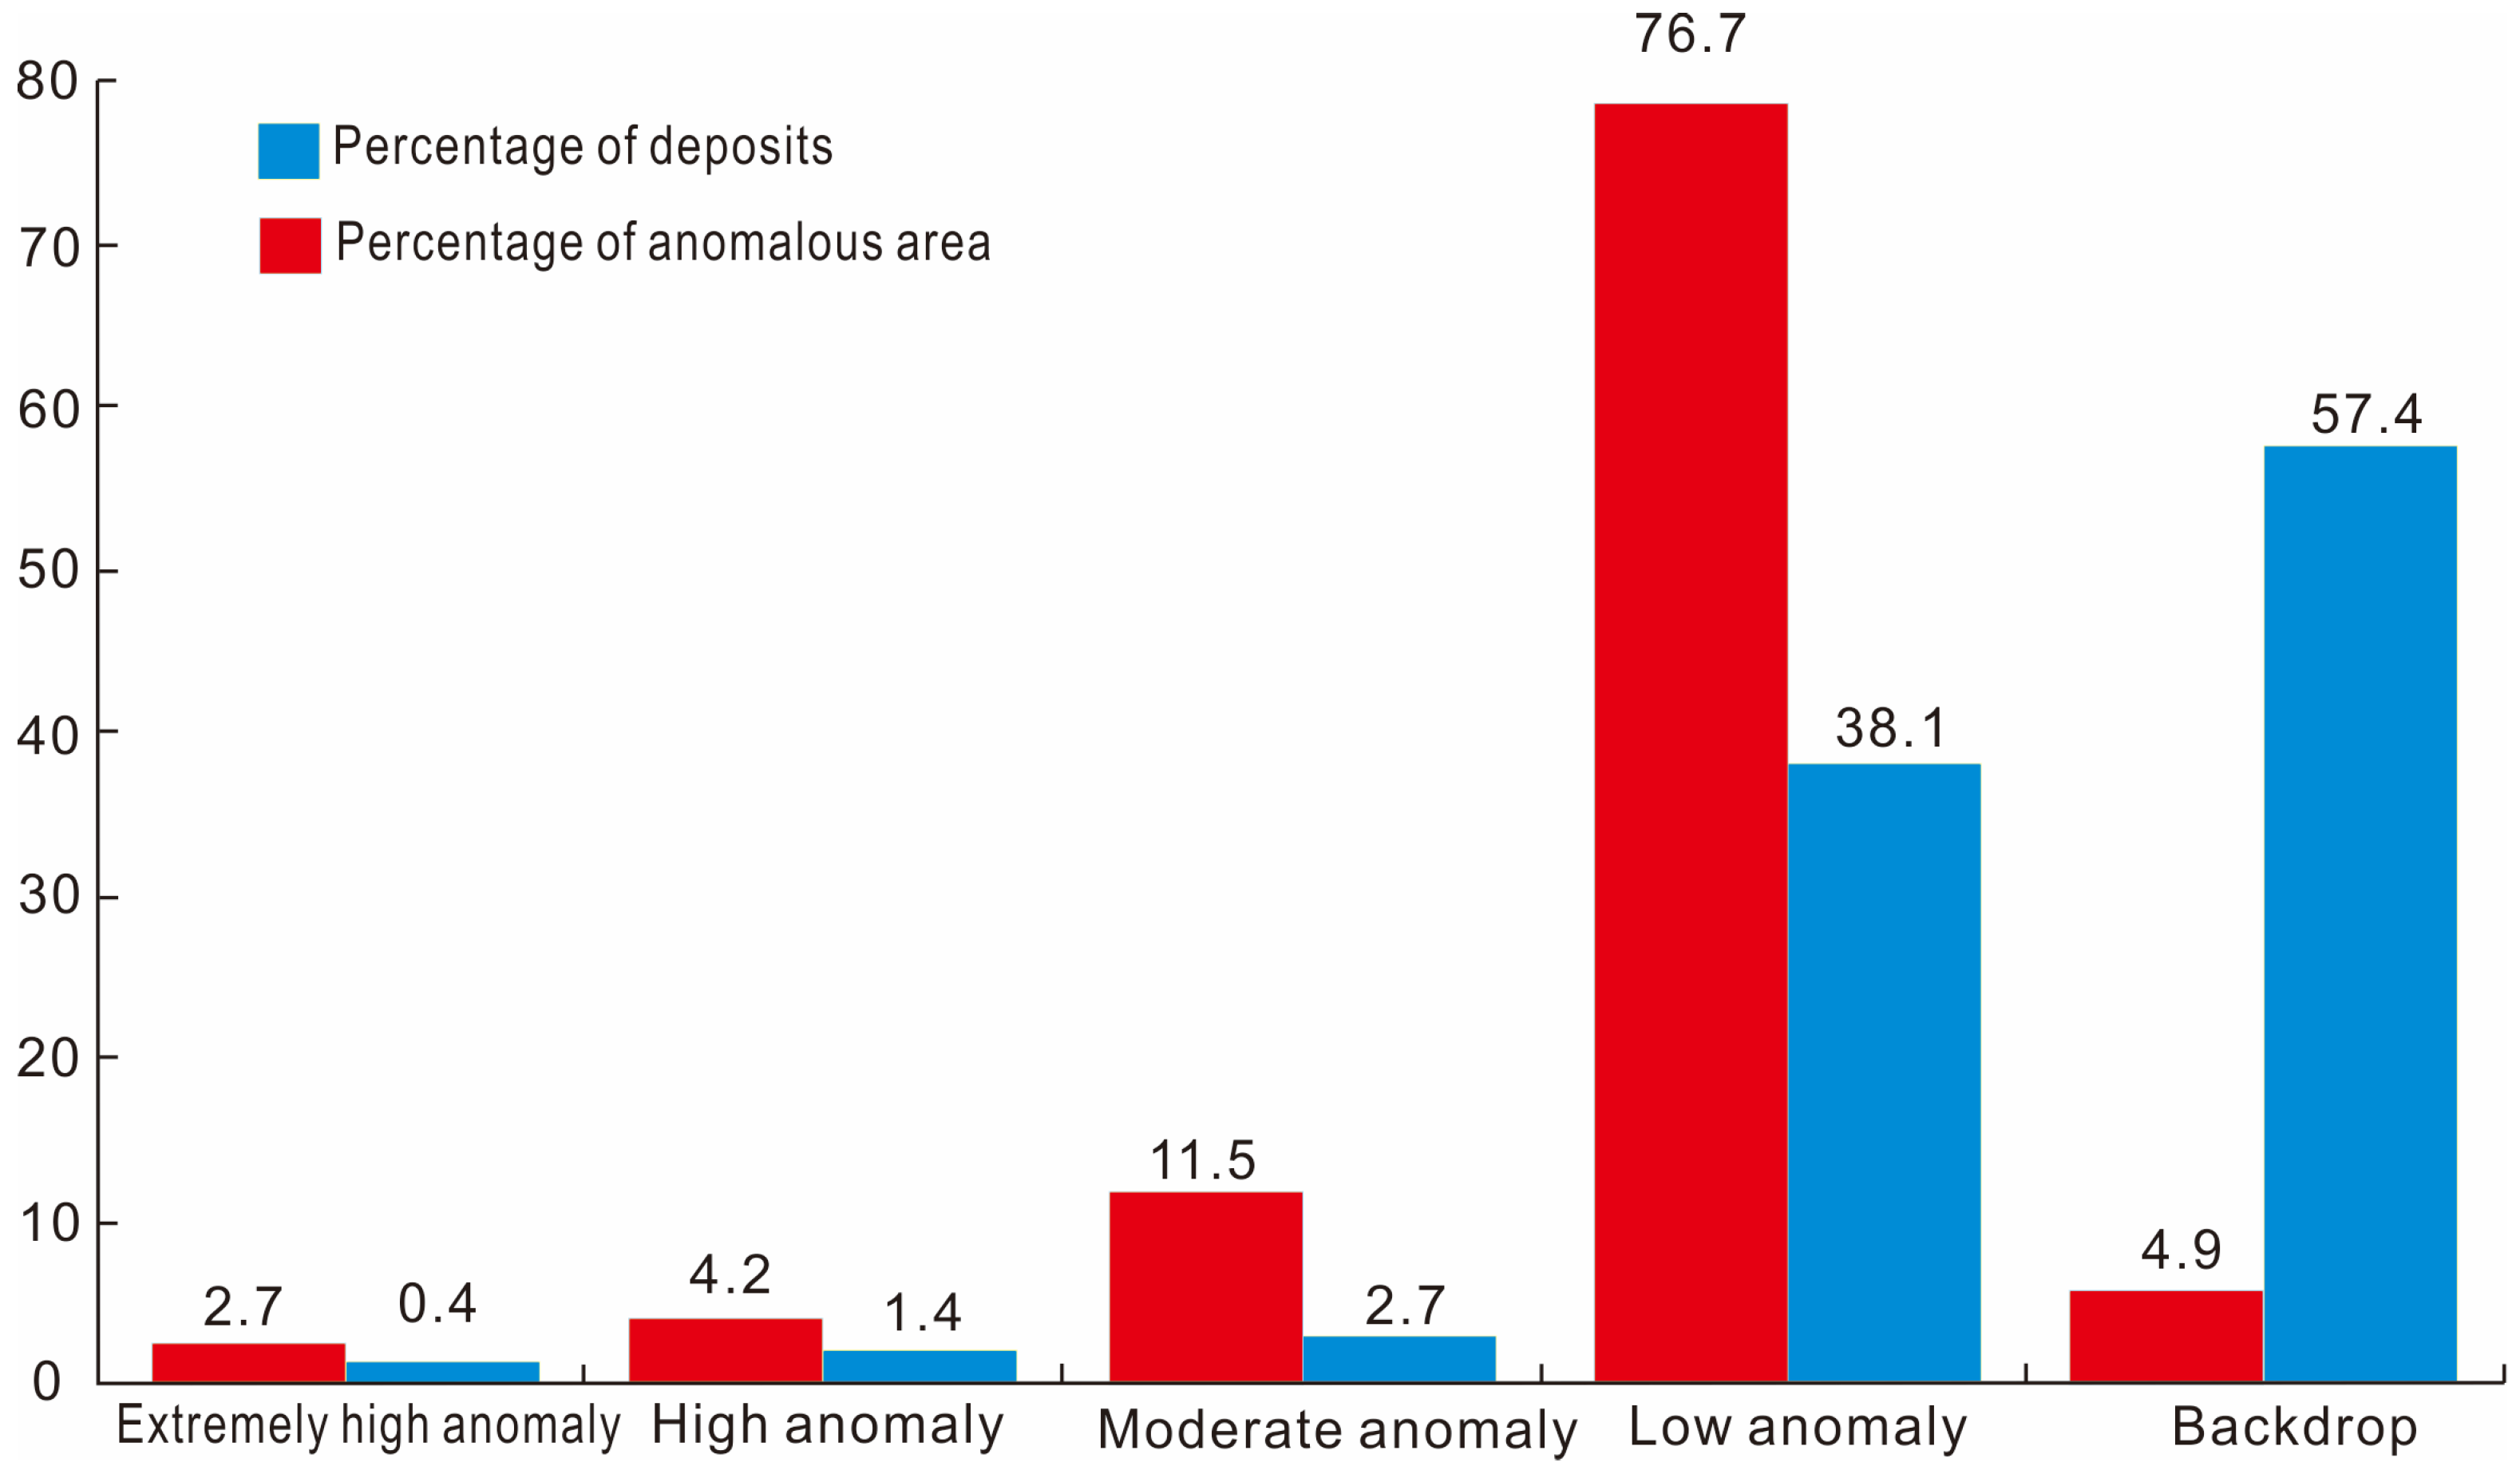
Discussion on the contribution of aeromagnetic data in the models
In preferred mode I, the variable coefficient of ΔTx is positive, while the variable coefficient of ΔTd is negative. The individual contributions of the two exceed 10%, and their cumulative height is 39.1%. This highlights the crucial importance of regional aeromagnetic data in identifying promising regions for gold mineral exploration, and the significant discrepancy is beneficial for prospecting. It can be inferred from the aeromagnetic geophysical characteristics that the output of Au deposits (points) in the region is closely related to the aeromagnetic gradient zone. This conclusion is consistent with the established fact that regional Au deposits are predominantly located in fault zones and contact zones between different geological bodies. In model II, although the contribution of the ΔTd variable is not as significant as Au, it also exceeds 5% and holds a certain weight in the model; in model III, the contribution of the ΔTx variable is much higher than that of Au, also exceeding 5%, and it holds a certain weight in the model.
In model I, the individual contribution of the ΔTx and ΔTd aeromagnetic data variables to the optimal model is significantly greater than that of the Au element. This outcome provides definitive evidence that when aeromagnetic data are transformed into a format suitable for use with geochemical data to construct an optimal model for regional Au prospecting target areas, aeromagnetic data exhibit excellent discriminant ability. This result not only calls into question the traditional geological research conclusion that aeromagnetic results are ineffective in determining Au mineral prospecting targets, but also corroborates the assertion that geophysical information is not influenced by sampling representativeness and is a more reliable and accurate measurement than geochemical information. In conclusion, this evidence demonstrates the potential for significant insights to be gained from extensive datasets. From this, it becomes clearer that there is infinite potential in massive data information, which can only be fully explored by changing the way we think, based on the concept of big data and the method of quantitative research.

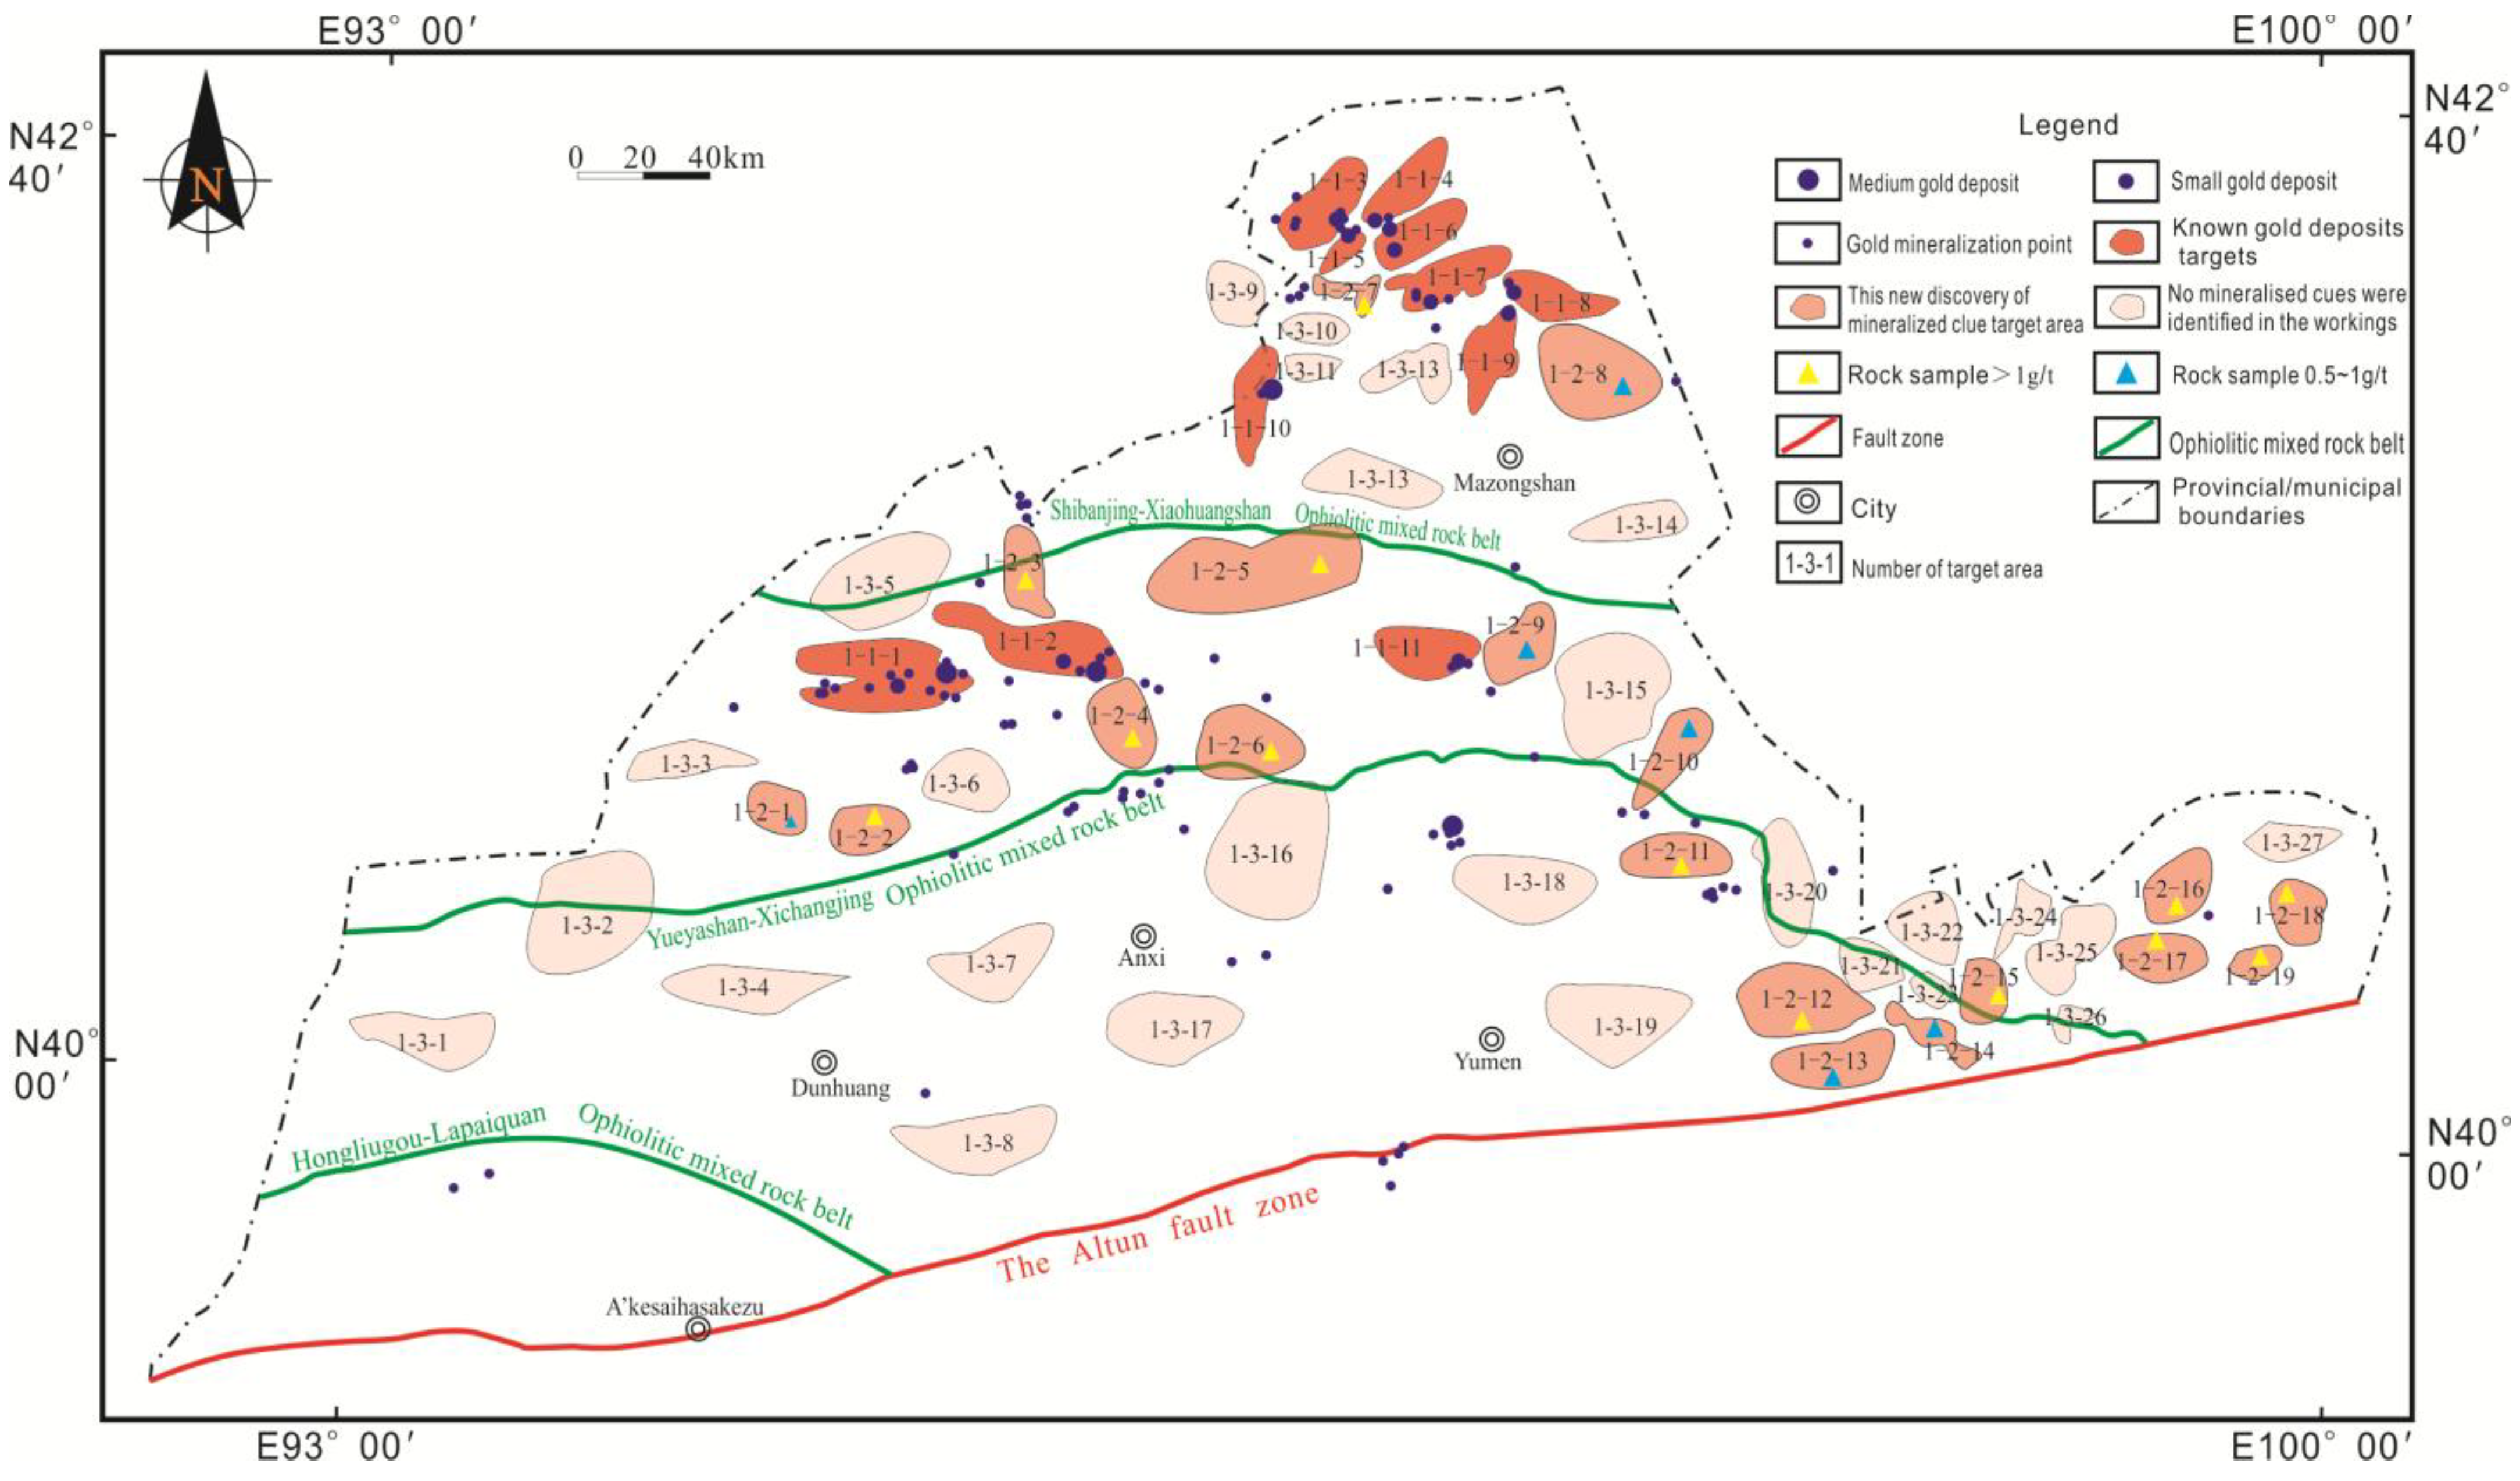
4.3. Results of Quantitative Target Selection Based on Geophysical and Geochemical Prospecting Information for Au Mining Region

Preferred models (discriminant functions) I, II, and III, as presented in Table 2, were utilized to process the “Au mineralization prospecting information specification unit modeling database (24,824 × 42)” within the designated study area. Subsequently, the discriminant values (R1, R2, and R3) for each model were calculated for each research unit. Identify the inverse value of each discriminant value, calculate the sum of the discriminant values for each ore-bearing unit, and determine the RZ value (RZ represents the comprehensive discriminant value derived from a series of preferred models for each ore-bearing unit, and its magnitude directly reflects the reliability of prospecting for ore-bearing units). The delineation of the preferred ore-bearing regions is retained, while the low and isolated areas are excluded. The largest comprehensive discriminant value in each concentration area and its location are selected to represent the area. The maximum RZ values in each concentration area are sorted in descending order, and the top 300 preferred ore-bearing unit concentration areas are selected as the preferred ore target areas for the Au ore area in the Beishan area based on the geophysical and geochemical information.
The 300 prospecting target areas are classified into three categories according to the “golden section rule”. The first category, level I, comprises 57 areas, including 11 known ore-bearing target areas, with a mineralization rate of 19.29% in level-I target areas. The 93 level-II Au prospecting target areas, including the 11 mineralized target areas, exhibit a mineralization rate of 11.87% in target areas. A total of 150 level-III Au prospecting target areas were identified, of which 5 mineralized target areas were confirmed to contain ore, yielding a target area ore-finding rate of 3.33%. The ore-finding rate of each level of the target area is considerably higher than the average ore-finding rate of the anomaly unit. It is therefore postulated that the quantitative optimal model for prospecting Au in the anomaly unit is highly accurate for determining and optimizing the Au prospecting target areas in this region (Table 6).
The proportion of the area of each level of preferred target area is calculated. The aggregate area of the 57 level-I prospecting target areas is 838.75 km2, with the smallest area measuring 4.05 km2 and the largest area measuring 29.37 km2. The cumulative area of the 93 level-II prospecting target areas is 1022.27 km2, with the smallest area measuring 0.5 km2 and the largest area measuring 33.77 km2. The cumulative area of the preferred I- and II-level target areas is 1861.02 km2, representing a mere 3.67% of the total area of the study region (49,430 km2).
A total of 150 I- and II-level target areas have been identified for prospecting Au mineralization regions, with the selection process based on quantitative optimization using geophysical and geochemical prospecting information. Of these, 22 target areas are known ore-bearing target areas, representing a ratio of 33.3 times higher than proportion of target areas with minerals. The quantitatively optimized I- and II-level target areas are distributed across a mere 3.67% of the total area of the study area. It is believed that the quantitative target selection model for Au mine searching based on geophysical and geochemical exploration information is highly accurate for determining and selecting the target area for Au mine searching in the Beishan area of Gansu Province. In comparison with the traditional selection method, it is hypothesized that the precision of the target area is significantly enhanced and the area of the target area is considerably reduced.

4.4. Field Inspection to Verify the Situation

The Gansu Provincial Bureau of Geology and Mineral Resources Development and its subordinate units conducted field inspections of 46 blank target areas (target areas where no mineral deposits had been found) in the level-I target area. There were 19 target areas with Au grades greater than 0.5 g/t in the pick-up block samples in Table 7 (including 13 target areas with Au grades greater than 1 g/t). The mineralization grade of the blank target areas was 41.3%. Combining the 11 known ore-bearing target areas, the actual ore-discovering rate in the level-I target area can reach 52.6%. The authors believe that the method of quantitatively selecting Au ore target areas based on geophysical and geochemical information has significant results in the Beishan area of Gansu Province (Figure 4).

5. Conclusions

The utilization of big data, artificial intelligence, and other methodologies and technologies enables a digitally driven approach to the exploitation of geological data. This approach involves studying the correlation of geophysical and geochemical exploration information (data) to achieve a quantitative prediction of mineral prospecting targets and increase the probability of discovering mineral deposits. Compared to the conventional “theory-driven” and “causality analysis” qualitative prediction research methods, the constraints imposed by pertinent geological experience (theory) and the impact of subjective variables are effectively negated.
The self-developed software for determining the prediction lower limit of geochemical exploration data and processing data leveling by amplitude and area effectively eliminates the original data’s systematic errors, realizes the leveling of different-scale geochemical exploration data, and addresses the long-standing challenges of data processing and the “loss of low and slow anomalies”. This lays a solid foundation for enhancing the effectiveness of mineral prediction and discovery.
The essential information of the classification of mineral deposits was restored, the potential value of the geochemical exploration data was effectively exploited, and the correlation between the mineralization elements and the predicted mineral species was significantly improved. The predicted target area was reduced to 3.67% of the total study area. Within this, the actual observation rate of minerals in the level-I predicted target area is as high as 52.6%, thereby markedly enhancing the accuracy of the predictions for the target area.
The innovative application of aeromagnetic data in predicting the mineralization of non-magnetic mineral species, such as Au, has altered the conclusion that aeromagnetic results are ineffective for identifying target areas for gold mining, as previously suggested in traditional geological research.

Author Contributions

L.Z., conceptualization, methodology, software, and writing—original draft preparation; R.H., writing—review and editing, funding acquisition; Y.Z., resources, supervision, and writing—review; H.F., visualization; J.L., methodology and conceptualization; Y.L., investigation and data curation. All authors have read and agreed to the published version of the manuscript.

Funding

This research was financially supported by the Science and Technology Plan of Gansu Province “Key Research and Development Program of Gansu Province” (No. 21YF5NA040); the National Natural Science Foundation Project of China (No. 41572060, No. 42172086, and No. U1133602).

Institutional Review Board Statement

Not applicable.

Informed Consent Statement

Not applicable.

Data Availability Statement

All data used in this study are available in the article and the published literature.

Acknowledgments

We thank the Comprehensive Research Office of the Gansu Provincial Bureau of Geology and Mineral Resources for providing data on field verification of the target area.

Conflicts of Interest

The authors declare no conflict of interest.

References

  1. Luo, J.M.; Wang, X.W.; Song, B.T.; Yang, Z.M.; Zhang, Q.; Zhao, Y.Q. Discussion on the method for quantitative classification of magmatic rocks: Taking it’s application in West Qinling of Gansu Province for example. Acta Petrol. Sin. 2018, 34, 326–332. [Google Scholar]
  2. Wang, C.; Ma, X.; Chen, J.; Chen, J. Information extraction and knowledge graph construction from geoscience literature. Comput. Geosci. 2018, 112, 112–120. [Google Scholar] [CrossRef]
  3. Enkhsaikhan, M.; Holden, E.J.; Duuring, P.; Liu, W. Understanding ore-forming conditions using machine reading of text. Ore Geol. Rev. 2021, 135, 104200. [Google Scholar] [CrossRef]
  4. Austin, J.R.; Blenkinsop, T.G. Local to regional scale structural controls on mineralization and the importance of a major lineament in the eastern Mount Isa Inlier. Australia: Review and analysis with autocorrelation and weights of evidence. Ore Geol. Rev. 2009, 35, 298–316. [Google Scholar] [CrossRef]
  5. Liu, C.; Ji, X.; Dong, Y.; He, M.; Yang, M.; Wang, Y. Chinese mineral question and answering system based on knowledge graph. Expert Syst. Appl. 2023, 231, 120841. [Google Scholar] [CrossRef]
  6. Zhuang, C.; Liu, C.; Zhu, H.; Ma, Y.; Shi, G.; Liu, Z.; Liu, B. Constraint information extraction for 3D geological modelling using a span-based joint entity and relation extraction model. Earth Sci. Inf. 2024, 17, 985–998. [Google Scholar] [CrossRef]
  7. Sobhana, N.V.; Mitra, P.; Ghosh, S.K. Conditional random field based named entity recognition in geological text. Int. J. Comput. Appl. 2010, 1, 143–147. [Google Scholar] [CrossRef]
  8. Qiu, Q.; Tian, M.; Huang, Z.; Xie, Z.; Ma, K.; Tao, L.; Xu, D. Chinese engineering geological named entity recognition by fusing multi-features and data enhancement using deep learning. Expert Syst. Appl. 2024, 238, 121925. [Google Scholar] [CrossRef]
  9. Zhou, Y.Z.; Chen, S.; Zhang, Q.; Xiao, F.; Wang, S.G.; Liu, Y.P.; Jiao, S.T. Advances and prospects of big data and mathematical geoscience. Acta Petrol. Sin. 2018, 34, 255–263. [Google Scholar]
  10. Zhou, Y.Z.; Xiao, F. Overview: A glimpse of the latest advances in artificial intelligence and big data geoscience research. Earth Sci. Front. 2024, 31, 1–6. [Google Scholar]
  11. Abbaszadeh, M.; Hezarkhani, A.; Soltani-Mohammadi, S. An SVM-based machine learning method for the separation of alteration zones in Sungun porphyry copper deposit. Geochemistry 2013, 73, 545–554. [Google Scholar] [CrossRef]
  12. Zuo, R.G. Identifying geochemical anomalies associated with Cu and Pb-Zn skarn mineralization using principal component analysis and spectrum-area fractal modeling in the Gangdese Belt, Tibet (China). J. Geochem. Explor. 2011, 111, 13–22. [Google Scholar] [CrossRef]
  13. Filzmoser, P.; Hron, K.; Reimann, C. Robust factor analysis for compositional data. Comput. Geosci. 2009, 35, 1854–1861. [Google Scholar] [CrossRef]
  14. Maepa, F.; Smith, R.S.; Tessema, A. Support vector machine and artificial neural network modelling of orogenic gold prospectivity mapping in the Swayze greenstone belt, Ontario, Canada. Ore Geol. Rev. 2021, 130, 103968. [Google Scholar] [CrossRef]
  15. Chen, Z.; Wu, Q.; Han, S.; Zhang, J.; Yang, P.; Liu, X.; Lang, M. The metallogenic tectonic implication of the volcanic rocks of the Dahalajunshan Formation in the Early Carboniferous in the West Tianshan based on big data analytics. Arab. J. Geosci. 2022, 15, 1658. [Google Scholar] [CrossRef]
  16. Zhang, S.; Xiao, K.Y.; Carranza, E.J.M.; Yang, F. Maximum entropy and random forest modeling of mineral potential: Analysis of gold prospectivity in the Hezuo—Meiwu district west Qinling Orogen, China. Nat. Resour. Res. 2019, 28, 645–664. [Google Scholar] [CrossRef]
  17. Shabani, A.; Ziaii, M.; Monfared, M.S.; Shirazy, A.; Shirazi, A. Multi-Dimensional Data Fusion for Mineral Prospectivity Mapping (MPM) Using Fuzzy-AHP Decision-Making Method, Kodegan-Basiran Region. East Iran. Minerals 2022, 12, 1629. [Google Scholar] [CrossRef]
  18. Nti, I.K.; Quarcoo, J.A.; Aning, J.; Fosu, G.K. A mini-review of machine learning in big data analytics: Applications, challenges, and prospects. Big Data Min. Anal. 2022, 5, 81–97. [Google Scholar] [CrossRef]
  19. Zhang, S.; Carranza, E.J.M.; Xiao, K.Y.; Wei, H.T.; Yang, F. Mineral prospectivity mapping based on isolation forest and random forest: Implication for the existence of spatial signature of mineralization in Outliers. Nat. Resour. Res. 2023, 31, 1981–1999. [Google Scholar] [CrossRef]
  20. Qiu, Q.; Ma, K.; Lv, H.; Tao, L.; Xie, Z. Construction and application of a knowledge graph for iron deposits using text mining analytics and a deep learning algorithm. Math. Geosci. 2021, 55, 423–456. [Google Scholar] [CrossRef]
  21. Jean, G.E.; Bancroft, M. An XPS and SEM study of gold deposition at low temperatures on sulphide mineral surfaces: Concentration of gold by adsorption /reduction. Geochim. Cosmochim. Acta 1985, 49, 979–987. [Google Scholar] [CrossRef]
  22. Sadeghi, B.; Khalajmasoumi, M.; Afzal, P.; Moarefvand, P.; Yasrebi, A.B.; Wetherelt, A.; Foster, P.; Ziazarifi, A. Using ETM+ and ASTER sensors to identify iron occurrences in the Esfordi 1:100,000 mapping sheet of Central Iran. J. Afr. Earth Sci. 2013, 85, 103–114. [Google Scholar] [CrossRef]
  23. Hu, H.; Wen, Y.; Chua, T.S.; Li, X. Toward scalable systems for big data analytics: A technology tutorial. IEEE Access 2014, 2, 652–687. [Google Scholar] [CrossRef]
  24. Rodriguer-galiano, V.F.; Chica, O.M.; Chica, R.M. Predictive modelling of gold potential with the integration of multisource information based on random forest: Acase study on the Rodalquilar area Southern Spain. Int. J. Geogr. Inf. Sci. 2014, 28, 1336–1354. [Google Scholar] [CrossRef]
  25. Carranza, E.J.M.; Laborte, A.G. Random forest predictive modeling of mineral prospectivity with small number of prospects and data with missing values in Abra (Philippines). Comput. Geosci. 2015, 74, 60–70. [Google Scholar] [CrossRef]
  26. Rodgiguez, G.; Sanchez, C.; Chica, O.M.; Chica, R.M. Machine learning predictive models for mineral prospectivity: An evaluation of neural networks random forest regression trees and supportvector machines. Ore Geol. Rev. 2015, 71, 804–818. [Google Scholar]
  27. Baumann, P.; Mazzetti, P.; Ungar, J.; Barbera, R.; Barboni, D.; Beccati, A.; Bigagli, L.; Boldrini, E.; Bruno, R.; Calanducci, A.; et al. Big data analytics for earth sciences: The Earth Server approach. Int. J. Digit. Earth 2016, 9, 3–29. [Google Scholar] [CrossRef]
  28. Li, T.F.; Xia, Q.L.; Zhao, M.Y.; Gui, Z.; Leng, S. Prospectivity mapping for tungsten polymetallic mineral resources Nanling Metallogenic Belt South China: Use of Random Forest Algorithm from a Perspective of Data Imbalance. Nat. Resour. Res. 2019, 29, 203–227. [Google Scholar] [CrossRef]
  29. Mohamed, A.; Najafabadi, M.K.; Wah, Y.B.; Zaman, E.A.K.; Maskat, R. The state of the art and taxonomy of big data analytics: View from new big data framework. Artif. Intell. Rev. 2020, 53, 989–1037. [Google Scholar] [CrossRef]
  30. Chen, G.X.; Huang, N.; Wu, G.P.; Luo, L.; Wang, D.T.; Cheng, Q.M. Mineral prospectivity mapping based on wavelet neural network and Monte Carlo simulations in the Nanling W-Sn metallogenic province. Ore Geol. Rev. 2022, 143, 104765. [Google Scholar] [CrossRef]
  31. Li, Y.S.; Peng, C.; Ran, X.J.; Xue, L.F.; Chai, S.L. Soil geochemical prospecting prediction method based on deep convolutional neural networks-Taking Daqiao Gold Deposit in Gansu Province, China as an example. China Geol. 2022, 5, 71–83. [Google Scholar]
  32. Ren, W.X.; Luo, J.M.; Sun, B.N.; Wang, H.T.; Wang, Y.X. Application of geochemical data in gold prospecting and target selecting: Taking the Yushishan area in Gansu Province as a case. Acta Petrol. Sin. 2018, 34, 3225–3234. [Google Scholar]
  33. Safari, S.; Ziaii, M.; Ghoorchi, M.; Sadeghi, M. Application of concentration gradient coefficients in mining geochemistry: A comparison of copper mineralization in Iran and Canada. J. Min. Environ. 2018, 9, 277–292. [Google Scholar]
  34. Zuo, R.; Xiong, Y. Big data analytics of identifying geochemical anomalies supported by machine learning methods. Nat. Resour. Res. 2018, 27, 5–13. [Google Scholar] [CrossRef]
  35. Ziaii, M.; Safari, S.; Timkin, T.; Voroshilov, V.; Yakich, T. Identification of geochemical anomalies of the porphyry-Cu deposits using concentration gradient modelling: Acase study Jebal-Barez area Iran. J. Geochem. Explor. 2019, 199, 16–30. [Google Scholar] [CrossRef]
  36. Huston, D.L.; Sie, S.H.; Suter, G.F.; Cooke, D.R. Both RATrace elements in sulfide minerals from Eastern Australian volcanic-hosted massive sulfide deposits: Part, I. Proton Microprobe analyses of pyrite, chalcopyrite, and sphalerite, and Part II. Selenium Levels in Pyrite: Comparison with δ34S values and implications for the source of sulfur in volcanogenic hydrothermal systems. Econ. Geol. 1995, 90, 1167–1196. [Google Scholar]
  37. Han, B.F.; Guo, Z.J.; Zhang, Z.C.; Zhang, L.; Chen, J.F.; Song, B. Age, geochemistry, and tectonic implications of a late Paleozoic stitching pluton in the North Tian Shan suture zone, Western China. Geol. Soc. Am. Bull. 2010, 122, 627–640. [Google Scholar] [CrossRef]
  38. Kwok, S.W.; Carter, C. Multiple decision trees. In Machine Intelligence and Pattern Recognition; Elsevier: Amsterdam, The Netherlands, 1990; Volume 9, pp. 327–335. [Google Scholar]
  39. Kempe, U.; Seltmann, R.; Graupner, T.; Rodionov, N.; Sergeev, S.A.; Matukov, D.; Kremenetsky, A.A. Concordant U-Pb SHRIMP ages of U-rich zircon in granitoids from the Muruntau gold district (Uzbekistan): Timing of intrusion, alteration ages, or meaningless numbers. Ore Geol. Rev. 2015, 65, 308–326. [Google Scholar] [CrossRef]
  40. Feng, W.Y.; Zheng, J.H.; Shen, P. Petrology, mineralogy, and geochemistry of the Carboniferous Katbasu Au-Cu deposit, western Tianshan, Northwest China: Implications for petrogenesis, ore genesis, and tectonic setting. Ore Geol. Rev. 2023, 161, 105659. [Google Scholar] [CrossRef]
  41. Teng, C.; Dong, M.; Yang, X.; Xiao, D.; Shao, J.; Cao, J.; Su, Y.; Lu, W. Zircon U-Pb Geochronology and Geochemical Constraints of Tiancang Granites, Southern Beishan Orogenic Belt: Implications for Early Permian Magmatism and Tectonic Evolution. Minerals 2025, 15, 426. [Google Scholar] [CrossRef]
  42. Li, R.; Su, S.; Sun, H.; Liu, R.; Xia, Y. Petrogenesis and Tectonic Significance of Early Permian Intermediate–Felsic Rocks in the Southern Beishan Orogen, Northwest China: Geochronological and Geochemical Constraints. Minerals 2024, 14, 114. [Google Scholar] [CrossRef]
  43. Chen, B.; Shen, Y.; Liu, T. Ore-controlling factors and metallogenic models of gold deposits in the Beishan orogenic belt, NW China. Minerals 2021, 11, 345. [Google Scholar]
  44. Zhang, F.; Li, G. Geological characteristics and prospecting indicators of quartz vein-type gold deposits in the Beishan area. J. Geochem. Explor. 2022, 235, 106952. [Google Scholar]
  45. Lu, X. Metallogenic regularity and prospecting indicators of porphyry copper deposits in the Beishan area: A case study of the Gongpoquan deposit. Appl. Sci. 2023, 13, 5890. [Google Scholar]
  46. Shen, Z.; Zeng, Q. Tectonic evolution and its constraints on gold-copper mineralization in the Beishan orogenic belt. Ore Geol. Rev. 2020, 124, 103678. [Google Scholar]
  47. He, Z.; Zhan, G. Geochemical characteristics and metallogenic potential of sedimentary rock-hosted gold deposits in the Beishan area. J. Asian Earth Sci. 2021, 215, 104803. [Google Scholar]
  48. Laurent-Charvet, S.; Charvet, J.; Shu, L.S.; Ma, R.S.; Lu, H.F. Palaeozoic late collisional strike-slip deformations in Tianshan and Altay, Eastern Xinjiang, NW China. Terra Nova 2002, 14, 249–256. [Google Scholar] [CrossRef]
  49. Keith, M.; Smith, D.J.; Jenkin, G.R.T.; Holwell, D.A.; Dye, M.D. A review of Te and Se systematics in hydrothermal pyrite from precious metal deposits: Insights into ore-forming processes. Ore Geol. Rev. 2018, 96, 269–282. [Google Scholar] [CrossRef]
  50. Large, R.R.; Mukherjee, I.; Gregory, D.D.; Steadman, J.A.; Maslennikov, V.V.; Meffre, S. Ocean and atmosphere geochemical proxies derived from trace elements in marine pyrite: Implications for ore genesis in sedimentary basins. Econ. Geol. 2017, 112, 423–450. [Google Scholar] [CrossRef]
  51. Mao, Q.G.; Xiao, W.J.; Wang, H.; Ao, S.J.; Windley, B.; Song, D.F.; Sang, M.; Tan, Z.; Li, R.; Wang, M. Prolonged Late Mesoproterozoic to Late Triassic Tectonic Evolution of the Major Paleo-Asian Ocean in the Beishan Orogen (NW China) in the Southern Altaids. Front. Earth Sci. 2022, 9, 825852. [Google Scholar] [CrossRef]
  52. Kempe, U.; Graupner, T.; Seltmann, R.; Boorder, H.D.; Dolgopolova, A.; Zeylmans Van Emmichoven, M. The Muruntau gold deposit (Uzbekistan)- A unique ancient hydrothermal system in the southern Tien Shan. Geosci. Front. 2016, 7, 495–528. [Google Scholar] [CrossRef]
  53. Dong, L.L.; Wan, B.; Yang, W.Z.; Deng, C.; Chen, Z.; Yang, L.; Cai, K.D.; Xiao, W.J. Rb-Sr geochronology of single gold-bearing pyrite grains from the Katbasu gold deposit in the South Tianshan, China and its geological significance. Ore Geol. Rev. 2018, 100, 99–110. [Google Scholar] [CrossRef]
  54. Groves, D.I.; Foster, R.P. Archaean lode gold deposits. In Gold Metallogeny and Exploration; Foster, R.P., Ed.; Springer: Boston, MA, USA, 1991; pp. 63–103. [Google Scholar]
  55. Xu, X.W.; Ma, T.L.; Sun, L.Q. Characteristics and dynamic origin of the large−scale Jiaoluotage ductile compressional zone in the eastern Tianshan Mountains, China. J. Struct. Geol. 2003, 25, 1901–1915. [Google Scholar] [CrossRef]
  56. Yousefi, M.; Kreuzer, O.P.; Nykänen, V.; Hronsky, J.M.A. Exploration information systems-a proposal for the future use of GIS in mineral exploration targeting. Ore Geol. Rev. 2019, 111, 103005. [Google Scholar] [CrossRef]
  57. Xi, Y.Z.; Li, Y.B.; Liu, J.J.; Wu, S.; Lu, N.; Liao, G.X.; Wang, Q.L. Application of Analytic Hierarchy Process in Mineral Prospecting Prediction Based on an Integrated Geology-Aerogeophysics-Geochemistry Model. Minerals 2023, 13, 978. [Google Scholar] [CrossRef]
  58. Agterberg, F. New applications of the model of de Wijs in regional geochemistry. Math. Geol. 2007, 39, 1. [Google Scholar] [CrossRef]
  59. Parsa, M.; Maghsoudi, A. Assessing the effects of mineral systems-derived exploration targeting criteria for random Forests-based predictive mapping of mineral prospectivity in Ahar-Arasbaran area, Iran. Ore Geol. Rev. 2021, 138, 104399. [Google Scholar] [CrossRef]
  60. Allard, D.; Comunian, A.; Renard, P. Probability aggregation methods in geoscience. Math. Geosci. 2012, 44, 545–581. [Google Scholar] [CrossRef]
  61. Chhabra, A.B.; Sreenivasan, K.R. Negative dimensions: Theory, computation, and experiment. Phys. Rev. A 1991, 43, 1114. [Google Scholar] [CrossRef]
  62. Chen, Y.; Lu, L.; Li, X. Application of continuous restricted Boltzmann machine to identify multivariate geochemical anomaly. J. Geochem. Explor. 2014, 140, 56–63. [Google Scholar] [CrossRef]
  63. Enkhsaikhan, M.; Liu, W.; Holden, E.J.; Duuring, P. Auto-labelling entities in low-resource text: A geological case study. Knowl. Inf. Syst. 2021, 63, 695–715. [Google Scholar] [CrossRef]
  64. Abedini, M.; Ziaii, M.; Negahdarzadeh, Y.; Ghiasi-Freez, J. Porosity classification from thin sections using image analysis and neural networks including shallow and deep learning in Jahrum formation. J. Min. Environ. 2018, 9, 513–525. [Google Scholar]
  65. Parsa, M.; Maghsoudi, A.; Yousefi, M. Spatial analyses of exploration evidence data to model skarn-type copper prospectivity in the Varzaghan district, NW Iran. Ore Geol. Rev. 2018, 92, 97–112. [Google Scholar] [CrossRef]
  66. Shirazi, A.; Hezarkhani, A.; Beiranvand, P.A.A. Fusion of Lineament Factor (LF) Map Analysis and Multifractal Technique for Massive Sulfide Copper Exploration: The Sahlabad Area, East Iran. Minerals 2022, 12, 549. [Google Scholar] [CrossRef]
  67. Chorley, R.J.; Haggett, P. Trend-surface mapping in geographical research. Trans. Inst. Br. Geogr. 1965, 37, 47–67. [Google Scholar] [CrossRef]
  68. Journel, A.; Zhang, T. The necessity of a multiple-point prior model. Math. Geol. 2006, 38, 591–610. [Google Scholar] [CrossRef]
Figure 1. Geological sketch map of the Beishan area in Gansu (distribution of gold deposits).
Applsci 15 05430 g001
Figure 2. Research flow diagram.
Applsci 15 05430 g002
Figure 3. Comparison of the percentage of gold deposits in the Beishan Area of Gansu Province and the percentage of area with different levels of abnormality.
Applsci 15 05430 g003
Figure 4. Schematic representation of the results of the inspection of the prospecting target area for level-I Au deposits based on geophysical and geochemical information in the Beishan area of Gansu Province.
Applsci 15 05430 g004
Table 1. Stepwise regression fitting model of elemental Au for 1:200,000 water system sediment measurements.
VariantConstantBiPbCuZnSbSiO2YK2OBLaTh
Factor2.790.760.020.02−0.010.070.010.02−0.100.004−0.010.02
VariantBeNa2OLiMgOCaOAuNbUFe2O3Al2O3Mo
Factor−0.05−0.02−0.004−0.010.010.002−0.004−0.01−0.010.005−0.01
Table 2. Quantitative optimization series model of Au mine regional mineral search target area based on physical and chemical exploration information.
Model No.Variables and ParametersValidity CheckTypical Deposits
Model IVariableconstantSiO2ΔTxΔTdAl2O3Na2OR0 = −1.98
Fp = 16.26
Mineral positive conviction rate, 82.2%
Mineral-free positive conviction rate, 98.3%
Ore-bearing units: 60
The Xiaoxi Gong medium-sized gold deposit in Subei County and the Laojin Chang medium-sized gold deposit in Guazhou County
Parameter−19.440.2080.004−0.0030.2670.251
Contribution 32.64522.78416.2837.9044.466
Variable TiBaPbVAu
Parameter 0.0010.001−0.034−0.014−0.043
Contribution 2.6522.5942.4731.8691.838
Model IIVariableconstantSiO2AuZrCaOSrR0 = −0.89
Fp = 6.45
Mineral positive conviction rate, 100%
Mineral-free positive conviction rate, 88.1%
Ore-bearing units: 78
The Xiaocaohu small gold deposit in Anxi County and the Xinjinchang small gold deposit in Xihu Township, Anxi County
Parameter−20.080.216−0.1190.0120.0640.002
Contribution 25.09218.62816.9817.4656.778
Variable MgOMnΔTd
Parameter 0.1530.001−0.002
Contribution 6.6855.6965.302
Model IIIVariableconstantAuhYAl2O3ΔTxVR0 = −1.41
Fp = 0.47
Mineral positive conviction rate, 85.7%
Mineral-free positive conviction rate, 94.6%
Ore-bearing units: 21
Jinchanggou gold deposit in Subei County and the Jingoujing gold deposit in Anxi County
Parameter0.18−1.821−0.1260.3410.0020.026
Contribution 15.26013.26910.6116.1225.327
Variable BCaOPbSrCu
Parameter 0.0220.105−0.029−0.0020.042
Contribution 4.3894.3384.1053.1723.013
Description: F0.01 = 3, there are a total of 102 ore-bearing units in the serial model (93.6% of the total number of occupied ore-bearing units).
Table 3. Statistics of quantitative optimization results of model I.
Class of Preferred UnitsNumber of Preferred UnitsRatio of Preferred Units to Total Projected UnitsNumber of Known Ore-Bearing UnitsRatio of Known Ore-Bearing Units to Preferred UnitsIncrease Multiplier for Proportion of Units with Minerals
Level I890.36%24 26.97% 61.29
Level II1440.58%28 19.44% 44.18
Level III2330.94% 8 3.43%7.80
Total4671.88% 60 12.85%29.20
Description: Total number of projected units: 24,824. The number of known ore-bearing units: 109. Proportion of units with minerals (ratio of known ore-bearing units to total projected units: 0.44%.
Table 4. Statistics of quantitative optimization results of model II.
Class of Preferred UnitsNumber of Preferred UnitsRatio of Preferred Units to Total Projected UnitsNumber of Known Ore-Bearing UnitsRatio of Known Ore-Bearing Units to Preferred UnitsIncrease Multiplier for Proportion of Units with Minerals
Level I127 0.51% 20 15.75% 35.79
Level II205 0.83%35 17.07% 38.71
Level III332 1.34% 23 6.92% 15.72
Total665 2.68% 78 11.73%26.66
Description: Total number of projected units: 24,824. The number of known ore-bearing units: 109. Proportion of units with minerals (ratio of known ore-bearing units to total projected units): 0.44%.
Table 5. Statistics of quantitative optimization results of model III.
Class of Preferred UnitsNumber of Preferred UnitsRatio of Preferred Units to Total Projected UnitsNumber of Known Ore-Bearing UnitsRatio of Known Ore-Bearing Units to Preferred UnitsIncrease Multiplier for Proportion of Units with Minerals
Level I units105 0.42% 6 5.71% 12.98
Level II units170 0.68% 4 2.35% 5.34
Level III units275 1.11% 11 4% 9.09
Total550 2.22% 21 3.81%8.68
Description: Total number of projected units: 24,824. The number of known ore-bearing units: 109. Proportion of units with minerals (ratio of known ore-bearing units to total projected units): 0.44%.
Table 6. Statistics of quantitative optimization results for the target area of the Au mine.
Class of Target AreasNumber of Preferred Target AreasRatio of Preferred Target Areas to Total Projected Target AreasNumber of Known Ore-Bearing Target AreasRatio of Known Ore-Bearing Target Areas to Preferred Target AreasIncrease Multiplier for Proportion of Target Areas with Minerals
Level I57 0.23%11 19.29%43.85
Level II93 0.37%11 11.82%26.88
Level III150 0.60%5 3.33%7.57
Total300 1.21% 27 9.00%20.45
Description: Total number of projected target areas: 24,824. The number of known ore-bearing target areas: 109. Proportion of target areas with minerals (ratio of known ore-bearing target areas to total projected target areas): 0.44%.
Table 7. List of blank target area-checking results.
Number of Target AreaAu (10−6)Number of Target AreaAu (10−6)Data Supplier
I-2-61.96–2.02I-2-90.63The Fourth Geological Survey Institute of Gansu Provincial Geology and Mining Bureau
I-2-100.57I-2-113.65
I-2-122.76–3.43I-2-130.97
I-2-140.51--
I-2-71.42–1.71I-2-41.42Geological Survey of Gansu Province
I-2-80.86–0.93I-2-10.59
I-2-51.63–1.84I-2-22.34–3.78
I-2-31.16I-2-42.76–2.95
I-2-140.66I-2-151.74The Third Geological Survey Institute of Gansu Provincial Geology and Mining Bureau
I-2-161.52–2.13I-2-171.06–4.42
I-2-181.62–1.74I-2-192.85–5.66
Description: The Third Survey Institute, the Fourth Survey Institute of Gansu Province Geology and Mining Bureau, and the Geological Survey of Gansu Province completed the field validation work, and the Comprehensive Research Office of Gansu Province Geology and Mining Bureau summarized the validation results.
Disclaimer/Publisher’s Note: The statements, opinions and data contained in all publications are solely those of the individual author(s) and contributor(s) and not of MDPI and/or the editor(s). MDPI and/or the editor(s) disclaim responsibility for any injury to people or property resulting from any ideas, methods, instructions or products referred to in the content.

