
Multi-Source Data Fusion-Based Grid-Level Load Forecasting

Abstract
1. Background and Motivation
1.1. Literature Review and Research Gaps
Research Gaps in Grid-Level Forecasting Integration
1.2. Research Contributions
1.3. Paper Organization
2. Materials and Methods
2.1. Challenges of Grid-Level Power Load Forecasting Integration
2.2. Provincial Forecasting Methodologies
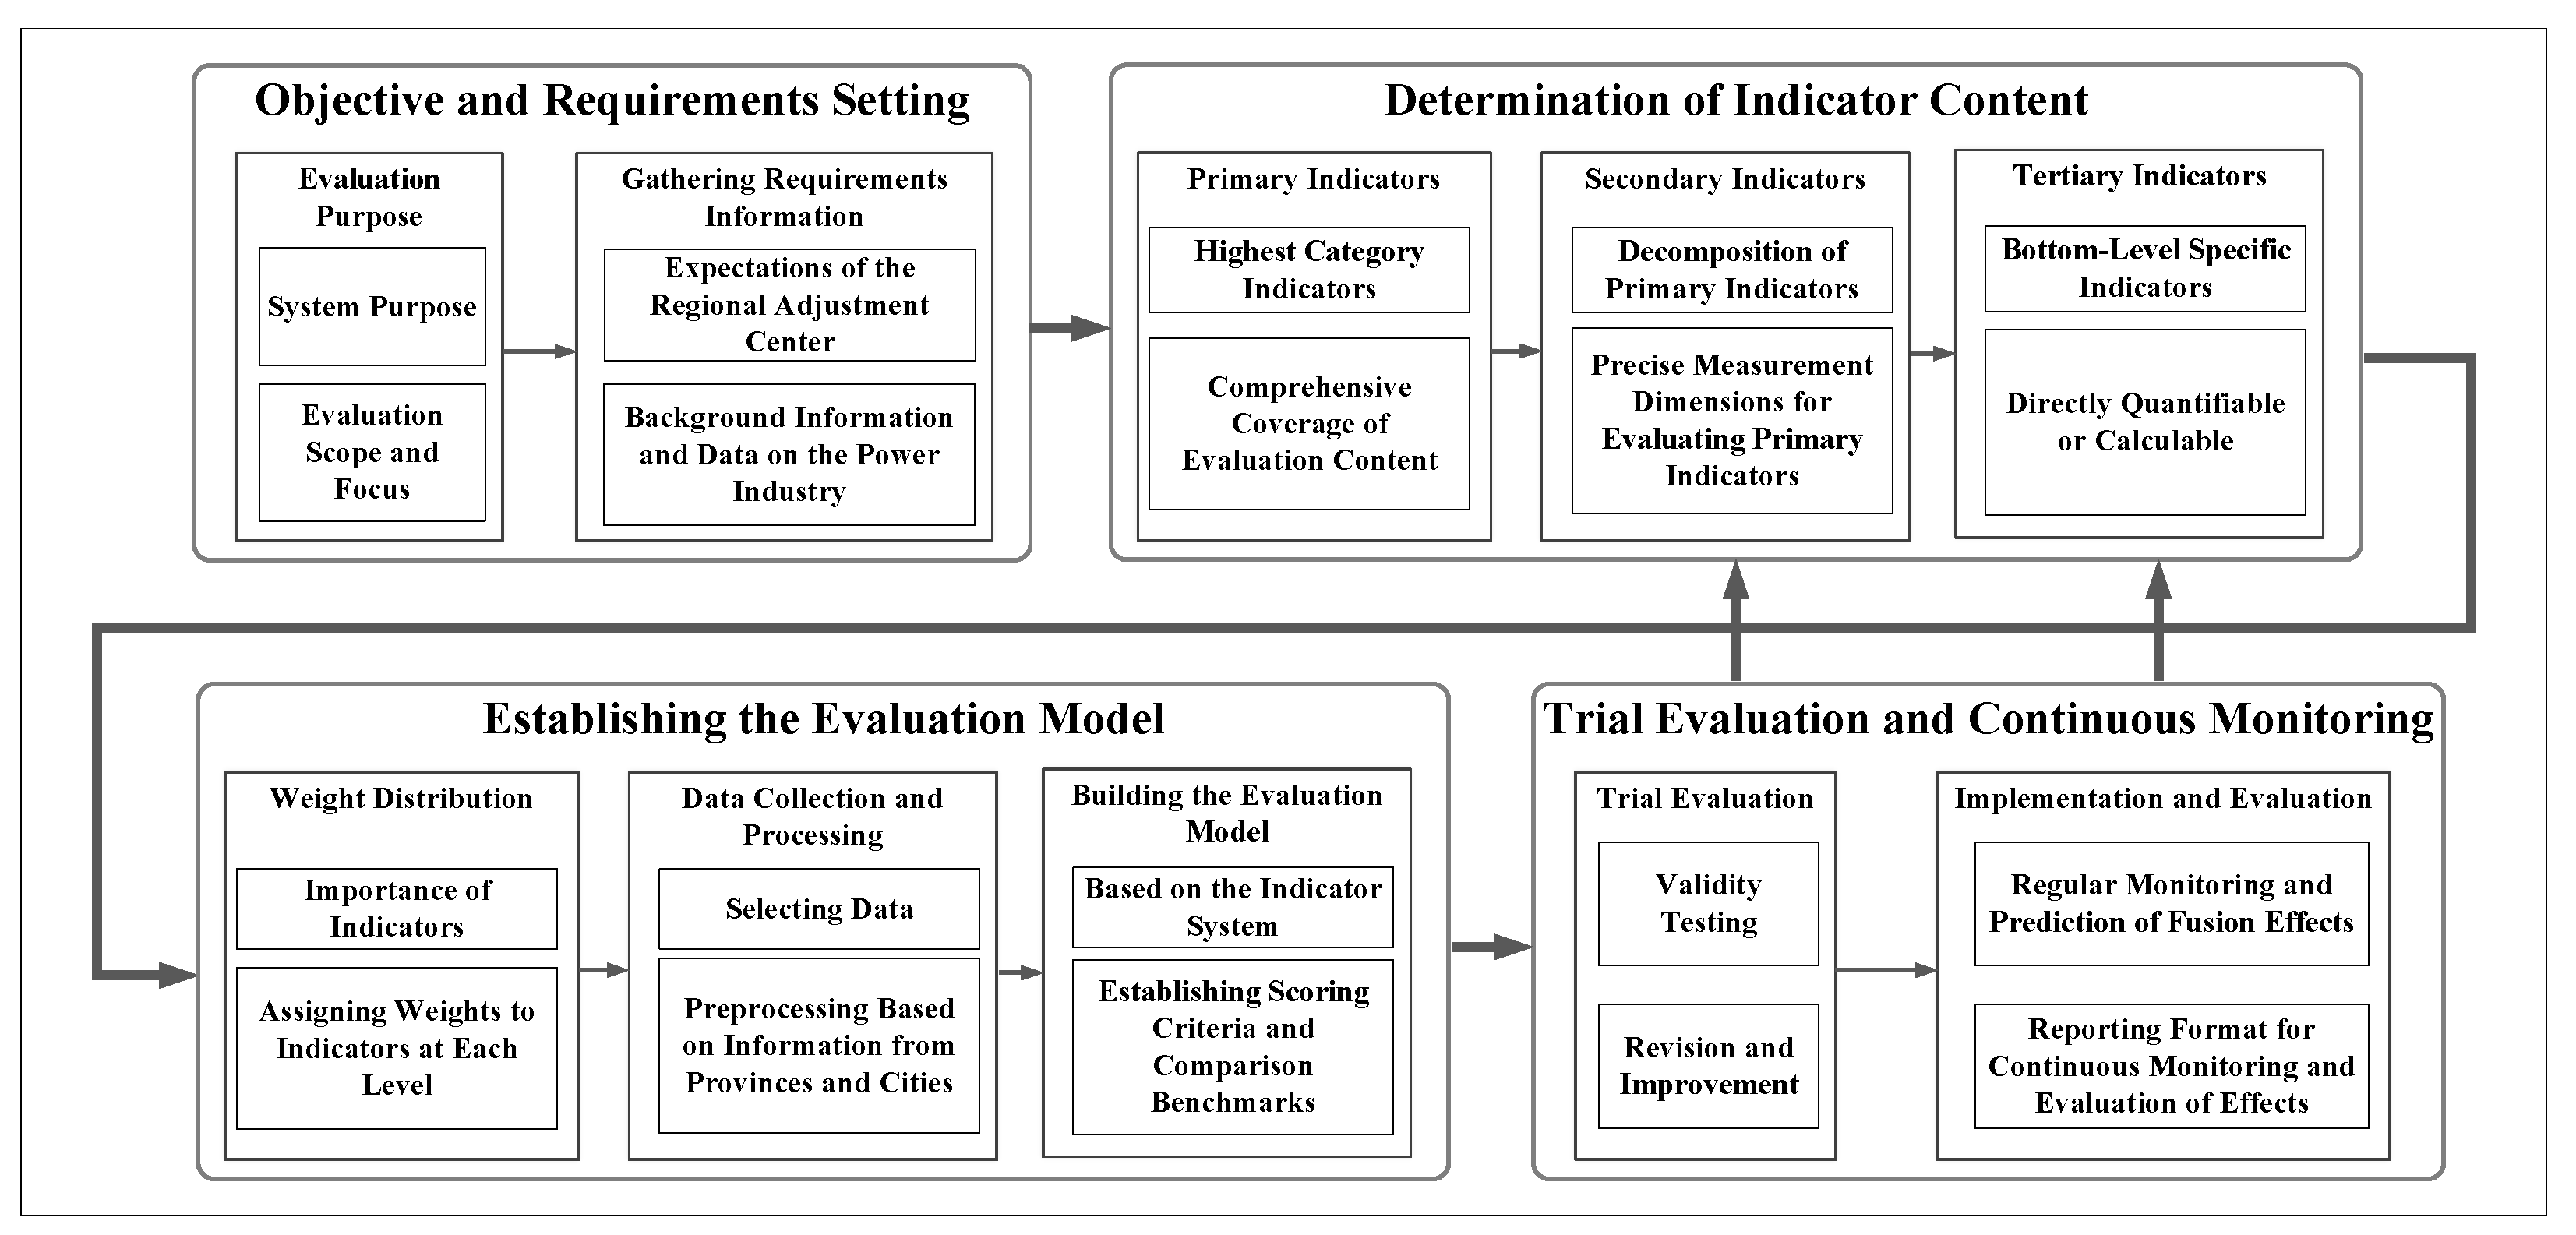
2.3. Comprehensive Evaluation Index System
2.4. PCA-Based Weight Determination Framework
2.4.1. Evaluation Matrix Construction
2.4.2. PCA-Based Weight Calculation Process
2.4.3. Time-Varying Weight Matrix
2.4.4. Balanced Fusion Concept
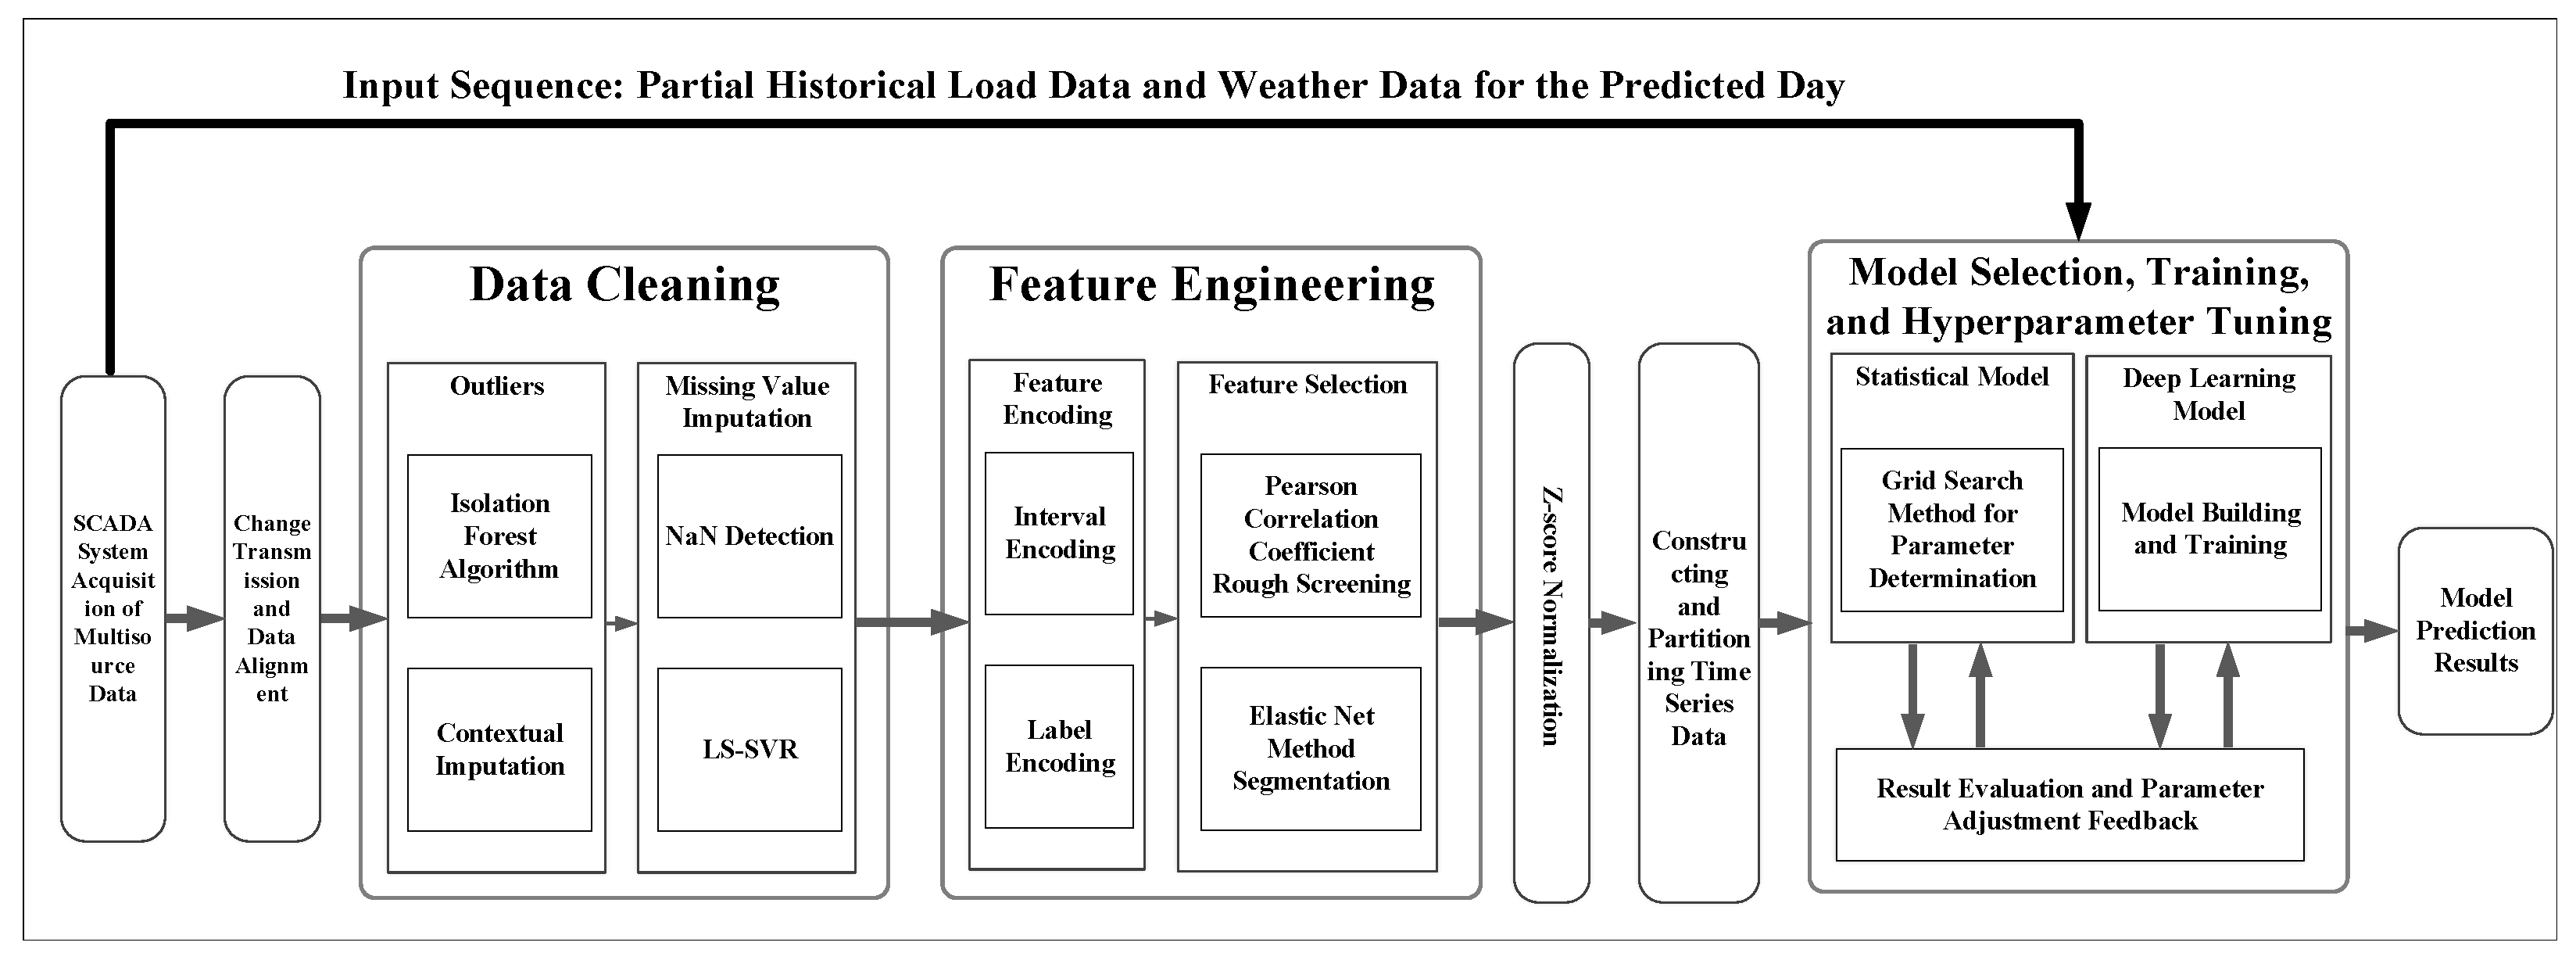
2.5. Implementation Framework for Multi-Regional Load Forecasting Integration
2.5.1. Multi-Regional Integration Framework Overview
2.5.2. Multi-Source Data Preprocessing
- Sectoral electricity usage data (industrial, commercial, residential).
- Real-time electricity price information.
- Operational data from distributed generation sources.
- High-resolution meteorological data (temperature, humidity, precipitation).
- Socioeconomic indicators (holidays, population density, economic indices).
2.5.3. Provincial Forecast Generation
- Regions with stable industrial profiles: Statistical methods like ARIMA or exponential smoothing.
- Regions with complex seasonal patterns: Recurrent neural networks (LSTM, GRU).
- Regions with multiple influential external factors: Attention-based architectures.
2.5.4. Multi-Regional Forecast Fusion
3. Results
3.1. Experimental Setup
3.1.1. Hardware and Software Configuration
3.1.2. Dataset Description
3.1.3. Methodological Approach
- Provincial-level forecasting: Using historical load data without additional features but employing a peak-weighted loss function to improve accuracy during high-demand periods.
- Grid-level integrated forecasting: Incorporating enhanced feature sets (including weather data, calendar effects, and regional economic indicators) alongside peak-weighted loss functions.
3.1.4. Evaluation Metrics
- Mean Absolute Error (MAE): .
- Mean Absolute Percentage Error (MAPE): .
- Root Mean Square Error (RMSE): .
- Mean Square Percentage Error (MSPE): .
- Coefficient of Determination (): .
3.2. Regional Forecasting Performance Analysis
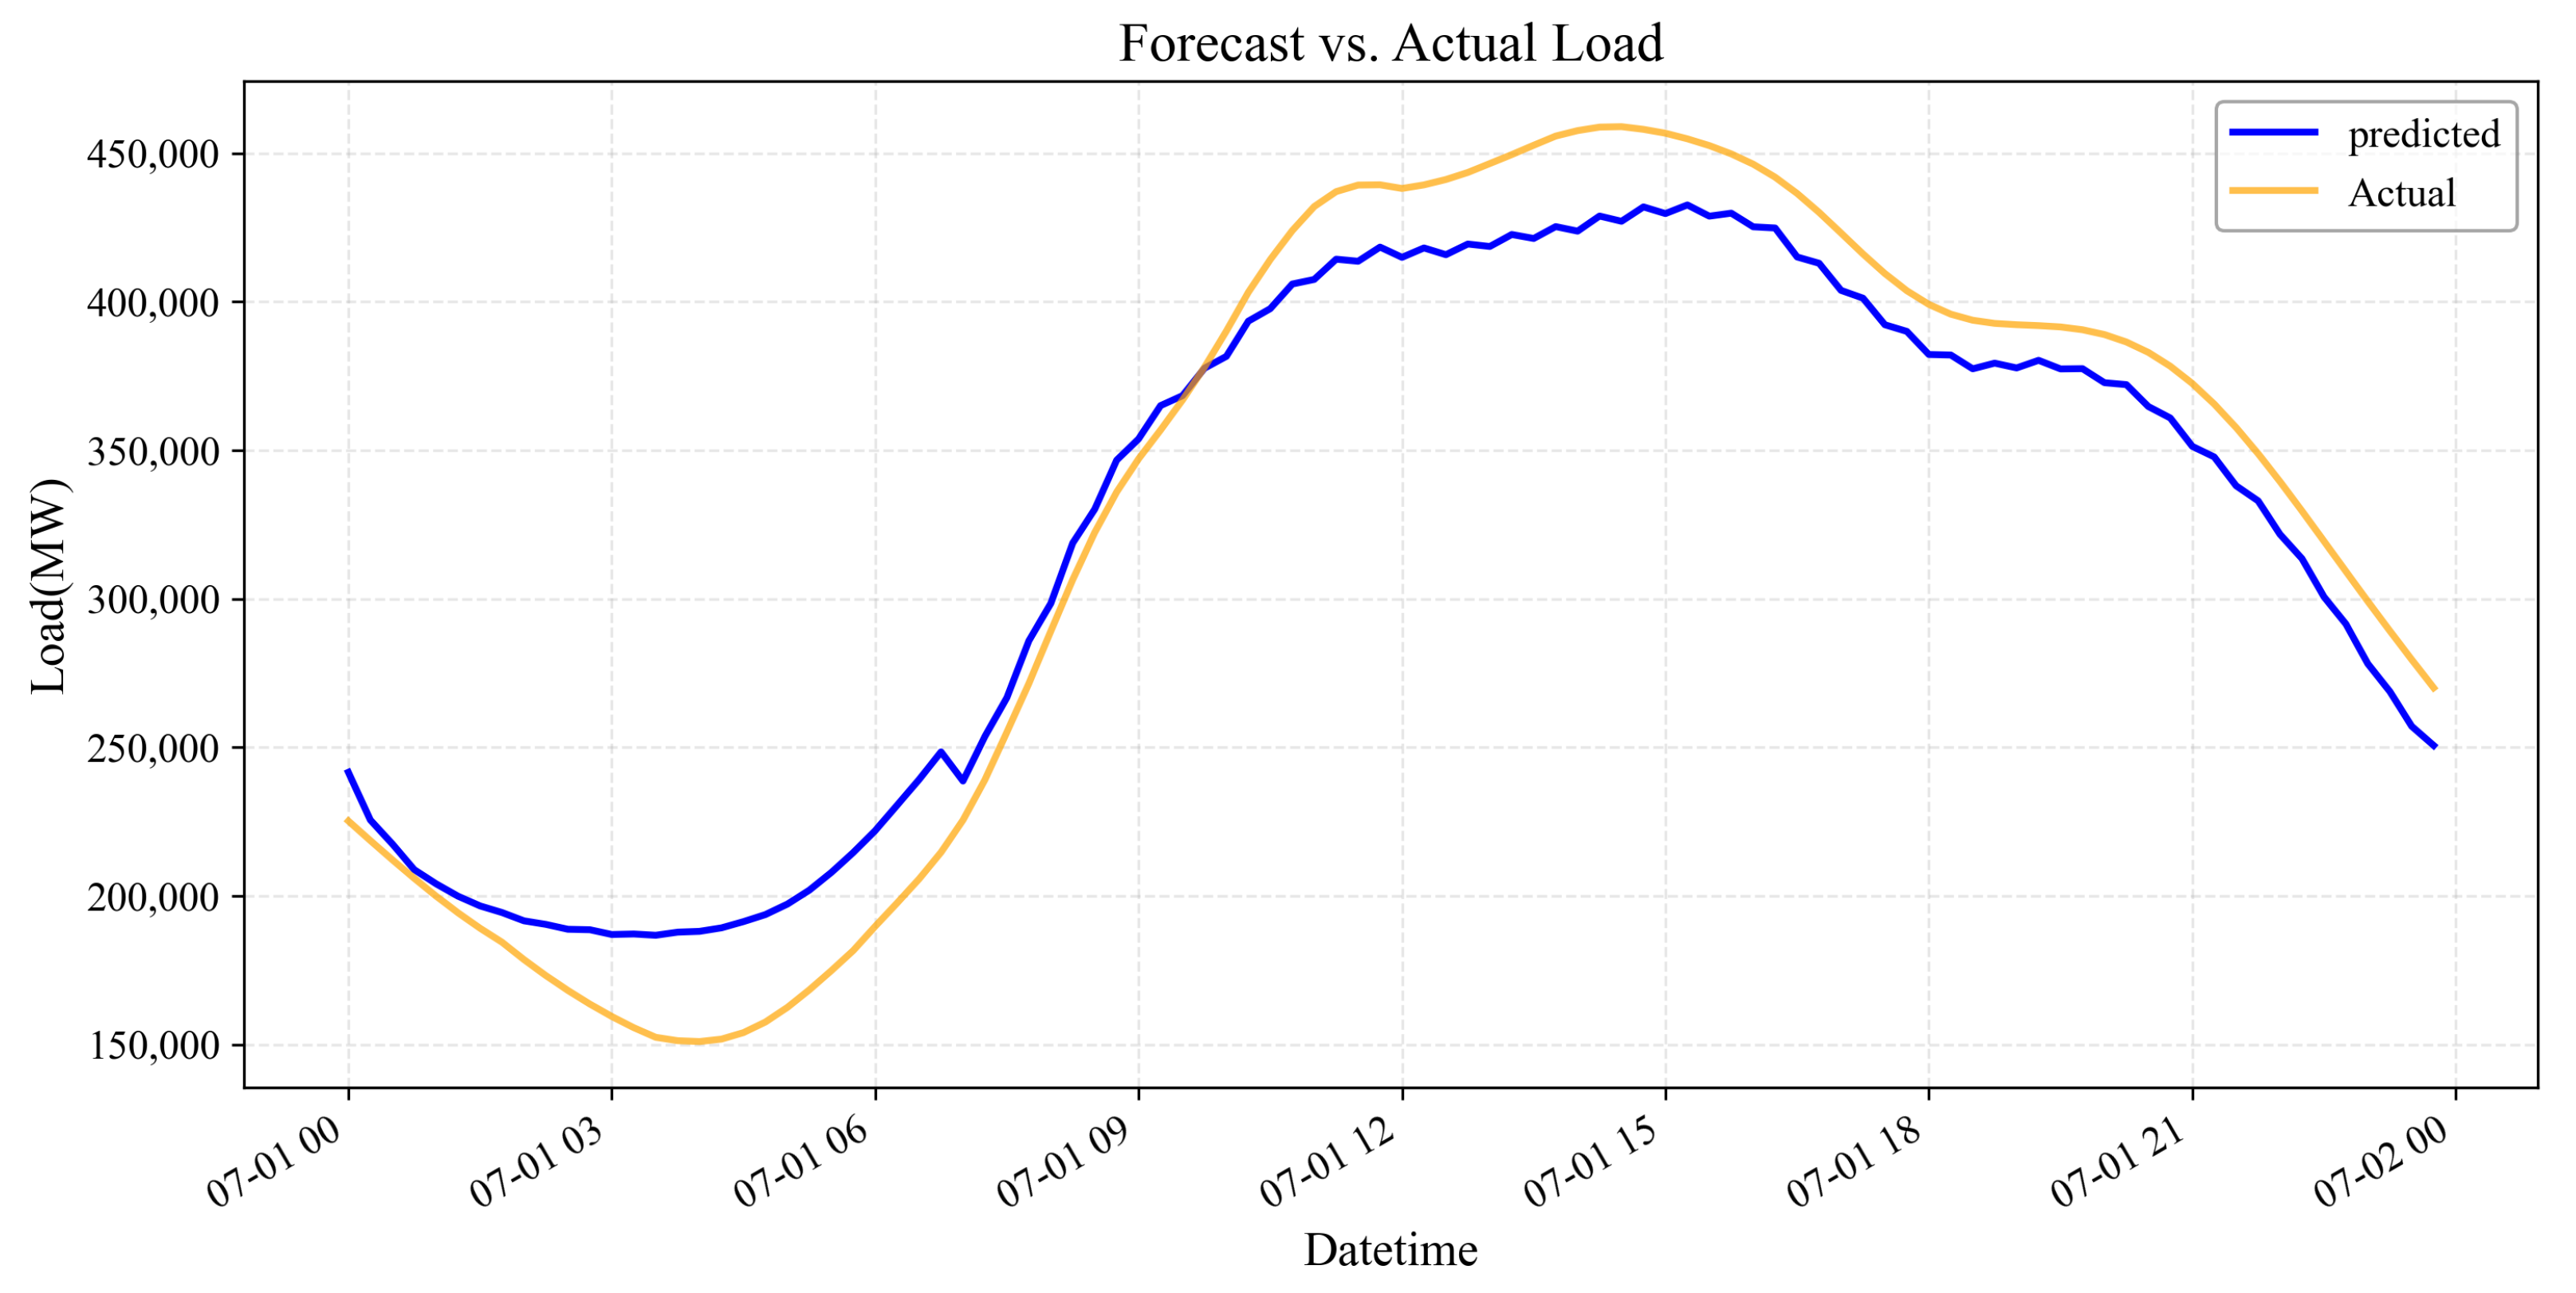
3.2.1. Daily Load Pattern Analysis for Shanghai
- Overnight Load Overestimation: Between 00:00 and 03:00, the model systematically overestimated the actual load, suggesting potential changes in overnight energy consumption patterns not captured by historical training data.
- Morning Valley Discrepancy: A significant forecasting error appears during the early morning hours (04:00–06:00), where the actual load reached approximately 150,000 units while the prediction remained at around 190,000 units. This 26.7% difference represents the largest proportional error in the 24 h cycle and indicates a potential structural change in morning industrial or commercial activity.
- Midday and Afternoon Peak Accuracy: Between 09:00 and 15:00, the model affirms good agreement with the actual peak load pattern but consistently underestimates the magnitude by approximately 25,000–30,000 units (6.5–7.0%). This systematic bias suggests the need for the recalibration of the peak-weighted loss function.
- Evening Transition Period: From 18:00 to 22:00, while the model correctly captures the declining trend, it again underestimates the actual load by a relatively consistent margin of approximately 20,000 units (5.0–5.5%).
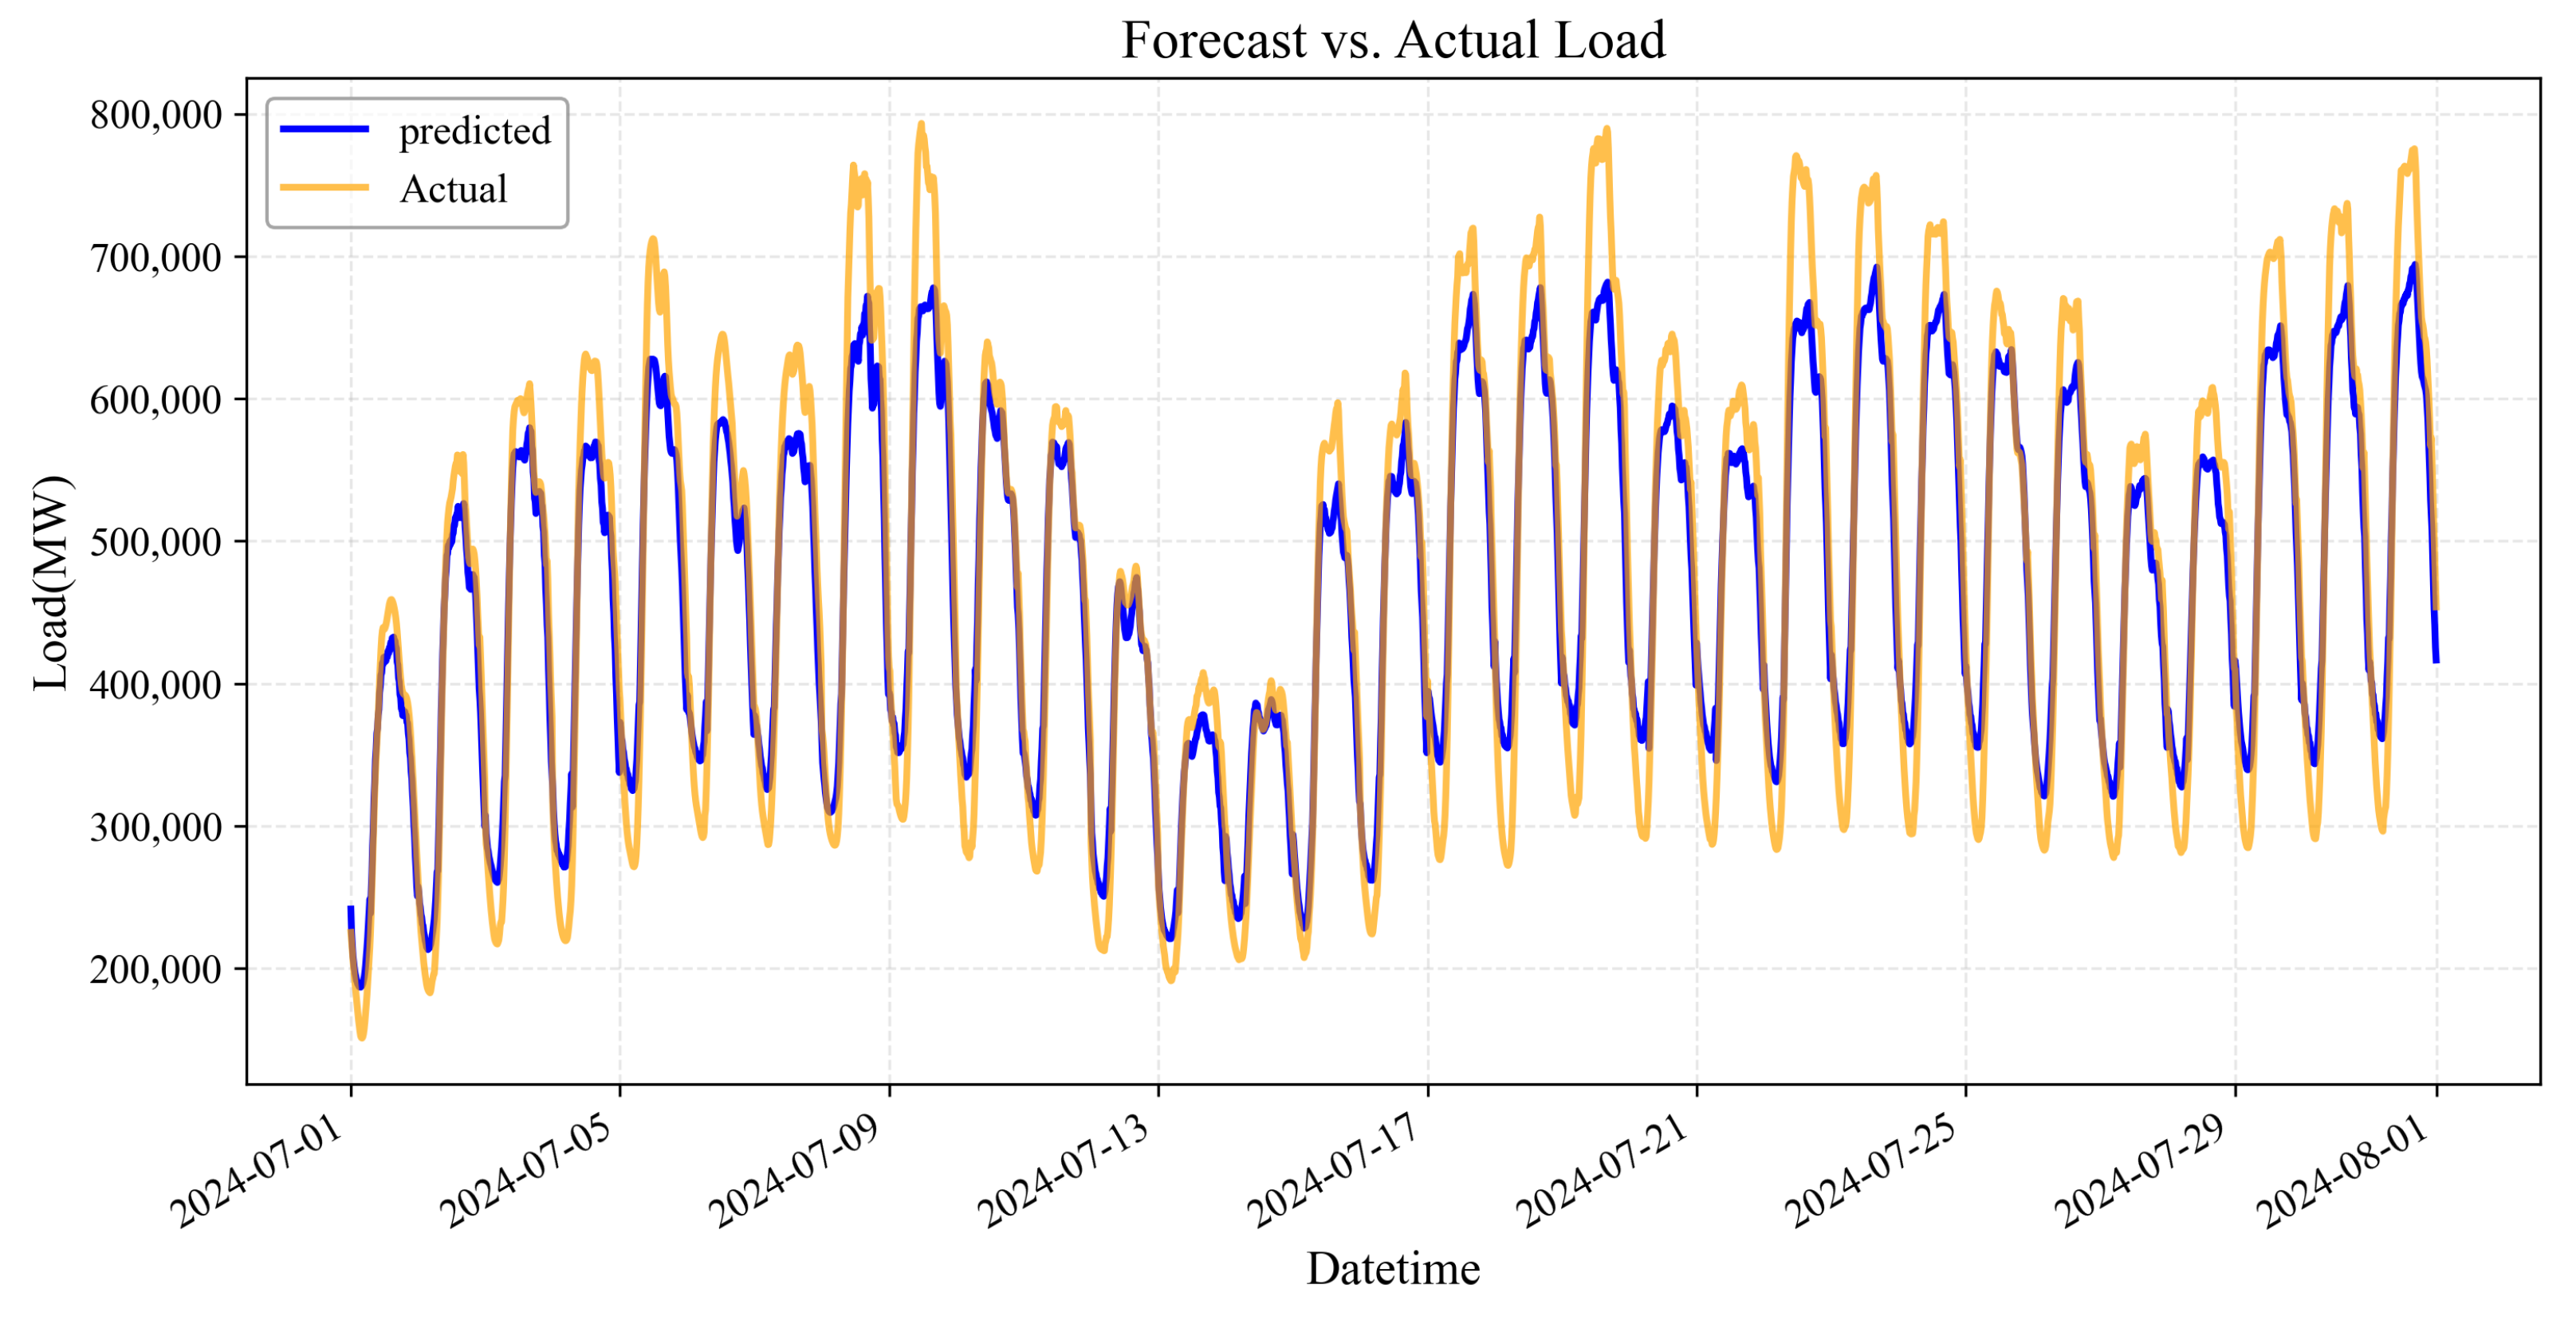
3.2.2. Monthly Rolling Forecast Performance
- Daily Cyclical Pattern Capture: The forecasting model successfully captures the fundamental daily load cycles with clear distinction between weekday and weekend patterns.
- Peak Load Magnitude Error: Consistent with the single-day analysis, the model systematically underestimates peak loads throughout the month, with discrepancies reaching up to 10% during extreme demand periods (particularly evident on 8–9 July and 17–19 July).
- Valley Forecasting Variability: The model demonstrates inconsistent performance in predicting load valleys, sometimes overestimating (1–3 July) and other times underestimating (13–15 July) the minimum load values. This variability suggests potential instability in the model’s response to low-load conditions.
- Mid-Month Adaptation Failure: An interesting phenomenon occurs around 12–15 July, where the forecast temporarily improves before deteriorating again. This suggests that while the model may be capturing some temporal shifts in load patterns, it fails to maintain this adaptation consistently throughout the forecast horizon.
- Weekday–Weekend Differentiation: The model demonstrates better performance on weekdays than weekends, with weekend load overestimation being particularly problematic. This indicates insufficient differentiation of calendar features in the provincial-level model.
3.3. Evaluation of Weighted Fusion Methodology
3.3.1. Experimental Methodology
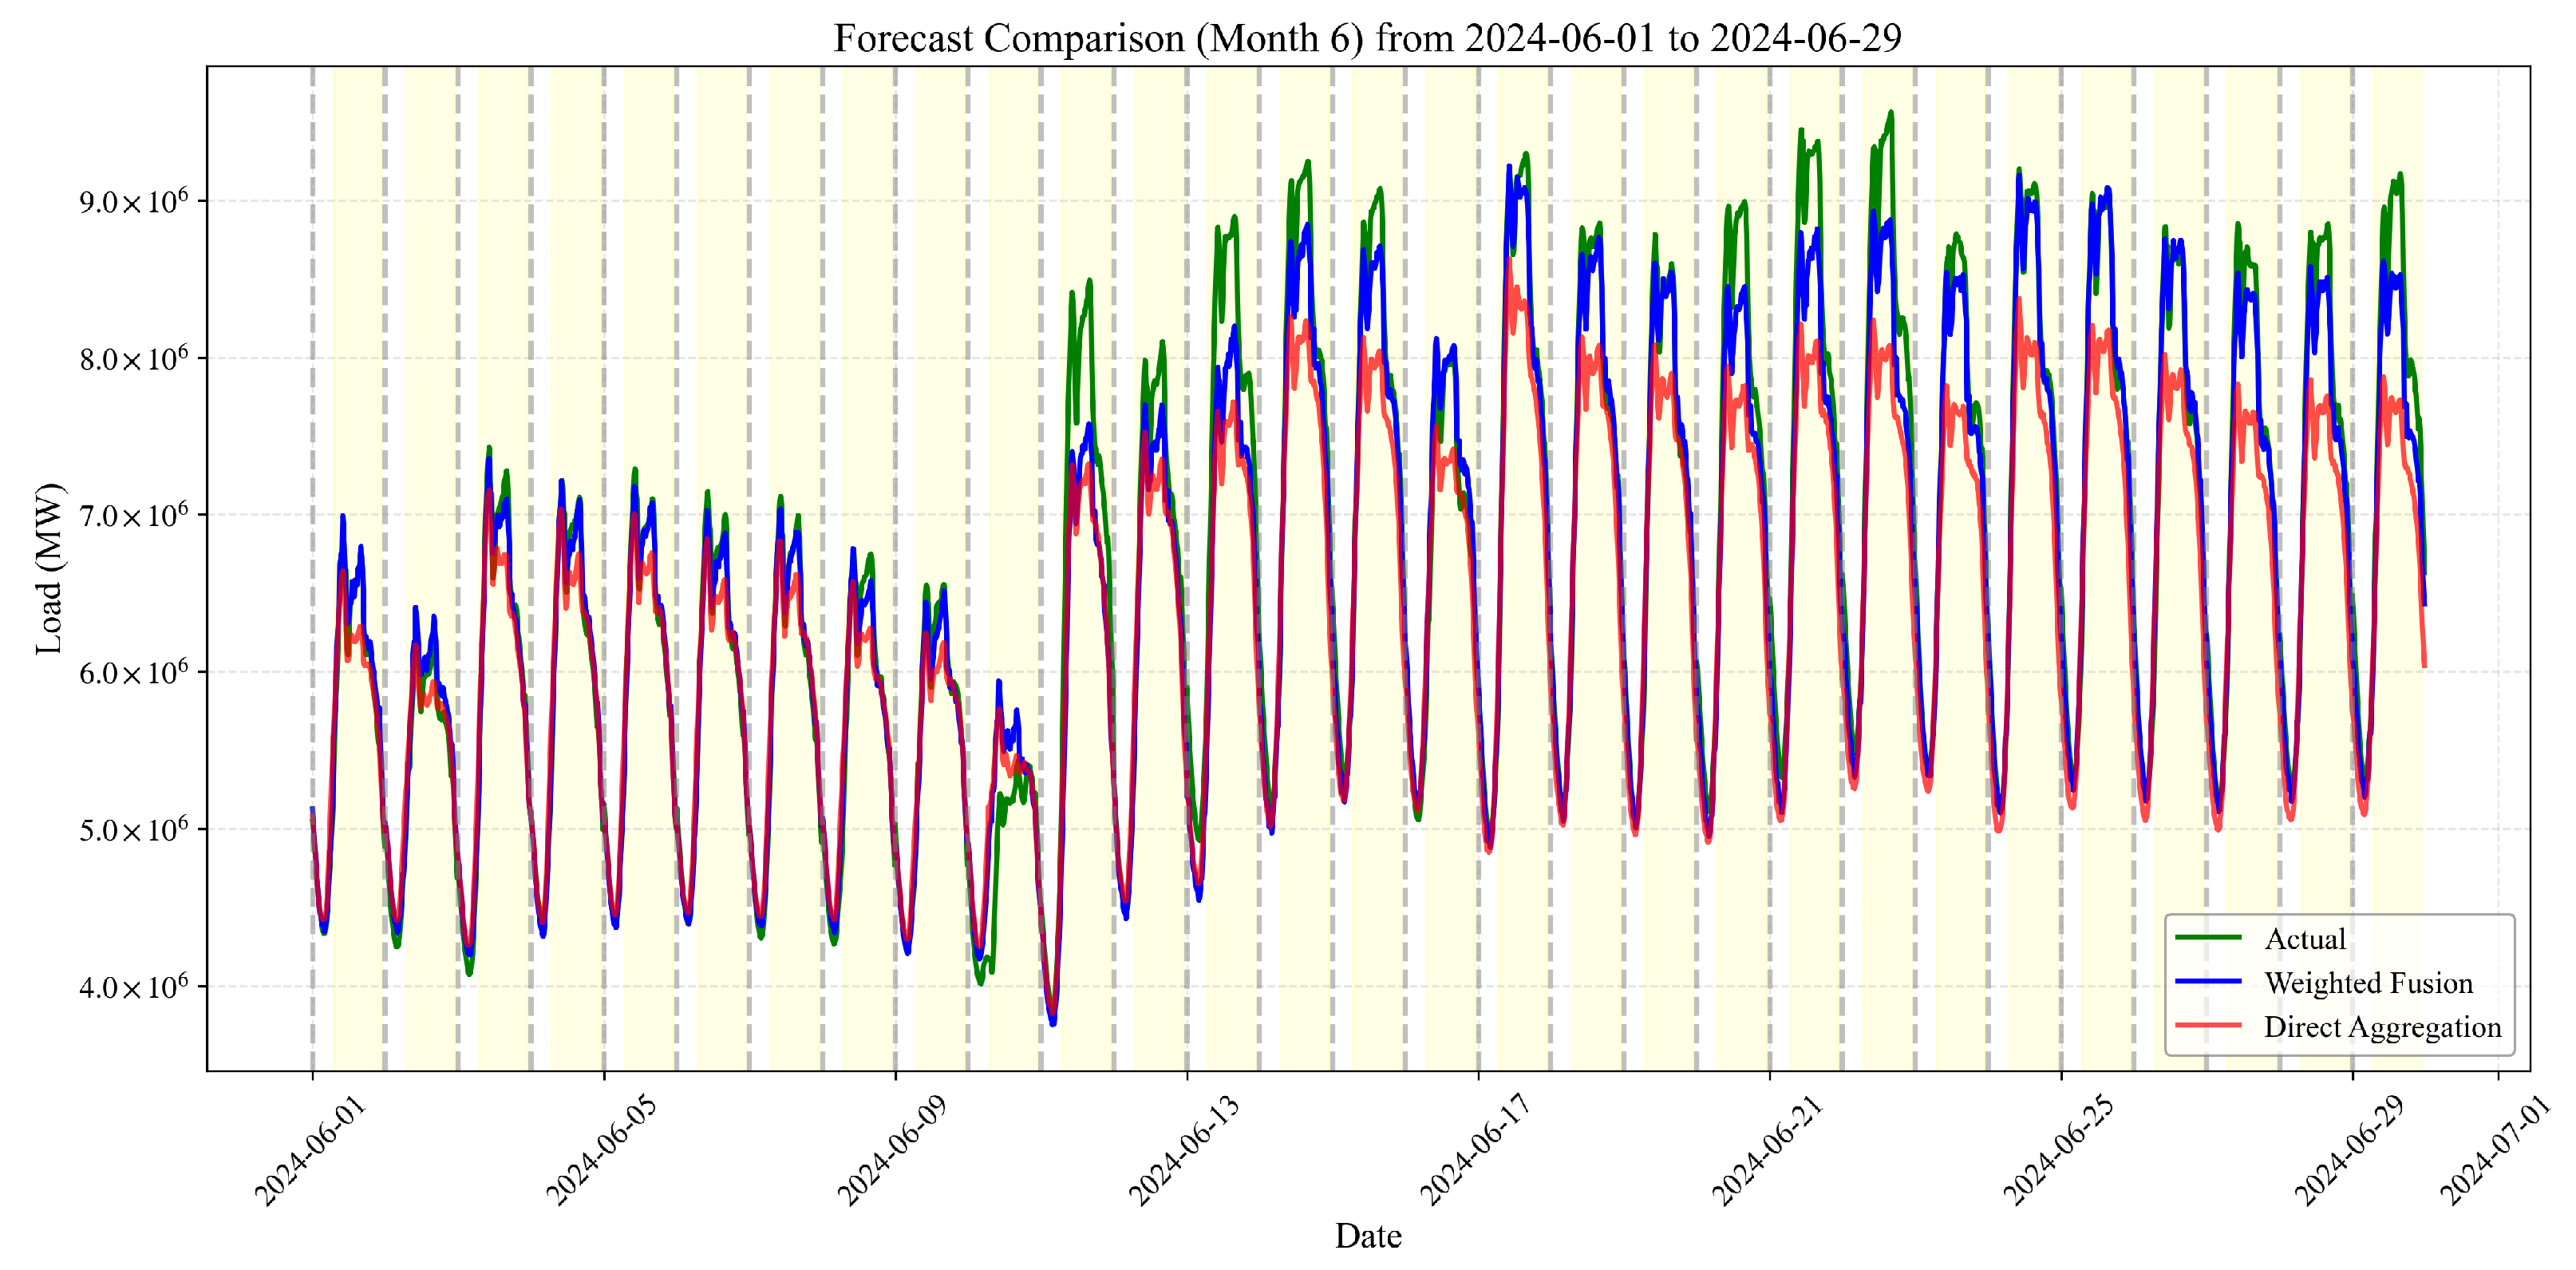
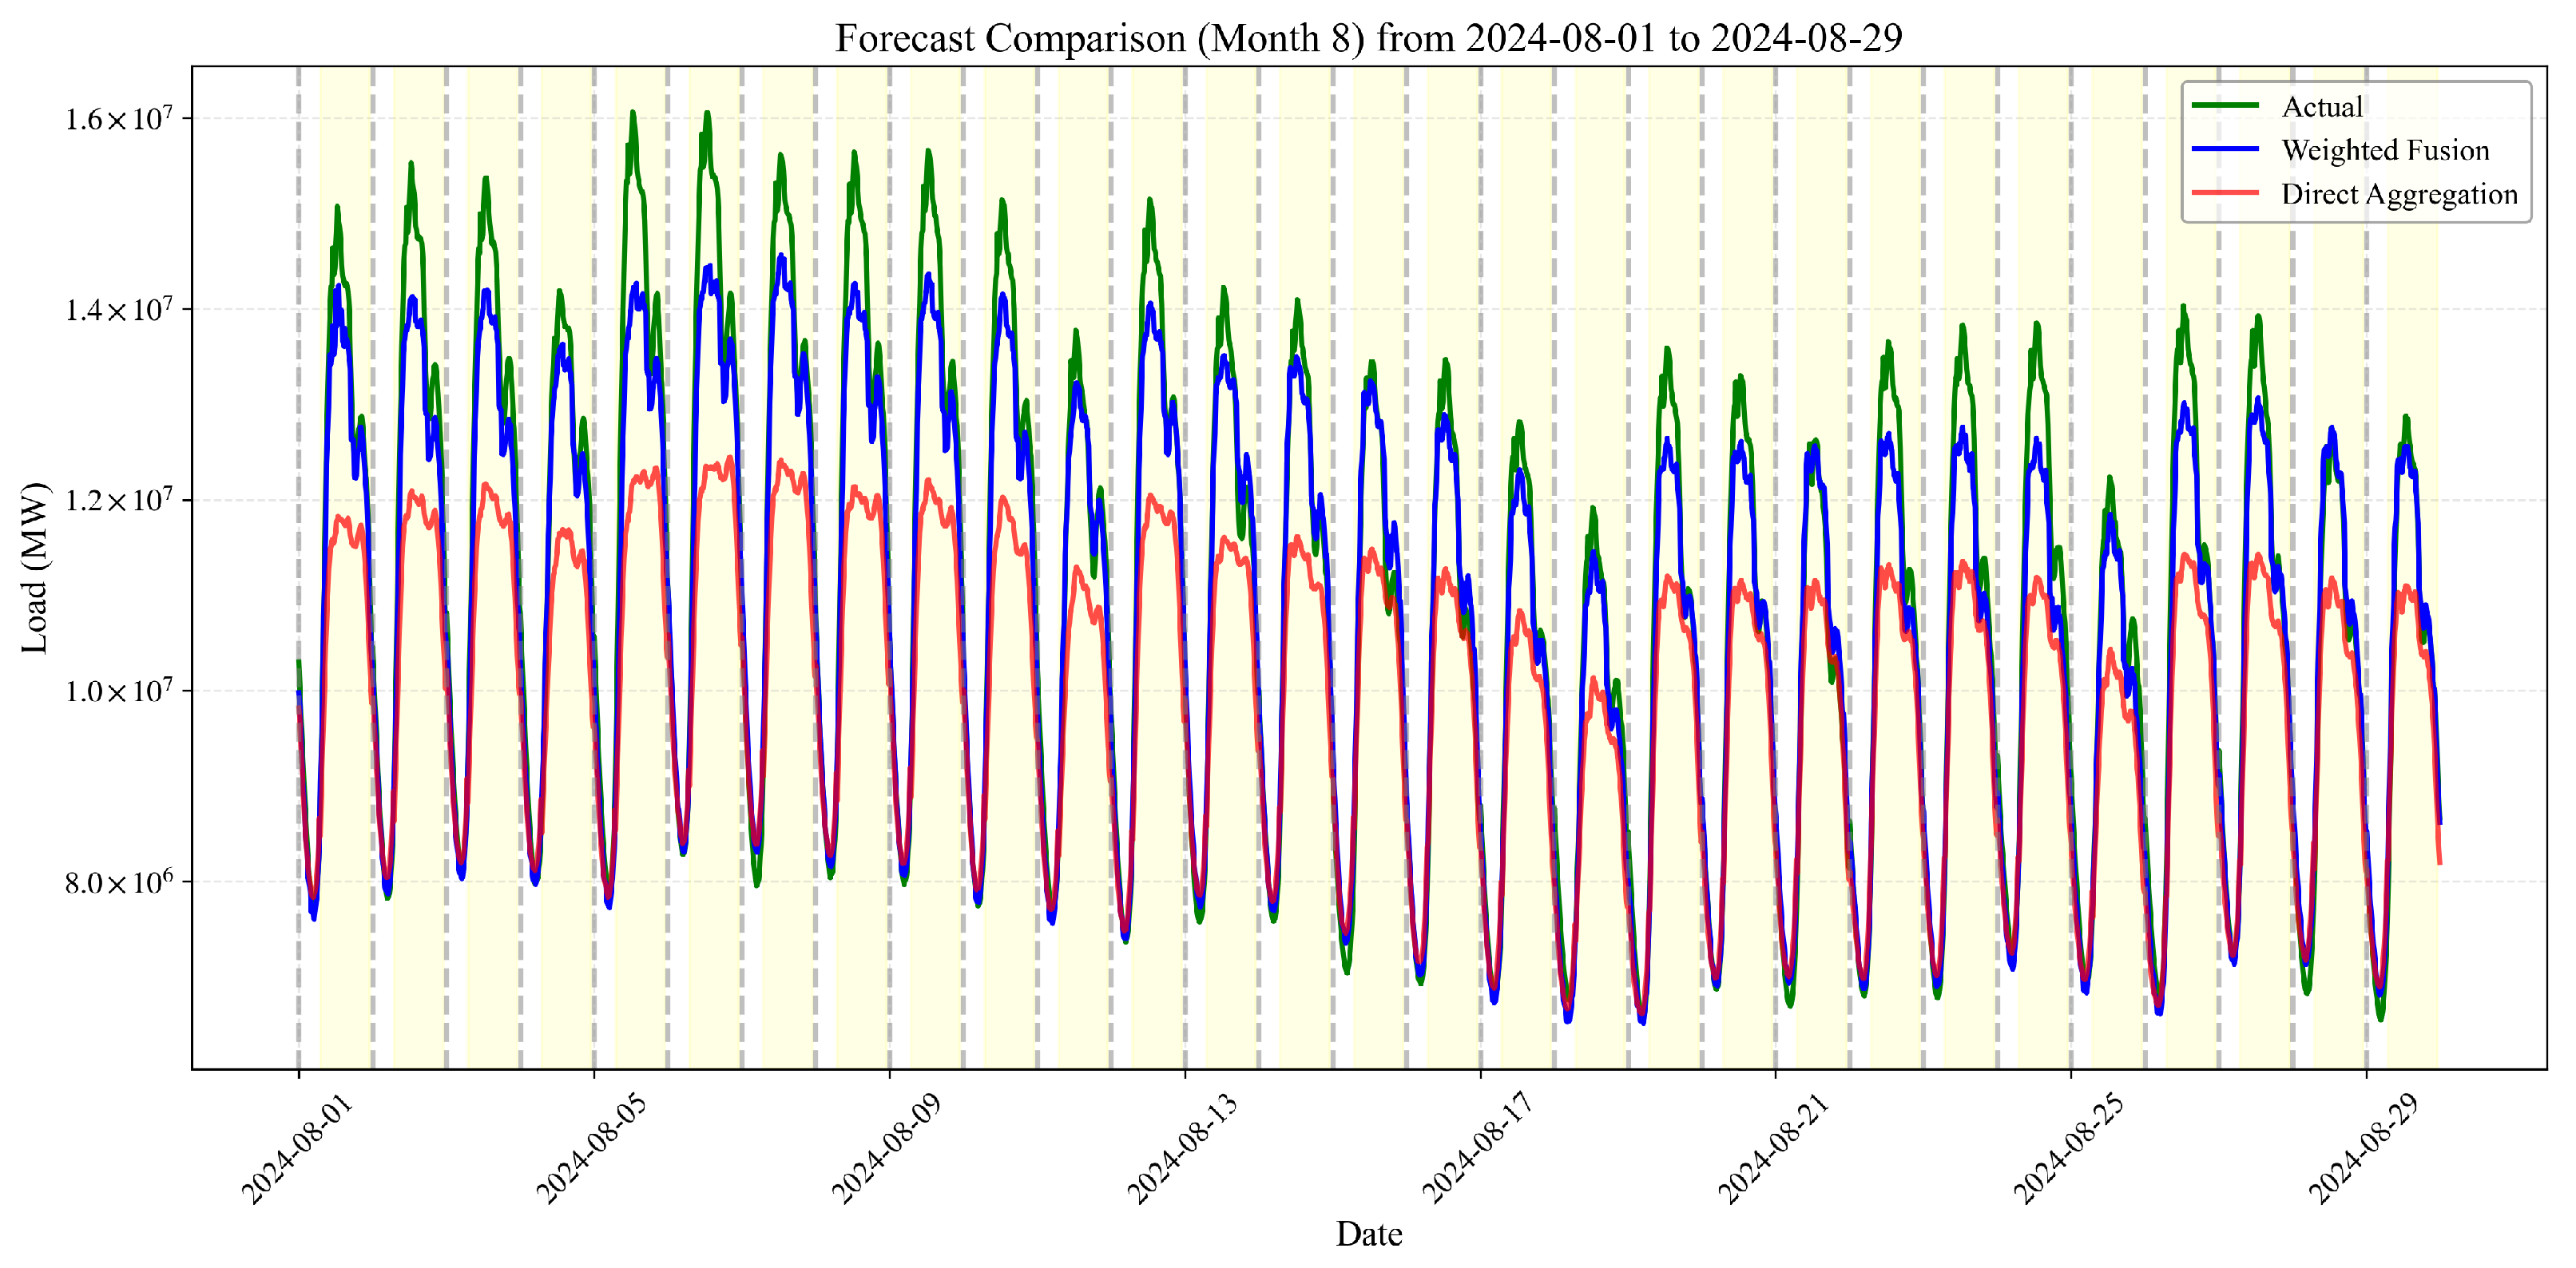
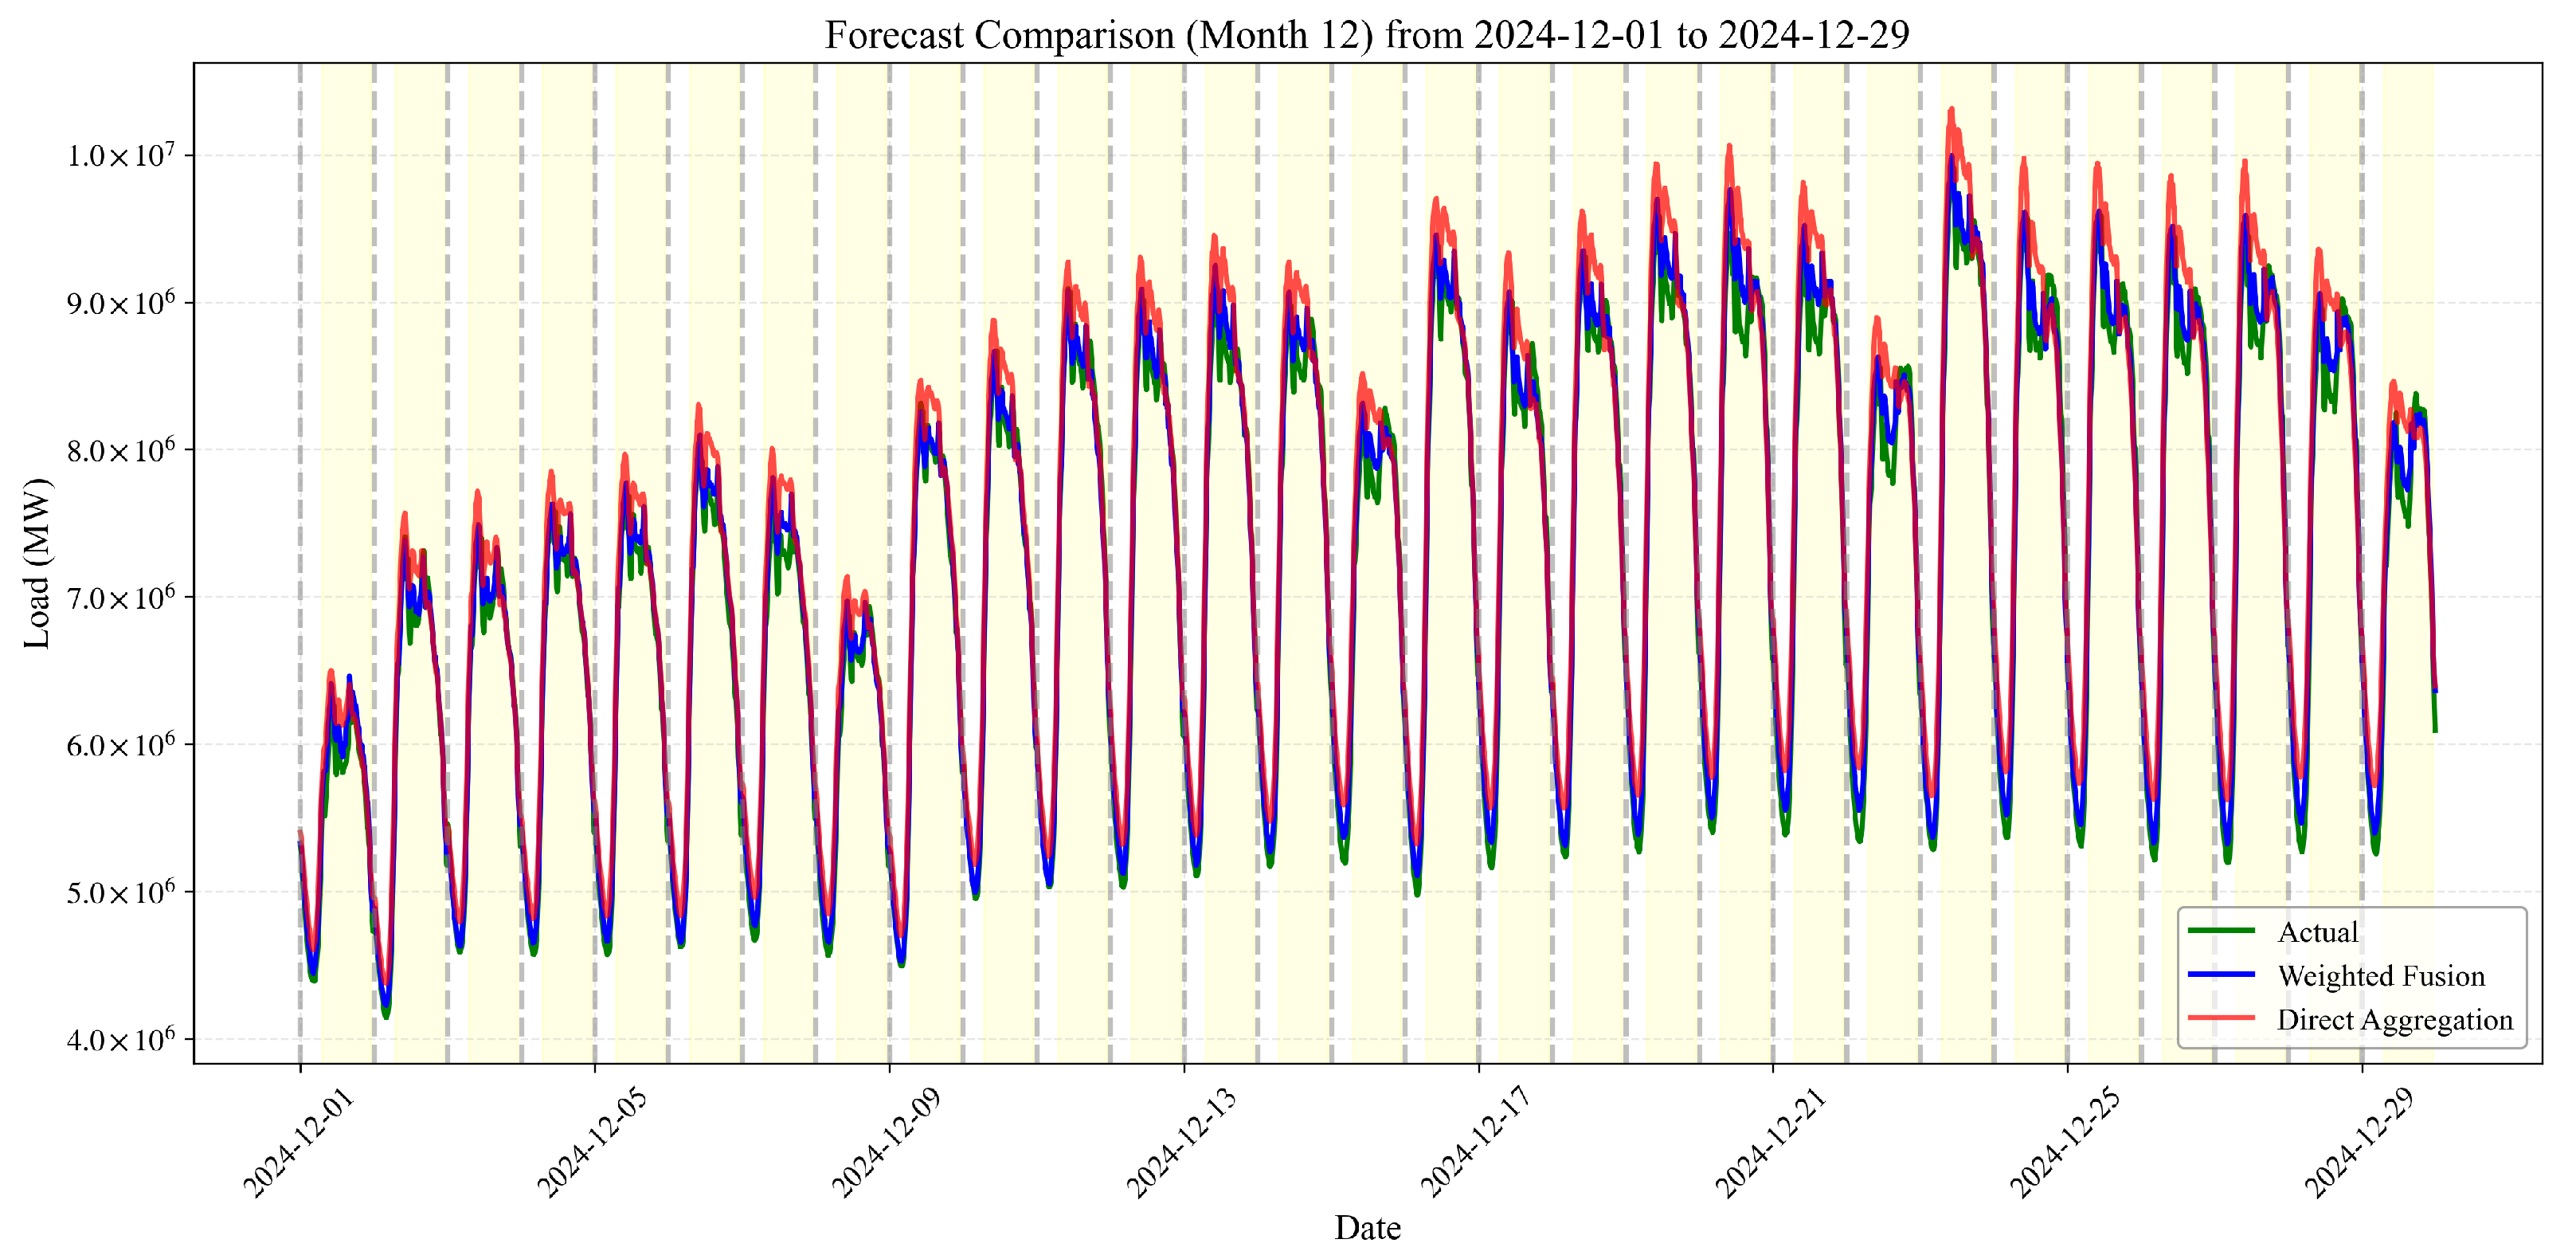
- Actual Load: The recorded ground truth values for grid-level load.
- Direct Aggregation: Simple summation of provincial-level forecasts without weighting adjustments.
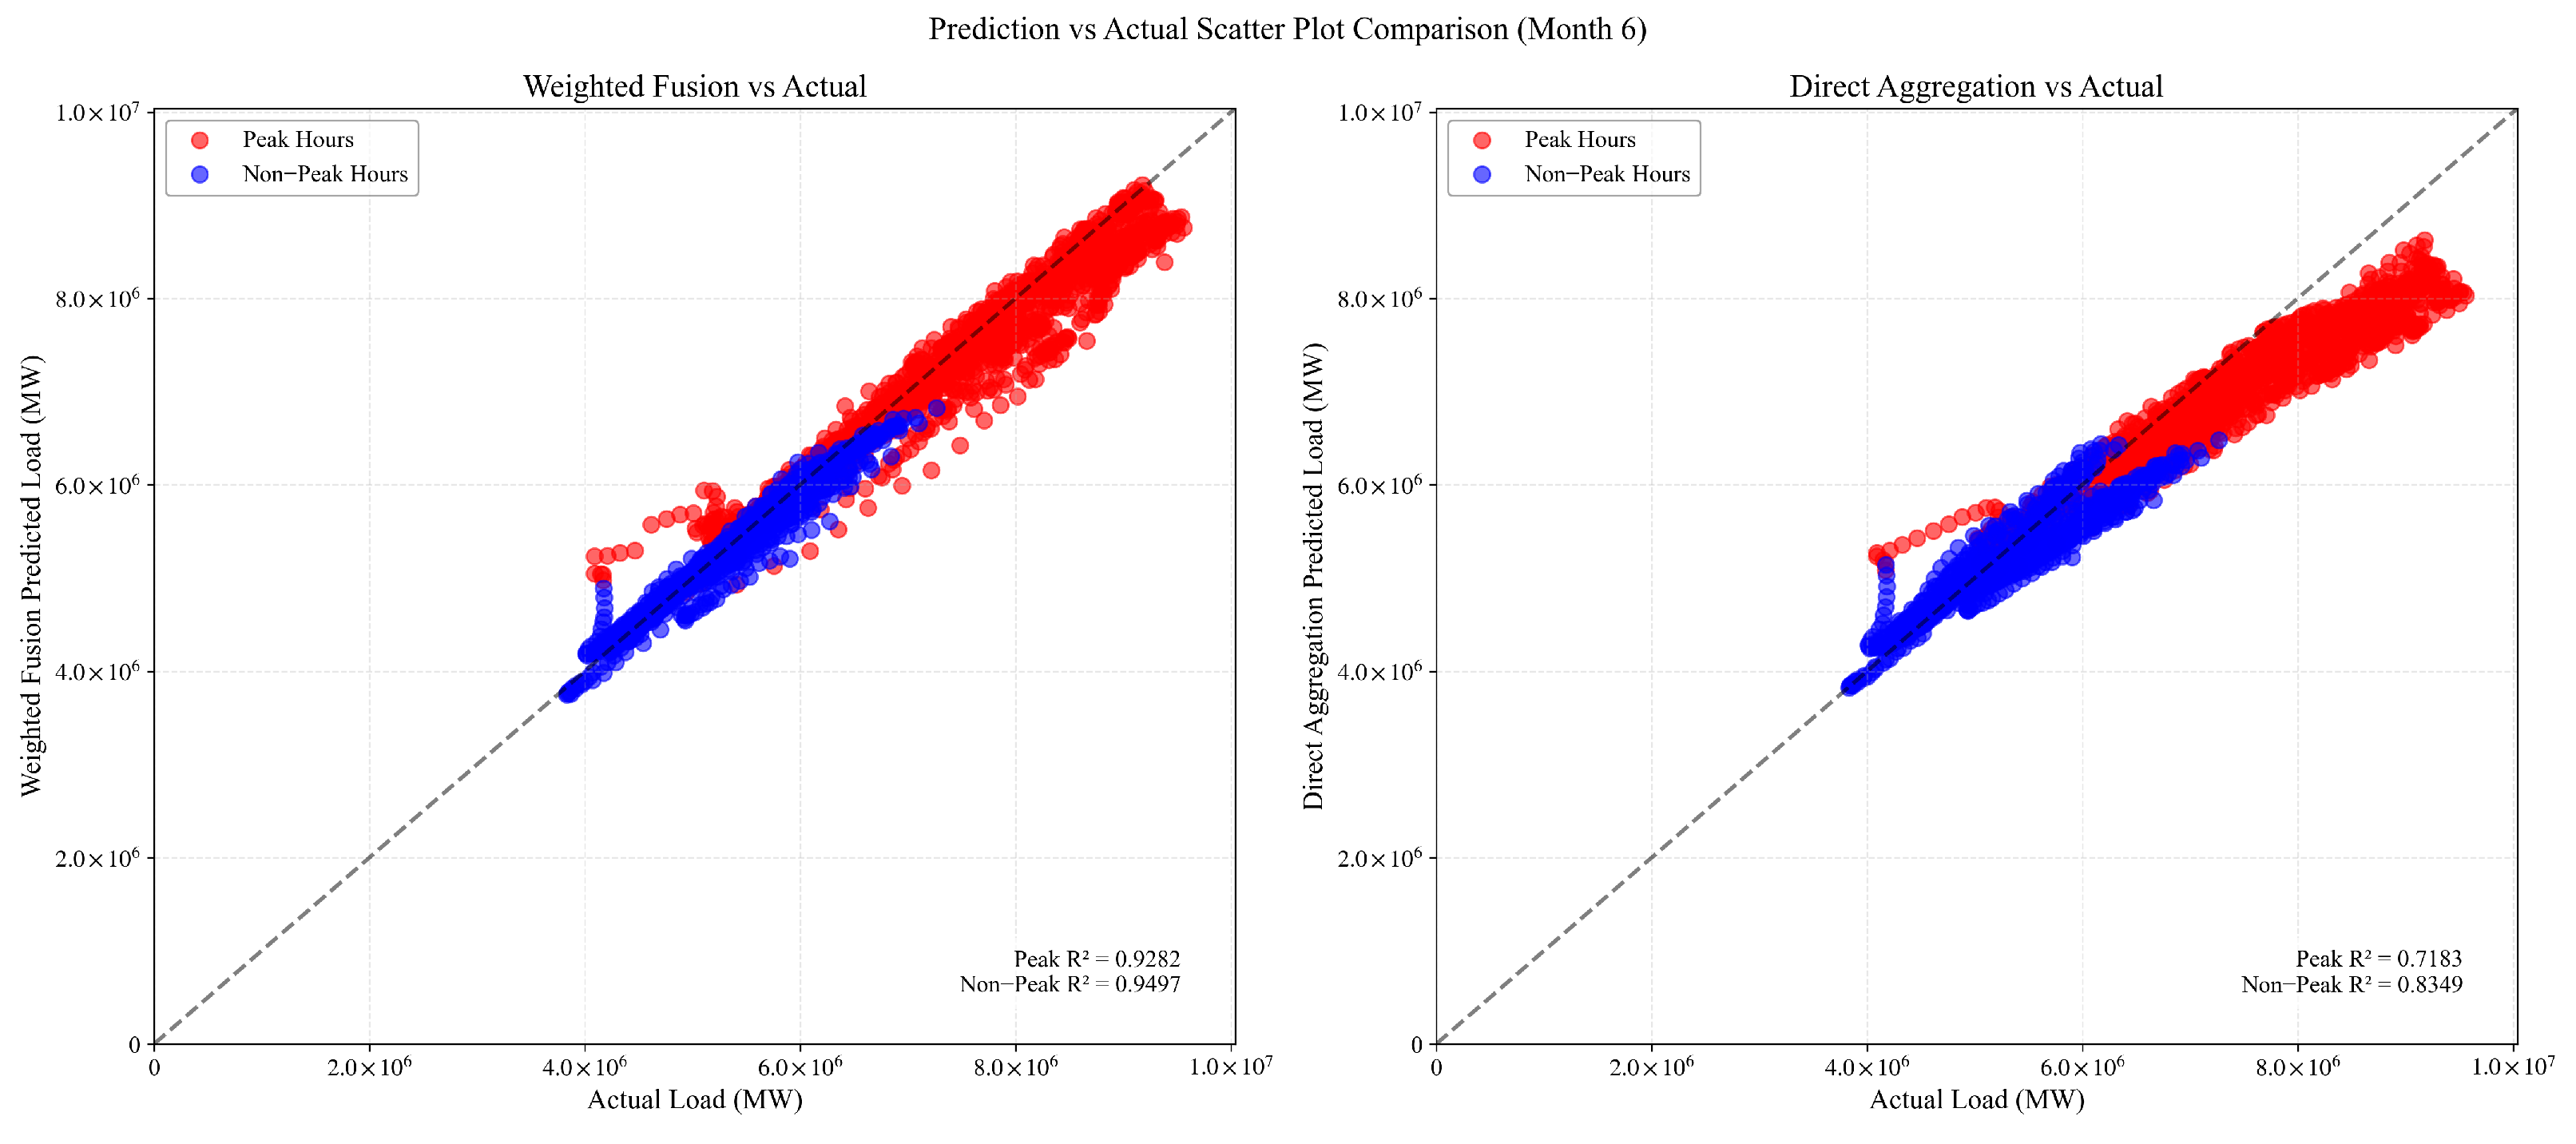
- Weighted Fusion: Our proposed PCA-based integration methodology that dynamically assigns reliability-based weights to provincial forecasts.
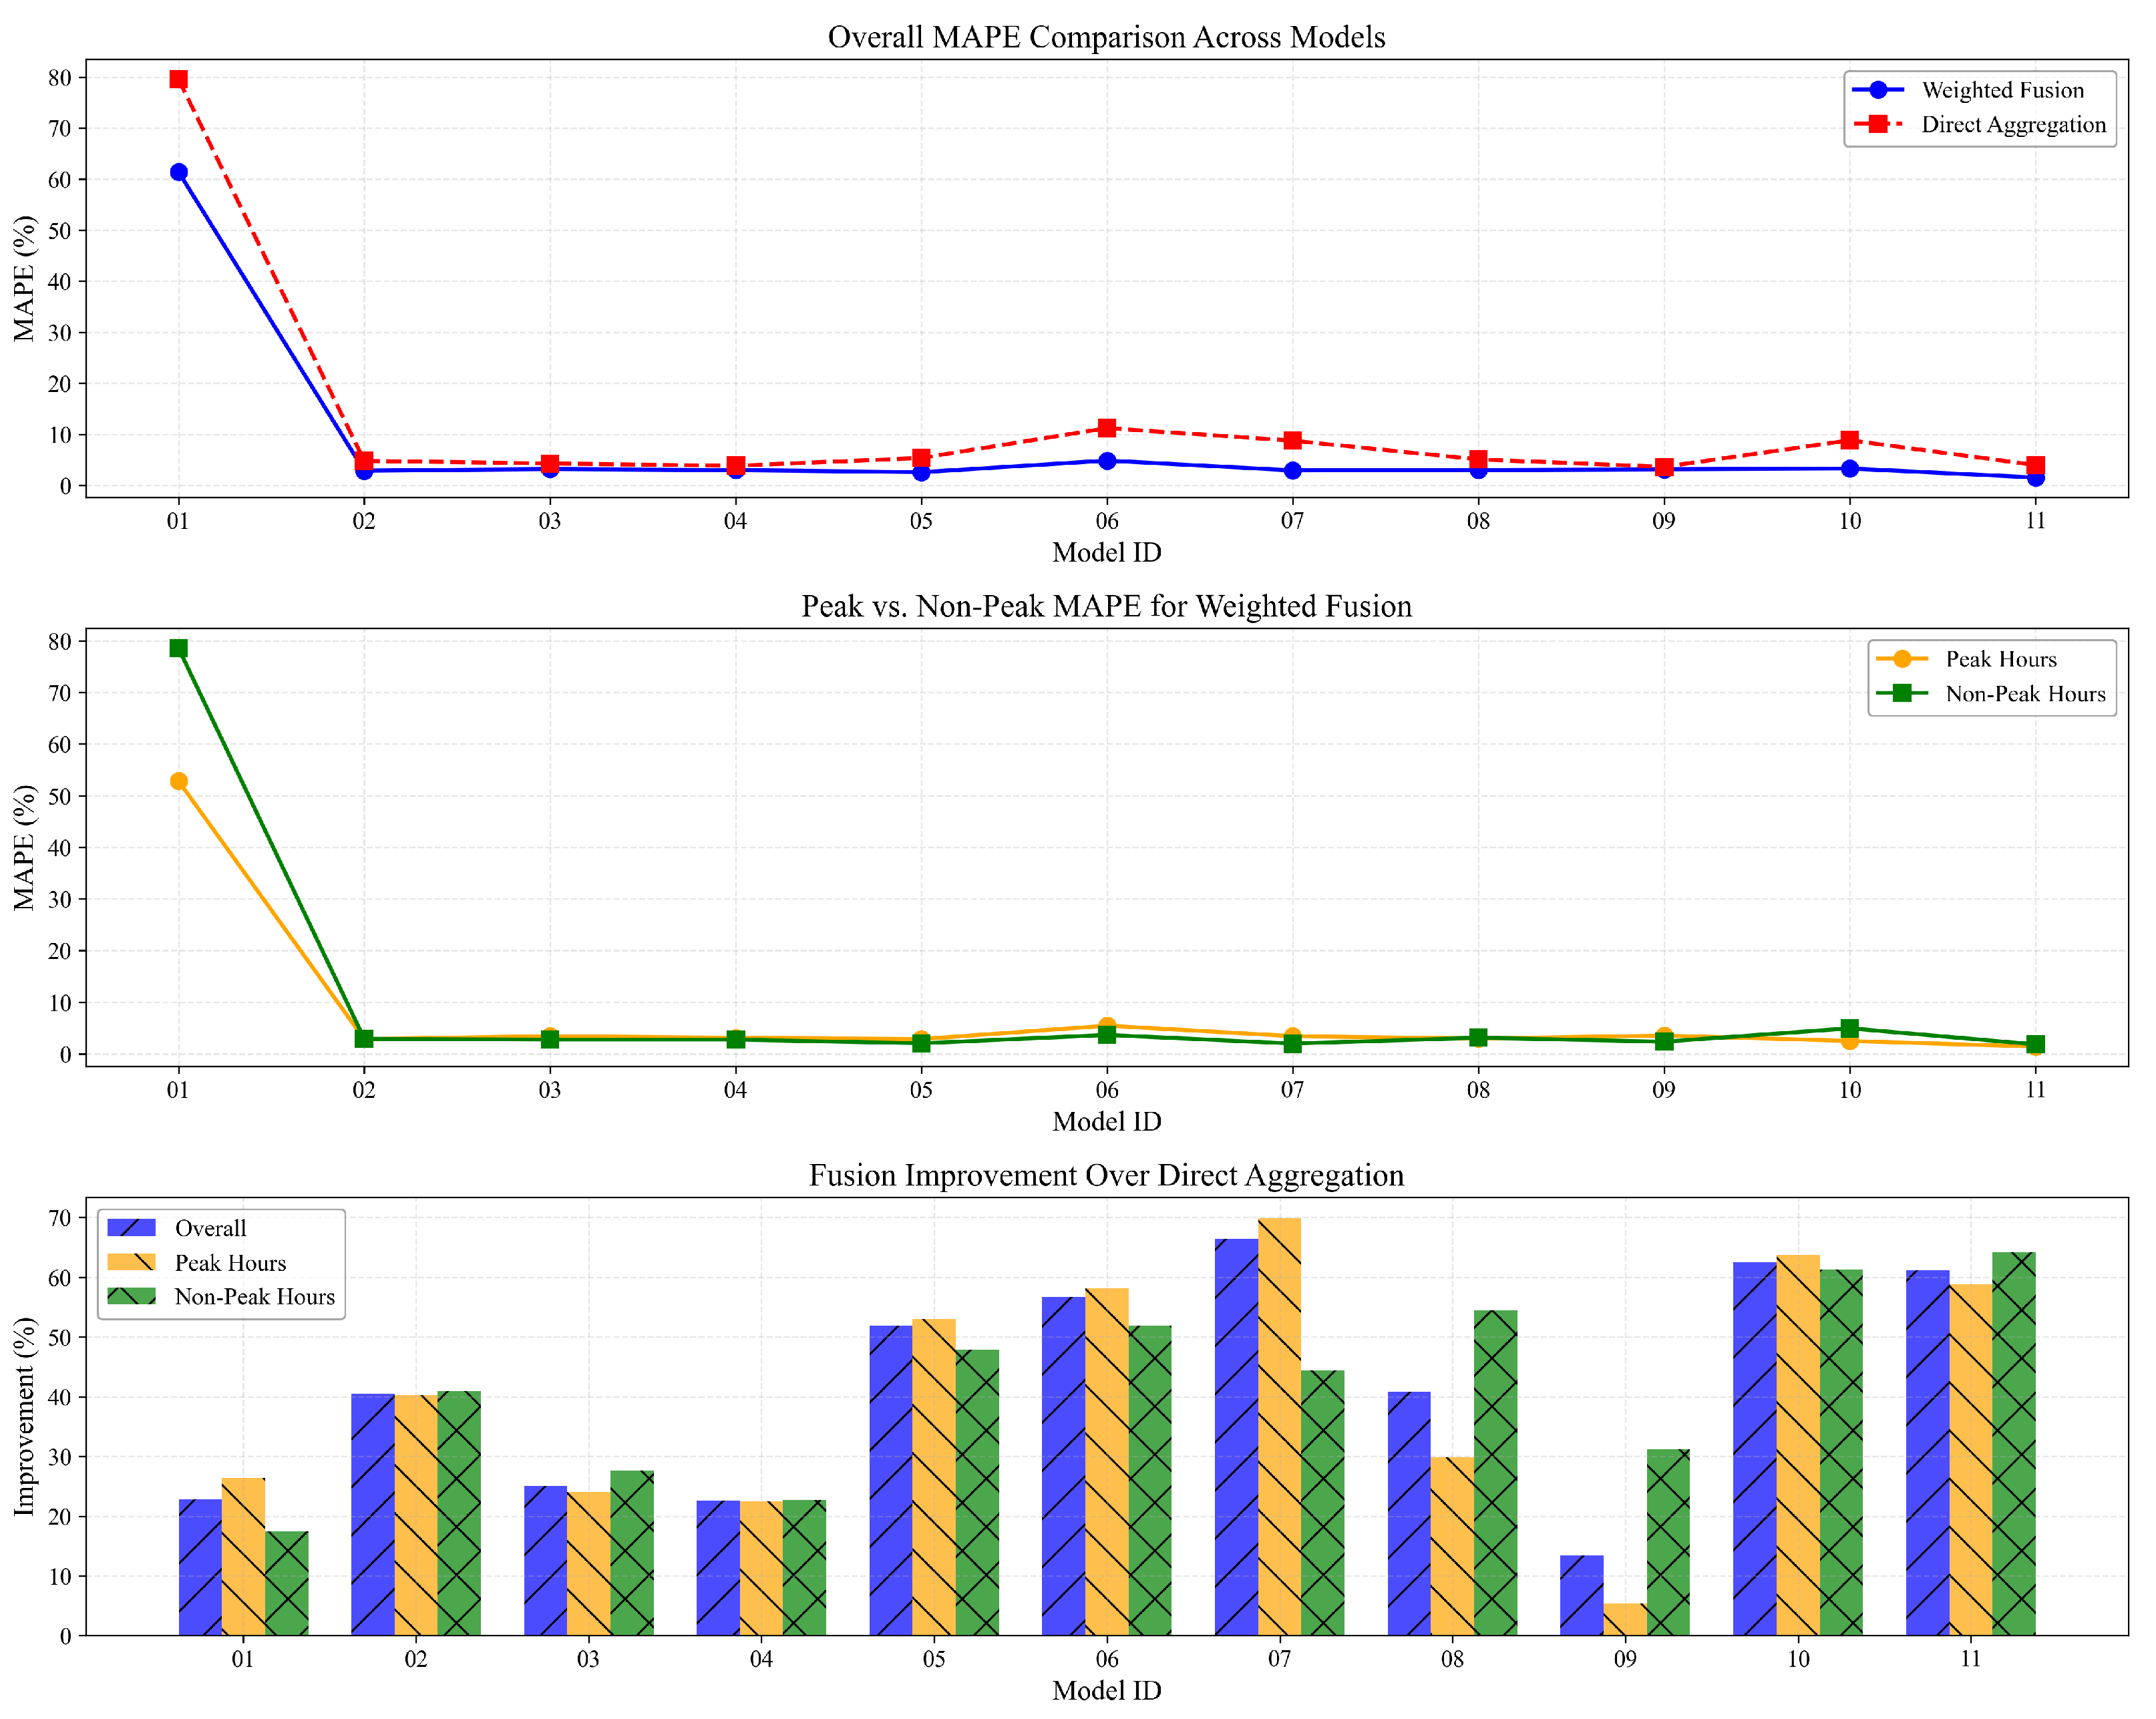
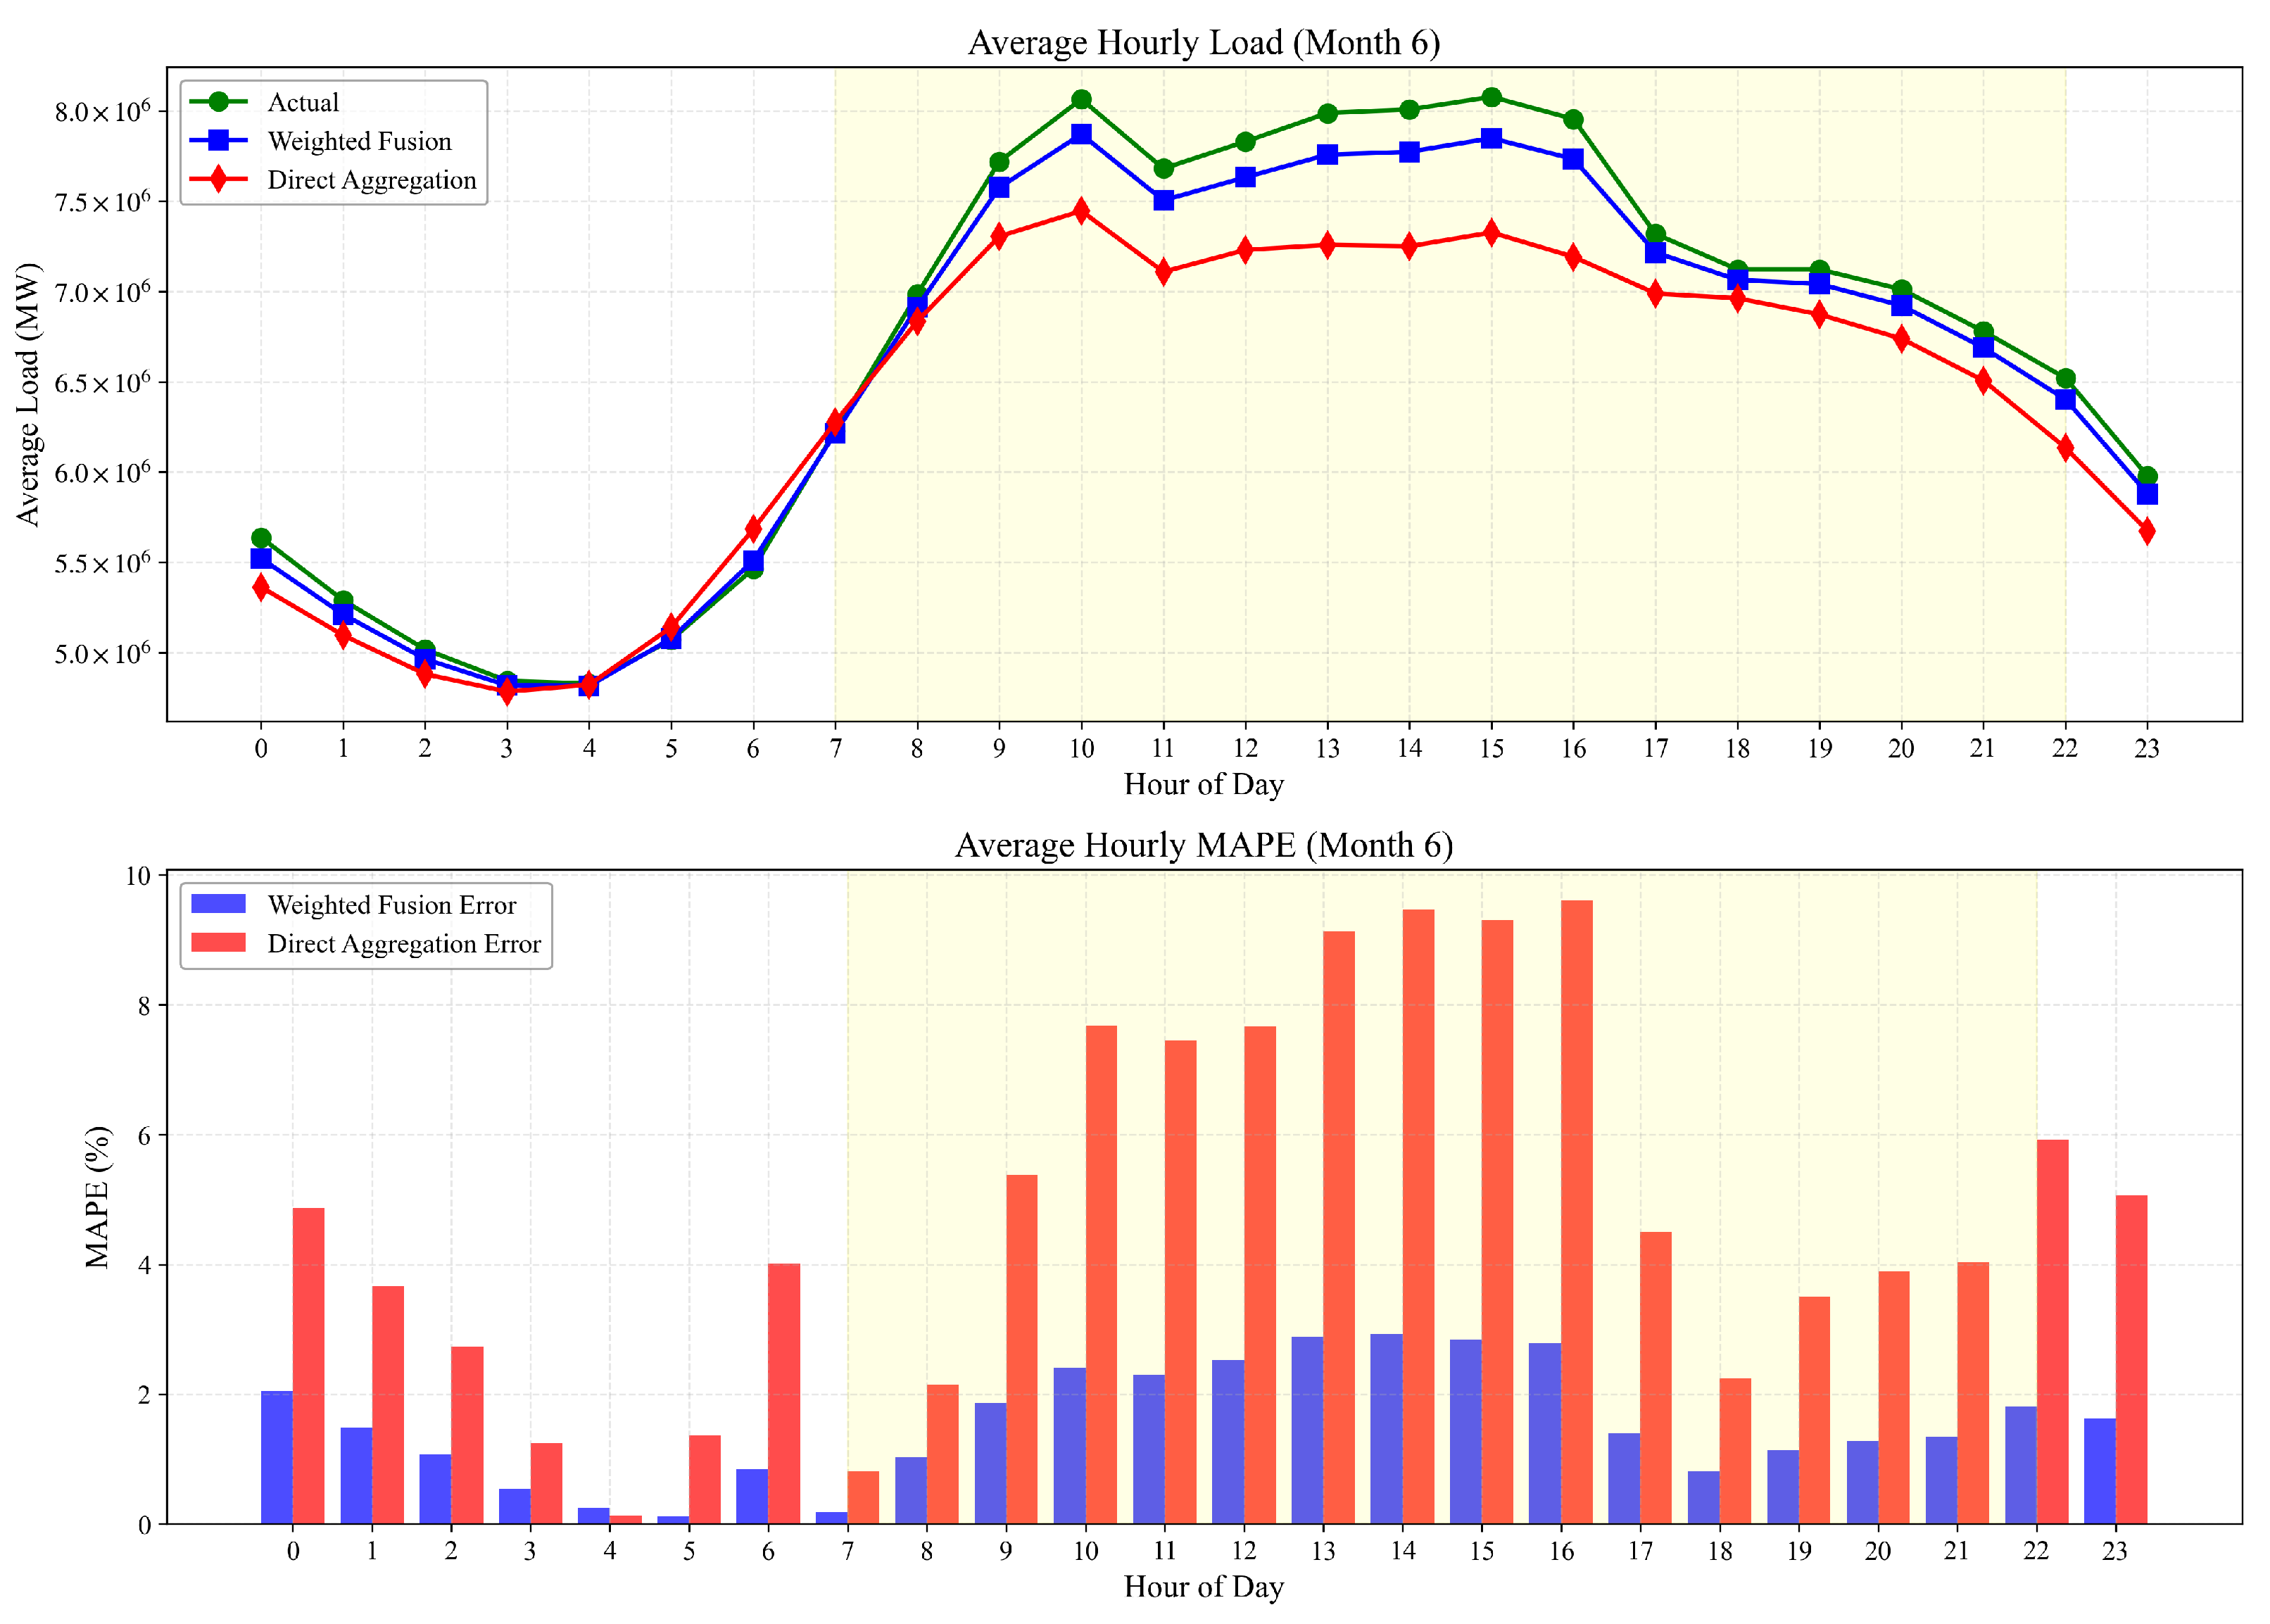
3.3.2. Moderate Condition Analysis (June 2024)
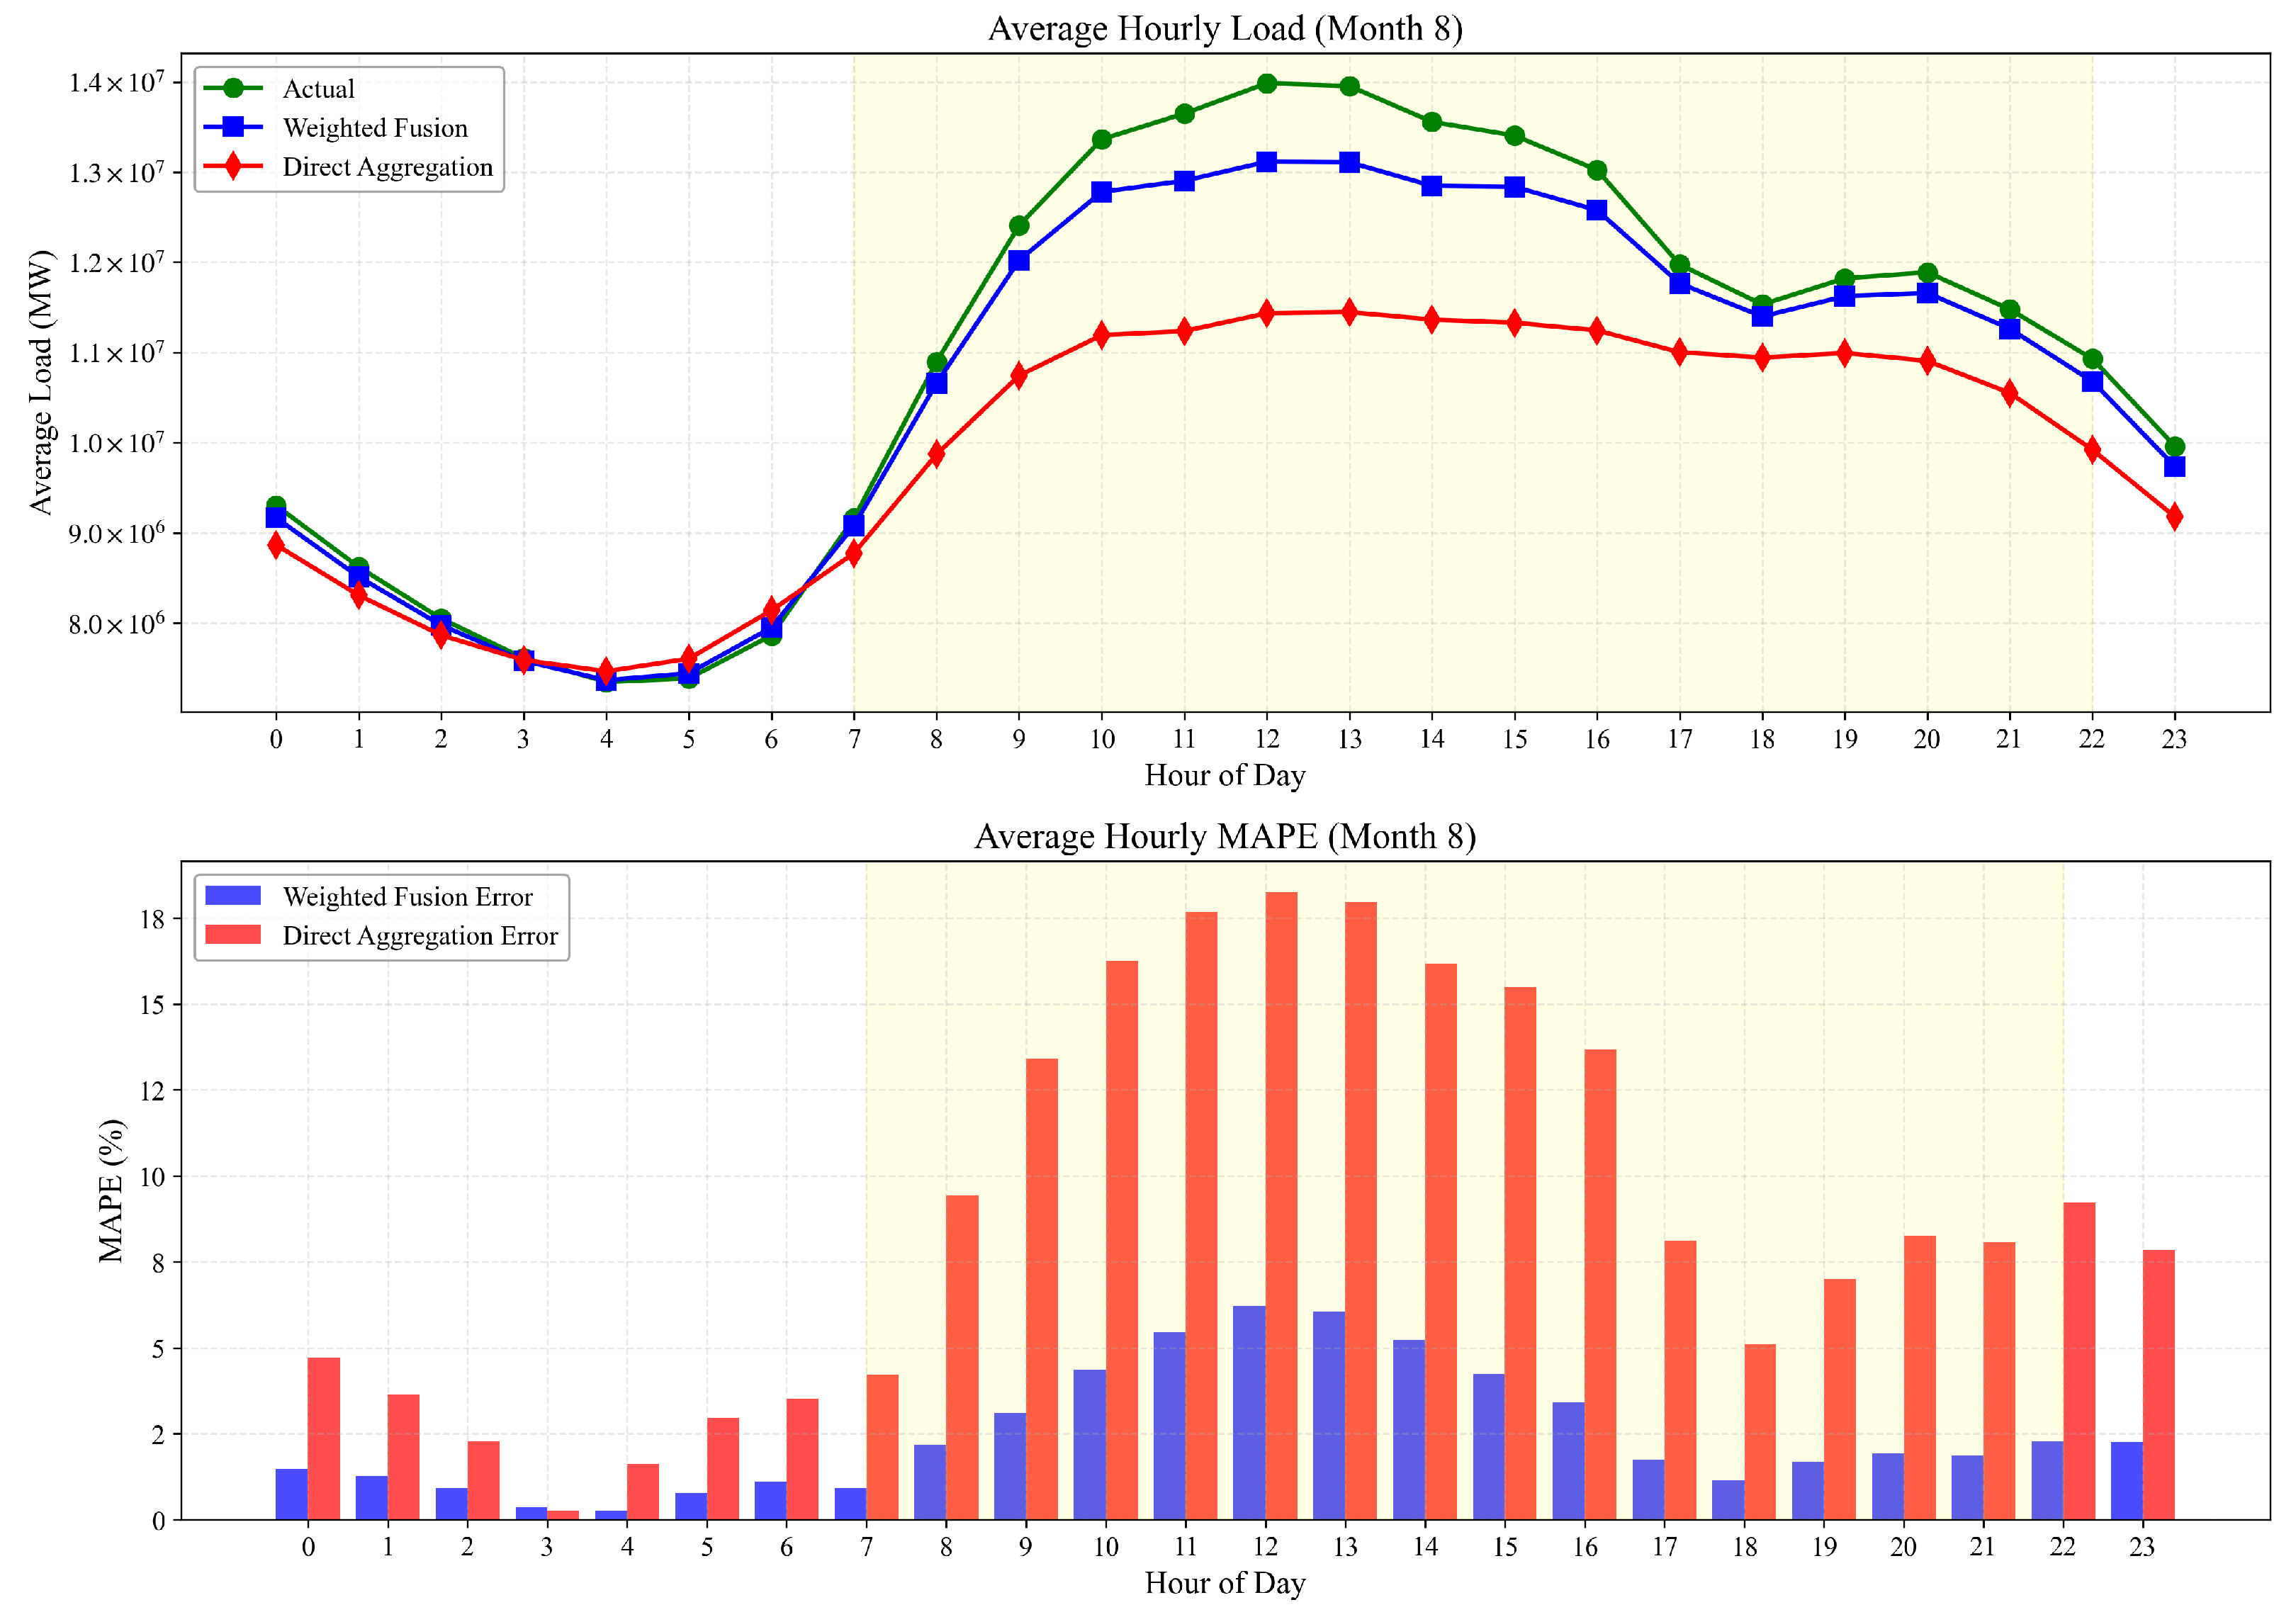
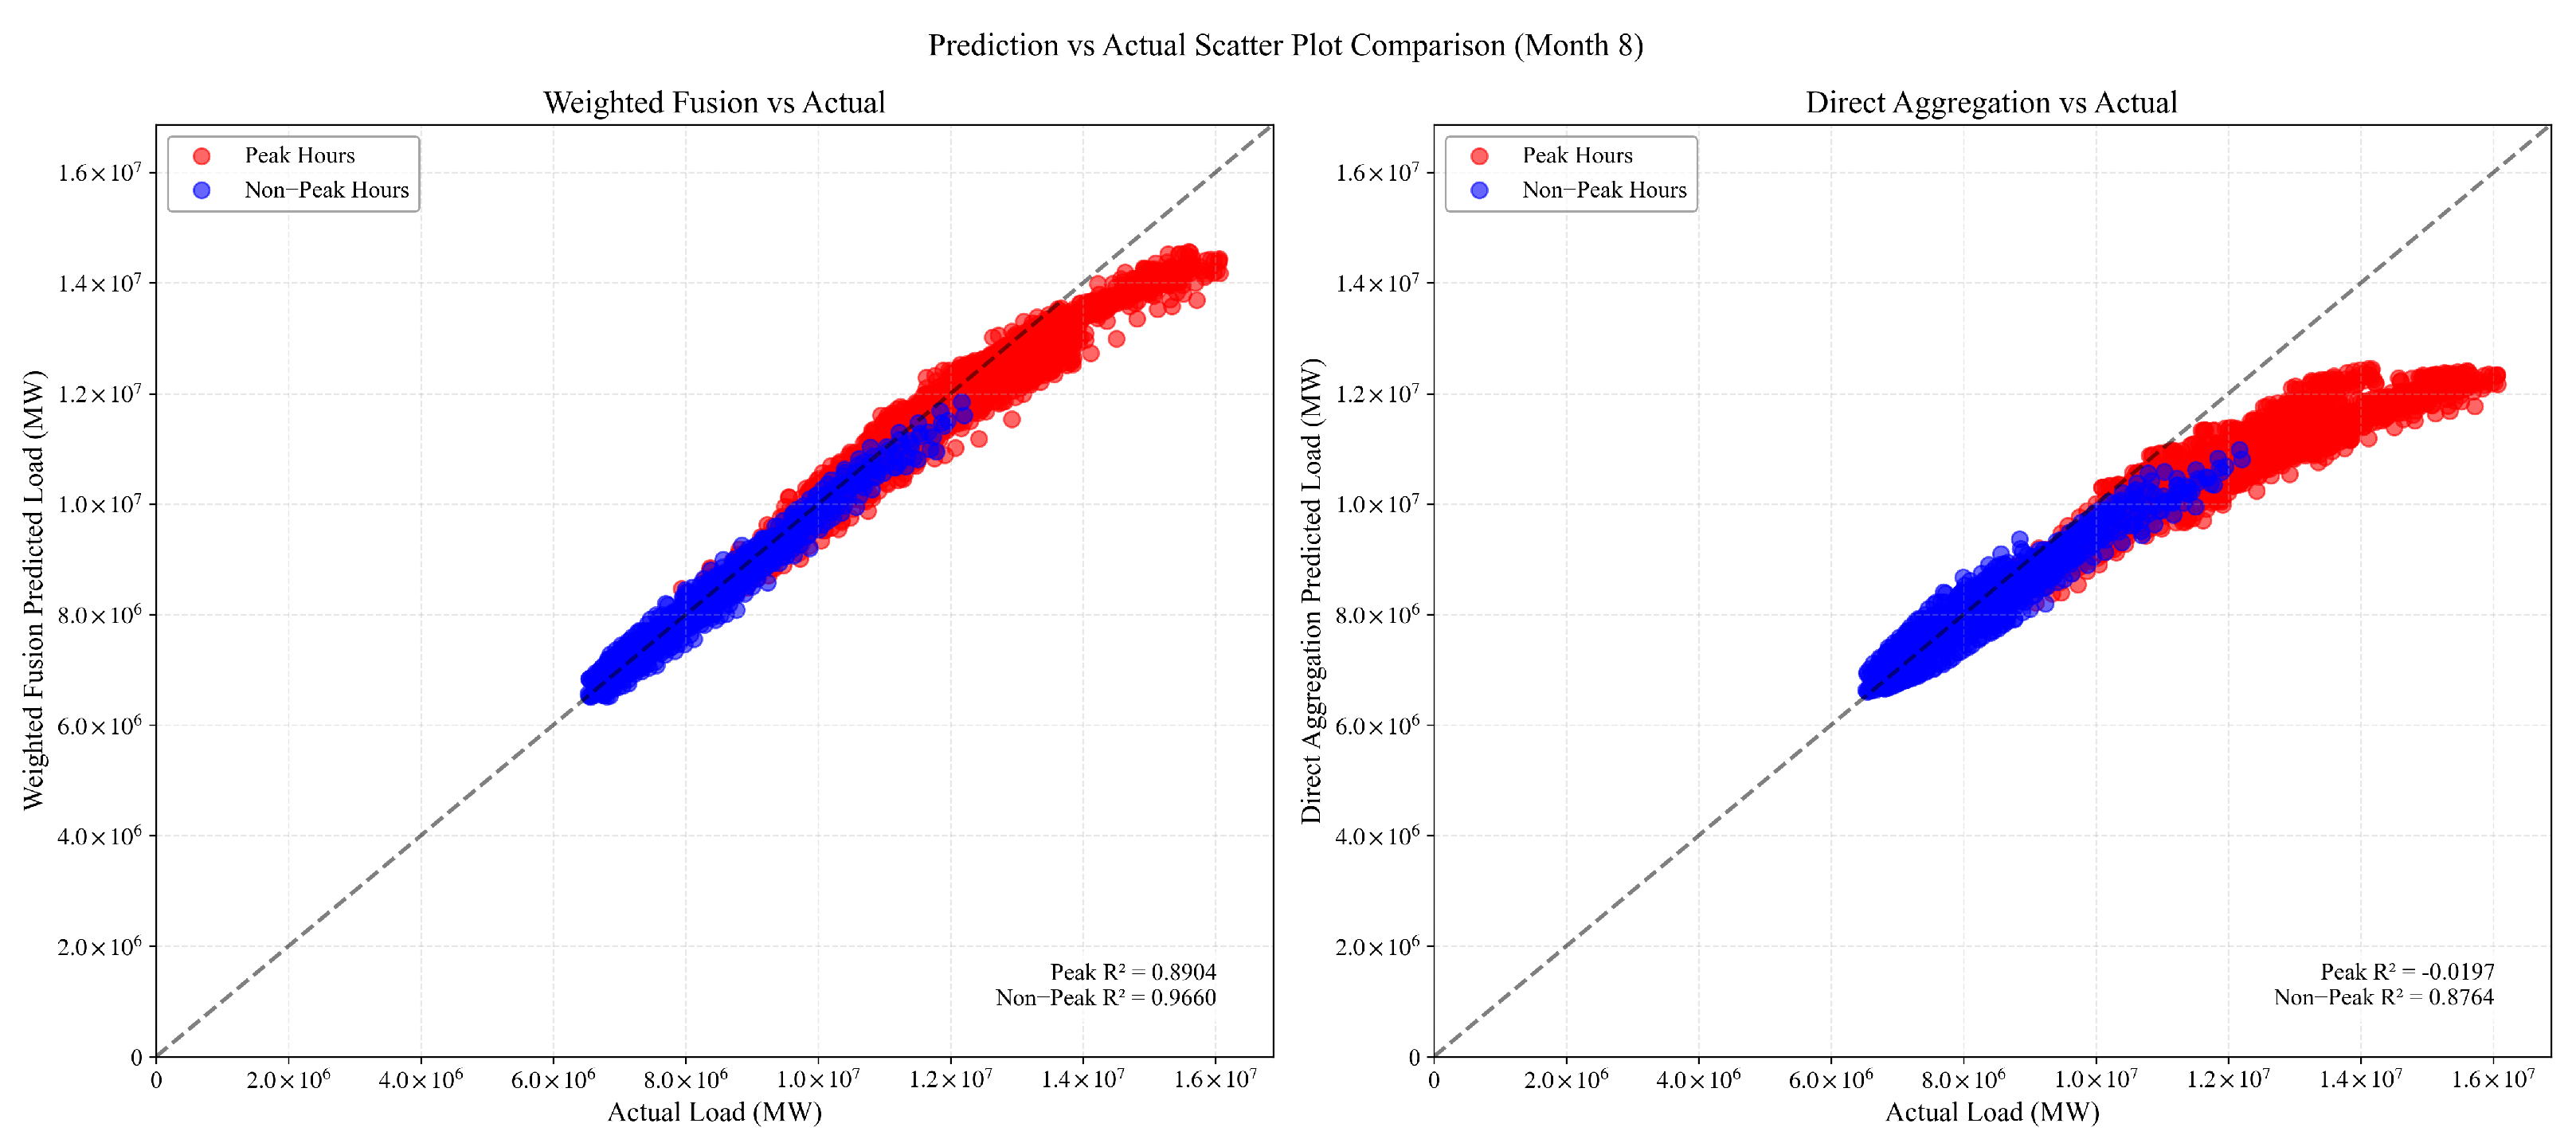
3.3.3. High-Temperature Condition Analysis (August 2024)
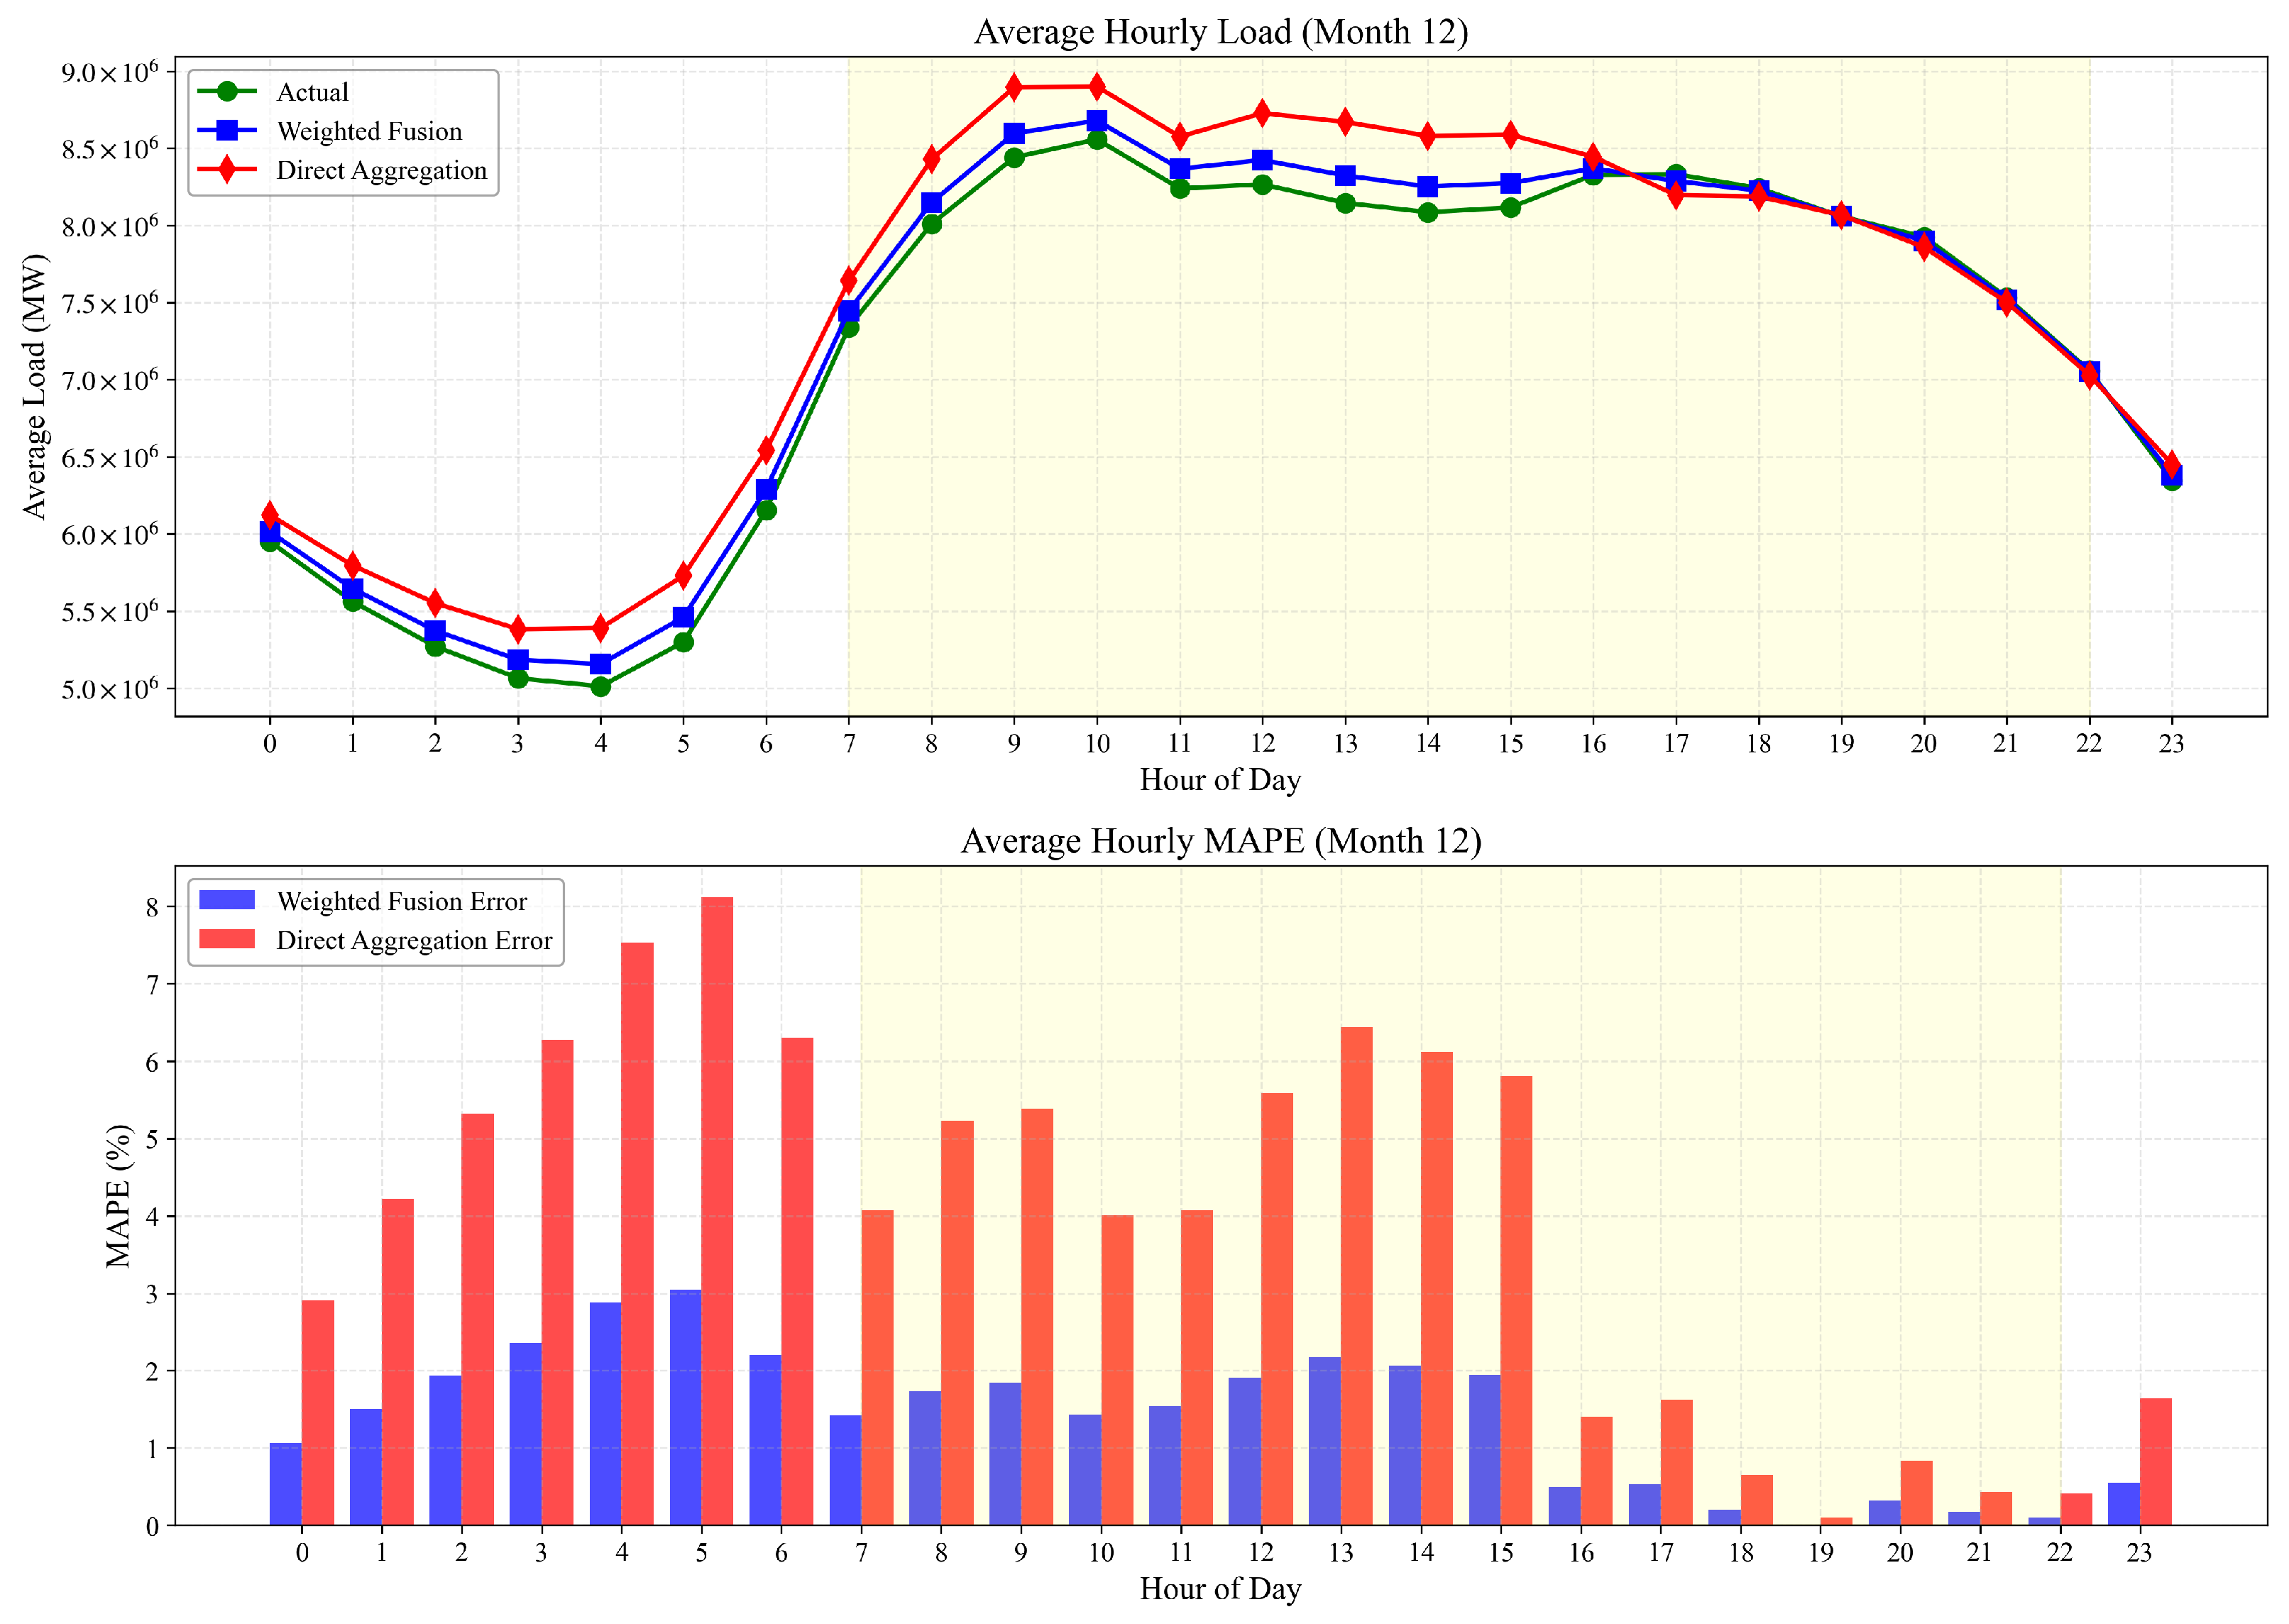
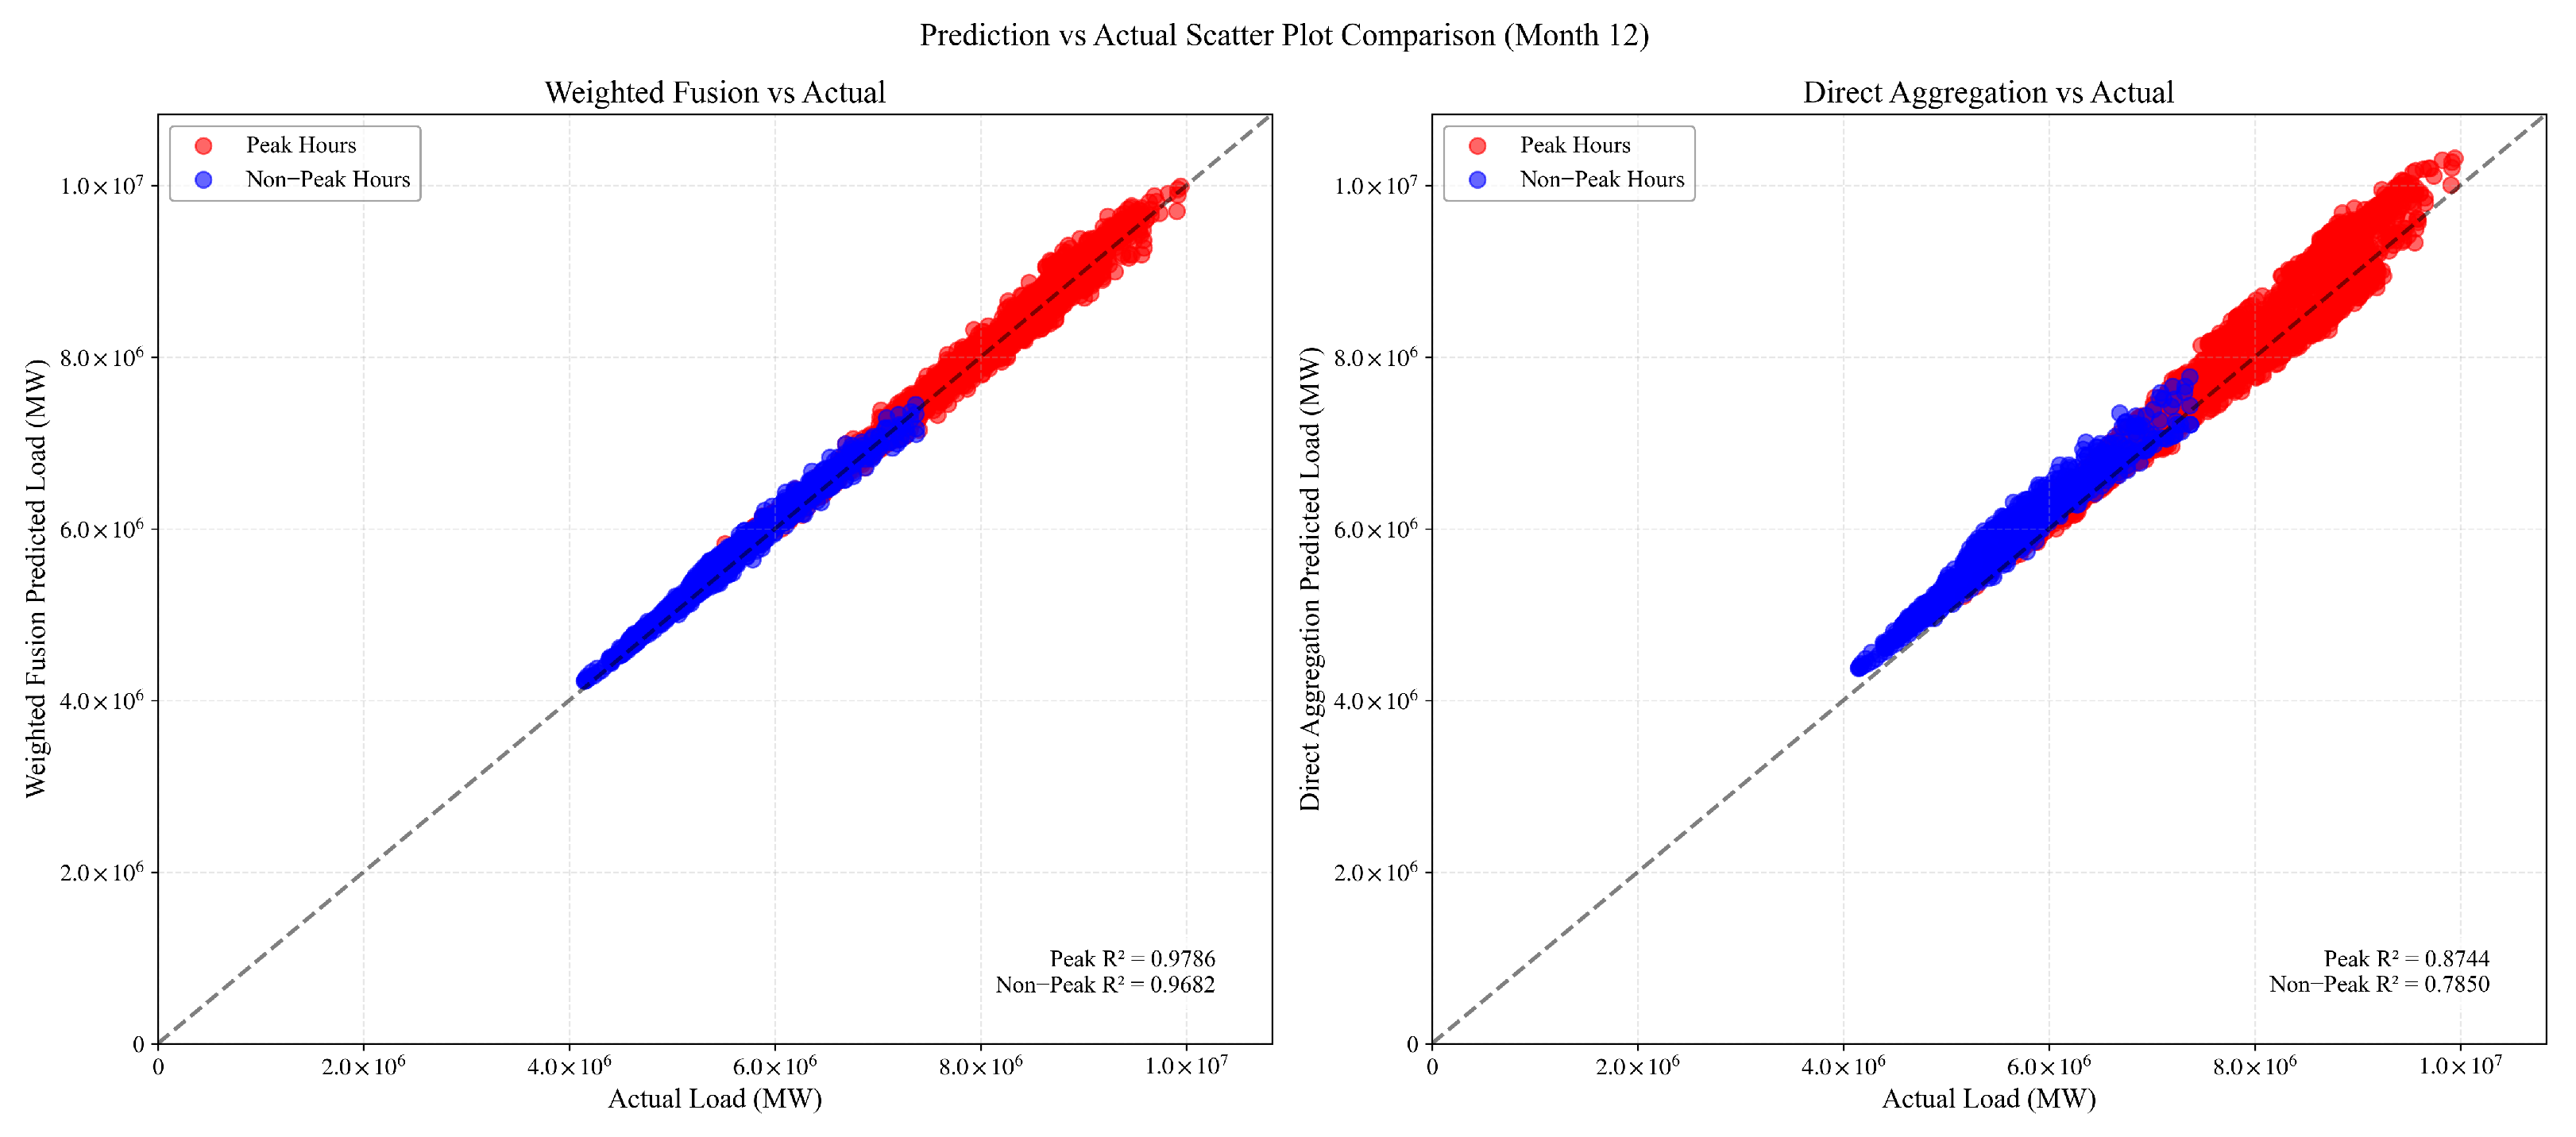
3.3.4. Winter Condition Analysis (December 2024)
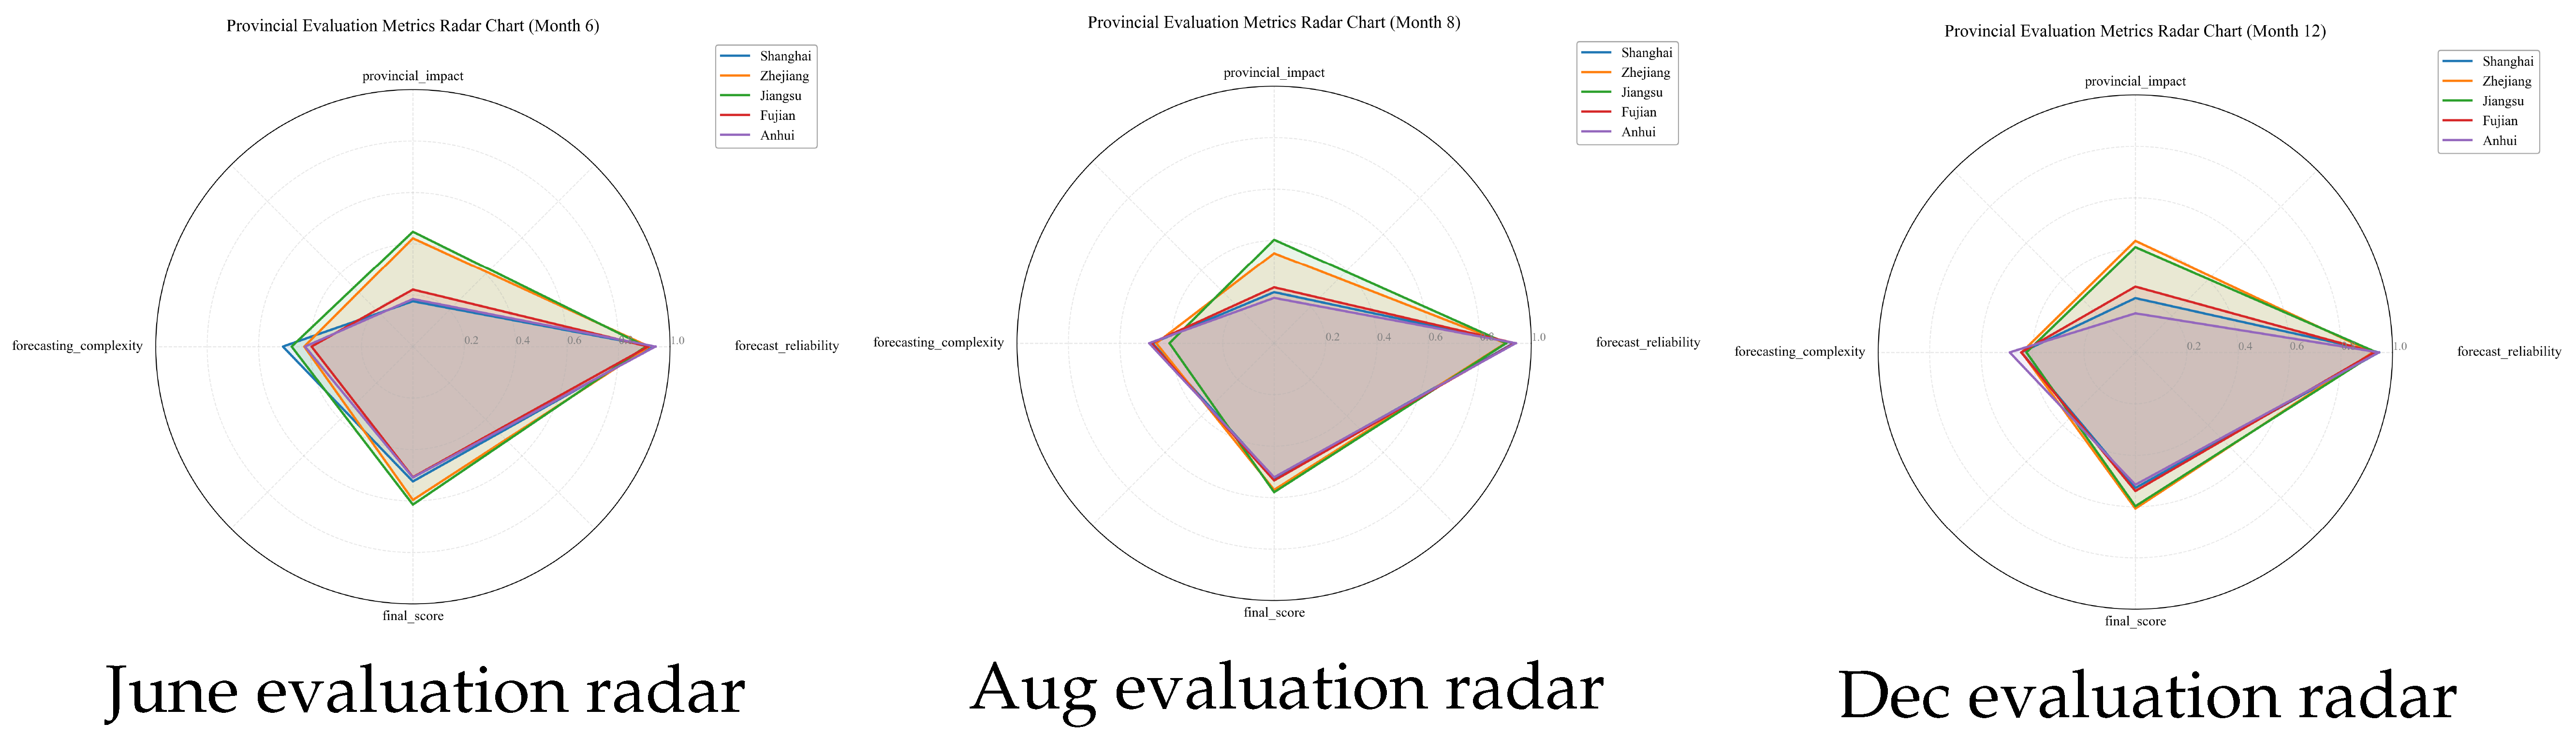
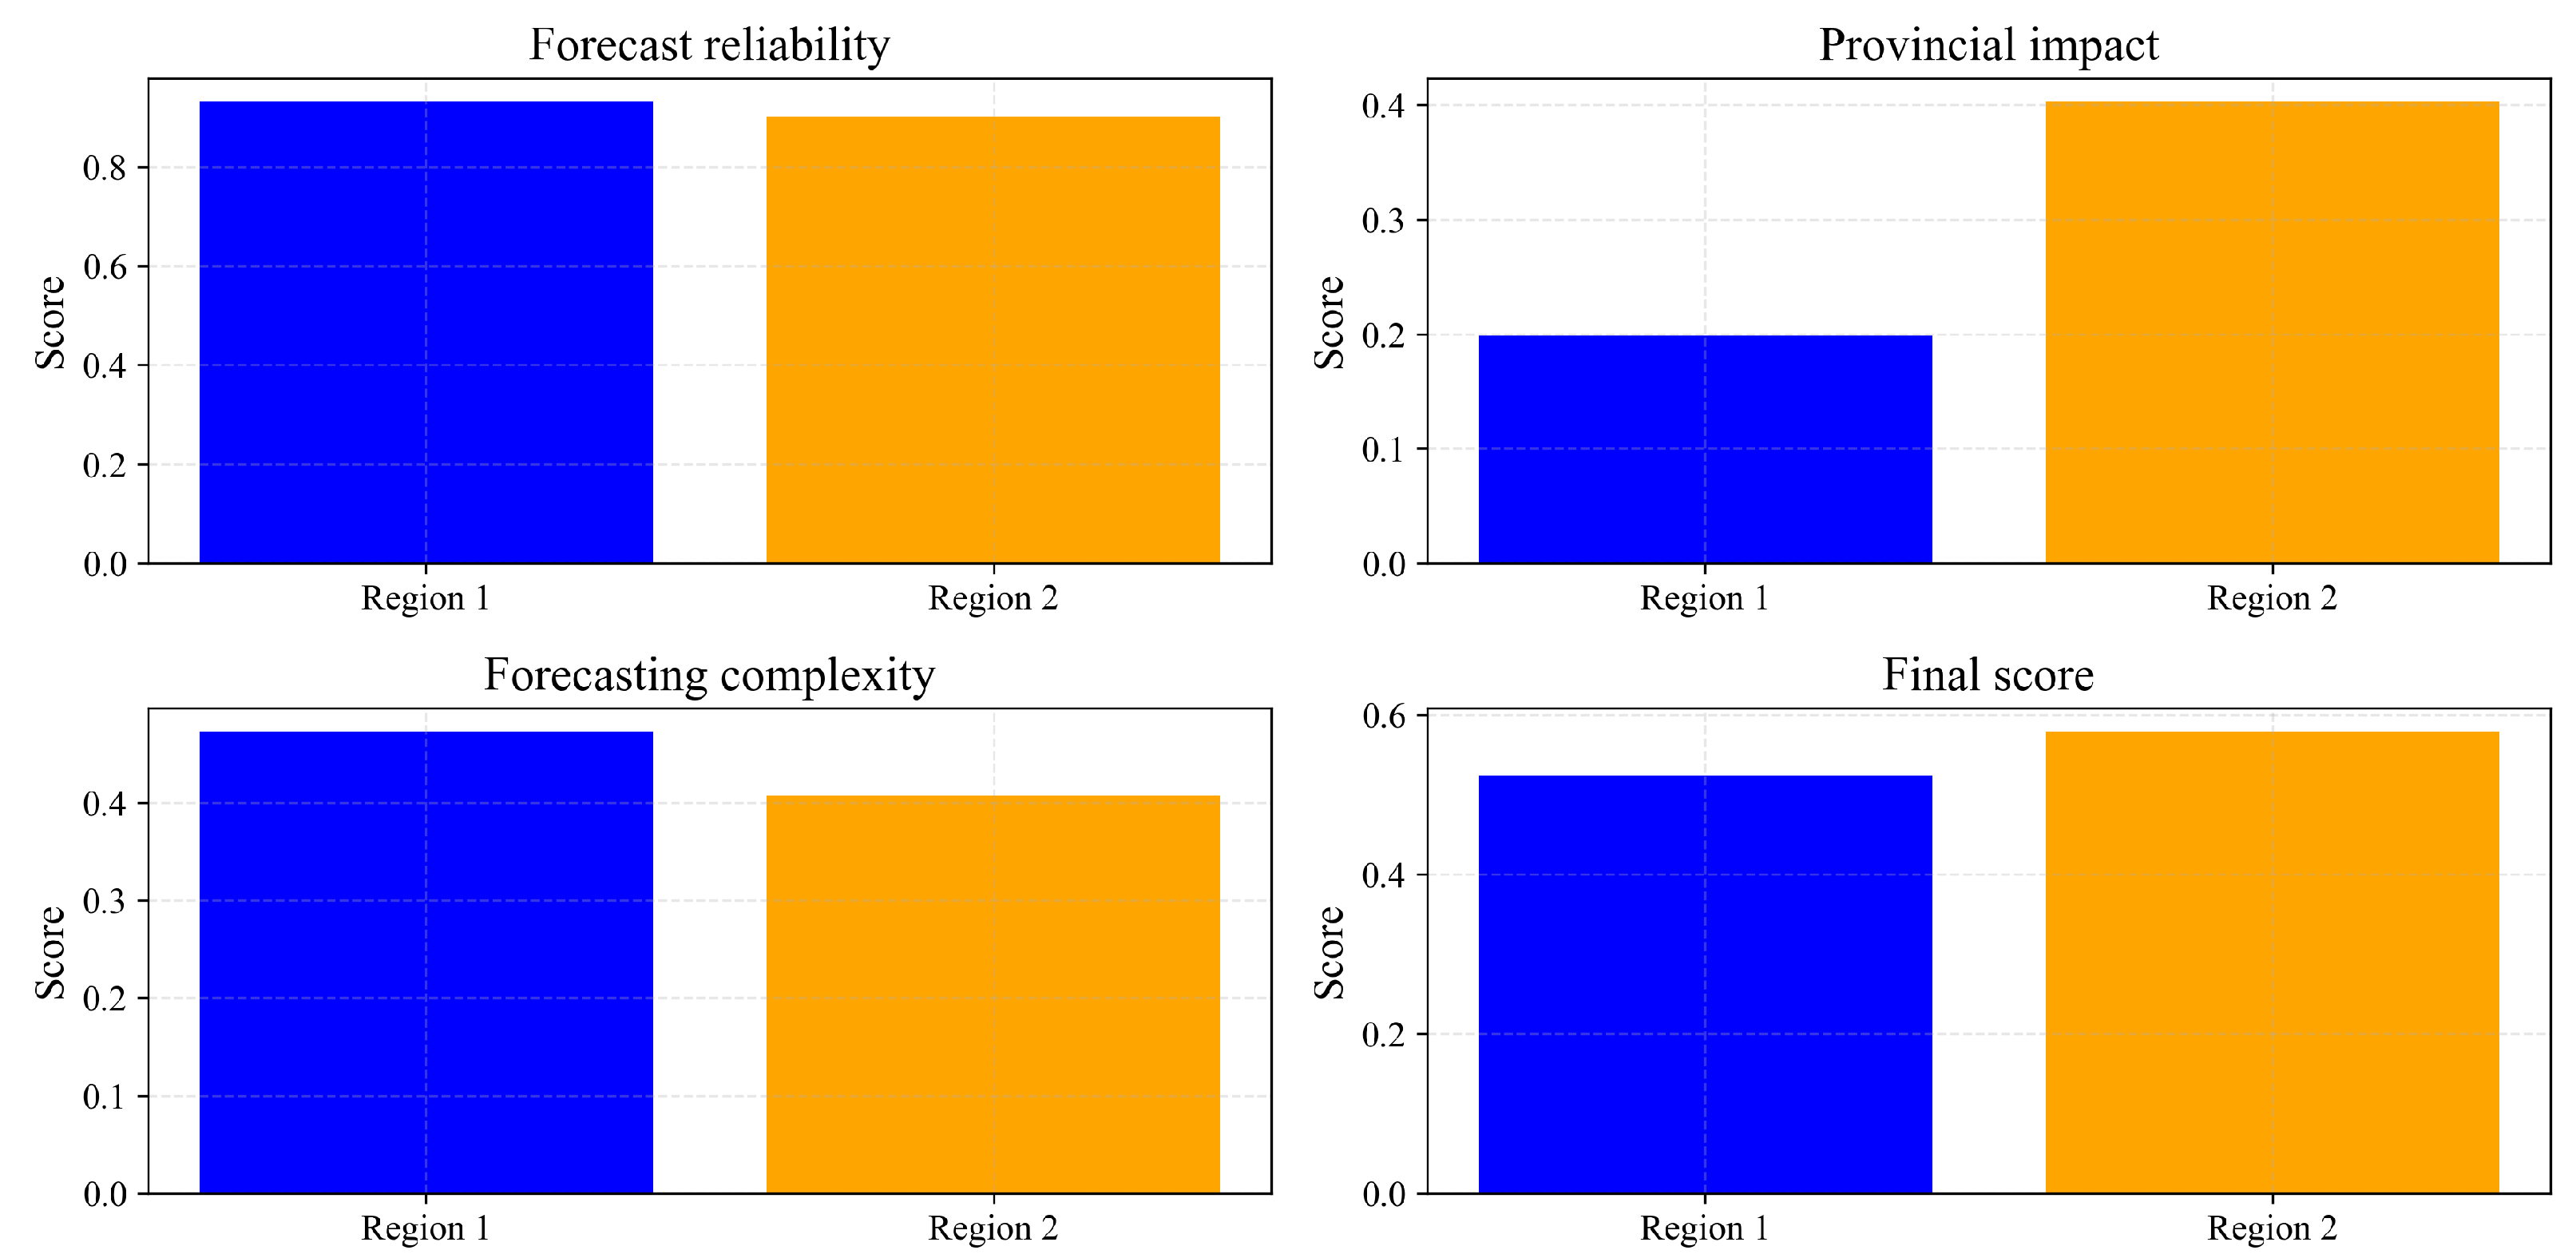
3.3.5. Provincial Evaluation Analysis
- Forecast Reliability: Jiangsu consistently demonstrated the highest forecast reliability across all three periods, followed by Zhejiang. Shanghai showed the lowest reliability in June and August but improved significantly in December.
- Provincial Impact: Jiangsu maintained the highest provincial impact on the overall grid due to its substantial industrial load. This impact remained relatively stable across seasons, whereas other provinces showed more significant seasonal variations.
- Forecasting Complexity: Anhui consistently presented the lowest forecasting complexity, while Shanghai demonstrated the highest complexity during summer months, reflecting its sensitivity to cooling demand in its predominantly urban environment.
3.3.6. Computational Efficiency Analysis
3.3.7. Summary of Performance Improvements
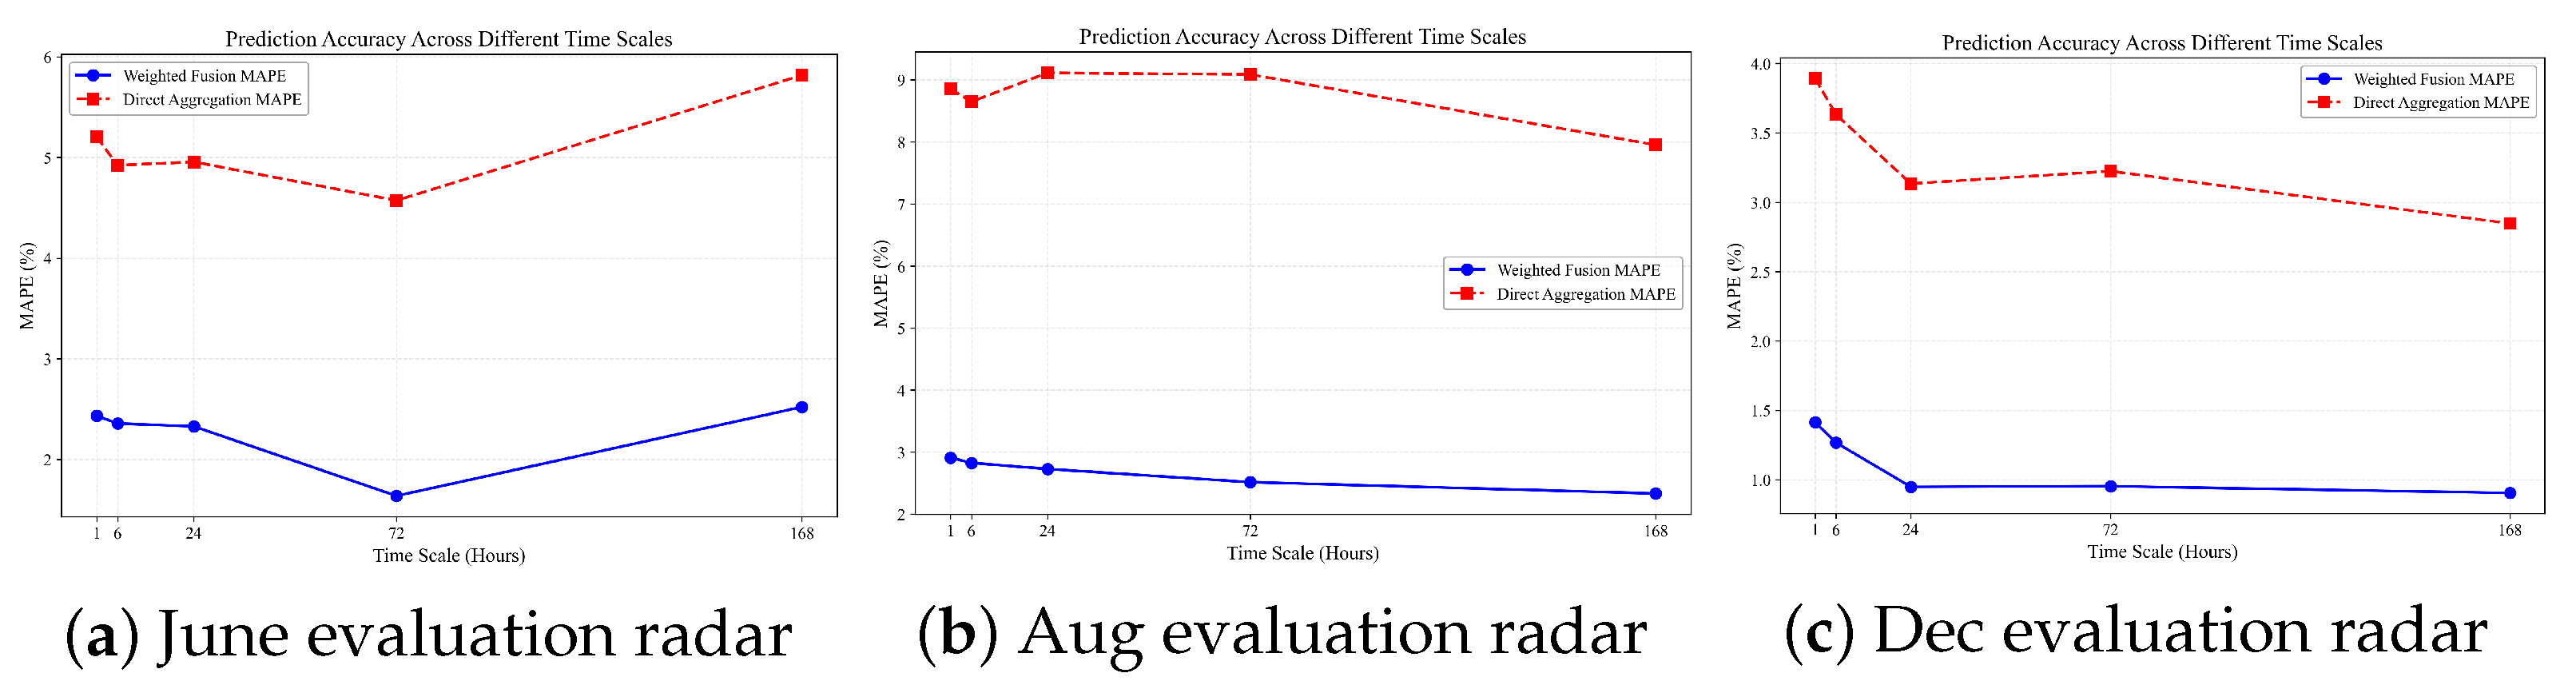
3.4. Multi-Temporal Scale Analysis
- Seasonal Differentiation: The performance advantage of weighted fusion is most pronounced during extreme temperature conditions (August), moderately significant during mild conditions (June), and least pronounced (though still substantial) during winter conditions (December).
- Temporal Resilience: The weighted fusion methodology demonstrates remarkable resilience to extended forecasting horizons. While conventional forecasting methods typically show degrading performance as the prediction horizon extends, our approach maintains relatively stable MAPE values even at the 168 h horizon. This suggests that by effectively balancing provincial forecasts based on their demonstrated reliability, our methodology successfully preserves long-term forecasting accuracy.
- Operational Implications: The superior performance of weighted fusion at very short horizons (1–6 h) has particularly significant operational implications for grid dispatch centers. These ultra-short-term forecasts directly inform real-time operational decisions, making the substantial accuracy improvements (approximately 60–70% error reduction in comparison with direct aggregation) critically valuable for maintaining grid stability and economic operation.
3.5. Relationship Between Evaluation Indicators and Forecasting Performance
3.5.1. Comparative Analysis of Regional Evaluation Indicators
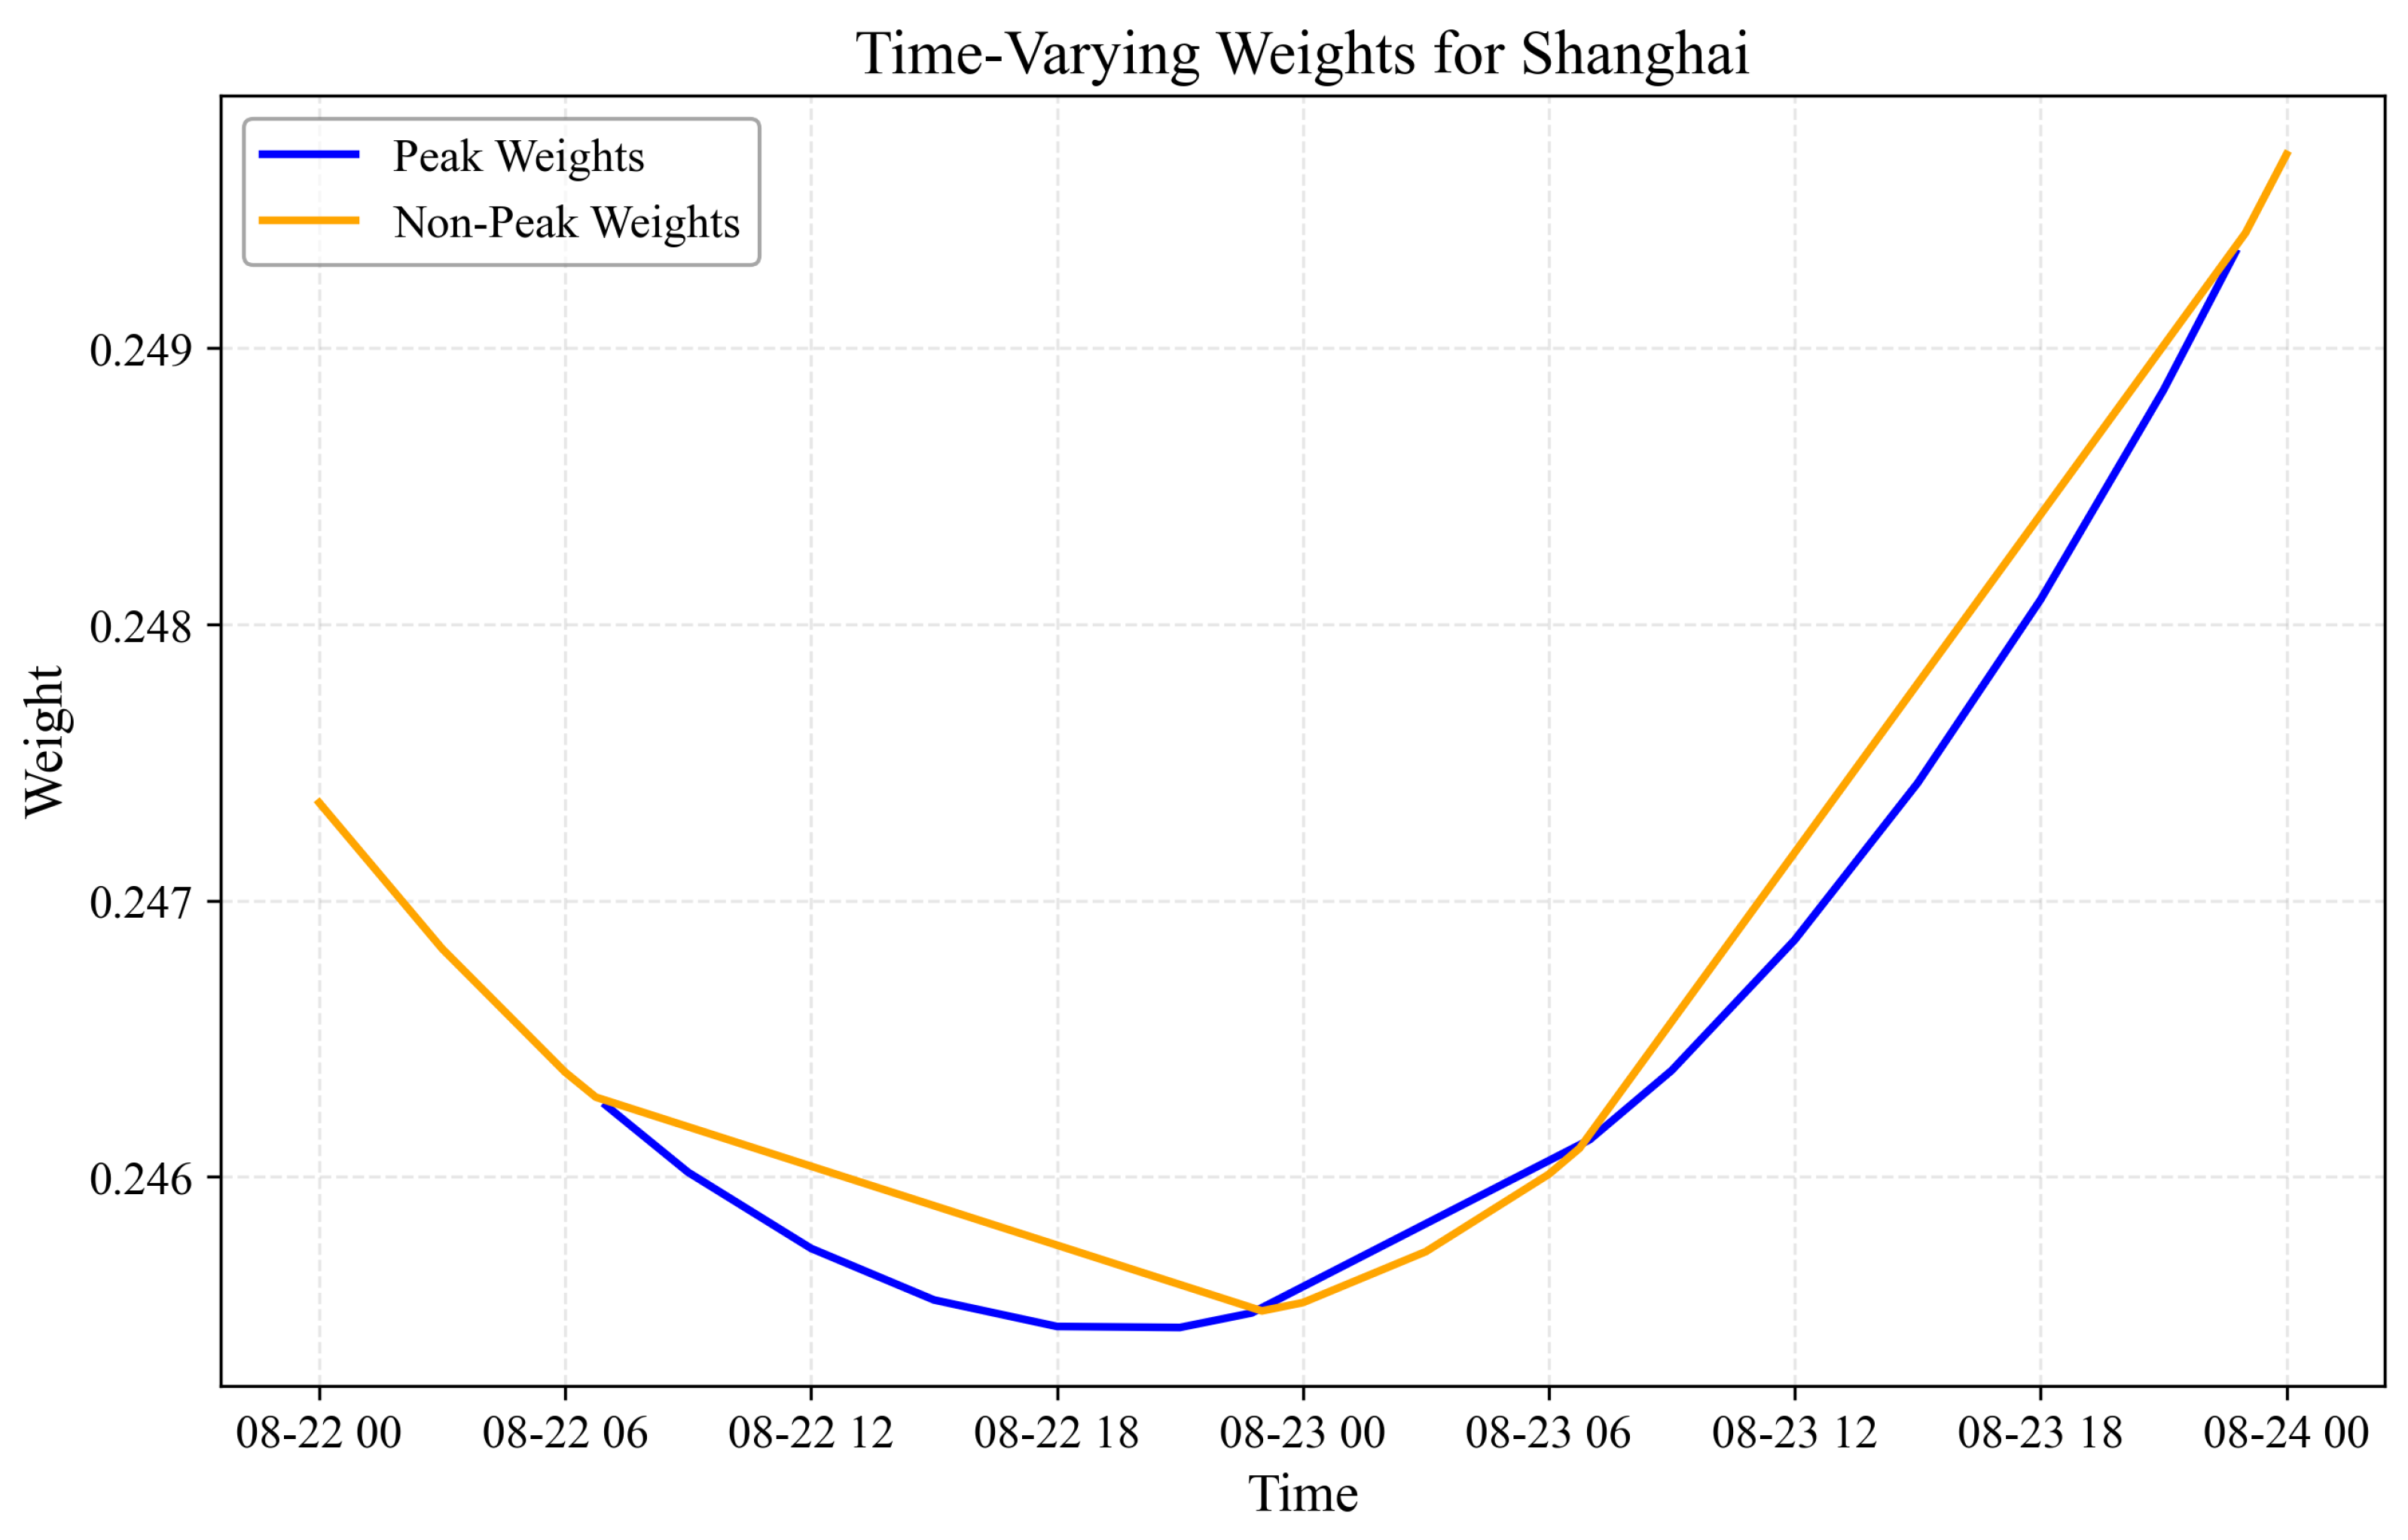
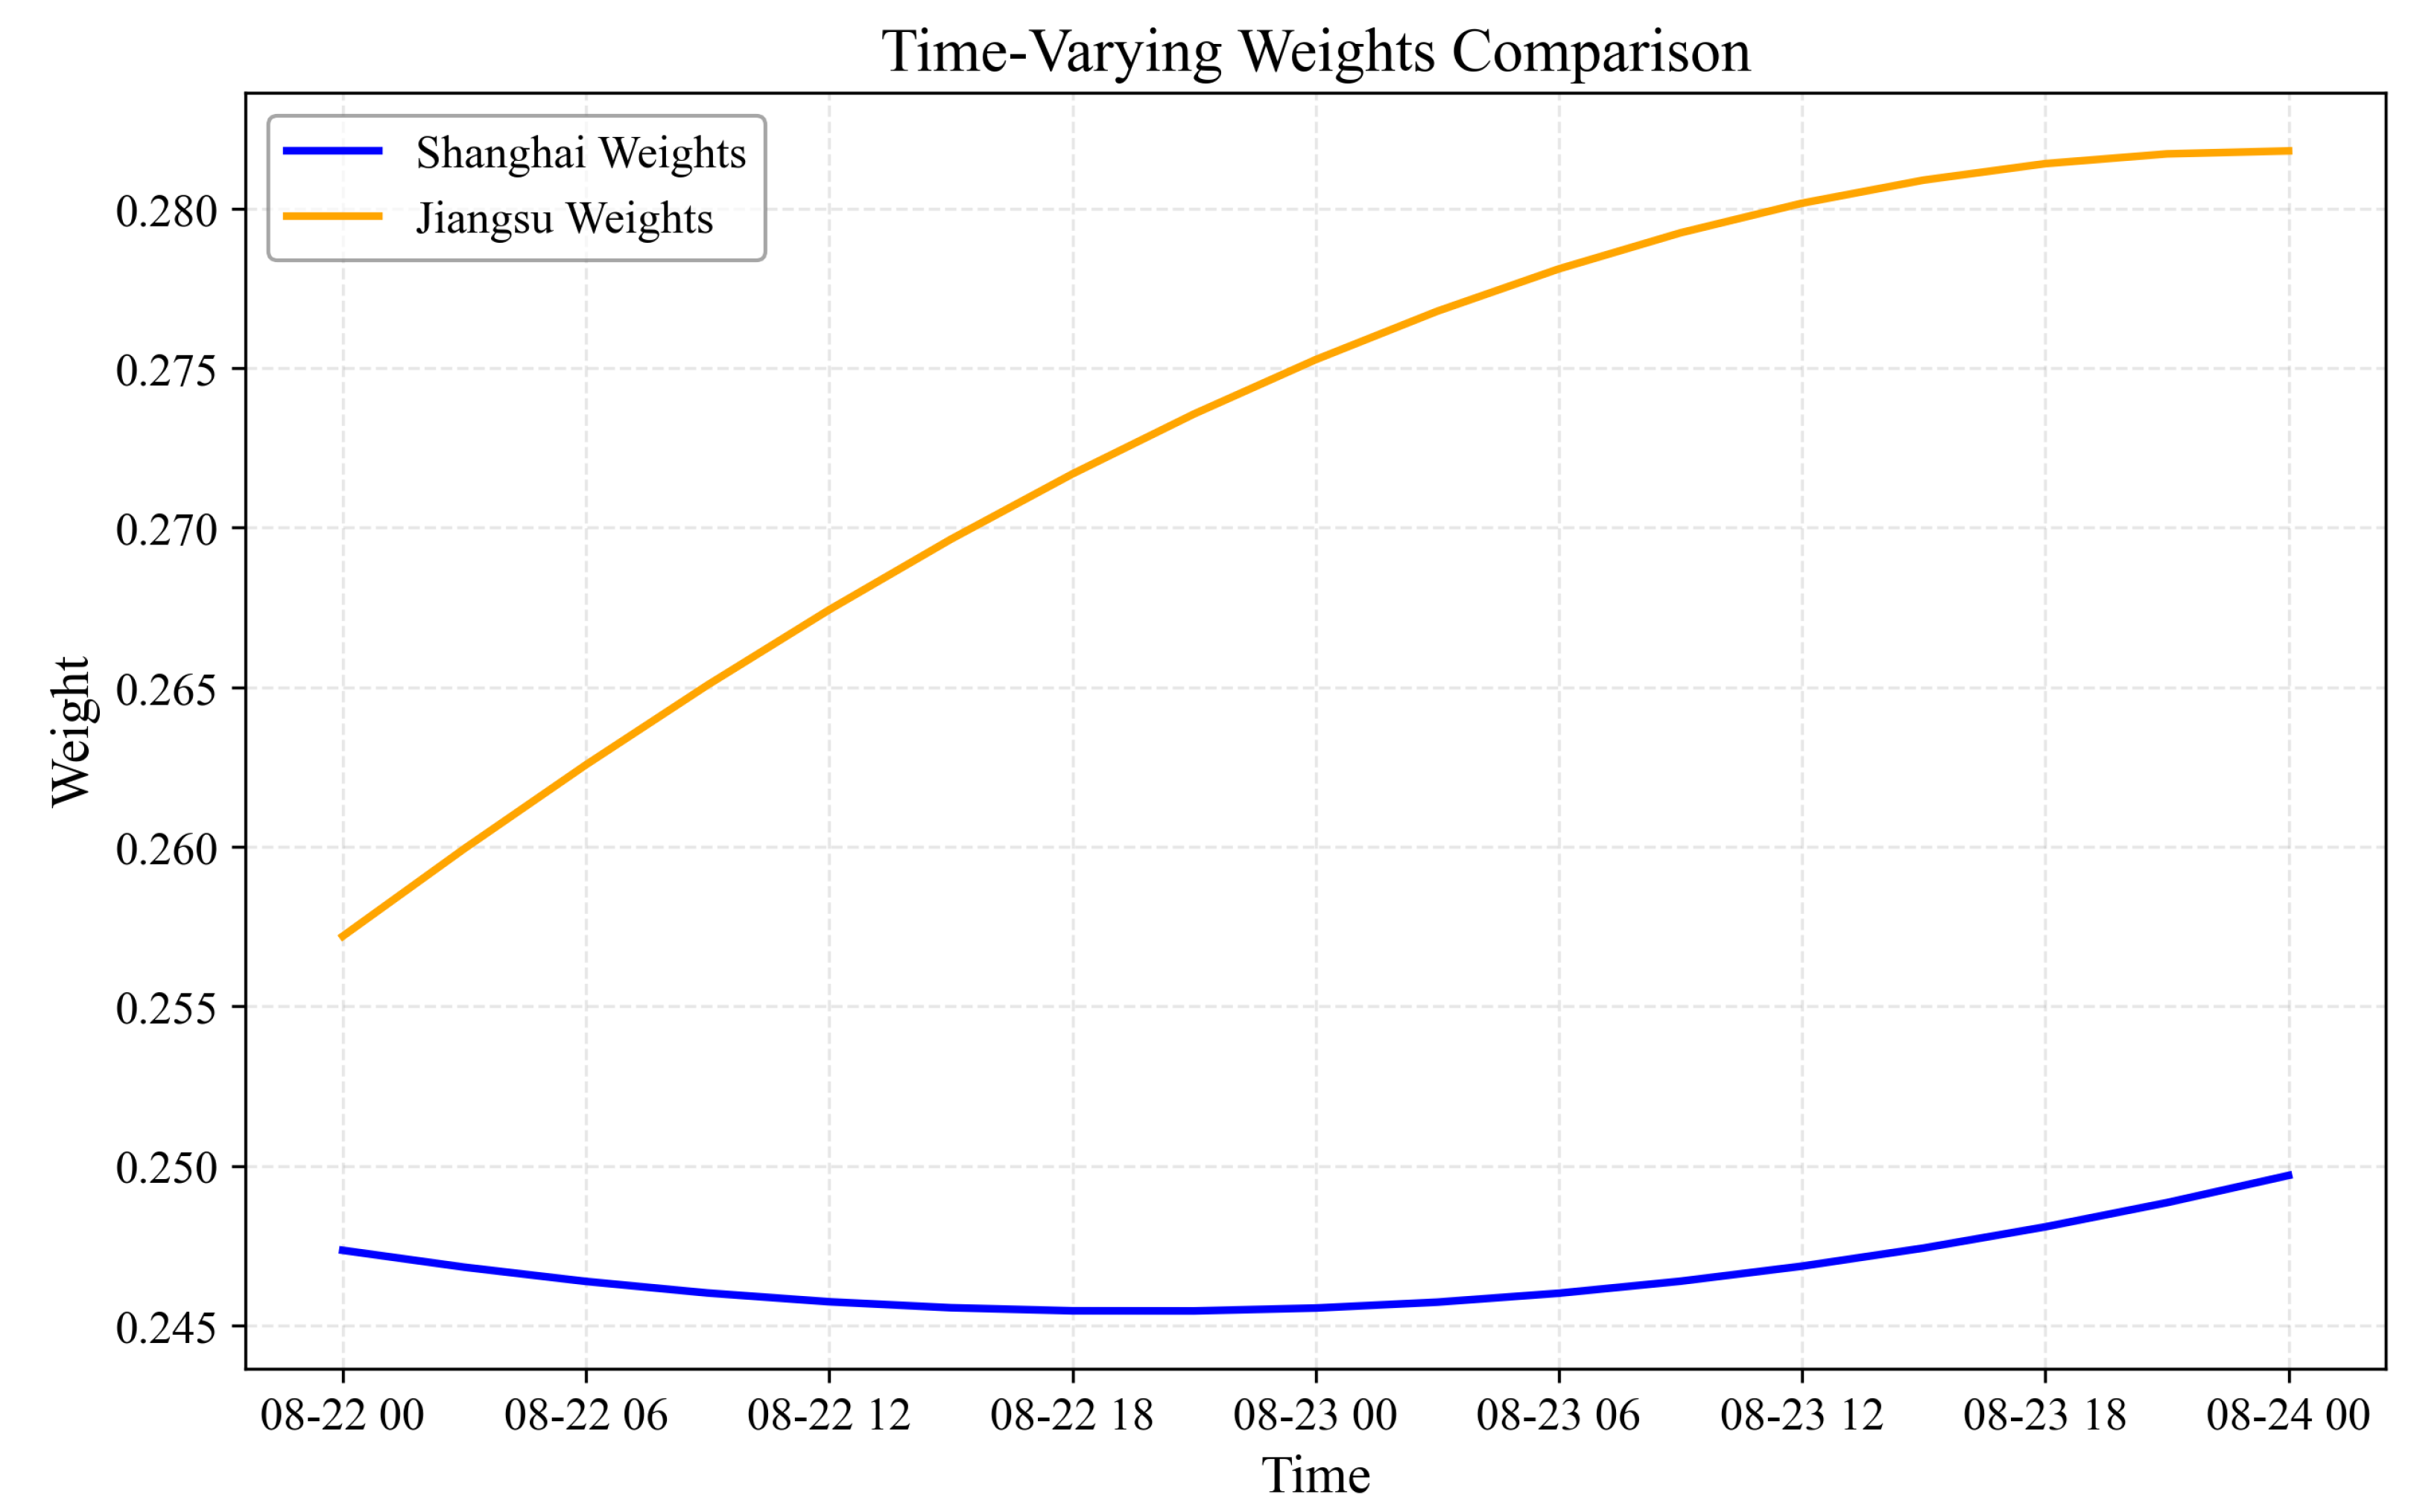
3.5.2. Time-Varying Weight Dynamics
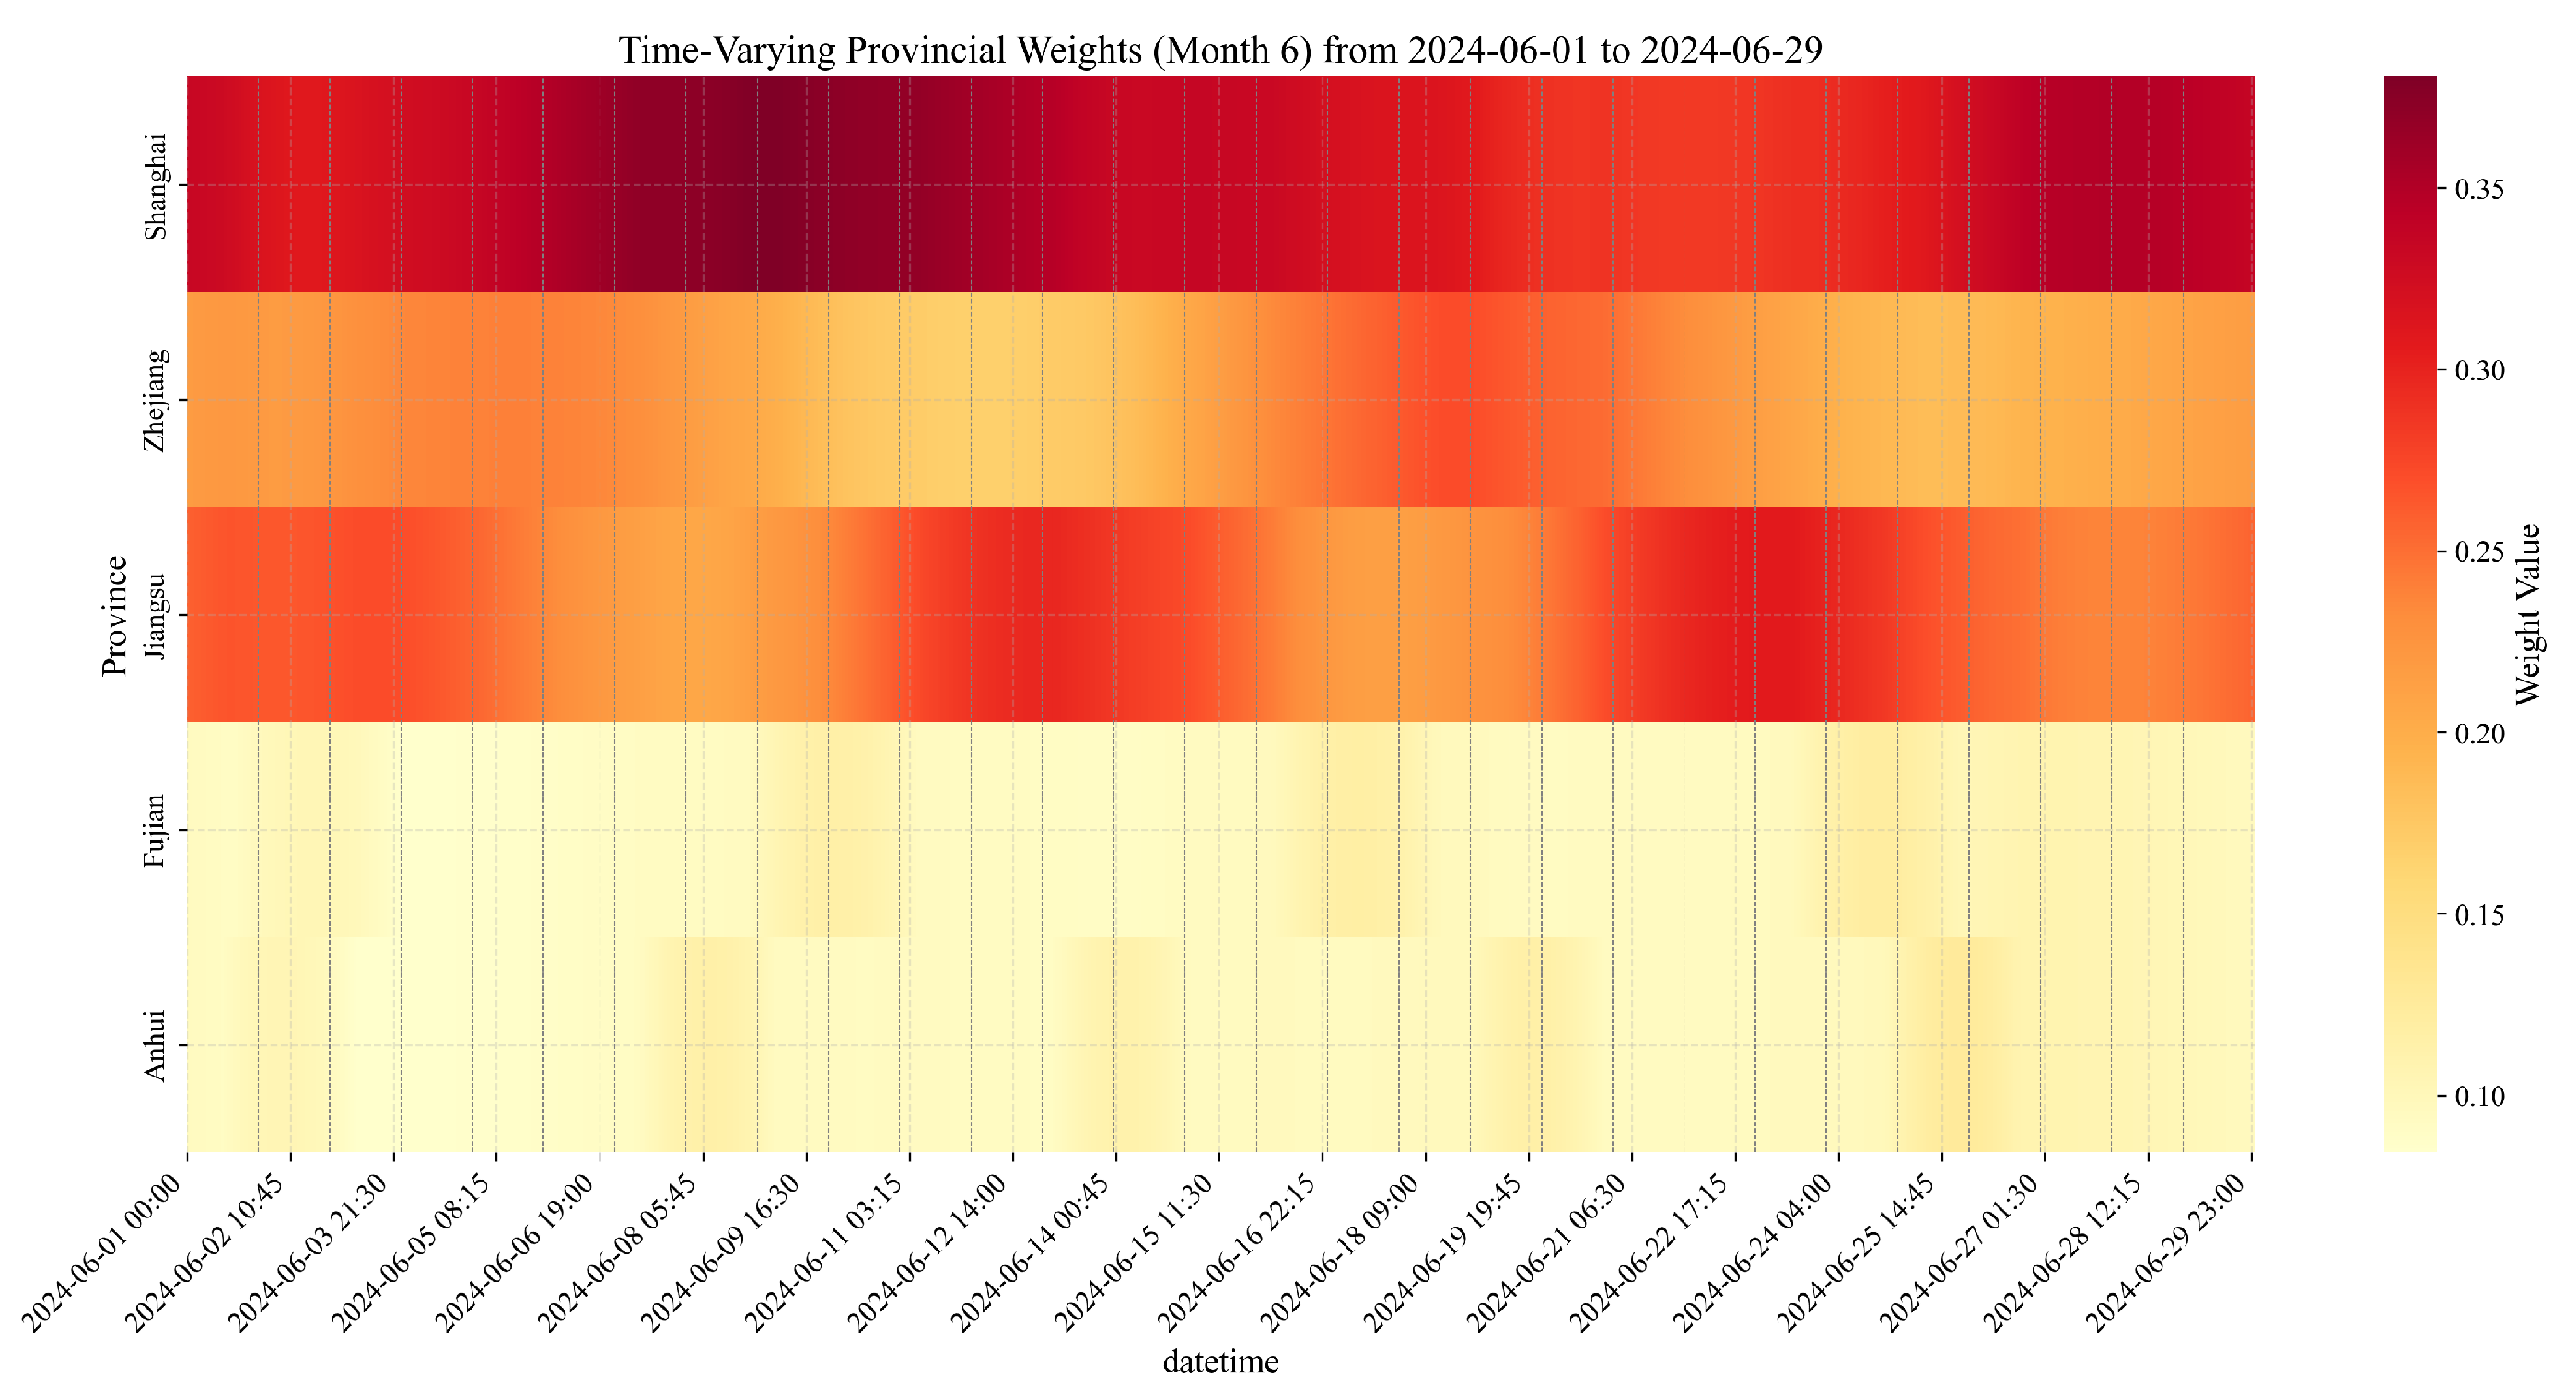
3.5.3. Seasonal Variations in Provincial Weight Dynamics
June (Moderate-Temperature Conditions)
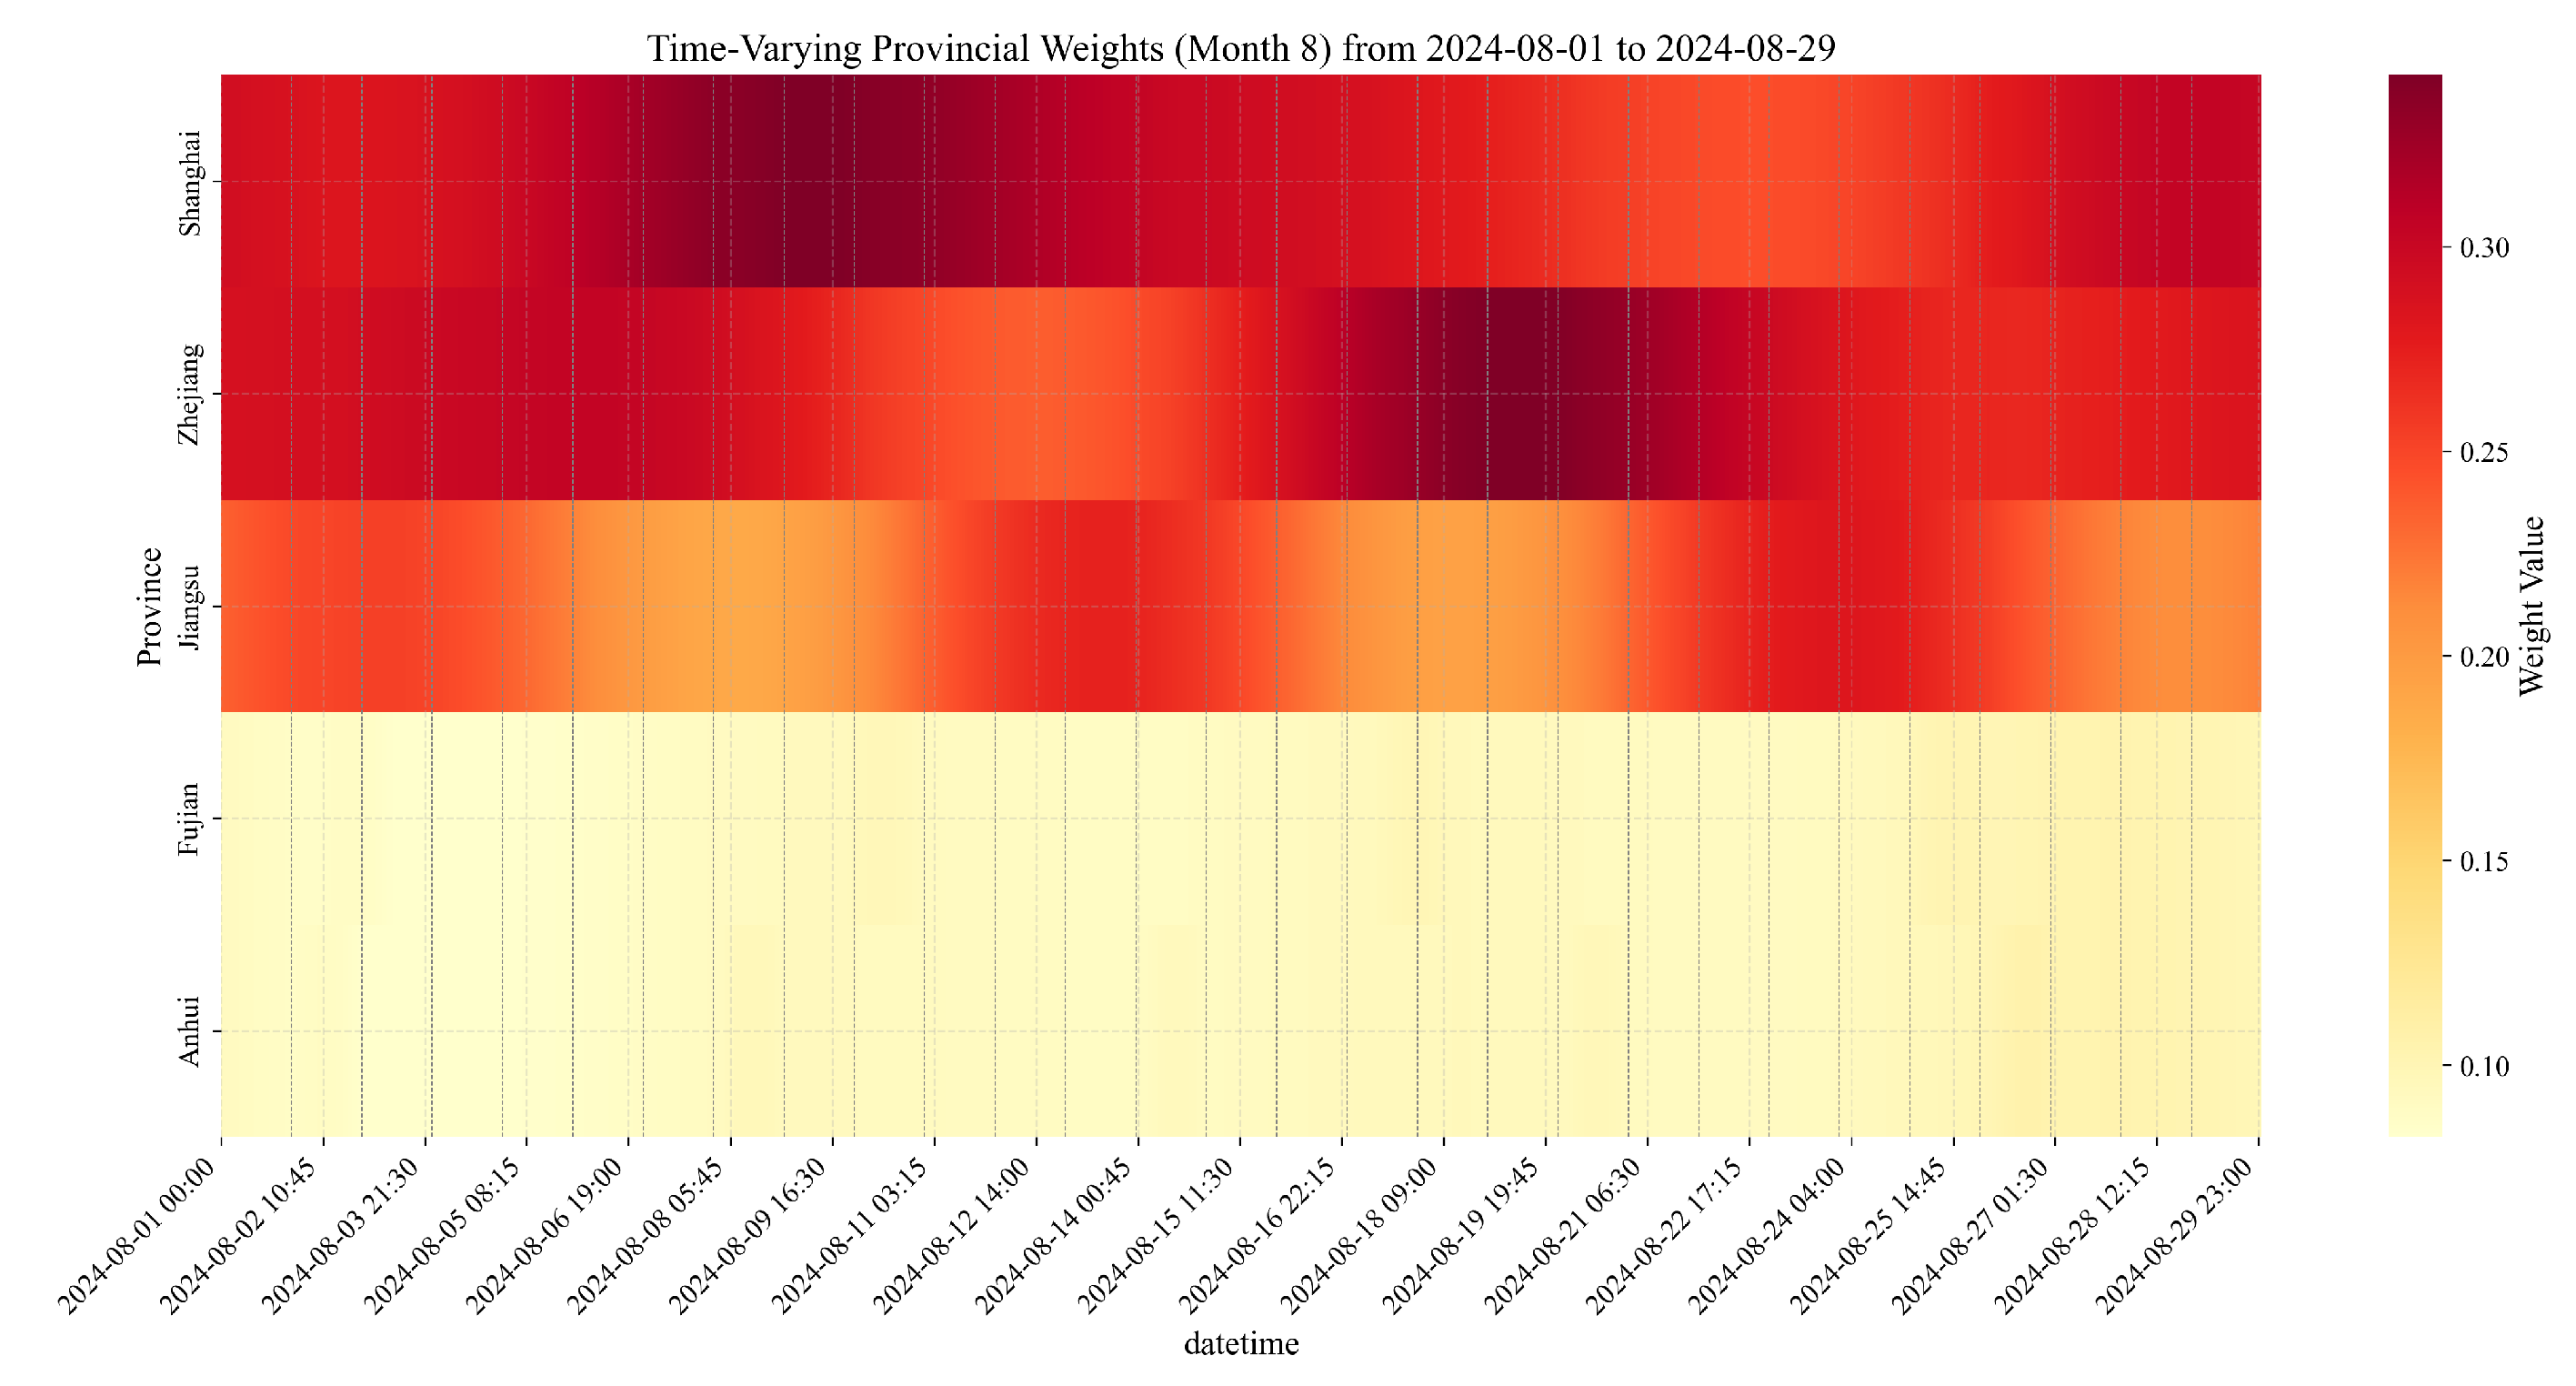
August (High-Temperature Conditions)
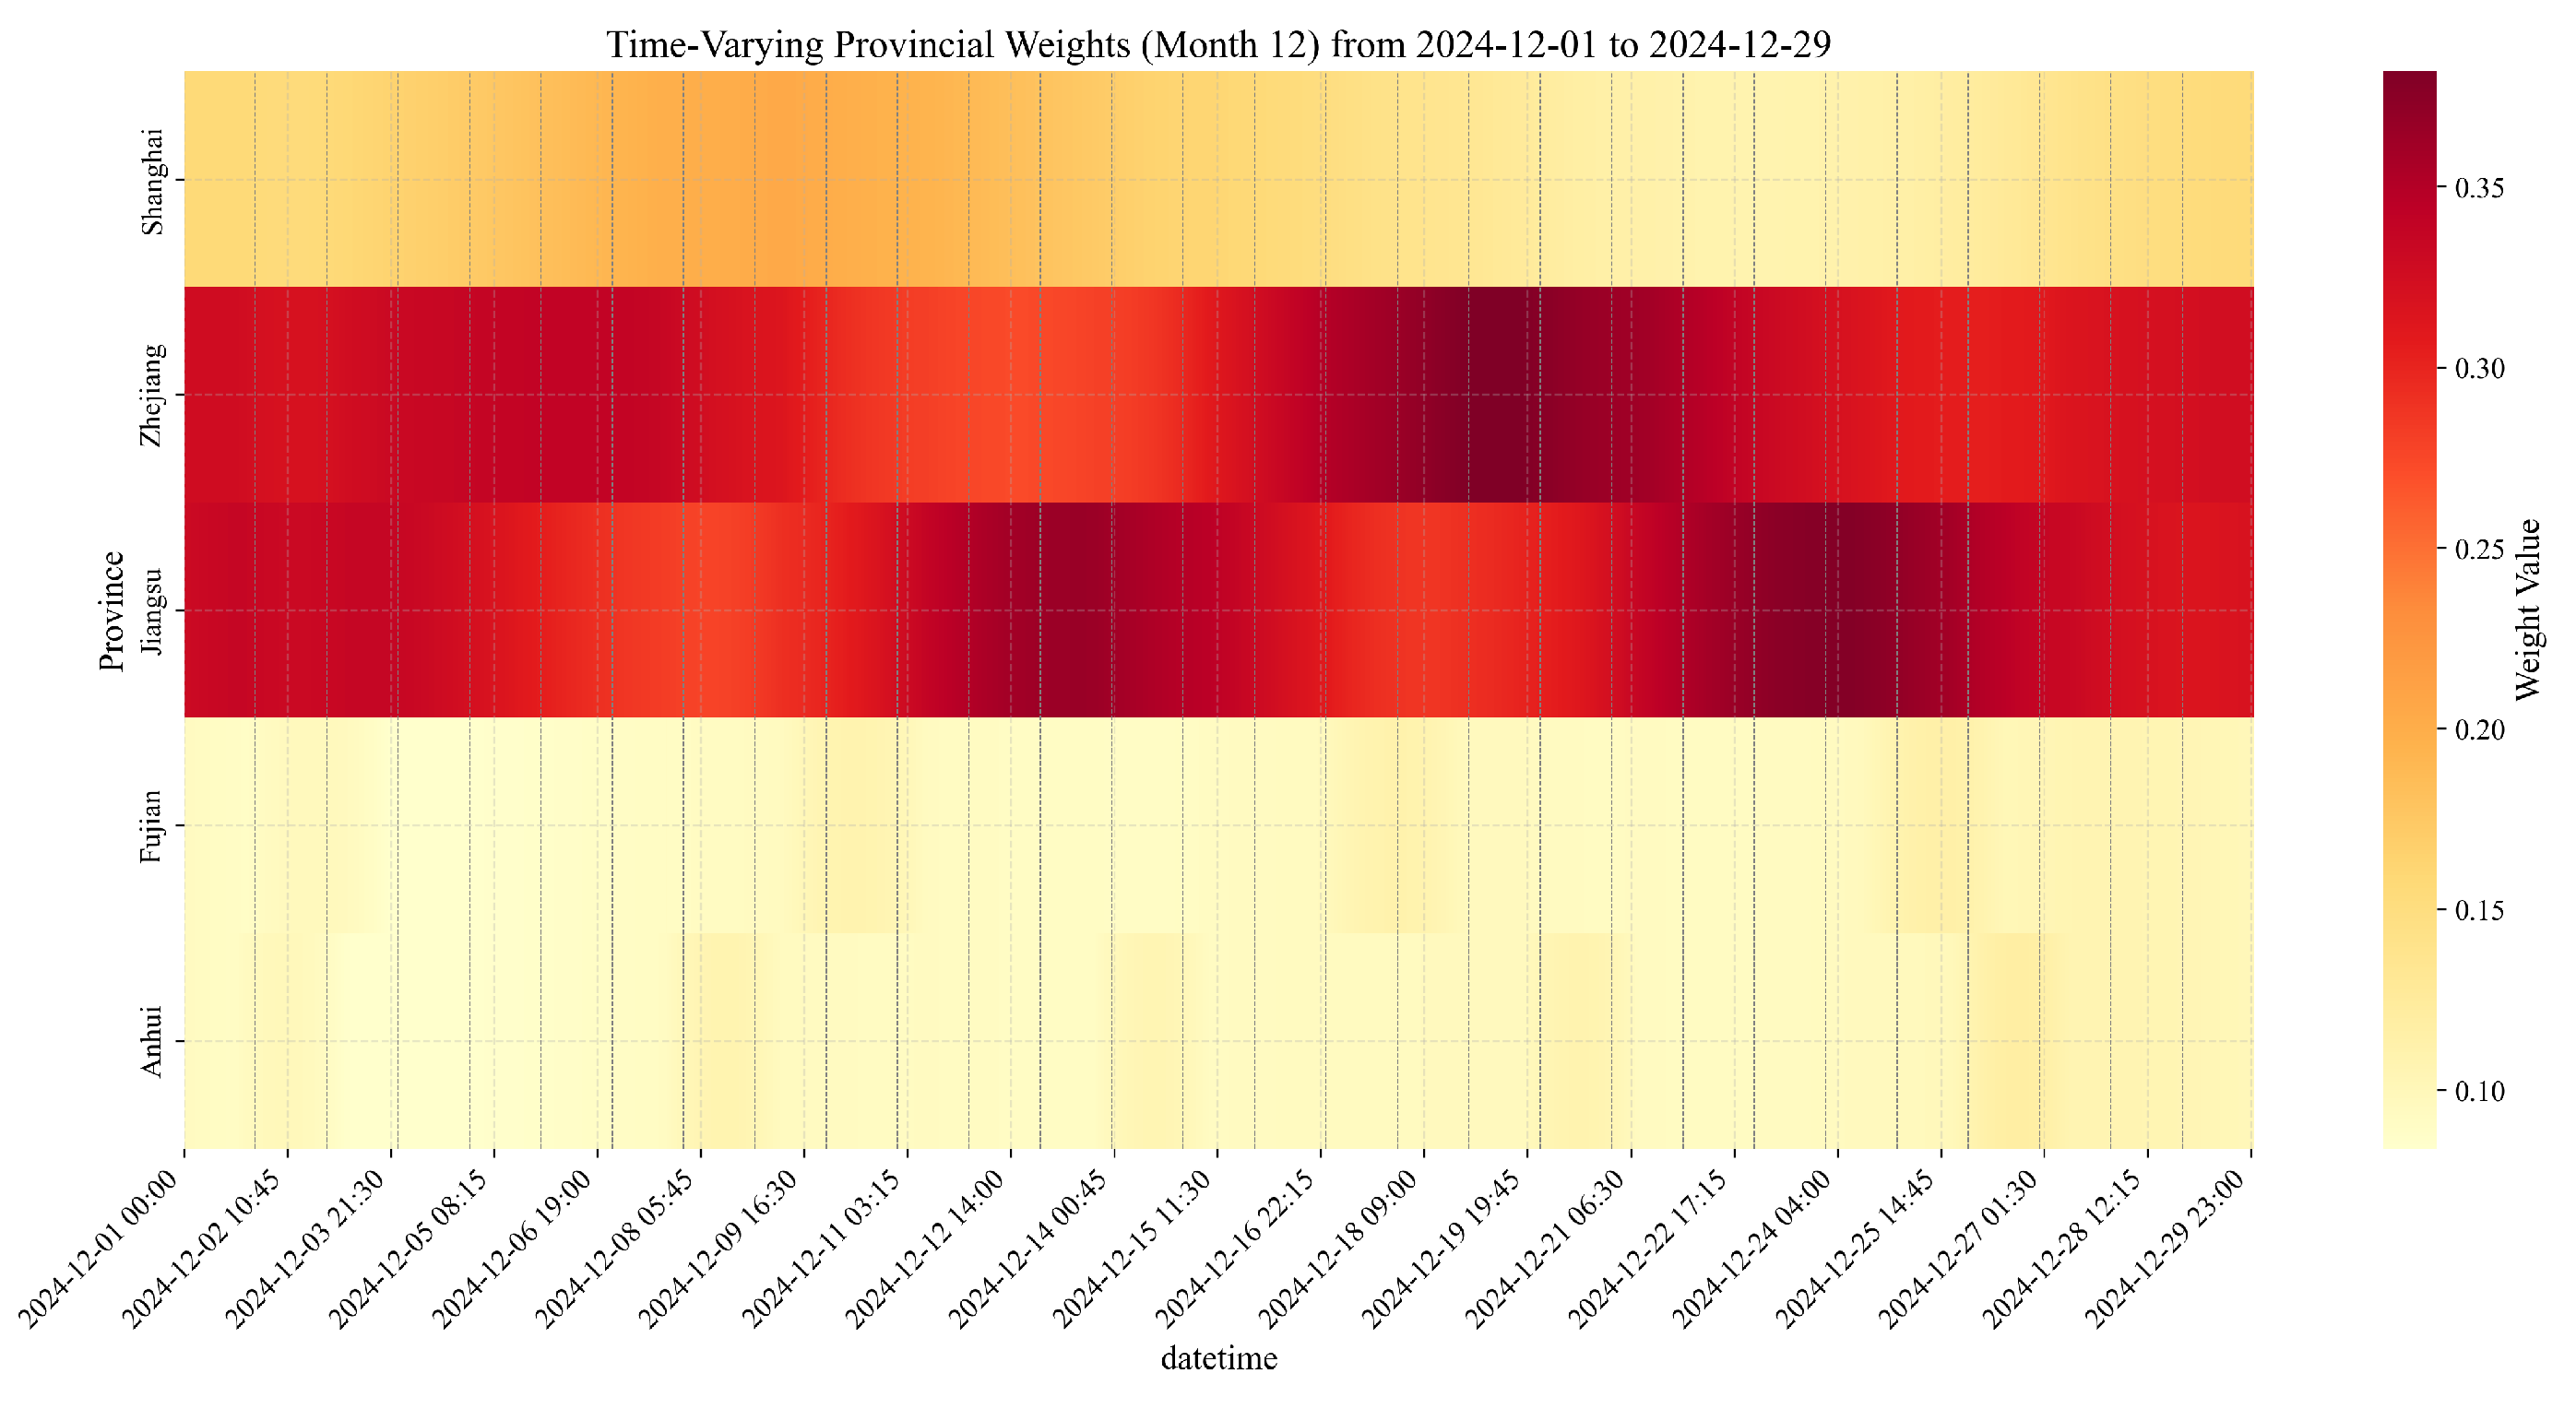
December (Winter Conditions)
Cross-Seasonal Comparative Analysis
- Seasonal Weight Redistribution: The substantial shift in weights from Jiangsu’s dominance in summer months to the increased Anhui contribution in winter demonstrates our methodology’s ability to recognize and adapt to seasonal changes in provincial load characteristics. This redistribution is essential for maintaining forecasting accuracy across different operational conditions.
- Temporal Granularity Impact: The increased temporal variations in weights during August, particularly for Jiangsu and Zhejiang, coincide with higher overall MAPE values but also greater performance improvements from weighted fusion. This suggests that more dynamic weight adjustments are both necessary and effective during high-volatility periods.
- Error Profile Transformation: The shift in error profiles from afternoon-peaked in summer months to morning-peaked in winter illustrates how seasonal load characteristics fundamentally alter forecasting challenges. The weighted fusion methodology successfully adapts to these changing error profiles by dynamically redistributing provincial weights.
3.5.4. Implications for Multi-Regional Integration
- Operational Regime Differentiation: The distinct differences in evaluation metrics between peak and non-peak periods justify our approach of calculating separate weights for different operational regimes rather than using a single static weight. This differentiation allows our fusion methodology to adapt to the changing characteristics and relative strengths of provincial forecasts throughout the day.
- Provincial Specialization Recognition The substantial differences in weights between provinces (e.g., Shanghai and Jiangsu) demonstrate how our methodology effectively recognizes and leverages provincial specialization. Rather than treating all provincial forecasts equally, our approach appropriately emphasizes forecasts from provinces with stronger evaluation metrics, particularly during periods when their forecasting strengths are most relevant.
- Temporal Adaptation: The evolution of weights over time shows how our methodology responds to changing operational conditions in real-time. This adaptive capability is particularly valuable during transition periods (e.g., morning ramp-up, evening peak) when load characteristics change rapidly and the relative strengths of different provincial forecasting systems may shift.
4. Discussion
4.1. Performance Improvements in Critical Operational Periods
4.2. Temporal Adaptability and Regional Specialization
4.3. Balanced Integration of Complementary Forecasting Strengths
4.4. Comparison with Existing Fusion Approaches
4.5. Limitations and Future Work
5. Conclusions
5.1. Methodological Contributions
5.2. Empirical Findings
5.3. Practical Implications
5.4. Future Research Directions
Author Contributions
Funding
Institutional Review Board Statement
Informed Consent Statement
Data Availability Statement
Acknowledgments
Conflicts of Interest
References
- Liu, M.-Y.; Xiao, Y.; Zhang, K.; Zhang, H.; Li, L. Collaborative optimization operation of high proportion renewable energy system considering source-load uncertainty. Electr. Power Constr. 2018, 39, 55–62. [Google Scholar]
- Li, L.; Fan, S.; Xiao, J.; Zhou, H.; Shen, Y.; He, G. Fair trading strategy in multi-energy systems considering design optimization and demand response based on consumer psychology. Energy 2024, 306, 132993. [Google Scholar] [CrossRef]
- Zheng, X.; Yang, M.; Yu, Y.; Wang, C. Short-term net load forecasting for regions with distributed photovoltaic systems based on feature reconstruction. Appl. Sci. 2023, 13, 9064. [Google Scholar] [CrossRef]
- Liao, Q.-S.; Hu, W.-H.; Cao, D. Distributed photovoltaic net load forecasting in new energy power systems. J. Shanghai Jiao Tong Univ. 2021, 55, 1520–1531. [Google Scholar]
- Zhang, Y.; Fan, S.; Meng, Y.; He, G. Payment and incentive allocation method in demand response programs based on Causer Pays principle. In Proceedings of the 2023 IEEE/IAS Industrial and Commercial Power Systems Asia, Chongqing, China, 7–9 July 2023; IEEE: New York, NY, USA, 2023; pp. 2212–2220. [Google Scholar]
- Shao, Y.; Fan, S.; Meng, Y.; Jia, K.; He, G. Personalized demand response based on sub-CDL considering energy. Appl. Energy 2024, 374, 123964. [Google Scholar] [CrossRef]
- Meng, Y.; Fan, S.; Shen, Y.; Xiao, J.; He, G.; Li, Z. Transmission and distribution network-constrained large-scale demand response based on locational customer directrix load for accommodating renewable energy. Appl. Energy 2023, 350, 121681. [Google Scholar] [CrossRef]
- Peng, Y.; Wang, Y.; Lu, X.; Li, H.; Shi, D.; Wang, Z.; Li, J. Short-term load forecasting at different aggregation levels with predictability analysis. In Proceedings of the 2019 IEEE Innovative Smart Grid Technologies-Asia (ISGT Asia), Chengdu, China, 21–24 May 2019; IEEE: New York, NY, USA, 2019; pp. 3385–3390. [Google Scholar]
- Yuan, Q.; Pi, Y.; Kou, L.; Zhang, F.; Li, Y.; Zhang, Z. Multi-source data processing and fusion method for power distribution internet of things based on edge intelligence. Front. Energy Res. 2022, 10, 891867. [Google Scholar] [CrossRef]
- Chodakowska, E.; Nazarko, J.; Nazarko, Ł. ARIMA models in electrical load forecasting and their robustness to noise. Energies 2021, 14, 7952. [Google Scholar] [CrossRef]
- Kang, C.-Q.; Xia, Q.; Liu, M. Electric Power System Load Forecasting, 2nd ed.; China Electric Power Press: Beijing, China, 2017; pp. 2–25. [Google Scholar]
- Groß, A.; Lenders, A.; Schwenker, F.; Braun, D.A.; Fischer, D. Comparison of short-term electrical load forecasting methods for different building types. Energy Inform. 2021, 4 (Suppl. S3), 13. [Google Scholar] [CrossRef]
- Tai, N.-L.; Hou, Z.-J.; Li, T.; Jiang, C.; Song, J. Short-term load forecasting method for power system based on wavelet analysis. Proc. CSEE 2003, 23, 46–51. [Google Scholar]
- Zhang, D.-H.; Sun, K.; He, J.-H. Short-term load forecasting based on similar days and multi-model fusion. Power Syst. Technol. 2023, 47, 1961–1970. [Google Scholar]
- Huang, N.; Hu, Z.; Cai, G.; Yang, D. Short-term electrical load forecasting using mutual information-based feature selection with generalized minimum-redundancy and maximum-relevance criteria. Entropy 2016, 18, 330. [Google Scholar] [CrossRef]
- Zhang, P.-X.; Yin, X.-H.; Li, S.-Y.; Wang, L. Short-term electricity load forecasting for agricultural greenhouse park based on VMD-CNN-LSTM. Inf. Control 2023, 53, 238–249. [Google Scholar]
- Zhu, M.-J.; Wang, C.-B.; Wang, T.-Z. An adaptive power load forecasting method based on multi-source data. Water Resour. Power 2017, 35, 200–203. [Google Scholar]
- Hu, L.; Wang, J.; Guo, Z.; Zheng, T. Load forecasting based on LVMD-DBFCM load curve clustering and the CNN-IVIA-BLSTM model. Appl. Sci. 2023, 13, 7332. [Google Scholar] [CrossRef]
- Wang, H.-X.; Wang, B.; Chen, H.-K.; Liu, C.; Ma, F. Power data fusion: Basic concepts, abstract structure, key technologies and application scenarios. Power Supply Consum. 2020, 37, 24–32. [Google Scholar]
- Bouktif, S.; Fiaz, A.; Ouni, A.; Serhani, M.A. Multi-sequence LSTM-RNN deep learning and metaheuristics for electric load forecasting. Energies 2020, 13, 391. [Google Scholar] [CrossRef]
- Chen, Z.-Y.; Liu, J.-B.; Li, C.; Ji, X.; Li, D.; Huang, Y.; Di, F.; Gao, X.; Xu, L. Ultra-short-term power load forecasting based on LSTM and XGBoost combined model. Power Syst. Technol. 2020, 44, 614–620. [Google Scholar]
- Semmelmann, L.; Henni, S.; Weinhardt, C. Load forecasting for energy communities: A novel LSTM-XGBoost hybrid model based on smart meter data. Energy Inf. 2022, 5 (Suppl. S1), 24. [Google Scholar] [CrossRef]
- Vaswani, A.; Shazeer, N.; Parmar, N.; Uszkoreit, J.; Jones, L.; Gomez, A.N.; Kaiser, Ł.; Polosukhin, I. Attention is all you need. Adv. Neural Inf. Process. Syst. 2017, 30, 1–11. [Google Scholar]
- Liu, Y.; Hu, T.; Zhang, H.; Wu, H.; Wang, S.; Ma, L.; Long, M. iTransformer: Inverted transformers are effective for time series forecasting. arXiv 2023, arXiv:2310.06625. [Google Scholar]
- Wang, W.; Feng, B.; Huang, G.; Liu, Z.; Ji, W. Short-term net load forecasting based on self-attention encoder and deep neural network. Proc. CSEE 2023, 43, 9072–9084. [Google Scholar]
- Zhang, S.; Liu, W.-X.; Tang, H.-Y.; Ma, Y.-J.; Wan, H.-Y.; Lu, Y. A short-term load forecasting method based on Transformer multi-feature fusion. J. North China Electr. Power Univ. (Nat. Sci. Ed.) 2023, 49, 1–9. [Google Scholar]
- Meng, W.; Yu, B.; Bai, L.; Xu, J.; Gu, J.-H.; Guo, F. Short-term power net load forecasting based on STGCN-Transformer. China Meas. Test 2024, 49, 1–9. [Google Scholar]
- Wang, M.; Xu, X.; Yan, Z. Online fault diagnosis of PV array considering label errors based on distributionally robust logistic regression. Renew. Energy 2023, 203, 68–80. [Google Scholar] [CrossRef]
- Wang, H.-L.; Zhang, Y.-J.; Mao, H.-P. Electric vehicle charging load forecasting method based on instantaneous charging probability. Electr. Power Autom. Equip. 2019, 39, 207–213. [Google Scholar]
- Fan, S.-X.; Liu, X.-W.; Yu, Y.-J.; Zhang, W. Ultra-short term bus load forecasting method based on multi-source data and model fusion. Power Syst. Technol. 2021, 45, 243–250. [Google Scholar]
- Singh, D.; Pal, N.; Sinha, S.K. Technical investigation on operational challenges of large-scale PV integration and opportunities with market restructuring, storages, green corridors, and AI. Microsyst. Technol. 2024, 30, 1109–1122. [Google Scholar] [CrossRef]
- Lu, D.-L.; Guo, J.-Y.; Wu, Y. Power system load forecasting method based on multi-source data driven under the influence of COVID-19. Power Supply Consum. 2022, 39, 74–80. [Google Scholar]
- Long, Y.; Ruan, W.-J.; Liu, M.; Zhou, Y. Research on medium and long-term probabilistic load forecasting method based on data fusion. Power Demand Side Manag. 2024, 26, 9–15. [Google Scholar]
- Yang, M.; Chang, H.; Li, W.; Wang, H.; Lin, J.; Tong, Z.; Zhang, W. High-Temperature Deformation and Skid Resistance of Steel Slag Asphalt Mixture Under Heavy Traffic Conditions. Buildings 2024, 14, 3990. [Google Scholar] [CrossRef]
- Zulfiqar, M.; Kamran, M.; Rasheed, M.B.; Alquthami, T.; Milyani, A.H. A short-term load forecasting model based on self-adaptive momentum factor and wavelet neural network in smart grid. IEEE Access 2022, 10, 77587–77602. [Google Scholar] [CrossRef]
- He, X.; Dong, H.; Yang, W.; Li, W. Multi-source information fusion technology and its application in smart distribution power system. Sustainability 2023, 15, 6170. [Google Scholar] [CrossRef]
- Zakaria, J. Principal Component Analysis (PCA) Explained; Built In: Chicago, IL, USA, 2023. [Google Scholar]


| Primary Indicators | Secondary Indicators | Tertiary Indicators |
|---|---|---|
| Forecast Reliability | Historical Forecast Performance | Day-ahead Forecast Accuracy, Real-time Forecast Accuracy, Extreme Weather Forecast Accuracy |
| Forecasting System Stability | System Update Frequency, Forecast Result Continuity, Abnormal Forecast Proportion | |
| Data Quality Level | Data Completeness Rate, Data Timeliness, Data Consistency | |
| Provincial Load Impact | Load Scale Proportion | Maximum Load Proportion, Average Load Proportion, Peak Load Contribution Rate |
| Regulation Capability | Peak Regulation Capacity Ratio, Renewable Energy Installation Ratio, Demand Response Capability | |
| Forecasting Complexity | Load Fluctuation Characteristics | Daily Load Fluctuation Rate, Weekly Load Fluctuation Rate, Seasonal Fluctuation Intensity |
| External Factor Sensitivity | Temperature Sensitivity, Humidity Sensitivity, Holiday Sensitivity | |
| Electricity Consumption Structure Complexity | Industrial Electricity Proportion, Number of Key Users, User Type Diversity |
| Period | Average MAPE (%) | Improvement Percentage (%) | |||
|---|---|---|---|---|---|
| Weighted Fusion | Direct Aggregation | Overall | Peak Hours | Non-Peak Hours | |
| June 2024 | 1.92 | 5.36 | 64.2 | 69.3 | 57.8 |
| August 2024 | 3.47 | 9.82 | 64.7 | 62.6 | 68.4 |
| December 2024 | 1.41 | 4.23 | 66.7 | 59.1 | 71.6 |
Disclaimer/Publisher’s Note: The statements, opinions and data contained in all publications are solely those of the individual author(s) and contributor(s) and not of MDPI and/or the editor(s). MDPI and/or the editor(s) disclaim responsibility for any injury to people or property resulting from any ideas, methods, instructions or products referred to in the content. |
© 2025 by the authors. Licensee MDPI, Basel, Switzerland. This article is an open access article distributed under the terms and conditions of the Creative Commons Attribution (CC BY) license (https://creativecommons.org/licenses/by/4.0/).
Share and Cite
Ye, H.; Teng, X.; Song, B.; Zou, K.; Zhu, M.; He, G. Multi-Source Data Fusion-Based Grid-Level Load Forecasting. Appl. Sci. 2025, 15, 4820. https://doi.org/10.3390/app15094820
Ye H, Teng X, Song B, Zou K, Zhu M, He G. Multi-Source Data Fusion-Based Grid-Level Load Forecasting. Applied Sciences. 2025; 15(9):4820. https://doi.org/10.3390/app15094820
Chicago/Turabian StyleYe, Hai, Xiaobi Teng, Bingbing Song, Kaiming Zou, Moyan Zhu, and Guangyu He. 2025. "Multi-Source Data Fusion-Based Grid-Level Load Forecasting" Applied Sciences 15, no. 9: 4820. https://doi.org/10.3390/app15094820
APA StyleYe, H., Teng, X., Song, B., Zou, K., Zhu, M., & He, G. (2025). Multi-Source Data Fusion-Based Grid-Level Load Forecasting. Applied Sciences, 15(9), 4820. https://doi.org/10.3390/app15094820