Article

Design of 3D Scanning Technology Using a Method with No External Reference Elements and Without Repositioning of the Device Relative to the Object

Department of Computer Aided Manufacturing Technologies, Faculty of Manufacturing Technologies, Technical University of Kosice, Bayerova 1, 08001 Presov, Slovakia
*
Authors to whom correspondence should be addressed.
Appl. Sci. 2025, 15(8), 4533; https://doi.org/10.3390/app15084533
Submission received: 2 April 2025 / Revised: 16 April 2025 / Accepted: 17 April 2025 / Published: 19 April 2025

Abstract

:
The use of 3D scanning technologies for surface scanning of objects is limited by environmental conditions and technology requirements based on their characteristics. Among the emerging fields is technical diagnostics in areas of hard-to-reach places with varying surface characteristics of objects of different materials, where the use of commercially available 3D scanning technologies is limited by space. Furthermore, in these areas it is not convenient to use external reference elements or to move the equipment during the digitization process. This paper presents a novel markerless 3D scanning system capable of digitizing objects in confined spaces without requiring external reference elements or repositioning the device relative to the object and aims to address this challenge by designing a 3D scanning technology using the Active Shape from Stereo technique utilizing laser vertical line projection. For this purpose, a testing and prototype design and a software solution using a unique method of calculating 3D surface coordinates have been proposed. In addition to hard-to-reach places, this solution can be used as a desktop 3D scanner and for other 3D digitizing applications for objects of different materials and surface characteristics. Furthermore, the device is well suited to inspecting 3D printed objects, enabling quick, markerless checks of surface geometry and dimensions during the process of 3D printing to ensure printing accuracy and quality.

1. Introduction

Three-dimensional digitization of physical objects has become a fundamental component of reverse engineering, a process that facilitates the conversion of physical objects into digital models. The approach of capturing the geometry of objects through discrete data and converting them into continuous CAD models was described as early as the late 1990s. Reverse engineering is the process of analyzing a product or system to understand its design, structure, and functionality. Among other utilizations, a critical component of reverse engineering is the 3D digitization of the surface of objects, which facilitates the acquisition of an accurate three-dimensional model of physical components in the absence of existing technical documentation. Others include the accuracy of the manufacturing and quality control, such as comparing a casting, forging, 3D printed object or workpiece against a nominal model [1], the identification and quantification of the wear of components [2], creating personalized prosthetics [3] and collecting real data for FEM analysis [4]. The utilization of 3D digitizing devices has gained prominence across diverse industrial sectors. The necessity for such systems has arisen in domains where access is particularly challenging, such as the inspection of hard-to-reach places. Conventional endoscopic visual inspections, employed for decades in domains such as turbines, aircraft engines, and pipeline maintenance, offer a 2D image, lacking the capacity to provide the full 3D surface shape data necessary for comprehensive inspection. Consequently, while inspectors may discern fractures or defects, direct measurement of their depth and dimensions from the 2D image remains challenging. The acquisition of three-dimensional information has typically necessitated intricate procedures, often involving the utilization of specialized scanning apparatus equipped with lasers or the disassembly of the equipment itself, followed by scanning of the components from an external location [5].
This research builds on the scientific work of authors [6]. Conventionally used industrial scanners often require the attachment of reference markers or the movement of the scanner around the object to combine the individual scans into a coherent model. However, this is particularly a problem in confined spaces where it is not possible to attach markers or move around the object from all directions. The necessity to avoid using external references has led to research into automatic scan registration algorithms; for example, the Iterative Closest Point (ICP) algorithm has become the standard for merging point clouds without the need for reference features, based on aligning scans to the shortest distance to each other [7]. This technique of merging surface scans requires having common shape regions that are unique and can be registered on the merged scans. However, the ICP itself is functional when the scanning device is moved relative to the object. Successive improvements in 3D point cloud processing have enabled modern handheld scanners to track their motion relative to an object using natural surface features. Examples include simultaneous localization and mapping (SLAM) [8] or surface-based registration [9]. A comprehensive review of 3D scanning methods was published by the authors of [9], who summarized the development of photogrammetry, laser and structured light scanners and compared their accuracy and reliability. They pointed out that although scene scanning is often time consuming, new algorithms and sensors are continuously making the process more efficient. These advances have opened the way for applications of 3D digitization in specialized fields as well. For example, non-contact body scanners have been used in medicine [10,11], which described several types of scanners used to digitize human body parts for the production of personalized orthoses. In orthopedic practice, digitizing technologies without the use of external reference elements are used to perform scanning of the patient’s back for the purpose of designing corsets for scoliosis [12]. Another field is robotics and localization in unknown environments. The authors of [13] presented a compact 3D scanning system with an active triangulation laser line, complemented by inertial sensors and the SLAM algorithm. Their device was able to produce a map of a confined space without the need for an external framework, demonstrating the integration of 3D scanning with navigation techniques for autonomous exploration of hard-to-reach places. Despite these advances, the research problem of digitizing internal and hard-to-reach spaces without the need for disassembly requires further research. The authors [14] performed a study of the reconstruction error for the vision reconstruction with a planar laser, two cameras and a 3D orientation board. The variation principles of the spatial coordinates caused by the variations of the extrinsic parameters of the cameras, intrinsic parameters of the internal camera, and image coordinate points of the internal camera, are modeled and analyzed in this paper. In their research they made use of a 3D orientation board [14]. The authors of [15] proposed a structured light vision measurement method using a scanning laser line and a positioning laser line. The device required second positioning line of laser [15]. Although these existing methods have proven effective in open environments, they generally necessitate either external markers or the movement of the scanning device around the object to register point clouds. This requirement becomes impractical when dealing with confined or sensitive objects where neither markers nor free movement are viable. Hence, a fundamental research gap remains in achieving highly accurate, markerless 3D digitization while keeping both the scanner and the object static. The primary objective of this study is to design and validate a 3D digitizing technology capable of capturing surfaces without the necessity of external reference points or adjustments to the scanning system’s position relative to the object.

2. Materials and Methods

The system must be sufficiently compact and portable to fit into a confined space, yet sufficiently accurate to capture fine surface details. The hypothesis is that by integrating active optical techniques (e.g., utilizing structured light) and a suitable mechanical design of the scanning head, it is feasible to obtain 3D data in a space where conventional scanners are unable to access. The significance and contribution of this work lies in its potential to advance the frontiers of non-destructive diagnostics. The proposed technology has the potential to enable the inspection of equipment (e.g., machinery components, nuclear reactors, historical artifacts) without the need for disassembly, thereby reducing both time and cost, and the risk of damage to the objects under investigation. It should be noted that the present research is constrained to laboratory proof-of-concept; it does not extend to direct integration into mass production or automated processing of point clouds into CAD models. It is assumed that the scanned objects remain static during the digitization process and that the surrounding environment does not introduce significant distracting light reflections that would not be accounted for by the controlled illumination. The proposed approach’s limitations may stem from the field of view, as the system is unable to capture surfaces that are not visible to both cameras unless the sensor position is altered, a modification not feasible under the stipulated conditions. Notwithstanding these limitations, it is anticipated that this approach will broaden the scope of 3D digitization by enabling its application in hitherto inaccessible locations. Furthermore, it is expected to lay the foundation for a new generation of markerless 3D scanners designed for specific applications. In addition to industrial inspections and reverse engineering, additive manufacturing can also benefit significantly, by verifying the dimensional accuracy or detecting surface defects of 3D printed components. It is critical, and proposed markerless scanning solution provides a convenient pathway to perform such quality control on newly fabricated parts.

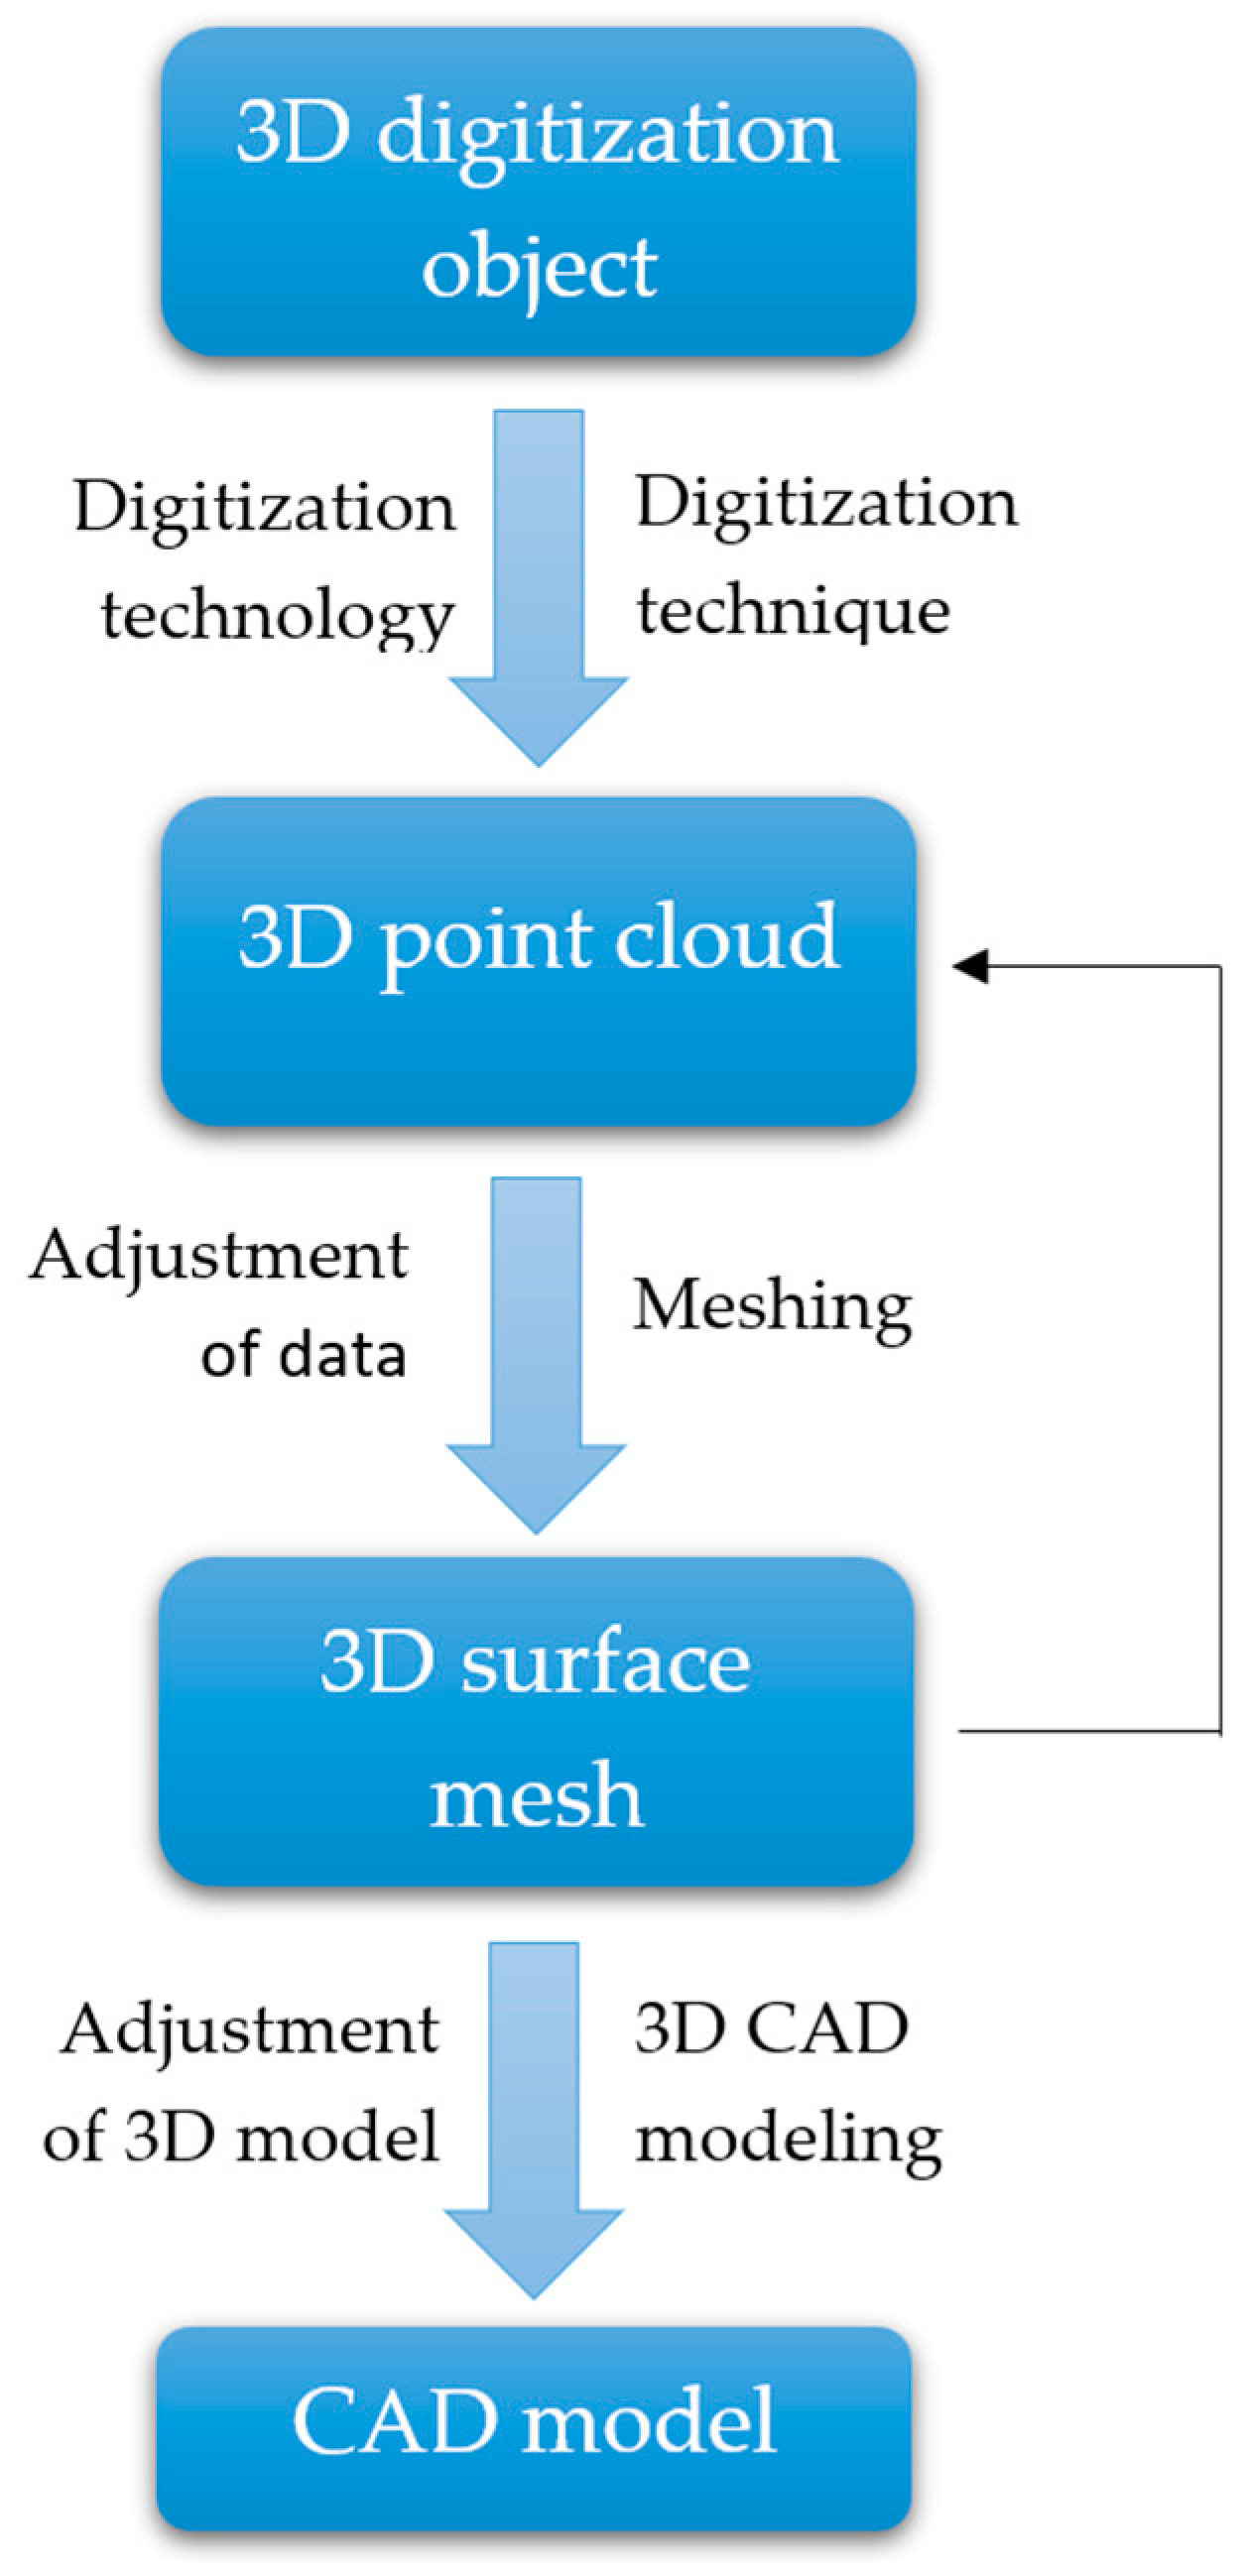
2.1. Reverse Engineering and 3D Surface Digitization

Reverse engineering is defined as the process of systematically analyzing a product or system to understand its design, structure, and function. This process finds application in a variety of industries and applications, including hardware, software, and machine systems. The definition of reverse engineering frequently encompasses particular software or the utilization of an original design to generate a new one, or to delineate a limited array of pragmatic applications. However, these definitions are limited in scope and fail to fully capture the historical importance and broad applications of reverse engineering. Reverse engineering can be defined as the process of identifying the fundamental principles that define an object, product, substance, material, structure, assembly, or system by systematically analyzing their structure, and possibly their functionality and behavior. This process commences with a design solution or other outcome of a problem, aiming to ascertain its initial conditions and the methods by which it was created, ultimately leading to the final result [16].
The disassembly process plays a pivotal role in the engineering task that is being addressed by reverse engineering techniques. In the context of products, disassembly can be conceptualized in two distinct ways, physical disassembly and conceptual review. Disassembly is a two-step process. In the first case, the product is functional and the reasons for its success are examined. In the second case, the focus shifts to non-functional or failing products, with an investigation into the underlying causes of their failure. Product disassembly is a multifaceted tool that can be utilized for a variety of purposes, including product analysis, technical analysis, gaining experience and knowledge for personal or business use, and conducting trial tests. The fundamental processes of reverse engineering encompass observation, measurement, and experimentation. Through careful observation, the expertise of the product can be readily discerned. An experienced engineer in their field can distinguish a high-quality product from a low-quality one at first sight through observation. During the observation process, it is beneficial to be mindful of the manner in which the product is assembled, including the specific use of fasteners and standardized elements, the sequence of part assembly, and the physical properties of the parts. The measurement of these elements is a critical component of reverse engineering. Dimensions (geometry) are measured in reverse engineering, and, if the object allows it, the measurement of functional connections is also conducted. The process of experimentation, if the product is functional and its purpose is known, can provide valuable information, knowledge, and understanding. Within the paradigm of reverse engineering, experimentation is driven by two overarching objectives: the establishment of functionality through experimentation and the quantification of functional values through measurement. However, it is important to note that the implementation of reverse engineering may be subject to limitations imposed by laws and regulations specific to a country or region [16].
The acquisition of shape and dimensional models of parts that are no longer manufactured or available on the market can also be considered an important practical application of object digitization. Specifically, such data are employed in the creation of technical documentation for spare parts. In contemporary times, the digitization of parts has become increasingly prevalent for the purpose of modifying the shape of existing components without the availability of technical documentation and CAD drawings [17].
The digitization of physical objects is generally comprised of four distinct stages: data acquisition, polygonization, data processing, and data reconstruction (3D model creation). This sequence can be observed in Figure 1. Technological devices employed within the measurement process of reverse engineering obtain 3D point coordinates as values in the X, Y, Z axes relative to the initial or chosen coordinate system. Typically, a substantial quantity of point clouds is acquired, and these coordinates delineate the surface of the digitized objects. Additionally, separate 3D coordinates can be acquired at predetermined locations.
A typical example is a coordinate measuring system based on the principle of contact data acquisition. It is important to note that the acquired data may contain errors resulting from the measurement process and technology. These errors may include points on the surface of the surroundings, points distant from others by a significant distance value, and missing points at certain locations. The resulting point cloud can be utilized in surface comparison analyses; however, it is not typically an output of the digitization process. The surface data acquisition process can be segmented, and the object can be digitized incrementally, whereby the individually acquired data can be merged. The creation of a three-dimensional surface model of the shell type, which can subsequently be utilized in practical applications, necessitates the polygonization of the point cloud [18].

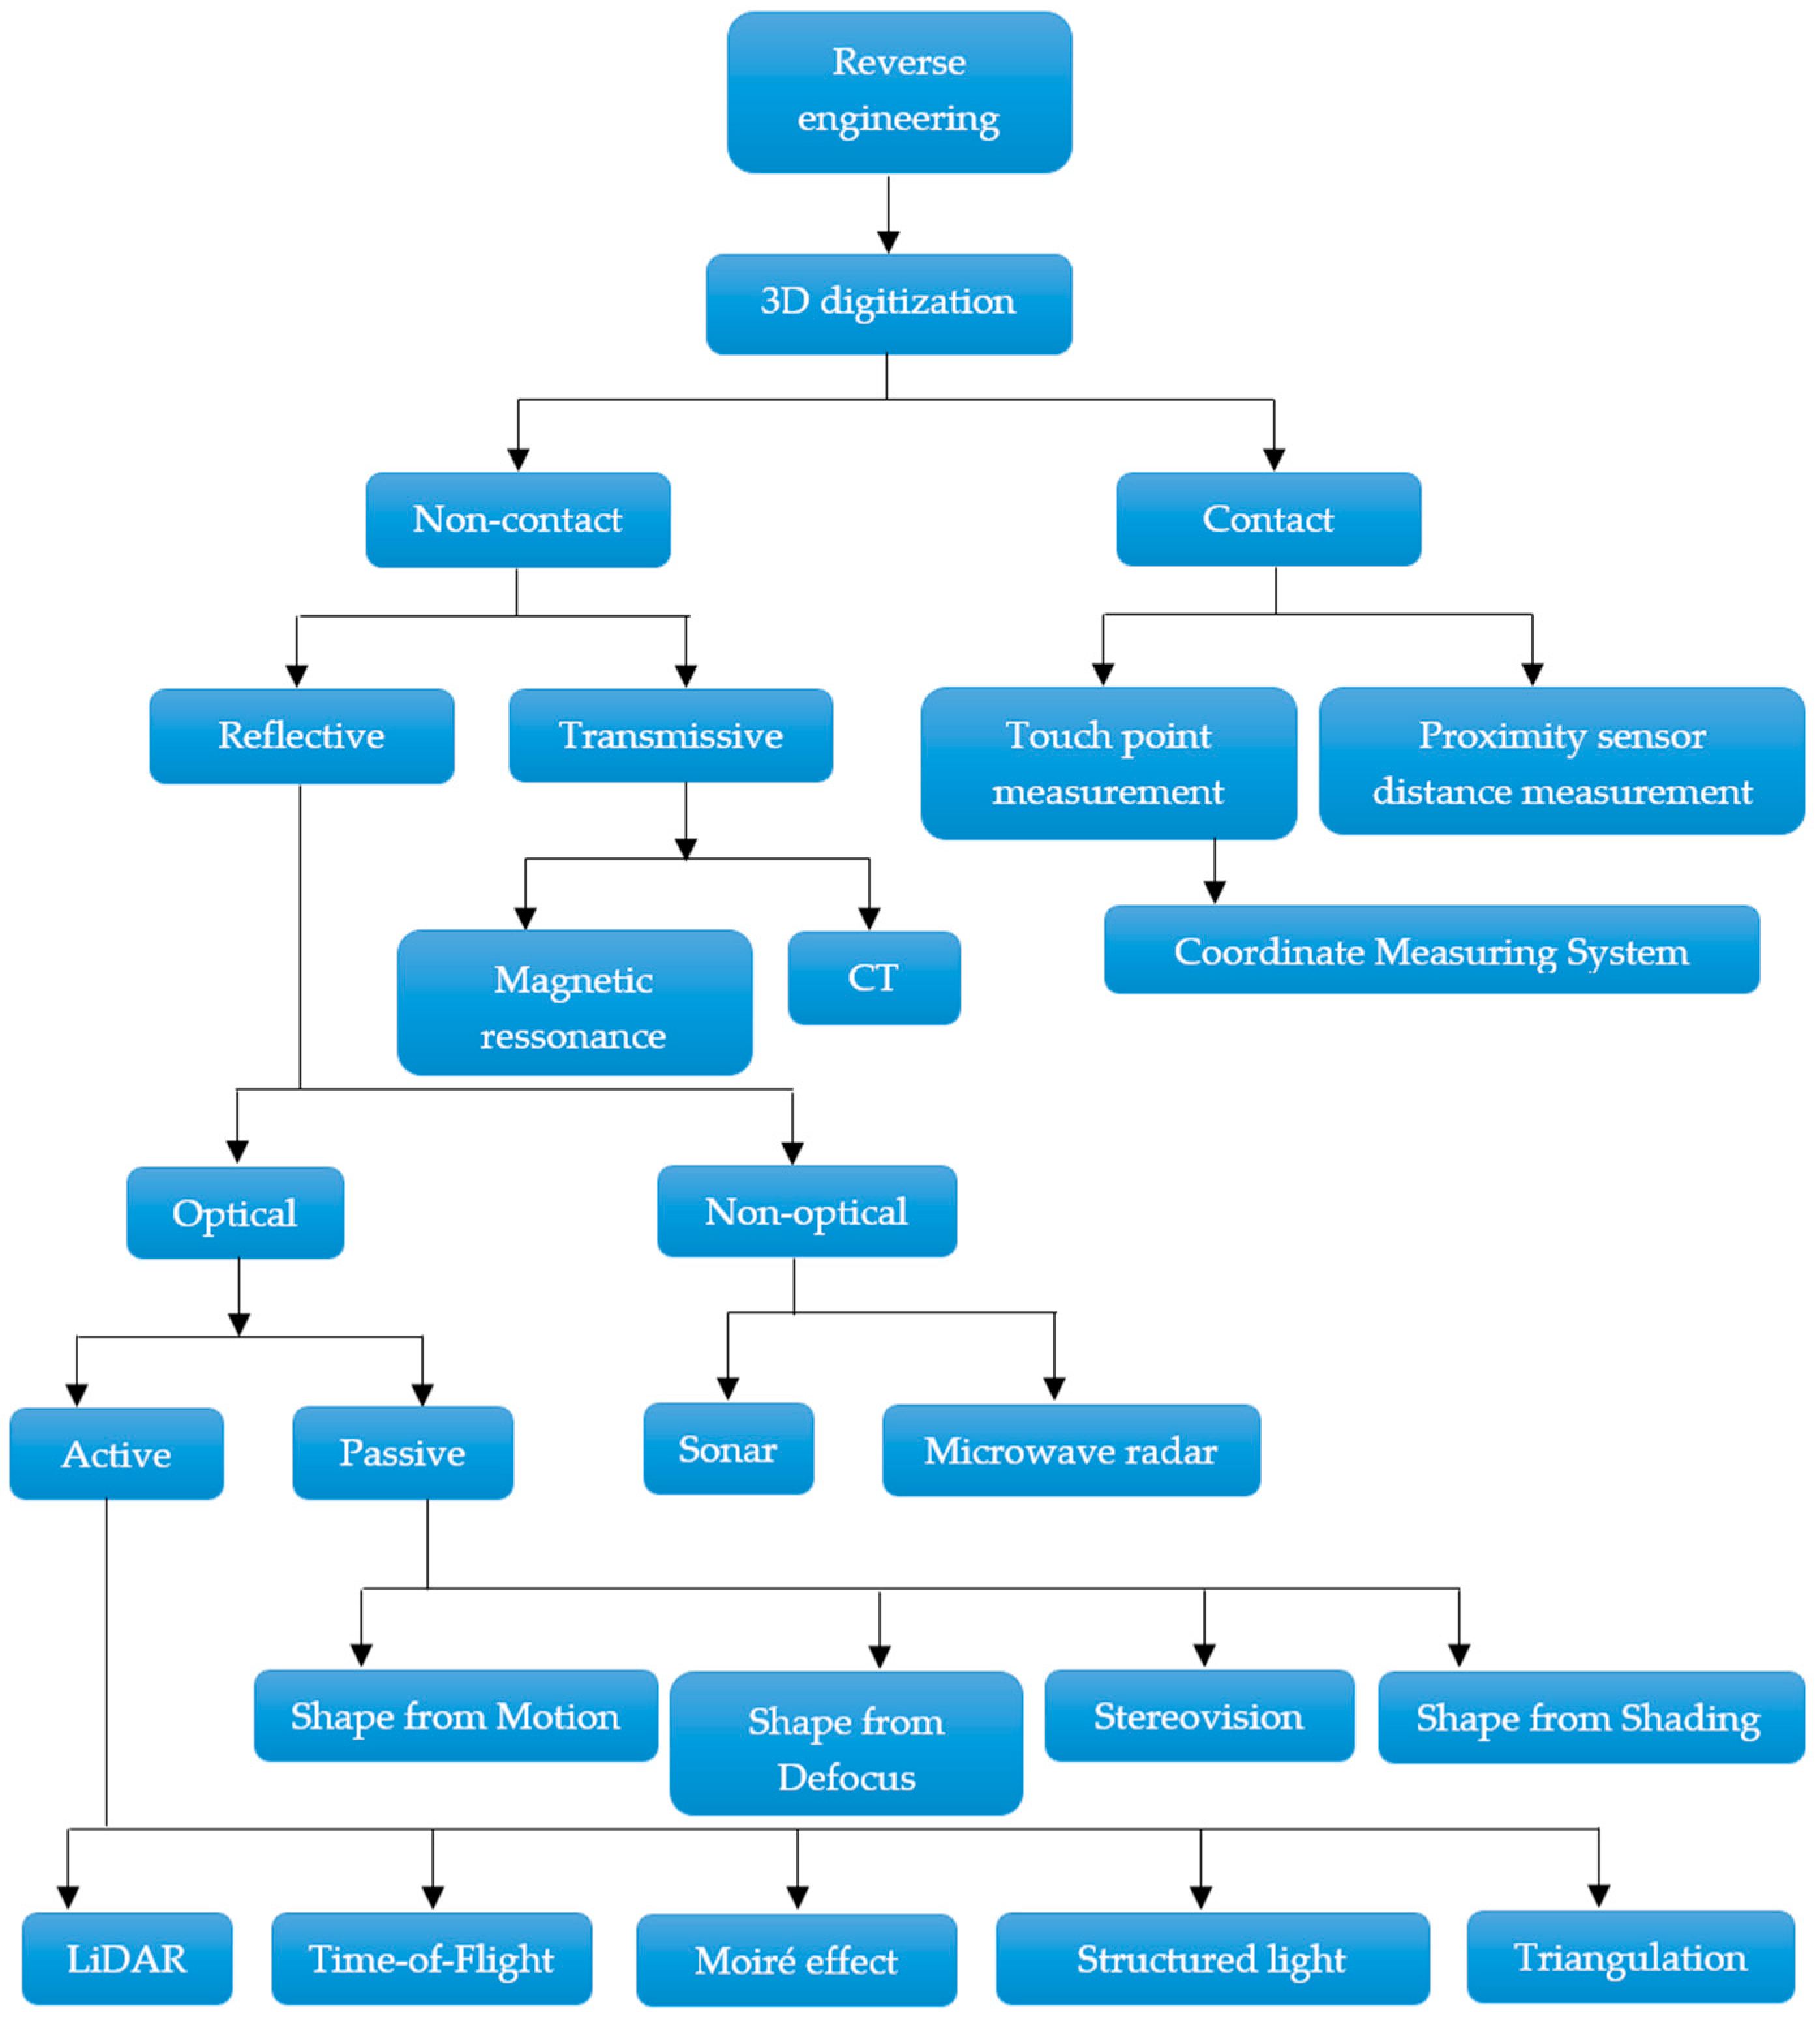
2.2. Reverse Engineering Techniques and Technologies

A plethora of techniques and technologies are at one’s disposal when undertaking the reverse engineering process, which can be applied to a multitude of practical applications. It is imperative to draw distinctions between the definitions of “reverse engineering technique” and “reverse engineering technology”. The term “reverse engineering technique” denotes the fundamental principle that underlies a specific digitization process. The term “reverse engineering technology” encompasses technological devices utilizing distinct techniques.
Reverse engineering techniques are based on two main principles, which are used in object digitization. These principles are contact and non-contact acquisition of point coordinates. This is illustrated in Figure 2. Direct contact technologies involve the acquisition of surface data of the digitized object through physical contact between the contact sensor of the technology and the surface of the digitized object. The most widely used example of this principle for obtaining surface point coordinates is the Coordinate Measuring Machine (CMM). The primary advantage of this system is its ability to achieve surface measurement with a high degree of accuracy. However, this method is not without drawbacks, including the necessity of employing fixtures to position the digitized objects correctly, the limitation to specific points for measurement, the requirement for an environment free from disturbances, and the consequent reduction in digitization speed [17,19].
Non-contact, or non-direct, digitizing devices eschew the use of physical proximity and contact with the surface of the digitized object. Rather, they employ mathematical and physical laws as the underlying principles of these techniques. Within the framework of the non-direct principle of digitization, two distinct techniques can be distinguished: reflective and transmissive. The transmissive techniques are predicated on the laws of wave transmission through materials with different physical properties, the best known of which are magnetic resonance imaging and computed tomography, which are widely used in the medical field [17].
In the domain of object digitization, the predominant technologies are those grounded in the physical principles of ray and wave reflection from object surfaces. Conversely, non-optical techniques rely on the physical laws of wave reflection from surfaces during the process of surface digitization. Examples of such techniques include sonar and microwave radar. In contrast, the domain of optical digitization relies on the physical laws that govern the reflection of light rays from the object’s surface. It is important to note that there are two primary categories of optical digitizing techniques: active and passive. Passive optical techniques rely on ambient light, eschewing the use of a light beam source by the digitizing devices for data acquisition. The aforementioned techniques are based on surface computation using camera position change imaging Shape from Motion, focus change imaging Shape from Defocus, stereovision technique Shape from Stereo, and surface shadowing imaging Shape from Shading. Active optical digitizing techniques use the reflection of light and laser beams emitted from the actual source to compute the surface shape. These techniques include Light Detection and Ranging (LiDAR), Time of Flight (ToF) calculations, Moiré effect-based techniques, projection of structured light onto a surface and triangulation based techniques.
The process of 3D surface digitization that eliminates the need for external references and repositioning of the technology relative to the object is challenging because it requires specialized equipment and techniques. Reverse engineering offers a multitude of applicable techniques and technologies in the field of surface digitization of physical objects, but not all of them are applicable in the field of hard-to-reach diagnostics. Hard-to-reach places can be considered as areas where it is not possible to perform the required activities and to use conventional technologies used in a typical environment, and the definition of hard-to-reach can be approached from several perspectives [6]. Employing appropriate safety procedures and regulations is paramount when undertaking tasks in such confined spaces to mitigate the risk of injury or damage to the technology. When selecting and comparing specific techniques and technologies, it is imperative to consider the requirements for digitization techniques and equipment.
The basic requirements for digitizing equipment include the following:
  • portability—they should be lightweight and easily portable and be able to operate in confined spaces or harsh environments;
  • accuracy—the range of distances between the values obtained and the actual values;
  • range—the functional range of distances between the device and the object to be digitized;
  • requirements for the physical properties of the digitized objects—size, surface characteristics, shape constancy and complexity of the object, etc.;
  • repeatability—determines the extent of changes on the acquired data within several measurements of the same object by the same device and without changing the parameters;
  • dynamic accuracy—the range of the number of measurements per unit time within which the specified accuracy can be achieved;
  • calibration—making a comparison of the data obtained from a device relative to known values;
  • volume, size, wattage and power parameters—the material and physical parameters of the equipment;
  • safety—the extent to which there is a risk of harm, injury or death when working with the digitizing device;
  • usability—the ability of the device to capture and measure multiple surface aspects of physical objects;
  • cost—the sum of the purchase price and the operating costs over the required time horizon for the use of the device;
  • output data—the method of display and representation of the acquired and retrieved data and the output format of the recorded data;
  • ergonomics—design criteria for the physical and ergonomic demands of working with the device;
  • robustness and durability—the ability of the equipment to withstand external influences and forces applied when working with the equipment;
  • the nature, manner and extent of changes made and caused by the digitizing device to the digitized object as part of the digitization process [16].
The application of reverse engineering in the field of diagnostics of hard-to-reach places can be considered as an application of 3D digitizing technology without the use of external references and changes in the relative position of the technology and the object. Given that the real world can be conceptualized as a 3D framework defined in space, it is imperative to capture and measure real physical objects. This necessitates the acquisition of information regarding the distance, or depth, of the scanning device relative to the object. To address the requirements for precise measurement of features within the surface of objects and the necessity to reconstruct surface areas of objects in hard-to-reach locations, specific dedicated devices must be defined. Since the beginning of the 21st century, these imaging and digitizing devices have been the focus of research by scientific teams worldwide. Research on 3D endoscopic devices has been particularly oriented towards medical applications in diagnostics and as an assistive technology in surgical operations. The digitization techniques employed in hard-to-reach areas can be categorized as follows:
1.
Digitization using photogrammetry:
  • A technique based on camera movement (Shape from Motion, SfM);
  • Digitization using video (Shape from Video, SfV).
2.
Stereo vision (Shape from Stereo, SfS) using dual sensing:
  • Stereo vision with two optical sensors outside the head of the device;
  • Stereo vision with two optical sensors located on the head of the device.
3.
Stereo vision based on dual optics and single optical sensor sensing:
  • channel with split optics;
  • dual aperture optics;
  • dual optical channel with prismatic lens;
  • dual aperture optics with interlaced image;
  • dual aperture optics with Complimentary Multiband Band-pass Filters (CMBF);
  • variable optical path system;
  • an off-axis static aperture system and a rotating disc.
4.
Digitization based on the use of structured light:
  • structured light technique with optical light guiding device;
  • the structured light technique with a projection device on the external side of the endoscope;
  • structured light technique based on phase shift analysis;
  • structured light technique with spectrally encoded light pattern;
  • a stereoscopic sensor pair using structured light;
  • structured light technique with a multi-component coupled optical system sensor.
5.
Digitization using endoscopic equipment with one optical channel:
  • a technique based on differential focusing of the image and astigmatic projection of the light pattern;
  • ToF reflected light Time of Flight calculation technique;
  • holographic optics technique with a sensor on the endoscope head;
  • holographic optics technique, light guided through an optical channel and a sensor outside the endoscope head;
  • Shape from Shading (SfSh) technique;
  • Shape from Defocus (SfD) technique of the sensor optics;
  • SfD based technique for projected light patterns, 3D measurement technique using laser beams [20].
In the selection of a reverse engineering technique for 3D surface digitization that does not involve the use of external references or repositioning of the technology or the object, it was imperative to evaluate the capabilities of each technique and select the most suitable one. The employment of techniques founded on structured light projection necessitates the utilization of a projection device. However, the intricate and complex projected pattern may not be well suited for utilization in challenging industrial environments, which encompass hard-to-reach locations. Consequently, the SfS stereovision technique employing dual imaging has been selected.

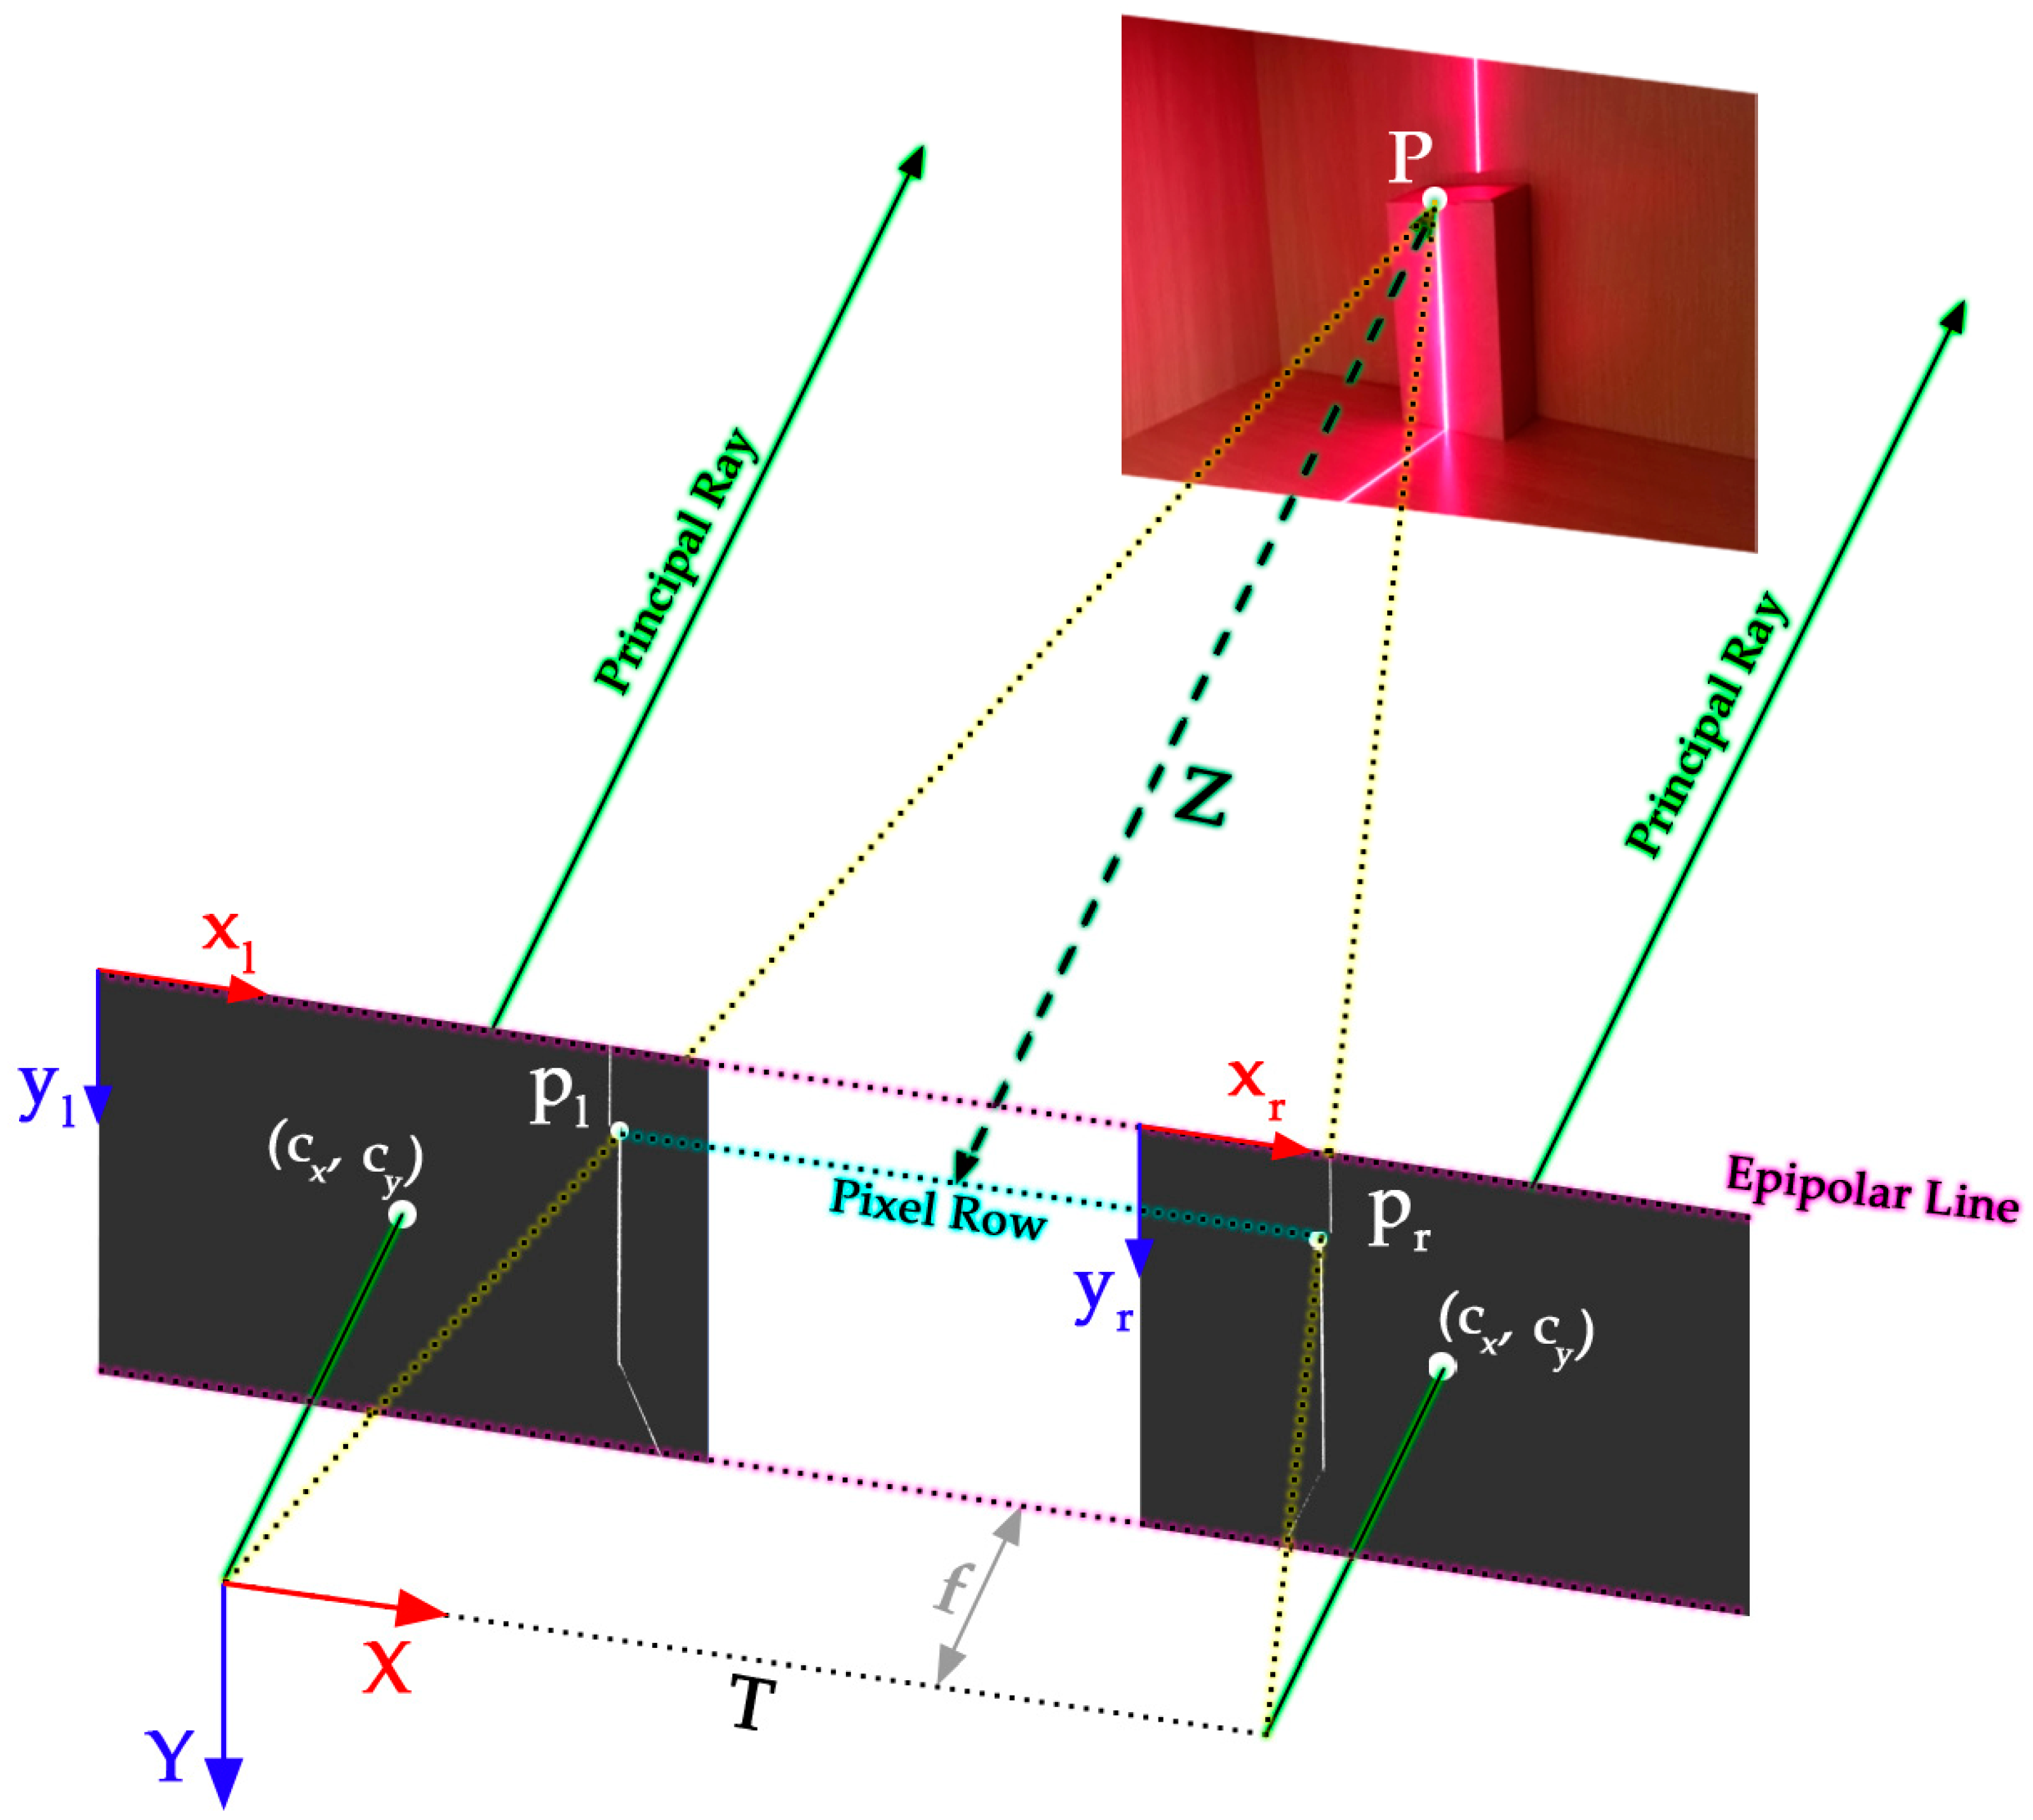
2.3. Shape from Stereo SfS

Stereovision, also known as binocular vision, is a technique of perceiving the environment through the use of an optical system that produces dual imaging from two different perspectives. The concept of stereovision was inspired by the natural world, where humans and animals utilize a pair of eyes to navigate and perceive their surroundings. This faculty of spatial perception has been preserved through evolution in most animal species. This observation underscores the efficacy of stereovision. The implementation of stereovision has expanded significantly in recent years, with applications ranging from robotics and autonomous systems to object digitization and distance measurement, virtual and augmented reality, and medicine. The process of stereovision digitization (SfS) involves the utilization of the fundamental principle of space perception by an optical system equipped with a pair of sensors, employing distance measurements between the optical system and objects in space for the purpose of digitization. The objective of the SfS-based digitization process is to generate a depth image, point cloud, or a surface model that accurately represents the actual surface of a physical object within a scene, given a real-world coordinate system and the coordinate system of the digitizing device. The SfS-based digitization process employs a dual-sensing optical system situated in space, with two optical sensors capturing the space from different perspectives. The SfS employs the parallax effect, which manifests as a perceptual shift in the perceived position of an object when observed from two distinct positions due to a change in perspective at varying angles or distances.
SfS digitizing is a particular digitizing technique that utilizes triangulation and photogrammetry as its fundamental mathematical model. Photogrammetry can be defined as a three-dimensional measurement technique that uses central projection imaging as its underlying mathematical model. Photogrammetry involves measurement methods based on image datasets and their interpretation to obtain the surface, shape, and location of a physical object based on one or more photographs of that object. To employ photogrammetry techniques for the digitization of objects, it is imperative to ascertain the precise location of cameras within the scene to facilitate the requisite calculations. The reconstruction of physical models based on image-based calculations entails the generation of point features on the object, with these features being derived from the object’s shape, brightness, and color distribution as depicted in the images. At the initiation of the physical object reconstruction process employing photogrammetry, it is imperative to establish a methodology for interpreting and measuring the images, thereby facilitating the creation of these point features. To this end, the employment of measuring and sensing devices characterized by the requisite geometric and optical quality characteristics is required [21].
The SfS digitization process utilizes dual-imaging, which involves the use of a pair of optical sensors to capture binocular stereo images of the scene. This technique is analogous to the manner in which humans perceive visual information, enabling the acquisition of three-dimensional data concerning the surface characteristics of an object. The process employs a computation designed to obtain an exact match of a particular surface point on both images. However, the utilization of passive stereovision, devoid of the illumination provided by a specific light pattern, demonstrates comparatively diminished accuracy and relies extensively on block registration of regions exhibiting similar disparity across the image. Notable examples include Stereo Block Matching (abbreviated BM) and Stereo Semi-Global Block Matching (abbreviated SGBM). In this context, the registration of common visual features for disparity computation can also be considered problematic. This is due to the fact that hard-to-reach locations may be poorly illuminated, and clearly distinguishable visual features would be difficult to register within two image frames. Additionally, the utilization of surface objects exhibiting uniform color and light properties across a substantial portion of the surface introduces challenges. The uniformity and similarity of the surface hinders the registration of visual features on the object, thereby constraining the digitization by passive SfS. To address this challenge, the employment of a laser beam projector was selected to enhance the precision of digitization. The employment of this device ensures the visibility of the projected laser pattern as a consistent visual element within the two SfS images, thereby facilitating a more precise digitization process.

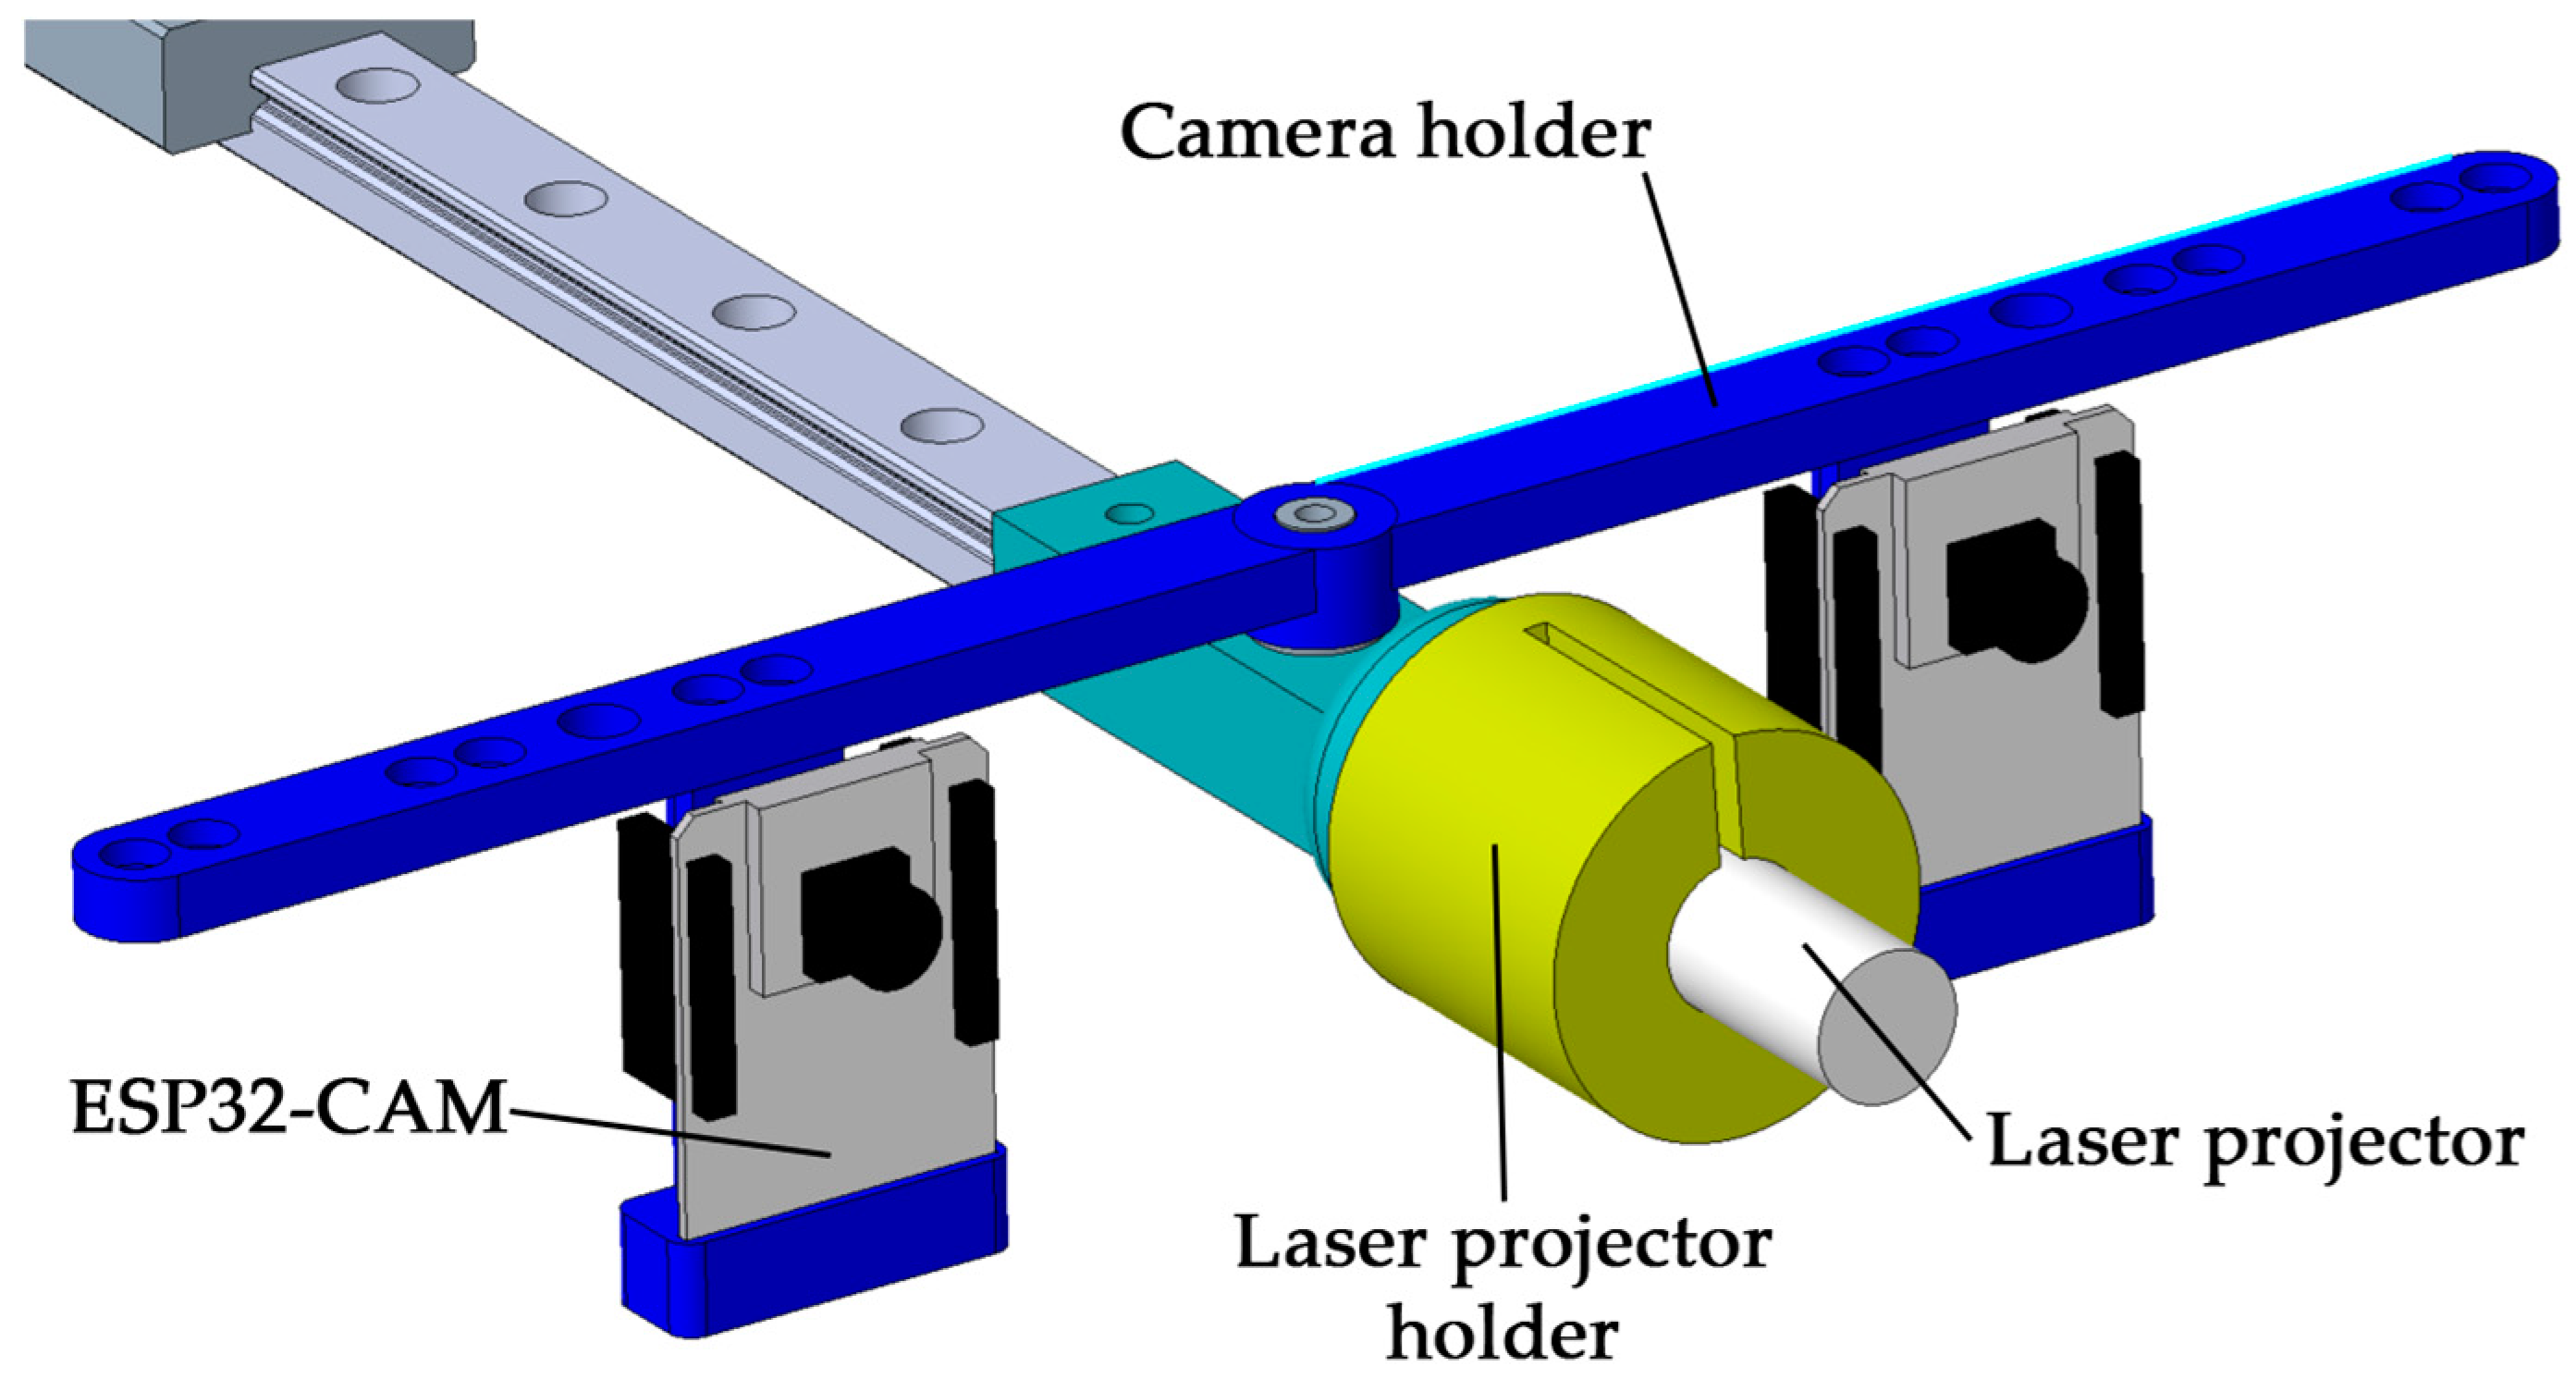
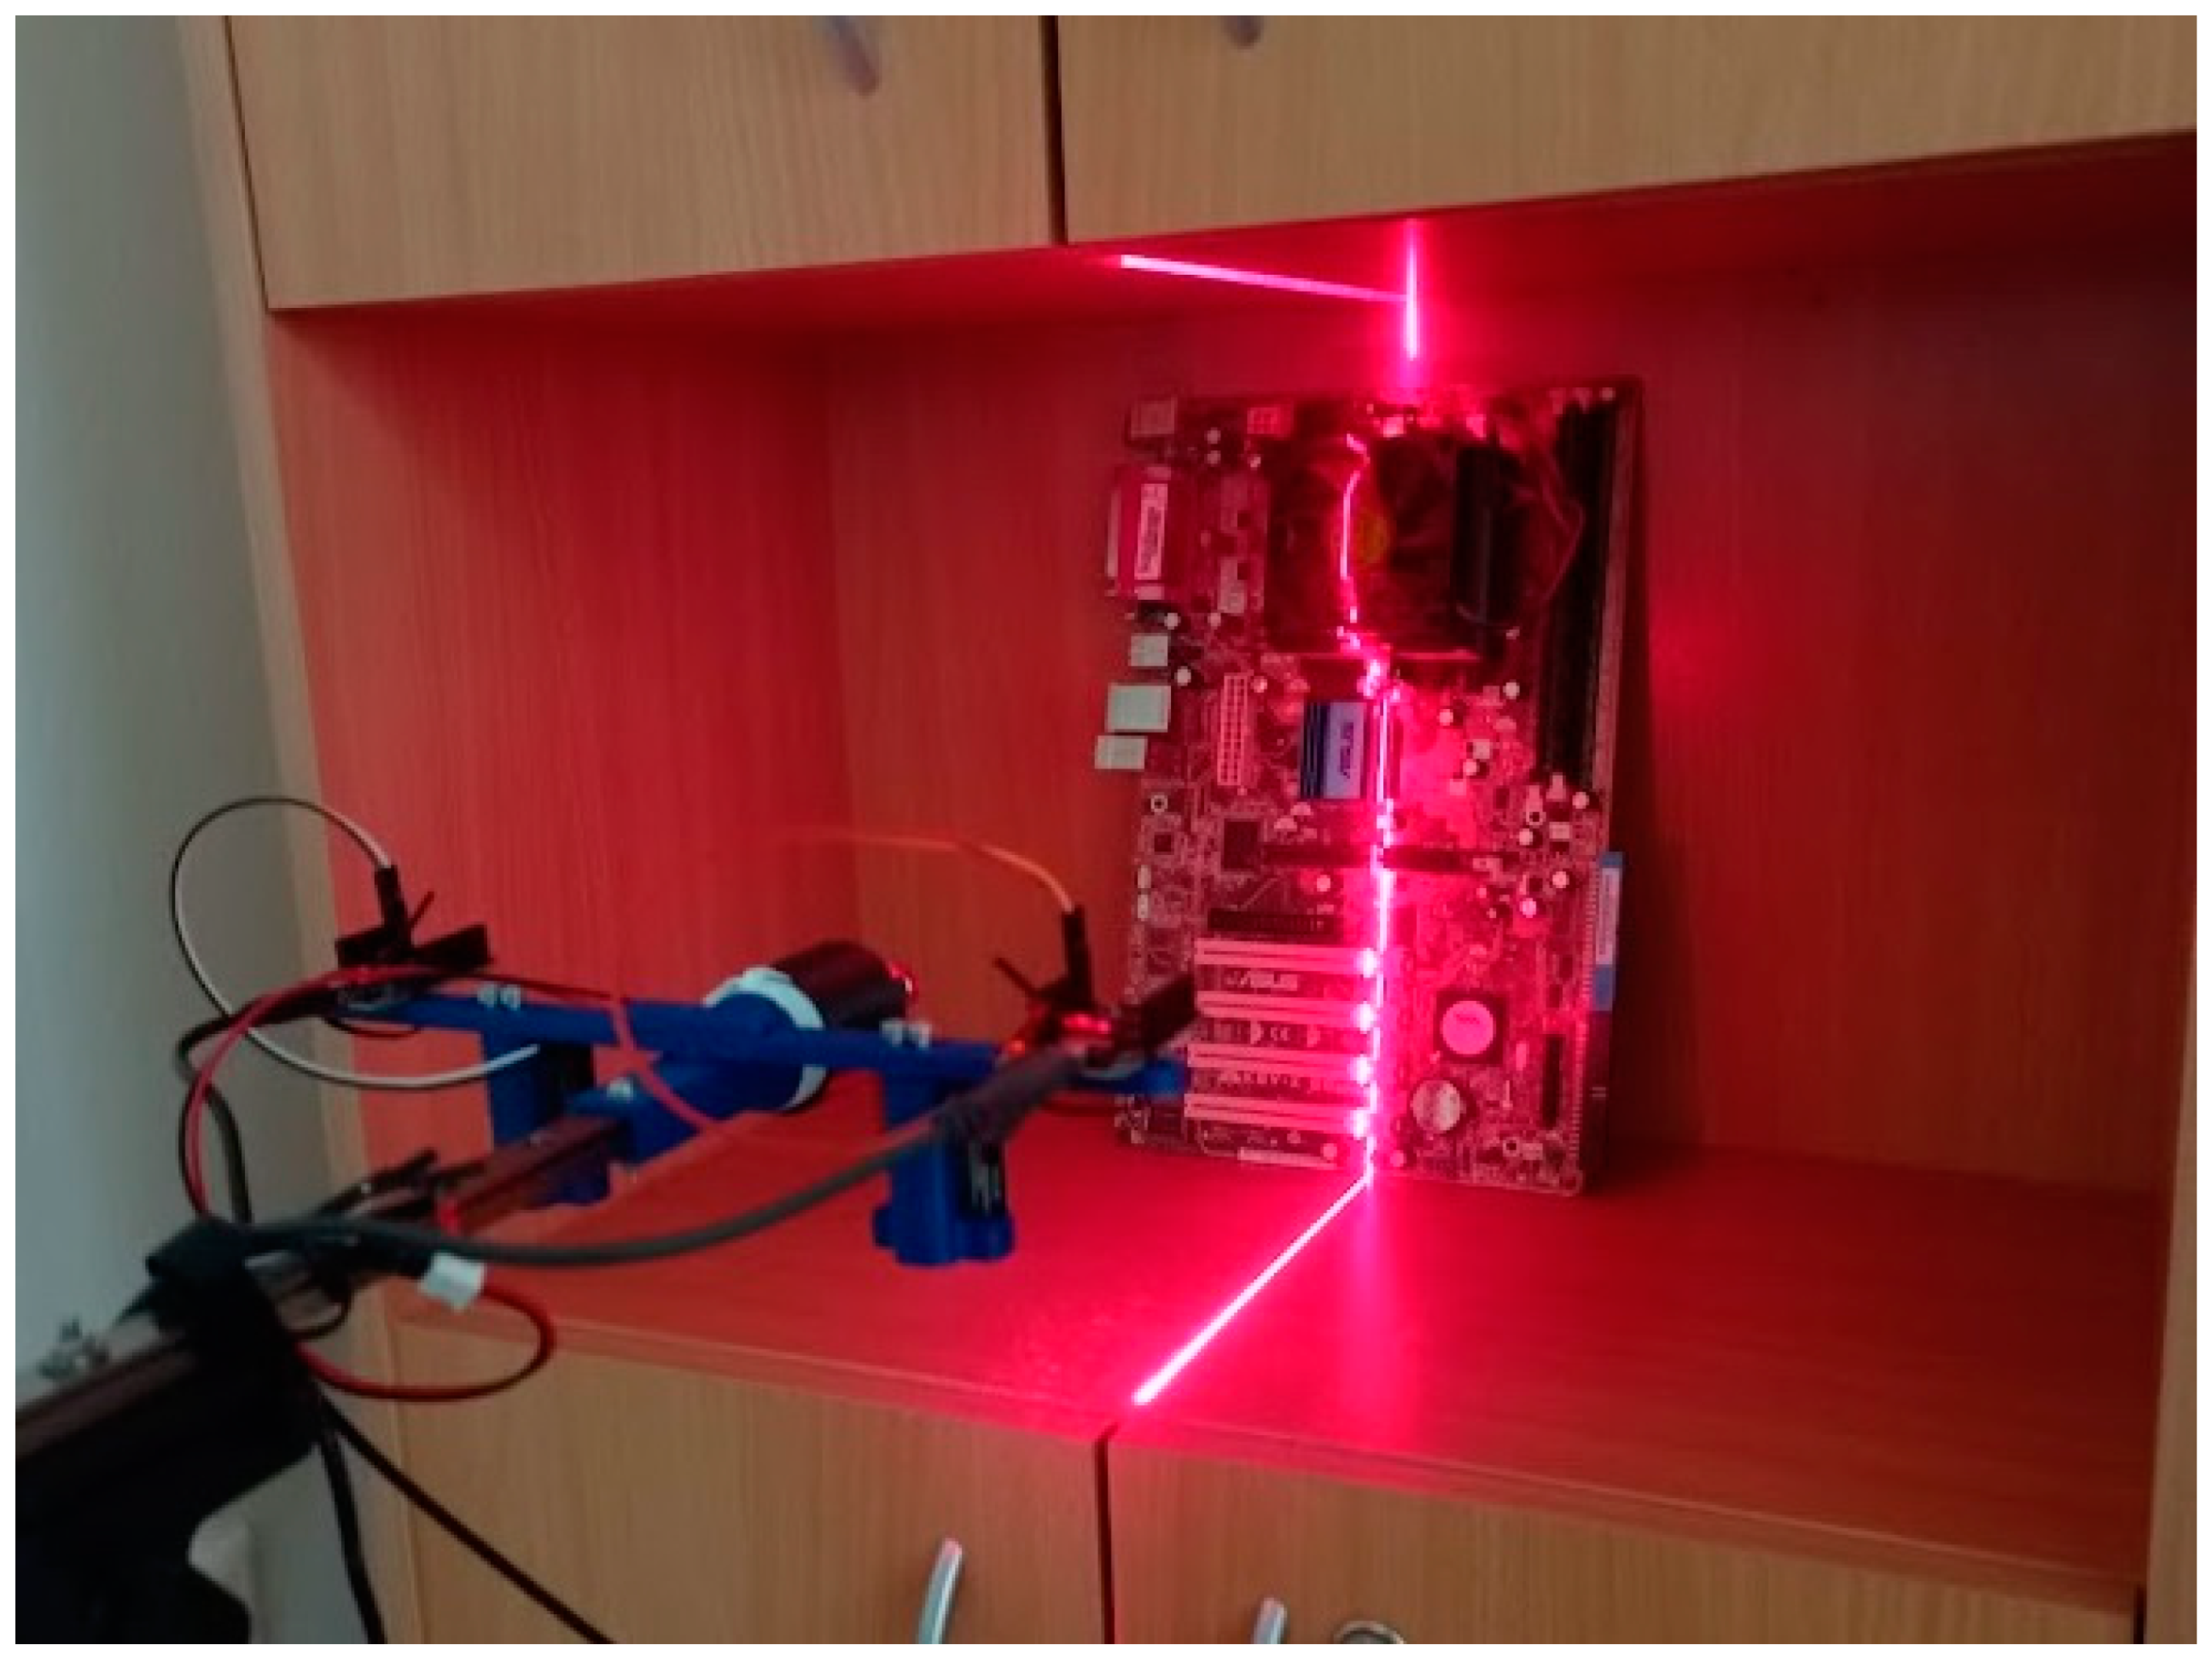
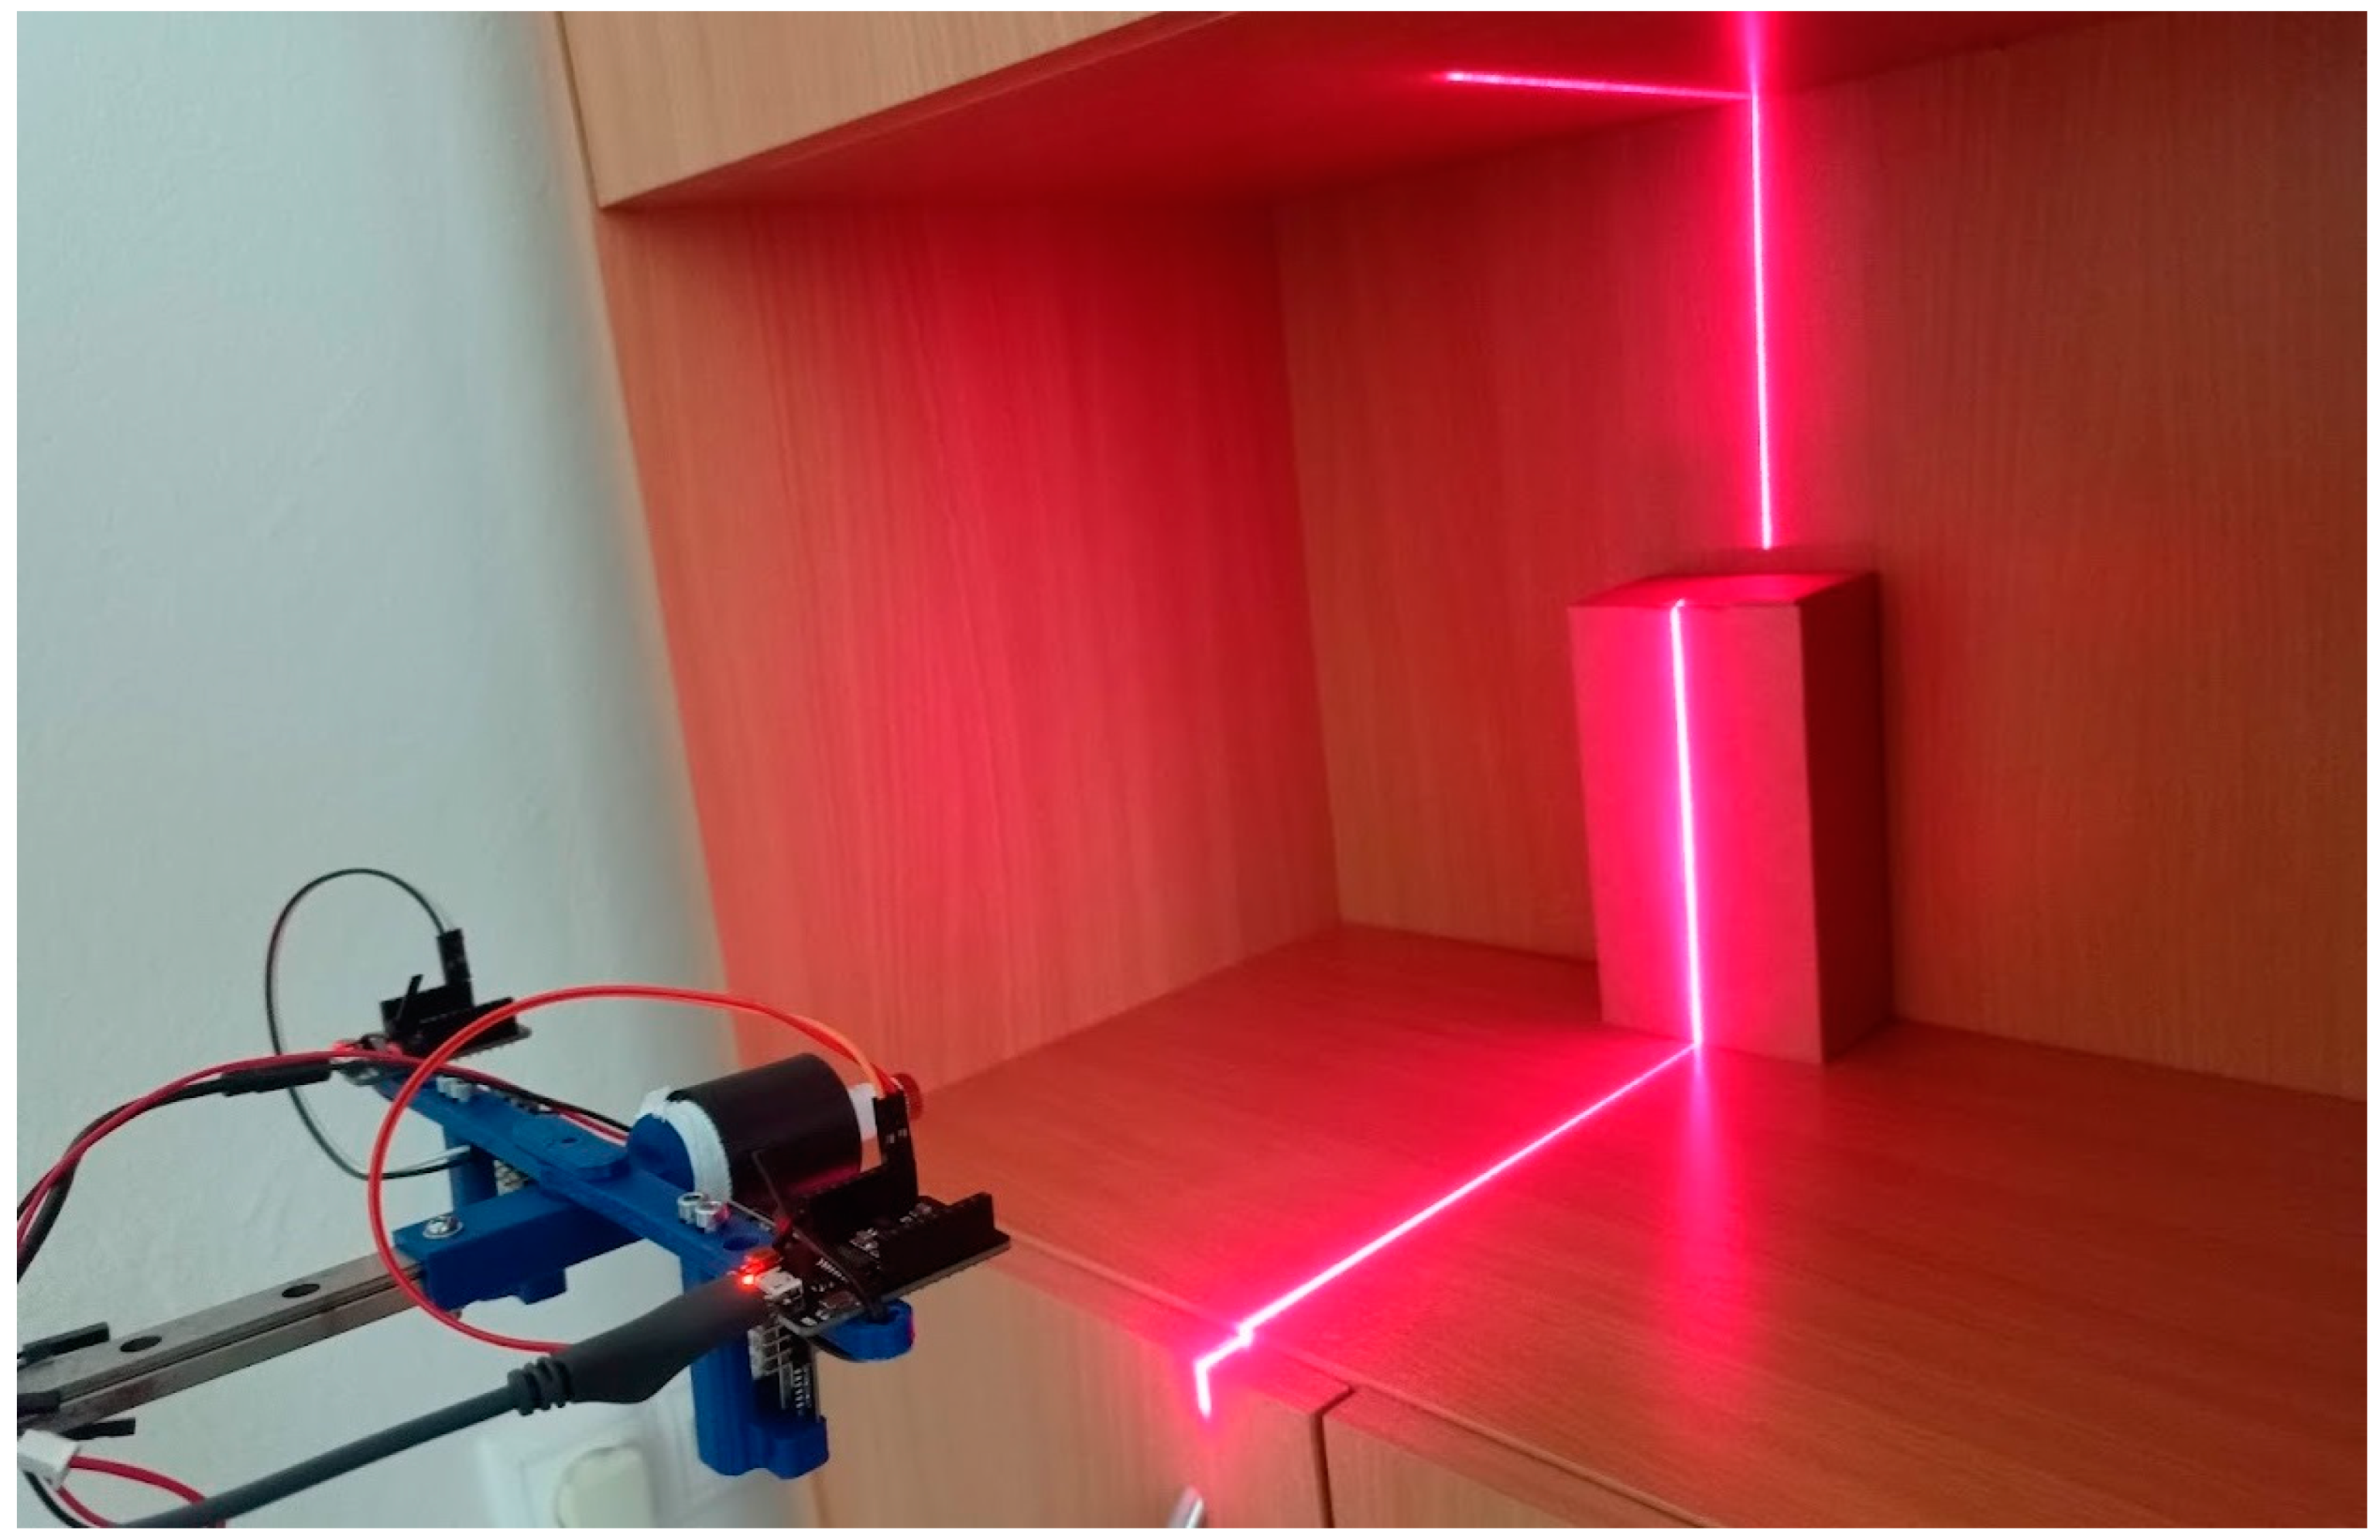
2.4. Initial Design of the Device

As part of the prototype design, the internal and external parameters of the device can be calibrated using OpenCV 4.7.0 libraries. The device itself does not require the use of external reference elements, e.g., reference points. Concurrently, the device necessitates that its position in space and its relative position to the object remain constant during the process of digitization. The calibration of the device is performed freely in space, using cv2.calibrateCamera and cv2.stereoCalibrate libraries for calibrating the camera (internal parameters) and the external parameters of the device, respectively. Given the potential for disparate settings for indoor and outdoor parameters, it is imperative to ascertain the correct parameters for digitizing nearby objects. The parameters that are suitable for digitizing nearby objects differ from those that are suitable for digitizing larger objects in a room. A notable example is the working range of optical sensors, where certain sensors may not function optimally at close distances. The design of the ESP32-CAM devices incorporates modularity and adaptability, facilitating the seamless swapping of optical sensors, modification of camera spacing, and adjustment of camera rotation. This functionality is illustrated in Figure 3.
The device’s design utilizes the active SfS stereovision principle, thereby eliminating the necessity for external reference elements. Consequently, the 3D surface digitization process was conceptualized around a laser pattern, ensuring sufficient coverage of the digitized surface area of an object. To this end, a laser source holder was incorporated into the initial design, enabling its rotation around its own axis. This laser holder is attached to the main device holder by a mechanism, whereby it is attached to the guide while the walls are supported against the main holder. The main holder has been designed with shaped elements that protrude regularly around the circumference of the device; these elements are 60 in number and are regularly spaced within a rotation angle of 6°. Within the laser source holder, four shaped elements are designed to project circumferentially, exhibiting a regular rotation angle of 90°. The friction between these protruding elements enables precise control over the laser beam rotation angle, set at 6°. In the initial proposal, ESP32-CAM devices, manufactured and sourced by AI Thinker in Shenzen, China, are utilized for the execution of stereo pair camera imaging. The utilization of ESP32-CAM facilitates the concurrent operation of two or more cameras, thereby leveraging the comprehensive functionality of the devices. The integration of a PC or laptop facilitates seamless operation, enhancing the user experience. The ESP32-CAM devices establish a wireless connection with the computer via WiFi, eliminating the requirement for a physical cable connection. This feature enhances the device’s portability, facilitating its use in confined or inaccessible locations. The ESP32-CAM devices require a 5 V power supply, consuming no more than 1.5 W during operation. Additionally, the ESP32-CAM facilitates the swift and straightforward replacement of optical sensors, employing optical sensors with a lengthier flex cable connection, thereby reducing the necessary device dimensions. The fabrication of the physical models and parts of the prototype device was carried out using Fused Filament Fabrication (FFF) technology.
The ESP32-CAM technology, developed by Ai-Thinker, employs a System on Chip (SoC) integration approach, encompassing all the essential electronic system circuitry necessary for utilizing the optical sensor within a unified integrated circuit. The ESP32-CAM can be succinctly characterized as a microcomputer that incorporates an optical sensor, encompassing a microprocessor, operating memory, storage capacity, and the capacity to utilize peripheral devices through general-purpose input/output (GPIO) pins. The ESP32-CAM is based on the ESP32-S technology, with the addition of an interface for connecting and exchanging an optical sensor, the OV2460 sensor as standard. The ESP32-CAM employs a Tensilica Xtensa® LX6 microprocessor with two 32-bit cores operating at 240 MHz, thereby enabling its utilization for demanding computer vision applications. The ESP32-CAM is equipped with 520 KB of internal RAM operating memory, augmented by 4 MB of external Pseudo-Static Random Access Memory (PSRAM) and 4 MB of internal memory. Additionally, the device can utilize an external MicroSD memory card, thereby expanding its functional scope without the necessity of connectivity to other devices. The device is equipped with an OV2640 optical sensor, offering a resolution of 1600 × 1200 pixels (equivalent to 2 megapixels) at a frame rate of 15 to 60 frames per second. It is noteworthy that the ESP32-CAM is compatible with additional optical sensors, thereby expanding its functional capabilities. The ESP32-CAM facilitates connectivity with external devices through Wi-Fi 802.11 b/g/n and Bluetooth v4.2 wireless technologies. The device utilizes a 5 V power supply, with an average current consumption of 80 mAh during operation, 160 mAh during image data transmission, and a maximum of 260 mAh when transmitting video with LED lighting activated. The ESP32-CAM is capable of entering a deep sleep mode, during which it exhibits a current consumption of merely 5μA. The ESP32-CAM’s notable advantages over competing cameras include its compact size, the option to use interchangeable optical sensors with extended connection cables (e.g., 75 mm), enabling the placement of a sensor at a distance from the primary unit, and its relatively low current cost within the range of several tens [22].
Prior to utilization of the ESP32-CAM device, its programming is necessary. It should be noted that the ESP32-CAM device itself does not include a USB port that can be used for programming. Consequently, an external programming device or board is required to facilitate programming via the GPIO interface. An alternative option is to utilize the ESP32-CAM-MB add-on board, which incorporates a Micro USB interface. Once connected to a computer via the Arduino IDE, the program can be loaded into the device. After selecting the appropriate board and port within the Arduino IDE, the CameraWebServer library, which is freely available, can be selected and modified. Initially, it is necessary to select the ESP32-CAM device model by removing the comment from the line reading #define CAMERA_MODEL_AI_THINKER. Subsequently, the login credentials for the WiFi router to which the ESP32-CAM devices will connect must be entered. This can be a WiFi router with local network sharing enabled to which both the ESP32-CAM and the computer are connected. The second convenient option is to share the mobile access point with a computer to which the ESP32-CAM devices connect. It is imperative that, upon logging into the local network, the Internet Protocol (IP) addresses of the ESP32-CAM devices can be retrieved from the list of connected devices. These IP addresses will subsequently be utilized in the digitization process. Following the upload of the code to the ESP32-CAM devices and their establishment of a connection within the local network, the cameras become operational through the utilization of a browser-based login interface. This procedure entails entering the IP address of the device into the search bar of a web browser. During the digitization process, it is imperative to maintain a connection with the ESP32-CAM devices within the browser and to have selected the requisite settings from the available menu in the settings panel located on the left side of the browser window. It is imperative to note that closing the browser window can potentially alter the camera capture settings. Within the digitizing process, to create a camera image according to the current browser settings, it is necessary to use a code within which the IP address is written and the text “/capture” is added after it.
The CameraWebServer library facilitates the modification of the camera’s internal parameters according to the available settings. In the context of ESP32-CAM device utilization for digitization applications, adhering to the camera’s pre-calibration internal parameter configuration during the digitization process is paramount for ensuring optimal functionality. In the process of selecting the appropriate scan settings with ESP32-CAM devices, it is imperative to disable the automatic software image corrections and select the appropriate settings so that the laser projection can be uniquely identified within the image. It is imperative to note that, upon loading the CameraWebServer library, the default device processor frequency setting on ESP32-CAM devices is set to 20 MHz, which is incompatible with the device’s optimal functionality. Consequently, it is necessary to adjust this frequency to a range of 6–19 MHz or 21–24 MHz. It is crucial to note that selecting a higher frequency results in increased power consumption and device heating, which is suitable for achieving a higher frame rate during video capture. Conversely, for the sequential capture of individual video frames, a value proximate to the median value, such as 16 MHz, suffices. The CameraWebServer GUI when employing two ESP32-CAM devices is depicted in Figure 4.
In the context of resolution selection, it is evident that a higher resolution is more suitable for the digitization requirements. Consequently, the highest resolution available is set at 1600 × 1200. Consequently, an image quality value of 10 is selected for optimal image quality. Subsequently, automatic image corrections are deactivated, encompassing Auto White Balance (AWB) options, along with AWB Gain, Automatic Exposure Control (AEC), and Auto Exposure Control (AE). These include AEC, AGC, Gamma Correction (Raw GMA), Lens Correction, and Black Pixel Correction (BPC). Notably, White Pixel Correction (WPC) remains as the sole automatic correction that is required to be enabled. This is due to the fact that erroneous white pixels during scanning would be registered during the digitizing process, analogous to the pixels of a projected laser beam. Manual exposure selection is essential, and it is important to have the same settings for both ESP32-CAM devices at the same time during calibration and digitization. It should also be noted that the calibration of this device allows for exposure modification. This feature enables convenient calibration of the device in ambient lighting conditions, followed by exposure adjustment to compensate for variations in lighting conditions when the device is placed in a hard-to-reach place.

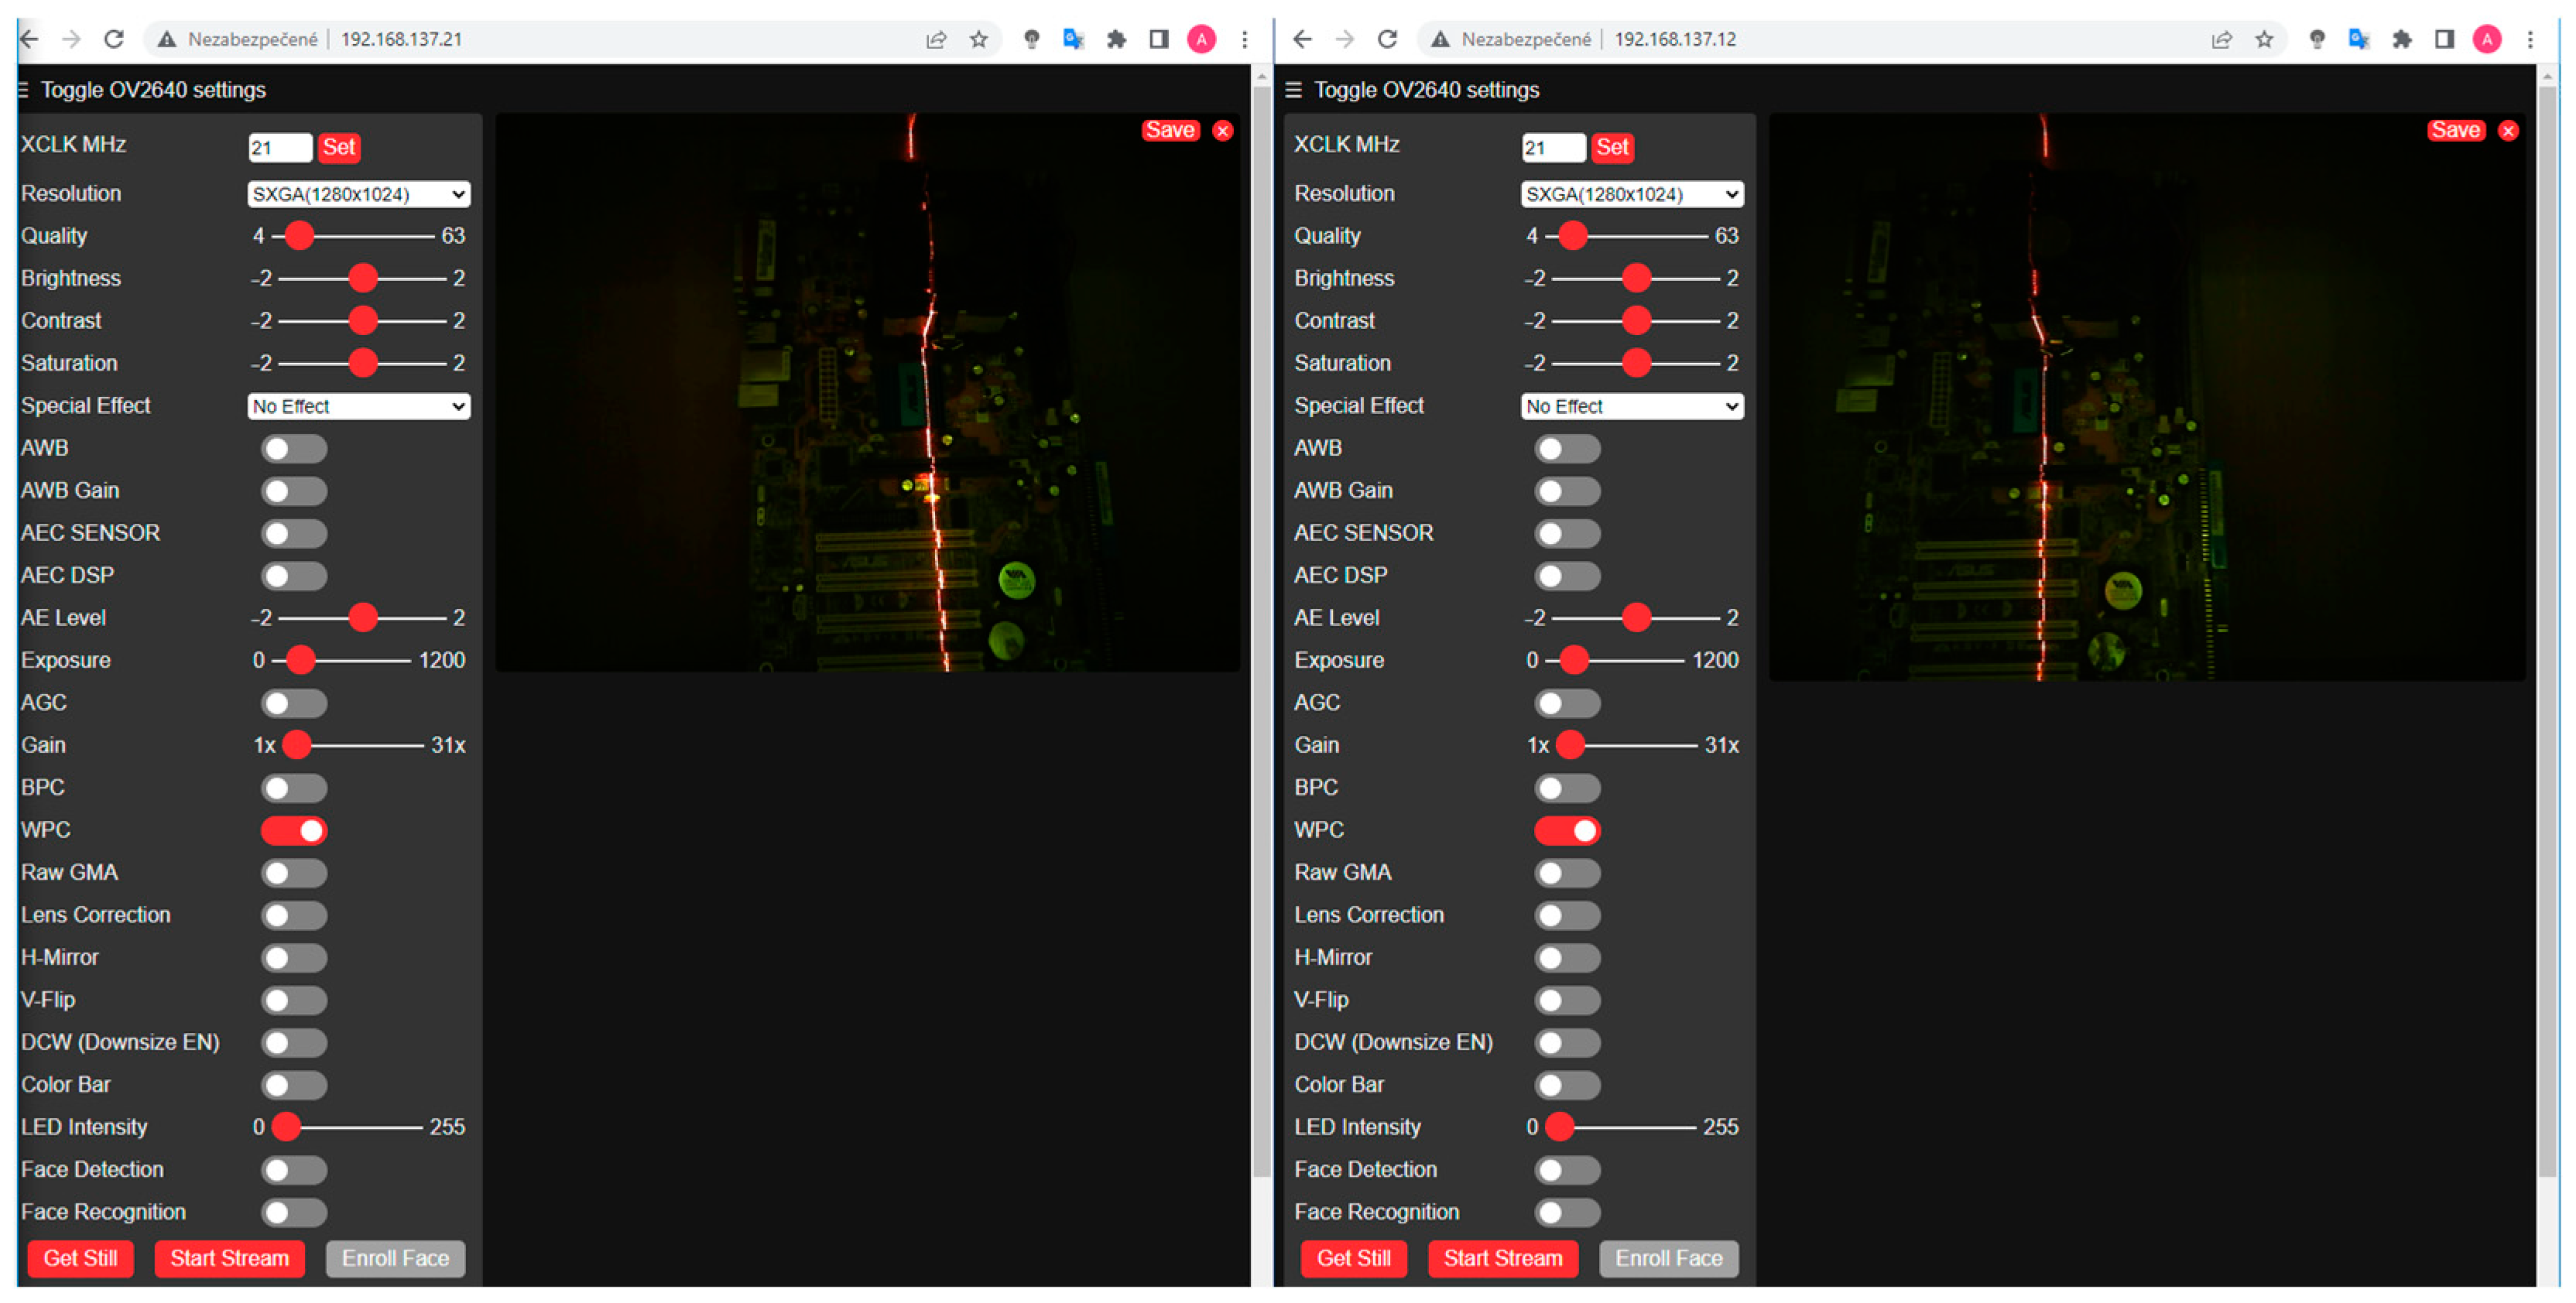
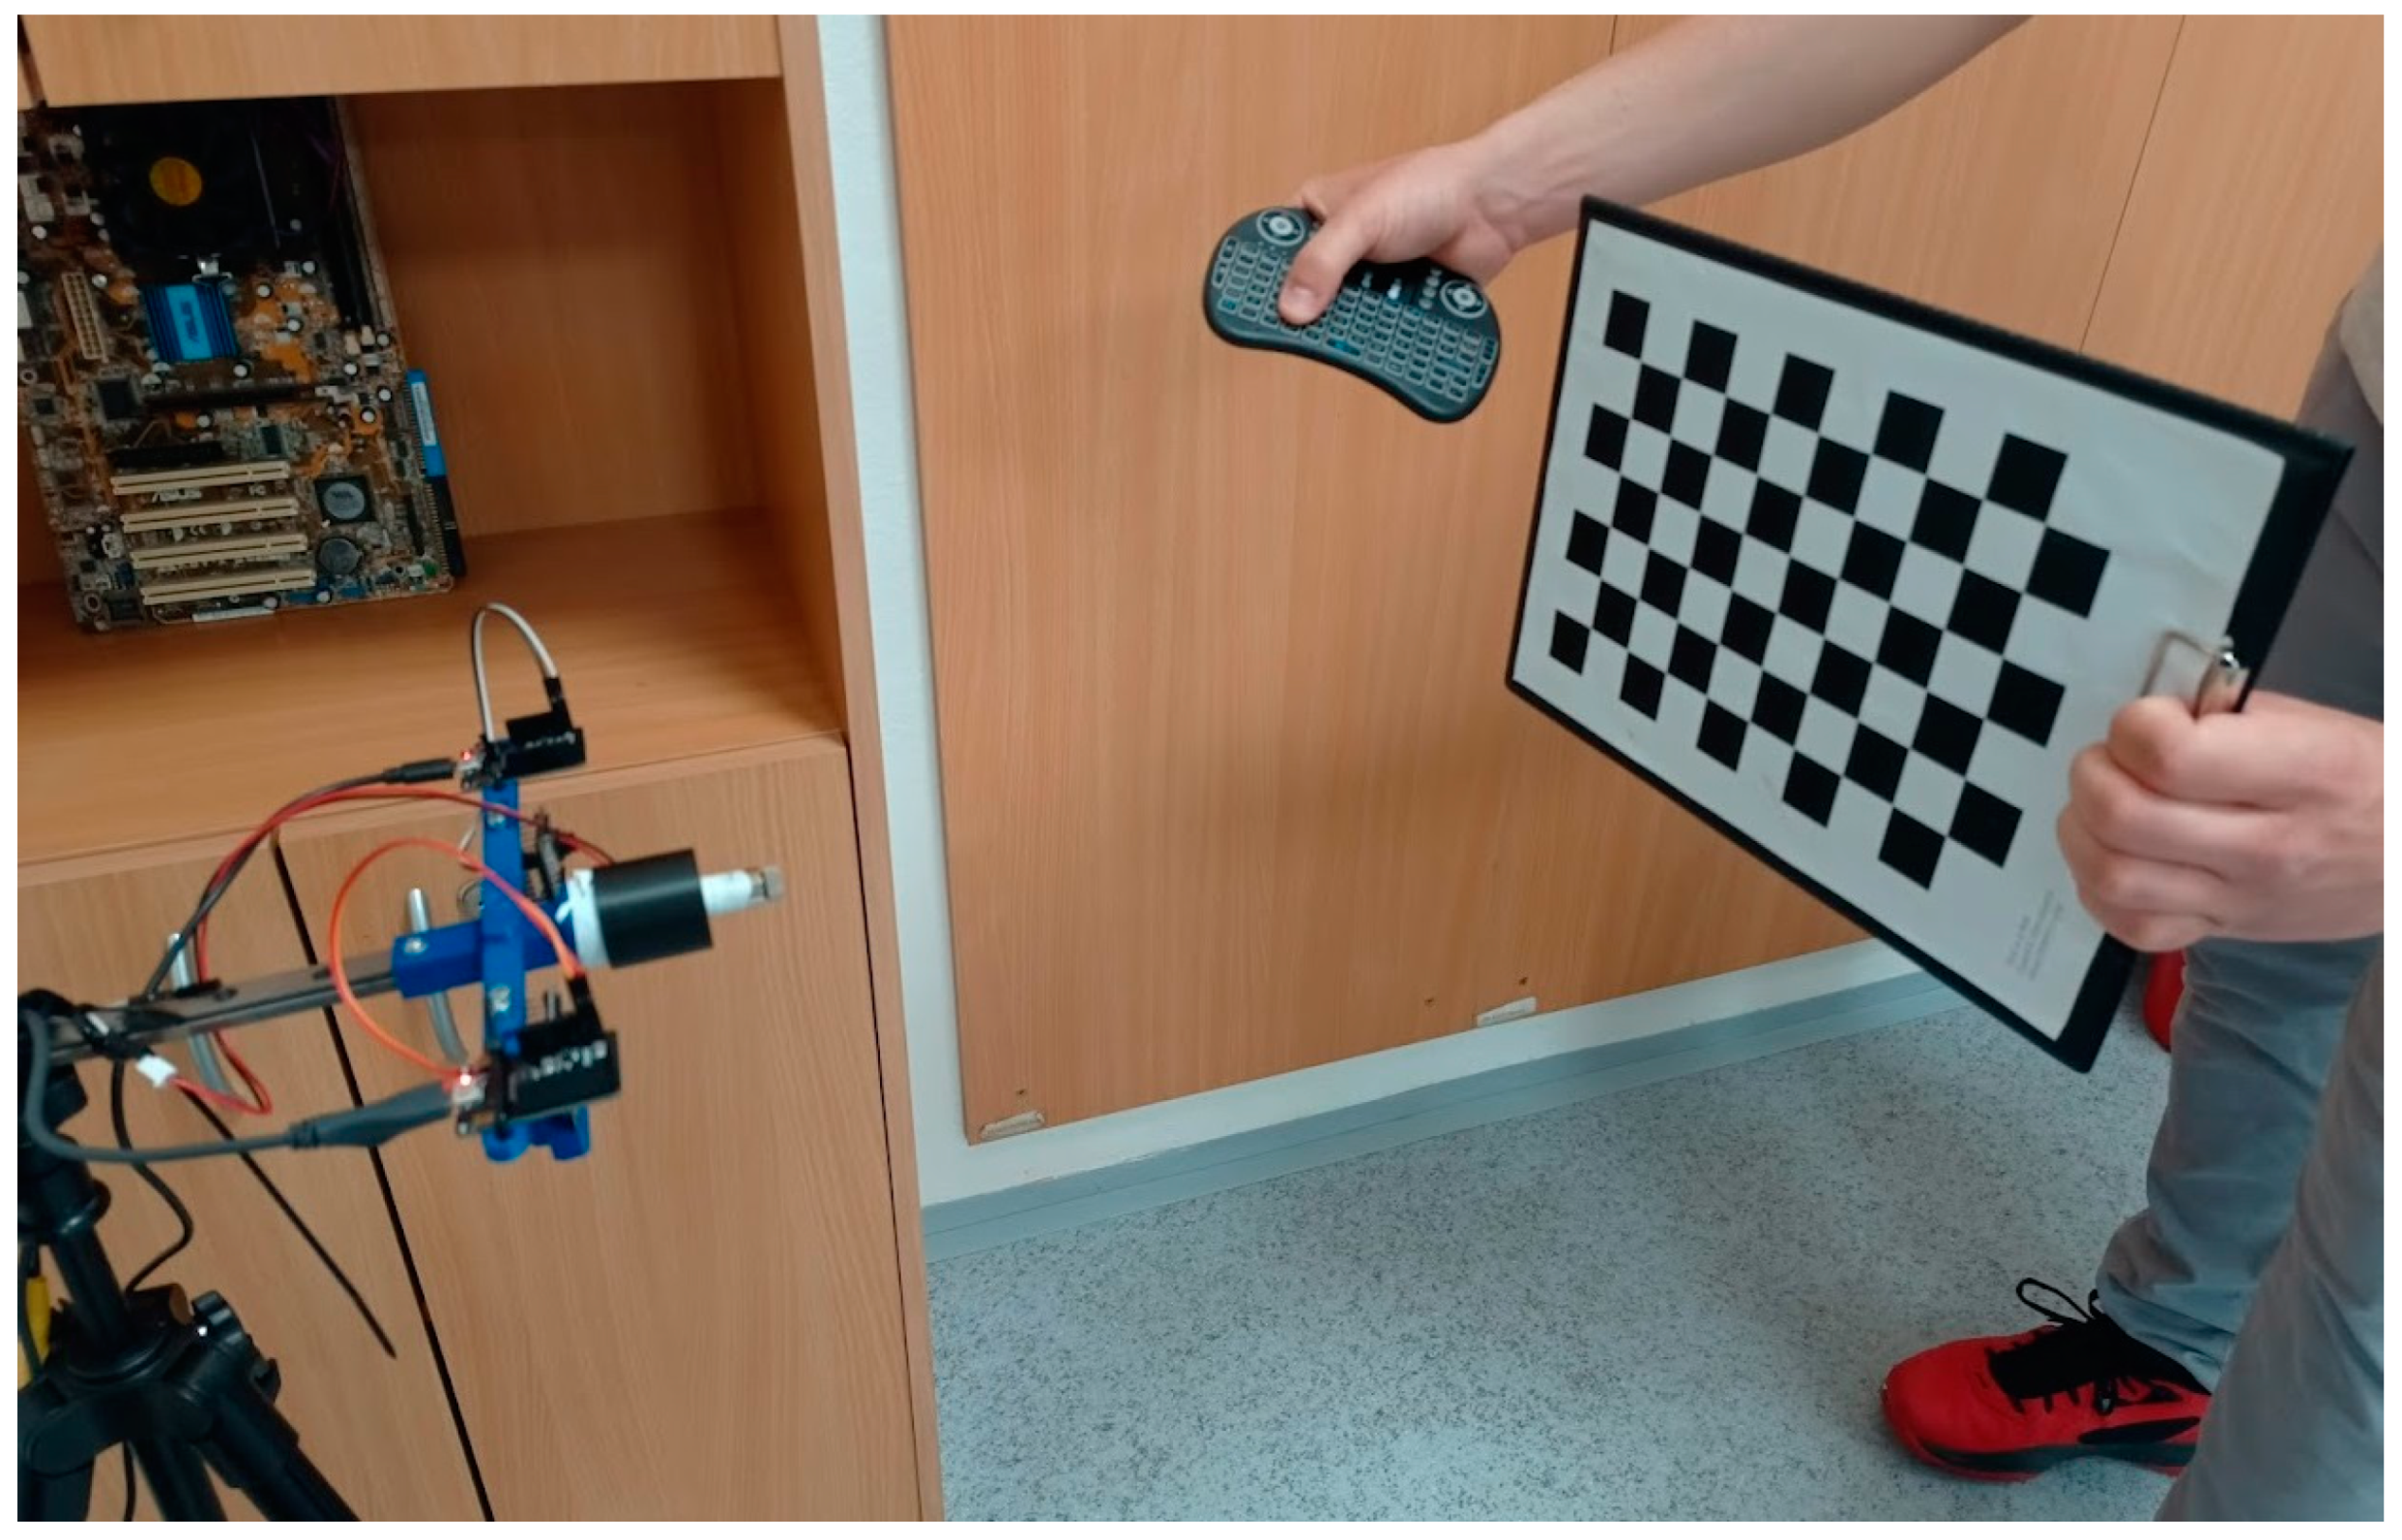
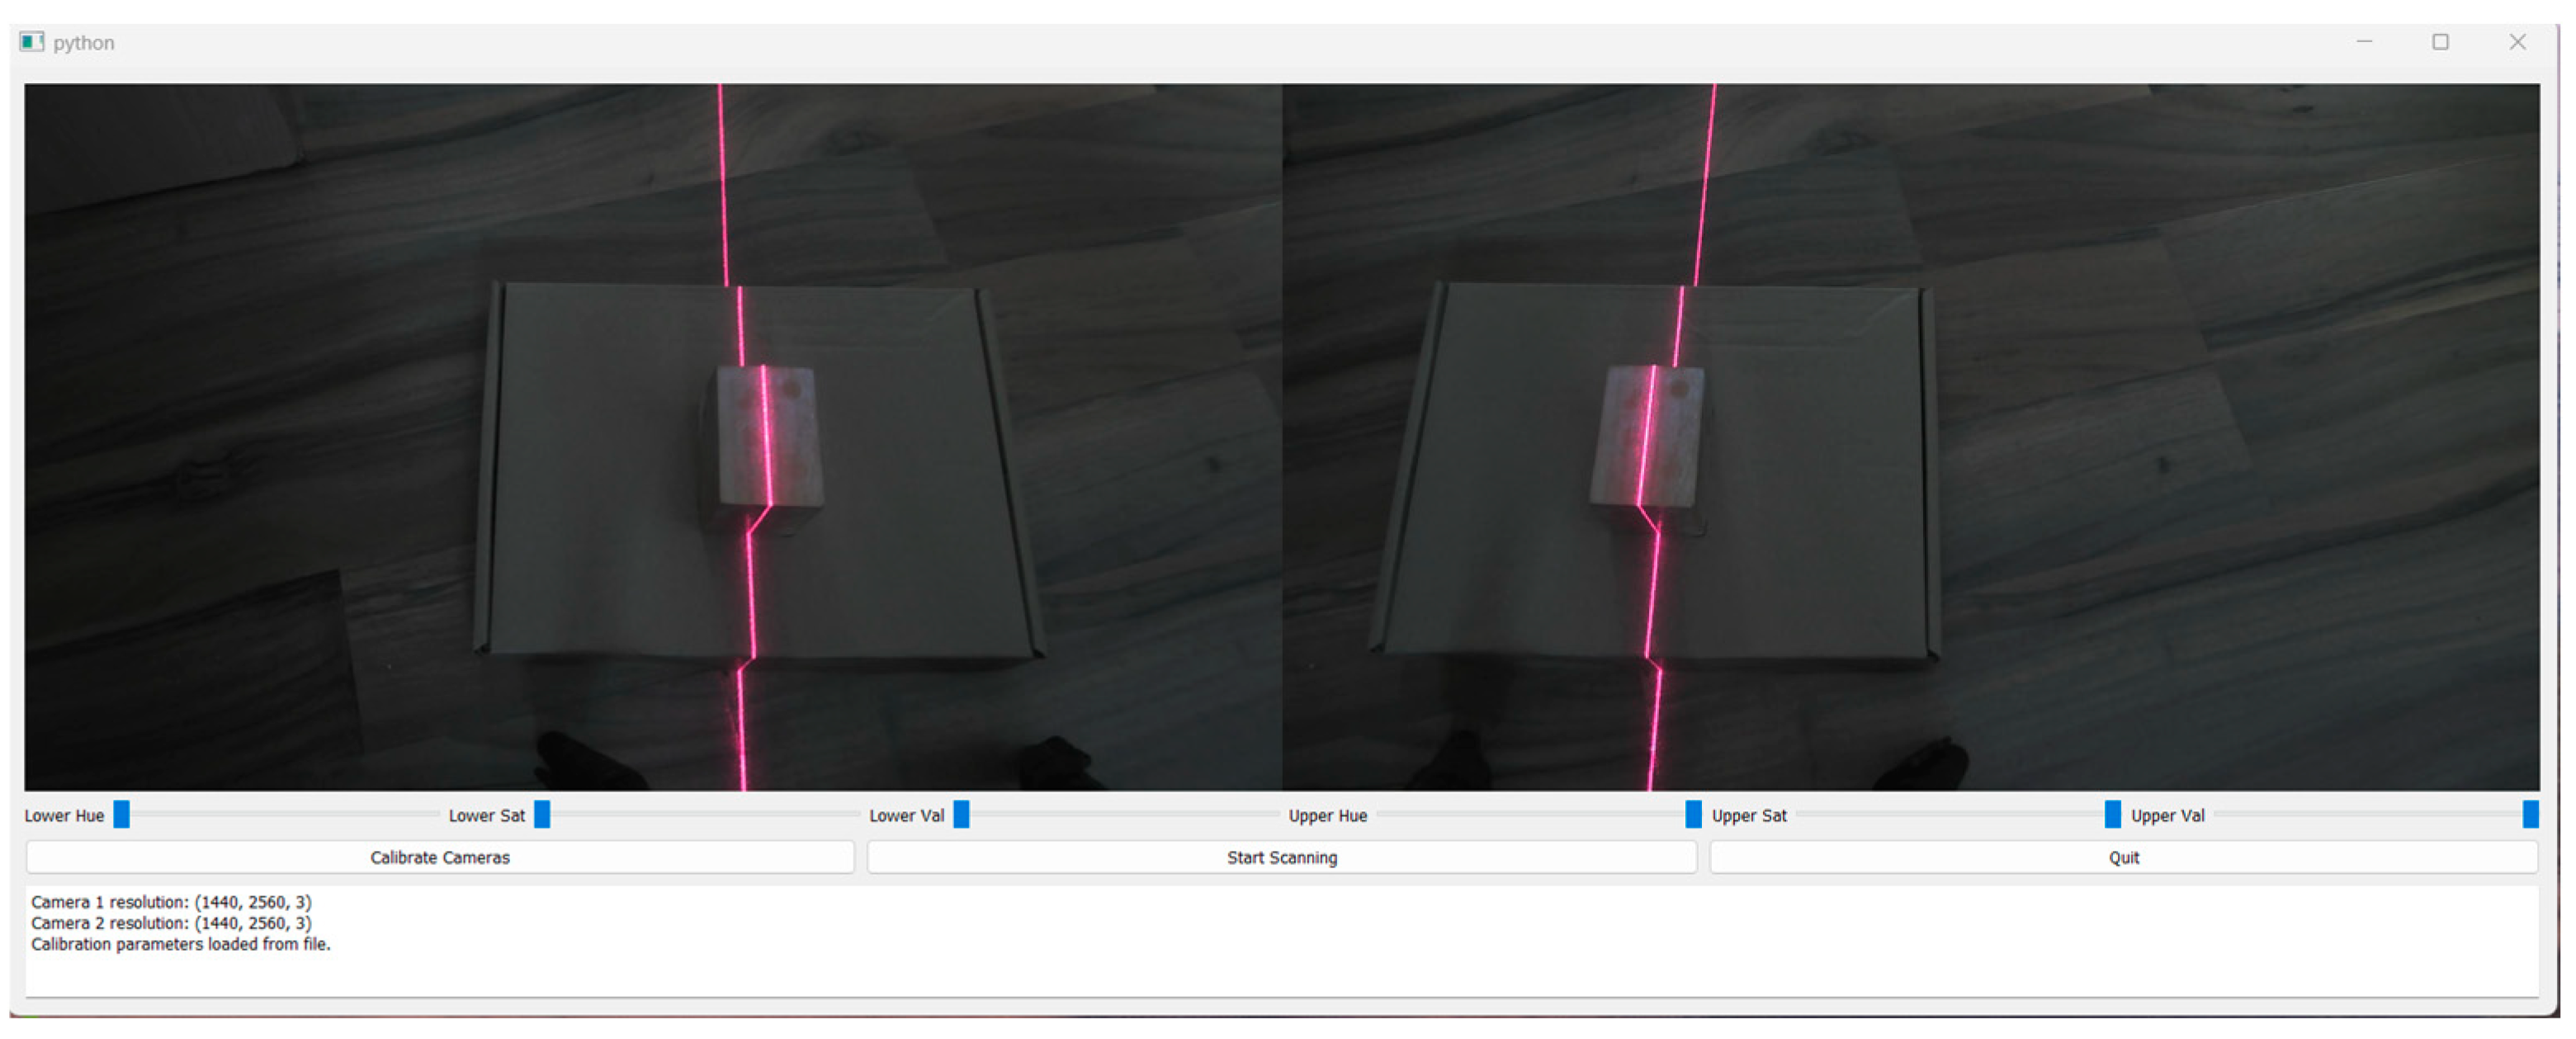
2.5. Calibration of Device

Camera calibration is necessary to mathematically correct for variations due to camera design and lens effects. Camera calibration is critical for real-world measurements using in-camera measurements, and the relationship between image points, distance lengths, and projections is important. Calibration results in defining the geometric properties of the camera and the defocus model from the lenses. The calibration process entails the estimation of both intrinsic and extrinsic camera parameters. These parameters are fundamental to the camera model, as they facilitate the exploitation of relationships, transformations, and projections between the camera coordinate system, 2D image (pixel) coordinates, and the real-world coordinate system [23].
The internal parameters of the camera refer to its internal characteristics and should remain unchanged during calibration and scanning as part of its use in digitization. Modifications to these parameters can be effected by altering the camera settings, such as adjusting the focus or switching lenses. The internal parameters of the camera include focal length, optical center, image distortion, and pixel size. Focal length is defined as the distance between the optical sensor and the optical center. The optical center, alternatively designated as the principal point, is the point of intersection of the optical axis and the image plane, thereby defining the origin of the image co-ordination system. Distortion is caused by curvature of the image by the lens or by misalignment of the sensor. Tangential distortion is characterized by the rounding of straight lines, while radial distortion is caused by misalignment of the sensor and lens. In the context of camera calibration, the internal parameters of the camera are represented by the camera matrix (mtx) and the distortion coefficients (dist) [24].
The external parameters of the camera delineate its position and orientation relative to the real-world coordinate system. These parameters are subject to alteration during the calibration or digitization processes, should there be a change in the camera’s position or orientation. The external parameters are defined by the rotation matrix (R) and the translation vectors (T). The rotation matrix, denoted by R, represents the orientation of the camera, defined by the rotation angles of the axes of the camera coordinate system relative to the world coordinate system. The translation vectors delineate the position of the optical center of the camera relative to the world coordinate system. The calibration of both the internal and external parameters of a single camera in a scene can be achieved through the utilization of the OpenCV libraries and the cv2.calibrateCamera function [25].
A variety of objects can be utilized as calibration objects, with their visual elements being suitably registered. Currently, checkerboard patterns with alternating white and black squares or dot patterns with well-defined pattern dimensions are employed in camera calibration. These patterns offer distinct advantages over three-dimensional calibration objects, primarily due to their high contrast properties. Additionally, their printability on standard office paper facilitates their use in practical applications. Given the known dimensions of the checkerboard pattern, its position and rotation angle relative to the scene and camera coordinate systems can be defined through calibration. To ensure sufficient accuracy in the calibration process, it is imperative to scan the pattern multiple times and rotate it in various directions during the scanning procedure. It is recommended to obtain a minimum of 31 scans of the calibration pattern. To calibrate the internal and external parameters of a single camera in a scene, the OpenCV libraries and the cv2.calibrateCamera function can be used, but a specific procedure must be followed and multiple OpenCV functions must be used in sequence [26].
Within the software design, it is then necessary to define a function to calibrate the internal and external parameters of the cameras separately. For this purpose, the OpenCV libraries cv2.calibrateCamera for calibrating the internal parameters of the cameras and cv2.stereoCalibrate for calibrating the external parameters of the entire device are used. The actual calibration of the internal and external device parameters performed by the user within the scene was done using a printed, periodically repeated chessboard pattern printed on paper and glued to a hardboard [27]. Given the distance between the user and the computer, and the user’s manual placement of the calibration pattern within the scene, it is advantageous to employ a wireless keyboard.
For this purpose, a wireless keyboard connected to the computer via Bluetooth is selected, enabling the user to hold the keyboard and press buttons with a single hand. This can be seen in Figure 5. This straightforward solution significantly enhances the portability of the device. Subsequent to the initiation of the program, the device must be positioned in a manner that enables the calibration pattern to be captured by its cameras. It is imperative during the process of calibration that the calibration pattern be moved and rotated within the field of view of the cameras, ensuring the sharpness of the acquired images is maintained by maintaining the calibration pattern in a fixed position at the moment of acquisition. It is imperative to ensure that the equipment remains static during the calibration process. Multiple scans are required for accurate calculation, but excessive scans can strain computer processing power during calibration. A suitable number of frames is between 31 and 60 frames.
The acquired images are displayed on a computer monitor, enabling users to visually verify the accurate positioning of the calibration pattern within the field of view of the cameras. These observations can be seen in Figure 5. Upon completion of a sufficient number of images, the user initiates the calibration process. Subsequently, the calculation of the calibration parameters is initiated. Upon completion of the calibration process, a confirmation message is displayed, and the device can be maneuvered within the 3D scanning work area. At this juncture, the laser beam projection can be activated, and the thresholding of the laser pattern can be initiated. The laser beam projection is illustrated in Figure 6.

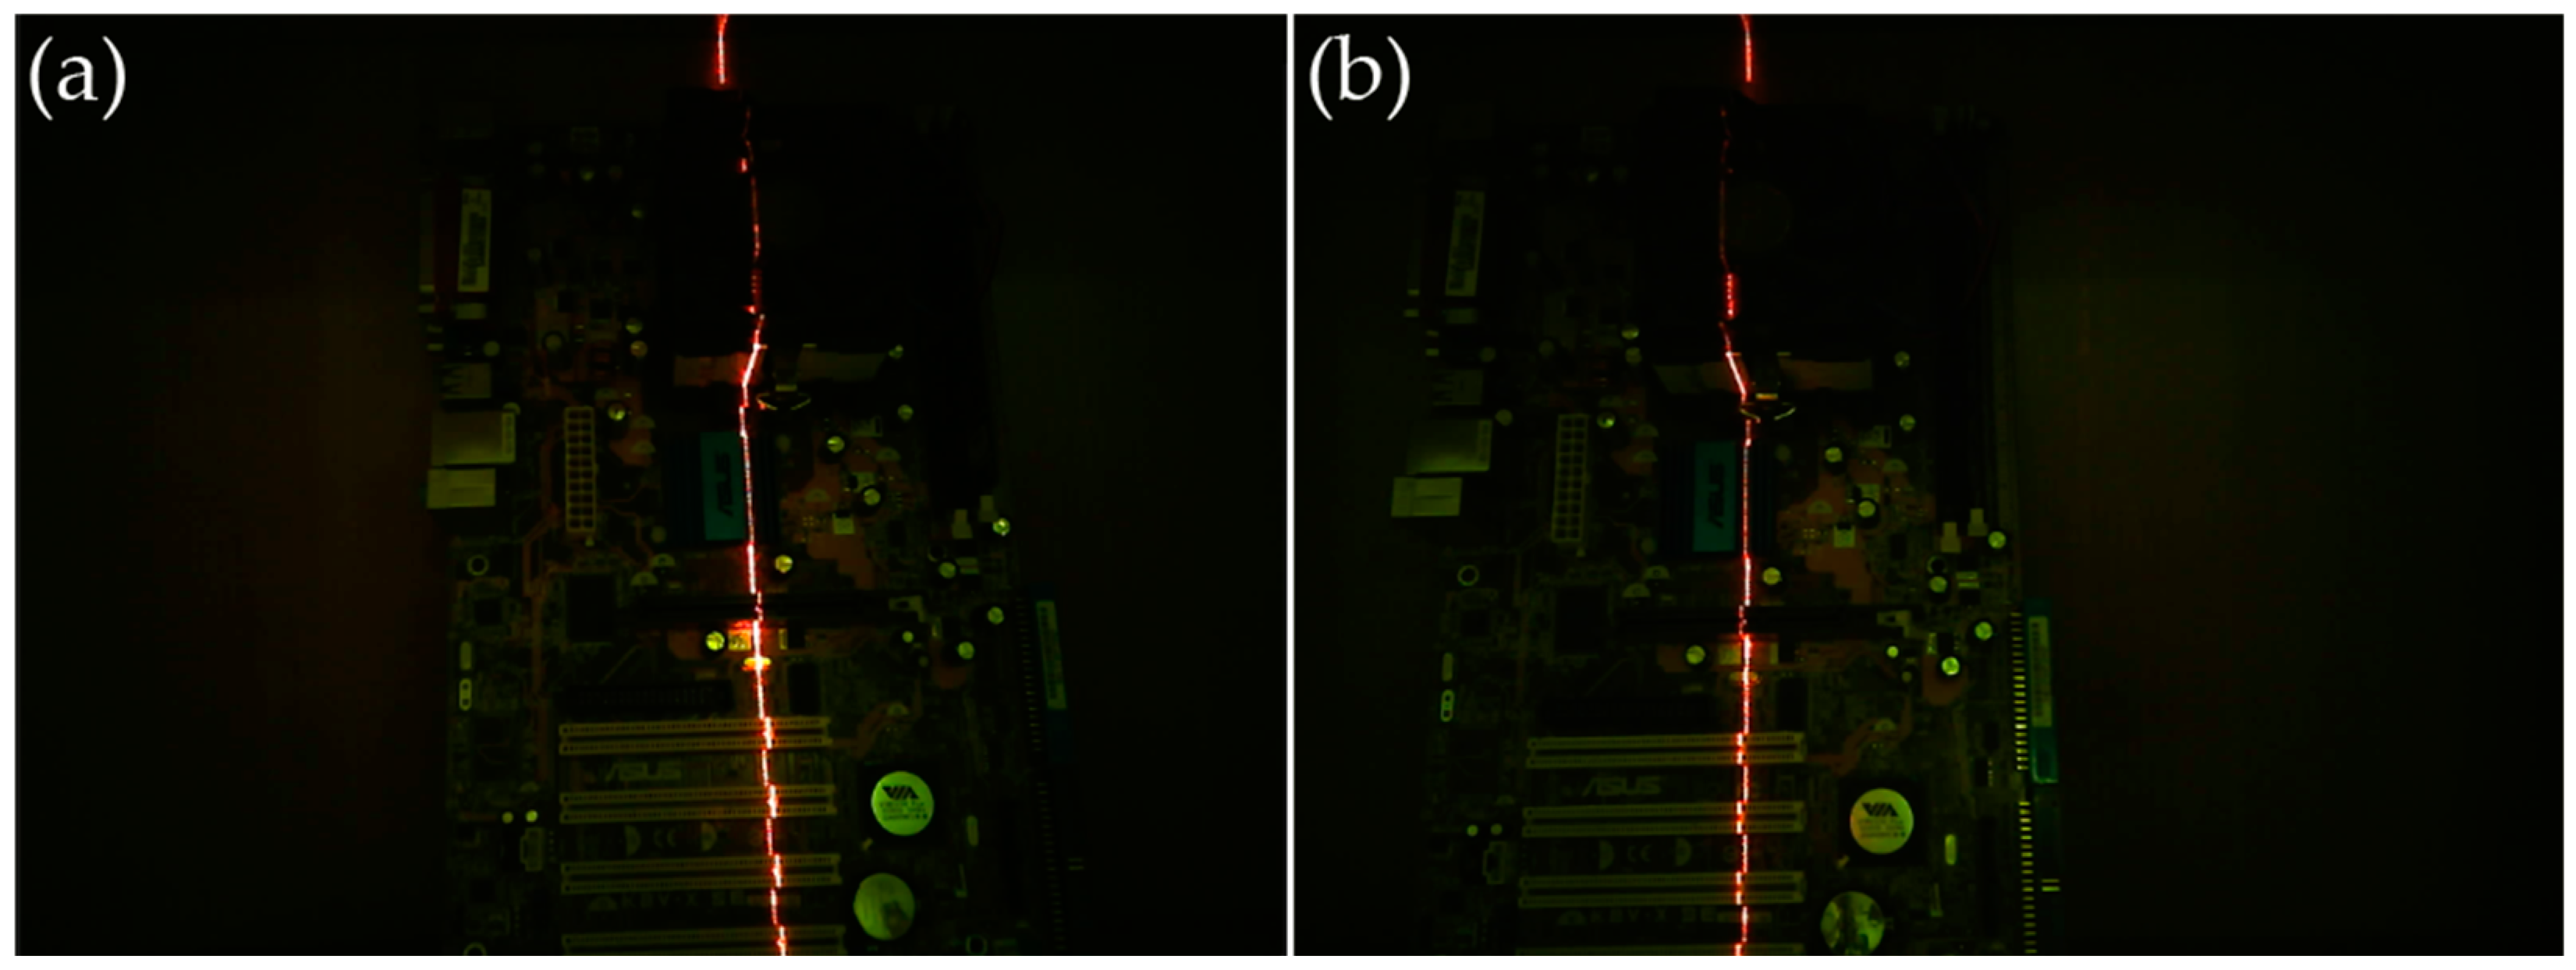
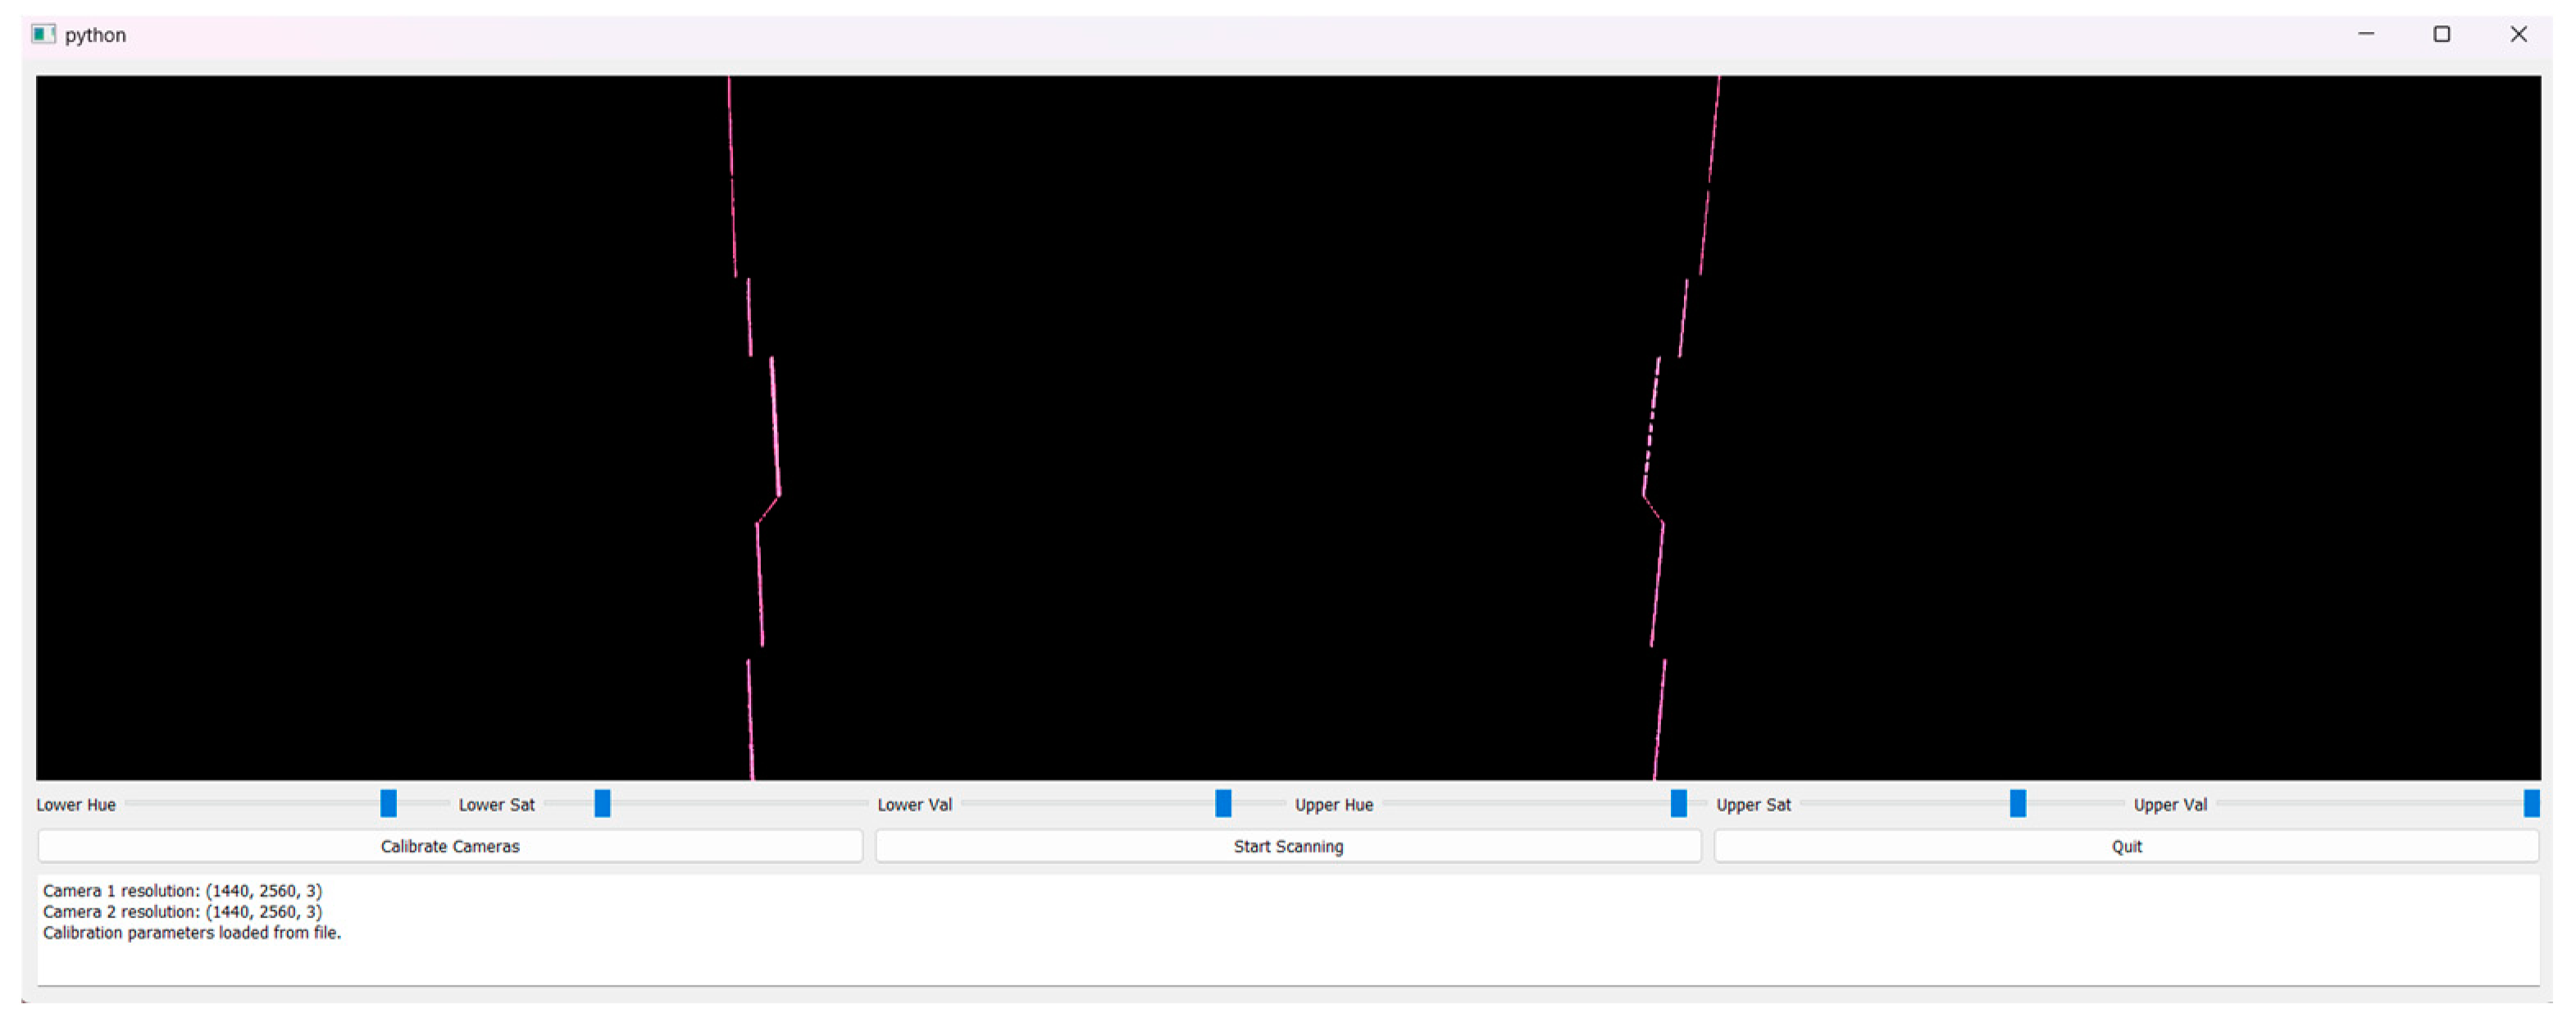
2.6. Image Processing for Calculating 3D Surface Coordinates

As part of the program design, it is necessary to design a code to process the images acquired by the ESP32-CAM devices with the current settings. This code must adjust the image by rectification for distortion correction based on the distortion vectors obtained by calibration. Initially, the rectification of the cameras is computed using the cv2.stereoRectify library. Subsequently, the maps are computed as a basis for distortion correction and image rectification. Subsequent to the rectification of the maps, the rectification of the images is performed. This function yields aligned images with aligned epipolar planes, thereby enabling depth calculation based on the distortion of the image points.
Consequently, extraction of the projected laser beam within the image points was implemented. A method employing thresholding was selected. Initially, the camera image undergoes processing and conversion into a monochromatic color image through the utilization of the cv2.cvtColor and cv2.COLOR_BGR2GRAY functions. The representation of the image frames prior to the extraction of the laser pattern can be observed in Figure 7. Subsequently, the image is transformed into binary code using the cv2.treshold and cv2.TRESH_BINARY functions, and a threshold is chosen within the brightness (threshold) below which all pixels have a value of 0 and above which they have a value of 1. In this way, with respect to the brightness of the monochrome image, it is possible to extract the lighter pixels. Given the utilization of a laser line within the device, it is presumed that the projected laser image is more luminous than its surroundings within the camera image. however. This method of extracting the projected laser beam is simple and efficient, but is sensitive to light reflections or bright areas illuminated by a stronger light source [28].
Consequently, a function for adjusting the threshold is proposed, since brightness is influenced by several factors and settings, from the software adjustment of the settings to the lighting conditions within the scene. Initially, a threshold of 230 is designated. The image within the current threshold is then displayed, and the user can press the + and − buttons to add and remove threshold values in increments of 5. This process is illustrated in Figure 8.
As part of the program design, it is necessary to select an appropriate program function to calculate the depth of the 3D point cloud based on the obtained binary image and the disparity between these images. The initial function evaluated was cv2.stereoBM, which utilizes depth calculation based on entire image frames. In this approach, common visual features are sought within a stereo pair of images, allowing for registration across both camera frames and unique distinction. The generation of blocks with similar disparity is predicated on these common features. A similar function is cv2.stereoSGBM, which has been demonstrated to produce more accurate results by taking into account not only the visual elements but also the surrounding blocks. However, when implemented within the proposed program, both cv2.stereoBM and cv2.stereoSGBM failed to generate a 3D point cloud. This failure can be attributed to the fact that these functions are designed to analyze a color stereo image pair and look for correspondences based on visual features. They are not designed to be used in combination with a laser projector. The cv2.stereoBM and cv2.stereoSGBM functions demonstrate suboptimal accuracy and precision, rendering them unsuitable for scanning close objects in demanding applications. The utilization of laser pattern projection has been proposed within the device under evaluation to obtain a shared visual feature (projected laser pattern) within a stereo image pair at the requisite quality level. The rectified and thresholded binary images employed in this study necessitated the development of a custom program function to leverage the laser pattern, thereby facilitating the acquisition of higher quality data.
To address these challenges, a custom program function was designed. Initially, the baseline is calculated as the distance between the cameras based on the transformation vector T. Subsequently, the focal length is calculated as the average of the focal lengths of the two cameras. Subsequent to this initial step, it is imperative to identify and extract the non-zero values within the images, a process that necessitates the implementation of a thresholding technique. Thereafter, an order of values is established, wherein the 3D coordinate points are to be stored. Subsequently, for each point in the first image, a corresponding point in the second image is located in the non-zero points in the same pixel row. The rectification of the images, the identification of their epipolar lines, and the subsequent alignment of the rows of pixels are utilized to calculate the disparity within them. Consequently, the fundamental formula for calculating depth based on disparity is employed. This formula is then utilized to calculate the X and Y coordinates. The resultant coordinates are then appended to the array points_3D.
The program’s primary function involves the invocation of previously defined functions, which are then executed in a sequential manner. Initially, web links are obtained to access the ESP32-CAM devices. The number of squares in the calibration pattern is selected, and the image acquisition queues for calibration are created. Subsequently, the user confirms the opening of the image windows for calibration. It is imperative to emphasize that within the calibration process, but this also pertains to other components of the program, the active window with one of the camera images is selected by clicking. Otherwise, the program fails to obtain input from the keyboard. Once a sufficient number of images of the calibration pattern have been acquired, calibration of the device is performed after confirmation by the user. Following the completion of calibration, it is essential to physically move the device to the designated location and orient it appropriately, especially in hard-to-reach areas. Subsequent to the aforementioned orientation, the laser projector is to be activated, and the confirmation of activation is to be made by pressing any key. The initial image pair is then captured, including the laser image projected onto the target. Subsequent to the imaging process, a thresholding operation is performed, and the binary image windows are opened after thresholding with the initial values. The user can adjust the threshold value by pressing the “+” and “−” buttons, which in turn adjusts the binary image according to the current threshold value. If the user is satisfied with the selected thresholding, they confirm it. Then, they click on the camera image from the calibration to activate it and continue to perform the scan. Subsequently, a scan is performed, with the user changing the position of the laser projector in between to cover the necessary part of the surface of the object to be scanned. Following calibration, while maintaining the device in a fixed position during scanning, the user can adjust the position of the laser projector. Any displacement of the device or cameras will result in a reduction in the accuracy, precision, and quality of the acquired surface point cloud. The resulting point cloud would then be shifted by the value of the device displacement.
To describe the scanning process, it is useful to consider an ideal stereovision setup where the cameras are perfectly aligned after distortion correction, i.e., the image planes are coplanar and their optical axes are parallel with a known mutual distance and the same focal length fl = fr. This configuration can be observed in Figure 9, as depicted in the three-dimensional view. In this case, the principle axes can be considered as the optical axes, since in an ideal camera design the optical and principle axes are identical. However, in practice, due to imperfect alignment of the lenses and the optical sensor, the principal axes exhibit a slight deviation from the optical axis of the camera. Consequently, it is more precise to refrain from utilizing the term “optical center”, which is the intersection of the image plane and the optical axis. Instead, the term “principle point cxl and cxr” is more appropriate. In this case, we consider that these principle points are calibrated and their coordinates are at the same location within the horizontally inverted image planes. It is further assumed that it is possible to find a point P within the object and the real world, which is represented in the image plane at the points pl and pr, whose horizontal coordinates are xl in the left image plane and xr in the right image plane. The depth of Z relative to point P is directly proportional to the disparity within the image planes [27].
The disparity and depth of Z are determined by the following equations:
d = x l x r ,
T x l x r Z f = T Z ,
Z = fT x l x r

3. Results

In the course of evaluating the initial version of the test device program, 57 scans of the calibration pattern were performed. Subsequently, 37 scans were obtained as part of the scanning process. This resulted in a point cloud with a file size of 7638 kB. GOM Inspect 2018 was utilized to conduct a visual inspection of the obtained point cloud, which was subsequently imported. Following a thorough visual inspection by the user, it can be concluded that the calibration and scanning were successful and that the point cloud obtained corresponds to the scanned surface. This observation is further substantiated by Figure 10. The scanned surface of the computer motherboard, which was selected due to its complex shape and numerous small features, was successfully scanned.

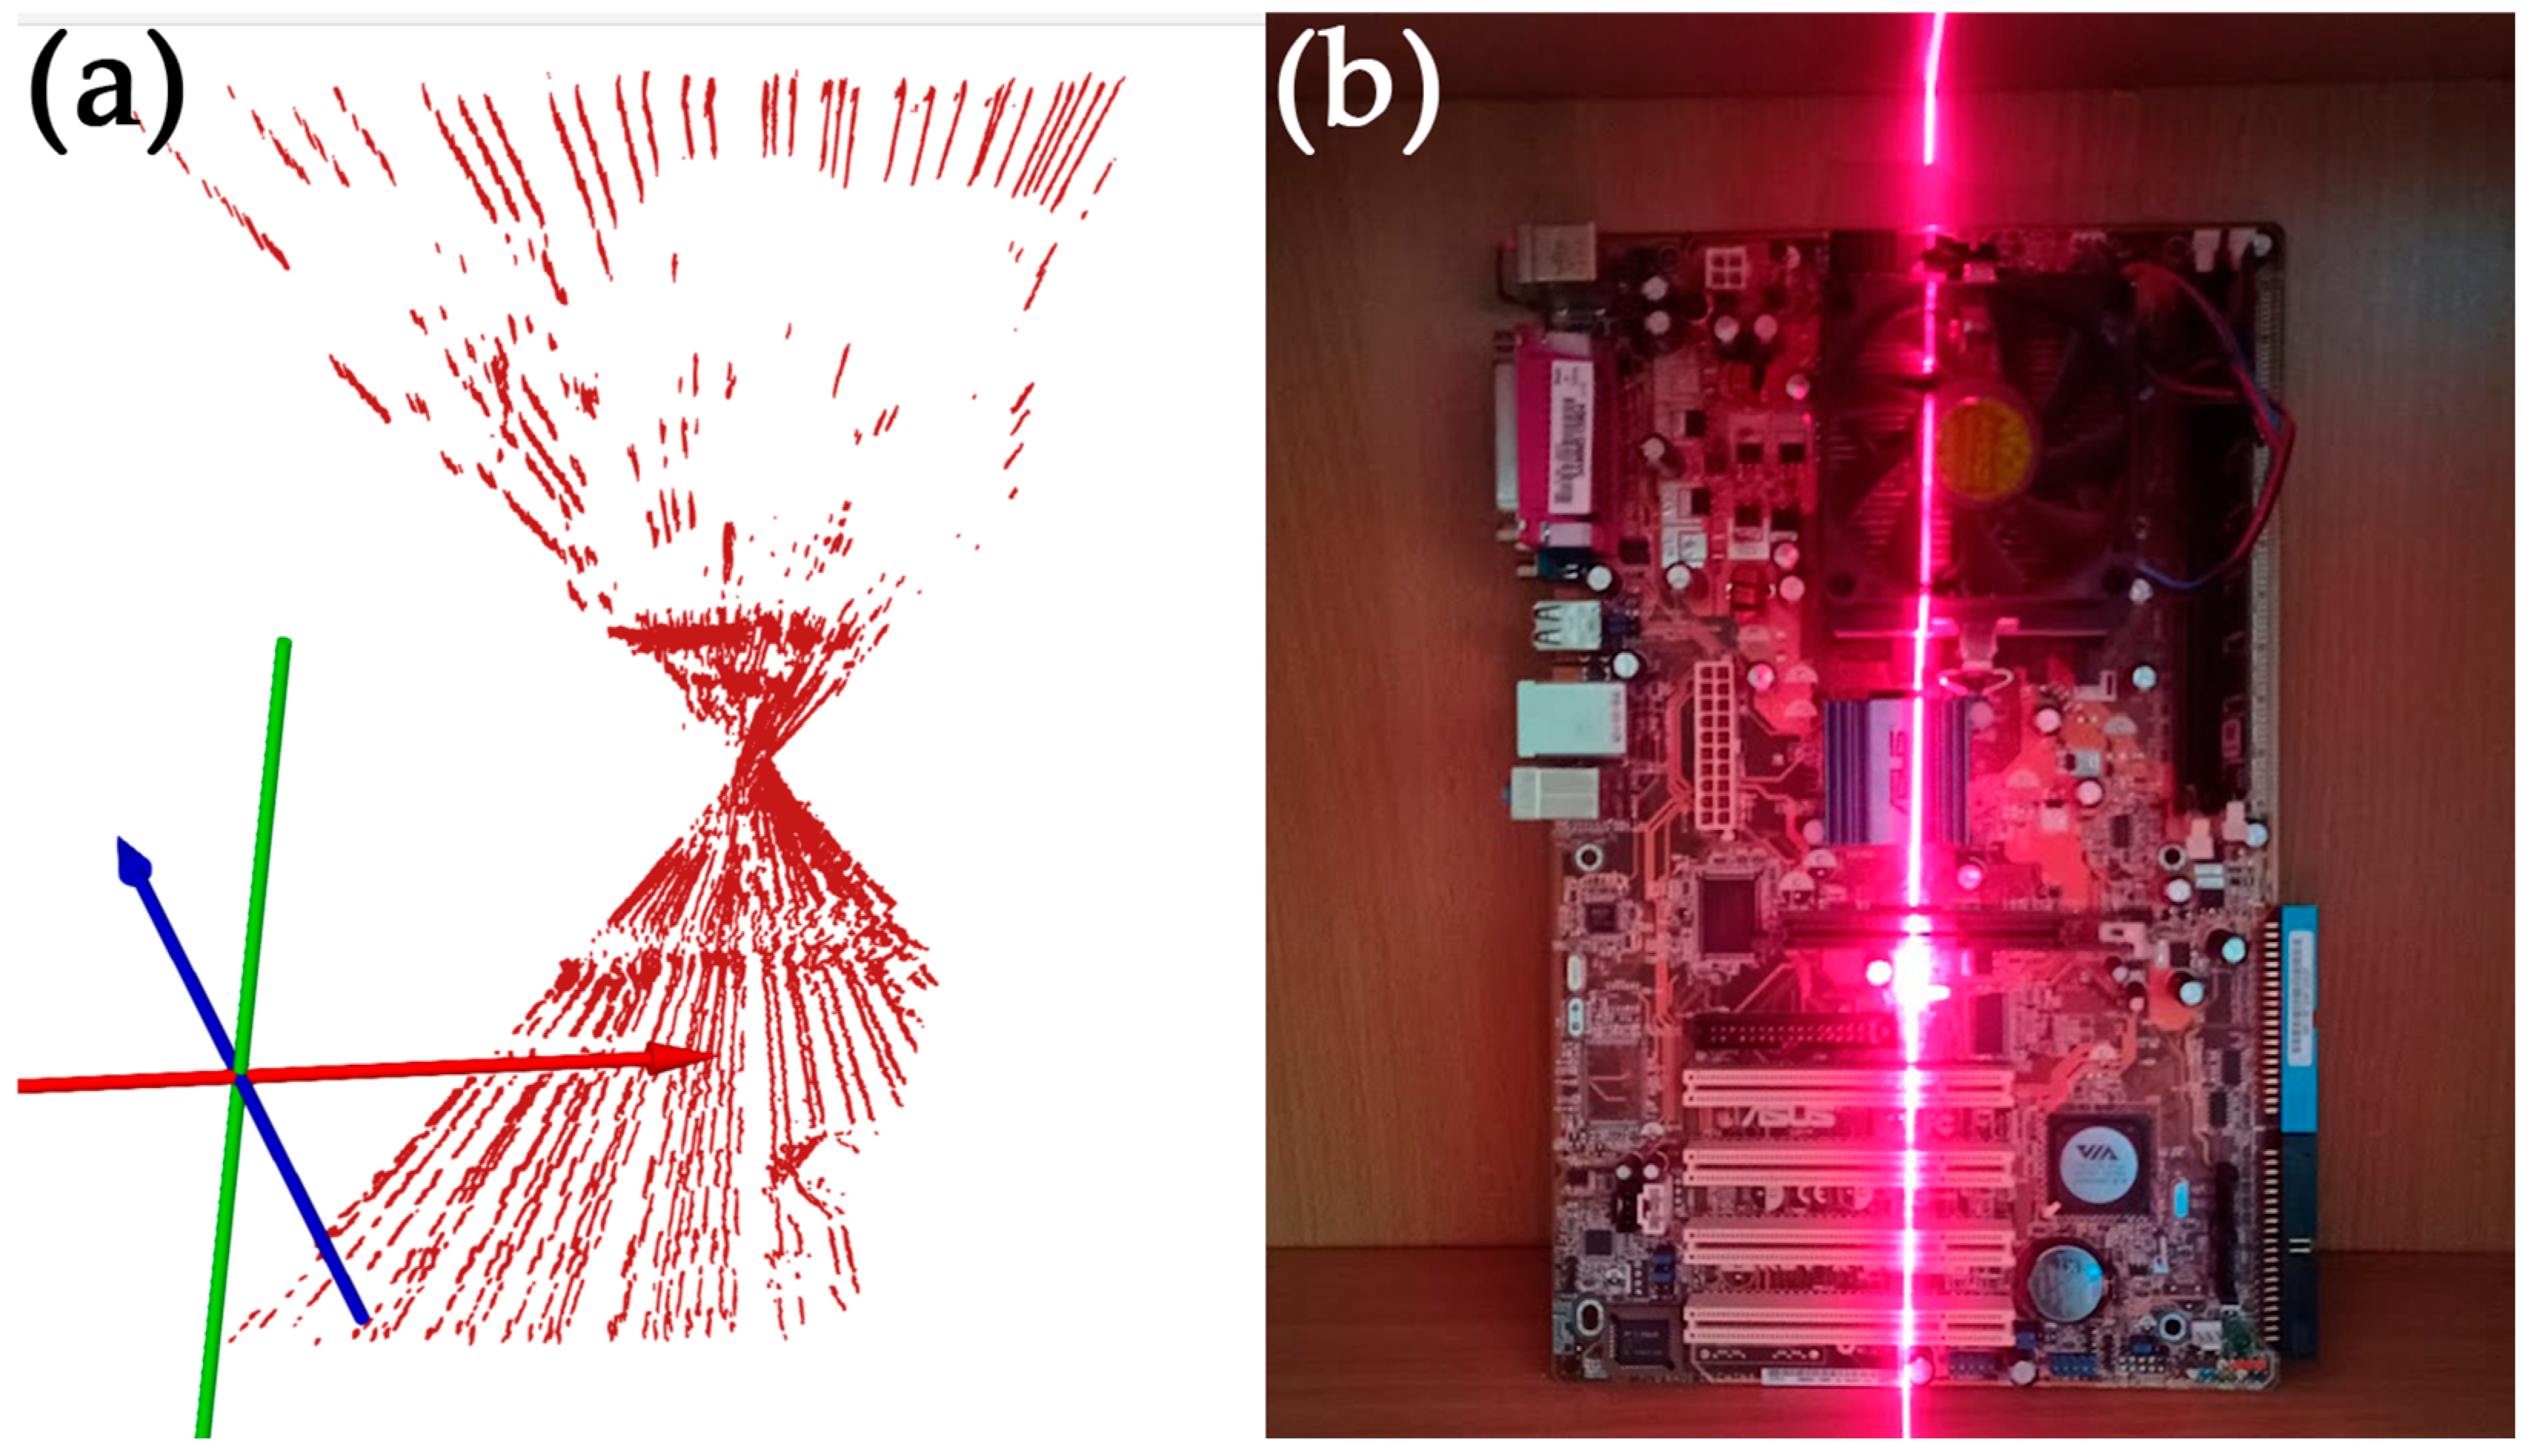
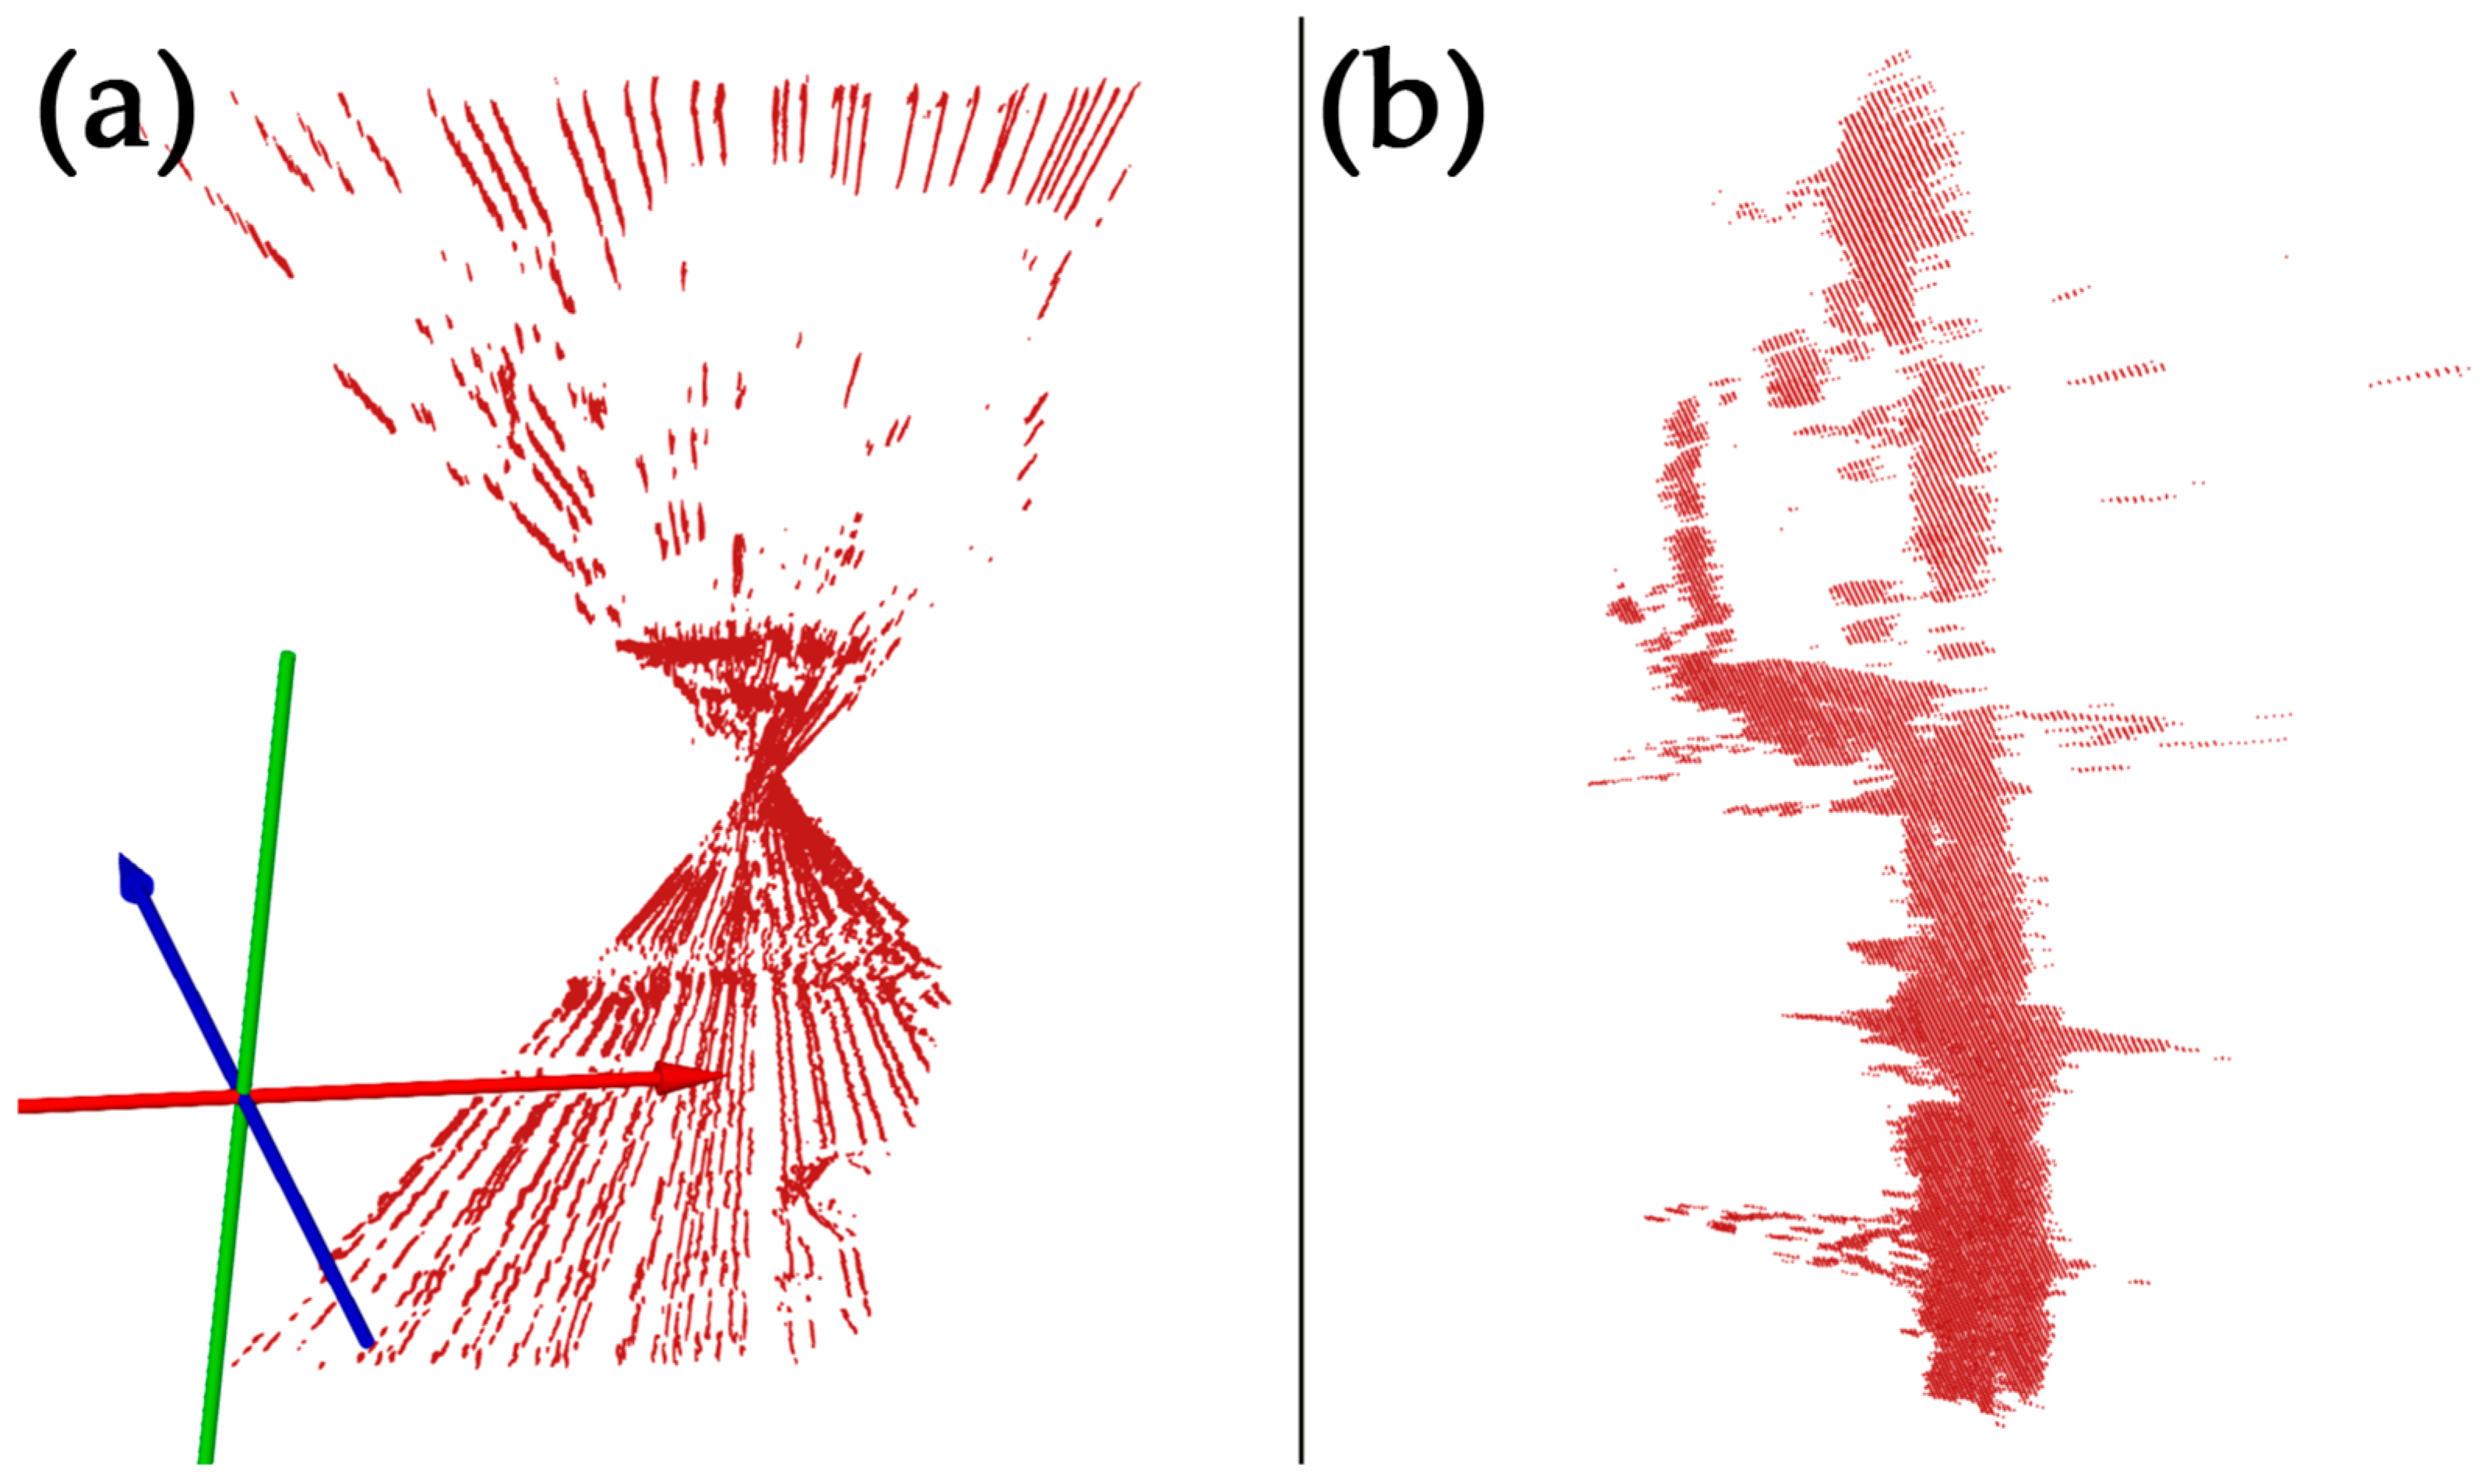
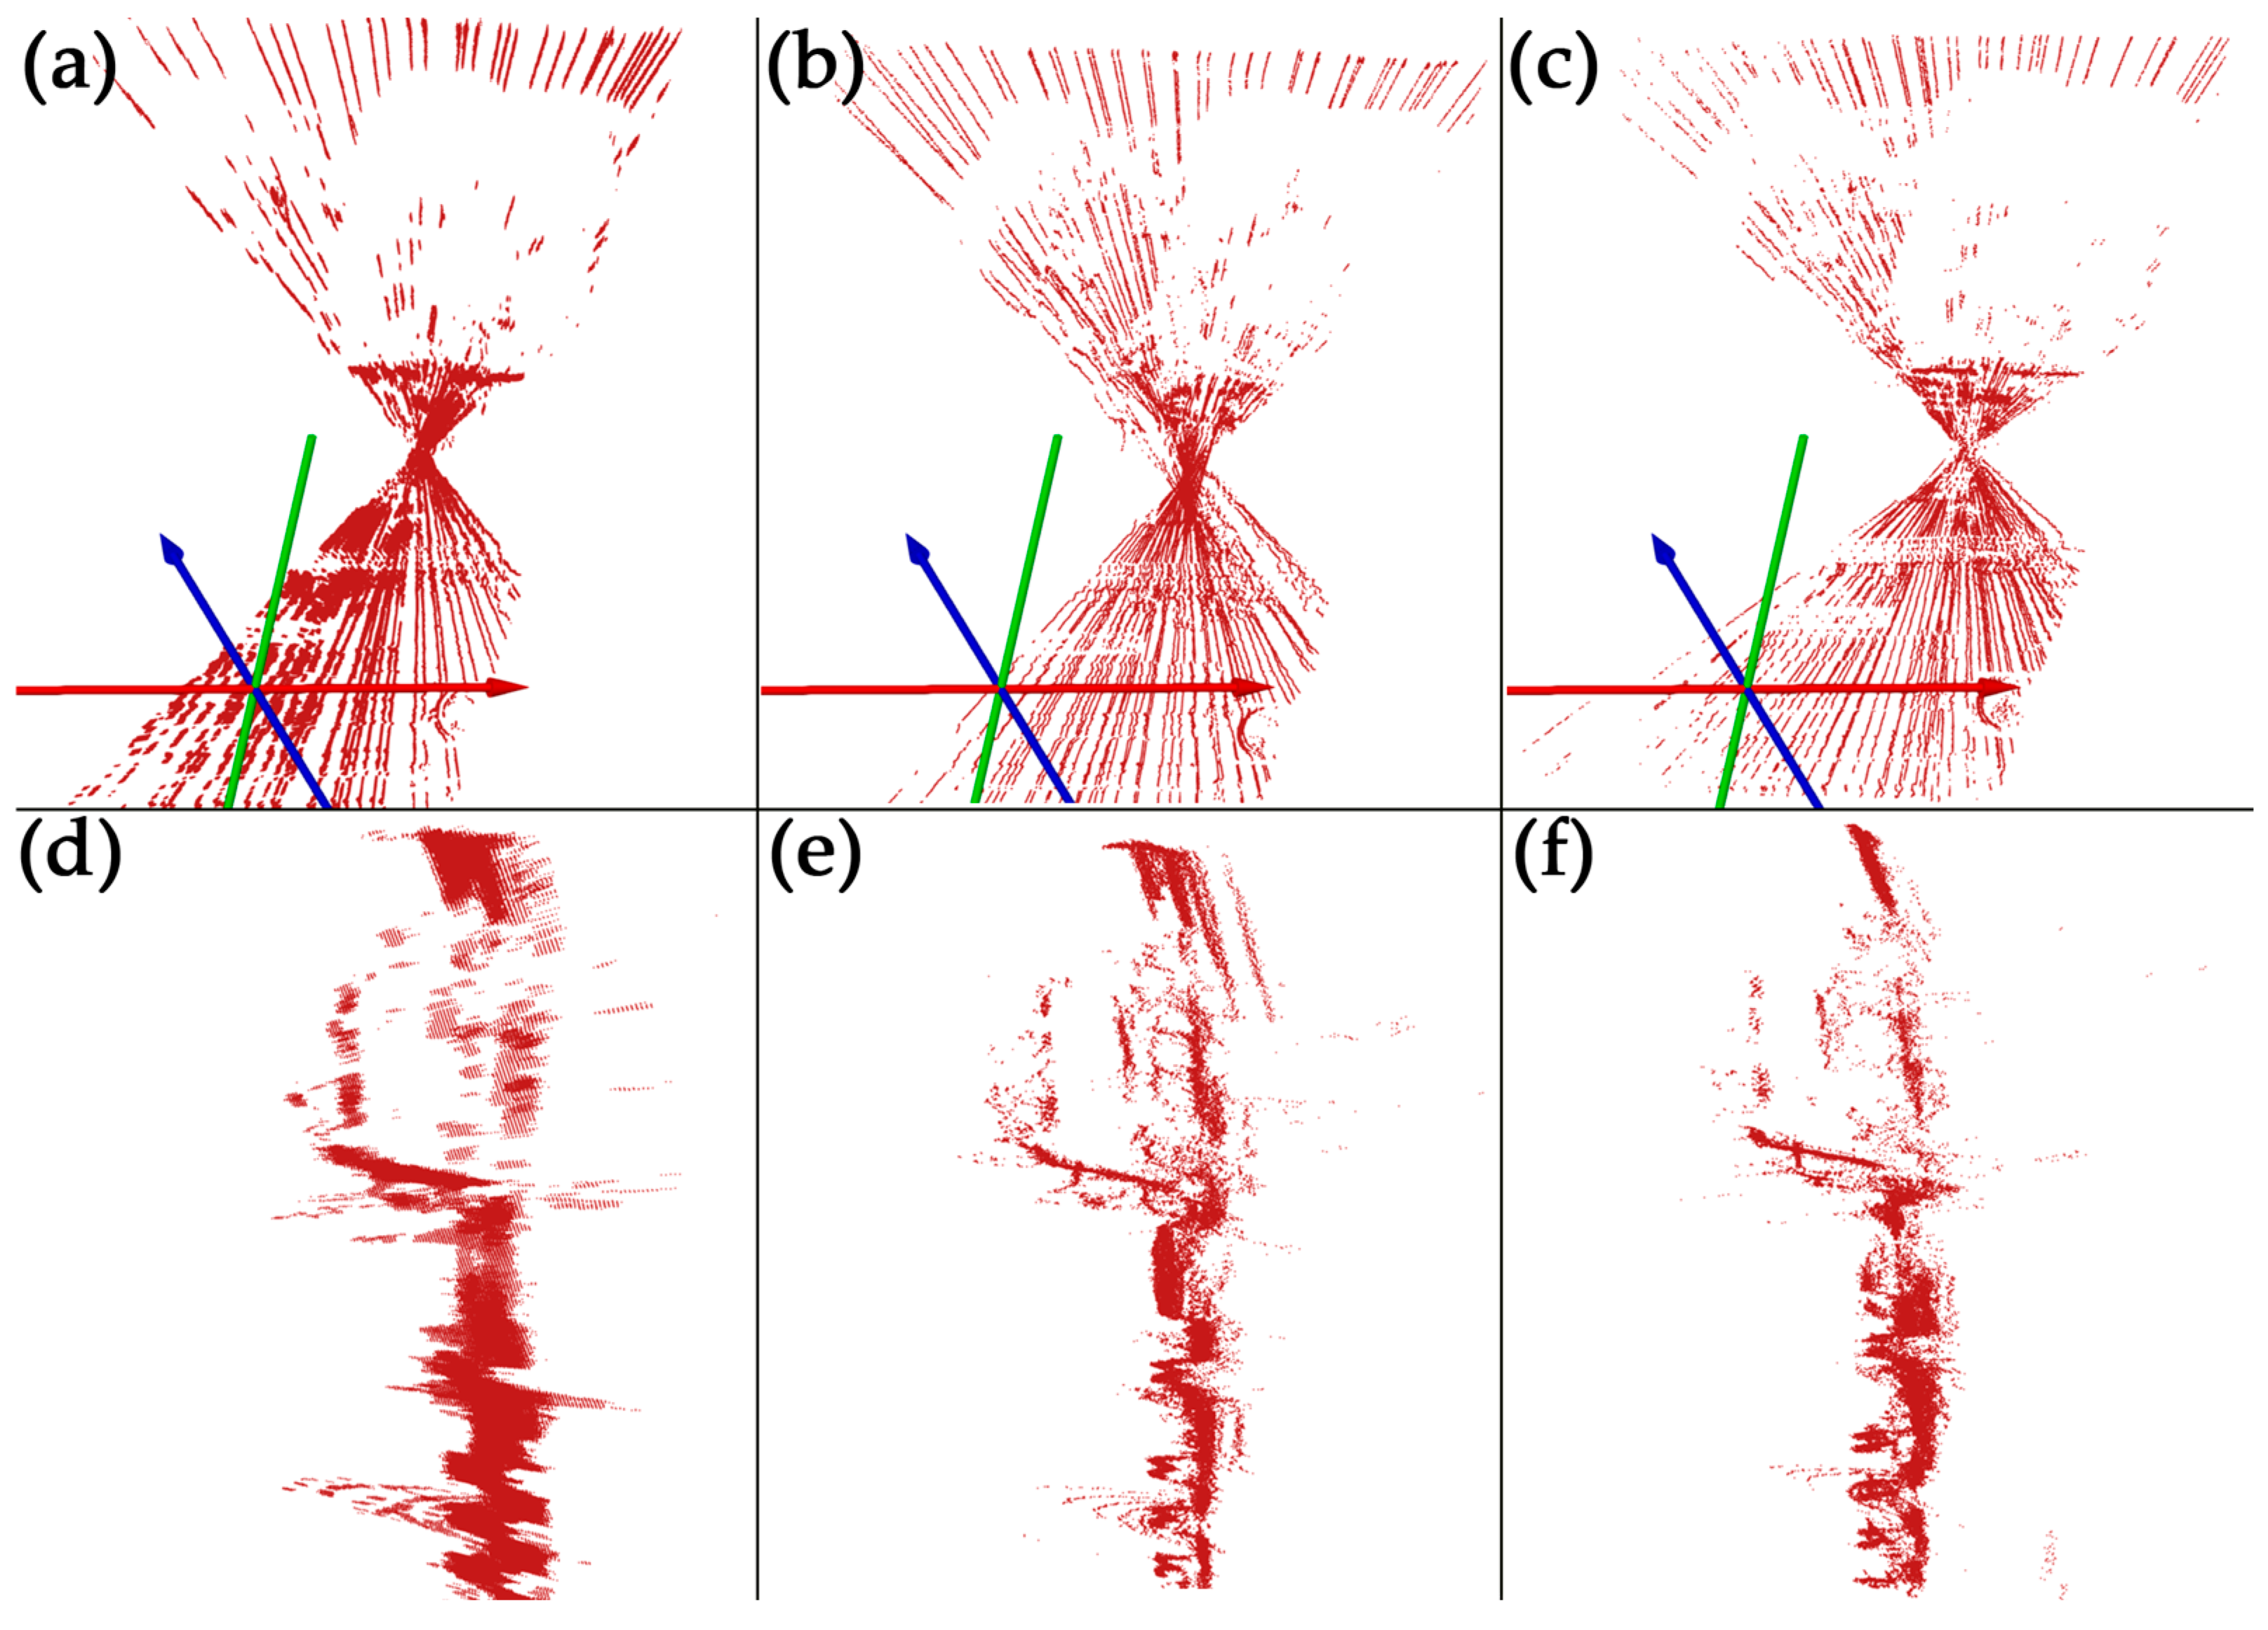
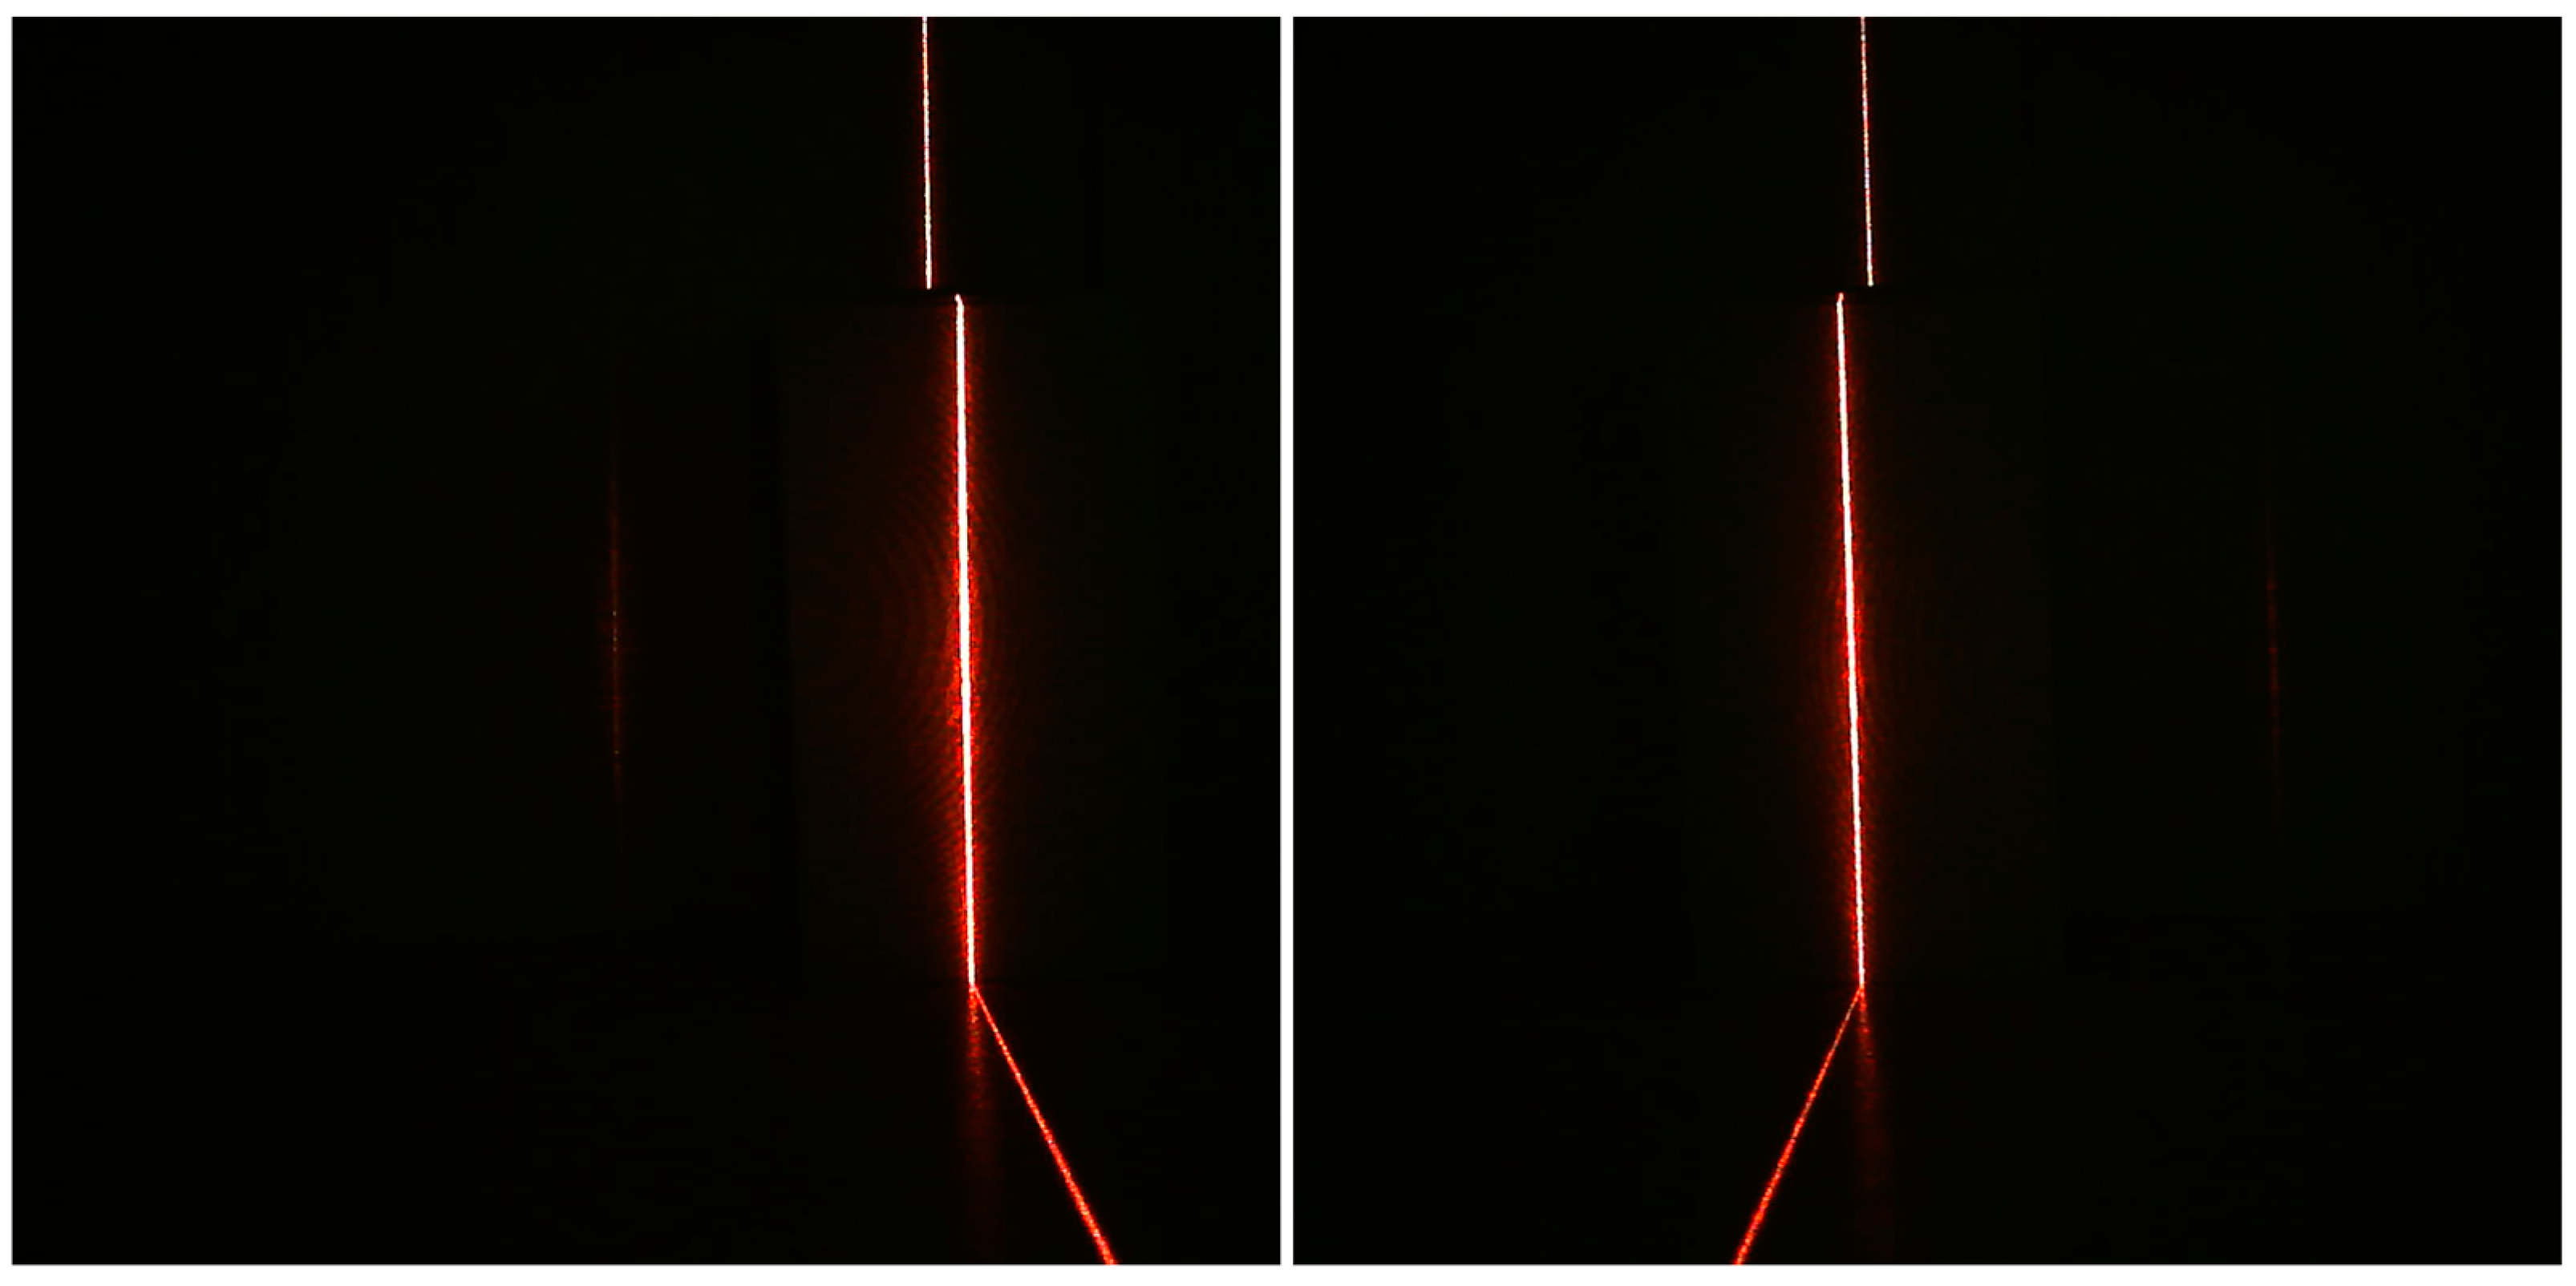
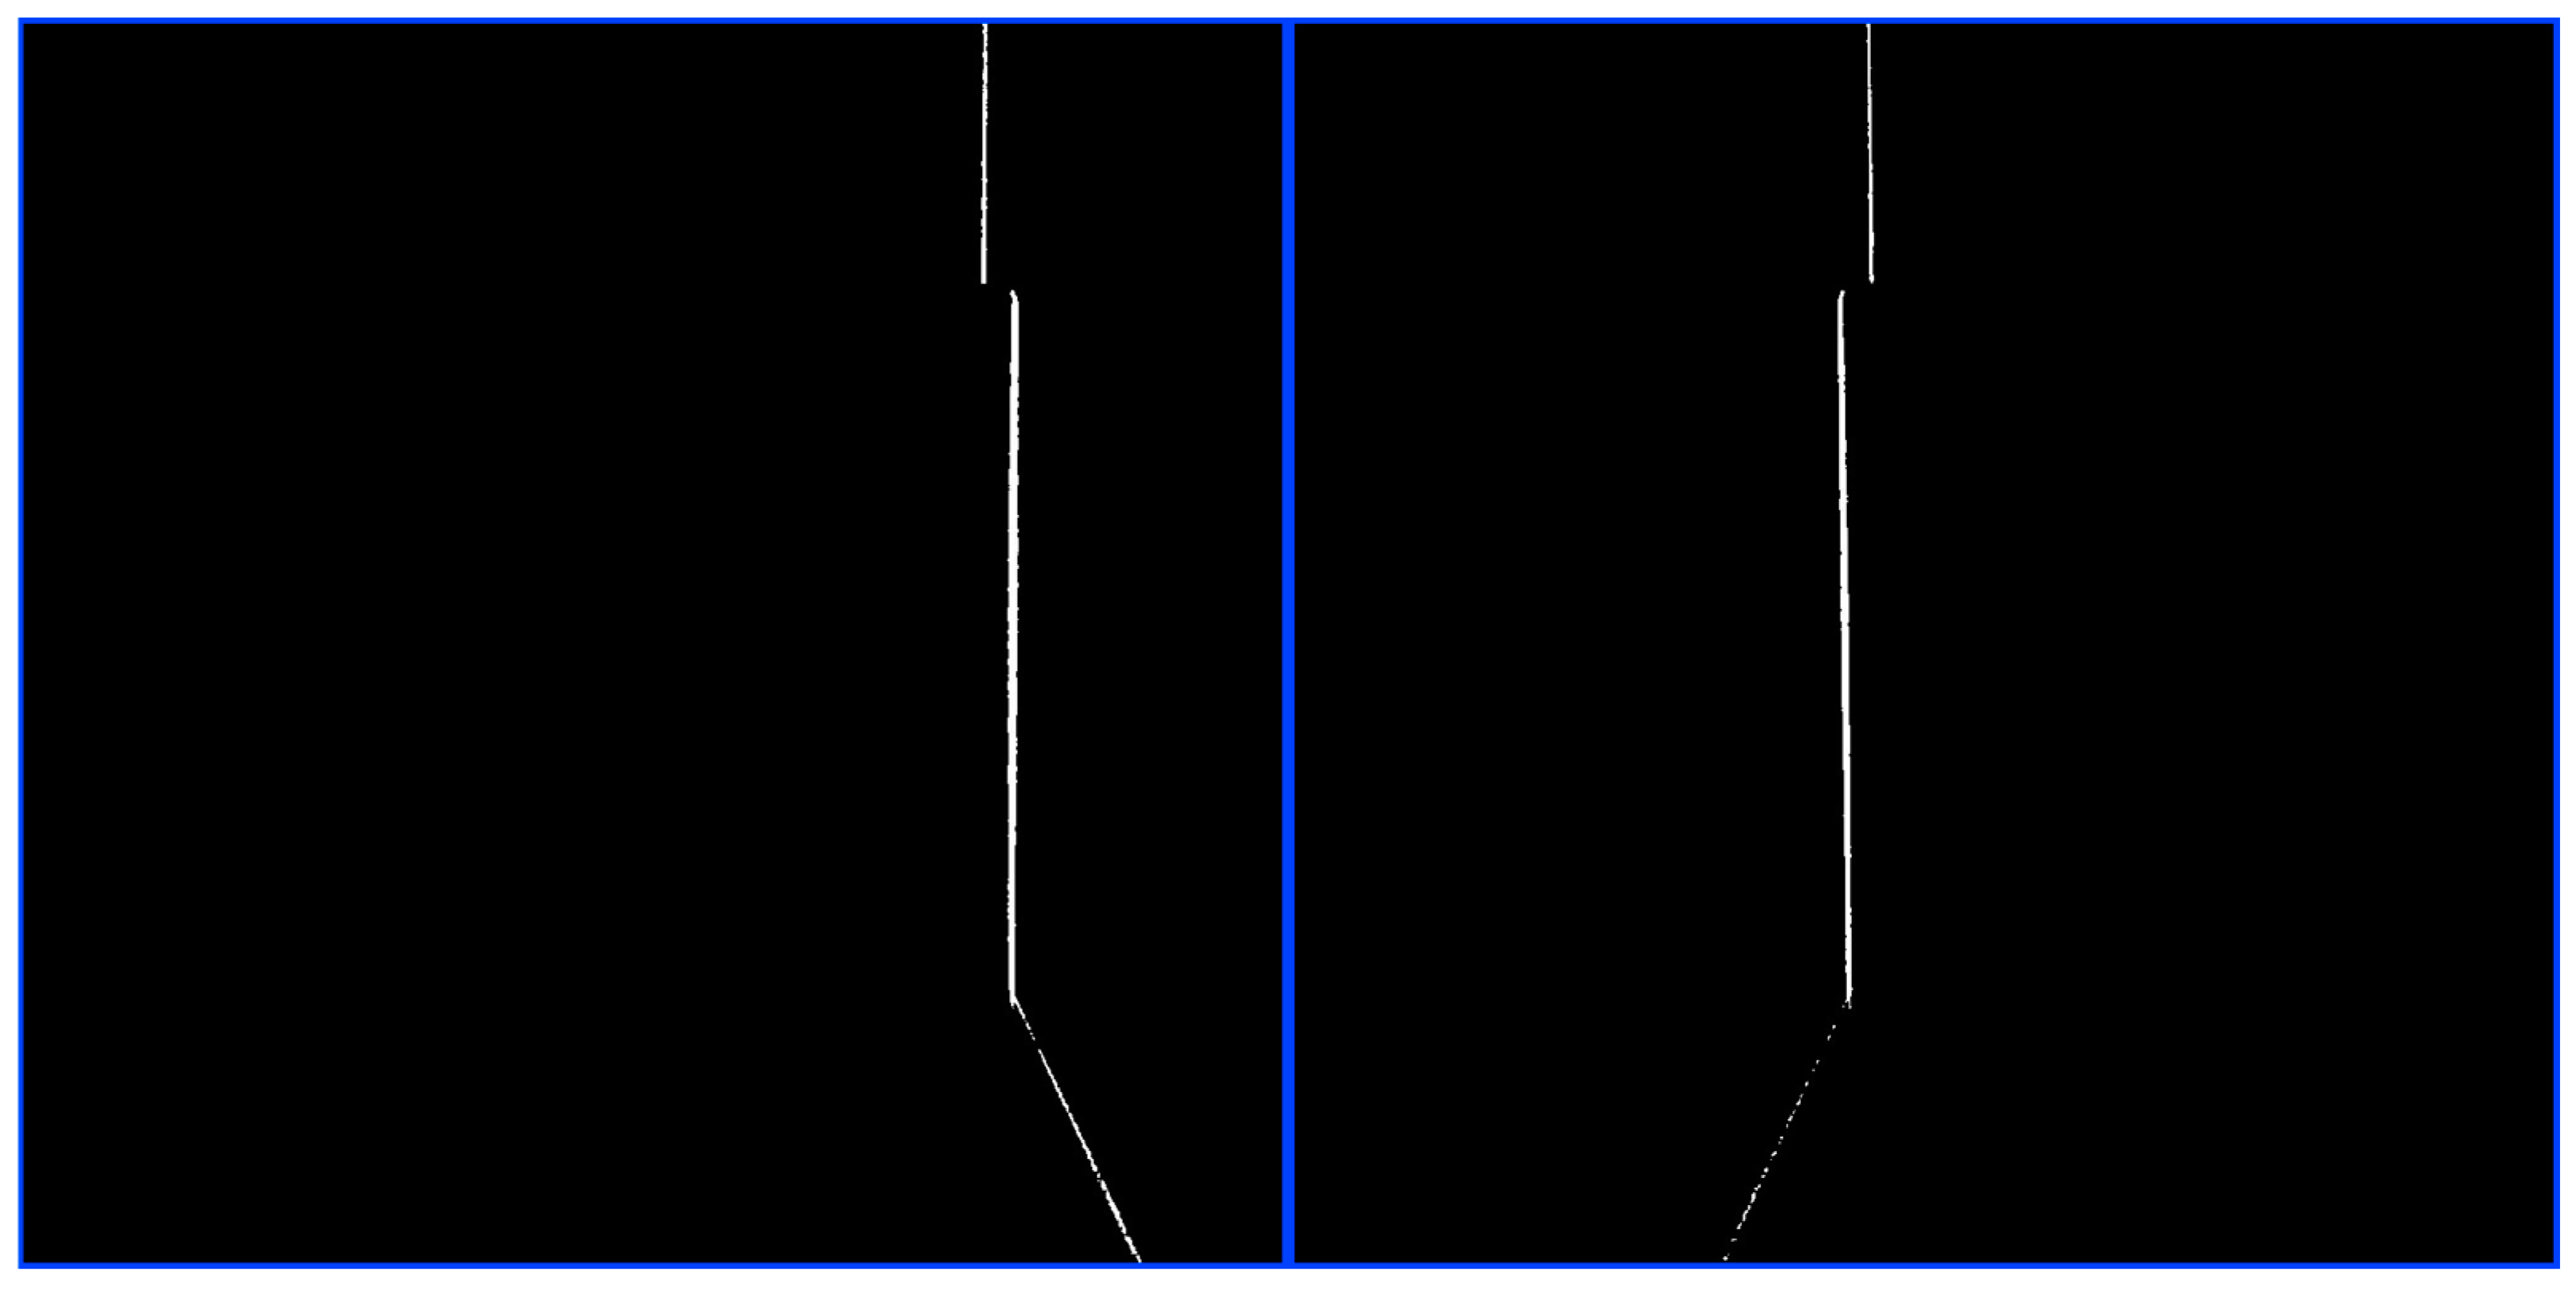
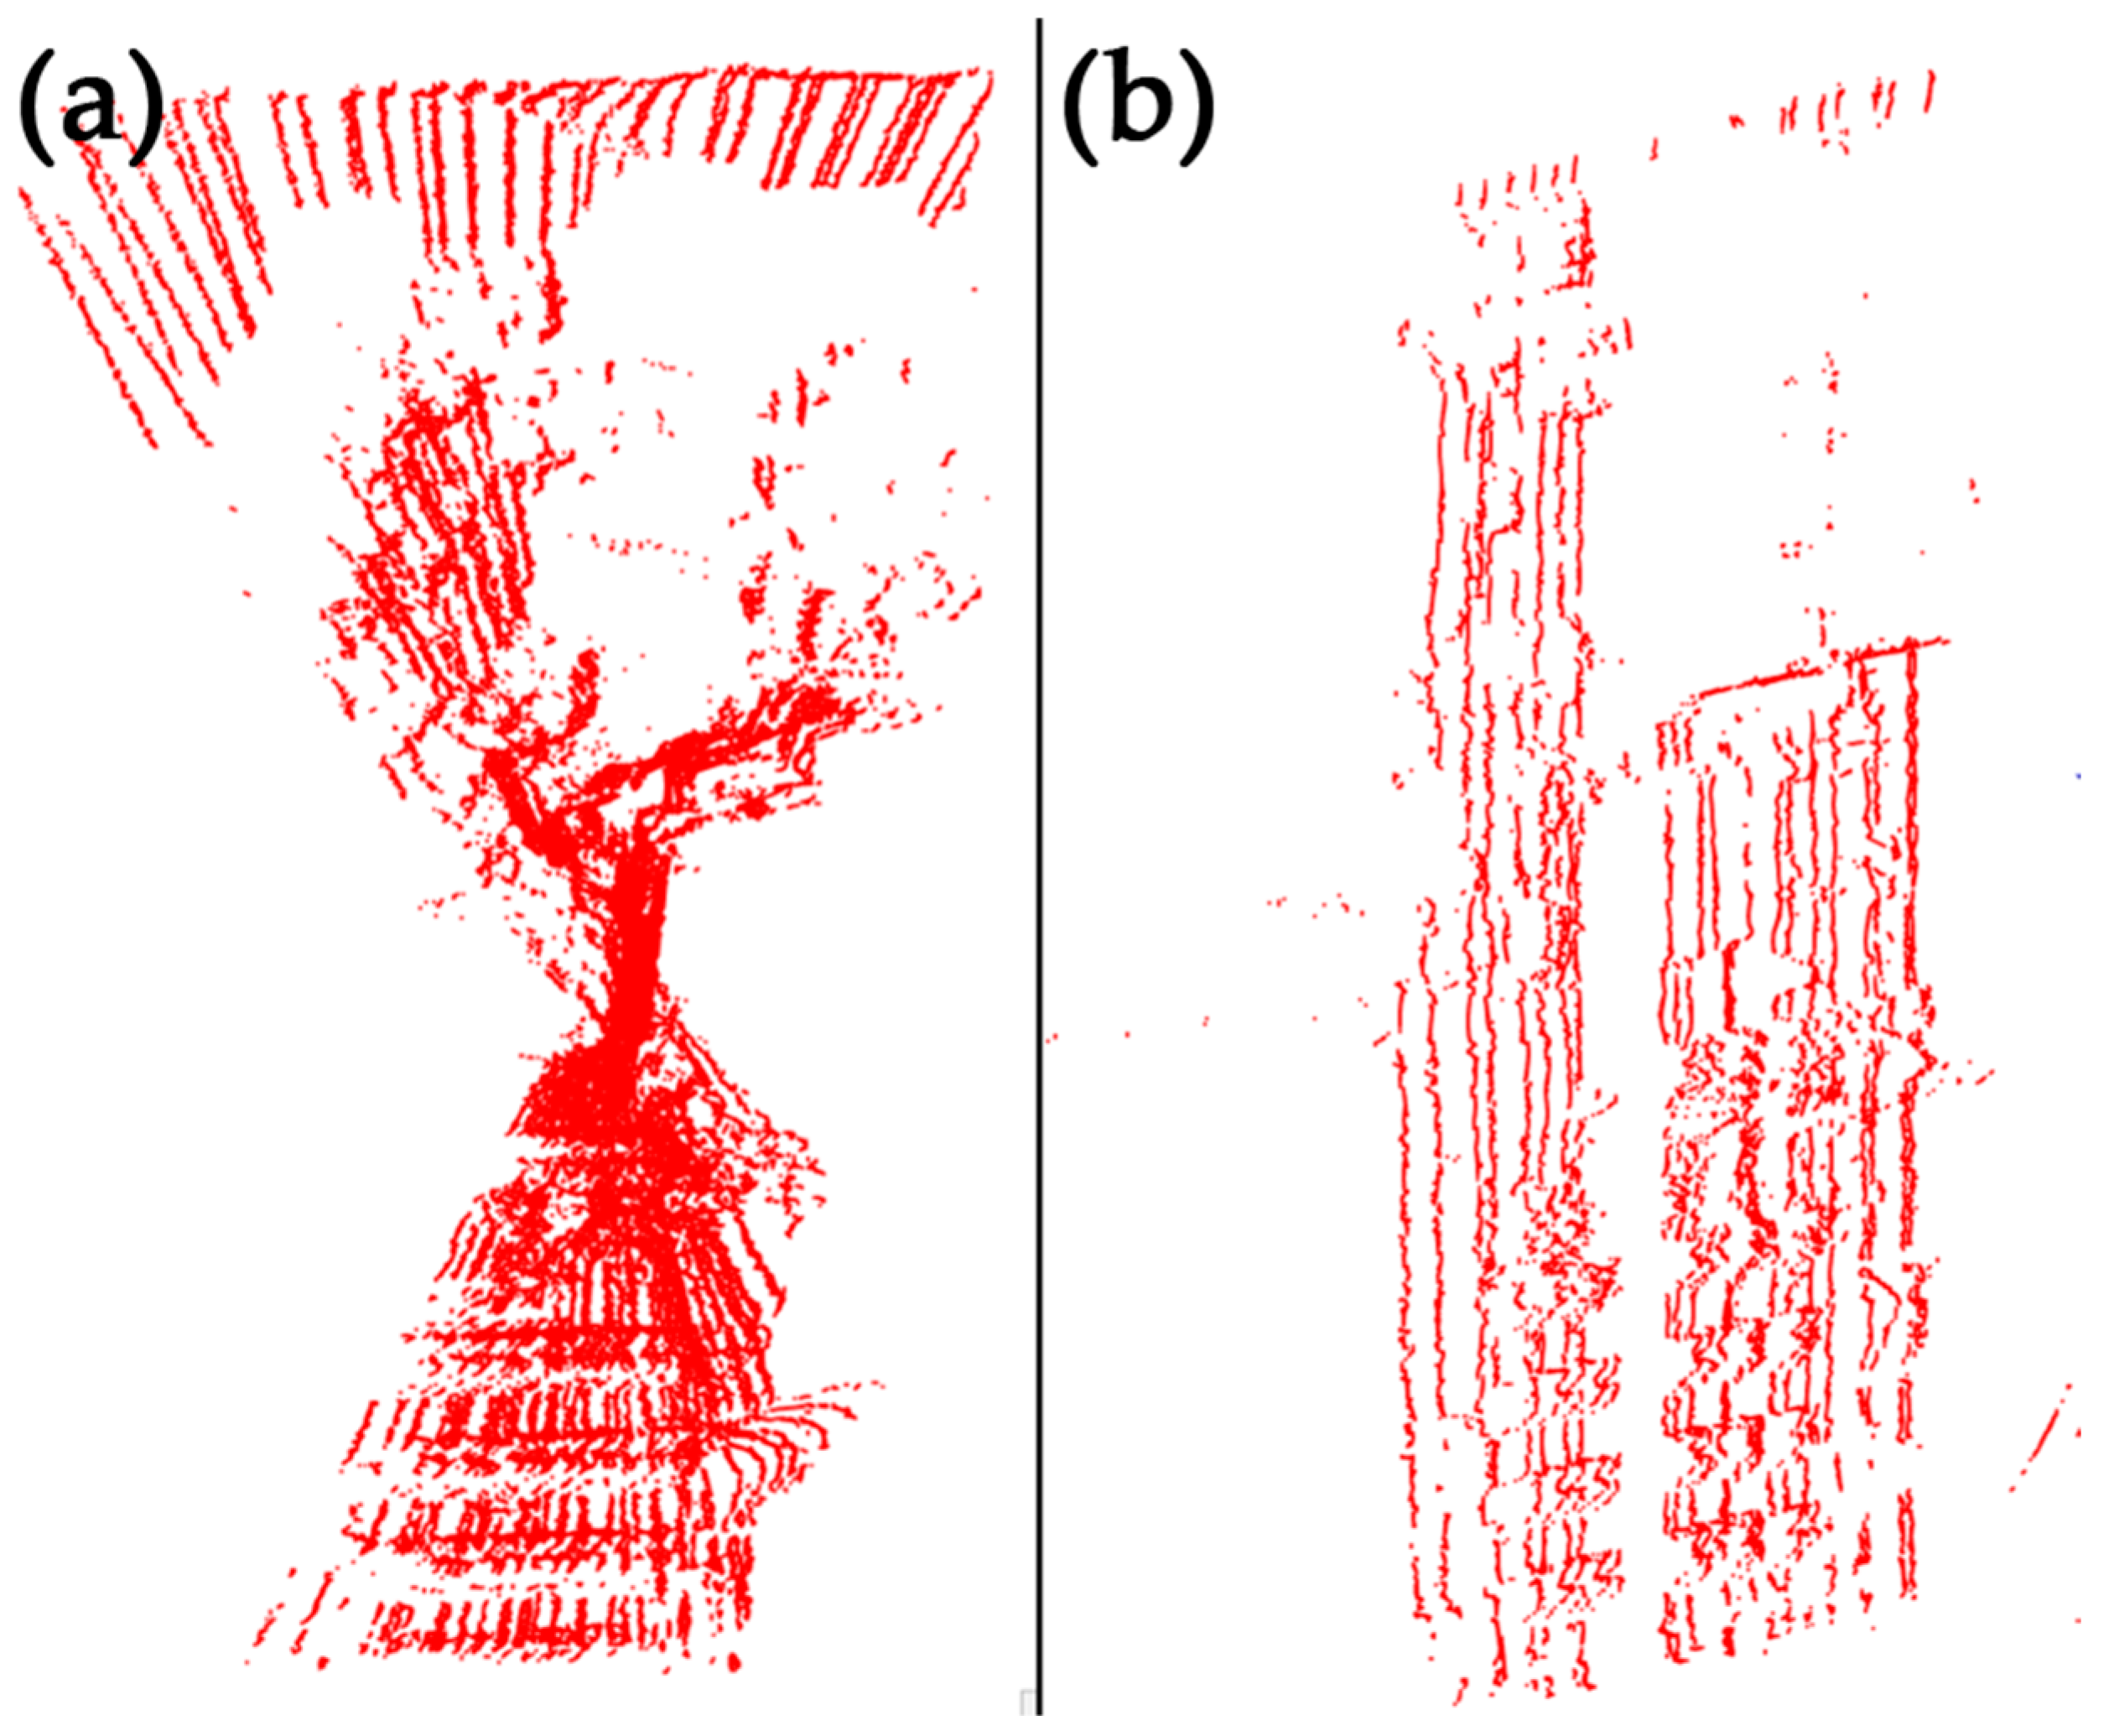
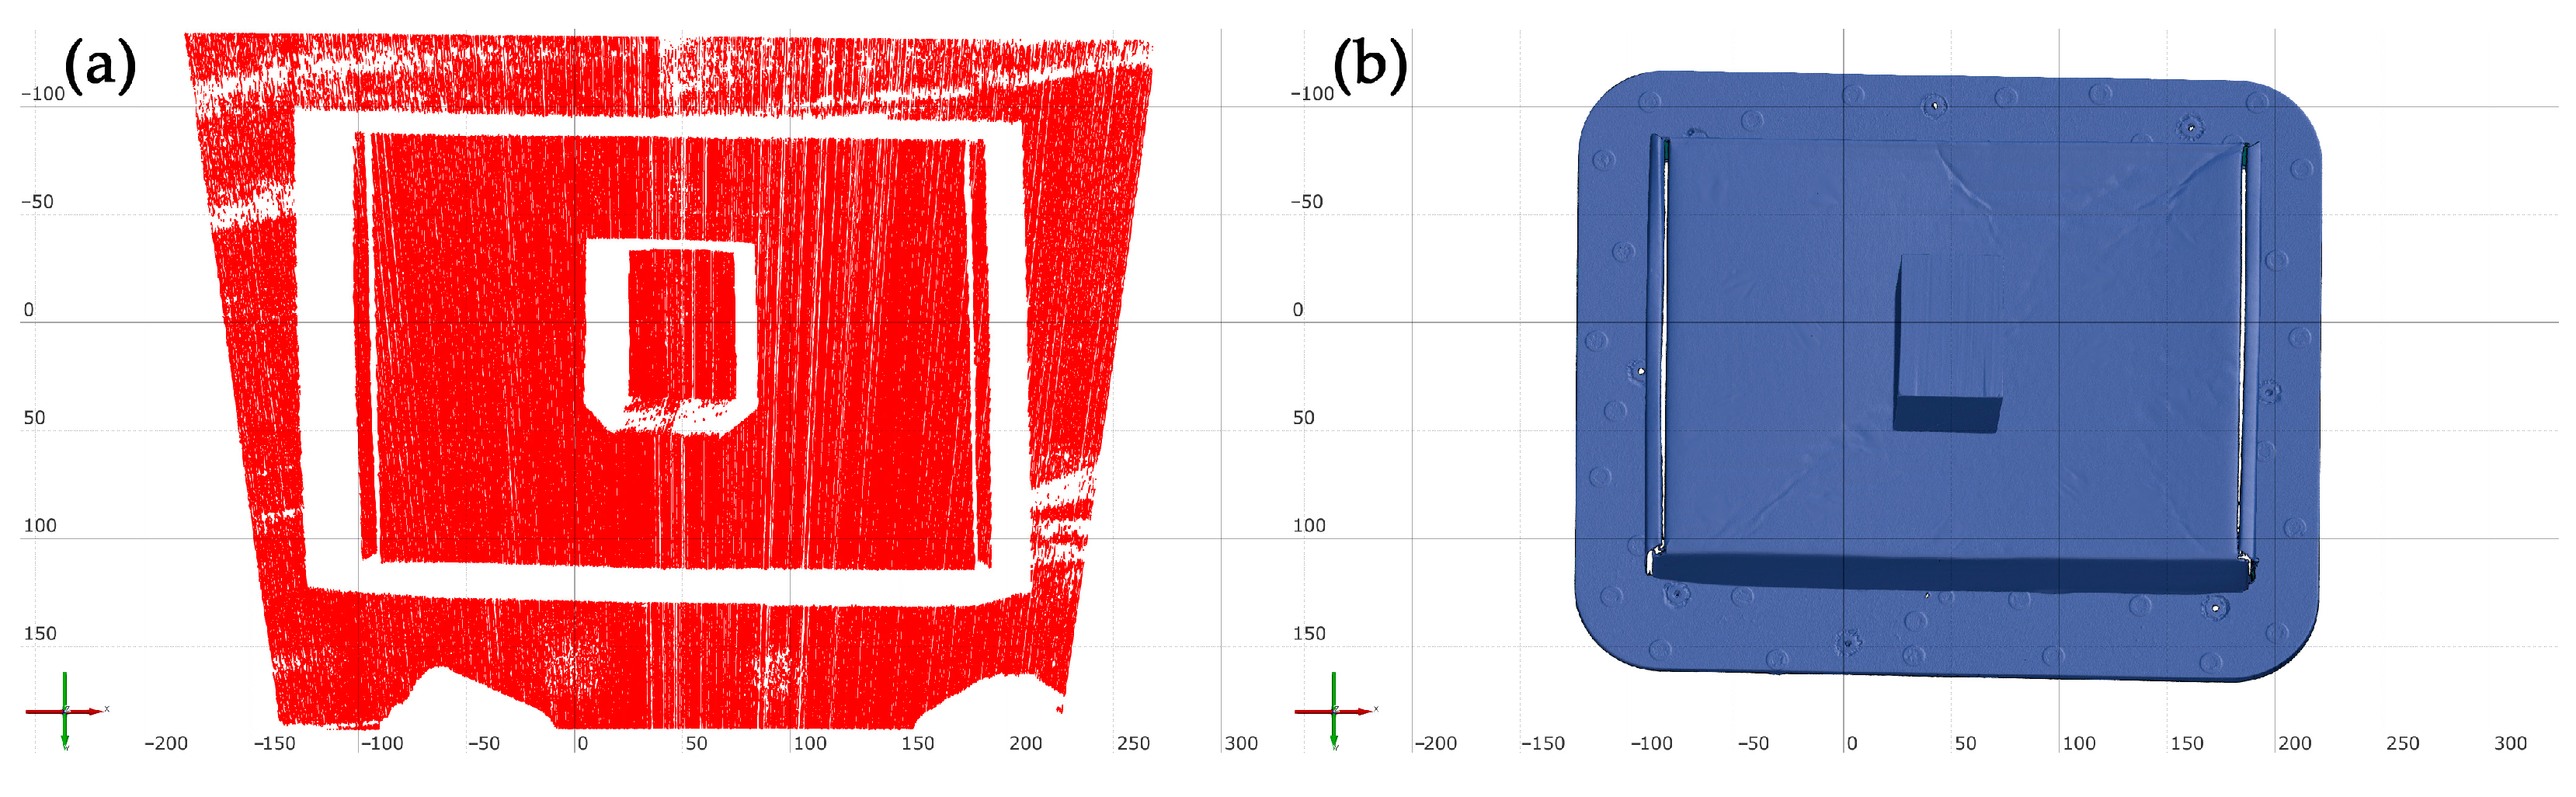
3.1. Scan Result Analysis

During the visual inspection, several deficiencies in the scanning process were identified. Primarily, the quality of the surface diminished as the rotation angle of the laser projector increased. The maximum rotation angle from the vertical position was approximately 45°. It was observed that each increment in the rotation angle led to a decline in the quality obtained. This decline in quality can be attributed to the calculation of depth based solely on disparity. The projected laser pattern on the surface of the object itself possesses a certain thickness. This projected pattern, with its specific thickness, is then captured by cameras with a given resolution. Consequently, the thickness of the laser pattern is imaged within the image pixels at a certain thickness. To optimize surface quality, it is recommended to minimize the thickness of the projected laser pattern and enhance the resolution and image quality of the cameras to the greatest extent possible. For a given thickness of the laser pattern on the object, the lowest laser thickness within a single image line is in the image pixels in the case of a vertical orientation of the laser line. With each rotation of the laser projector from the vertical position, the thickness of the laser pattern increases in direct proportion. Consequently, calculating the disparity at rotation angles close to and equal to 90° becomes impractical. Therefore, the rotation of the laser projector should not exceed 45° from the vertical position, which significantly reduces the possible scanning area. Consequently, for subsequent applications, it is recommended to redesign the system to restrict movement to the vertical laser line, thereby eliminating the need for rotation. This issue can be mitigated or altogether eliminated through the implementation of multiple scans, followed by the processing and integration of the acquired point clouds based on their common characteristics. A notable shortcoming of the scanning process pertains to the region of the glossy surface within which the acquired points are significantly distant from the actual surface. This deficiency often arises during scanning in general, and efforts are made to compensate for it. The application of a matting agent on the glossy area of the surface can eliminate its effect, if the object to be scanned and the working space allows it.
A notable disadvantage of the scanning process is the periodic layering of the resulting point cloud. This deficiency arises from the disparity-based depth calculation. The projected laser pattern has a certain thickness in the pixels of the images. The current program function calculates the Z coordinate of the points based on the disparity in the same row of non-zero points of the binary images. However, it does this for each non-zero point of the first image relative to each non-zero point in the second image. The disparity of the image point of the left image is computed as the smallest absolute difference of distances. Given the utilization of a single laser line projector, under optimal conditions, the laser pattern would be constrained to the thickness of a single non-zero image point within a given line across both binary frames. Thus, only one 3D coordinate point could be accurately computed for each image line. The projected laser pattern in the binary image possesses a certain thickness in image points, thereby enabling the calculation of multiple 3D coordinate points within a single row of image points based on the disparity of these points. This results in the formation of multiple regular layers of image points in the Z-axis direction, as illustrated in Figure 11.
This undesirable effect on the obtained point cloud can be eliminated in several ways. These methods must be designed specifically for the proposed prototype device and with respect to the actual proposed program function. One approach involves modifying the custom function to calculate the arithmetic mean of the non-zero values (i.e., the laser beam) of the binary image in the same line. The center image point is then utilized to facilitate a comparison with the center image point calculated in the same manner on the other binary image. This approach eliminates the necessity for performing multiple disparity calculations within a single row of image points, thereby streamlining the process. This approach is predicated on the hypothesis that within a specific thickness of the laser beam image points in a single row, the most accurate 3D coordinate point can be obtained if only the arithmetic center is taken into account in the calculation. To this end, the np.unique function is employed, enabling the execution of the calculation for each row individually by generating a distinct list of rows. This list is then utilized for the calculation of the center points. Subsequently, the calculation of the 3D coordinate points is performed. The second method is similarly based on a modification of the original program function, while the actual calculation of the 3D coordinate points remains unchanged. In this approach, for each distinct row of image points of the binary image, a 3D coordinate point is calculated as the arithmetic mean of the depth in the Z-axis of the obtained 3D coordinate points in that row.
Subsequently, the selected proposed features were tested under the same object digitization scene setup as in the test scan with the original feature. A substantial enhancement in the quality of the point clouds was discernible through a visual examination. As illustrated in Figure 12a, the point cloud resulting from the digitization using the original program feature can be observed. When viewed from the right, as depicted in Figure 12d, the layering of the point cloud is clearly apparent. Furthermore, when observing Figure 12b from the front and Figure 12e from the right, it is evident that employing the modified program function, which calculates the arithmetic mean of the image points in the binary image, results in a substantial enhancement in the quality of the obtained point cloud. The effect of layer formation is noticeably reduced, and in some cases, it is completely eliminated. A similar observation can be made in Figure 12c from the front and Figure 12f from the right, where digitization is performed using a modified program function based on averaging the acquired 3D coordinate points. These two point clouds exhibit a high degree of similarity after adjusting the parameters with respect to quality, and no significant enhancement in quality is discernible between them, making it challenging to select a suitable one. Consequently, it is imperative to digitize a shapeless complex object and to perform a scan of only one laser projection.
In order to select the most appropriate function from the two proposed, scans were performed with only a single laser beam. This is depicted in Figure 13. The computer motherboard, having been digitized in the preceding testing, exhibited a surface of excessively intricate geometry. The scanning of motherboards and electronic components presents a significant challenge, even when employing industrial-grade scanners. Consequently, a cardboard box devoid of any printing was selected for scanning. In the context of scanning the planar surface of the box, it is possible to select a more suitable program function with greater certainty based on the quality of the obtained point cloud. The scanning conditions were designed to mirror prior scans, ensuring consistency and repeatability.
As illustrated in Figure 14., the projection of the laser beam onto the planar surface of the cardboard box is clearly discernible within the ESP32-CAM device images. The laser pattern can be unambiguously registered. Consequently, the scanning conditions can be regarded as adequate for the purpose of comparing the quality of point clouds using multiple functions of the program. Additionally, Figure 15. presents the registration of the laser pattern within the binary images that underwent thresholding. This scan results in three point clouds.
A comparative analysis of the resulting point clouds for these functions, conducted through visual inspection, revealed that the highest degree of precision was observed in Figure 16. The second function depicted in Figure 16b employed the arithmetic mean of the image points present within the binary image. Consequently, this function was selected for subsequent utilization in scans and within the final device design.
As previously mentioned, it is more appropriate for subsequent research to employ a laser line that moves along the object without undergoing rotation. Following the digitization process, Figure 17 illustrates the coverage of a more extensive area of the digitized surface achieved through the movement of the laser line over the object’s surface. This finding lends further credence to the hypothesis that the proposed principle of digitizing with shifting of the projected laser line is more suitable for the prototype digitizing device than the principle of digitizing with rotation of the laser projector.

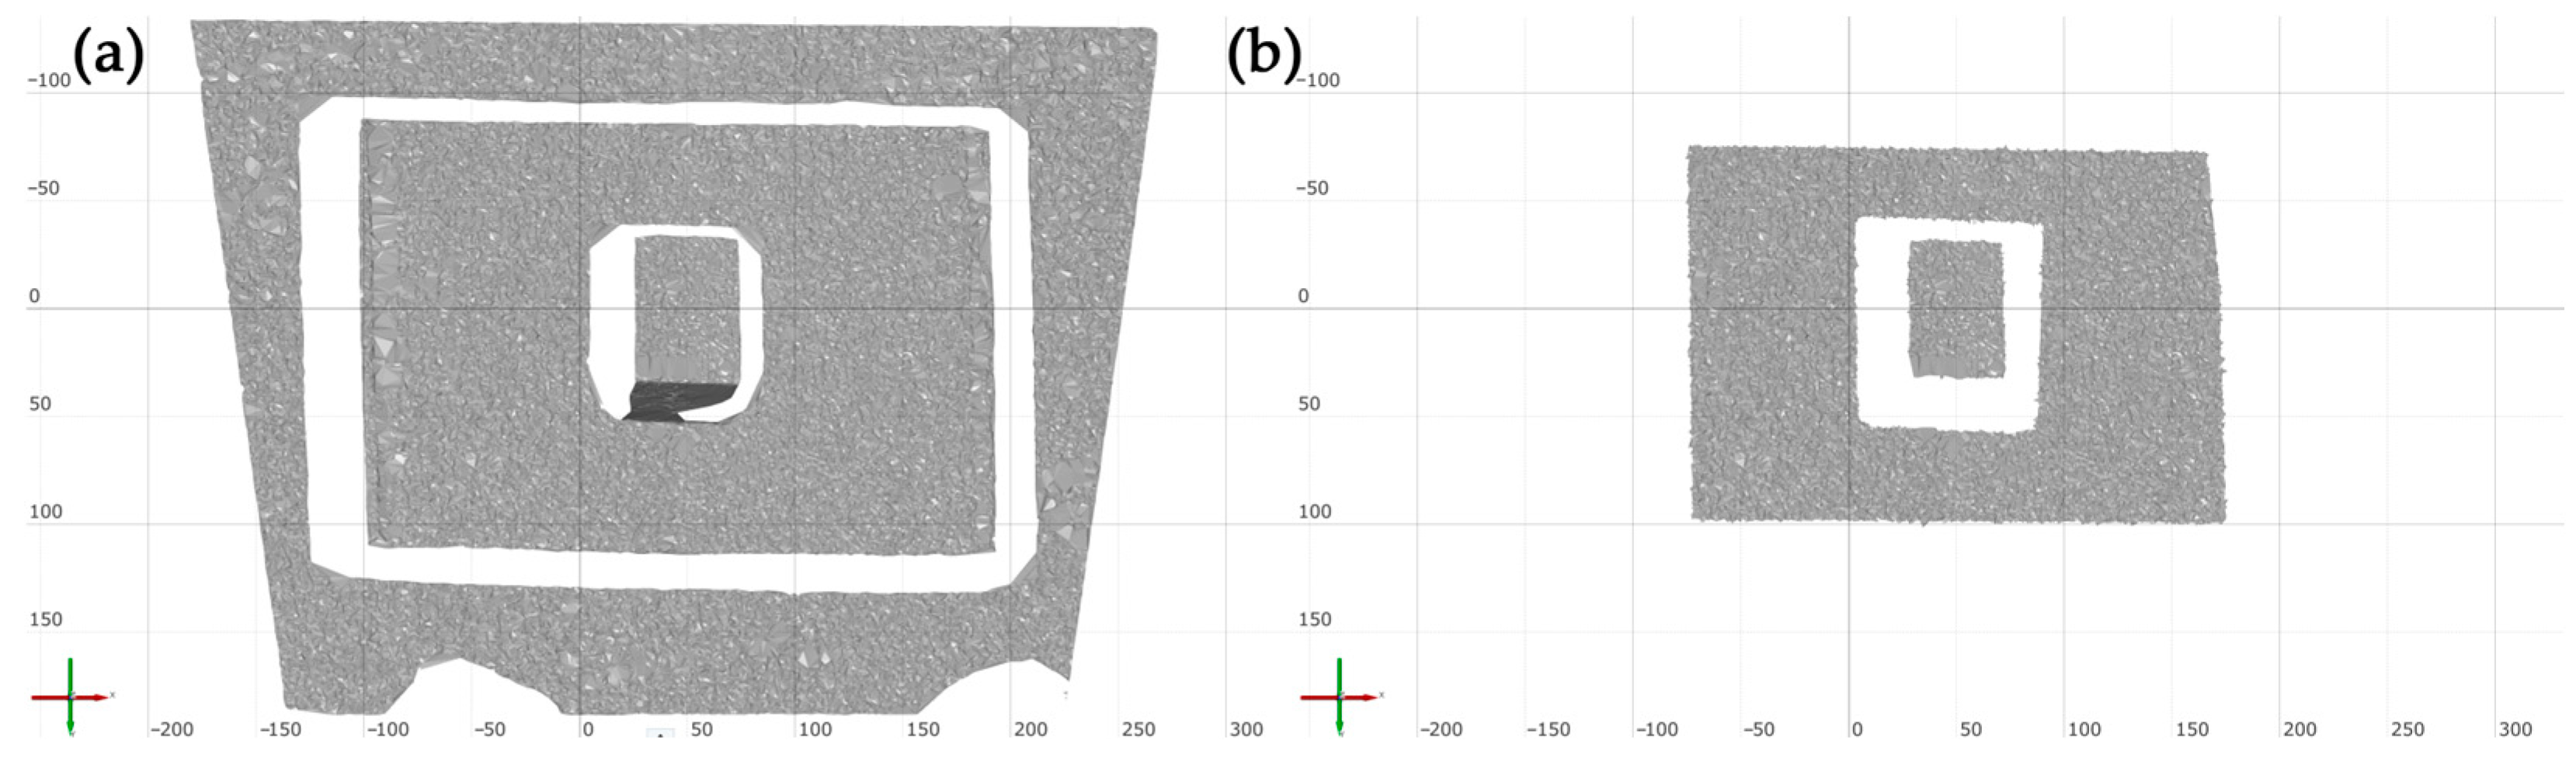
3.2. Further Design Improvements and Adjustments

A previous prototype design confirmed the functionality of the proposed software and hardware design and was used to debug and modify these parts. Given the entirely new and bespoke nature of the hardware and software components of this prototype, the relevant software settings and hardware selections were determined through a multifaceted approach. This approach entailed a rigorous objective evaluation by the research authors, complemented by a subjective selection process based on the empirical experience of the authors and the availability of the hardware components. The prototype’s design incorporated values that were considered appropriate as initial parameters. Subsequent to this, a series of tests were conducted on the selected parameters, encompassing their various combinations and digitization outputs. These outputs were then subjected to quantitative, qualitative, and visual inspection, with the parameters themselves serving as the fundamental reference point. This process was time consuming and was carried out without recording the data for publication. The result was an overview of default settings suitable for a prototype 3D scanning device.
The previous proposal used two ESP32-CAM devices as image capture cameras to perform calibration and digitization of object surfaces. Despite the advantages of using the ESP32-CAM in areas of difficult access, especially the use of a wireless WiFi network and the small size of the devices, for a general-purpose 3D scanning device design, the ESP32-CAM devices have significant disadvantages, especially with respect to image quality. The ESP32-CAM uses a 1600 × 1200 resolution OV2640 camera module with a choice of automatic and manual zoom. Since the use of automatic zoom changes the intrinsic parameters of the device, it would not be possible to keep these parameters unchanged after calibration. For this reason, only manual zoom can be used.
For general use as a 3D scanner, the low resolution quality and limited range of lens parameter selection favor the use of industrial-quality cameras with the ability to use high-quality lenses with manual settings. For this reason, a pair of SUFCO SU200-MB cameras with 4 MPx resolution and 2.8–12 mm manual lens, manufactured and sourced by SUFCO, China, was selected to improve the prototype design. These cameras permit the interchangeable lenses, thus enhancing the device’s versatility. Another notable enhancement in the design is the elimination of the manual feeding of the laser beam across the object, which is now performed by a 28BYJ-48 5 V stepper motor with a ULN2003 driver module using an Arduino UNO R3, manufactured and sourced by Geekcreit, Shenzen, China. This motor enables precise and gradual translation of the laser line source about a vertical axis perpendicular to the axis of the laser source. To ensure safe usage and enhance portability, a mount was designed and fabricated using FFF technology for the camera and stepper motor. The CAD design is depicted in Figure 18a, and a photograph of the prototype device during the digitizing process is shown in Figure 18b. The mount was designed so that appropriate extrinsic parameters of the device, namely the relative spacing of the cameras (baseline, T) and the camera angles and their orientation, could be selected prior to calibration. These adjustments can be used for 3D surface digitization of objects of different sizes and working distances. To facilitate the work with the prototype device, a mount for placing it on a tripod was designed.
The initial design of the prototype device utilized the OpenCV image thresholding library, in which a uniform threshold value is applied to each pixel. If the pixel value of color is less than or equal to the threshold, it is set to 0. Otherwise, it is set to a maximum value. This approach enabled the distinction and registration of the common graphical feature of active stereo vision in both images (the laser line) based on the brightness of the laser. The primary advantage of this method was its simplicity, but in the case of flares or brighter features, the digitization process was subject to error. To address this limitation, a software solution was developed to register the laser beam based on the HSV cylindrical coordinate of the RGB color model. The HSV model (hue, saturation, and value) offers a clearly defined framework. In the prototype device, the laser beam is red and possesses a certain brightness, enabling it to be distinguished from the surrounding pixels based on brightness and color. The images and graphical interface of the software prototype are depicted in Figure 19.
Given that the image points of the laser beam are not monochromatic and their color is a combination of the material properties of the surface and the reflection of the light, for each HSV value, the lowest Lower and the highest Upper value can be considered, which can be conveniently changed by moving the slider until the laser beam is correctly registered. This process is illustrated in Figure 20.

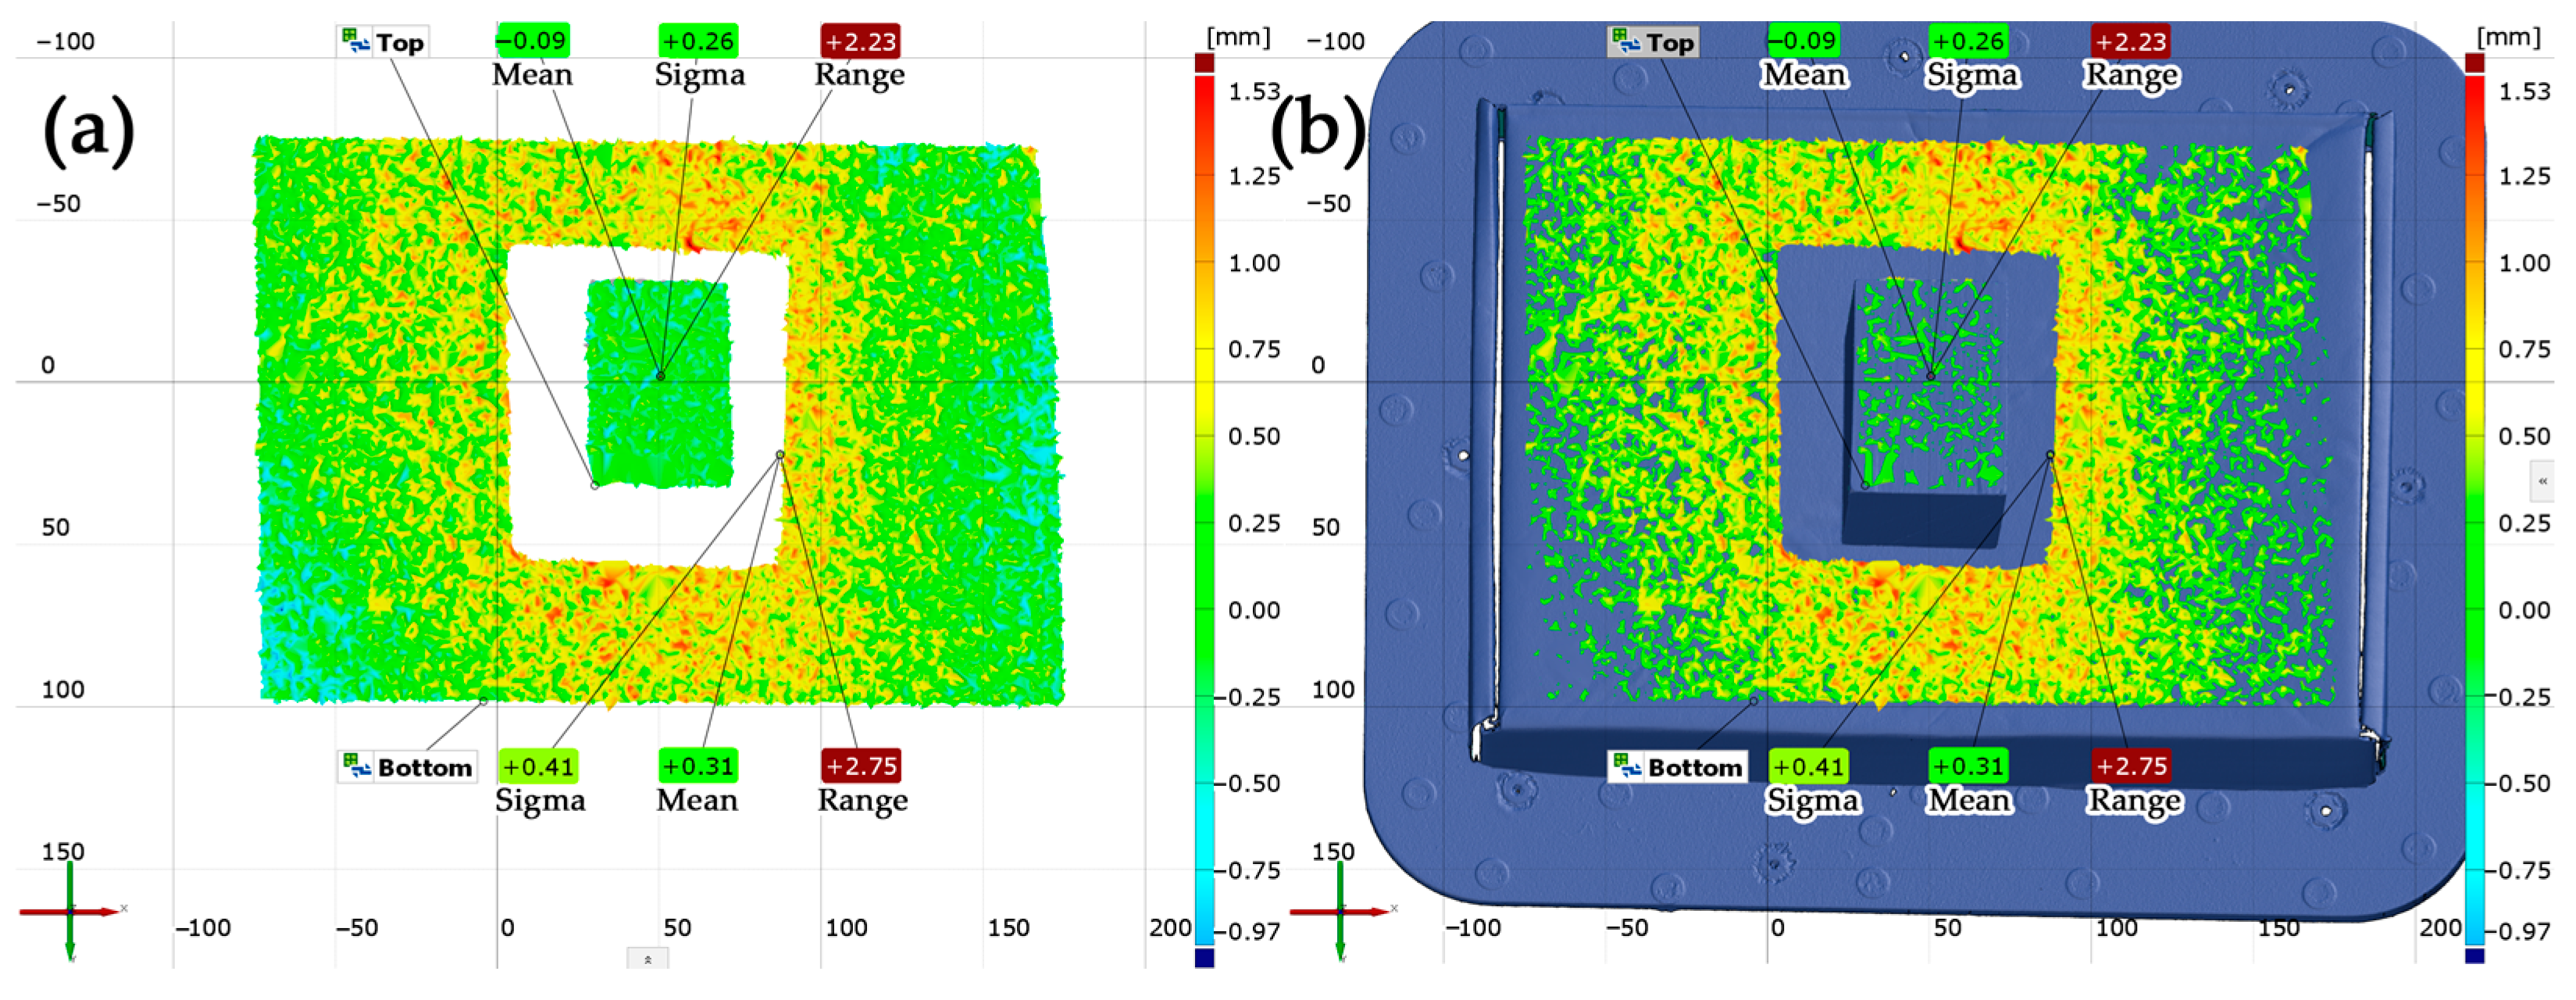
3.3. Verification of the Performance of the Improved Prototype Design

The proposed prototype device for 3D surface scanning of physical objects without using external references and changing the relative position of the technology and the object is a unique solution with its own software and hardware. Consequently, verifying the qualitative and quantitative characteristics of the device, particularly the quality of the acquired surface data, poses a significant challenge. To address this challenge, an experimental approach was proposed to verify the results of the digitization process against a 3D model obtained by 3D scanning with an accurate commercial 3D scanner. Specifically, the Creality CR-Scan Raptor, manufactured and sourced by Shenzhen Creality 3D Technology Co., Ltd., Shenzhen, China, was utilized for this purpose. The device is claimed to have a maximum accuracy of 0.02 mm when using seven blue parallel laser lines, a 3D resolution of 0.02 mm, a working distance range of 150 mm to 400 mm, and an aligning mode that uses markers as external reference elements [29]. In selecting physical objects for scanning, it was imperative to choose objects with flat surfaces, where it is clearly possible to distinguish certain planar surfaces at a certain distance from each other. Consequently, a wooden block positioned on a box of natural brown color was selected. The disparity in height between the top surface of the wooden cube and the box will be utilized to assess the deviation of the data digitized by the prototype device against the nominal 3D scan obtained by a commercial 3D scanner with settings for the highest available accuracy and precision.
Initially, the objects were digitized with a prototype device employing default settings appropriate for the scene at a distance of 500 mm from the objects. A total of 2014 scans were obtained during the digitization process, which were subsequently stored as point clouds. These point clouds were subsequently exported to the ZEISS Inspect 2025 software, as illustrated in Figure 21a. This software was selected due to its suitability for the intended application and its availability. Following the digitization process with the prototype device, the Creality CR-Scan Raptor was employed for the digitization of the objects. This was necessitated by the requirement of the Creality CR-Scan Raptor for the application of Markers reference elements, which were not utilized by the prototype device. Following the completion of the 3D scanning process, the planar mesh model in STL format was exported to the same project in ZEISS Inspect software, as depicted in Figure 21b.
The subsequent phase involved aligning the acquired data to the closest possible distance. Given that the ZEISS Inspect software does not permit the alignment of point clouds with surfaces, it was necessary to polygonize the point cloud that had been digitized by the prototype device. During this process, it was essential to select values to obtain meshes of the desired quality. The values for these parameters were determined by the authors based on the findings from prior research [30]. The values selected were as follows: minimum distance of used points, 0.6 mm; maximum noise, 10 mm; maximum length of new edges, 6 mm. The polygonized mesh, as illustrated in Figure 22a, was aligned using the Local Best Fit tool, with the top surface of the wooden block being aligned to the shortest possible distance. To focus the analysis on specific areas of the overlapping mesh surfaces, it was necessary to crop the mesh from the digitization with the prototype device. The cropped mesh is depicted in Figure 22b.
A detailed analysis of the geometric deviations between the test model and the reference model was subsequently conducted. Two surfaces were analyzed: the top surface of the calibration cube (the reference surface utilized for alignment) and the bottom surface of the reference pad (the secondary surface located outside the alignment area). The result of the deviation analysis is illustrated in Figure 23a. The deviations between the nominal and test data were quantified using statistical parameters.
The analysis result, along with the displayed nominal reference model, is illustrated in Figure 23b. The range of deviations (Range) is defined as the difference between the maximum and minimum observed deviation from the nominal (reference) surface. A lower Range value means higher data consistency (lower scatter of values) and thus higher reliability and accuracy of the scanner. Conversely, a high Range value signifies the presence of more outliers or errors in the measurements, i.e., the 3D scanning is producing a wider range of values from the ideal surface. The arithmetic mean of the deviations, termed the “mean”, can indicate a potential systematic error, given the accuracy of the nominal value and the precision of the alignment. A mean value that approaches 0 indicates that the scanner is not subject to significant systematic error, and therefore its measurements are, on average, correctly aligned and accurate. Conversely, a positive or negative mean value signifies a systematic upward (positive) or downward (negative) displacement of the scanner data, i.e., the presence of systematic error. Standard deviation (Sigma) is indicative of variability or random error in the data obtained from the device under test. A low sigma value suggests that the measured data are concentrated near the mean, which is an indicator of the accuracy and consistency of the scanner. Conversely, a high sigma value signifies greater variability in the data, suggesting higher noise or lower repeatability of the measurements. Such deviations may be indicative of technical issues, such as unstable calibration, sensor noise, or inadequate data processing.
The analysis indicates that the prototype device exhibits precision, with a sigma of 0.41 mm on the bottom surface and 0.26 mm on the top surface. This finding suggests that the laser line was focused more intensely on the top surface compared to the bottom surface. It is important to note that the precision is particularly affected by the thickness of the laser line and its width of registration of the image points. It is evident that enhancing the precision of the prototype can be achieved through the utilization of a thinner laser line of superior quality, exhibiting greater consistency across varying distances. The accuracy of the device is evidenced by the measured mean values of −0.09 mm on the top surface and +0.31 mm on the bottom surface. It is noteworthy that surface smoothing can enhance surface precision and reduce the sigma value. However, the systematic error of +0.31 mm remains relatively low, particularly when considering the absence of external reference markers. This performance is noteworthy when benchmarked against other technologies in this category, such as ToF or Passive SfS.
The values obtained through measurement and the quality of the data collected by the prototype device are significantly impacted by the selection of device parameter values. In the context of working with the prototype device, the authors have proposed default values for the measurements. However, in the context of changing the conditions of 3D digitizing, it is necessary to adjust these parameters of the digitizing process. The digitizing process involves numerous parameters, each of which exerts a substantial influence on the quality of the surface data obtained. Consequently, it can be deduced that the measured values of the qualitative and quantitative properties of the prototype device, particularly accuracy and precision, are not definitive. The prototype device can be enhanced by adjusting the parameters of the digitization process. In its present state, it is possible to define these parameters to 45 parameters, divided into 29 intrinsic and 16 extrinsic parameters. It is important to note that these parameters can interact in various ways, underscoring the need for a comprehensive and systematic approach to parameter optimization.
Intrinsic parameters are defined as the internal settings and characteristics inherent to the scanner hardware, lens, laser, calibration procedure, and software settings. These parameters directly influence the digitization process, independent of external conditions. These include the camera sensor resolution (width W, height H), pixel size (ps), frame rate (FPS), exposure (texp), gain (G), brightness (Bri), contrast (Con), saturation (Sat), sharpness (Sh), white balance (WB), gamma correction (γ), and hue adjustments (Hue). Furthermore, the selection of the lens itself emerges as a critical intrinsic parameter influencing the overall digitization capability, prior to adjusting specific lens parameters such as focal length (f), aperture (f/#), and manual focus distance (Fdist). Intrinsic parameters of the laser module include wavelength (λ), intensity or power (Plaser), and laser line width or focus (Wlaser). Calibration-specific intrinsic parameters derived from stereo calibration procedures include camera focal lengths in pixels (fx, fy), the principal points (cx, cy), and lens distortion coefficients (k1, k2, p1, p2, k3). Furthermore, intrinsic parameters extend to software image-processing thresholds, specifically the HSV threshold ranges for color-based laser point extraction (Hlow, Hup, Slow, Sup, Vlow, Vup).
Conversely, extrinsic parameters comprise external adjustments and conditions involving the relative positioning, alignment, and environmental conditions that significantly influence digitization accuracy and reliability. These parameters include the stereo baseline distance (B or Tbaseline), the camera angles and alignment (yaw, pitch, roll: αcam, βcam, γcam), the laser positioning and tilt angle (αlaser), and calibration extrinsic parameters such as the rotation matrix (R) and the translation vector (T). Furthermore, extrinsic factors encompass scanning-process parameters such as scanning intervals (tscan), the total number of scans (Nscans), and image-processing morphological kernel size (K), which have been shown to significantly influence data quality. Finally, environmental conditions and scene-specific extrinsic parameters play a pivotal role. These include ambient lighting (Lamb), surface reflectivity (Rsurf), background reflectivity (Rbg), working distance from the object to the scanner (Dobj), and the background’s color and reflectance characteristics. Consequently, precise identification, control, and optimization of these intrinsic and extrinsic parameters offer significant opportunities to enhance the accuracy, precision, and overall reliability of the digitization process in the prototype scanning device. An important practical application lies in 3D printing workflows, where the scanner could be deployed to evaluate printed objects for dimensional deviations or layer artifacts. Its markerless, single-position design simplifies in-process or post-print checks, reducing the risk of undetected defects and enhancing overall print quality and consistency.

4. Discussion

The findings of this study demonstrate that a stationary, markerless 3D digitization approach using active stereo vision (SfS) with an integrated laser line can deliver reliable surface data in scenarios where traditional methods are either impractical or impossible. By eliminating the need for external reference markers and maintaining the scanning system in a fixed position relative to the object, the proposed method directly addresses key challenges associated with confined or hard-to-reach locations. This development signifies a substantial advancement for use cases such as in situ inspections of machine components (e.g., turbines, aircraft engines) and endoscopic scans in the medical field. A comparison of the presented system with existing industrial scanning techniques reveals several advantages. Conventional handheld or robotic scanners generally necessitate full or partial mobility around the object, which can be impractical within confined enclosures or in sensitive areas. Conversely, photogrammetric solutions frequently depend on distinct markers or expansive reference frameworks for alignment, a process that is similarly challenging when marker placement is not applicable. Furthermore, purely passive Shape from Motion or Shape from Stereo methods generally necessitate object or camera motion and are more sensitive to poorly textured surfaces. In contrast to these methods, the system proposed here employs active projection of a laser line onto the scene, thereby reducing the need for extensive texture while maintaining a compact, rigidly mounted design. However, the research also reveals several important limitations. Primarily, the accuracy and precision of the digitized data are contingent upon a multitude of intrinsic and extrinsic parameters, numbering 45 in the present design. This underscores the complexity of tuning the system for different objects and environments. The achievable accuracy is influenced by factors such as laser line thickness, camera resolution, stereo baseline, and ambient lighting conditions. The standard deviation of depth errors (sigma) ranging up to 0.4 mm on specific test surfaces underscores the necessity for meticulous parameter calibration, particularly in scenarios where sub-millimeter accuracy is imperative. In real industrial or medical settings, reflective or glossy surfaces, vibrations, and unpredictable lighting will likely intensify these challenges.
In order to mitigate the aforementioned effects, strategies such as the application of matt coatings on shiny parts, the use of optical filters, or the use of higher-quality laser modules can be employed. It is imperative for users to reposition the laser to achieve wider coverage (either manually or using a stepper motor), which can increase the time required to acquire data. For highly detailed applications, more advanced structured-light approaches (e.g., projecting multiple lines or patterns) might be introduced to expedite scanning while preserving a markerless methodology. Despite the challenges, the benefits of in situ 3D scanning without object movement are evident. A comparison of the point clouds obtained from the in situ 3D scanning system with those from a commercial scanner reveals that the system achieves reasonable accuracy, on the order of tenths of a millimeter, even in the early prototype stage. This accuracy is observed for both planar surfaces and those of moderately complex geometry. In industrial contexts, the capacity to expedite the inspection of equipment internals has the potential to curtail downtime and costs. In the field of medicine, the acquisition of precise 3D data of anatomical structures through endoscopic means has the potential to enhance patient outcomes by facilitating informed diagnosis or guiding minimally invasive procedures.
Future work will focus on refining hardware components, automating and further tuning parameters, and improving robustness in challenging environments. Initially, the integration of advanced camera modules, such as those with higher resolution or global-shutter sensors, along with high-precision lasers, is expected to minimize noise and enhance scanning accuracy and precision. Second, the automation or semi-automation of the tuning of numerous intrinsic and extrinsic parameters will help ensure consistent performance across diverse scanning conditions. Finally, further experimentation is necessary to validate the method in real industrial or clinical environments, where challenges such as specular reflections, limited visibility, or temperature fluctuations may significantly affect data quality.

5. Conclusions

This research has demonstrated an innovative, markerless 3D digitization method for capturing the geometry of physical objects in challenging or constrained environments. The proposed system effectively overcomes the need for external reference markers or sensor movement around the object by combining stereo vision with a projected laser line. This facilitates in situ scanning where conventional techniques may fail. Experimental testing and comparisons to a commercial 3D scanner have shown that the prototype achieves acceptable accuracy and repeatability, even on complex surfaces. However, the performance is sensitive to a variety of intrinsic and extrinsic parameters, such as camera resolution, laser quality, and environmental conditions, which require further research. To enhance the system’s robustness, it is imperative to improve hardware components, automate parameter calibration, and assess the system’s performance in more challenging industrial and clinical environments. The insights gathered and the successes achieved to date underscore the system’s promise for reverse engineering, non-destructive testing, medical diagnostics, and other specialized applications.

Author Contributions

Conceptualization, A.V. and M.K.; methodology, A.V. and M.K.; software, A.V.; validation, M.K. and M.P.; formal analysis, J.K. and J.T.; investigation, J.K. and J.T.; resources, M.K. and M.P.; data curation, J.K. and J.T.; writing—original draft preparation, A.V., J.K. and J.T.; writing—review and editing, A.V., J.K. and J.T.; visualization, A.V., J.K. and J.T.; supervision, M.K. and M.P.; project administration, M.K. and M.P.; funding acquisition, M.K. and M.P. All authors have read and agreed to the published version of the manuscript.

Funding

This research received no external funding.

Institutional Review Board Statement

Not applicable.

Informed Consent Statement

Not applicable.

Data Availability Statement

The datasets generated during the current study and analyzed during the current study are available from the corresponding author upon reasonable request. The data are not publicly available due to privacy.

Acknowledgments

This research was funded by project KEGA 002TUKE-4/2023 and VEGA 1/0121/23, granted by the Ministry of Education, Research, Development and Youth of the Slovak Republic, and by the EU NextGenerationEU through the Recovery and Resilience Plan for Slovakia under the project No. 09I05-03-V02-00042.

Conflicts of Interest

The authors declare no conflict of interest.

Abbreviations

The following abbreviations are used in this manuscript:
3DThree-dimensional
2DTwo-dimensional
ICPIterative Closest Point
SLAMSimultaneous Localization and Mapping
CADComputer Aided Design
CMMCoordinate Measuring Machine
LiDARLight Detection and Ranging
ToFTime of Flight
SfMShape from Motion
SfSShape from Stereo
CMBFComplimentary Multiband Band-pass Filters
SfShShape from Shading
SfDShape from Defocus
BMBlock Matching
SGBMSemi-Global Block Matching
WiFiWireless Fidelity
FFFFused Filament Fabrication
GPIOGeneral Purpose Input/Output
RAMRandom Access Memory
PSRAMPseudo-Static Random Access Memory
LEDLight Emitting Diode
IPInternet Protocol
AWBAuto White Balance
AECAutomatic Exposure Control
AEAutomatic Exposure
GMAGamma
BPCBlack Pixel Correction
WPCWhite Pixel Correction
MPxMegapixels
RGBRed Green Blue
HSLHue Saturation Lightness
HSVHue Saturation Value

References

  1. Wakjira, Y.; Kurukkal, N.S.; Lemu, H.G. Assessment of the Accuracy of 3D Printed Medical Models through Reverse Engineering. Heliyon 2024, 10, e31829. [Google Scholar] [CrossRef] [PubMed]
  2. Strzępek, P. The Assessment of Abrasion Resistance of Casted Non-Ferrous Metals and Alloys with the Use of 3D Scanning. Processes 2024, 12, 2200. [Google Scholar] [CrossRef]
  3. Borthakur, P.P. The Role and Future Directions of 3D Printing in Custom Prosthetic Design. Eng. Proc. 2025, 81, 10. [Google Scholar] [CrossRef]
  4. Szalai, V.; Stratan, A.; Ciutina, A.; Clepe, A.D.; Ene, A. Procedure for Generation of Finite Element Models of Steel Members from 3D Scanned Data. In Lecture Notes in Civil Engineering; Springer Nature Switzerland: Cham, Switzerland, 2024; pp. 154–164. ISBN 9783031577994. [Google Scholar]
  5. Daneshmand, M.; Helmi, A.; Avots, E.; Noroozi, F.; Alisinanoglu, F.; Arslan, H.S.; Gorbova, J.; Haamer, R.E.; Ozcinar, C.; Anbarjafari, G. 3D Scanning: A Comprehensive Survey. arXiv 2018, arXiv:1801.08863. [Google Scholar]
  6. Vodilka, A.; Kočiško, M.; Kaščak, J. Design of a Prototype of an Innovative 3D Scanning Technology for Use in the Digitization of Hard-to-Reach Places. Appl. Sci. 2025, 15, 2817. [Google Scholar] [CrossRef]
  7. Zhou, Q.-Y.; Park, J.; Koltun, V. Open3D: A Modern Library for 3D Data Processing. arXiv 2018, arXiv:1801.09847. [Google Scholar]
  8. Macario Barros, A.; Michel, M.; Moline, Y.; Corre, G.; Carrel, F. A Comprehensive Survey of Visual SLAM Algorithms. Robotics 2022, 11, 24. [Google Scholar] [CrossRef]
  9. Teo, T.-A.; Huang, S.-H. Surface-Based Registration of Airborne and Terrestrial Mobile LiDAR Point Clouds. Remote Sens. 2014, 6, 12686–12707. [Google Scholar] [CrossRef]
  10. Silva, R.; Silva, B.; Fernandes, C.; Morouço, P.; Alves, N.; Veloso, A. A Review on 3D Scanners Studies for Producing Customized Orthoses. Sensors 2024, 24, 1373. [Google Scholar] [CrossRef] [PubMed]
  11. Török, J.; Vodilka, A.; Kaščak, J.; Kočiško, M. Design of Personalized Orthoses with Support of PTC Creo and FDM Technology. In Lecture Notes in Mechanical Engineering; Springer Nature Switzerland: Cham, Switzerland, 2024; pp. 149–162. ISBN 9783031564581. [Google Scholar]
  12. Rothstock, S.; Weiss, H.-R.; Krueger, D.; Kleban, V.; Paul, L. Innovative Decision Support for Scoliosis Brace Therapy Based on Statistical Modelling of Markerless 3D Trunk Surface Data. Comput. Methods Biomech. Biomed. Engin. 2020, 23, 923–933. [Google Scholar] [CrossRef] [PubMed]
  13. Cheng, D.; Shi, H.; Xu, A.; Schwerin, M.; Crivella, M.; Li, L.; Choset, H. Visual-Laser-Inertial SLAM Using a Compact 3D Scanner for Confined Space. In Proceedings of the 2021 IEEE International Conference on Robotics and Automation (ICRA), Xi’an, China, 30 May–5 June 2021; IEEE: Piscataway, NJ, USA, 2021. [Google Scholar]
  14. Chen, R.; Chen, F.; Xu, G.; Li, X.; Shen, H.; Yuan, J. Precision Analysis Model and Experimentation of Vision Reconstruction with Two Cameras and 3D Orientation Reference. Sci. Rep. 2021, 11, 3875. [Google Scholar] [CrossRef] [PubMed]
  15. Wang, M.; Sun, Q.; Gao, C.; Ren, Z.; Dai, W. A Three-Dimensional Vision Measurement Method Based on Double-Line Combined Structured Light. Sci. Rep. 2023, 13, 18660. [Google Scholar] [CrossRef] [PubMed]
  16. Messler, R.W., Jr. Reverse Engineering: Mechanisms, Structures, Systems & Materials; McGraw-Hill Professional: New York, NY, USA, 2013; ISBN 9780071825160. [Google Scholar]
  17. Kumar, A.; Jain, P.K.; Pathak, P.M. Reverse Engineering in Product Manufacturing: An Overview. In DAAAM International Scientific Book 2013; DAAAM International Vienna: Vienna, Austria, 2013; pp. 665–678. ISBN 9783901509940. [Google Scholar]
  18. Wang, W. Reverse Engineering: Technology of Reinvention; CRC Press: Boca Raton, FL, USA, 2010; ISBN 9781439806302. [Google Scholar]
  19. Vasco, J.C. Additive Manufacturing for the Automotive Industry. In Additive Manufacturing; Elsevier: Amsterdam, The Netherlands, 2021; pp. 505–530. ISBN 9780128184110. [Google Scholar]
  20. Geng, J.; Xie, J. Review of 3-D Endoscopic Surface Imaging Techniques. IEEE Sens. J. 2014, 14, 945–960. [Google Scholar] [CrossRef]
  21. Luhmann, T.; Robson, S.; Kyle, S.; Boehm, J. Close-Range Photogrammetry and 3D Imaging, 4th ed.; De Gruyter: Berlin, Germany, 2023; ISBN 9783111029351. [Google Scholar]
  22. ESP32-CAM Camera Development Board. Available online: https://docs.ai-thinker.com/en/esp32-cam (accessed on 13 March 2025).
  23. Brahmbhatt, S. Practical OpenCV, 1st ed.; APress: Berlin, Germany, 2013; ISBN 9781430260790. [Google Scholar]
  24. OpenCV: Camera Calibration with OpenCV. Available online: https://docs.opencv.org/4.x/d4/d94/tutorial_camera_calibration.html (accessed on 14 March 2025).
  25. Vaishya, A. Mastering OpenCV with Python: Use NumPy, Scikit, TensorFlow, and Matplotlib to Learn Advanced Algorithms for Machine Learning Through a Set of Practical Projects; Orange Education: Delhi, India, 2023; ISBN 9789390475797. [Google Scholar]
  26. OpenCV: Camera Calibration with Square Chessboard. Available online: https://docs.opencv.org/4.x/dc/d43/tutorial_camera_calibration_square_chess.html (accessed on 14 March 2025).
  27. Bradski, G.R.; Kaehler, A. Learning OpenCV: Computer Vision with the OpenCV Library, 2nd ed.; O’Reilly Media: Sebastopol, CA, USA, 2015; ISBN 9781449314651. [Google Scholar]
  28. Chen, J. Learn OpenCV with Python by Examples: Implement Computer Vision Algorithms Provided by OpenCV with Python for Image Processing, Object Detection and Machine Learning, 2nd ed.; James Chen, 2023; ISBN 9781738908448. [Google Scholar]
  29. CR-Scan Raptor. Available online: https://www.creality.com/products/creality-cr-scan-raptor (accessed on 27 March 2025).
  30. Vodilka, A.; Pollák, M.; Kočiško, M. Polygonization of the Surface Digitized Using Helios2 Time-of-Flight Camera. In EAI/Springer Innovations in Communication and Computing; Springer International Publishing: Cham, Switzerland, 2023; pp. 31–43. ISBN 9783031227189. [Google Scholar]
Figure 1. Stages of digitization in reverse engineering.
Applsci 15 04533 g001
Figure 2. Representation of reverse engineering techniques.
Applsci 15 04533 g002
Figure 3. CAD view of the initial device design.
Applsci 15 04533 g003
Figure 4. The CameraWebServer graphical user interface (GUI) when utilized with a pair of ESP32-CAM devices.
Applsci 15 04533 g004
Figure 5. The photograph illustrates the scene during the process of device calibration.
Applsci 15 04533 g005
Figure 6. Representation of laser beam projection within the device testing.
Applsci 15 04533 g006
Figure 7. Representation of images before laser pattern extraction. (a) Left image, (b) right image.
Applsci 15 04533 g007
Figure 8. The display of the acquired binary image of the left camera. (a) Using thresholding before adjustment, (b) after adjustment of thresholding value.
Applsci 15 04533 g008
Figure 9. Illustration of the principle of Z depth calculation using the proposed Active Shape from Stereo method.
Applsci 15 04533 g009
Figure 10. Result of the scan. (a) Obtained point cloud, (b) photograph of the scanning process.
Applsci 15 04533 g010
Figure 11. Obtained point cloud of the digitized surface. (a) Front view, (b) right side view.
Applsci 15 04533 g011
Figure 12. Comparison of obtained point clouds within the proposed program functions. (a) Front view of initial scan, (b) front view of results of computing arithmetic mean of points, (c) front view of results of computing based on averaging the acquired 3D coordinate, (d) right view of initial scan, (e) right view of results of computing arithmetic mean of points, (f) right view of results of computing based on averaging the acquired 3D coordinate.
Applsci 15 04533 g012
Figure 13. Representation of scanning a single laser beam on the surface of a cardboard box.
Applsci 15 04533 g013
Figure 14. ESP32-CAM images used for point cloud calculation.
Applsci 15 04533 g014
Figure 15. Rectified and thresholded binary images used for point cloud computation.
Applsci 15 04533 g015
Figure 16. Comparison of the resulting point clouds. (a) Initial function, (b) second adjusted function, (c) third adjusted function.
Applsci 15 04533 g016
Figure 17. The point cloud obtained from the digitization process conducted using specialized test equipment. (a) Prior to adjustment, (b) subsequent to adjustment.
Applsci 15 04533 g017
Figure 18. Further developed prototype device. (a) CAD assembly, (b) photo of prototype device in the process of 3D digitizing the object in the real world.
Applsci 15 04533 g018
Figure 19. Images and graphical interface of the prototype device software.
Applsci 15 04533 g019
Figure 20. Images after adjustment of HSV values for laser beam pixel registration.
Applsci 15 04533 g020
Figure 21. Results from digitizing process for comparing surface quality. (a) Point cloud derived from the digitizing process employing prototype equipment, (b) three-dimensional mesh model digitized with high precision utilizing Creality CR-Scan Raptor.
Applsci 15 04533 g021
Figure 22. 3D mesh model obtained from the prototype device. (a) Before cropping, (b) after cropping.
Applsci 15 04533 g022
Figure 23. Analysis of geometric deviations between the tested model and the reference model. (a) Result of the deviation analysis, (b) display of the analysis result together with the displayed nominal reference model.
Applsci 15 04533 g023
Disclaimer/Publisher’s Note: The statements, opinions and data contained in all publications are solely those of the individual author(s) and contributor(s) and not of MDPI and/or the editor(s). MDPI and/or the editor(s) disclaim responsibility for any injury to people or property resulting from any ideas, methods, instructions or products referred to in the content.

