

Selective Alkali Activation of Limestone for Additive Manufacturing in Construction: Influence of Alkali Concentration on Physical and Mechanical Properties


Abstract
Featured Application
Abstract

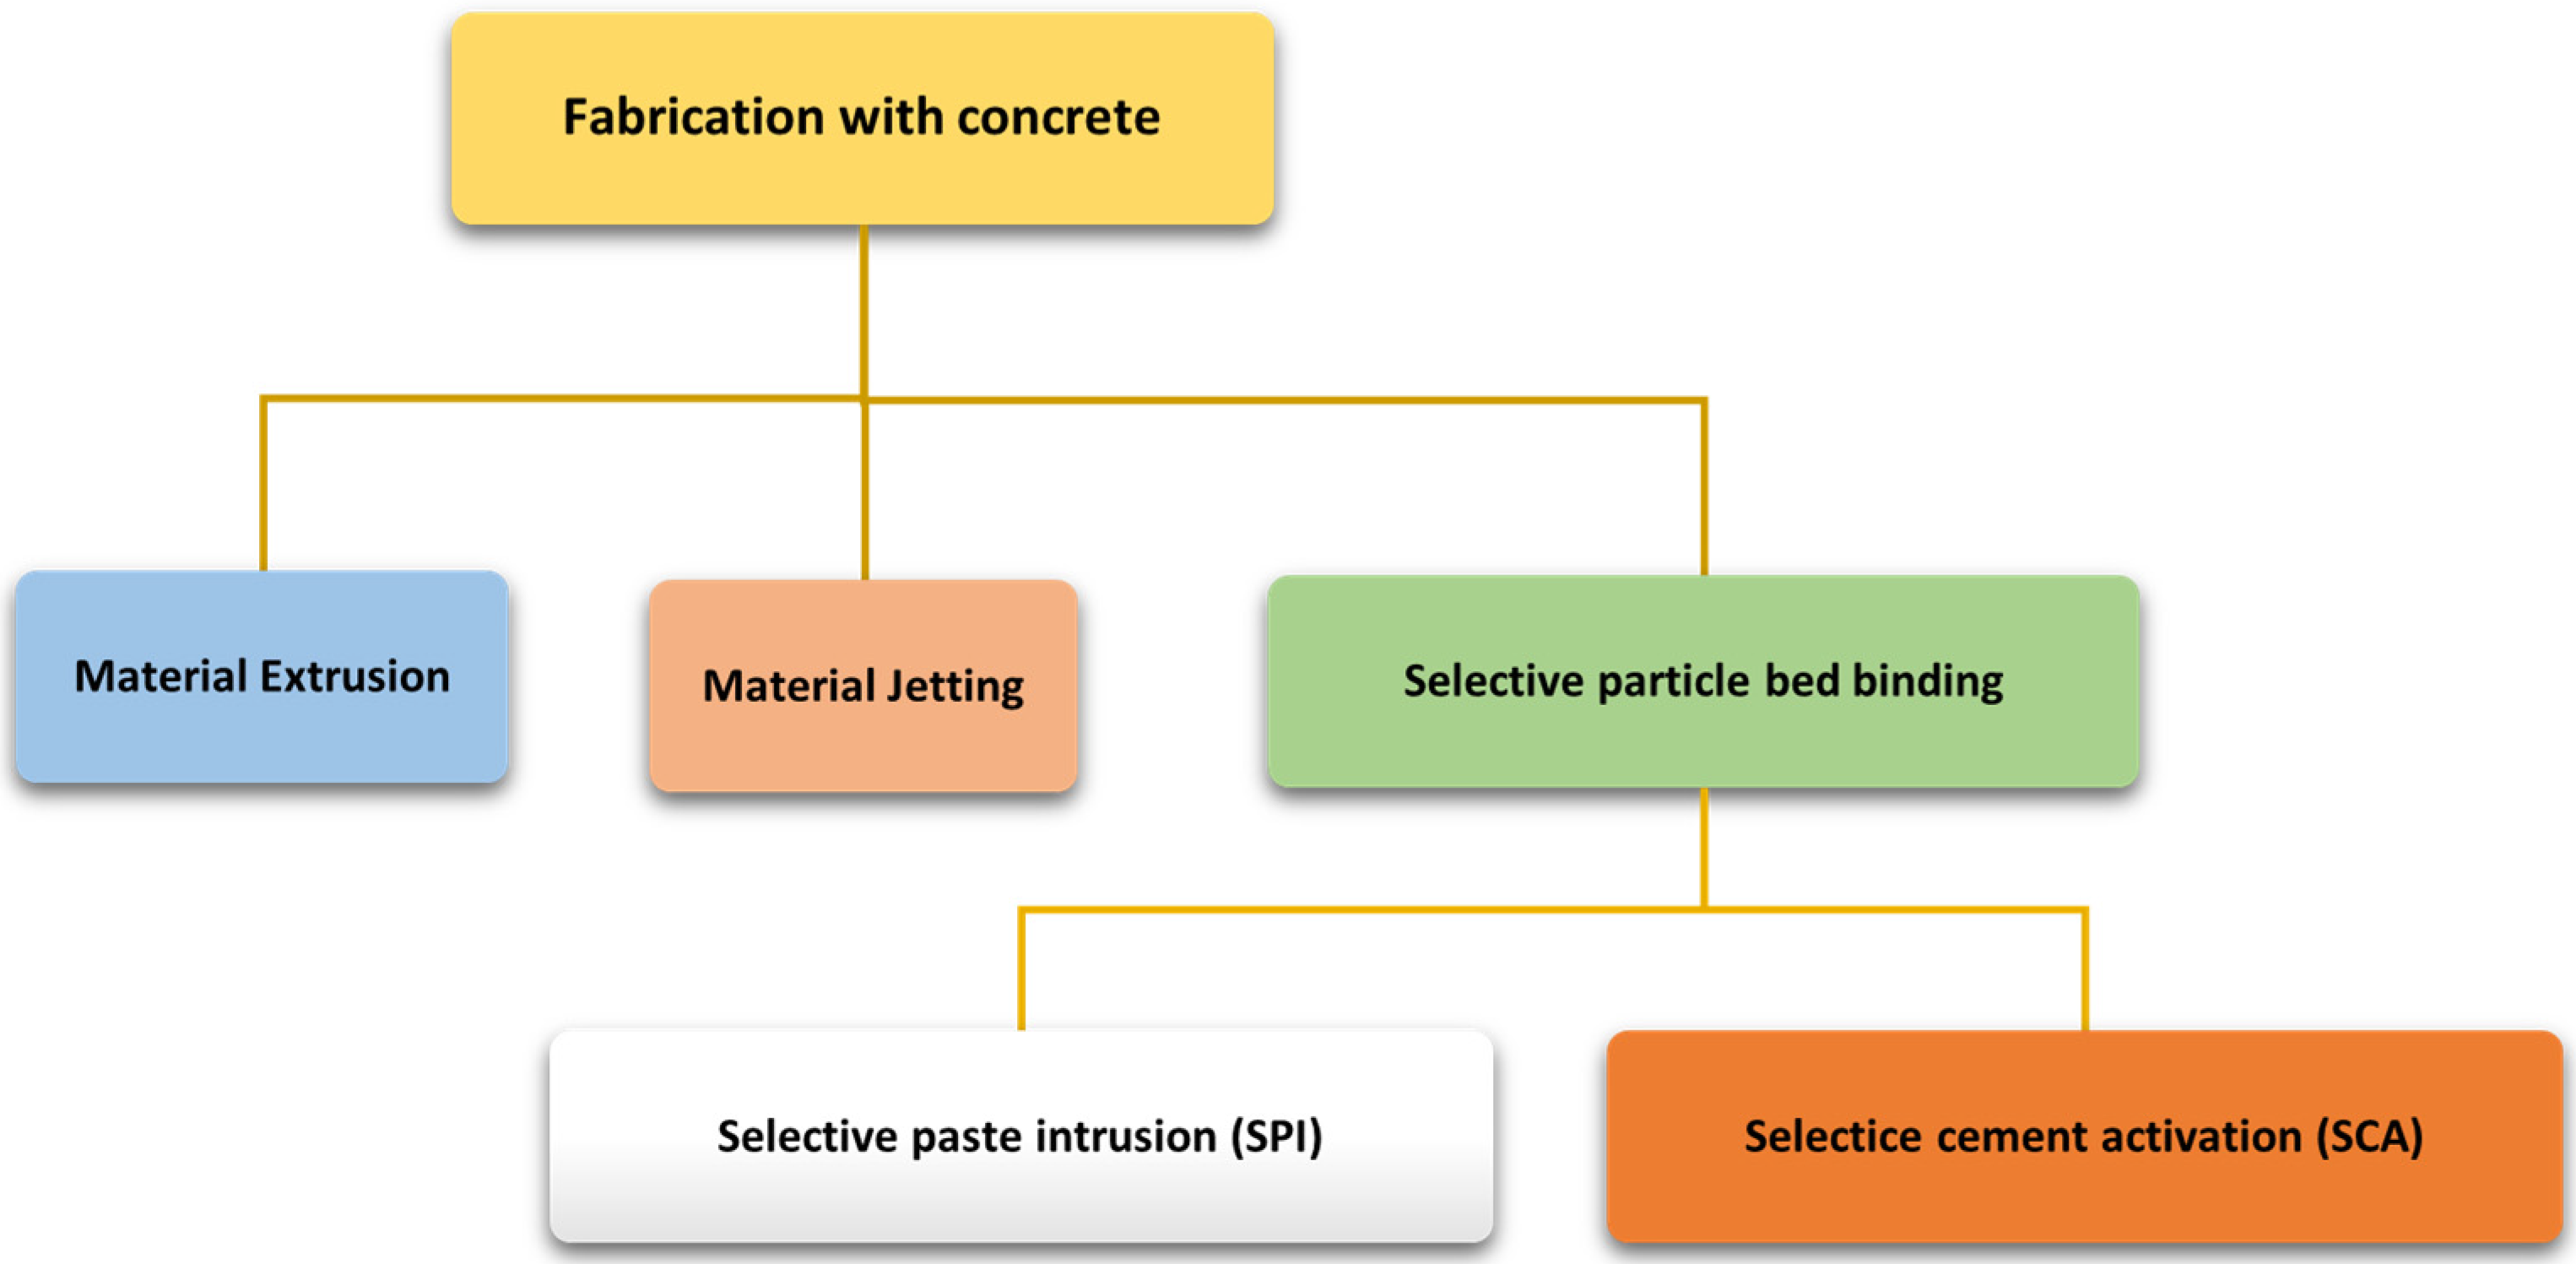
1. Introduction
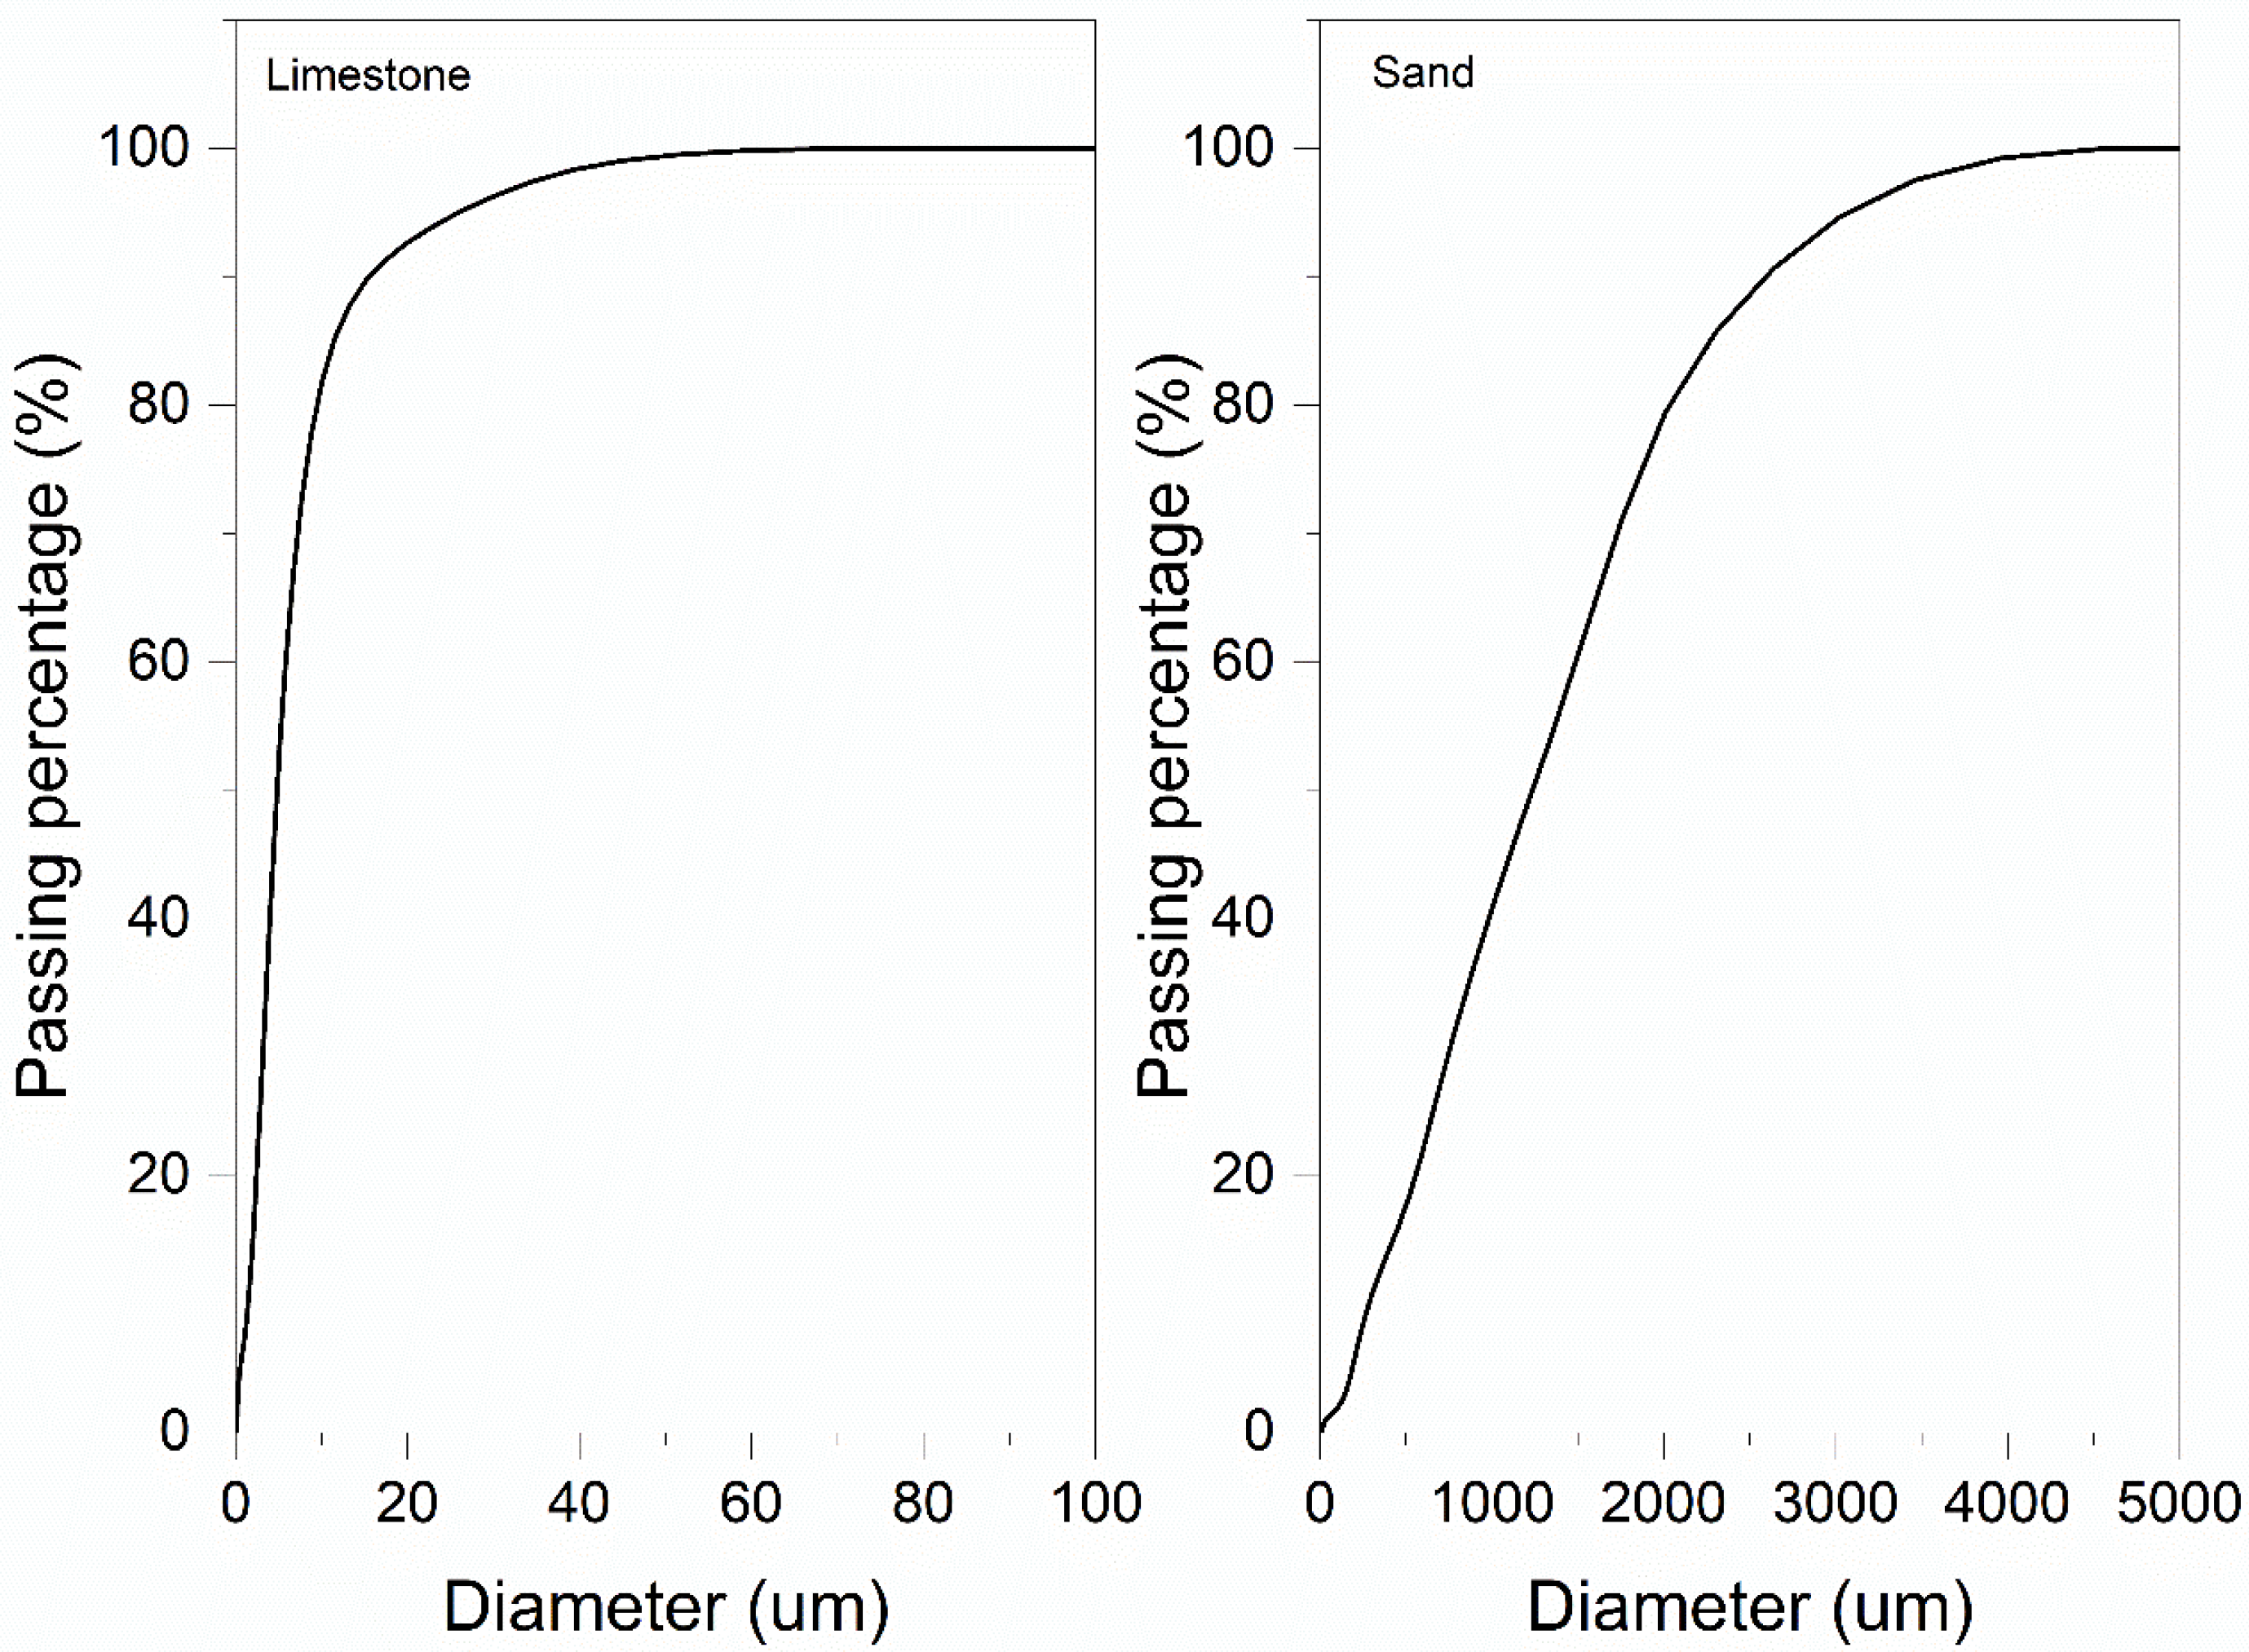
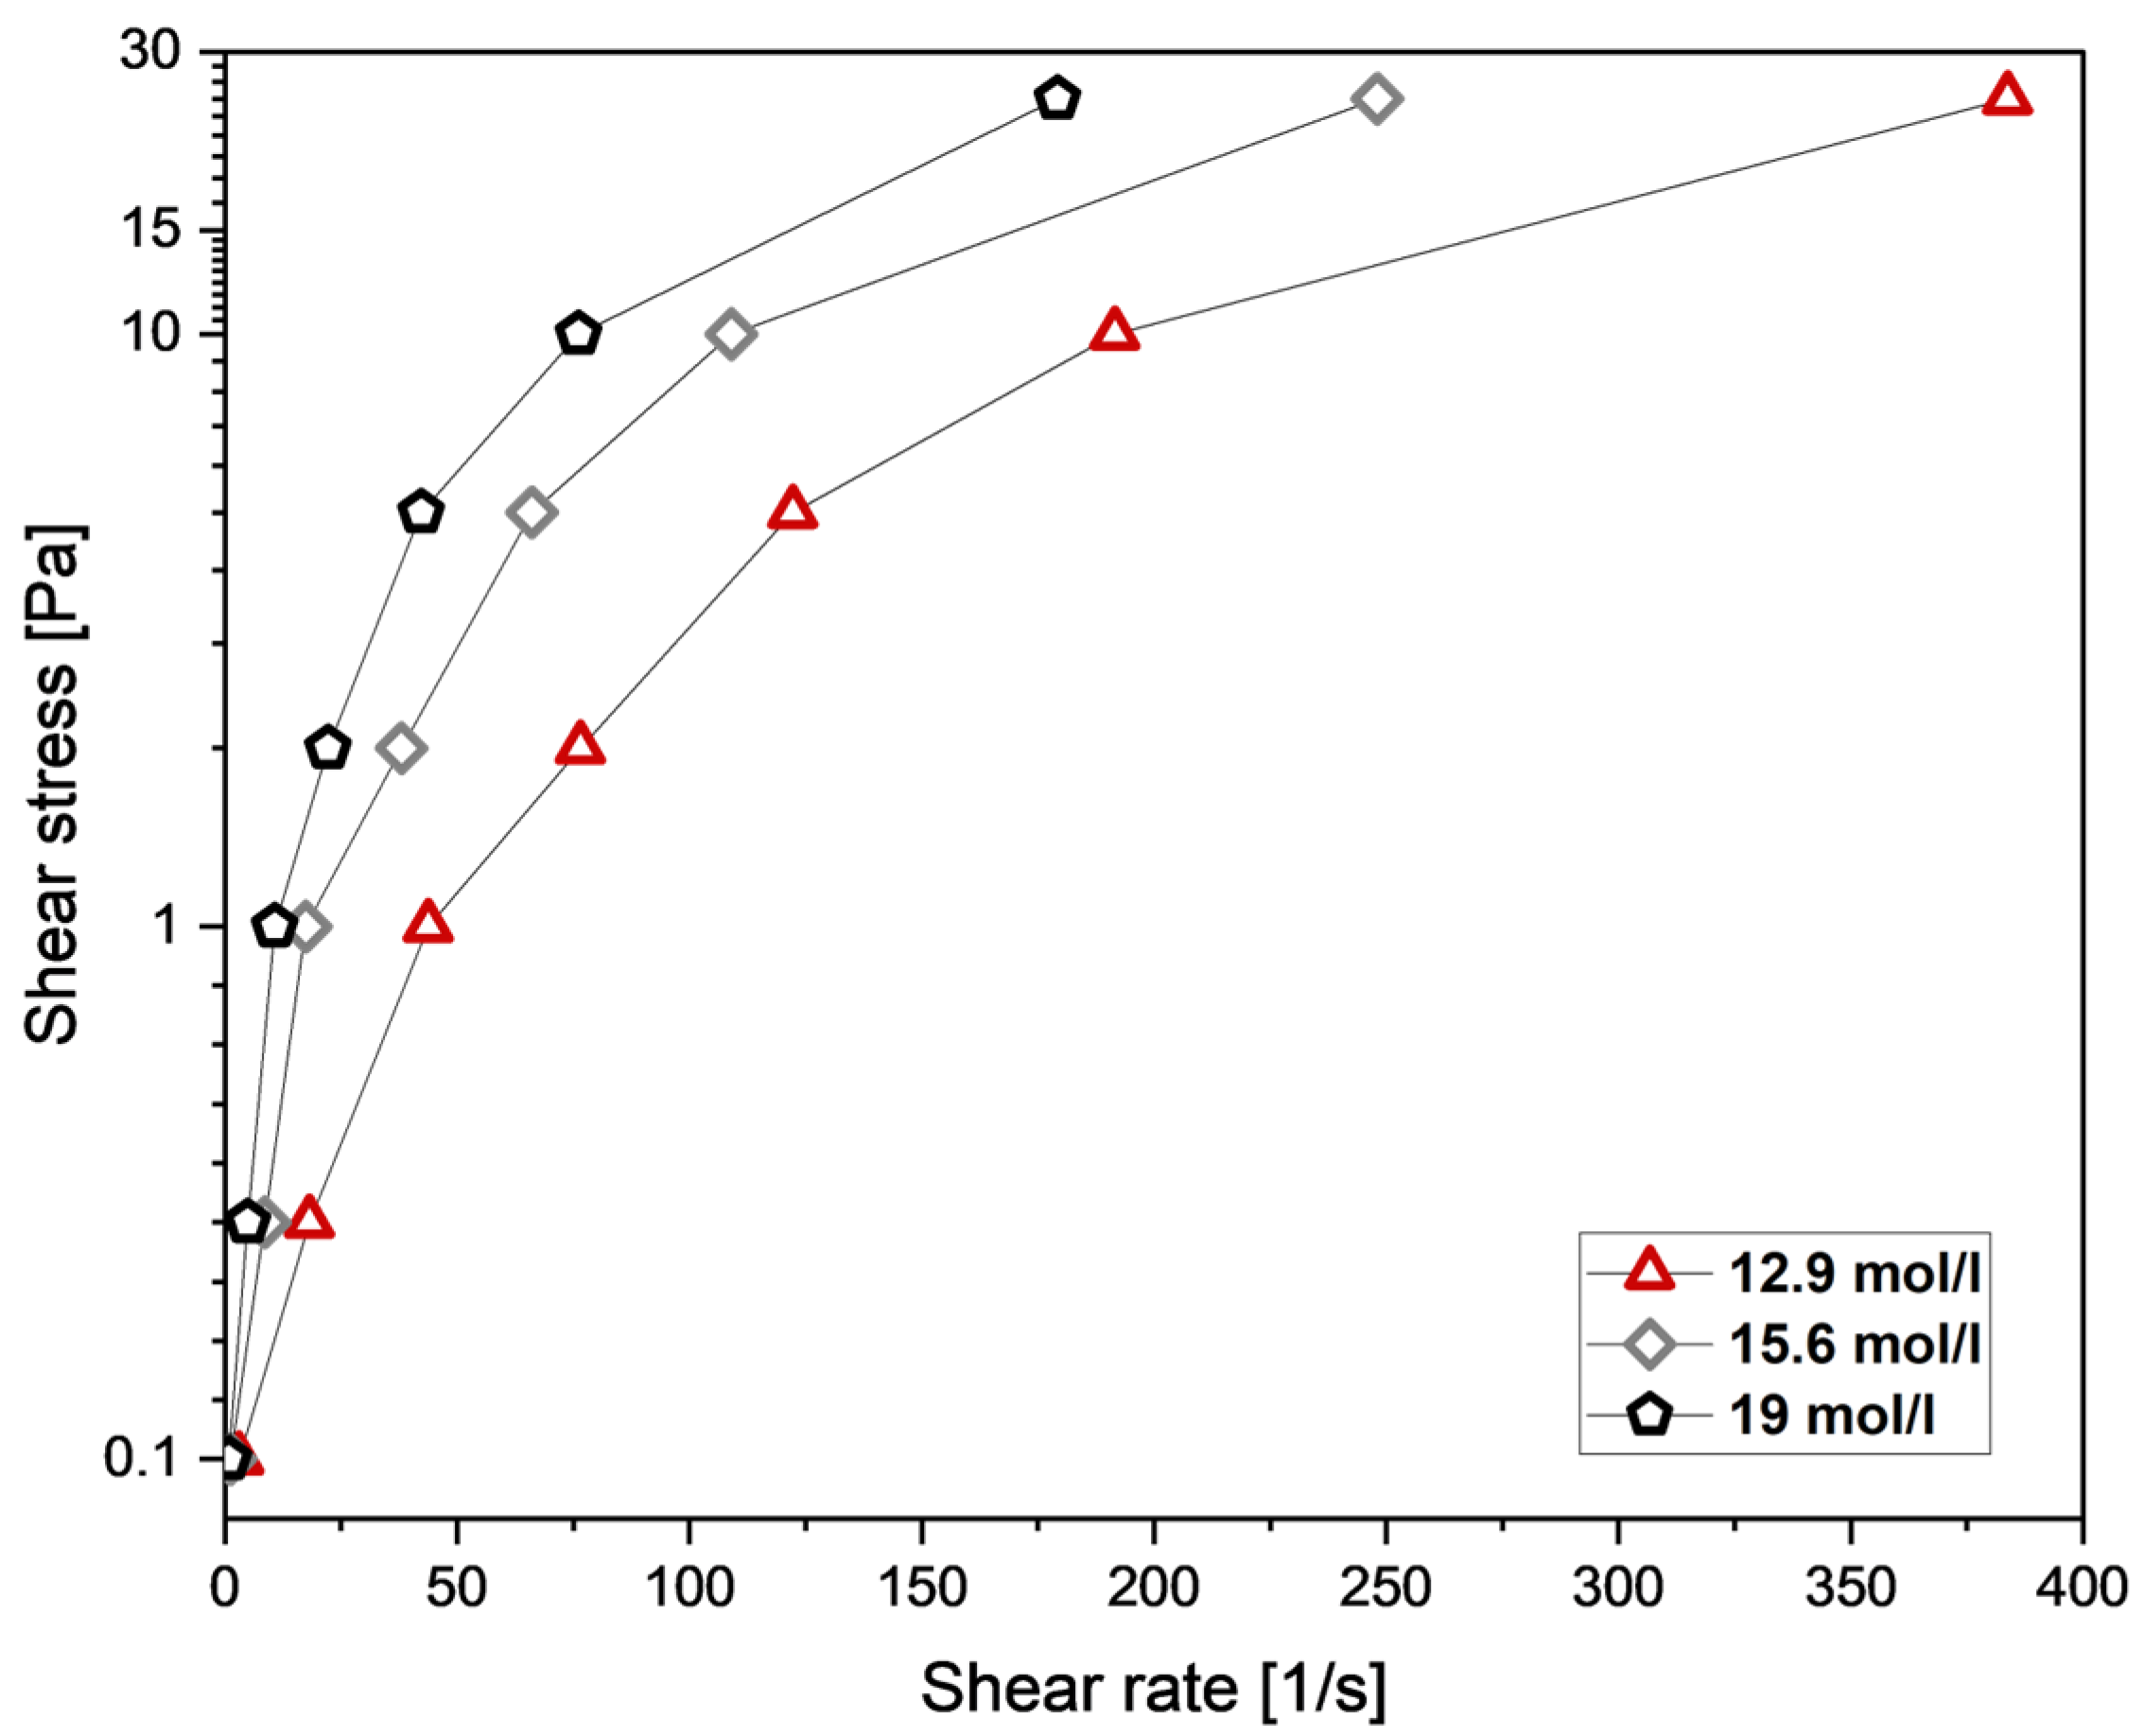
2. Materials and Methods
3. Results and Discussion
3.1. Weight Loss After Printing
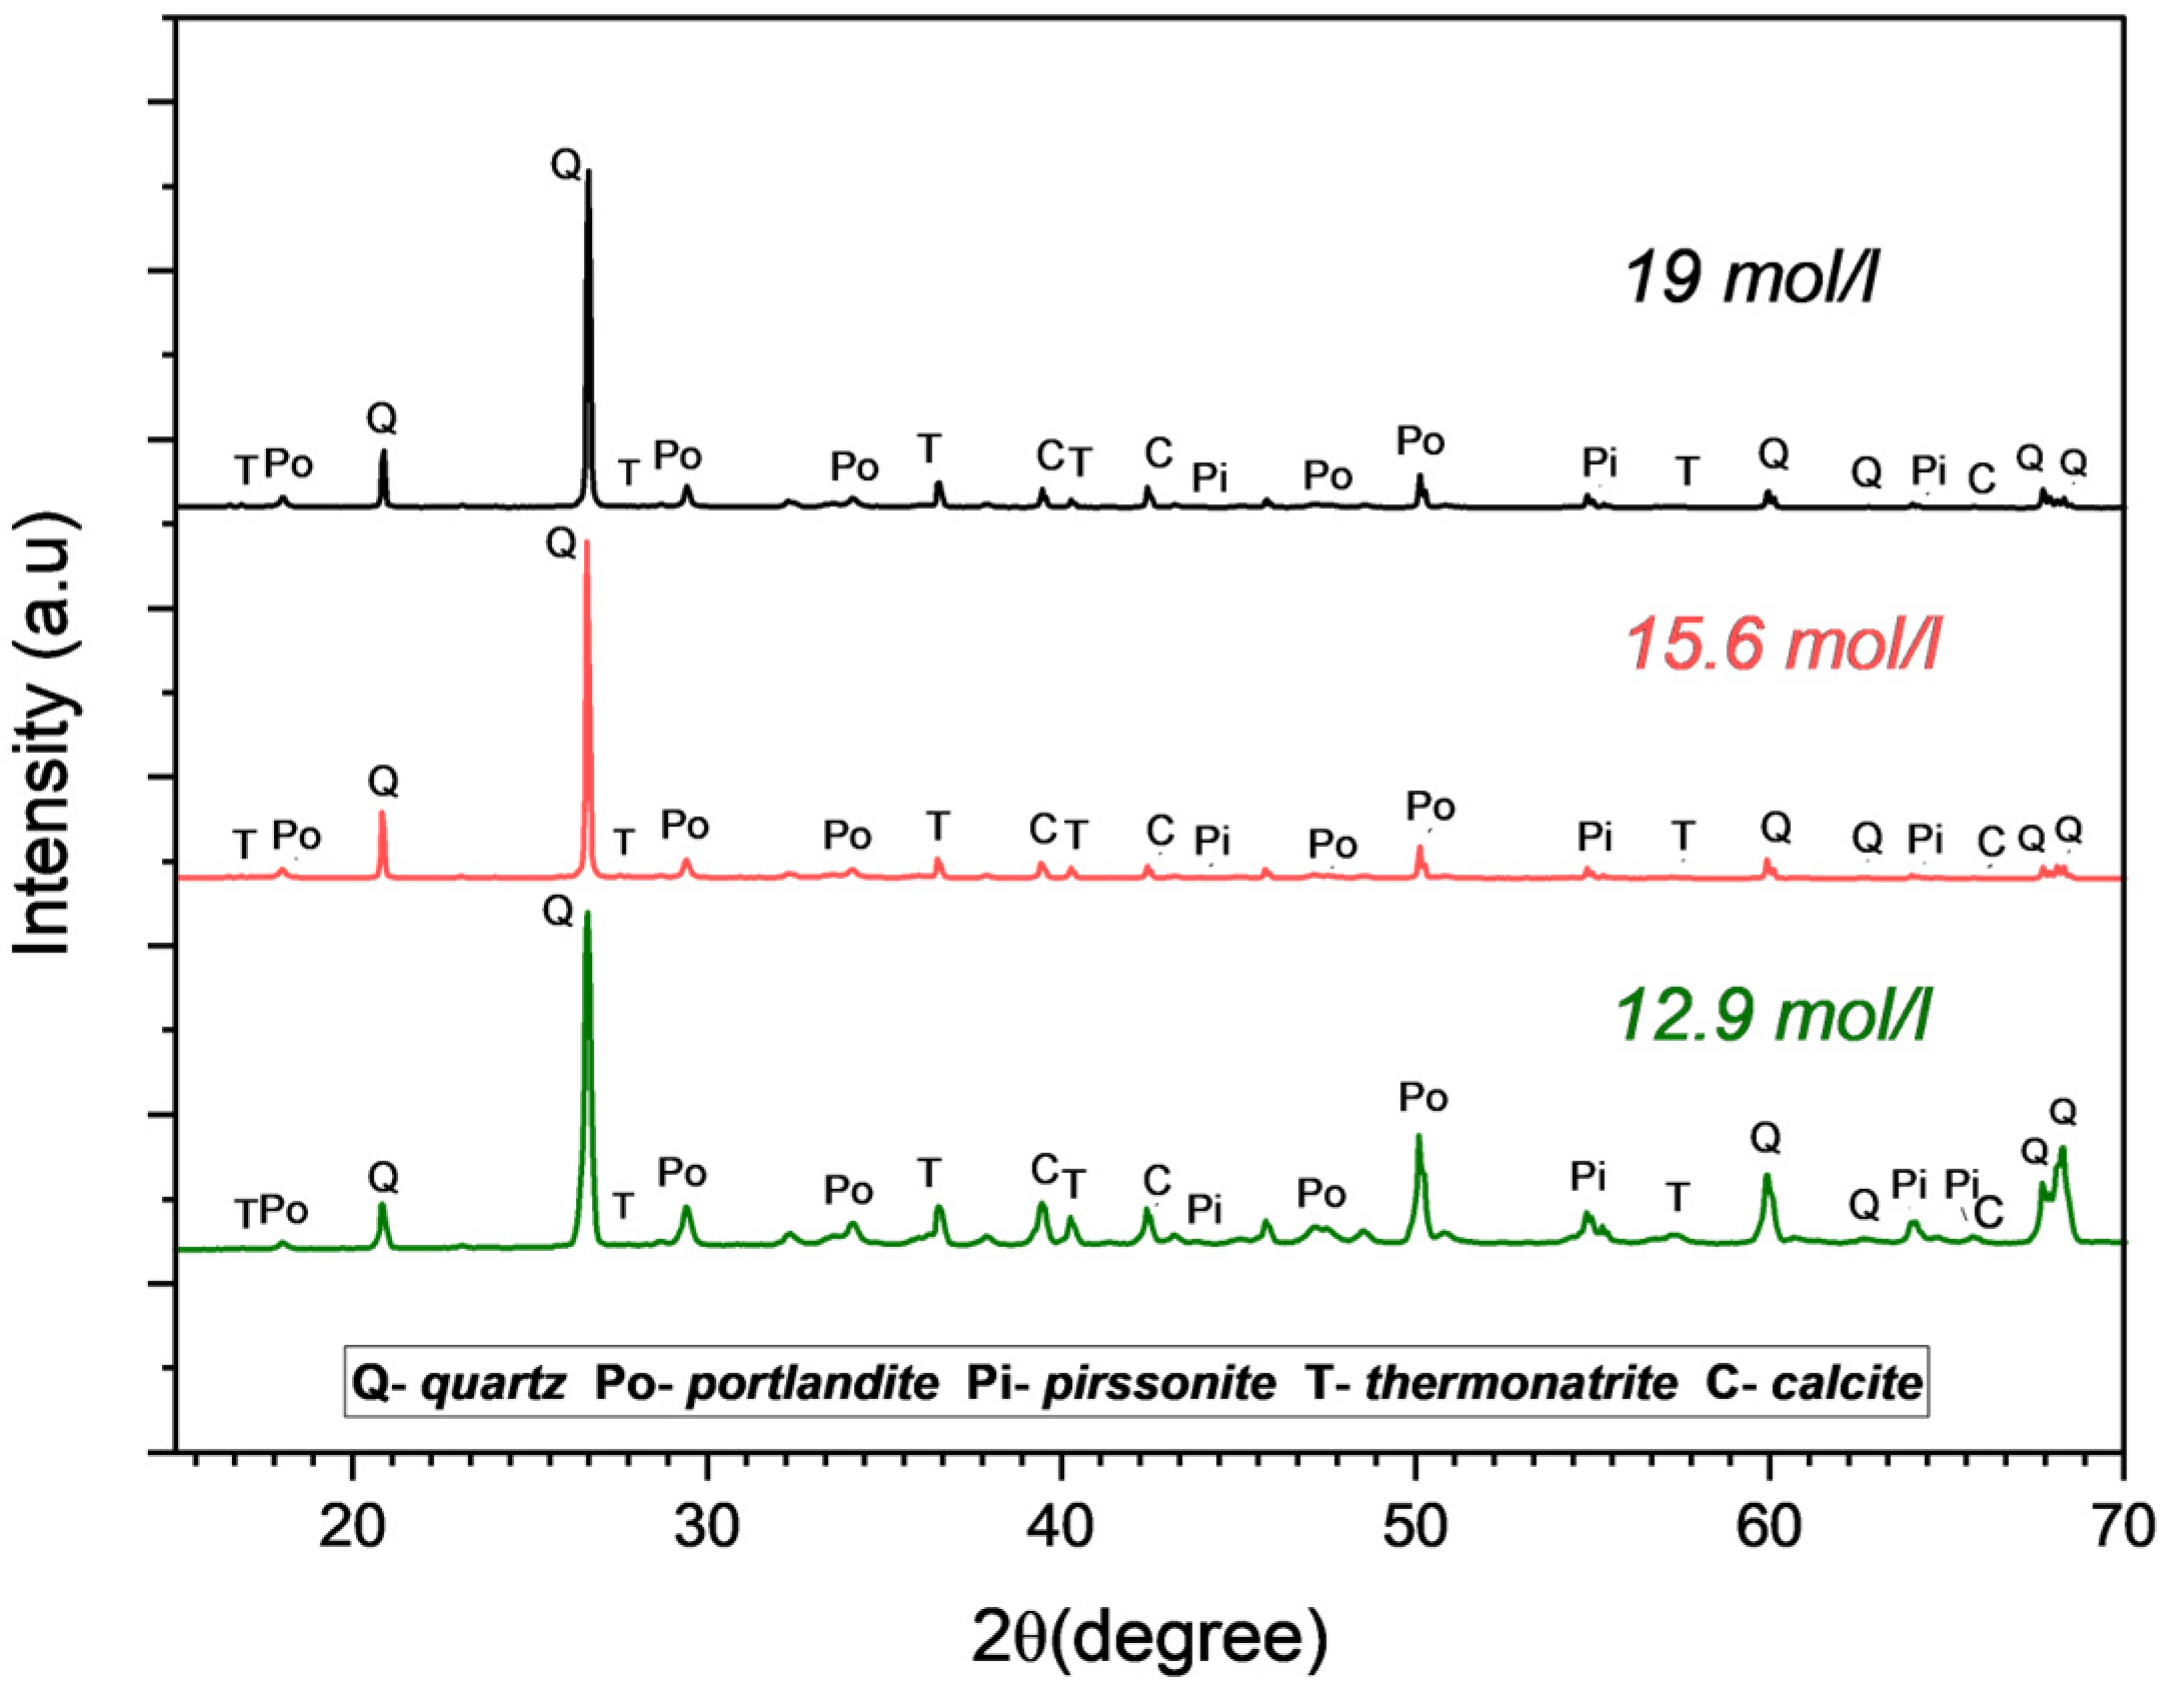
3.2. Identification of the Reaction Product
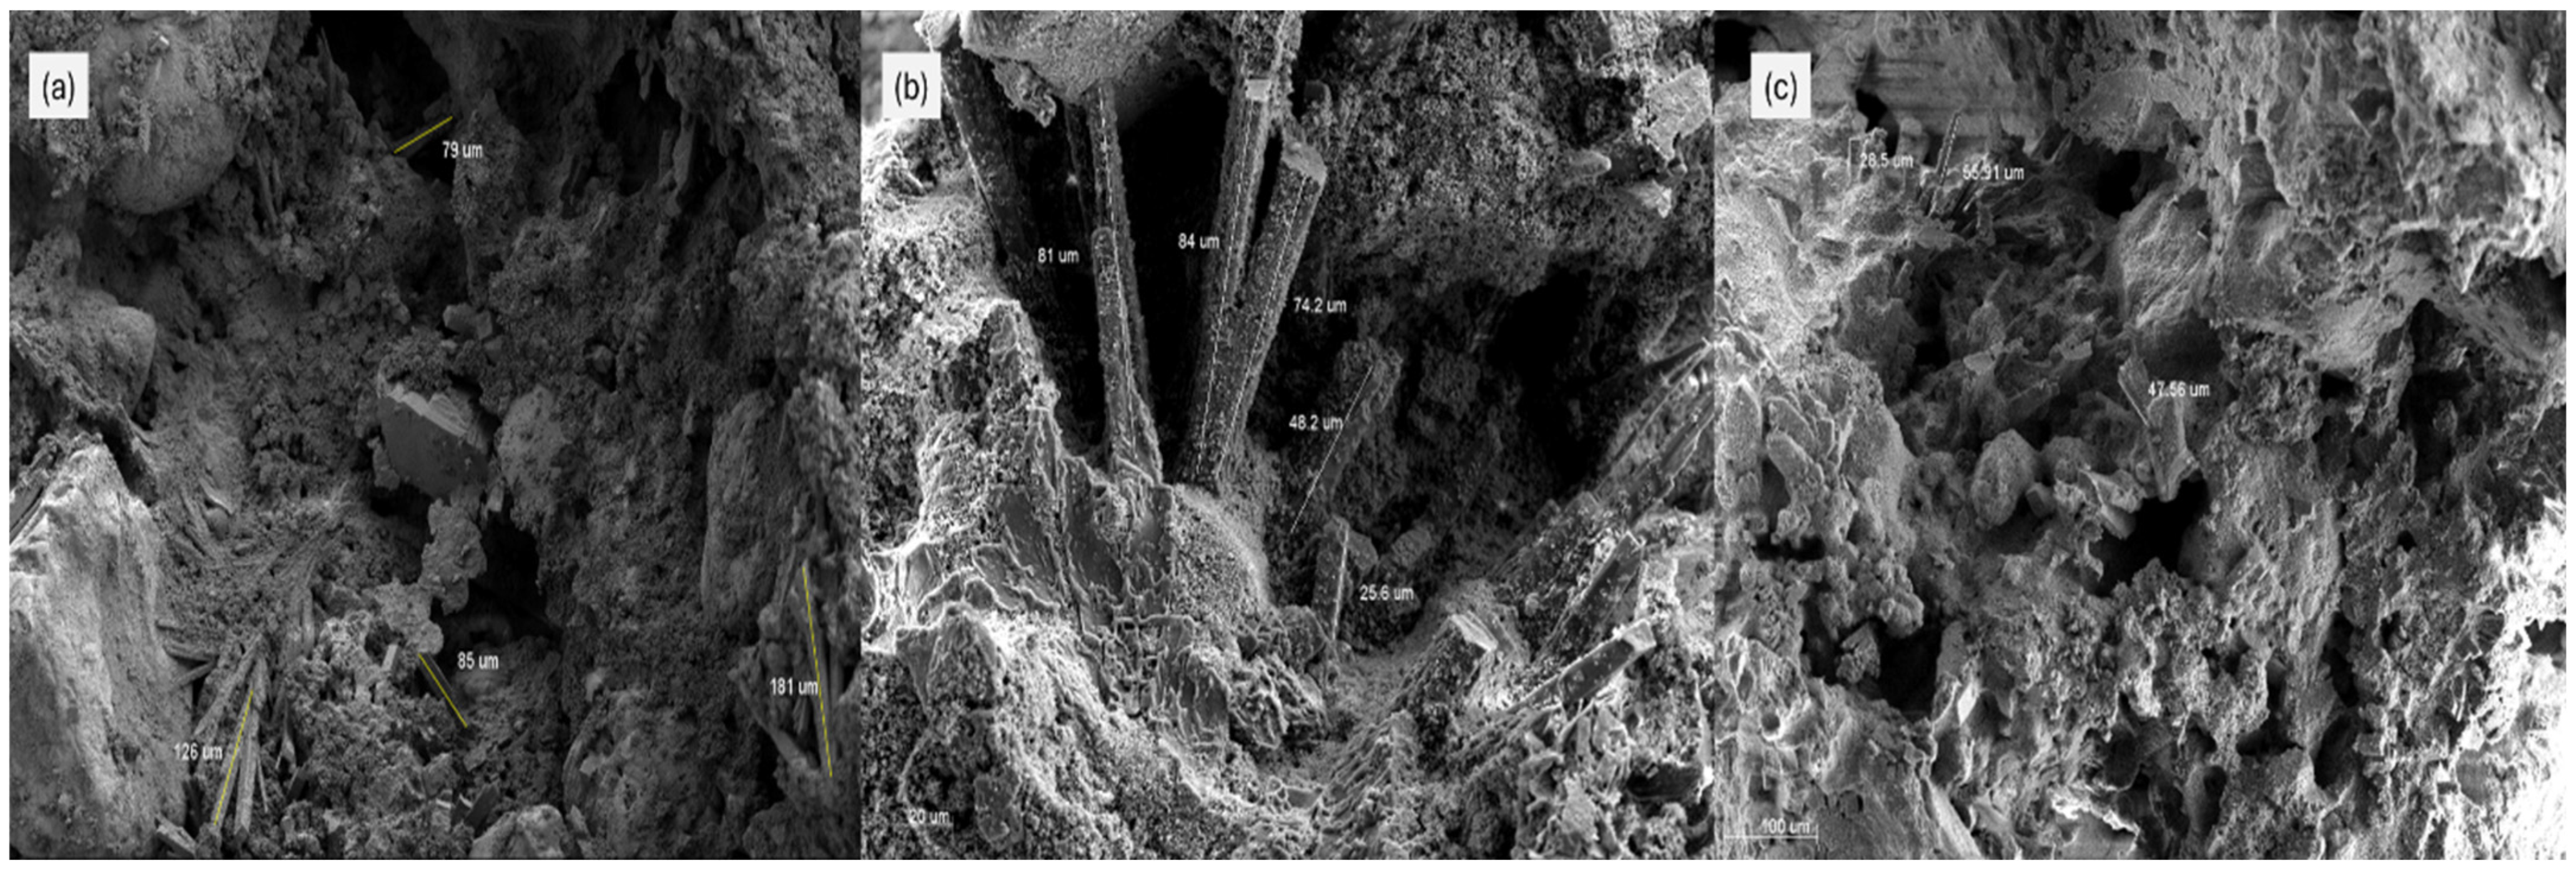
3.3. SEM Analysis
3.4. Porosity
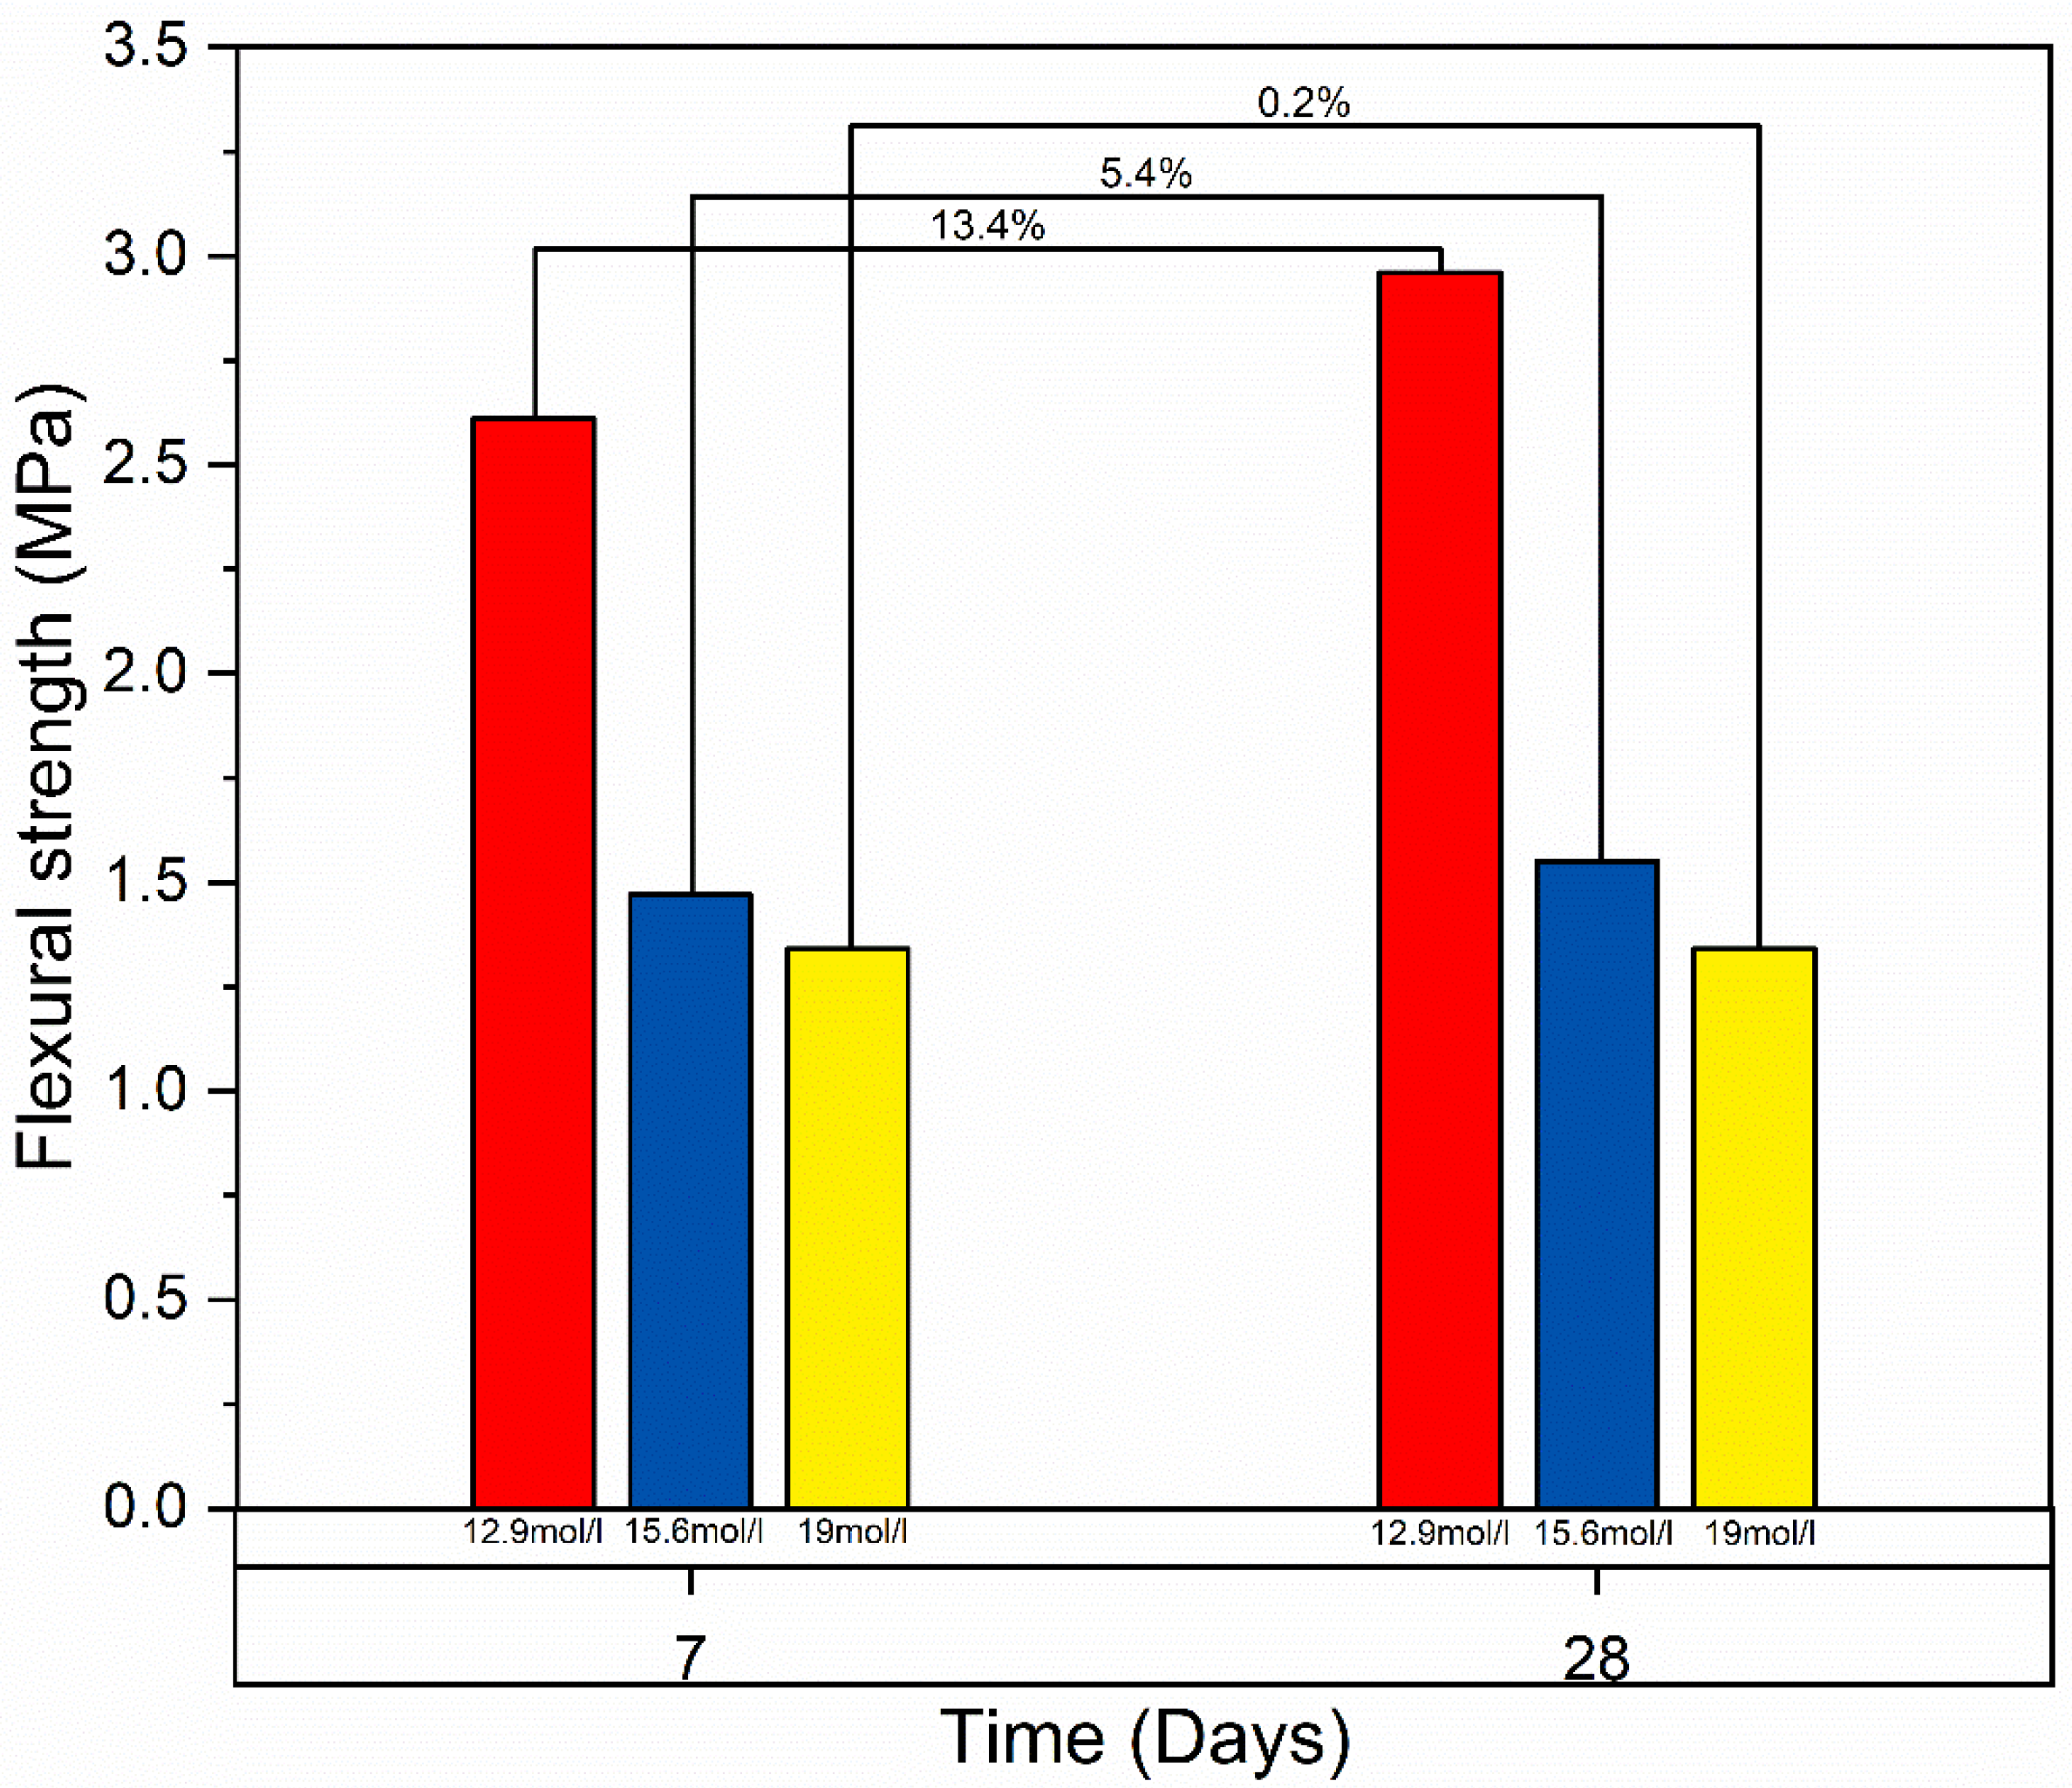
3.5. Mechanical Properties
4. Conclusions
Author Contributions
Funding
Institutional Review Board Statement
Informed Consent Statement
Data Availability Statement
Acknowledgments
Conflicts of Interest
References
- Bhushan, B.; Caspers, M. An Overview of Additive Manufacturing (3D Printing) for Microfabrication. Microsyst. Technol. 2017, 23, 1117–1124. [Google Scholar] [CrossRef]
- Doyle, M.; Agarwal, K.; Sealy, W.; Schull, K. Effect of Layer Thickness and Orientation on Mechanical Behavior of Binder Jet Stainless Steel 420 + Bronze Parts. Procedia Manuf. 2015, 1, 251–262. [Google Scholar] [CrossRef]
- Gibson, I.; Rosen, D.W.; Stucker, B. Additive Manufacturing Technologies: Rapid Prototyping to Direct Digital Manufacturing; Springer: Berlin/Heidelberg, Germany, 2010; pp. 1–459. [Google Scholar] [CrossRef]
- Gibson, I.; Rosen, D.; Stucker, B. Additive Manufacturing Technologies: 3D Printing, Rapid Prototyping, and Direct Digital Manufacturing, 2nd ed.; Springer: Berlin/Heidelberg, Germany, 2015; pp. 1–498. [Google Scholar] [CrossRef]
- Lowke, D.; Dini, E.; Perrot, A.; Weger, D.; Gehlen, C.; Dillenburger, B. Particle-Bed 3D Printing in Concrete Construction—Possibilities and Challenges. Cem. Concr. Res. 2018, 112, 50–65. [Google Scholar] [CrossRef]
- Pierre, A.; Weger, D.; Perrot, A.; Lowke, D. Penetration of Cement Pastes into Sand Packings during 3D Printing: Analytical and Experimental Study. Mater. Struct. 2018, 51, 22. [Google Scholar] [CrossRef]
- Shakor, P.; Sanjayan, J.; Nazari, A.; Nejadi, S. Modified 3D Printed Powder to Cement-Based Material and Mechanical Properties of Cement Scaffold Used in 3D Printing. Constr. Build. Mater. 2017, 138, 398–409. [Google Scholar] [CrossRef]
- Ingaglio, J.; Fox, J.; Naito, C.J.; Bocchini, P. Material Characteristics of Binder Jet 3D Printed Hydrated CSA Cement with the Addition of Fine Aggregates. Constr. Build. Mater. 2019, 206, 494–503. [Google Scholar] [CrossRef]
- Xia, M.; Nematollahi, B.; Sanjayan, J. Compressive Strength and Dimensional Accuracy of Portland Cement Mortar Made Using Powder-Based 3D Printing for Construction Applications. In Proceedings of the First RILEM International Conference on Concrete and Digital Fabrication—Digital Concrete 2018, Zurich, Switzerland, 10–12 September 2018; Timothy, W., Flatt, R.J., Eds.; Springer International Publishing: Cham, Switzerland, 2019; pp. 245–254. [Google Scholar]
- Weger, D.; Lowke, D.; Gehlen, C. 3D Printing of Concrete Structures Using the Selective Binding Method—Effect of Concrete Technology on Contour Precision and Compressive Strength. In Proceedings of the 11th fib International PhD Symposium in Civil Engineering, Tokyo, Japan, 29–31 August 2016. [Google Scholar]
- Lowke, D.; Talke, D.; Dressler, I.; Weger, D.; Gehlen, C.; Ostertag, C.; Rael, R. Particle Bed 3D Printing by Selective Cement Activation—Applications, Material and Process Technology. Cem. Concr. Res. 2020, 134, 106077. [Google Scholar] [CrossRef]
- Mai, I.; Lowke, D.; Perrot, A. Fluid Intrusion in Powder Beds for Selective Cement Activation—An Experimental and Analytical Study. Cem. Concr. Res. 2022, 156, 106771. [Google Scholar] [CrossRef]
- Shahid, M.; Sglavo, V.M. Binder Jetting 3D Printing of Binary Cement—Siliceous Sand Mixture. Materials 2024, 17, 1514. [Google Scholar] [CrossRef]
- Salari, F.; Bosetti, P.; Sglavo, V.M. Binder Jetting 3D Printing of Magnesium Oxychloride Cement-Based Materials: Parametric Analysis of Manufacturing Factors. J. Manuf. Mater. Process. 2022, 6, 86. [Google Scholar] [CrossRef]
- Ur Rehman, A.; Sglavo, V.M. 3D Printing of Geopolymer-Based Concrete for Building Applications. Rapid Prototyp. J. 2020, 26, 1783–1788. [Google Scholar] [CrossRef]
- Pichat, P. Fabrication d’ Un Matériau Solide à Partir d’ Un Hydroxyde Alcalin. WO2006087484A3, 24 August 2006. [Google Scholar]
- van Leeuwen, R.; Kim, Y.-J.; Sriraman, V. The Effects of Limestone Powder Particle Size on the Mechanical Properties and the Life Cycle Assessment of Concrete. J. Civ. Eng. Res. 2016, 6, 104–113. [Google Scholar] [CrossRef]
- Ortega-Zavala, D.E.; Santana-Carrillo, J.L.; Burciaga-Díaz, O.; Escalante-García, J.I. An Initial Study on Alkali Activated Limestone Binders. Cem. Concr. Res. 2019, 120, 267–278. [Google Scholar] [CrossRef]
- Avila-López, U.; Almanza-Robles, J.M.; Escalante-García, J.I. Investigation of Novel Waste Glass and Limestone Binders Using Statistical Methods. Constr. Build. Mater. 2015, 82, 296–303. [Google Scholar] [CrossRef]
- Cousture, A.; Renault, N.; Ndiaye, K.; Gallias, J.L. Mechanisms of Alkali-Activation of Limestone: Reaction Kinetics and Influence of Drying Parameters. Constr. Build. Mater. 2024, 441, 137501. [Google Scholar] [CrossRef]
- EN 196-1:2016; Methods of Testing Cement—Part 1: Determination of Strength. French Association for Standardization: Paris, France, 2016. Available online: https://standards.iteh.ai/catalog/standards/cen/37b8816e-4085-4dcc-a642-a383d9bddd6c/en-196-1-2016 (accessed on 18 June 2024).
- DIN 53019. Available online: https://www.austrian-standards.at/en/shop/din-53019-1-1980-05~p3018442 (accessed on 14 April 2025).
- Cousture, A.; Renault, N.; Gallias, J.-L.; Ndiaye, K. Study of a Binder Based on Alkaline Activated Limestone. Constr. Build. Mater. 2021, 311, 125323. [Google Scholar] [CrossRef]
- Bottcher, M.E.; Gehlken, P.L. Dehydration of Natural Gaylussite (Na2Ca (CO3)(2) Center Dot 5H (2) O) and Pirssonite (Na2Ca (CO3)(2) Center Dot 2H (2) O) as Illustrated by FTIR Spectroscopy. Neues Jahrb. Fur Mineral. Monatshefte 1996, 2, 73–91. [Google Scholar]
- Menéndez, E.; Andrade, C.; Vega, L. Study of Dehydration and Rehydration Processes of Portlandite in Mature and Young Cement Pastes. J. Therm. Anal. Calorim. 2012, 110, 443–450. [Google Scholar] [CrossRef]
- Zucchini, A.; Gavryushkin, P.N.; Golovin, A.V.; Bolotina, N.B.; Stabile, P.; Carroll, M.R.; Comodi, P.; Frondini, F.; Morgavi, D.; Perugini, D.; et al. Crystal Structure of Nyerereite: A Possible Messenger from the Deep Earth. Am. Mineral. 2022, 107, 2054–2064. [Google Scholar] [CrossRef]
- Raman, C.V.; Nedungadi, T.M.K. The α-β Transformation of Quartz. Nature 1940, 145, 147. [Google Scholar] [CrossRef]
- Zheng, S.; Liu, T.; Jiang, G.; Fang, C.; Qu, B.; Gao, P.; Li, L.; Feng, Y. Effects of Water-to-Cement Ratio on Pore Structure Evolution and Strength Development of Cement Slurry Based on HYMOSTRUC3D and Micro-CT. Appl. Sci. 2021, 11, 3063. [Google Scholar] [CrossRef]
- Poiseuille, J.-L.-M. Experimental Investigations Upon the Flow of Liquids in Tubes of Very Small Diameter; Bingham, E.C., Ed.; Lancaster Press Inc.: Lancaster, PA, USA, 1940; Volume 1. [Google Scholar]


| NaOH Molarity (mol/l) | 12.9 | 15.6 | 19.0 | |
|---|---|---|---|---|
| Related products and temperature range (°C) | Thermonatrite (25–140) | 1.8 | 1.1 | 1.3 |
| Pirssonite (140–335) | 0.6 | 3.1 | 1.9 | |
| Portlandite (335–560) | 1.6 | 1.5 | 1.5 | |
| Carbonated phases (560–1100) | 9.1 | 10.5 | 9.5 | |
| Weight loss from curing (%) | 8.2 | 6.7 | 5.5 | |
| Total water (%) | 12.2 | 12.4 | 10.2 | |
| Concentration mol/L | Density (g/cm3) | Porosity (%) |
|---|---|---|
| 12.9 | 1.6 ± 0.2 | 33 ± 1 |
| 15.6 | 1.6 ± 0.1 | 32 ± 2 |
| 19 | 1.8 ± 0.1 | 30 ± 4 |
Disclaimer/Publisher’s Note: The statements, opinions and data contained in all publications are solely those of the individual author(s) and contributor(s) and not of MDPI and/or the editor(s). MDPI and/or the editor(s) disclaim responsibility for any injury to people or property resulting from any ideas, methods, instructions or products referred to in the content. |
© 2025 by the authors. Licensee MDPI, Basel, Switzerland. This article is an open access article distributed under the terms and conditions of the Creative Commons Attribution (CC BY) license (https://creativecommons.org/licenses/by/4.0/).
Share and Cite
Shahid, M.; Pierre, A.; Cousture, A.; Sglavo, V.M. Selective Alkali Activation of Limestone for Additive Manufacturing in Construction: Influence of Alkali Concentration on Physical and Mechanical Properties. Appl. Sci. 2025, 15, 4453. https://doi.org/10.3390/app15084453
Shahid M, Pierre A, Cousture A, Sglavo VM. Selective Alkali Activation of Limestone for Additive Manufacturing in Construction: Influence of Alkali Concentration on Physical and Mechanical Properties. Applied Sciences. 2025; 15(8):4453. https://doi.org/10.3390/app15084453
Chicago/Turabian StyleShahid, Mursaleen, Alexandre Pierre, Annelise Cousture, and Vincenzo M. Sglavo. 2025. "Selective Alkali Activation of Limestone for Additive Manufacturing in Construction: Influence of Alkali Concentration on Physical and Mechanical Properties" Applied Sciences 15, no. 8: 4453. https://doi.org/10.3390/app15084453
APA StyleShahid, M., Pierre, A., Cousture, A., & Sglavo, V. M. (2025). Selective Alkali Activation of Limestone for Additive Manufacturing in Construction: Influence of Alkali Concentration on Physical and Mechanical Properties. Applied Sciences, 15(8), 4453. https://doi.org/10.3390/app15084453