Abstract
The consumption of wild red deer (Cervus elaphus) meat is growing due to its nutritional benefits and sustainability. However, challenges like a shorter shelf life and increased microbial load of game meat highlight the need to investigate effective preservation techniques. This study investigated the effects of high hydrostatic pressure (HHP) on the quality parameters of wild red deer meat, including pH, color characteristics, microbial load, texture attributes, and protein stability, assessed on different days. Wild red deer meat was treated with pressures ranging from 150 to 600 MPa, followed by storage at 4 °C for up to 14 days. Results showed that HHP at or above 300 MPa stabilized pH and suppressed microbial growth. On Day 1, the control samples had a microbial count of 4.67 log CFU/g, while treatments at or above 500 MPa reduced microbial levels to below 1 log CFU/g. Texture analysis revealed improved tenderness at lower pressures (150–300 MPa) and enhanced firmness at higher pressures. Color parameters, including lightness and redness, were also influenced by HHP, as lightness increased with pressure, while redness decreased at higher pressure levels. SDS-PAGE analysis indicated protein denaturation, especially at ≥300 MPa, with significant degradation of sarcoplasmic and myofibrillar proteins at ≥500 MPa. These findings suggest that HHP can be an effective method for improving certain quality parameters and extending the shelf life of wild red deer meat up to 14 days of storage, depending on the pressure level applied.
1. Introduction
The consumption of game meat, including wild red deer (Cervus elaphus), has been gaining significant attention due to its nutritional benefits and potential as a sustainable alternative to traditional livestock meats [1]. Wild deer meat is valued for its rich flavor, high protein, and low fat content, making it an attractive choice for health-conscious consumers [2]. However, wild game meat, including venison, often faces challenges related to its shorter shelf life and increased microbial load compared to farmed meats, primarily due to hunting and handling practices in the wild [3]. This presents significant challenges for maintaining meat quality and extending shelf life, making it essential to explore advanced preservation techniques.
In recent years, growing consumer concerns regarding food safety, combined with a demand for fresh-like quality in minimally processed foods, have driven the food industry to seek innovative preservation methods. Among these, high hydrostatic pressure (HHP) processing is an environmentally friendly and non-thermal method that enhances meat tenderness while simultaneously inhibiting the growth of pathogenic and spoilage bacteria [4]. Numerous studies have demonstrated the effectiveness of HHP as a tenderization technique for various meats, including pork [5], beef [6], and chicken breast [7]. These studies indicate that applying HHP at pressures ranging from 150 to 600 MPa results in significant enhancements in meat tenderness and water-holding capacity [8]. HHP also affects the structural properties of muscle proteins, particularly myofibrillar and sarcoplasmic proteins, which undergo conformational changes due to pressure-induced denaturation. These modifications impact texture, water retention, and overall meat quality, making HHP a critical factor in protein functionality [9]. A key advantage of HHP is its ability to alter non-covalent bonds without significantly impacting the nutritional quality of food products [10]. Consequently, the use of HHP in the food industry presents promising opportunities for improving product quality.
While HHP has been widely studied in other meat products, such as beef [6,11], pork [5,12], and poultry [7,13], its effects on game meats like wild red deer remain largely unexplored. Given the unique composition of deer meat and its sensitivity to spoilage, there is a need to evaluate how HHP affects its key quality attributes. In this study, wild red deer meat samples were subjected to HHP treatment to evaluate its effects on quality parameters, including pH, surface color, microbial load, texture, and protein structure. Additionally, it investigates the shelf-life extension of vacuum-packed wild red deer meat over a 14-day refrigerated storage period at 4 °C. By assessing these factors, this research aims to determine the potential of HHP to enhance the overall quality and shelf life of wild red deer meat, addressing both consumer and industry demands for safer, high-quality meat products.
2. Materials and Methods
2.1. Preparation of Samples
Meat from wild red deer (Cervus elaphus) was obtained from the local processing plant “VADEX” Mezőföldi Zrt. located in Hungary. The deer, hunted in in the western part of the country, included both stags (males) and hinds (females) aged between 4 and 6 years. Fresh meat samples were packed in low-density polyethylene pouches, transported to the laboratory under refrigeration (4 ± 1 °C), and stored for one day. The semimembranosus muscles were dissected from 22 individual deer. Each muscle was cut into 3 steaks of similar size (approximately 14 × 7 × 2.4 cm, weighing 250 ± 5 g), resulting in a total of 66 steaks. The steaks were individually vacuum-packed using a Multivac C200 vacuum-packaging machine (Multi-vac Ltd., Geprüfte Scherhert, AGW, Wolfertschwenden, Germany). The samples were then randomly assigned to the control group and different pressure treatment groups.
The packaging material used was PA/PE 90, which provides optimal protection during storage due to its specific permeability characteristics for moisture vapor, oxygen, carbon dioxide, and nitrogen. The PA/PE 90 packaging material exhibited a water vapor transmission rate of 2.6 g/m2 per day, along with permeability values of 50 cm3/m2 for oxygen, 150 cm3/m2 for carbon dioxide, and 10 cm3/m2 for nitrogen.
2.2. Pressure Treatment
Vacuum-packed samples were subjected to HHP using the Resato FPU-100-2000 HHP equipment (Resato Int. B.V., Roden, The Netherlands). The samples were pressurized at 150, 200, 250, 300, 350, 400, 450, 500, 550, and 600 MPa for 5 min at 22 °C. A total of 11 sample groups, including a non-treated control, were prepared.
Following treatment, all samples were stored at 4 ± 1 °C for 14 days. Quality parameters were evaluated on Days 1 and 14 of storage.
2.3. pH Determination
The pH of the HHP-treated wild red deer meat samples was measured using a one hand digital pH meter (Testo, Model 206-pH2, Alton, UK). The measurements were taken directly from the muscle tissue of the chilled samples at room temperature. Measurements were performed in triplicate for each sample. The pH meter was carefully cleaned between uses, and calibration was checked using standard buffer solutions of pH 4.0 and 7.0 according to the manufacturer’s instructions.
2.4. Instrumental Color Measurement
The surface color of the wild red deer meat samples was assessed using a Chroma Meter CR-400 (Konica Minolta, Tokyo, Japan) equipped with a 4 mm diameter aperture, D65 illuminant, and a 10° standard observer. The device was calibrated with a white reference tile before every measurement session to ensure accuracy. Each sample was measured 20 times. The color parameters recorded included lightness (L*), redness (a*), and yellowness (b*). Additionally, chroma (C*), which represents the intensity or vividness of the color, was determined using Equation (1):
The hue angle (h), which describes the hue of the color [14], was calculated using Equation (2):
2.5. Microbiological Evaluation
For microbial analysis, 10 g of each meat sample was homogenized with 90 mL of 0.1% sterile peptone water. Serial dilutions were prepared by mixing 1 mL of the homogenate with 9 mL of 0.1% peptone water. The aerobic plate count (APC) was assessed using the pour plate method on plate count agar (Laboratorios Conda, Madrid, Spain), following ISO 4833-2:2013 guidelines [15]. Plates were incubated at 30 °C for 48 h, after which colony-forming units were counted and expressed as log CFU/g to quantify microbial load, ensuring consistency with data presentation.
2.6. Instrumental Texture Measurement
Texture analysis of venison samples was conducted using both texture profile analysis (TPA) and the Warner–Bratzler (WB) shear test. For TPA, samples were prepared as 12 mm diameter by 12 mm height cylinders and measured using an SMS TA.XT Plus Texture Analyzer (Stable Micro Systems Ltd., Godalming, UK) with Texture Exponent 32 software 4.0 version. A cylindrical probe with a 35 mm diameter applied compression at speeds of 3.0 mm/s (pre-test phase), 1.0 mm/s (test phase), and 3.0 mm/s (post-test phase). The probe compressed 70% of the sample height, retracted, paused for 2 s, and performed a second compression. Resistance (N) was recorded every 0.01 s and plotted as a force–time curve.
For the WB shear test, wild red deer meat samples were removed from vacuum packaging and sliced into pieces with dimensions of 10 mm thickness, 10 mm width, and 100 mm length. Each sample was placed under the V-blade, and shear force measurements were recorded. The blade moved downward at a speed of 1 mm/s to cut through the sample. The peak shear force (N) was recorded, providing a measure of the meat’s tenderness. Each sample was evaluated 10 times to ensure consistency and reliability of the data.
2.7. Analysis of Sarcoplasmic and Myofibrillar Proteins by Sodium Dodecyl-Sulfate Polyacrylamide Gel Electrophoresis
Sarcoplasmic and myofibrillar proteins were extracted following a modified method based on Csehi et al. [16] and Kretzschmar [17], as described in our previous study [14].
2.7.1. Isolation of Sarcoplasmic and Myofibrillar Proteins
Minced deer meat samples (5 g) were homogenized in 10 mL of 0.05 M NaCl solution using an Ultra-Turrax T25 homogenizer (Ika Werke, Staufen, Germany) at 13,500 rpm for 3.5 min, including one 30 s pause to prevent heating. The suspension was centrifuged at 6000 rpm (Beckman J2-21, Beckman Coulter, Brea, CA, USA) for 20 min at 4 °C. The supernatant, containing sarcoplasmic proteins, was collected and stored at −24 °C. The remaining pellet was washed twice with 0.05 M NaCl, resuspended in 10 mL of 0.7 M NaCl, and homogenized for 1 min. After centrifugation (6000 rpm, 15 min, 4 °C), the myofibrillar protein extract was collected and stored at −24 °C.
2.7.2. SDS-PAGE Analysis
SDS-PAGE was conducted using hand-cast polyacrylamide gels prepared from a 30% acrylamide/bis-acrylamide solution (29:1), with gel dimensions of 830 × 730 × 1.0 mm, using a vertical electrophoresis system (Mini-PROTEAN Tetra System, Bio-Rad, Hercules, CA, USA), following the method of Laemmli [18] with modifications based on previous studies [19,20]. The molecular weight marker (Precision Plus Protein Standards All Blue, Bio-Rad, USA) covered a range of 250–10 kDa.
Protein extracts were diluted with Laemmli sample buffer (2×) containing 2-mercaptoethanol (Bio-Rad, USA). Sarcoplasmic proteins were diluted 20-fold, while myofibrillar proteins were diluted 2-fold before loading. The mixtures were heated at 95 °C for 2 min to denature proteins. A total of 4 μL of each diluted protein solution was loaded into the gel wells, and electrophoresis was performed at a constant voltage of 200 V for 45 min. Gel images were captured using a Bio-Rad Gel Doc XR system and analyzed with ImageLab 6.1 software (Bio-Rad, USA).
2.8. Statistical Analysis
The experimental data were analyzed using two-way analysis of variance (ANOVA) to evaluate the effects of HHP treatment, storage time, and their interaction on the measured quality parameters of wild red deer (Cervus elaphus) meat. For multiple comparisons, Tukey’s honest significant difference test was performed to identify statistically significant differences between treatment groups at a 95% confidence level (p < 0.05). Data were expressed as mean ± standard deviation (SD). Statistical analysis was conducted using IBM SPSS27 (IBM Corp., Armonk, NY, USA).
3. Results and Discussion
3.1. pH
The pH values of wild red deer meat treated with different levels of high hydrostatic pressure (HHP) and stored for 14 days at 4 ± 1 °C are summarized in Table 1.

Table 1.
pH values of wild red deer meat treated with different levels of HHP during storage. (Mean ± SD).
On Day 1, pH values ranged from 5.60 in the control group (0 MPa) to 5.94 at 600 MPa. Samples treated at 300, 350, 400, 450, and 550 MPa exhibited significantly higher pH values than the control (p < 0.05), while the 150, 200, and 250 MPa groups were not significantly different. The highest pH value at 600 MPa was significantly different from all other treatments (p < 0.05). These increases are consistent with previous findings under high-pressure conditions, often attributed to ion redistribution and structural changes in proteins [21,22].
By Day 14, a general decrease in pH was observed in most treatments. The control group exhibited a significant decline from 5.60 to 5.13 (p < 0.05), likely due to lactic acid and other metabolites accumulating during microbial activity, as reported in previous studies on vacuum-packaged meat [14]. Significant pH declines were measured at 150, 200, and 250 MPa between Day 1 and Day 14 (p < 0.05), likely due to continued microbial activity and post-mortem glycolysis leading to acid accumulation. In contrast, significant pH increases were observed at 400, 450, 500, and 550 MPa (p < 0.05), which may be attributed to pressure-induced denaturation of proteins and suppression of acid-generating microbial and enzymatic activity. pH remained stable at 300, 350, and 600 MPa (p > 0.05). The 600 MPa group retained a pH of 5.90 on Day 14, nearly identical to its initial value of 5.94. This stability could be explained by the suppression of microbial activity and enzymatic processes at higher pressure levels, as reported in similar studies on red meat [23].
3.2. Surface Color
The surface color of wild red deer meat was evaluated using the CIE Lab system, where lightness (L*), redness (a*), and yellowness (b*) were measured on Days 1 and 14 of storage. Pressure treatments and storage duration significantly influenced the color parameters across all treatment levels (Table 2).
Table 2.
Instrumental color measurement results of control and HHP-treated samples measured on Days 1 and 14 (Mean ± SD).
On Day 1, the L* values increased progressively with increasing pressure, particularly from 350 MPa onwards, with the highest L* values observed at 450 MPa (Table 2, Figure 1). The a* values showed variable trends: the control had higher a* values compared to samples treated at 150 MPa and pressures of 450 MPa or greater, while samples treated at intermediate pressures (250–400 MPa) showed elevated a* values. Yellowness also increased with pressure, with significant changes observed at 350 MPa and higher, peaking at 600 MPa. Hue angle and chroma values were significantly affected by pressure treatments. Hue angle increased sharply at pressures above 400 MPa, reflecting a shift in the color balance due to protein and pigment alterations. Chroma followed similar trends, with a noticeable increase from 250 MPa, peaking at 600 MPa. These changes suggest that higher pressures induced more pronounced color alterations, likely due to protein denaturation and pigment oxidation [24].
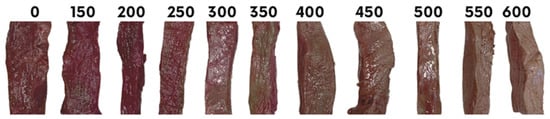
Figure 1.
Visual representation of color changes in wild red deer meat samples control (0 MPa) and treated at different HHP levels (150–600 MPa) on Day 1.
After 14 days of storage, L* values remained significantly elevated for samples treated at pressures of 300 MPa or greater (Table 2). However, a slight decrease in L* was noted for lower-pressure treatments (150–250 MPa) and the control compared to Day 1, although this change was not statistically significant. Redness values significantly decreased over storage, particularly at higher pressures (350 MPa and above). The lowest a* values were observed for 550 MPa and 600 MPa treatments, which may reflect oxidation of myoglobin and other pigments during extended storage, consistent with findings from Chmiel et al. [25], who reported a progressive decline in redness in high-pressure-treated vacuum-packed beef. Similarly, Reesman et al. [26] observed that while moderate pressure levels (300–450 MPa) improved the redness of dark, firm, and dry (DFD) beef, higher pressures (≥600 MPa) led to excessive pale coloration and further reductions in a* values over time. Yellowness (b*) values increased significantly in samples treated at pressures of 350 MPa or higher. This increase, combined with reductions in redness, contributed to shifts in hue angle, which was significantly higher in these samples. Chroma values, indicative of color intensity, were consistently lower for high-pressure treatments after 14 days, suggesting a loss of vividness due to protein aggregation and pigment degradation.
The results highlight the dual influence of HHP treatment and storage duration on the surface color of wild red deer meat. High-pressure treatments above 300 MPa caused significant protein denaturation, pigment oxidation, and aggregation, leading to increased lightness and yellowness but reduced redness and chroma values over time. These changes reflect the structural and chemical modifications induced by HHP on myoglobin and other meat proteins [21,23,24].
The pronounced effects observed at higher pressures (450–600 MPa) could impact consumer perception, as discoloration and reduced redness may affect the visual appeal of meat products [24]. The changes in hue angle and chroma also underscore the importance of optimizing pressure levels to balance preservation and appearance, particularly for fresh meat applications.
3.3. Microbiological Evaluation
The impact of HHP treatments on the aerobic plate count (APC) of vacuum-packed wild red deer meat samples during storage is presented in Figure 2. The microbial counts on Day 1 and Day 14 demonstrate the effectiveness of HHP in reducing microbial loads and its influence on microbial growth during storage at 4 ± 1 °C.
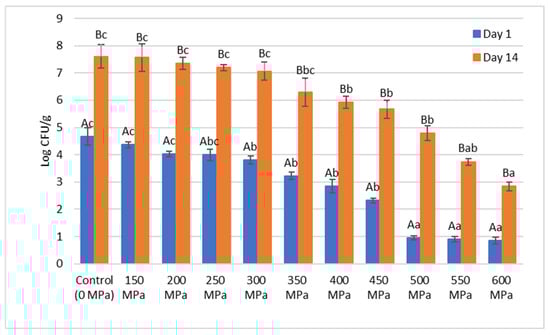
Figure 2.
Means ± standard error for aerobic plate count (log CFU/g) of vacuum-packed wild red deer meat samples subjected to different high hydrostatic pressure (HHP) treatments (150–600 MPa) and control (0 MPa) on Day 1 and Day 14 of storage at 4 ± 1 °C. Means marked with different lowercase letters (a, b, c) indicate significant differences (p < 0.05) among different pressure levels, while means with different uppercase letters (A, B) indicate significant differences (p < 0.05) between storage periods (Day 1 vs. Day 14), based on Tukey’s HSD test.
On Day 1, a significant reduction in microbial counts was observed as the pressure increased, with the control (0 MPa) samples exhibiting the highest microbial load 4.67 log CFU/g. Samples treated at 150 MPa to 250 MPa showed moderate reductions compared to the control, while pressures of 300 MPa and above resulted in a significant decline in microbial counts, achieving levels below 1 log CFU/g at pressures of 500 MPa or higher. This dose-dependent microbial inactivation effect of HHP has been widely documented in the literature [27,28], attributed to the ability of high pressure to disrupt microbial cell membranes, denature cellular proteins, and inhibit enzyme activity. HHP is generally more effective against Gram-negative bacteria (e.g., Pseudomonas spp., Enterobacteriaceae) due to their thinner peptidoglycan layer, whereas Gram-positive bacteria (e.g., Lactobacillus spp., Listeria monocytogenes) exhibit greater resistance to pressure-induced inactivation due to their thicker cell walls [29]. Bacteria typically present in chilled game meat include Pseudomonas spp., Lactobacillus spp., and members of the Enterobacteriaceae family. Among these, Pseudomonas spp. is the primary contributor to meat spoilage, while facultative anaerobic bacteria, particularly Lactobacillus spp., tend to dominate in vacuum-packaged meat [30,31].
By Day 14, microbial counts in all samples increased due to storage-related microbial growth, with the control samples reaching 7.6 log CFU/g. In contrast, HHP-treated samples demonstrated significantly lower microbial growth compared to the control, with higher pressures (500 MPa and above) maintaining microbial counts below 5 log CFU/g. Notably, microbial counts in samples treated at 600 MPa remained at 2.83 log CFU/g, indicating the potential of high-pressure treatments to extend the microbial shelf life of vacuum-packed meat products. Previous studies have shown that pressures above 400 MPa are effective in suppressing microbial growth during chilled storage, as observed in beef [21].
Additionally, microbial counts on Day 14 were consistently significantly higher than those on Day 1 for all pressure levels, reflecting microbial recovery or regrowth during storage. However, the extent of microbial growth was strongly dependent on the applied pressure, with higher pressures effectively limiting growth.
3.4. Texture Analysis
The effects of HHP treatments on the texture properties of wild red deer meat samples were analyzed using Warner–Bratzler (WB) shear force, texture profile analysis (TPA) hardness, cohesiveness, springiness, and chewiness. Results for samples measured on Day 1 and Day 14 are presented in Table 3.
Table 3.
Instrumental texture measurement results of control and HHP-treated samples measured on Days 1 and 14 (Mean ± SD).
Shear force, which reflects the resistance to cutting and is indicative of tenderness, showed significant differences across pressure treatments and storage days. On Day 1, the control samples exhibited a shear force of 40.32 ± 3.89 N, while increasing pressure levels generally led to higher shear forces, peaking at 87.39 ± 6.48 N for 550 MPa. Notably, treatments at 450 MPa and above resulted in significantly higher shear forces compared to the control, indicating increased firmness due to protein denaturation and cross-linking at high pressure levels [32]. By Day 14, the shear force of control samples increased to 82.19 ± 4.98 N, which may reflect limited post-mortem proteolysis and higher connective tissue content typical of wild game meat. Unlike farm animals, where aging often improves tenderness, wild species such as red deer may exhibit reduced tenderization during storage [33]. Interestingly, samples treated with 300 MPa and 450 MPa showed reductions in shear force on Day 14, suggesting that moderate pressures may promote proteolysis during storage, enhancing tenderness.
Hardness, measured through TPA, revealed distinct trends with pressure and storage time. On Day 1, samples treated at low to moderate pressures (150–400 MPa) showed significantly lower hardness values compared to the control (23.90 ± 1.23 N) (p < 0.05), with the lowest mean hardness observed at 350 MPa (4.30 ± 0.34 N). In contrast, samples treated at higher pressures (450–600 MPa) exhibited hardness values comparable to the control, with no statistically significant differences among them. This observation aligns with previous reports [23,34] that HHP can cause either softening or hardening of meat proteins, depending on factors such as temperature, pressure, and processing time. These changes are attributed to protein denaturation, aggregation, or gelation, which alter the structural properties of the meat matrix. By Day 14, higher-pressure treatments (500–600 MPa) demonstrated further increases, indicating that the textural effects of high-pressure treatment persisted over time.
The texture analysis highlights the significant impact of high hydrostatic pressure on the structural and functional properties of wild red deer meat. At moderate pressures (150–300 MPa), the results suggest a balance between protein denaturation and proteolysis, leading to tenderness improvements over storage. In contrast, higher pressures (450–600 MPa) induced greater hardness, chewiness, and cohesiveness due to extensive protein gelation and matrix densification. These findings align with previous studies [23,32,34] indicating that HHP alters meat texture through pressure-induced protein modifications, including partial denaturation, aggregation, and gel formation.
The storage period also influenced texture properties, as proteolytic activity likely contributed to tenderness in some pressure-treated samples, particularly at 250–300 MPa. However, at higher pressures, the structural rigidity imparted by HHP appeared to counteract proteolysis, resulting in firmer textures even after 14 days of storage.
3.5. Protein Profile Analysis Using SDS-PAGE
Figure 3 shows the SDS-PAGE profiles of sarcoplasmic (a) and myofibrillar (b) proteins extracted from vacuum-packed wild red deer meat treated with HHP (150–600 MPa) and a control (0 MPa) on Day 1 and Day 14 of storage at 4 ± 1 °C. The molecular weight standards in Lane 1 provided a reference for identifying key protein bands from 250 kDa to 10 kDa.
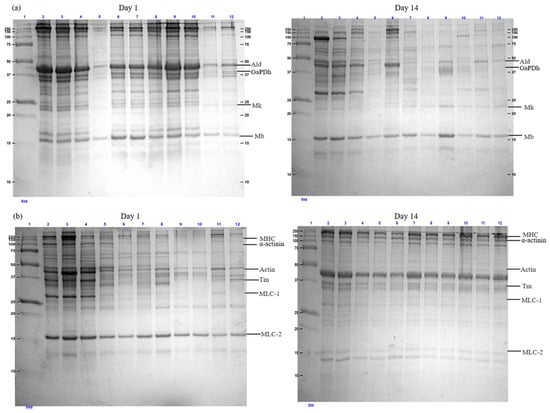
Figure 3.
SDS-PAGE patterns of (a) sarcoplasmic and (b) myofibrillar proteins of vacuum-packed wild red deer meat subjected to HHP treatments (150–600 MPa) and control (0 MPa) on Day 1 and Day 14 of storage at 4 ± 1 °C. (Lane 1: molecular weight standard; Lane 2: control (0 MPa); Lane 3: 150 MPa; Lane 4: 200 MPa; Lane 5: 250 MPa; Lane 6: 300 MPa; Lane 7: 350 MPa; Lane 8: 400 MPa; Lane 9: 450 MPa; Lane 10: 500 MPa; Lane 11: 550 MPa; Lane 12: 600 MPa; Ald = Aldolase; GaPDh = Glyceraldehyde 3-phosphate dehydrogenase; Mk = Myokinase; Mb = Myoglobin; Tm = Tropomyosin; MHC = Myosin heavy chain; MLC = Myosin light chain).
Proteins in meat, including sarcoplasmic and myofibrillar proteins, undergo significant changes during high-pressure treatment, primarily due to aggregation and denaturation [16,35]. Sarcoplasmic proteins, which are water-soluble, include enzymes from the glycolytic pathway and myoglobin, a key pigment responsible for meat color [16]. Myoglobin is one of the most critical sarcoplasmic proteins, making its analysis essential for understanding color changes in meat. On Day 1, sarcoplasmic protein profiles remained relatively consistent across treatments up to 500 MPa, with no major visual differences in band intensity observed between the control, 150 MPa, 450 MPa, and 500 MPa samples. Noticeable reductions in band intensity were more apparent at 550 and 600 MPa. High-pressure treatment induces conformational changes in myoglobin, such as denaturation of the globin component or oxidation of ferrous ions, which can result in meat discoloration [23,35,36]. As Bekhit et al. [37] reported, this discoloration is closely linked to spontaneous structural changes in myoglobin.
Interestingly, the sample treated at 250 MPa (Lane 5) on Day 1 and Day 14 exhibited an unexpectedly strong reduction in band intensity similar to the 600 MPa treatment (Lane 12). This non-linear behavior suggests that 250 MPa may represent a transitional pressure level where both pressure-induced tenderization and early stages of protein denaturation coexist. Although considered a moderate pressure, 250 MPa may still be sufficient to disrupt the solubility of heat- or pressure-sensitive sarcoplasmic proteins. This non-linear behavior highlights the complexity of protein responses under varying pressure conditions, where unfolding and solubility loss may not correlate directly with pressure intensity.
Day 14, the degradation of sarcoplasmic proteins was more pronounced across all treatments. The control sample (Lane 2) still retained identifiable bands, but higher-pressure treatments (500–600 MPa; Lanes 10–12) exhibited marked reductions in band intensity, with the near disappearance of lower-molecular-weight proteins.
The SDS-PAGE analysis of myofibrillar proteins in Figure 3b also demonstrated significant changes due to HHP and storage duration. The majority of myofibrillar proteins consist of myosin, which is composed of two heavy chains and three light chains. As shown in Figure 3b, the intensity of the MLC-1 band decreased at higher pressures, suggesting potential denaturation or reduced solubility as a result of high-pressure treatment. In contrast, MLC-2 remained detectable even after exposure to 600 MPa. At lower pressures (150 and 200 MPa), the intensity of myofibrillar proteins, as observed in the SDS-PAGE analysis, was comparable to that of the control. However, at pressures of 250 MPa or higher, a noticeable reduction in protein intensity was observed. This decline in intensity is attributed to protein aggregation caused by the high-pressure treatment.
4. Conclusions
HHP treatments, particularly at pressures ≥300 MPa, effectively stabilized pH during 14 days of storage, likely due to suppressed microbial and enzymatic activity. While these pressures enhanced microbial safety and extended shelf life by significantly reducing aerobic plate counts, pressures ≥ 500 MPa were most effective, achieving microbial counts below 1 log CFU/g on Day 1 and maintaining them at safe levels during storage. Treatments ≥ 300 MPa increased lightness and yellowness while reducing redness and chroma, reflecting protein denaturation and pigment oxidation. Textural analysis revealed that moderate pressures (150–300 MPa) improved tenderness by balancing proteolysis and denaturation, whereas higher pressures (450–600 MPa) caused greater firmness due to protein aggregation and gelation. SDS-PAGE analysis confirmed significant denaturation and aggregation of sarcoplasmic and myofibrillar proteins at pressures ≥300 MPa, with more pronounced degradation at pressures ≥ 500 MPa.
Based on these findings, 300 MPa appears to be an optimal pressure level for improving tenderness, microbial safety, and shelf life, while limiting the extent of protein denaturation observed by SDS-PAGE. For maximum microbial reduction and extended shelf life, 500 MPa could be applied. Further research should explore preservation techniques, such as sous vide processing, to optimize quality and shelf-life extension of game meat.
Author Contributions
Conceptualization, M.E. (Munkhnasan Enkhbold) and A.V.-T.; methodology, A.L.; software, K.I.H.; validation, A.L., L.F. and K.I.H.; formal analysis, M.E. (Munkhnasan Enkhbold); investigation, M.E. (Munkhnasan Enkhbold), M.E. (Majd Elayan) and A.B.; resources, A.V.-T.; data curation, M.E. (Munkhnasan Enkhbold); writing—original draft preparation, M.E. (Munkhnasan Enkhbold); writing—review and editing, A.V-T.; visualization, M.E. (Munkhnasan Enkhbold); supervision, A.V.-T.; project administration, K.I.H.; funding acquisition, L.F. All authors have read and agreed to the published version of the manuscript.
Funding
This research received no external funding.
Institutional Review Board Statement
Not applicable.
Informed Consent Statement
Not applicable.
Data Availability Statement
The raw data supporting the conclusions of this article will be made available by the authors on request.
Acknowledgments
This research was supported by the Doctoral School of Food Science and the Institute of Food Science and Technology, Hungarian University of Agriculture and Life Sciences. We sincerely appreciate their support.
Conflicts of Interest
The authors declare no conflicts of interest.
References
- Milczarek, A.; Janocha, A.; Niedziałek, G.; Zowczak-Romanowicz, M.; Horoszewicz, E.; Piotrowski, S. Health-Promoting Properties of the Wild-Harvested Meat of Roe Deer (Capreolus capreolus L.) and Red Deer (Cervus elaphus L.). Animals 2021, 11, 2108. [Google Scholar] [CrossRef] [PubMed]
- Lorenzo, J.M.; Maggiolino, A.; Gallego, L.; Pateiro, M.; Serrano, M.P.; Domínguez, R.; García, A.; Landete-Castillejos, T.; De Palo, P. Effect of Age on Nutritional Properties of Iberian Wild Red Deer Meat. J. Sci. Food Agric. 2019, 99, 1561–1567. [Google Scholar] [CrossRef] [PubMed]
- Kudrnáčová, E.; Bartoň, L.; Bureš, D.; Hoffman, L.C. Carcass and Meat Characteristics from Farm-Raised and Wild Fallow Deer (Dama Dama) and Red Deer (Cervus Elaphus): A Review. Meat Sci. 2018, 141, 9–27. [Google Scholar] [CrossRef]
- de Oliveira, F.A.; Neto, O.C.; dos Santos, L.M.R.; Ferreira, E.H.R.; Rosenthal, A. Effect of High Pressure on Fish Meat Quality–A Review. Trends Food Sci. Technol. 2017, 66, 1–19. [Google Scholar] [CrossRef]
- Bak, K.H.; Lindahl, G.; Karlsson, A.H.; Orlien, V. Effect of High Pressure, Temperature, and Storage on the Color of Porcine Longissimus Dorsi. Meat Sci. 2012, 92, 374–381. [Google Scholar] [CrossRef]
- Morton, J.D.; Pearson, R.G.; Lee, H.Y.-Y.; Smithson, S.; Mason, S.L.; Bickerstaffe, R. High Pressure Processing Improves the Tenderness and Quality of Hot-Boned Beef. Meat Sci. 2017, 133, 69–74. [Google Scholar] [CrossRef]
- Omana, D.A.; Plastow, G.; Betti, M. The Use of β-Glucan as a Partial Salt Replacer in High Pressure Processed Chicken Breast Meat. Food Chem. 2011, 129, 768–776. [Google Scholar] [CrossRef]
- Yang, H.; Khan, M.A.; Yu, X.; Zheng, H.; Han, M.; Xu, X.; Zhou, G. Changes in Protein Structures to Improve the Rheology and Texture of Reduced-Fat Sausages Using High Pressure Processing. Meat Sci. 2016, 121, 79–87. [Google Scholar] [CrossRef]
- Sikes, A.L.; Warner, R. Application of High Hydrostatic Pressure for Meat Tenderization. In Innovative Food Processing Technologies; Elsevier: Amsterdam, The Netherlands, 2016; pp. 259–290. [Google Scholar]
- Marcos, B.; Aymerich, T.; Garriga, M.; Arnau, J. Active Packaging Containing Nisin and High Pressure Processing as Post-Processing Listericidal Treatments for Convenience Fermented Sausages. Food Control 2013, 30, 325–330. [Google Scholar] [CrossRef]
- Han, G.; Chen, Q.; Xia, X.; Liu, Q.; Kong, B.; Wang, H. High Hydrostatic Pressure Combined with Moisture Regulators Improves the Tenderness and Quality of Beef Jerky. Meat Sci. 2021, 181, 108617. [Google Scholar] [CrossRef]
- Duma-Kocan, P.; Rudy, M.; Gil, M.; Żurek, J.; Stanisławczyk, R.; Krajewska, A.; Dziki, D. The Influence of High Hydrostatic Pressure on Selected Quality Features of Cold-Storage Pork Semimembranosus Muscle. Foods 2024, 13, 2089. [Google Scholar] [CrossRef] [PubMed]
- Ros-Polski, V.; Koutchma, T.; Xue, J.; Defelice, C.; Balamurugan, S. Effects of High Hydrostatic Pressure Processing Parameters and NaCl Concentration on the Physical Properties, Texture and Quality of White Chicken Meat. Innov. Food Sci. Emerg. Technol. 2015, 30, 31–42. [Google Scholar] [CrossRef]
- Enkhbold, M.; Lőrincz, A.; Elayan, M.; Friedrich, L.; Barkó, A.; Csurka, T.; Boros, A.; Hitka, G.; Varga-Tóth, A. Effects of Lactic Acid and Ascorbic Acid Mixture on Quality Properties of Wild Red Deer (Cervus Elaphus) Meat. Appl. Sci. 2024, 14, 8915. [Google Scholar] [CrossRef]
- ISO 4833-2:2013; Microbiology of the Food Chain—Horizontal Method for the Enumeration of Microorganisms—Part 2: Colony Count at 30 °C by the Pour Plate Technique. International Organization for Standardization (ISO): Geneva, Switzerland, 2013.
- Csehi, B.; Szerdahelyi, E.; Pásztor-Huszár, K.; Salamon, B.; Tóth, A.; Zeke, I.; Jónás, G.; Friedrich, L. Changes of Protein Profiles in Pork and Beef Meat Caused by High Hydrostatic Pressure Treatment. Acta Aliment. 2016, 45, 565–571. [Google Scholar] [CrossRef]
- Kretzschmar, U. Funktionelle Eigenschaften von Sarcoplasmaproteinen. II: Emulgiereigenschaften. Fleischwirtschaft 1995, 75, 1354–1357. [Google Scholar]
- Laemmli, U.K. Cleavage of Structural Proteins during the Assembly of the Head of Bacteriophage T4. Nature 1970, 227, 680–685. [Google Scholar] [CrossRef]
- Darnay, L.; Barkó, A.; Hidas, K.; Pataki, F.A.; Miklós, G.; Surányi, J.; Laczay, P. Comparison of Quality Properties of Powder Milk-based Camel Cheese Depending on Calf Rennet Concentration and Microbial Transglutaminase. Int. J. Dairy Technol. 2024, 77, 532–539. [Google Scholar] [CrossRef]
- Darnay, L.; Tóth, A.; Csehi, B.; Szepessy, A.; Horváth, M.; Pásztor-Huszár, K.; Laczay, P. The Effect of Microbial Transglutaminase on the Viscosity and Protein Network of Kefir Made from Cow, Goat, or Donkey Milk. Fermentation 2021, 7, 214. [Google Scholar] [CrossRef]
- McArdle, R.A.; Marcos, B.; Kerry, J.P.; Mullen, A.M. Influence of HPP Conditions on Selected Beef Quality Attributes and Their Stability during Chilled Storage. Meat Sci. 2011, 87, 274–281. [Google Scholar] [CrossRef]
- Szerman, N.; Barrio, Y.; Schroeder, B.; Martinez, P.; Sancho, A.M.; Sanow, C.; Vaudagna, S.R. Effect of High Hydrostatic Pressure Treatments on Physicochemical Properties, Microbial Quality and Sensory Attributes of Beef Carpaccio. Procedia Food Sci. 2011, 1, 854–861. [Google Scholar] [CrossRef]
- Şayin Sert, T.; Coşkun, F. The Effects of High-Pressure Processing on PH, Thiobarbituric Acid Value, Color and Texture Properties of Frozen and Unfrozen Beef Mince. Molecules 2022, 27, 3974. [Google Scholar] [CrossRef] [PubMed]
- Jung, S.; Ghoul, M.; de Lamballerie-Anton, M. Influence of High Pressure on the Color and Microbial Quality of Beef Meat. LWT-Food Sci. Technol. 2003, 36, 625–631. [Google Scholar] [CrossRef]
- Chmiel, M.; Świder, O.; Roszko, M.; Adamczak, L.; Cegiełka, A.; Pietrzak, D.; Florowski, T.; Bryła, M.; Florowska, A. Effect of High-Pressure Processing and Long-Time Storage on Color, Lipid Oxidation, and Free Amino Acids Profile of Beef. Appl. Sci. 2025, 15, 2382. [Google Scholar] [CrossRef]
- Reesman, C.; Sullivan, G.; Danao, M.-G.; Pfeiffer, M.; More, S.; Mafi, G.; Ramanathan, R.; Mafi, G.G. Use of High-Pressure Processing to Improve the Redness of Dark-Cutting Beef. Meat Muscle Biol. 2023, 7, 15716. [Google Scholar] [CrossRef]
- Martínez Bernié, I.; Mussio, P.; Jorcin, S.; Rajchman, M.; López-Pedemonte, T. Application of High Hydrostatic Pressure for the Reduction of STEC on Raw Ground Beef Patties and Its Impact on Physicochemical Properties: PH and Color. LWT 2021, 151, 112126. [Google Scholar] [CrossRef]
- Garriga, M.; Grebol, N.; Aymerich, M.T.; Monfort, J.M.; Hugas, M. Microbial Inactivation after High-Pressure Processing at 600 MPa in Commercial Meat Products over Its Shelf Life. Innov. Food Sci. Emerg. Technol. 2004, 5, 451–457. [Google Scholar] [CrossRef]
- Wei, P.-C.; Lee, Y.-C.; Kang, C.; Tsai, Y.-H.; Arakawa, O. High-Hydrostatic Pressure on Escolar Meats: Impact on the Microbial, Chemical, and Organoleptic Qualities and Bacterial Community by Using High-Throughput Sequencing. LWT 2025, 215, 117196. [Google Scholar] [CrossRef]
- Kunová, S.; Sendra, E.; Haščík, P.; Vuković, N.L.; Vukić, M.D.; Hsouna, A.B.; Mnif, W.; Kačániová, M. Microbiological Quality of Deer Meat Treated with Essential Oil Litsea Cubeba. Animals 2022, 12, 2315. [Google Scholar] [CrossRef]
- Doulgeraki, A.I.; Ercolini, D.; Villani, F.; Nychas, G.-J.E. Spoilage Microbiota Associated to the Storage of Raw Meat in Different Conditions. Int. J. Food Microbiol. 2012, 157, 130–141. [Google Scholar] [CrossRef]
- Macfarlane, J.J.; McKenzie, I.J.; Turner, R.H.; Jones, P.N. Pressure Treatment of Meat: Effects on Thermal Transitions and Shear Values. Meat Sci. 1981, 5, 307–317. [Google Scholar] [CrossRef]
- Hoffman, L.C.; Wiklund, E. Game and Venison–Meat for the Modern Consumer. Meat Sci. 2006, 74, 197–208. [Google Scholar] [CrossRef] [PubMed]
- Sun, X.D.; Holley, R.A. High Hydrostatic Pressure Effects on the Texture of Meat and Meat Products. J. Food Sci. 2010, 75, R17–R23. [Google Scholar] [CrossRef] [PubMed]
- Marcos, B.; Kerry, J.P.; Mullen, A.M. High Pressure Induced Changes on Sarcoplasmic Protein Fraction and Quality Indicators. Meat Sci. 2010, 85, 115–120. [Google Scholar] [CrossRef] [PubMed]
- Majzinger, K.; Kovács-Bányász, B.; Horváth-Mezőfi, Z.; Pósa, E.; Csehi, B.; Hitka, G.; Alpár, B.; Nyulas-Zeke, I.C. The Effects of High Hydrostatic Pressure Treatment on the Quality Characteristics and the Protein Structure of Vacuum-Packed Fresh Pork and Wild Boar Meats. Appl. Sci. 2025, 15, 1766. [Google Scholar] [CrossRef]
- Bekhit, A.E.-D.A.; Geesink, G.H.; Ilian, M.A.; Morton, J.D.; Sedcole, R.; Bickerstaffe, R. Particulate Metmyoglobin Reducing Activity and Its Relationship with Meat Color. J. Agric. Food Chem. 2003, 51, 6026–6035. [Google Scholar] [CrossRef]
Disclaimer/Publisher’s Note: The statements, opinions and data contained in all publications are solely those of the individual author(s) and contributor(s) and not of MDPI and/or the editor(s). MDPI and/or the editor(s) disclaim responsibility for any injury to people or property resulting from any ideas, methods, instructions or products referred to in the content. |
© 2025 by the authors. Licensee MDPI, Basel, Switzerland. This article is an open access article distributed under the terms and conditions of the Creative Commons Attribution (CC BY) license (https://creativecommons.org/licenses/by/4.0/).