Article

Modeling and Performance Analysis of Task Offloading of Heterogeneous Mobile Edge Computing Networks

by
Wenwang Li
and
Haohao Zhou
*
Science and Technology on Information Systems Engineering Laboratory, National University of Defense Technology, Changsha 410073, China
*
Author to whom correspondence should be addressed.
Appl. Sci. 2025, 15(8), 4307; https://doi.org/10.3390/app15084307
Submission received: 5 March 2025 / Revised: 7 April 2025 / Accepted: 10 April 2025 / Published: 14 April 2025

Abstract

:
Mobile edge computing architecture (MEC) can provide users with low latency services by integrating computing, storage and processing capabilities near users and data sources. As such, there has been intense interest in this topic, especially in single-server and homogeneous multi-server scenarios. The impact of network heterogeneity and load fluctuations is ignored, and the performance evaluation system relies too much on statistical mean indicators, ignoring the impact of real-time indicators. In this paper, we propose a new heterogeneous edge computing network architecture composed of multi-core servers with varying transmission power, computing capabilities and waiting queue length. Since it is necessary to evaluate and analyze the service performance of MEC to guarantee Quality of Service (QoS), we design some indicators by solving the probability distribution function of response time, such as average task offloading delay, immediate service probability and blocking probability. By analyzing the impact of bias factors and network parameters associated with MEC servers on network performance, we provide insights for MEC design, deployment and optimization.

1. Introduction

With continuous progress in the Internet of Things and mobile wireless communication technology, the number of intelligent devices and data they generate is growing rapidly [1]. The rapid iteration and updating of Internet information technology have led to the emergence of new services in smart cities, intelligent manufacturing, intelligent healthcare, and intelligent transportation. However, terminal devices are limited in computing power and cannot support computation-intensive tasks. Many researchers have applied cloud computing (CC) to overcome this challenge. In cloud computing, remote cloud centers provide abundant computing resources to support IoT applications. Users transfer computation-intensive tasks to the cloud for processing and receive the results. However, cloud centers are usually far away from users, and extensive data transmission causes significant latency [2]. For tasks that are sensitive to delay, like real-time monitoring and traffic dispatching, such large task delays are unbearable. Furthermore, massive data transmission can cause network congestion, burdening the core network [3]. In order to solve these problems, edge computing (EC) emerged. By integrating computing, storage, and processing capabilities near users and data sources, edge computing can provide lower network latency, better Quality of Service (QoS), and flexible adaptation to various application scenarios.
Task offloading is a core technology of mobile edge computing, which focuses on reducing service delay and device energy consumption by processing computing-intensive tasks on network edge servers. Task offloading strategies play a crucial role in determining which tasks should be offloaded to the edge server for execution, as well as how to select the appropriate edge server. The decision-making process for task offloading can be influenced by various factors, including the type of task, network status, and the load of edge servers.
Traditional theoretical performance analysis methods primarily rely on deterministic models to represent the spatial distribution of nodes. The performance analysis process often depends on Monte Carlo simulation or overly idealized assumptions [4,5]. However, due to the heterogeneity and randomness of node distribution in MEC networks, traditional modeling methods are excessively idealized. Therefore, there is an urgent need for new modeling approaches that can accurately capture the randomness of MEC network topology for precise performance analysis. Stochastic geometric models have been introduced into wireless mobile networks, where researchers model the distribution of base stations and users as a homogeneous Poisson point process (PPP). This approach has been used to validate the accuracy of performance analysis based on stochastic geometric models [6]. To address the issue of heterogeneity, research has further extended these results to multi-layer heterogeneous networks in the literature [7,8].
In the field of performance analysis, queuing theory plays an important role [9,10]. It is a mathematical theory and method that studies the phenomenon of the random aggregation and dispersion of systems, as well as the working process of random service systems, also known as the theory of random service systems. Queuing theory provides a theoretical framework for edge computing to analyze and optimize resource allocation, task scheduling, system performance, and other aspects. Through the queuing model, we can gain a better understanding and design the edge computing architecture to meet real-time efficiency, reliability, and other requirements.
The main contributions of this paper can be summarized as follows:
(1)
We develop a new heterogeneous edge computing network architecture, which is composed of MEC Servers with different transmission power, computing capabilities, number of CPU cores, and waiting queue length.
(2)
We characterize the spatial distribution of MEC servers and users by employing stochastic geometry, and we derive the delay distribution via queuing theory uncertainties.
(3)
Leveraging average task offloading delay, immediate service probability and blocking probability, we evaluate network performance.
(4)
We elucidate the impacts of network parameters and bias factors on network performance.

2. Related Work

As a core technology in the field of edge computing, the technology of computing offloading has attracted widespread attention. Recent research has made significant contributions in this field. A lightweight and efficient offloading method based on genetic algorithms was proposed for single server scenarios, achieving minimum average computation delay for tasks [11]. Researchers proposed a task offloading and power allocation optimization algorithm to minimize task completion time under energy constraints on mobile devices [12]. A fast offloading algorithm based on policy gradient was proposed for queuing tasks with a single terminal and a single edge server [13]. Researchers proposed a resource allocation algorithm based on the Deep Deterministic Policy Gradient for task offloading and resource optimization [14]. The algorithm can quickly find the optimal decision and maximize long-term benefits. Recently, in order to study joint resource allocation and task offloading in an ultra-dense edge computing network, a heuristic task offloading scheme based on binary mixed gray wolf optimization was proposed [15]. A Joint Optimization method based on the Discrete Binary Particle Swarm Optimization Algorithm for system load was proposed for single mobile device to one mobile edge server scenarios, effectively reducing delay and energy consumption [16].
Most current research on task offloading focuses on offloading decisions and resource allocation, primarily addressing implementation details of the offloading process. This often overlooks the huge burden of heterogeneity and environmental configuration on the network, lacking detailed performance analysis of the offloading process. In the mobile edge computing (MEC) system, real-time indicators are very important, such as immediate service probability is related to the timeliness of task processing, and blocking probability reflects the probability of a task being discarded. At present, the performance analysis of the offloading process mainly focuses on the average number of requests, average delay, average energy consumption and other average indicators [17,18,19,20], ignoring the impact of real-time indicators such as immediate service probability and blocking probability. The mean number of requests and mean response time were used for analyzing the performance of multi-access edge computing networks [21]. Researchers used average delay and average energy consumption to performance evaluation on the mobile edge computing [22]. Average delay was used for performance research in a two-tier edge structure [23].
There has been intense interest in MEC, especially in single-server scenarios [24,25,26,27,28], and, to a lesser extent, in homogeneous multi-server scenarios [29,30,31,32,33]. In contrast, only a few studies have been conducted to investigate the heterogeneous servers scenarios. In the future, MEC will be applied not only to access points (APs) and base stations (BSs) but also to mobile devices and all computing devices around us. Thus, it is necessary to study how to design a network with various types of MEC servers and analyze network performance. In cases where APs have different resources (such as transmission power), the Heterogeneous Networks have been studied, focusing on communication performance rather than computational performance [34,35]. Most works apply random geometry to spatial models of distributed users and APs using Poisson point processes (PPP) [36]. For example, uplink network modeling and coverage analysis [37], downlink network modeling and coverage analysis [38], and decoupling of the uplink and downlink [39]. Recently, random geometry has also been applied to performance analysis of randomly distributed MEC servers [40], but delay distribution and heterogeneous MEC servers are not considered in the design of Heterogeneous Mobile Edge Computing Networks (HetMECNets). Compared to existing models that mainly focus on single-server or homogeneous multi-server scenarios, our model is designed specifically for heterogeneous server environments. For example, most prior studies overlook the impact of different transmission power, computing capabilities, number of CPU cores, and waiting queue lengths among MEC servers on network performance. Our model comprehensively considers these factors, enabling a more accurate and detailed analysis of task offloading in complex MEC networks.
Task offloading efficiency is critical to edge computing service quality, as it directly impacts system responsiveness and resource utilization, so it is of great significance to model and evaluate the task offloading process. MEC task offloading performance has been the subject of extensive research. Studies in this area have primarily focused on delay analysis [41,42,43] and energy consumption analysis [33,44,45], with heuristic and machine learning algorithms proposed for optimizing these metrics. Moreover, while average performance metrics receive considerable attention, there is a lack of focus on real-time indicators, such as immediate service probability and blocking probability. Immediate service probability measures the probability that users can have their needs met without waiting, while blocking probability refers to the probability that the number of user tasks exceeds the edge server’s capacity, which reflects the probability of the task being discarded. We conduct research on task offloading performance evaluation under heterogeneous edge computing network architecture. Utilizing random geometry and queuing theory, we develop models to analyze key metrics, including average task offloading delay, immediate service probability, and blocking probability. This comprehensive approach enables a detailed assessment of system performance and contributes to the development of more efficient and stable MEC systems.
Table 1 summarizes the research scenarios and evaluation metrics of the cited literature.

3. MEC Network Model

In this section, we first introduce the system model of a HetMECNet. We characterize the spatial distribution of MEC servers and user devices by employing stochastic geometry. For a comprehensive evaluation of the system’s performance, we apply queuing theory to model the task offloading process. A summary of the key notations used throughout this paper are summarized in Table 2.

3.1. Network Model

We consider a Heterogeneous Mobile Edge Computing Network, composed of N m tiers of MEC servers, deployed at small-cell access points (APs). An example of the network is given in Figure 1. We use k = {1, 2,…, N m } as the index set of N m tiers of MEC servers. MEC servers in different tiers have different transmission power, computing capabilities, number of CPU cores, and waiting queue length. The spatial locations of users and MEC servers are modeled as homogeneous Poisson point processes (PPP) with spatial density λ u and λ m , respectively. The spatial locations of the kth-tier MEC servers are also modeled as homogeneous PPP with spatial density λ m , k = p m , k λ m , where p m , k is the portion of the kth-tier MEC servers. The number of CPU cores and waiting queue length in kth-tier MEC servers are c k and r k , respectively. In order to facilitate tracking and focusing on the core aspects of heterogeneous MEC network performance, we assume in this study that the waiting queues of MEC servers at different tiers are independent.
In order to process the computation task, the user transmits the computation request message to the MEC server (i.e., uplink transmission) and receives the computation resulting data (i.e., downlink transmission). We assume each transmission occurs in a time slot T s for simplicity. Users select the MEC server to process computation tasks based on association rules, which is based on the maximum biased received power. The probability that a user offloads to the kth-tier MEC server is indicated by p o , k , according to [52]:
p o , k = 2 π λ m , k 0 x exp π x 2 j ϵ K λ m , j P m , j B j P m , k B k 2 α d x
where B k is the bias factor of the user offloading to the kth-tier MEC server, P m , k is the transmission power of the kth-tier MEC server, and α is the path loss exponent.

3.2. Queuing Model

As the user location is modeled as a homogeneous PPP, computation tasks arrive at the server according to a Poisson process, with service order following the First Come First Served (FCFS) rule. The arrival rate of user tasks to the kth-tier MEC server is determined as
v k = λ u p o , k λ m , k
where λ u and λ m , k are spatial density of users and the kth-tier MEC server, respectively. p m , k kth-tier MEC server is the portion of the kth-tier MEC servers.
MEC servers of different tiers have different computing capacities. Assuming that each MEC server in the kth-tier is equipped with a c k -core CPU, the c k CPUs in the same tier have equal computing capacity. Service time on each core in a kth-tier MEC server follows an exponential distribution with a mean value 1/ c k , where u k is the service rate of a kth-tier MEC server. Since the service rate follows an exponential distribution, the probability density function (pdf) of T s v , k is determined as
f T s v , k t = u k exp u k t
Considering multi-core servers and finite waiting queue length, the user queuing model associated with a kth-tier MEC server can be modeled as an M/M/ c k / c k + r k queuing model. The utilization factor of ρ k is given by
ρ k = v k c k u k
If a task arrives to a full queue, it leaves; otherwise, it enters the queue and waits. It has been proven that when ρ k < 1, the system can reach a stationary state, so we only consider the case of ρ k < 1, which can be modeled as a birth-and-death process.
The M/M/ c k / c k + r k queuing model is established as a birth-and-death process, and its transient state flow is shown in Figure 2.
Due to the limited length of the waiting queue, when the waiting queue is full, the arrival rate of user tasks to the kth-tier MEC server (birth rate) is 0, otherwise, it is v k . The service rate (death rate) of the kth-tier MEC server depends on the number of tasks in the system. If the number of tasks in the system is greater than or equal to c k , then all CPU cores are busy. Since the service rate of each CPU core of the kth-tier MEC server is u k , the total service rate of the system is c k u k . According to Figure 2, the transition probability between system states can be obtained as follows:
v i = v k , i c k + r k 0 , i > c k + r k u i = i u k , i c k c k u k , i > c k
By solving the Markovian stationary equation, we can obtain Steady-state probability in Equations (6) and (7).
π k , 0 = n = 0 c k 1 c k ρ k n n ! + 1 ρ k r k + 1 c k ρ k c k 1 ρ k c k ! 1
π k , n = c k ρ k n n ! π k , 0 , 0 n < c k c k ρ k n c k n c k c k ! π k , 0 , c k n c k + r k
where π k , n is steady state probability that there are n tasks in the kth-tier MEC server. π k , 0 represents the probability that all edge servers are idle and there are no tasks in the kth-tier MEC server.
Assuming q k , n is the probability that there are n tasks when the task reaches the kth layer MEC server, it can be calculated by Bayes’ theorem in Equation (8).
q k , n = lim Δ t 0 v k Δ t + o Δ t π k , n n = 0 c k + r k 1 v k Δ t + o Δ t π k , n = lim Δ t 0 v k + o Δ t / Δ t π k , n n = 0 c k + r k 1 v k + o Δ t / Δ t π k , n = v k π k , n v k n = 0 c k + r k 1 π k , n = π k , n 1 π c k + r k
When the CPU core of the kth-tier MEC server is not fully occupied, tasks are processed immediately upon arrival with a waiting time of 0. The probability distribution is given by Equation (9)
F T w , k 0 = q k , 0 + q k , 1 + q k , 2 + + q k , c k 1 = n = 0 c k 1 π k , n 1 π c k + r k
If there are already x requests queued up when the task arrives, the task must wait for the completion of the previous x + 1 tasks. The departure flow of the c k CPU cores follows an exponential distribution with parameter c k u k . Therefore, the waiting time for the task is the sum of the time for x + 1 tasks to complete, which follows the Erlang distribution.
F T w , k t = F T w , k 0 + n = c k c k + r k 1 q k , n 0 t c k u k c k u k x n c k n c k ! e c k u k x d x
By substituting Equation (9) into Equation (10), we can obtain the cumulative distribution function (cdf) of the waiting delay, which is given by Equation (11).
F T w , k t = 0 , t 0 n = 0 c k 1 π k , n 1 π c k + r k + n = c k c k + r k 1 q k , n 0 t c k u k c k u k x n c k n c k ! e c k u k x d x , t > 0
The probability distribution function of the waiting delay can be obtained from the cdf of waiting delay with respect to t, which is given in Equation (12). And δ ( t ) is the impulse function.
f T w , k t = 0 , t 0 n = 0 c k 1 π k , n 1 π c k + r k δ t + n = c k c k + r k 1 q k , n c k u k c k u k t n c k n c k ! e c k u k t , t > 0

4. Performance Analysis

4.1. Average Latency

The total delay of task offloading includes the queuing delay, the service time at the MEC server, and transmission delay. The queuing delay is from task arrival to the start of processing. The transmission delay includes uplink and downlink. Therefore, we can obtain the total delay using Equation (13).
T t o t a l = T w , k + T s v , k + 2 T s
where T w , k is the waiting time at the MEC server, T s v , k is the service time of the MEC server, and T s is the link transmission time.
Assuming that the transmission process of the user sending requests and receiving results is always successful, the total average delay of users can be represented as
E T t o t a l = k ϵ K p o , k E T w , k + T s v , k + 2 T s
where E T w , k + T s v , k is an average of the sum of waiting time and service time. The expectation of waiting time can be obtained from the probability distribution function of the waiting delay, which is given in Equation (15).
E T w , k = 0 t f T w , k t d t = 0 t n = c k c k + r k 1 q k , n c k u k c k u k t n c k n c k ! e c k u k t d t
Service time follows an exponential distribution with a mean value 1/ u k ; therefore, the expectation of service time can be given in Equation (16).
E T s v , k = 1 u k
Finally, we can obtain the total delay of task offloading E ( T t o t a l ) in Equation (17)
E T t o t a l = k ϵ K p o , k 0 t n = c k c k + r k 1 q k , n c k u k c k u k t n c k n c k ! e c k u k t d t + 1 u k + 2 T s

4.2. The Immediate Service Probability

If the CPU cores of the kth-tier MEC server are not all busy when the task arrives, the task can be immediately served without waiting; that is, the total number of tasks in the kth-tier MEC is less than c k . The probability of immediate service for tasks in the kth-tier MEC server is obtained from the Total Probability Theorem, which is given in Equation (18).
P r , k = n = 0 c k 1 π k , n = n = 0 c k 1 c k ρ k n n ! π k , 0
Therefore, the probability of immediate service for users P r is given as follows:
P r = k ϵ K p o , k P r , k = k ϵ K p o , k n = 0 c k 1 c k ρ k n n ! π k , 0

4.3. The Blocking Probability

When there are already r k tasks queued in the kth-tier MEC server, if a new task arrives, the queue is full and the new task cannot be queued and is blocked. Assuming that the blocked task does not return, the current kth-tier MEC server is in a state of not receiving tasks. The probability of this state is the blocking probability, also known as the loss probability.
P b , k = π k , c k + r k = c k c k ρ k c k + r k c k ! π k , 0
Therefore, the system blocking probability P b is given as follows
P b = k ϵ K p o , k P b , k = k ϵ K p o , k c k c k ρ k c k + r k c k ! π k , 0

5. Numerical Results

In this section, we demonstrate how bias factors and network parameters associated with MEC servers affect network performance via numerical results. We consider a two-layer MEC network, where the computing capabilities of MEC servers in the first layer are higher than those in the second layer. The network parameter values used for numerical results are presented in Table 3, except where otherwise stated. The service load data are generated by simulating the network parameters shown in Table 3 (such as MEC server computing power, node distribution density, signal power, etc.) to verify the impact of bias factors and network parameters on system performance.

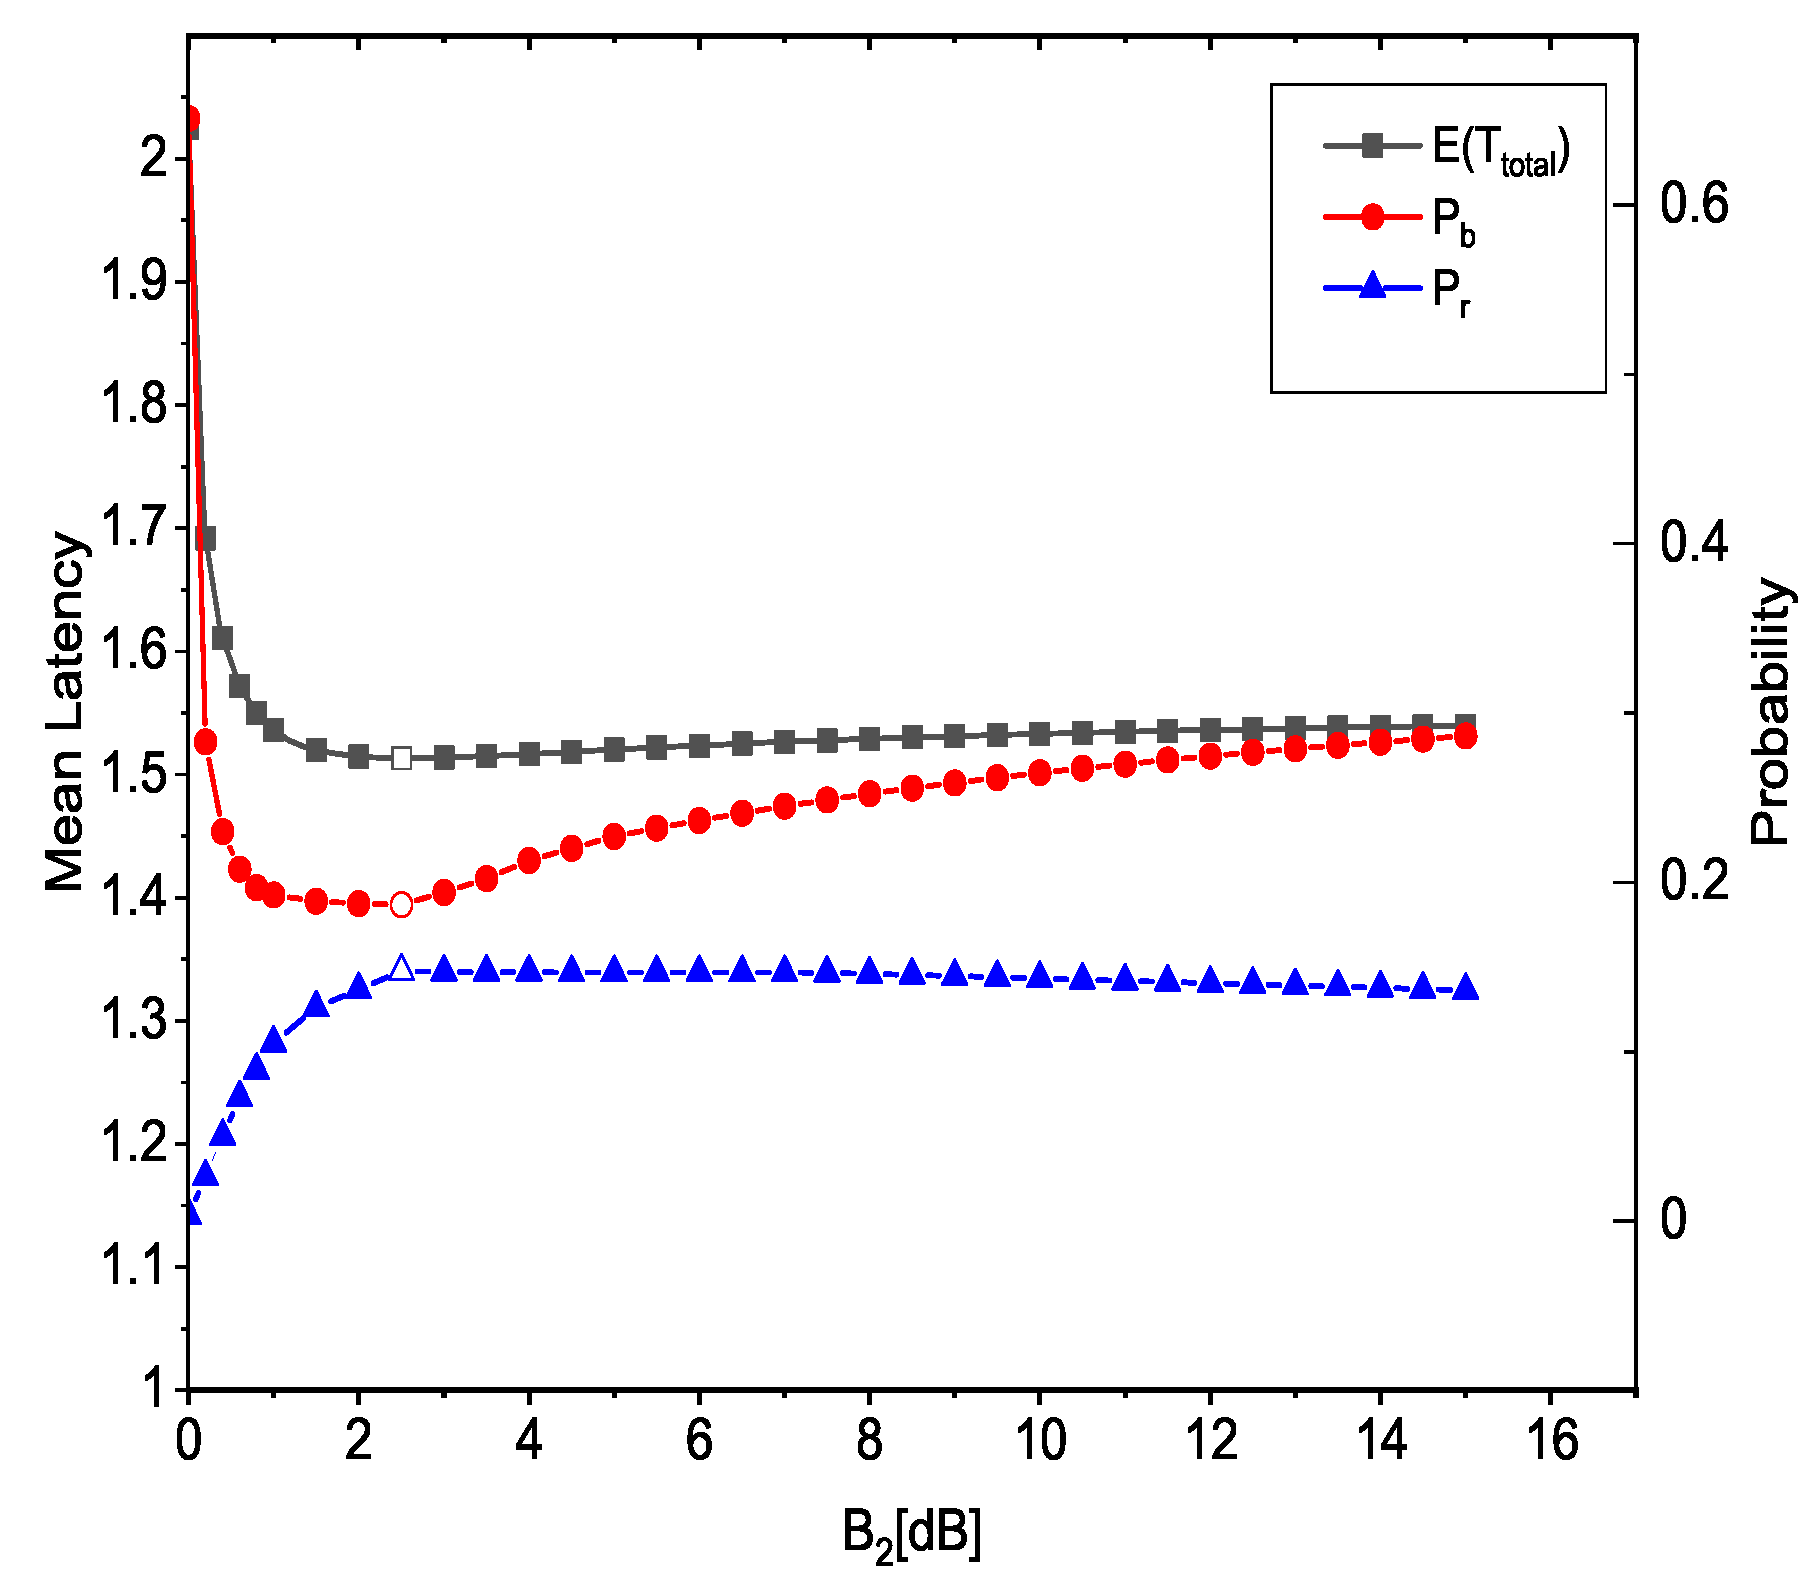
5.1. The Influence of Bias Factor

Figure 3 shows E ( T t o t a l ) , P r and P b as a function of the bias factor B 2 . For this figure, B 1 = 5 dB, and p m , k = {0.2, 0.8} are used. The curves in Figure 3 align with Equations (1) and (2), where B 2 controls task distribution via Poisson point process modeling. Bias Factor B 2 is chosen to model hierarchical MEC decision-making, as it quantifies the preference for offloading to second-tier MEC servers. Increasing B 2 (i.e., x-axis in Figure 3) means more users offload tasks to second-tier MEC servers. We can see that E ( T t o t a l ) and P b are relatively large, while P r is quite small when B 2 is small. This significant trend can be explained by the fact that a majority of the tasks are being offloaded to first-tier MEC servers. As a result, these MEC servers become overloaded, leading to an increase in waiting delay. As B 2 increases, some of the tasks are being offloaded to the second-tier MEC servers, This change is reflected in the graph as a decrease in both E ( T t o t a l ) and P b , and an increase in P r . However, after certain points of B 2 , E ( T t o t a l ) and P b increase, and P r begins to fall. This is due to the second-tier servers becoming increasingly heavy-loaded, and unable to handle the incoming tasks efficiently.

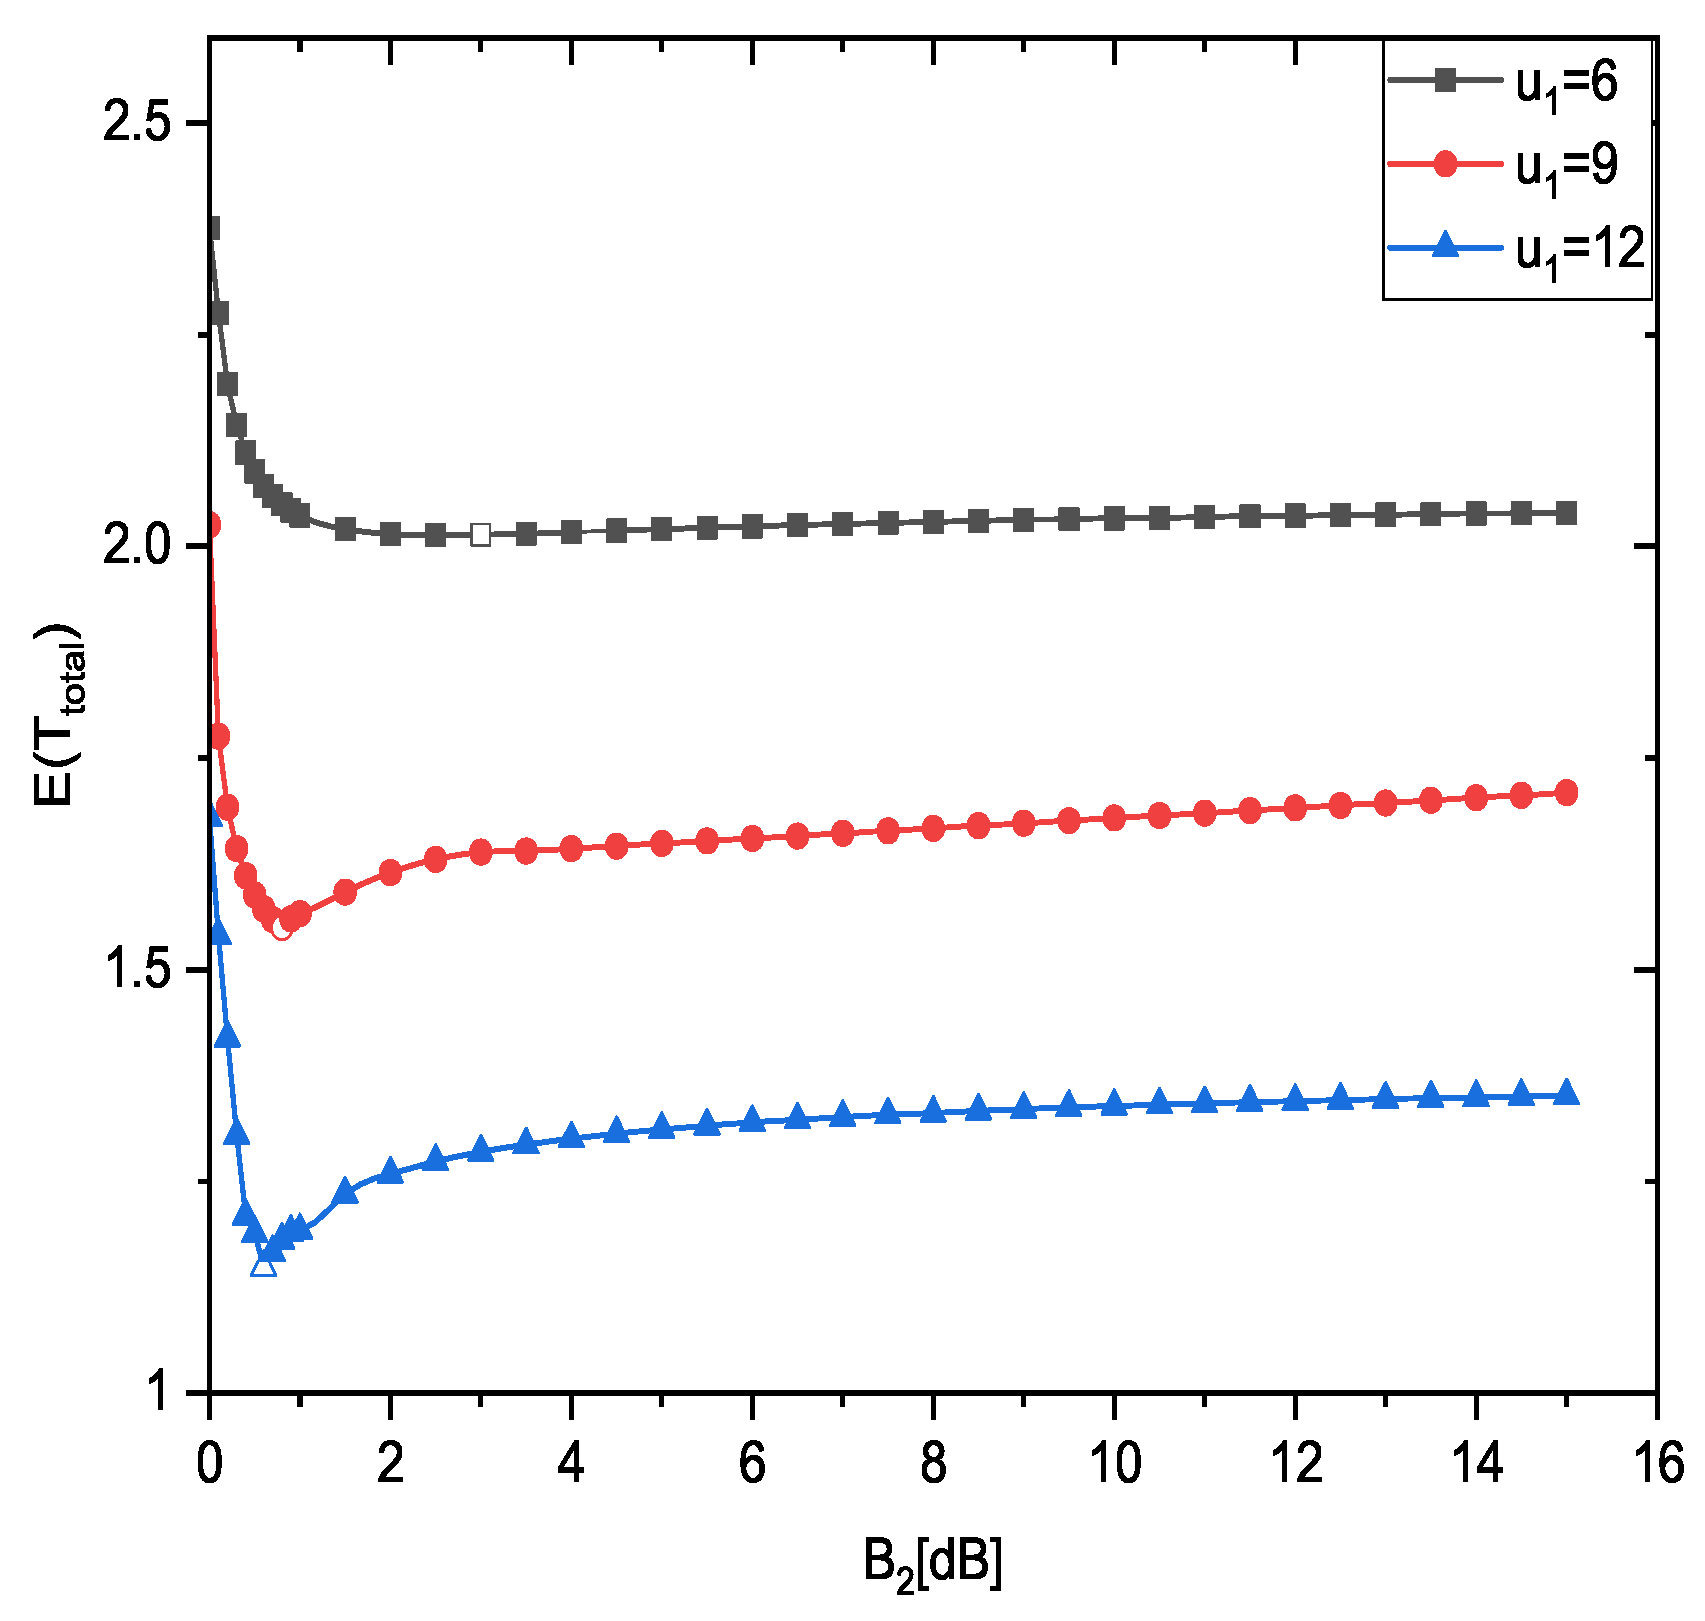
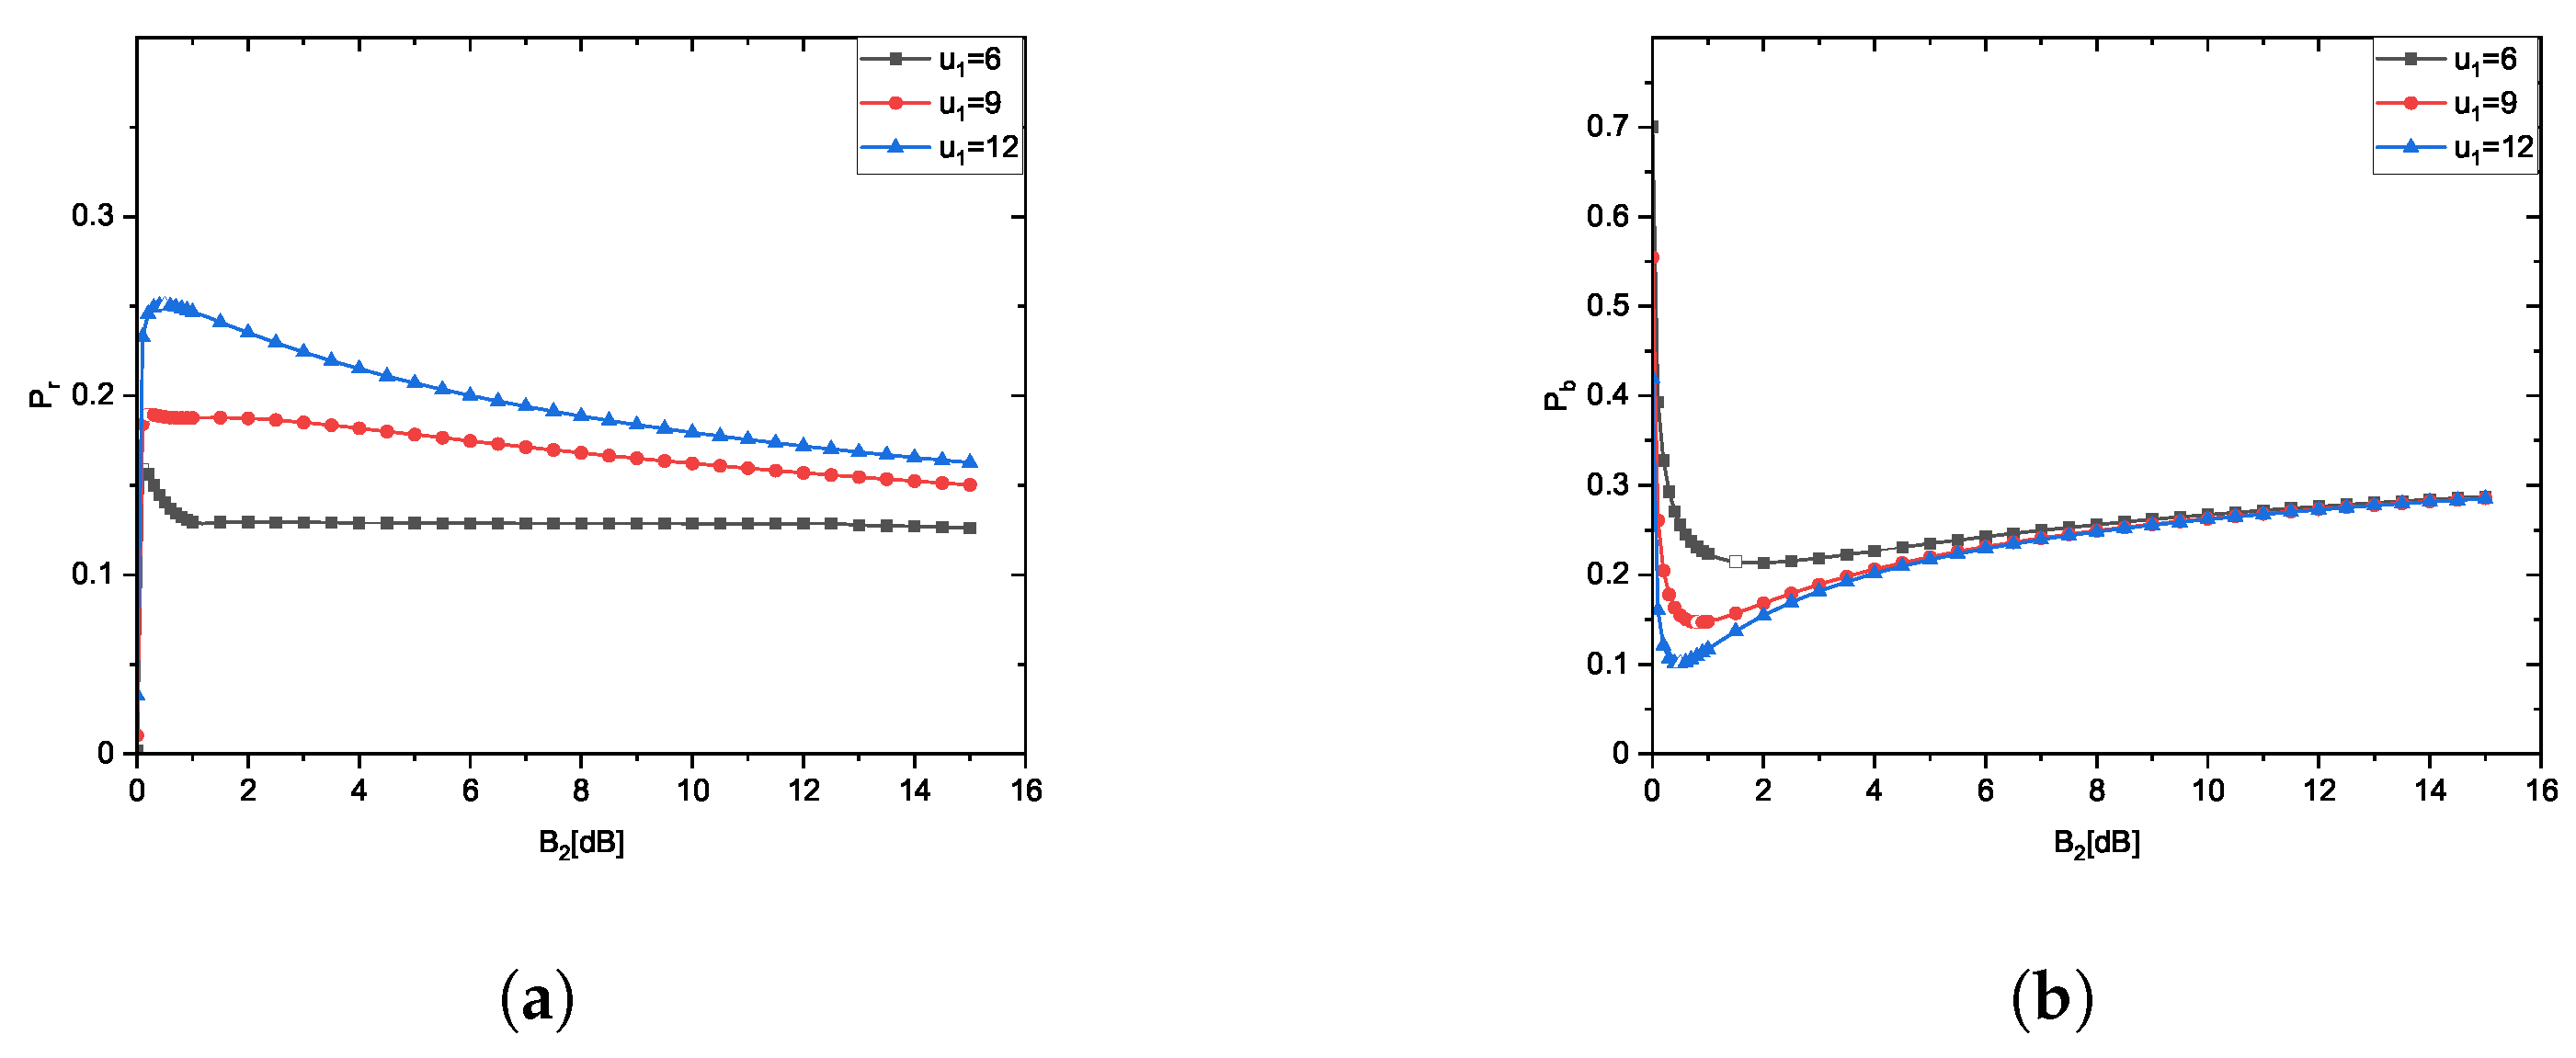
5.2. The Influence of Service Rate

Figure 4 and Figure 5a,b show E ( T t o t a l ) , P r and P b as a function of B 2 for different computing capabilities of a first-tier MEC server u 1 , respectively. Equations (16) and (17) predict service rate inversely correlates with delay. Doubling u 1 from 6 to 12 packet/slot decreases E ( T t o t a l ) , consistent with M/M/c/K queuing model. It is obvious that increasing u 1 contributes to a reduction in both E ( T t o t a l ) and P b , while concurrently enhancing P r . We can see that E ( T t o t a l ) and P b are large, and P r is small when B 2 is small. As the value of B 2 escalates, E ( T t o t a l ) and P b exhibit a declining trend, whereas P r experiences a noticeable upsurge. This trend signifies an inclination towards a greater number of tasks being offloaded to first-tier MEC servers with a larger computing capability. However, after certain points of B 2 , there is a reversal in this trend. At this point, E ( T t o t a l ) and P b begin to ascend while P r starts to dwindle, primarily due to the substantially heightened load on second-tier servers. We can also see that the larger the u 1 , the smaller the optimal bias factor B 2 .

5.3. The Influence of User Density and MEC Server Density

Figure 6a,b shows P b and P r as a function of B 2 for different user density λ u and MEC server density ratio λ m , 1 / λ m , 2 , respectively. Equation (2) indicates that λ u directly correlates with the arrival rate. High λ u overloads the first-tier MEC servers and the second-tier MEC servers. It can be seen from Figure 6a,b that when λ m , 1 / λ m , 2 is the same, the Probability of Immediate Service P r is relatively high when λ u is low, and the Blocking Probability P b is, otherwise, due to the decrease in total user tasks. When the density of first-tier MEC servers λ m , 1 / λ m , 2 increases, P r becomes larger and P b becomes smaller as the number of the first-tier MEC server increases.

5.4. The Influence of Number of CPU Cores

Figure 7a,b shows P b and P r as a function of B 2 for different number of CPU cores of a first-tier MEC server c 1 , respectively. We can find that P r for M/M/3 ( c 1 = 3) is higher than P r for M/M/2 ( c 1 = 3); P r for M/M/2 ( c 1 = 2) is higher than P r for M/M/1 ( c 1 = 1). P b for M/M/3 ( c 1 = 3) is lower than P b for M/M/2 ( c 1 = 2); P b for M/M/2 ( c 1 = 2) is lower than P b for M/M/1 ( c 1 = 1). More CPU cores in the MEC server can reduce the waiting time, so it can relieve blocking. From the results, we can see that a single-core edge server can be replaced by a dual-core edge server with a low service rate, which can achieve better performance. In Figure 7a,b, the optimal bias factor B 2 for P b and P r (M/M/3) is smallest, and optimal B 2 for P b and P r (M/M/1) is largest. This is because an MEC server with more CPU cores can achieve better performance. Equations (6) and (7) show that multi-core servers increase π k , 0 (idle probability), aligning with P r and P b improvements. Multi-core servers mitigate blocking by increasing parallel processing capacity, even at lower service rates.

5.5. The Influence of Waiting Queue Length

Figure 8a,b shows P b and P r as a function of B 2 for different waiting queue lengths of a first-tier MEC server r 1 . It is apparent that the influence of the bias factor B 2 on P b and P r is remarkably similar to what was observed in Figure 3. We can also see that P r significantly increases as the waiting queue length r 1 is increased and P b decreases sharply with the increase in r 1 . This increase can be attributed to the fact that a larger queue length allows for more user tasks to be offloaded to the MEC servers, thereby improving the overall performance of the system. Equations (20) and (21) demonstrate that longer queues reduce blocking by absorbing transient loads. Waiting queue length optimization balances task backlogs and processing capacity, providing a practical lever for real-time performance tuning.

6. Conclusions

In this paper, we propose the HetMECNet, a new heterogeneous edge computing network architecture that is composed of MEC Servers with different transmission power, computing capabilities, number of CPU cores, and different waiting queue lengths. We utilize the average delay of task offloading, immediate service probability, and blocking probability to characterize network performance. We then evaluate the impacts of network parameters and bias factors on network performance. Our results provide insights for HetMECNet design. Specifically, (1) as the MEC server computing capability increases, offloading more user tasks to MEC servers with high computing capability can achieve better system performance. For example, in high-traffic areas such as smart factories, increasing the computing power of MEC servers can improve performance by reducing task processing latency. (2) When user task volume is large, system performance decreases, and it is best to offload tasks to MEC servers with lower computing capabilities. For example, during city peak hours, user tasks surge, and offloading tasks to a server with a lower capacity can prevent system overload. (3) Single-core edge servers can be replaced by multi-core edge servers with a lower service rate for better performance. For example, in latency-critical scenarios such as healthcare IoT, replacing single-core servers with dual-core (or triple-core) nodes can reduce latency. (4) Increasing the waiting queue length allows for offloading more user tasks to MEC servers, which can improve system performance. For example, extending the wait queue length in dense network scenarios can increase the immediate service probability during peak loads, allowing more tasks to be processed without blocking.

SWOT Analysis of the Proposed Model

To strategically position this work within the research landscape, we summarize the key strengths, weaknesses, opportunities, and threats (SWOT) of the HetMECNet framework:
  • Strengths:
    -
    Comprehensive analysis framework incorporating heterogeneous server characteristics (transmission power, computing capability, CPU cores, waiting queue length).
    -
    Quantitative evaluation of critical metrics: average delay, immediate service probability, and blocking probability.
  • Weaknesses:
    -
    Simplified assumptions (exponential service time distribution, homogeneous PPP spatial model) may limit real-world applicability.
  • Opportunities:
    -
    Extension to energy/mobility-aware models via hybrid queuing approaches.
    -
    Validation in operational testbeds.
  • Threats:
    -
    Rapid technological evolution in edge computing may require dynamic model adaptation.
    -
    Complexity of real-world deployments (e.g., non-uniform geographical server distributions).
While the proposed model provides actionable insights for HetMECNet optimization, its simplified stochastic assumptions—particularly the exponential service time distribution and homogeneous PPP-based spatial modeling—may limit applicability in scenarios involving complex multi-resource tasks or geographically constrained deployments. To address these constraints, future work could enhance fidelity through task-aware probability distributions and GIS-informed spatial pattern integration. To bridge the gap between simulation and real-world applicability, future work will validate the proposed framework in operational edge-cloud testbeds, such as AWS Wavelength, Google Edge TPU, or 5G network slicing infrastructure.

Author Contributions

Conceptualization, W.L.; methodology, W.L.; software, W.L.; validation, W.L. and H.Z.; formal analysis, W.L.; writing—original draft preparation, W.L.; writing—review and editing, W.L. and H.Z.; visualization, W.L. and H.Z. All authors have read and agreed to the published version of the manuscript.

Funding

This research received no external funding.

Institutional Review Board Statement

Not applicable.

Informed Consent Statement

Not applicable.

Data Availability Statement

The datasets used in this study can be found at https://github.com/2450546671/Data.git (accessed on 9 April 2025).

Conflicts of Interest

The authors declare no conflicts of interest.

Abbreviations

The following abbreviations are used in this manuscript:
MECMobile Edge Computing
QoSQuality of Service
CCCloud Computing
ECEdge Computing
PPPPoisson Point Process
APsAccess Points
BSsBase Stations
HetMECNetsHeterogeneous Mobile Edge Computing Networks
FCFSFirst Come First Served

References

  1. Nguyen, D.C.; Ding, M.; Pathirana, P.N.; Seneviratne, A.; Li, J.; Niyato, D.; Dobre, O.; Poor, H.V. 6G Internet of Things: A Comprehensive Survey. IEEE Internet Things J. 2022, 9, 359–383. [Google Scholar] [CrossRef]
  2. Al-khafajiy, M.; Baker, T.; Waraich, A.; Al-Jumeily, D.; Hussain, A. IoT-Fog Optimal Workload via Fog Offloading. In Proceedings of the 2018 IEEE/ACM International Conference on Utility and Cloud Computing Companion (UCC Companion), Zurich, Switzerland, 17–20 December 2018; pp. 359–364. [Google Scholar]
  3. Wang, Y.; Wang, K.; Huang, H.; Miyazaki, T.; Guo, S. Traffic and Computation Co-Offloading With Reinforcement Learning in Fog Computing for Industrial Applications. IEEE Trans. Ind. Inform. 2019, 15, 976–986. [Google Scholar] [CrossRef]
  4. Kabdjou, J.; Tagne, E.F.; Rawat, D.B.; Acosta, J.; Kamhoua, C. Cyber Deception System based on Monte Carlo Simulation in the Mobile Edge Computing (MEC). In Proceedings of the 2023 International Conference on Computer, Information and Telecommunication Systems (CITS), Genoa, Italy, 10–12 July 2023; pp. 1–7. [Google Scholar]
  5. Qian, Y.; Sheng, K.; Ma, C.; Li, J.; Ding, M.; Hassan, M. Path Planning for the Dynamic UAV-Aided Wireless Systems Using Monte Carlo Tree Search. IEEE Trans. Veh. Technol. 2022, 71, 6716–6721. [Google Scholar] [CrossRef]
  6. Novlan, T.D.; Dhillon, H.S.; Andrews, J.G. Analytical Modeling of Uplink Cellular Networks. IEEE Trans. Wirel. Commun. 2013, 12, 2669–2679. [Google Scholar] [CrossRef]
  7. Musovic, J.; Lipovac, V.; Lipovac, A. Spectral and Network Deployment Efficiency Analysis in a k-Tier Network. In Proceedings of the 2019 International Conference on Software, Telecommunications and Computer Networks (SoftCOM), Split, Croatia, 19–21 September 2019; pp. 1–5. [Google Scholar]
  8. Hu, H.; Zhang, J.; Chu, X.; Zhang, J. Downlink Coverage Analysis of K-Tier Heterogeneous Networks with Multiple Antennas. In Proceedings of the ICC 2019—2019 IEEE International Conference on Communications (ICC), Shanghai, China, 20–24 May 2019; pp. 1–6. [Google Scholar]
  9. Wang, Y.; Han, X.; Jin, S. Performance Analysis of a VM-PM Repair Strategy in MEC-Enabled Wireless Systems With Bursty Traffic. IEEE Trans. Veh. Technol. 2024, 73, 1146–1161. [Google Scholar] [CrossRef]
  10. Li, J.; You, X.; Zheng, J. Performance Modeling and Analysis of an MEC System With Task Priority and Expiring Time Constraint. IEEE Commun. Lett. 2023, 27, 1754–1758. [Google Scholar] [CrossRef]
  11. Li, Q.; Peng, B.; Li, Q.; Lin, M.; Chen, C.; Peng, S. A Latency-Optimal Task Offloading Scheme Using Genetic Algorithm for DAG Applications in Edge Computing. In Proceedings of the 2023 8th International Conference on Cloud Computing and Big Data Analytics (ICCCBDA), Chengdu, China, 26–28 April 2023; pp. 344–348. [Google Scholar]
  12. Wang, X.; Zhou, Z.; Chen, H.; Zhang, Y. Task Offloading and Power Assignment Optimization for Energy-Constrained Mobile Edge Computing. In Proceedings of the 2021 Ninth International Conference on Advanced Cloud and Big Data (CBD), Xi’an, China, 26–27 March 2022; pp. 302–307. [Google Scholar]
  13. Li, Y.; Yang, C.; Deng, M.; Tang, X.; Li, W. A Dynamic Resource Optimization Scheme for MEC Task Offloading Based on Policy Gradient. In Proceedings of the 2022 IEEE 6th Information Technology and Mechatronics Engineering Conference (ITOEC), Chongqing, China, 4–6 March 2022; pp. 342–345. [Google Scholar]
  14. Zhao, J.; Hu, X.; Du, X. Algorithm of task offloading and resource allocation based on reinforcement learning in edge computing. In Proceedings of the 2021 IEEE 5th Information Technology, Networking, Electronic and Automation Control Conference (ITNEC), Xi’an, China, 15–17 October 2021; pp. 1266–1269. [Google Scholar]
  15. Liu, M.; Zhang, J. Research on Task Offloading Strategy for Ultra Dense Edge Computing Network. In Proceedings of the 2022 4th International Conference on Natural Language Processing (ICNLP), Xi’an, China, 25–27 March 2022; pp. 587–592. [Google Scholar]
  16. Tang, X.; Wen, Z.; Chen, J.; Li, Y.; Li, W. Joint Optimization Task Offloading Strategy for Mobile Edge Computing. In Proceedings of the 2021 IEEE 2nd International Conference on Information Technology, Big Data and Artificial Intelligence (ICIBA), Chongqing, China, 17–19 December 2021; pp. 515–518. [Google Scholar]
  17. Shojaee, R.; Yazdani, N. Modeling and performance analysis of smart map application in the Multi-access Edge Computing paradigm. Pervasive Mob. Comput. 2020, 69, 101280. [Google Scholar] [CrossRef]
  18. Maheshwari, S.; Raychaudhuri, D.; Seskar, I.; Bronzino, F. Scalability and Performance Evaluation of Edge Cloud Systems for Latency Constrained Applications. In Proceedings of the 2018 IEEE/ACM Symposium on Edge Computing (SEC), Seattle, WA, USA, 25–27 October 2018; pp. 286–299. [Google Scholar]
  19. Elbayoumi, M.; Hamouda, W.; Youssef, A. Edge Computing and Multiple-Association in Ultra-Dense Networks: Performance Analysis. IEEE Trans. Commun. 2022, 70, 5098–5112. [Google Scholar] [CrossRef]
  20. Gu, Y.; Yao, Y.; Li, C.; Xia, B.; Xu, D.; Zhang, C. Modeling and Analysis of Stochastic Mobile-Edge Computing Wireless Networks. IEEE Internet Things J. 2021, 8, 14051–14065. [Google Scholar] [CrossRef]
  21. Bebortta, S.; Singh, A.K.; Senapati, D. Performance analysis of multi-access edge computing networks for heterogeneous IoT systems. Mater. Today Proc. 2022, 58, 267–272. [Google Scholar] [CrossRef]
  22. Li, W.; Jin, S. Performance evaluation and optimization of a task offloading strategy on the mobile edge computing with edge heterogeneity. J. Supercomput. 2021, 77, 12486–12507. [Google Scholar] [CrossRef]
  23. Zhao, H.; Geng, J.; Jin, S. Performance research on a task offloading strategy in a two-tier edge structure-based MEC system. J. Supercomput. 2023, 79, 10139–10177. [Google Scholar] [CrossRef]
  24. Zeng, H.; Li, X.; Bi, S.; Lin, X. Delay-Sensitive Task Offloading With D2D Service-Sharing in Mobile Edge Computing Networks. IEEE Wirel. Commun. Lett. 2022, 11, 607–611. [Google Scholar] [CrossRef]
  25. Ma, X.; Zhou, A.; Sun, Q.; Wang, S. Freshness-Aware Information Update and Computation Offloading in Mobile-Edge Computing. IEEE Internet Things J. 2021, 8, 13115–13125. [Google Scholar] [CrossRef]
  26. Do-Duy, T.; Van Huynh, D.; Dobre, O.A.; Canberk, B.; Duong, T.Q. Digital Twin-Aided Intelligent Offloading With Edge Selection in Mobile Edge Computing. IEEE Wirel. Commun. Lett. 2022, 11, 806–810. [Google Scholar] [CrossRef]
  27. Luo, Z.; Huang, G. Energy-Efficient Mobile Edge Computing in RIS-Aided OFDM-NOMA Relay Networks. IEEE Trans. Veh. Technol. 2023, 72, 4654–4669. [Google Scholar] [CrossRef]
  28. Li, Z.; Chen, M.; Yang, Z.; Zhao, J.; Wang, Y.; Shi, J.; Huang, C. Energy Efficient Reconfigurable Intelligent Surface Enabled Mobile Edge Computing Networks with NOMA. IEEE Trans. Cogn. Commun. Netw. 2021, 7, 427–440. [Google Scholar] [CrossRef]
  29. Pham, Q.-V.; Leanh, T.; Tran, N.H.; Park, B.J.; Hong, C.S. Decentralized Computation Offloading and Resource Allocation for Mobile-Edge Computing: A Matching Game Approach. IEEE Access 2018, 6, 75868–75885. [Google Scholar] [CrossRef]
  30. Xiao, S.; Liu, C.; Li, K.; Li, K. System delay optimization for Mobile Edge Computing. Future Gener. Comput. Syst. 2020, 109, 17–28. [Google Scholar] [CrossRef]
  31. Gao, H.; Wang, X.; Wei, W.; Al-Dulaimi, A.; Xu, Y. Com-DDPG: Task Offloading Based on Multiagent Reinforcement Learning for Information-Communication-Enhanced Mobile Edge Computing in the Internet of Vehicles. IEEE Trans. Veh. Technol. 2024, 73, 348–361. [Google Scholar] [CrossRef]
  32. Luo, Q.; Li, C.; Luan, T.H.; Shi, W. Minimizing the Delay and Cost of Computation Offloading for Vehicular Edge Computing. IEEE Trans. Serv. Comput. 2022, 15, 2897–2909. [Google Scholar] [CrossRef]
  33. Gao, Z.; Hao, W.; Yang, S. Joint Offloading and Resource Allocation for Multi-User Multi-Edge Collaborative Computing System. IEEE Trans. Veh. Technol. 2022, 71, 3383–3388. [Google Scholar] [CrossRef]
  34. Shi, Y.; Alsusa, E.; Baidas, M.W. Joint DL/UL Decoupled Cell-Association and Resource Allocation in D2D-Underlay HetNets. IEEE Trans. Veh. Technol. 2021, 70, 3640–3651. [Google Scholar] [CrossRef]
  35. Arshad, R.; Farooq-i-Azam, M.; Muzzammel, R.; Ghani, A.; See, C.H. Energy Efficiency and Throughput Optimization in 5G Heterogeneous Networks. Electronics 2023, 12, 2031. [Google Scholar] [CrossRef]
  36. Herath, P.; Tellambura, C.; Krzymień, W.A. Coverage probability analysis of three uplink power control schemes: Stochastic geometry approach. EURASIP J. Wirel. Commun. Netw. 2018, 2018, 141. [Google Scholar] [CrossRef] [PubMed]
  37. Ali, S.; Aslam, M.I.; Ahmed, I.; Khawaja, A. Uplink Performance of Narrowband Internet-of-Things Devices in Downlink–Uplink Decoupled-Based Heterogeneous Networks. Iran. J. Sci. Technol. Trans. Electr. Eng. 2023, 47, 385–399. [Google Scholar] [CrossRef]
  38. Park, J.; Choi, J.; Lee, N. A Tractable Approach to Coverage Analysis in Downlink Satellite Networks. IEEE Trans. Wirel. Commun. 2023, 22, 793–807. [Google Scholar] [CrossRef]
  39. Khan, H.Z.; Ali, M.; Naeem, M.; Rashid, I.; Imran, M. Resource allocation in 5G heterogeneous networks with downlink-uplink decoupled access. Trans. Emerg. Telecommun. Technol. 2020, 31, e3831. [Google Scholar] [CrossRef]
  40. Ko, S.-W.; Han, K.; Huang, K. Wireless Networks for Mobile Edge Computing: Spatial Modeling and Latency Analysis. IEEE Trans. Wirel. Commun. 2018, 17, 5225–5240. [Google Scholar] [CrossRef]
  41. Zhao, K.; Zhou, Z.; Jiao, L.; Cai, S.; Xu, F.; Chen, X. Taming Serverless Cold Start of Cloud Model Inference With Edge Computing. IEEE Trans. Mob. Comput. 2024, 23, 8111–8128. [Google Scholar] [CrossRef]
  42. Tao, T.; Hou, J.; Nayak, A. A GNN-DRL-based Collaborative Edge Computing Strategy for Partial Offloading. In Proceedings of the GLOBECOM 2023—2023 IEEE Global Communications Conference, Kuala Lumpur, Malaysia, 4–8 December 2023; pp. 3717–3722. [Google Scholar]
  43. Guo, K.; Yang, M.; Zhang, Y.; Cao, J. Joint Computation Offloading and Bandwidth Assignment in Cloud-Assisted Edge Computing. IEEE Trans. Cloud Comput. 2022, 10, 451–460. [Google Scholar] [CrossRef]
  44. Bari, A.; de Veciana, G.; Johnsson, K.; Pyattaev, A. Managing Edge Offloading for Stochastic Workloads with Deadlines. In Proceedings of the Int’l ACM Conference on Modeling Analysis and Simulation of Wireless and Mobile Systems, Association for Computing Machinery, Montreal, QC, Canada, 30 October–3 November 2023; pp. 99–108. [Google Scholar]
  45. Song, L.; Sun, G.; Yu, H.; Guizani, M. SD-AETO: Service-Deployment-Enabled Adaptive Edge Task Offloading Scheme in MEC. IEEE Internet Things J. 2023, 10, 19296–19311. [Google Scholar] [CrossRef]
  46. Carvalho, D.; Rodrigues, L.; Takako Endo, P.; Kosta, S.; Airton Silva, F. Mobile Edge Computing Performance Evaluation using Stochastic Petri Nets. In Proceedings of the 2020 IEEE Symposium on Computers and Communications (ISCC), Rennes, France, 7–10 July 2020; pp. 1–6. [Google Scholar]
  47. Barbosa, V.; Sabino, A.; Lima, L.N.; Brito, C.; Feitosa, L.; Pereira, P.; Maciel, P.; Nguyen, T.A.; Silva, F.A. Performance Evaluation of IoT-Based Industrial Automation Using Edge, Fog, and Cloud Architectures. J. Netw. Syst. Manag. 2025, 33, 15. [Google Scholar] [CrossRef]
  48. Rocha, F.; Nogueira, B.; Gonçalves, G.; Silva, F.A. Smart Hospital Patient Monitoring System Aided by Edge-Fog-Cloud Continuum: A Performability Evaluation Focusing on Distinct Sensor Sources. J. Netw. Syst. Manag. 2024, 32, 99. [Google Scholar] [CrossRef]
  49. Behera, S.; Kandpal, M.; Goswami, V.; Tarasia, N.; Mund, G.B.; Barik, R.K. Leveraging towards dynamic allocations of mist nodes for IoT-Mist-Fog-Cloud system using M/Er/1 queueing model. In Proceedings of the 2023 OITS International Conference on Information Technology (OCIT), Raipur, India, 13–15 December 2023; pp. 59–64. [Google Scholar]
  50. Miao, W.; Min, G.; Zhang, X.; Zhao, Z.; Hu, J. Performance modelling and quantitative analysis of vehicular edge computing with bursty task arrivals. IEEE Trans. Mob. Comput. 2021, 22, 1129–1142. [Google Scholar] [CrossRef]
  51. Liang, J.; Ma, X.; Ding, H.; He, Z. Optimizing MEC System Performance Through M/M/m Queueing Model Analysis. In Proceedings of the 2024 IEEE International Symposium on Parallel and Distributed Processing with Applications (ISPA), Kaifeng, China, 30 October–2 November 2024; pp. 2217–2218. [Google Scholar]
  52. Singh, S.; Dhillon, H.S.; Andrews, J.G. Offloading in Heterogeneous Networks: Modeling, Analysis, and Design Insights. IEEE Trans. Wirel. Commun. 2013, 12, 2484–2497. [Google Scholar] [CrossRef]
Figure 1. The HetMECNet model.
Applsci 15 04307 g001
Figure 2. The state flow of M/M/ c k / c k + r k model.
Applsci 15 04307 g002
Figure 3. Performance of HetMECNet with different bias factors B 2 .
Applsci 15 04307 g003
Figure 4. E ( T t o t a l ) of HetMECNet with different service rate.
Applsci 15 04307 g004
Figure 5. Experimental results of different service rate. (a) P r of HetMECNet as a function of B 2 for different service rate. (b) P b of HetMECNet as a function of B 2 for different service rate.
Applsci 15 04307 g005
Figure 6. Experimental results of different user density and MEC server density. (a) P r of HetMECNet as a function of B 2 for different user density and MEC server density. (b) P b of HetMECNet as a function of B 2 for different user density and MEC server density.
Applsci 15 04307 g006
Figure 7. Experimental results of different number of CPU cores. (a) P r of HetMECNet as a function of B 2 for different number of CPU cores. (b) P b of HetMECNet as a function of B 2 for different number of CPU cores.
Applsci 15 04307 g007
Figure 8. Experimental results of different waiting queue length. (a) P r of HetMECNet as a function of B 2 for different waiting queue length. (b) P b of HetMECNet as a function of B 2 for different waiting queue length.
Applsci 15 04307 g008
Table 1. Summary of Literature Review.
ReferenceResearch ScenariosEvaluation Metrics
Carvalho et al. [46]single-serverresponse time, resource utilization
Barbosa et al. [47]single-serverresponse time, resource utilization, discard probability
Rocha et al. [48]single-servermean response time, resource utilization
Behera et al. [49]homogeneous multi-serverresponse time, mean length of busy, idle periods
Bebortta et al. [21]homogeneous multi-serveramount of data packets, waiting time
Miao et al. [50]heterogeneous multi-serverresponse time
Liang et al. [51]heterogeneous multi-serverresponse time
Oursheterogeneous multi-serverresponse time, immediate service probability, blocking probability
Table 2. Main Notations.
NotationDescription
N m the max tier of MEC servers
kindex set of N m tiers of MEC server
λ u , λ m spatial density of users and MEC server
p m , k , λ m , k portion and spatial density of the kth-tier MEC server
c k , r k , u k , ρ k number of CPU cores, waiting queue length, service rate and utilization factor in the kth-tier MEC server
T s time slot
p o , k probability that a user offloads to the kth-tier MEC server
B k bias factor of the user offloading to the kth-tier MEC server
P m , k transmission power of the kth-tier MEC server
α path loss exponent
v k arrival rate of user tasks to the kth-tier MEC server
Table 3. Parameter Values.
ParametersValues
p m , k {0.2, 0.8}
λ u [nodes/m2]1.2 × 10−4
λ m [nodes/m2]3 × 10−4
u 1 [packet/slot]9
u 2 [packet/slot]4
c 2 1
r 2 4
P m , 1 [dBm]45
P m , 2 [dBm]30
P u [dBm]20
Disclaimer/Publisher’s Note: The statements, opinions and data contained in all publications are solely those of the individual author(s) and contributor(s) and not of MDPI and/or the editor(s). MDPI and/or the editor(s) disclaim responsibility for any injury to people or property resulting from any ideas, methods, instructions or products referred to in the content.

