Article

Safety Assessment of Microwave Breast Imaging: Heating Analysis on Digital Breast Phantoms

by
Alessandra Ronca
1,2,*,
Luca Zilberti
2,
Oriano Bottauscio
2,
Gianluigi Tiberi
3,4 and
Alessandro Arduino
2
1
Politecnico di Torino, Department of Electronics and Telecommunications (DET), Corso Duca degli Abruzzi, 24, 10129 Torino, Italy
2
Istituto Nazionale di Ricerca Metrologica (INRiM), Strada delle Cacce 91, 10135 Torino, Italy
3
Umbria Bioengineering Technologies, UBT Srl, Via Santa Maria della Spina, 25, 06081 Perugia, Italy
4
School of Engineering, London South Bank University, 103 Borough Rd, London SE1 0AA, UK
*
Author to whom correspondence should be addressed.
Appl. Sci. 2025, 15(8), 4262; https://doi.org/10.3390/app15084262
Submission received: 12 February 2025 / Revised: 8 April 2025 / Accepted: 10 April 2025 / Published: 12 April 2025
(This article belongs to the Special Issue Antennas for Next-Generation Electromagnetic Applications)

Abstract

:

Featured Application

Devices for microwave mammography could soon appear in clinical practice. The significant result of this study is the demonstration of the high safety of a microwave imaging system in terms of heating induced in biological tissues.

Abstract

The impact of breast cancer on public health is serious, and due to risk/benefit assessment, screening programs are usually restricted to women older than 49 years. Microwave imaging devices offer advantages such as non-ionizing radiation, low cost, and the ability to distinguish between cancerous and healthy tissues due to their electrical properties. Ensuring the safety of this technology is vital for its potential clinical application. To estimate the temperature increase in breast tissues from a microwave imaging scanner, cases of healthy, benign, and malignant breast tissues were analyzed using three digital models and adding two healthy breast models with varying densities. Virtual experiments were conducted using the Sim4Life software (version 7.2) with a system consisting of a horn antenna in transmission and a Vivaldi antenna in reception. Temperature increases were estimated based on the Specific Absorption Rate distributions computed for different configurations and frequencies. The highest temperature increase obtained in this analysis is lower than 60 μK in fibroglandular tissue or skin, depending on the frequency and breast density. The presence of a receiving antenna acting as a scatterer modifies the temperature increase, which is almost negligible. Microwave examination can be performed without harmful thermal effects due to electromagnetic field exposure.

Graphical Abstract

1. Introduction

Breast cancer has become the most frequently diagnosed cancer in the world, with over 2.3 million new cases estimated in 2020 [1], and its impact on public health is serious. Nowadays, aware of the risk factors linked to the onset of cancer, the female population can implement lifestyle changes that, together with screening and technological advances in early diagnosis and treatment, allow them to live with a history of breast cancer.

1.1. Current Breast Cancer Screening Technologies

To date, X-ray mammography is the gold standard technology for breast cancer screening. Mammography sensitivity can be positively or negatively affected by variables like a woman’s age, hormonal status, and breast density (amount of fibroglandular tissue in a breast relative to fat), as well as tumors’ size and stage. From a case-control study [2], screening performance was found to be superior in the fat breast group compared to the dense breast group (overall sensitivity 75.7% vs. 57.8%). In addition to the low sensitivity in extremely dense breasts, other drawbacks of X-ray mammography are the painful physical compression of the breast and the risk related to the use of ionizing radiation. According to the WHO, women aged 50 and over should have a screening every two years. The use of X-rays does not allow for a higher examination frequency because of the potentially harmful consequences, such as the onset of cancer. For the same reason, young women are not eligible for screening, although, worldwide, almost 30% of breast cancer cases occur in women younger than 50 years [1]. In this scenario, different research groups are working to develop new imaging devices based on microwaves [3]. The latter have several advantages, including low cost, ease of use, and, mainly, the use of non-ionizing radiation. Moreover, despite low resolution (in the order of some millimeters [3]), the quantitative nature of the technique allows microwave imaging (MI) to differentiate between malignant and benign tumors. Magnetic resonance imaging (MRI) and ultrasound are other relevant breast screening techniques in the field of non-ionizing radiation. However, MRI requires a substantial financial commitment [3] for both the initial acquisition and subsequent costs, including maintenance, infrastructure, safety measures, and specialized staff. The limit of ultrasound is its low sensitivity in distinguishing benign and malignant tumors [3]. Indeed, the extensive investigation into the use of microwaves in breast cancer detection is motivated by the promise of better sensitivity due to the possibility of distinguishing some physiopathological statuses based on tissue electrical properties (EPs). The EPs in the range of microwaves (from 0.5 GHz to 8 GHz) differ greatly depending on the tissues. The electrical permittivity value of a benign tumor and cancer is about 3 and 10 times larger than that of the corresponding healthy tissue, respectively. Similar proportions are found for the conductivity [4]. This strong contrast is expected to become visible in the MI results. An MI system is usually composed of antennas illuminating the patient’s breast and collecting the reflected signals. Different systems presented in the literature use horn antennas [5], Vivaldi antennas [6], or patch antennas [7]. They usually use a compact vector network analyzer (VNA) as the signal generator and recording device, which works in the range from 0.5 GHz to 9 GHz. The output power is set on a scale from 0.05 mW to 32 mW, depending on the device. The VNA collects S-parameters, which can be elaborated by software to produce an image of the target object. Different architectures are also used in some radar-based systems, such as antenna arrangements in prosthetic bras [8] and hand-held devices [9]. Advanced MI systems produce qualitative images in which the contrast map can highlight the presence of an abnormal mass.

1.2. Safety Assessment of Microwave Technology

The introduction of MI systems in the clinical world is foreseen, considering that the CE mark [10], denoting products compliant with EU safety, health, and environmental standards for commercial purposes, was granted to some of them [11,12] and that clinical studies are ongoing [13]. Since MI is an evolving field, it is useful to check through scientifically sound dosimetric studies that the interaction between electromagnetic (EM) fields and biological tissues related to this application is safe. Because MI devices are based on non-ionizing radiation, the advantages over X-ray technology are indisputable, particularly as they would allow screening without age limitations. However, quantifying potential adverse effects caused by exposure to this type of EM field is essential to assess MI safety. This is important also to understand the room for further development of the technology, in terms of better hardware configurations, to ensure sufficient and good quality data for image reconstruction. In the MI range of frequencies, the only recognized biological effect of EM radiation is heating, which could increase the temperature in a localized manner. The specific absorption rate (SAR), defined as the power absorbed per mass of tissue, with units of watts per kilogram (W·kg−1), is a well-established metric to quantify the thermal effects of EM waves in the tissues. Since there is no specific technical regulation for MI that establishes patient exposure limits, the guidelines for limiting exposure to EM fields from 100 kHz to 300 GHz published by the International Commission on Non-Ionizing Radiation Protection (ICNIRP) [14] could be a reference starting point. For the general public, in the range from 100 MHz to 6 GHz over a 6-min time interval, SAR should not exceed the level of exposure defined by the guidelines. Above 6 GHz, SAR is replaced by the absorbed power density (W·m−2) as the metric to assess a more superficial effect of EM radiation localized at the skin level. As a matter of fact, the set of metrics established by ICNIRP acts as a surrogate of the temperature increase. For this reason, in this work, the calculation of SAR was performed not as a metric to be tested with respect to safety limits but as an intermediary parameter used to estimate the final temperature increase. Previous works presented studies of the thermal effects consequent to the use of MI in breast cancer detection. They show that the level of exposure is not dangerous for breast tissues. However, some studies were conducted with a non-anatomical model to mimic breast tissue [15] and a plane wave illumination [16], which could not mimic a real transmitted field. Another study used one specific virtual phantom from a repository of 3D biological models for numerical simulation and constructed a simple phantom that was used in a real experimental environment for validating the simulation results [17]. In this case, the exposure to the field generated by a Vivaldi antenna was assessed with an analysis performed by varying the signal power and the distance from the target. The computations were performed only at the frequency of 8.5 GHz, and the temperature increase was evaluated after a very long exposure of two hours. A dosimetric analysis was also performed for a hand-held MI [18], which works in direct contact with the breast and, as such, uses a relatively low transmitted power (0.045 mW). The particular design of this MI device makes it difficult to generalize the results of this analysis to other systems. This paper aims to assess the safety of an MI system in a wide range of frequencies by computing the SAR distribution in different numerical breast models selected from MRI scans of healthy and pathological breasts to cover variability in the patient population and analyze the maximum temperature increase in the different breast tissues. This approach enables the assessment of the thermal effects of electromagnetic fields on biological tissues in the microwave frequency range, moving beyond the reliance on reference quantities commonly used in guidelines, such as SAR. The study emphasizes temperature as it is the physical metric most closely related to biological effects and is easily interpretable. Quantification of thermal effect aids in evaluating the risk/benefit profile of the diagnostic tool. The system considered here is the MammoWave device [11] (UBT Srl, Perugia, Italy), consisting of a transmitting horn antenna rotating around a holder where the patient’s breast is located during the examination. The physical model adopted in this study for estimating the induced temperature increases could be applied to a range of breast MI devices, with minor necessary adjustments, in case they operate on the same principle.

2. Materials and Methods

The safety assessment was conducted by means of virtual experiments performed with the commercial software Sim4Life (Zurich MedTech, Zurich, Switzerland, version 7.2, https://sim4life.swiss/ accessed on 30 September 2024). Sim4Life is typically used for dosimetric analysis of biological tissues. It is widely used due to its availability and integration of highly detailed anatomical models; however, a similar analysis can be conducted with other EM software. Full-wave simulations have been conducted, considering Maxwell’s equations in their complete form. In the simulations, the models of the breast and the horn antenna that acts as a source in the considered MI system have been placed in the proper relative position, thus allowing to take into account the near-field coupling. Figure 1 shows the relative positioning of the antenna and the anatomical breast model.

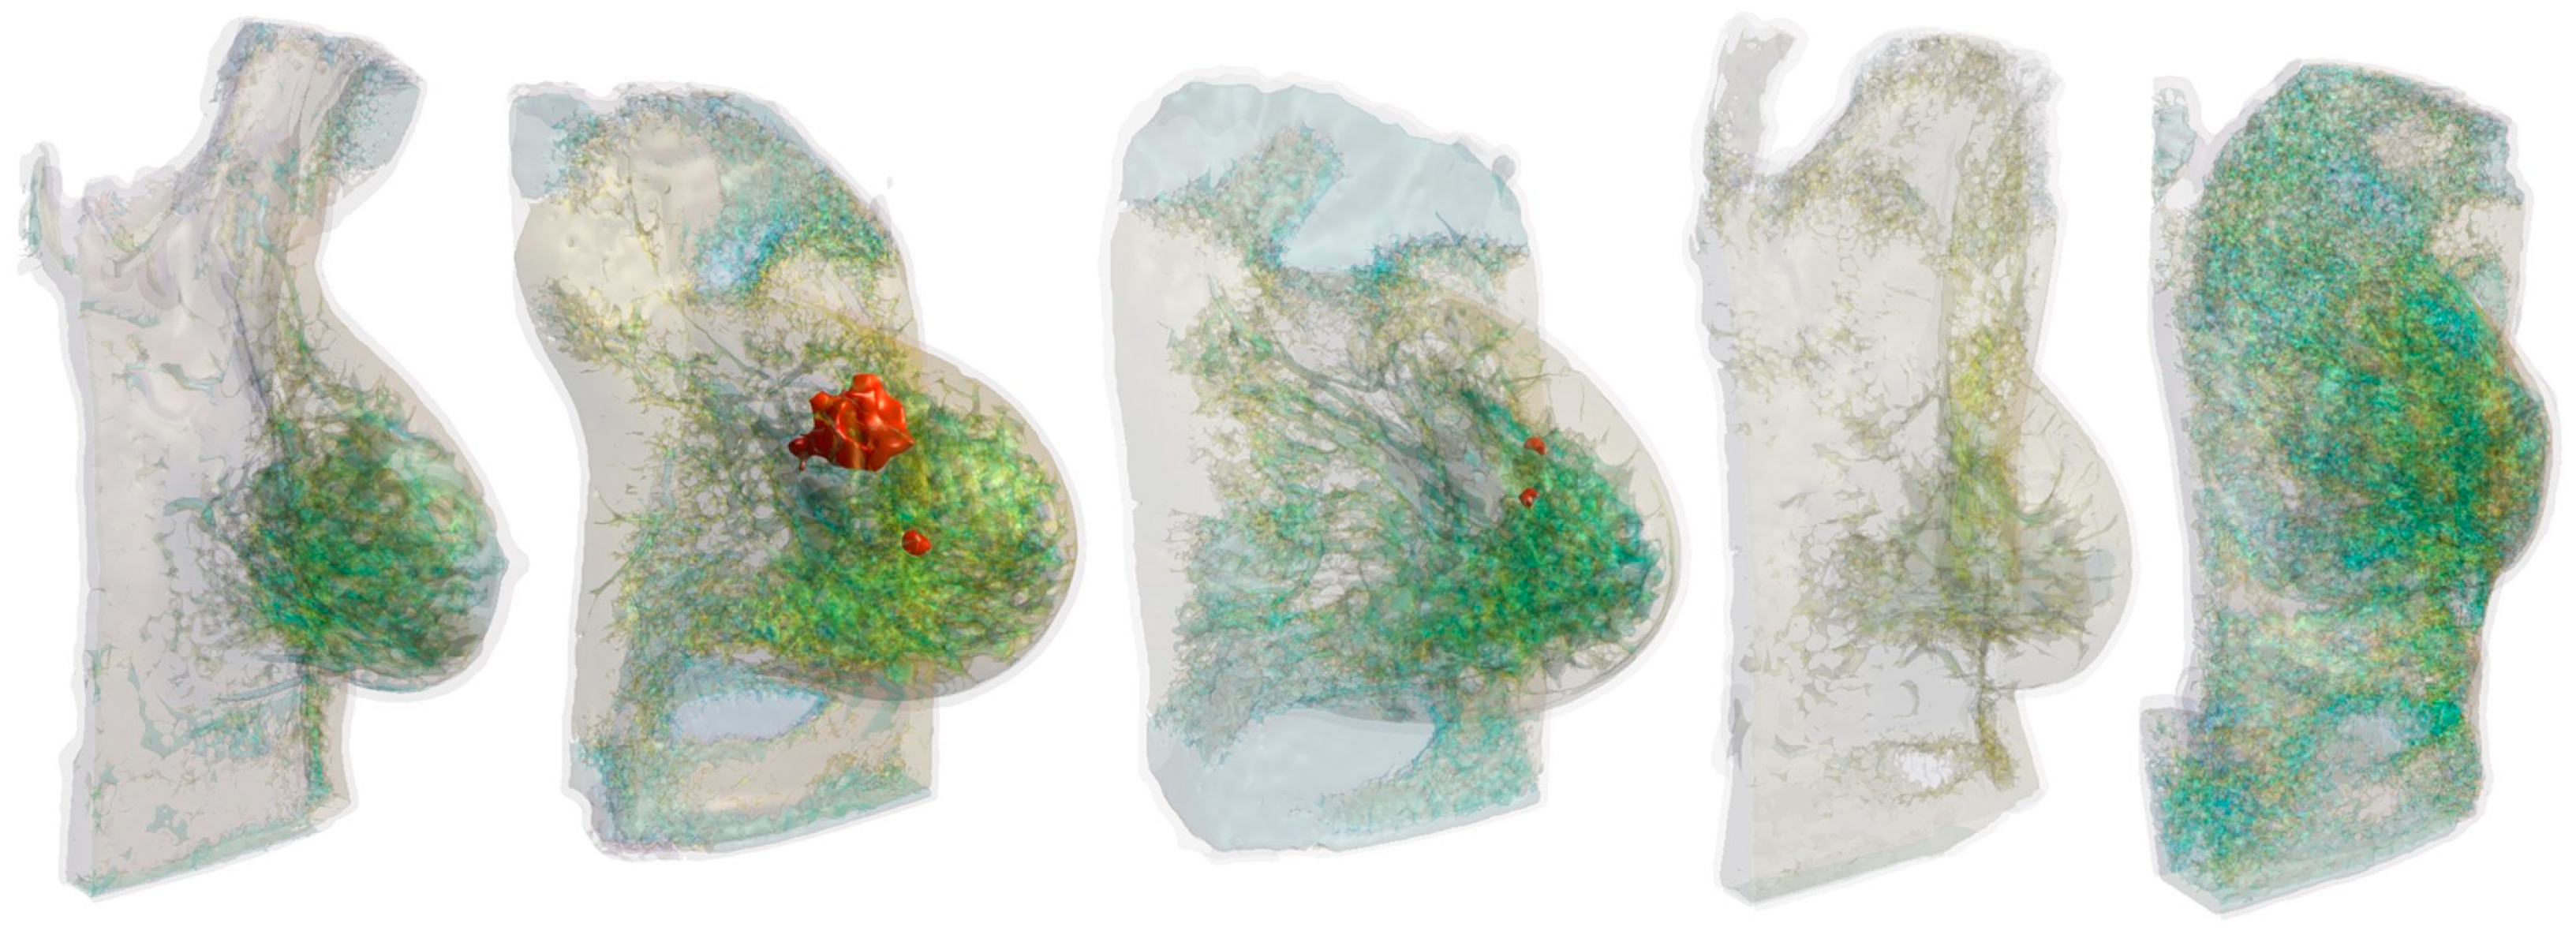
2.1. Anatomical Breast Models

The exposure of five different anatomical breast models was simulated. They represent the case of a healthy breast (models #1, #4, and #5), the presence of a benign tumor (model #2), and a cancerous breast (model #3). The digital models were produced from data collected in a public repository (https://github.com/acpelicano/breast_models_repository accessed on 30 September 2024) of models derived from MRI images for MI research [19]. The repository provides segmented medical images in MHA format that, processed with the software 3DSlicer (https://www.slicer.org/ accessed on 30 September 2024), were used to create STL surface models of the breast tissues. This allowed importing the anatomical breast models into the Sim4Life simulation environment. Six different tissues were defined in the breast models: skin, muscle, fibroglandular tissue, fat, and possibly benign or malignant tumors. The used breast models are shown in Figure 2. Model #2 includes two benign tumors with bounding boxes of 49.0 mm × 36.6 mm × 35.1 mm and 8.5 mm × 7.9 mm × 9.0 mm; model #3 includes two malignant tumors with bounding boxes of 8.4 mm × 7.6 mm × 7.4 mm and 8.1 mm × 6.8 mm × 8.0 mm. Breast density is a feature of interest because it can affect tumor detection in diagnostic imaging [20]. In this work, by comparing the volume of fibroglandular tissue to the total volume of the breast, we classified the models as a, b, c, or d, following the logic of VOLPARA software (https://www.volparahealth.com/breast-health-software/ accessed on 9 April 2025) [21]. Models #2 (breast density equal to 11%), #3 (13.7%), and #4 (9.3%) were in class c, models #1 (17%) and #5 (25%) were in class d.

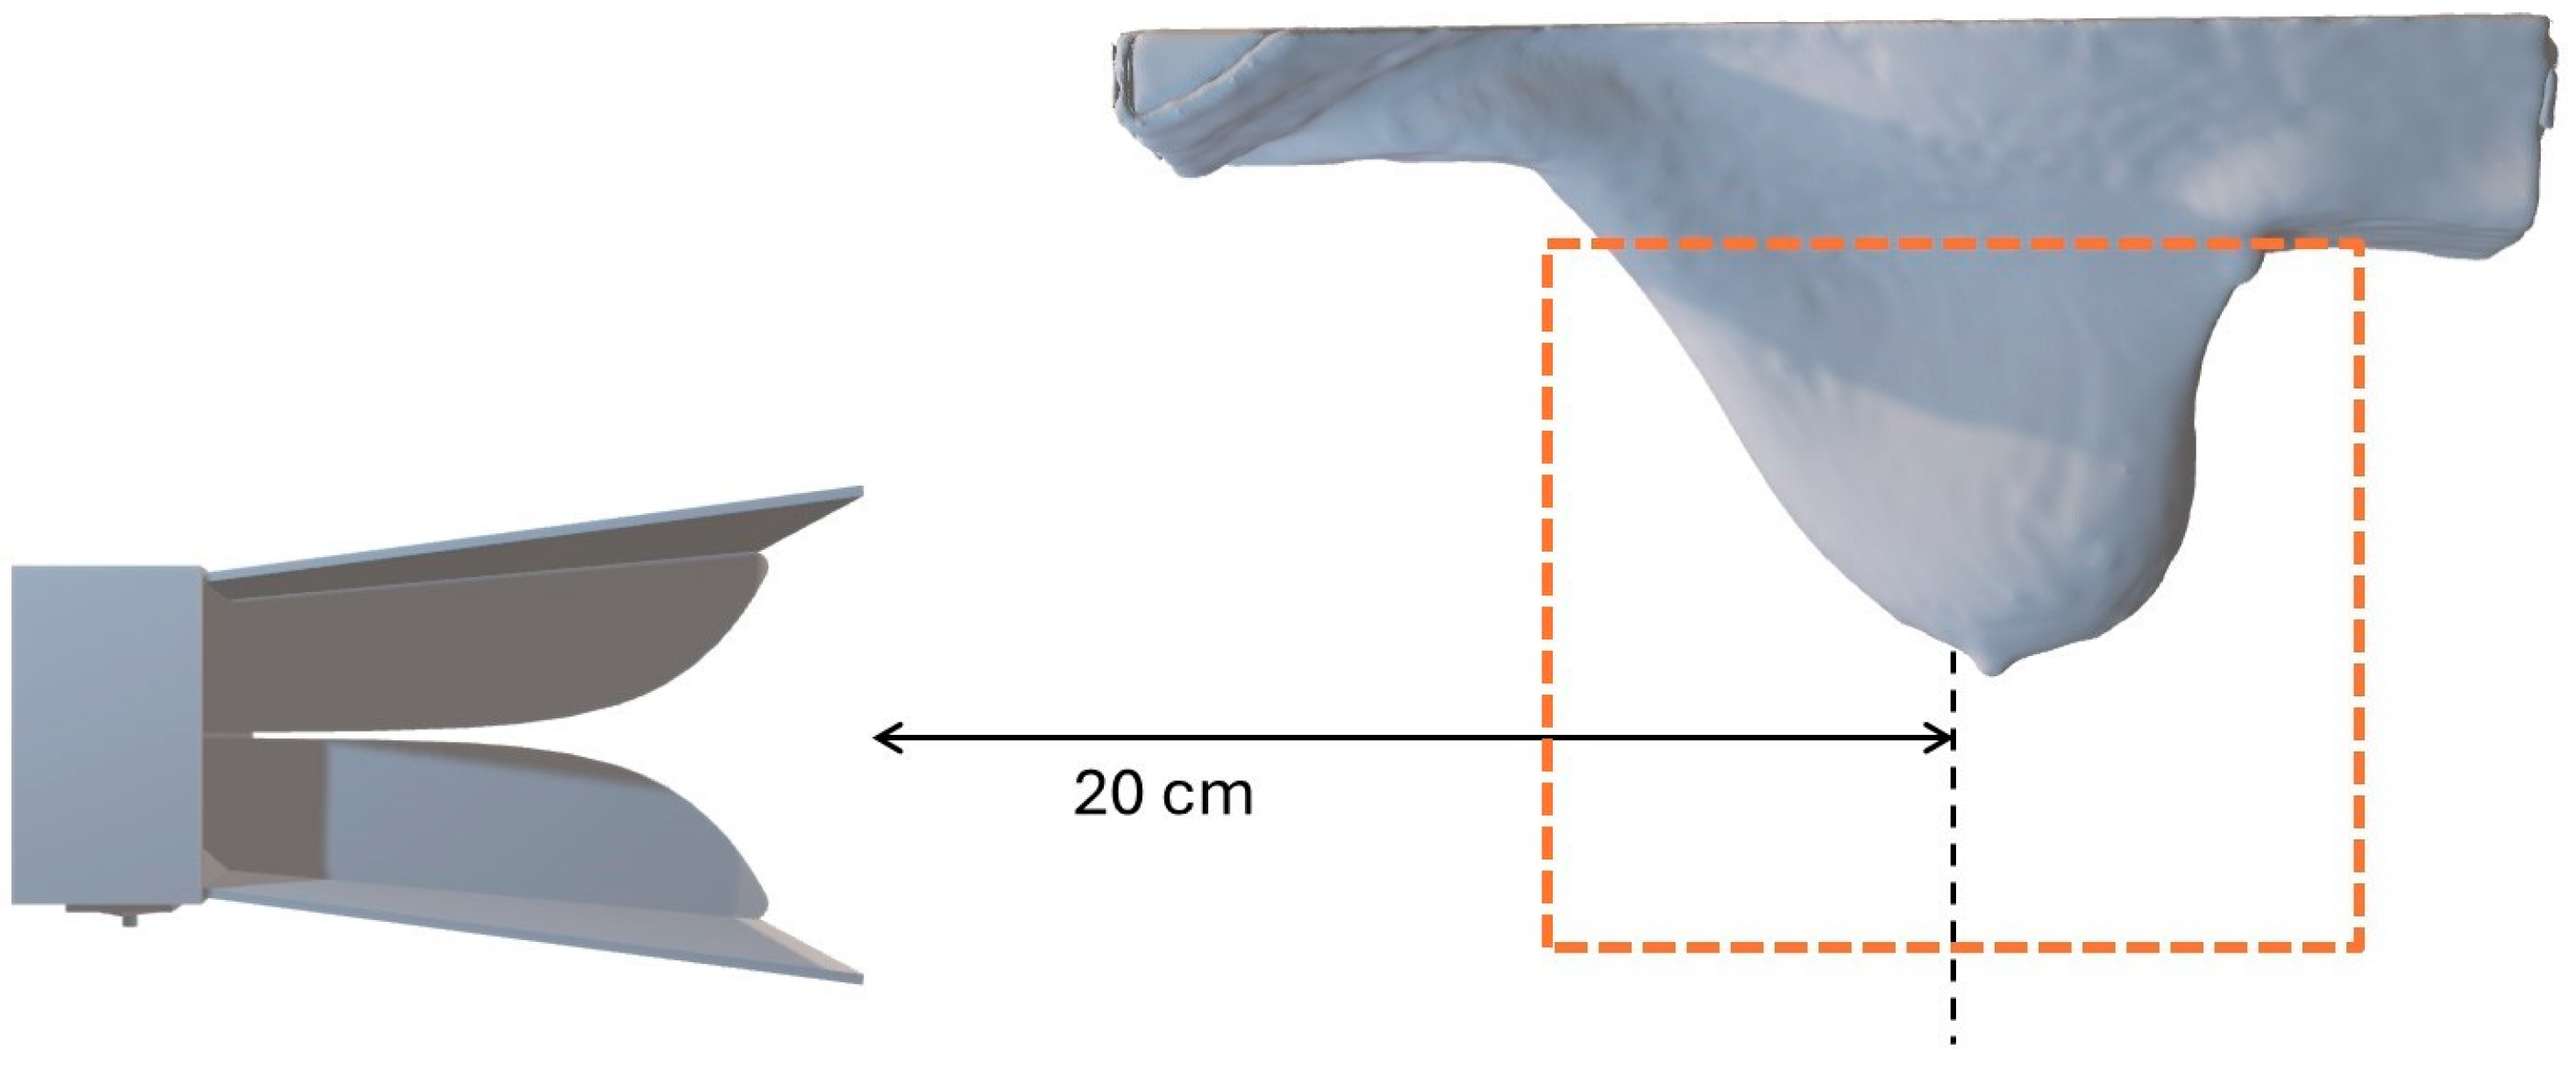
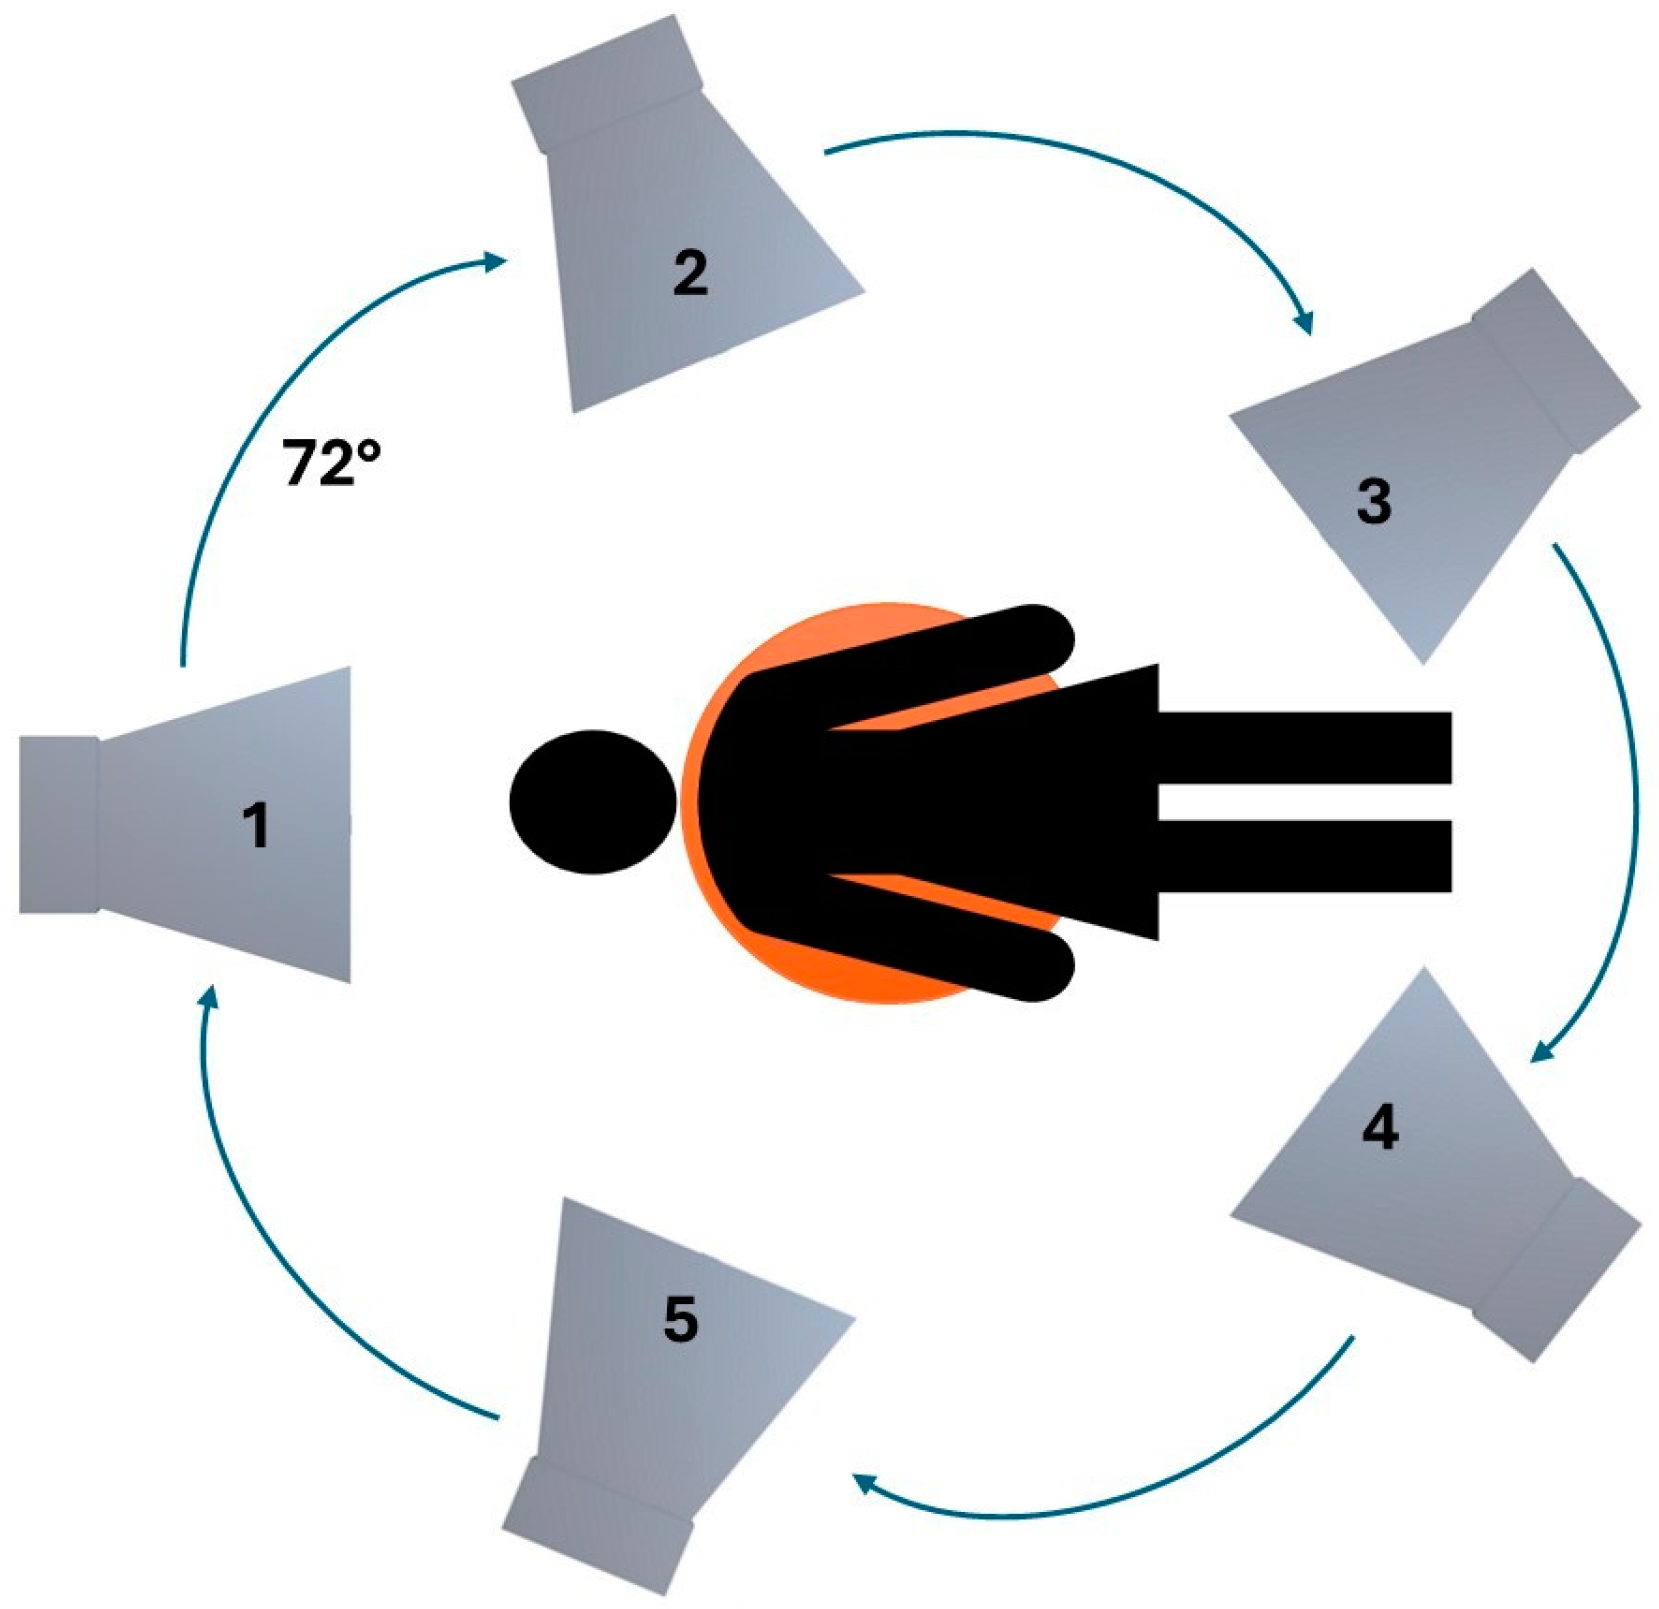
2.2. Hardware Configuration

MammoWave is one of the MI devices used in clinical studies [13]. Similar architectures can be found in the SAFE (MITOS medical technologies, Istanbul, Turkey) [22] and Wavelia (MVG industries, Villejust, France) [23] devices. All three operate with S-parameters: MammoWave uses two antennas, one for transmission and one for reception, while the other two devices have multiple antennas and a switch to perform both functions. They operate within a similar frequency range. Differently from both MammoWave and SAFE, the Wavelia system has its antennas immersed in a coupling liquid. The MammoWave device works in the frequency range from 1 GHz to 9 GHz with an incident power of 1 mW and uses a moving Vivaldi antenna in reception to collect the signal scattered from the object under exam in various positions for every stationary configuration of the transmitting horn antenna. The five transmitting antennae assume five stationary positions uniformly distributed around the breast holder, while the receiving antenna moves in steps of 4.5° to measure the signal from each transmitting position [11]. In particular, experimentally, the device works by employing 10 transmitting positions, displaced in 5 sections, with a slight tilt from the central position of each section, in order to average the acquisitions two by two. Simulations were performed at the frequencies of 2 GHz, 4 GHz, 6 GHz, and 8 GHz to cover the wide range of frequencies used in the MI system. All the breast models were studied considering all five central positions of the horn antenna. These positions are presented in Figure 3 and are numbered from 1 to 5. The Vivaldi antenna was included in the simulated problem with model #1 at a later stage in order to determine its impact on the estimated temperature increases. Three angles between the transmitting and the receiving antennas were simulated. The letters A, B, and C denote the three positions of the receiving antenna, as shown in Figure 4.

2.3. Mathematical Modeling

The EM problem was simulated in Sim4Life (version 7.2, https://sim4life.swiss/ accessed on 30 September 2024), which implements a finite-difference time-domain solver with absorbing boundary conditions implemented with perfectly matched layers (PML). The anatomical models were discretized in voxels, whose dimensions range from 7 mm in the background to 1 mm in the antenna and breast region. The size of the computational domain is 1000 mm × 362 mm × 1000 mm, with an additional padding of 300 mm × 20 mm × 300 mm. This allows for neglecting possible spurious reflection effects in the region of interest that may arise from imperfect absorption conditions on the boundaries. To avoid missing any detail or symmetry, it was necessary to use a finer mesh of 0.4 mm in the power supply, represented by a coaxial cable connected to the horn antenna. In the breast, a mesh with a resolution not larger than 1 mm ensured good accuracy in calculating the SAR distribution because the penetration depth at the highest considered frequency is equal to 2.4 mm. Results were scaled to an input power of 1 mW, equal to that used by the MammoWave system. Heat transfer in biological tissues was modeled mathematically by Pennes’ equation [24], which, with the temperature increase θ (K) as unknown, is given by
ρ C θ t = · k θ   - h b θ + Q em
where C is the specific heat capacity (J·kg−1·K−1), ρ is the mass density (kg·m−3), t is time (s), k is the thermal conductivity (W·m−1·K−1), hb is the perfusion coefficient (W· m−3·K−1), and Qem is representing the EM heat-source density (W·m−3). The temperature increase as unknown allows us to write Pennes’ equation without explicitly including the metabolic heat and the blood temperature, which are highly subject-dependent parameters [24]. EM heat source density is expressed as:
Q em = σ E 2 2 = ρ   SAR
where |E| is the peak value of the electric field generated in the considered point of tissue (V·m−1), σ the electric conductivity of the tissue (S·m−1), and SAR the specific absorption rate of the radiation in the tissue (W·kg−1). Because of the short duration of the exposure with respect to the time scale of the thermal conduction in biological tissues, the precautionary hypothesis of adiabatic heating was assumed, namely both the diffusion of heat towards neighbor voxels (described in the equation by the term with thermal conductivity) and the diffusion towards the blood (described by the term with the perfusion coefficient) were neglected. Thus, SAR and temperature increase became linearly related as follows:
θ = t e C SAR
where te is the duration of exposure (s). Henceforth, the duration of exposure is set to te = 15 s. Over the entire duration of a single breast diagnostic exam, the active time of the VNA was estimated as the product of 10 ms (VNA ignition time for every signal transmission) times 1601 (number of steps of frequency sampling, 5 MHz each, in the range from 1 GHz to 9 GHz) times 800 (number of combinations of 10 transmitting, 5 positions each one with 2 transmissions, and 80 receiving positions scanned with a two-port VNA) [11]. Therefore, 15 s is an overestimation of the actual duration of exposure. Moreover, it is worth noting that the active time should be distributed within the entire examination, which lasts about 8 min, obtaining a low-duty cycle. However, to obtain conservative results, 15 s of continuous exposure was considered for each of the five positions of the transmitting antenna chosen in this study and for each selected frequency. The electrical properties of the healthy tissues were assigned according to the IT’IS Foundation database [25] and assumed to be invariant with respect to temperature. Values of the specific heat capacity of the different breast tissues, including cancer, were set for every tissue [26]. The specific heat capacity of cancer was assigned to the benign tumor tissue as well. Regarding the mass density, its correlation with the tissue water content was exploited. Precisely, a linear regression between the water content of the skin, breast gland, adipose tissue, and muscle [26] and the mass density of the corresponding tissues [25] was used to obtain the breast cancer mass density given its water content [26]. The same mass density was also assigned to the benign tumor. The values set for all the thermal parameters are shown in Table 1. The EPs of benign and malignant tumors were set, distinguishing between breast benign abnormalities and cancer at the frequency of 2 GHz, 4 GHz, 6 GHz, and 8 GHz, according to the literature [4]. For each tissue, the peak SAR value and its position were extracted from the simulation results. The collected SAR values were used to compute the maximum temperature increase inside each breast tissue. To further investigate the sensitivity of simulation results with respect to the used input parameter values, a 10% variation was taken into account for these values. Precisely, two additional simulations were performed in a later stage at the intermediate frequency of 6 GHz and with the horn antenna in the position leading to the largest temperature increase in model #1. In each additional simulation, the values of the electrical and thermal properties of breast tissues were decreased or increased by 10%. All the properties were increased or decreased together, assuming that the variation in the properties is due to a variation in the tissue water content.

3. Results

The SAR distributions simulated under the conditions described above were extracted for each anatomical breast model. To quantify the level of conservativeness of the adiabatic heating assumption, the temperature increase in the healthy model #1 at 2 GHz with the antenna in position 1 was computed with the thermal transient solver of Sim4Life, taking into account both diffusion and perfusion, with parameters from the IT’IS Foundation database (version 4.2) [25]. The computed values were everywhere lower than the ones provided by the method adopted in this work, with a peak of 2.46 μK against 7.42 μK. Peaks of temperature increase in the healthy breast model #1 deduced from the peaks of SAR with the horn antenna in the five considered positions at each selected frequency are reported in Table 2. Table 3 presents the results for model #2, which includes a benign anomaly highlighted in the table insets as red dots. Table 4 reports the values for breast model #3, which includes a malignant tumor, highlighted using red dots in the table insets. The obtained values for models #4 and #5 are shown in Table 5 and Table 6, respectively. SAR distributions on the surface of the five exposed models are shown in Figure 5. The effect of the receiving Vivaldi antenna in the field distribution was tested for model #1, considering the horn antenna in position 3 transmitting at 6 GHz, which is the scenario showing the highest temperature increase in Table 2. Results are reported in Table 7. The sensitivity of the results with respect to variations in electrical and thermal properties of tissues was investigated for model #1, considering the horn antenna in position 3 transmitting at 6 GHz. Results are reported in Table 8. In the same scenario, SAR value sensitivity to mesh refinement was analyzed. The mesh density in the breast model domain was decreased by 50%, resulting in a 2 mm element size. Table 9 presents a comparison between temperature increases in this coarsened mesh assessment versus the original mesh configuration. The results suggest that any potential underestimation of SAR values when using a mesh dimension of 1 mm instead of 0.5 mm would not lead to harmful oversight of the actual temperature increases in tissue.

4. Discussion

Testing the safety of microwave mammography through virtual experiments was the aim of this work, with a focus directly on the biological effect, namely the induced temperature increase. The highest temperature increase observed in this analysis is 58.5 μK. Such a small temperature increase is related to the low incident power level at which the MammoWave system operates (1 mW). Other MI devices could operate at different power levels; however, the linear relationship between temperature and power ensures that the temperature increase at these frequencies remains very low even at much higher powers, such as up to 1 W. In this case, linearity assures that the temperature peak will increase by three orders of magnitude, with a maximum temperature increase lower than 60 mK. Simulations showed that the breast absorbs energy from the EM waves, whose intensity becomes attenuated as the radiation penetrates the biological tissue. In most cases, the temperature peak occurs in fibroglandular tissue. Specifically, this happens throughout the range of frequencies analyzed in models #1, #2, and #3 up to 6 GHz, except for model #1 with the horn antenna in position 5 transmitting at 4 GHz and for model #3 with the horn antenna in position 1 transmitting at 4 GHz, where the temperature peak was found in the skin. At 8 GHz, temperature peaks tend to move from the fibroglandular tissue to the skin for all models. Precisely, this happens for model #1 with the horn antenna in positions 4 and 5, for model #2 with all horn positions except number 2, and for model #3 with all the considered antenna positions. In models #2 and #3, the tumor tissue experiences the smallest temperature increase. This could be due to the fact that tumors receive a rather attenuated field, being located in a more internal area of the breast. In addition, it was mostly found that the benign tumor has a higher absorption than the malignant tumor despite the lower conductivity. This may depend on the fact that the tumor in model #3 is deeper than the one in model #2. Larger temperature increases could be observed in more superficial tumors that were not included in the investigation. However, the order of magnitude of the obtained results reassures us of the absence of thermal hazards even in such a situation. In order to better understand the variability of the presented results, the investigation took into account some parameters that could affect the temperature estimation, including breast density and the presence of a receiving antenna. The influence of the former parameter was studied in models #4 and #5. The temperature peak is located in the skin for model #4 at 6 GHz, 8 GHz, and 2 GHz with the horn antenna in position 4, whereas for model #5, it is in the fibroglandular tissue for all the considered frequencies except 8 GHz, excluding the horn antenna in position 5. When breast density is low, as in model #4 (9.3% of fibroglandular tissue), the energy of the radiation tends to be primarily dissipated in the outermost tissue, whereas in the case of high breast density, as in model #5 (25% of fibroglandular tissue), the energy of the radiation is dissipated in a relevant amount also in the most superficial areas of the glandular tissue. The considered MI system has an antenna configuration in which the transmitting and the receiving antennas operate in distinct moveable positions. When the receiving Vivaldi antenna is placed between the transmitting horn antenna and the breast model, the emitted signal can be distorted. Indeed, the results collected in Table 7 show that when the transmitter and the receiver are aligned, a reduction in the temperature peak is found in fat (−69.7%), fibroglandular tissue (−79.7%), and skin (−39.2%). In this case, the receiver, acting as a scatterer, tends to spread the transmitted EM field outward, and the signal received by the breast gets lower, with a reduced temperature increase compared to the case without the receiving antenna. When the transmitter and the receiver are at 30° from each other, an increase in the peak temperature was found in fat (+11.8%), fibroglandular tissue (+53.1%), where the strongest was observed, and skin (+5.4%). Finally, when the transmitter and the receiver are at 60° from each other, the temperature peak increases in the fat (+13.3%) and in the fibroglandular tissue (+14.9%) but decreases in the skin (6.2%). These results show that if the Vivaldi antenna is shifted with respect to the horn antenna, it can focus the EM waves toward the breast, causing a higher temperature increase than in the case without the receiving antenna. Other positions for the Vivaldi antenna were not studied because if the angle between the two antennas is greater than 90°, the impact was assumed to be negligible. Considering the small temperature elevation that occurs even in the worst case, the presence of the receiving antenna acting as a scatterer does not compromise the safety of the system. Varying the electrical and thermal properties of breast tissues of ±10% showed a temperature increase consistent with that obtained with nominal values, with a variation related to the applied changes of at most 15%. A thorough analysis of the influence of tissue property variability would require a stochastic dosimetry approach [27], but considering the extremely low levels of thermal effects, a deterministic approach has been chosen. The outcome builds upon the previous findings and supports the conclusion that the MI system can be considered safe.

Comparison with Existing Studies About the Safety of MI

This section compares the findings of the current study regarding the safety of the MI system with results from other relevant studies in the field. In [15], a dosimetric analysis on a monostatic radar-based MI system is proposed, employing a geometrical three-layer phantom with inclusions simulating tumors of various sizes and a microstrip patch antenna functioning as both transmitter and receiver. The SAR and the temperature increase induced in the phantom were computed at 4 GHz, 6 GHz, and 8 GHz, taking into account various distances of the antenna from the phantom and different dielectric property values to simulate the influence of the patient’s age. In the absence of tumors, the highest SAR is found in the skin layer, while it is found in the tumor if it is present. Temperature analysis reveals a slight increase, with maximum values of 55 mK in healthy tissue and 95 mK in cancerous tissue, with distribution patterns varying for continuous exposure times ranging from 10 to 60 min. The temperature variations are approximately four orders of magnitude higher than those reported in the current research. However, this discrepancy can be attributed to differences in system architecture and to the longer simulated exposure time, which is at least 10 min. Additionally, the model used in this study does not include fibroglandular tissue, which is found to be the primary energy-absorbing tissue in the current research. Simulating a realistic anatomical structure allows for better consideration of the breast’s heterogeneities, enhancing the accuracy of the analysis. In [16], a worst-case scenario was analyzed involving the exposure of a 3D anatomical breast model to a plane wave at various frequencies in the 0.4–9 GHz range. The input surface power density of 10 W/m2, maximum exposure level in the frequency range of interest according to [28], resulted in SAR peak values located in the skin higher than those observed in the current study. Despite differences in the physical nature of the source and input power, the increasing trend of SAR peak values with frequency reported in this study agrees with the trend of temperature rise with frequency calculated in the current work. To produce a quantitative comparison, the averaged incident surface power density was computed on the breast surface from a simulation performed on free space (without the breast tissues), yielding a value of 0.005 W/m2 at a frequency of 2 GHz. Using this value, the SAR was scaled to an input surface power density of 10 W/m2, resulting in a peak SAR of 2.97 W/kg in the fibroglandular tissue. This value is lower than the local peak SAR at 2 GHz reported in the other study, which is approximately 8 W/kg. Nevertheless, the order of magnitude of the SAR is consistent between the two studies. Experimental measurements available in the literature [17] show that the SAR value due to a Vivaldi antenna transmitting at 8.5 GHz with an incident power of 1 mW is in the order of 1 mW/kg. As can be seen in Figure 5, the results of this study are in the same order of magnitude, although a horn antenna was used in transmission. Moreover, the computation presented here shows that, despite the adopted conservative model, the thermal effect is small enough to be considered negligible. In [17], a variation of ±10% at 10 mW in the experimental SAR with respect to simulated SAR is reported. Since the current study does not provide an experimental setup for measuring SAR, this expected variation in the case of simulated data can be used, asserting that a ±10% variation in computed SAR values and, consequently, in temperature increases does not change the biological effect on breast tissues, which remains negligible (conservatively, the maximum temperature increase of 58.5 μK could be corrected with a 10% increase to 64.3 μK). In [18], a SAR evaluation on a hand-held impulse-radar breast cancer detector, designed for placement on the breast with the patient in the supine position, has been conducted to ensure patient safety. With an output power of 0.045 mW transmitted through a single antenna at a time, the maximum 1g averaged SAR values in the breast were found to range from 0.0118 W/kg to 0.0246 W/kg across the frequency range from 3.1 GHz to 10.6 GHz. Due to significant differences in the architecture and positioning of the device relative to the breast, these results cannot be directly extended to or compared with the analysis conducted in the current work. In concluding the overall analysis, as shown in [17], it would be beneficial to conduct experimental trials to validate these results; however, the current MI system does not support SAR or temperature measurements. Nevertheless, Sim4Life software has been validated multiple times in dosimetric and thermal studies, for example, in [29], and the fact that the found temperature increases are extremely low reaffirms the fact that even significant variations between simulated and measured data would not compromise the safety of the diagnostic examination. Rigorous computational methods, coupled with conservative safety margins, provide a robust framework for assessing potential thermal risks in medical imaging. Moreover, a cross-platform validation has been performed by comparing the Sim4Life simulation of a simplified test case with an equivalent model implemented in CST Microwave Studio (version 2023, https://www.3ds.com/products/simulia/cst-studio-suite accessed on 1 March 2025). The same transmitting horn antenna model has been implemented in both platforms, with a target consisting of a cylindrical phantom containing homogeneous material with electrical conductivity of 2 S/m and relative permittivity of 20. The comparative analysis revealed consistent results between these independent computational platforms, confirming the reliability of the presented results.

5. Conclusions

The small temperature variations observed in this study support the conclusion that the exposure of human breast tissues to the electromagnetic field generated by the MI system is not harmful, making adverse thermal effects highly unlikely during exams. In the perspective that the receiving antenna, acting as a scatterer, significantly influences the EM field and SAR distribution, it would be relevant to explore alternative configurations for the receiving system, such as the adoption of metamaterials. Moreover, there is the possibility to optimize the performance of the device, for example, by modulating the input power when the signal-to-noise ratio is altered by the presence of a scatterer (as the receiving antenna) or if it is necessary to enhance output images. This is possible because of the large safety margin in the transmitted power level identified, taking into account the linear dependency of the temperature increase on the transmitted power level itself. Considering a potential patient-specific approach, the MI system can be leveraged to calculate differential power between input and output through signal analysis, enabling individualized SAR estimation within the breast. This methodology would allow safety assessments tailored to each patient’s unique characteristics. In conclusion, microwave examination can be performed without harmful thermal effects due to EM field exposure.

Author Contributions

Conceptualization, A.R., L.Z., O.B., G.T. and A.A.; Methodology, A.R., L.Z. and A.A.; Validation, L.Z., O.B., G.T. and A.A.; Formal analysis, A.R., L.Z. and A.A.; Investigation, A.R., G.T. and A.A.; Resources, O.B. and G.T.; Data curation, A.R. and A.A.; Writing—original draft, A.R.; Writing—review & editing, L.Z., O.B., G.T. and A.A.; Visualization, A.R. and A.A.; Supervision, O.B. and A.A. All authors have read and agreed to the published version of the manuscript.

Funding

This work was supported by the funding received by the MammoScreen project, co-funded by the European Union’s Horizon research and innovation framework programme, Grant agreement 101097079. Views and opinions expressed are however those of the authors only and do not necessarily reflect those of the European Union, HaDEA or the UK R&I agency. Neither the European Union nor the granting authority can be held responsible for them.

Institutional Review Board Statement

Not applicable.

Informed Consent Statement

Not applicable.

Data Availability Statement

The original data presented in the study are openly available in Zenodo “Dataset related to article “Safety Assessment of Microwave Breast Imaging: Heating Analysis on Digital Breast Phantoms” at DOI: 10.5281/zenodo.15194948.

Conflicts of Interest

G.T. reports a relationship with Umbria Bioengineering Technologies that includes employment and equity or stocks. Gianluigi Tiberi is shareholder of UBT—Umbria Bioengineering Technology. For all the other authors, there is no financial/personal interest or belief that could affect their objectivity.

References

  1. Arnold, M.; Morgan, E.; Rumgay, H.; Mafra, A.; Singh, D.; Laversanne, M.; Vignat, J.; Gralow, J.R.; Cardoso, F.; Siesling, S.; et al. Current and future burden of breast cancer: Global statistics for 2020 and 2040. Breast 2022, 66, 15–23. [Google Scholar] [CrossRef]
  2. Tagliafico, A.S.; Houssami, N. Towards consensus on managing high mammographic density in population breast screening? Breast 2023, 69, 422–426. [Google Scholar] [CrossRef] [PubMed]
  3. Aldhaeebi, M.A.; Alzoubi, K.; Almoneef, T.S.; Bamatraf, S.M.; Attia, H.; Ramahi, O.M. Review of Microwaves techniques for breast cancer detection. Sensors 2020, 20, 2390. [Google Scholar] [CrossRef]
  4. Cheng, Y.; Fu, M. Dielectric properties for non-invasive detection of normal, benign, and malignant breast tissues using microwave theories. Thorac. Cancer 2018, 9, 459–465. [Google Scholar] [CrossRef]
  5. Vispa, A.; Sani, L.; Paoli, M.; Bigotti, A.; Raspa, G.; Ghavami, N.; Caschera, S.; Ghavami, M.; Duranti, M.; Tiberi, G. UWB device for breast microwave imaging: Phantom and clinical validations. Measurement 2019, 146, 582–589. [Google Scholar] [CrossRef]
  6. Solis-Nepote, M.; Reimer, T.; Pistorius, S. An air-operated bistatic system for breast microwave radar imaging: Pre-clinical validation. In Proceedings of the 41st Annual International Conference of the IEEE Engineering in Medicine and Biology Society (EMBC), Berlin, Germany, 23–27 July 2019; IEEE: Piscataway, NJ, USA, 2019; pp. 1859–1862. [Google Scholar] [CrossRef]
  7. Fontaine, G.; Pistorius, S. Initial characterization of a portable breast microwave detection device. In Proceedings of the 19th International Symposium on Antenna Technology and Applied Electromagnetics (ANTEM), Winnipeg, MB, Canada, 8–11 August 2021; IEEE: Piscataway, NJ, USA, 2021; pp. 1–2. [Google Scholar] [CrossRef]
  8. Kranold, L.; Taherzadeh, M.; Nabki, F.; Coates, M.; Popović, M. Microwave Breast Screening Prototype: System Miniaturization with IC Pulse Radio. IEEE J. Electromagn. RF Microw. Med. Biol. 2021, 5, 168–178. [Google Scholar] [CrossRef]
  9. Kikkawa, T.; Masui, Y.; Toya, A.; Ito, H.; Hirano, T.; Maeda, T.; Ono, M.; Murasaka, Y.; Imamura, T.; Matsumaru, T.; et al. CMOS Gaussian Monocycle Pulse Transceiver for Radar-Based Microwave Imaging. IEEE Trans. Biomed. Circuits Syst. 2022, 14, 1333–1345. [Google Scholar] [CrossRef]
  10. Manufacturers MD. Available online: https://health.ec.europa.eu/medical-devices-topics-interest/reprocessing-devices/manufacturers-md_en (accessed on 10 October 2024).
  11. Sani, L.; Vispa, A.; Loretoni, R.; Duranti, M.; Ghavami, N.; Sánchez-Bayuela, D.A.; Caschera, S.; Paoli, M.; Bigotti, A.; Badia, M.; et al. Breast lesion detection through MammoWave device: Empirical detection capability assessment of microwave images’ parameters. PLoS ONE 2021, 16, e0250005. [Google Scholar] [CrossRef]
  12. Shere, M.; Lyburn, I.; Sidebottom, R.; Massey, H.; Gillett, C.; Jones, L. MARIA® M5: A multicentre clinical study to evaluate the ability of the Micrima radio-wave radar breast imaging system (MARIA®) to detect lesions in the symptomatic breast. Eur. J. Radiol. 2019, 116, 61–67. [Google Scholar] [CrossRef]
  13. Porter, E.; O’Loughlin, D. Pathway to Demonstrating Clinical Efficacy of Microwave Breast Imaging: Qualitative and Quantitative Performance Assessment. IEEE J. Electromagn. RF Microw. Med. Biol. 2022, 6, 439–448. [Google Scholar] [CrossRef]
  14. International Commission on Non-Ionizing Radiation Protection (ICNIRP). Guidelines for limiting exposure to electromagnetic fields (100 kHz to 300 GHz). Health Phys. 2020, 118, 483–524. [Google Scholar] [CrossRef]
  15. Bhargava, D.; Rattanadecho, P. Microwave imaging of breast cancer: Simulation analysis of SAR and temperature in tumors for different age and type. Case Stud. Therm. Eng. 2022, 31, 101843. [Google Scholar] [CrossRef]
  16. Santorelli, A.; Vander Schueren, M.; Popovic, M. SAR levels in microwave breast imaging: 3-D safety assessment with plane-wave illumination. Asia Pac. Microw. Conf. 2011, 2011, 481–484. [Google Scholar]
  17. Kumari, V.; Sheoran, G.; Kanumuri, T. SAR analysis of directive antenna on anatomically real breast phantoms for microwave holography. Microw. Opt. Technol. Lett. 2020, 62, 466–473. [Google Scholar] [CrossRef]
  18. Song, H.; Sasada, S.; Kadoya, T.; Okada, M.; Arihiro, K.; Xiao, X.; Kikkawa, T. Detectability of Breast Tumor by a Hand-held Impulse-Radar Detector: Performance Evaluation and Pilot Clinical Study. Sci. Rep. 2017, 7, 16353. [Google Scholar] [CrossRef]
  19. Pelicano, A.C.; Gonçalves, M.C.T.; Godinho, D.M.; Castela, T.; Orvalho, M.L.; Araújo, N.A.M.; Porter, E.; Conceição, R.C. Development of 3D MRI-based anatomically realistic models of breast tissues and tumors for microwave imaging diagnosis. Sensors 2021, 21, 8265. [Google Scholar] [CrossRef]
  20. Edmonds, C.E.; O’Brien, S.R.; Conant, E.F. Mammographic breast density: Current assessment methods, clinical implications, and future directions. Semin. Ultrasound CT MR 2023, 44, 35–45. [Google Scholar] [CrossRef]
  21. Singh, N.; Joshi, P.; Singh, D.K.; Shamarendra, N.; Anurag, G. Volumetric breast density evaluation using fully automated Volpara software, its comparison with BIRADS density types and correlation with the risk of malignancy. Egypt. J. Radiol. Nucl. Med. 2022, 53, 118. [Google Scholar] [CrossRef]
  22. Janjic, A.; Cayoren, M.; Akduman, I.; Yilmaz, T.; Onemli, E.; Bugdayci, O.; Aribal, M.E. SAFE: A Novel Microwave Imaging System Design for Breast Cancer Screening and Early Detection—Clinical Evaluation. Diagnostics 2021, 11, 533. [Google Scholar] [CrossRef]
  23. Moloney, B.M.; McAnena, P.F.; Abd Elwahab, S.M.; Fasoula, A.; Duchesne, L.; Gil Cano, J.D.; Glynn, C.; O’Connell, A.; Ennis, R.; Lowery, A.J.; et al. Microwave Imaging in Breast Cancer—Results from the First-In-Human Clinical Investigation of the Wavelia System. Acad. Radiol. 2022, 29, S211–S222. [Google Scholar] [CrossRef]
  24. Zilberti, L.; Arduino, A.; Bottauscio, O.; Chiampi, M. Parametric analysis of transient skin heating induced by terahertz radiation. Bioelectromagnetics 2014, 35, 314–323. [Google Scholar] [CrossRef] [PubMed]
  25. Baumgartner, C.; Hasgall, P.A.; Di Gennaro, F.; Neufeld, E.; Lloyd, B.; Gosselin, M.C.; Payne, D.; Klingenböck, A.; Kuster, N. IT’IS Database for Thermal and Electromagnetic Parameters of Biological Tissues; v4.2; IT’IS Foundatio: Zurich, Switzerland, 2024. [Google Scholar] [CrossRef]
  26. Vaupel, P.; Piazena, H. Strong correlation between specific heat capacity and water content in human tissues suggests preferred heat deposition in malignant tumors upon electromagnetic irradiation. Int. J. Hyperth. 2022, 39, 987–997. [Google Scholar] [CrossRef] [PubMed]
  27. Bottauscio, O.; Zanovello, U.; Arduino, A.; Zilberti, L. Polynomial chaos expansion of SAR and temperature increase variability in 3 T MRI due to stochastic input data. Phys. Med. Biol. 2024, 69, 125005. [Google Scholar] [CrossRef] [PubMed]
  28. Health Canada. Limits of Human Exposure to Radiofrequency Electromagnetic Fields in the Frequency Range from 3 kHz to 300 GHz: Safety Code 6; Health Canada: Ottawa, ON, Canada, 2009. [Google Scholar]
  29. Muratoglu, R.; Gerster, D.; Nadobny, J.; Hansch, A.; Krahl, P.; Veltsista, P.D.; Ghadjar, P. Comparisons of computer simulations and experimental data for capacitive hyperthermia using different split-phantoms. Int. J. Hyperth. 2024, 41, 2416999. [Google Scholar] [CrossRef] [PubMed]
Figure 1. Positioning of the horn antenna and an anatomical breast model. The orange dotted line highlights the region of interest (ROI).
Applsci 15 04262 g001
Figure 2. Digital breast phantoms used in simulations. From left to right, a left healthy breast (model #1), a right breast with two benign tumors highlighted in red (model #2), a right breast with two malignant tumors highlighted in red (model #3), and two left healthy breasts (models #4 and #5).
Applsci 15 04262 g002
Figure 3. Studied positions of the transmitting horn antenna numbered from 1 to 5.
Applsci 15 04262 g003
Figure 4. (a) Configuration of horn and Vivaldi antennas with respect to the breast model; (b) three positions assumed by the Vivaldi antenna in the cases simulated labeled as C, D, and E, including the transmitting antenna.
Applsci 15 04262 g004
Figure 5. SAR distributions on the breast model surfaces computed with the horn antenna transmitting at 2 GHz in position 4.
Applsci 15 04262 g005
Table 1. Values of specific heat capacity, water content, and mass density of breast tissues.
TissueSpecific Heat Capacity (J·kg−1·K−1)Water Content
(%)
Mass Density
(kg·m−3)
Fat230050911
Gland3000601041
Skin3300601109
Tumor3850801179
Table 2. Peak of temperature increase (μK) varying frequency, breast tissue, and horn antenna position. Bolded values identify, for each frequency and antenna position, the tissue with the highest temperature increase.
Model #1Horn Antenna Position
f [GHz]Breast tissueApplsci 15 04262 i0011Applsci 15 04262 i0022Applsci 15 04262 i0033Applsci 15 04262 i0044Applsci 15 04262 i0055
2Fat1.272.403.264.191.84
Gland7.4213.017.827.711.7
Skin2.552.986.029.022.38
4Fat2.072.594.652.743.92
Gland13.87.7513.912.35.46
Skin5.354.788.978.815.79
6Fat4.604.516.944.415.53
Gland34.016.438.228.614.9
Skin11.89.6011.217.312.7
8Fat3.174.954.744.116.00
Gland22.421.429.519.912.5
Skin11.215.619.923.615.8
Table 3. Peak of temperature increase (μK) varying frequency, breast tissue, and horn antenna position. Bolded values identify, for each frequency and antenna position, the tissue with the highest temperature increase.
Model #2Horn Antenna Position
f [GHz]Breast tissueApplsci 15 04262 i006Applsci 15 04262 i007Applsci 15 04262 i008Applsci 15 04262 i009Applsci 15 04262 i010
2Fat1.313.153.532.913.67
Gland5.2614.112.718.313.6
Skin2.276.216.175.492.95
Tumor1.273.410.650.560.70
4Fat2.512.656.743.294.56
Gland7.7010.832.910.816.1
Skin3.265.059.555.394.49
Tumor2.504.160.400.200.30
6Fat4.085.157.205.644.08
Gland14.020.729.627.717.1
Skin8.419.1714.115.58.41
Tumor1.582.100.460.040.38
8Fat3.483.539.553.613.29
Gland8.7217.323.613.611.8
Skin14.816.128.028.216.2
Tumor0.640.760.160.020.15
Table 4. Peak of temperature increase (μK) varying frequency, breast tissue, and horn antenna position. Bolded values identify, for each frequency and antenna position, the tissue with the highest temperature increase.
Model #3Horn Antenna Position
f [GHz]Breast tissueApplsci 15 04262 i011Applsci 15 04262 i012Applsci 15 04262 i013Applsci 15 04262 i014Applsci 15 04262 i015
2Fat1.273.524.862.080.574
Gland3.4513.511.310.93.20
Skin1.894.398.814.741.57
Tumor0.591.190.430.630.39
4Fat1.003.087.002.331.30
Gland3.607.9624.66.564.11
Skin3.645.1113.13.912.19
Tumor0.910.170.040.020.40
6Fat3.414.1711.33.102.93
Gland14.715.523.513.87.05
Skin8.127.8912.69.395.52
Tumor0.360.030.020.010.17
8Fat2.633.475.403.292.02
Gland10.615.315.918.59.72
Skin14.919.627.719.713.3
Tumor0.420.0040.0030.0030.06
Table 5. Peak of temperature increase (μK) varying frequency, breast tissue, and horn antenna position. Bolded values identify, for each frequency and antenna position, the tissue with the highest temperature increase.
Model #4Horn Antenna Position
f [GHz]Breast tissueApplsci 15 04262 i001Applsci 15 04262 i002Applsci 15 04262 i003Applsci 15 04262 i004Applsci 15 04262 i005
2Fat0.360.921.741.120.89
Gland1.494.144.915.232.42
Skin1.101.723.155.592.00
4Fat1.060.701.011.471.06
Gland3.423.153.656.933.13
Skin2.052.342.944.113.03
6Fat1.201.422.521.872.17
Gland2.373.394.054.773.63
Skin4.695.079.528.114.96
8Fat1.561.653.912.771.93
Gland3.734.206.844.533.27
Skin10.611.515.315.510.8
Table 6. Peak of temperature increase (μK) varying frequency, breast tissue, and horn antenna position. Bolded values identify, for each frequency and antenna position, the tissue with the highest temperature increase.
Model #5Horn Antenna Position
f [GHz]Breast tissueApplsci 15 04262 i001Applsci 15 04262 i002Applsci 15 04262 i003Applsci 15 04262 i004Applsci 15 04262 i005
2Fat1.771.891.272.461.07
Gland6.485.706.9915.76.41
Skin2.493.764.384.711.57
4Fat3.071.871.623.392.56
Gland11.97.915.9213.97.93
Skin8.123.873.245.153.50
6Fat3.102.022.712.423.05
Gland10.58.5410.717.517.1
Skin8.256.675.805.945.90
8Fat4.972.122.412.602.36
Gland14.18.286.6311.612.3
Skin15.912.612.713.312.0
Table 7. Peak of temperature increase (μK) varying breast tissue, horn, and Vivaldi antenna position. Bolded values identify, for each antenna’s position, the tissue with the highest temperature increase.
Model #1Horn and Vivaldi Antenna Position
f [GHz]Breast tissueApplsci 15 04262 i0163CApplsci 15 04262 i0173DApplsci 15 04262 i0183E
6Fat2.107.767.86
Gland7.7458.543.9
Skin6.8111.810.5
Table 8. Peak of temperature increase (μK) varying breast tissue, horn, and Vivaldi antenna position. Bolded values identify, for each antenna’s position, the tissue with the highest temperature increase.
Model #1Horn Antenna Position
f [GHz]Breast tissueApplsci 15 04262 i003
−10%
Applsci 15 04262 i003
+10%
6Fat7.806.25
Gland43.733.7
Skin11.711.0
Table 9. Peak of temperature increase (μK) varying breast tissue, horn, and Vivaldi antenna position. Bolded values identify, for each antenna’s position, the tissue with the highest temperature increase.
Model #1Horn Antenna Position
f [GHz]Breast tissueApplsci 15 04262 i003
Actual mesh
Applsci 15 04262 i003
Coarser mesh
6Fat6.944.91
Gland38.233.9
Skin11.210.6
Disclaimer/Publisher’s Note: The statements, opinions and data contained in all publications are solely those of the individual author(s) and contributor(s) and not of MDPI and/or the editor(s). MDPI and/or the editor(s) disclaim responsibility for any injury to people or property resulting from any ideas, methods, instructions or products referred to in the content.

