Article

Study on the Mechanical Properties and Interaction Mechanism of Fractured Rock Subjected to Freeze–Thaw Cycles

School of Architecture and Civil Engineering, Xi’an University of Science and Technology, Xi’an 710054, China
*
Author to whom correspondence should be addressed.
Appl. Sci. 2025, 15(8), 4101; https://doi.org/10.3390/app15084101
Submission received: 28 February 2025 / Revised: 29 March 2025 / Accepted: 5 April 2025 / Published: 8 April 2025
(This article belongs to the Special Issue Advances and Challenges in Rock Mechanics and Rock Engineering)

Abstract

:
This study investigates the mechanical behavior of fractured sandstone under various factors, including freeze–thaw cycles, fracture dip angle, roughness, grouting material, and confining pressure. Freeze–thaw and triaxial compression tests were conducted to analyze the effects of individual factors and their interactions on the mechanical properties of sandstone. The results indicate the following: (1) Under independent factor conditions, freeze–thaw cycles generate frost heave forces through the water–ice phase transition, leading to the expansion of microcracks and deterioration of the pore structure, which results in a weakening effect. Grouting material enhances the bonding strength and supporting capacity of the rock sample, roughness improves the anchoring effect of the grout, fracture dip angle improves stress transmission efficiency, and confining pressure increases rock sample density and restricts deformation, all of which exhibit strengthening effects. (2) Interaction analysis revealed three types of interaction mechanisms for the peak stress and elastic modulus of the rock samples: interaction enhancement mechanism, where peak stress or elastic modulus significantly increases when the related factors are at high levels, demonstrating a synergistic strengthening effect; interaction inhibition mechanism, where factors at high levels suppress each other’s strengthening or weakening effects; and interaction reversal mechanism, where the influence trend of certain factors reverses under different conditions. Specifically, the interaction enhancement mechanism for peak stress is observed in the interactions between grouting material and roughness, grouting material and confining pressure, and fracture dip angle and roughness. The interaction inhibition mechanism occurs between grouting material and freeze–thaw cycles and confining pressure and freeze–thaw cycles. For elastic modulus, the interaction enhancement mechanism is observed in the interactions between fracture dip angle and confining pressure, grouting material and roughness, and confining pressure and roughness; the interaction reversal mechanism appears in the interaction between freeze–thaw cycles and fracture dip angle.

1. Introduction

Grouting reinforcement is commonly employed in engineering to enhance the mechanical properties of fissured rock bodies [1]. However, freeze–thaw cycles in the seasonal freezing zone cause the fissure structure to continue developing, which negatively impacts the effectiveness of grouting and leaves the grouted bodies vulnerable to significant geologic hazards [2]. Therefore, studying the evolution of the mechanical properties of freeze–thaw grouted fissured rock bodies in complex environments is crucial for the theoretical development of stability control in rock engineering within the seasonal freezing zone.
Currently, research on the mechanical properties of fractured rock masses under freeze–thaw cycles mainly focuses on the characteristics of different fractures [3,4,5,6,7]. Lu et al. [8] found, through triaxial compression tests, that the degradation mode of single-fracture sandstone gradually transitioned from brittle shear failure to ductile crushing failure as the number of freeze–thaw cycles increased. Moreover, the fracture penetration rate exhibits a nonlinear relationship with the number of freeze–thaw cycles. Liu et al. [9], based on uniaxial freeze–thaw tests of open fracture specimens, further pointed out that the freezing method and fracture inclination angle significantly affected the threshold of fracture-induced freezing expansion by altering the ice expansion stress distribution. When the fracture inclination angle is between 60° and 90°, the path of freezing-induced cracks leads to a reduction in the uniaxial strength of the rock mass. Fu et al. [10], in their study of slate, demonstrated that the bedding dip had a selective effect on freeze–thaw damage. When the bedding direction aligns with the freeze–thaw stress direction, the elastic modulus can decrease by as much as 32%. Yang et al. [11] revealed, through triaxial tests, that the fracture trace length was more sensitive to the strength degradation of the rock mass than the fracture width and that temperature variations had a more significant weakening effect on the peak strength of fractured rock masses under low confining pressures. Although these studies clarify the influence of single factors, most of them have not quantified the nonlinear cumulative effect of multiple factors interacting. For example, the damage model established by Zhu et al. [12] only considers the linear superposition of freeze–thaw cycles and fracture inclination, while the experiments of Liu et al. [13] showed that when the number of freeze–thaw cycles exceeds 20, the contribution of the joint filling material type to strength loss increases from 15% to 40%, suggesting that the interaction between freeze–thaw cycles and other factors may exhibit temporal dependence.
Regarding the study of the mechanical properties of fractured rock masses under grouting reinforcement, Yang et al. [14] found, through triaxial tests, that the peak deviatoric stress of the grouted body was positively correlated with the roughness, thickness, and quantity of grout veins. Lu et al. [15], through direct shear tests, further demonstrated that the strength model of the grouted body must simultaneously consider the synergistic effect of grout permeability and confining pressure. Liu et al. [16] conducted normal and tangential mechanical loading tests on grouted rock mass fracture specimens, concluding that grouting reinforcement increases the overall strength and stability of the rock mass by improving the mechanical properties of the fracture surfaces. Zhu et al. [17] revealed the marginal effects of grout material types: when the confining pressure exceeds 10 MPa, the strength difference between chemical grout and cement-based grout decreases from 25% to 8%, indicating that environmental stresses may alter the material performance advantage. Yong et al. [18], through uniaxial tests, found that the correlation between fracture filling roughness and crack propagation paths exhibits a clear threshold effect. Both Tang et al. [19] and Liu et al. [20] showed through their tests that different fracture characteristics significantly influence the mechanical properties and failure modes of grouted fracture specimens.
In summary, both domestic and international scholars have conducted extensive research on the mechanical properties of rock, focusing on factors, such as freeze–thaw cycles, fracture characteristics, grouting materials, and confining pressure conditions, resulting in numerous findings. However, most existing studies treat these factors as independent variables, neglecting their mutual influence and interaction. In complex geological environments, the interaction of multiple factors may amplify or diminish the effect of a single factor. Additionally, most current research on fractured rock masses focuses on straight fractures, with less attention given to the rough fracture surfaces commonly found in natural rock masses. Therefore, this study employs the joint roughness coefficient (JRC) to quantify fracture roughness. Through single-factor comparison experiments and orthogonal test designs, this study systematically analyzes the effects of factors, such as freeze–thaw cycles, fracture dip angle, roughness, grouting material, and confining pressure on rock’s mechanical properties, with a focus on the interaction and synergistic effects of these factors. The interaction mechanism of rock’s mechanical properties in complex environments was revealed, and the findings are expected to provide a theoretical basis and data support for the stability and disaster prevention of grouted reinforced slopes in seasonal frost areas.

2. Test Materials and Program

This section provides a detailed description of the preparation process of grouted fractured sandstone, including the setting of fracture dip angles, the surface roughness preparation, and the injection of grout materials. It also outlines the design of the single-factor comparison experiments and orthogonal tests and describes the specific procedures for conducting freeze–thaw cycling tests and triaxial compression tests.

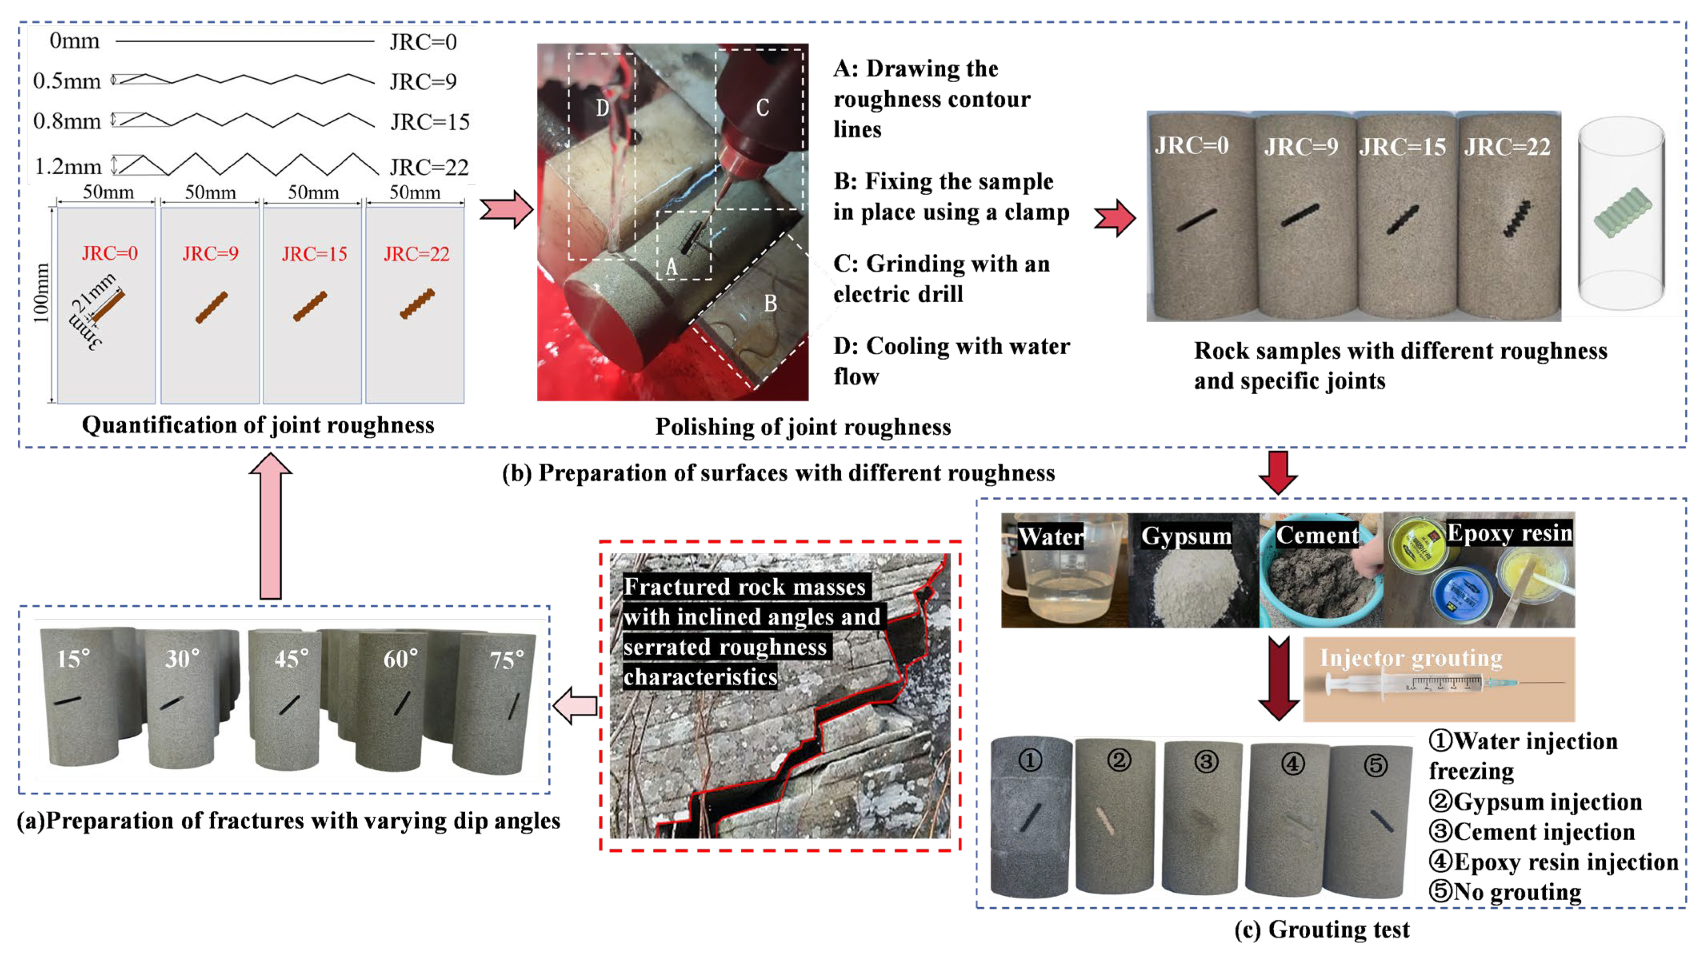
2.1. Sample Preparation

The rock specimen was collected from a grout-reinforced service slope in Shaanxi Province. The rock is grayish in appearance, and the core was extracted from a nearby section of the intact rock mass. The mineral content of the sandstone sample was analyzed using a DX-2700BH X-ray diffractometer (Dalian Instrument Co., Ltd., Dalian, China), and the results are presented in Table 1. According to the standard of the International Society for Rock Mechanics (ISRM) [21], the rock specimen was processed into a cylindrical specimen with a diameter of about 50 mm and a height of about 100 mm (L/D ratio of 2:1), and the wave velocity was measured. This L/D ratio was selected based on several considerations: it is commonly used in rock mechanics research and is considered effective in mitigating boundary effects caused by improper specimen dimensions. This ratio ensures a more uniform stress distribution within the specimen during testing, thereby enhancing the reliability and repeatability of the results. The selection of the 2:1 L/D ratio aligns with practices outlined in the ISRM Suggested Methods for Rock Characterization, Testing, and Monitoring [22] and ASTM D4543-19 Standard Practice for Preparing Rock Core Test Specimens [23], which, while not specifying an exact L/D ratio, support the rationale for using this dimension ratio in standard rock mechanics testing. Samples exhibiting significant discrepancies were discarded using an NM-4A Ultrasonic Pulse Velocity Tester (Cangzhou Lovely Group Co., Ltd., Cangzhou, China) to minimize the impact of sandstone variability on the test results. The samples were subsequently placed in an oven and dried at 105 °C for 48 h using a DZF-type vacuum drying oven (Zhengzhou Keda Machinery and Instrument Equipment Co., Ltd., Zhengzhou, China). After determining the dry mass, the samples were placed in a ZK-270-type vacuum saturation apparatus (Zhengzhou Soil Instrument Factory, Zhengzhou, China) for saturation. The saturated mass was obtained after weighing the samples following 24 h of saturation. The dry density ( ρ d ), saturated density ( ρ s a ), saturated moisture content ( ω s a ), and porosity ( n 0 ) of the rock specimens were calculated using Equations (1)–(4). Specifically, these parameters were computed as follows. The results are presented in Table 2.
ρ d = m s A · H
ρ s a = m s a A · H
ω s a = m s a m s m s × 100 %
n 0 = m sa m s ρ w · V × 100 %
The preparation process of the fractured sandstone used in this experiment is depicted in Figure 1. A single fracture was created using a waterjet, as shown in Figure 1a. The fracture had a width of 3 mm and a length of 21 mm. To simulate the typical fracture distribution in nature, fracture inclination angles (θ, the angle between the fracture and the horizontal plane) of 15°, 30°, 45°, 60°, and 75° were selected. Next, based on the formula proposed in [24], a theoretical fractal model was used to simulate the roughness of the joint profile. The fractal dimension of the joint was directly estimated from two statistical parameters: the average base length ( l ) and the average height ( h ) of the joint roughness. The mathematical expressions for the fractal dimension ( D ) and the joint roughness coefficient ( JRC ) are given by Equation (5) and Equation (6), respectively:
D = log 4 / log 2 1 + cos arctan 2 h / l
JRC = 85.2671 D   1 0.5679
These parameters are directly adopted from previous studies [24], where they were extensively used to characterize the roughness of rock joints and fractures. Specifically, the formulas are derived from the traditional Koch curve model, which has been validated through empirical data in earlier studies. These well-established parameters are widely recognized in the literature and are employed here without the need for further calibration.
To simulate the rough surface characteristics of natural rock fissures, the average base length of the joint roughness was set to 3 mm, and the average undulation heights were set to 0 mm, 0.5 mm, 0.8 mm, and 1.2 mm, respectively (see Figure 1b). To ensure the accuracy of the roughening process, several measures were taken to control and maintain precision. Initially, the contour lines of the areas to be roughened were marked using a marker. The rock specimens were then securely fixed in place using a clamp to ensure stability during the roughening process. A diamond abrasive drill bit was used to carefully roughen the marked regions. During the abrasion process, to prevent overheating of the diamond drill bit and ensure precision, continuous water cooling was employed. Upon completion of the abrasion, the roughness profiles of each sample were obtained using a scanner, and the data were imported into AutoCAD 2023 (Autodesk Inc., San Francisco, CA, USA) software for further analysis. Subsequently, the roughness values were calculated using the root mean square of the first derivative (Z2) method [25]. If the deviation between the measured JRC value and the design value exceeded 5%, the sample was discarded to maintain the accuracy and reliability of the experimental data. The calculation method for the measured JRC value is provided in Equations (7) and (8):
Z 2 = 1 n 1 i = 1 n 1 y i + 1 y i x i + 1 x i 2
J R C = 32.69 + 32.981 · l o g Z 2
In order to study the differences in the effect of grouting materials of different strengths on the reinforcement of fractured rock mass, four representative grouting materials were selected in this study: ice, gypsum paste, cement mortar and epoxy resin. Grouting tests were carried out on the fractured rock specimens using a syringe (see Figure 1c). For the ice-filled material, purified water was used; the plaster material was mixed in a ratio of water/plaster (construction plaster) = 1:2; the cement material was Portland cement P.O42.5, mixed in a ratio of water/cement/sand (quartz sand, particle size range 0.15–0.25 mm) = 1:2:4; epoxy resin is used as an organic material, and the ratio is resin glue/curing agent = 1:1. The specimen after grouting was allowed to cure in the air for 7 days. After the grouting material reached a certain strength, a freeze–thaw cycle test was performed. The uniaxial compressive strength, elastic modulus and Poisson’s ratio of the four grouting materials were determined by performing uniaxial compression tests on standard cylindrical test pieces using a TW-1000 mechanical testing machine (Shanghai Institute of Civil Engineering and Architecture, Shanghai, China). The loading method was deformation control at a rate of 0.05 mm/min. The results are shown in Table 3.

2.2. Experimental Design
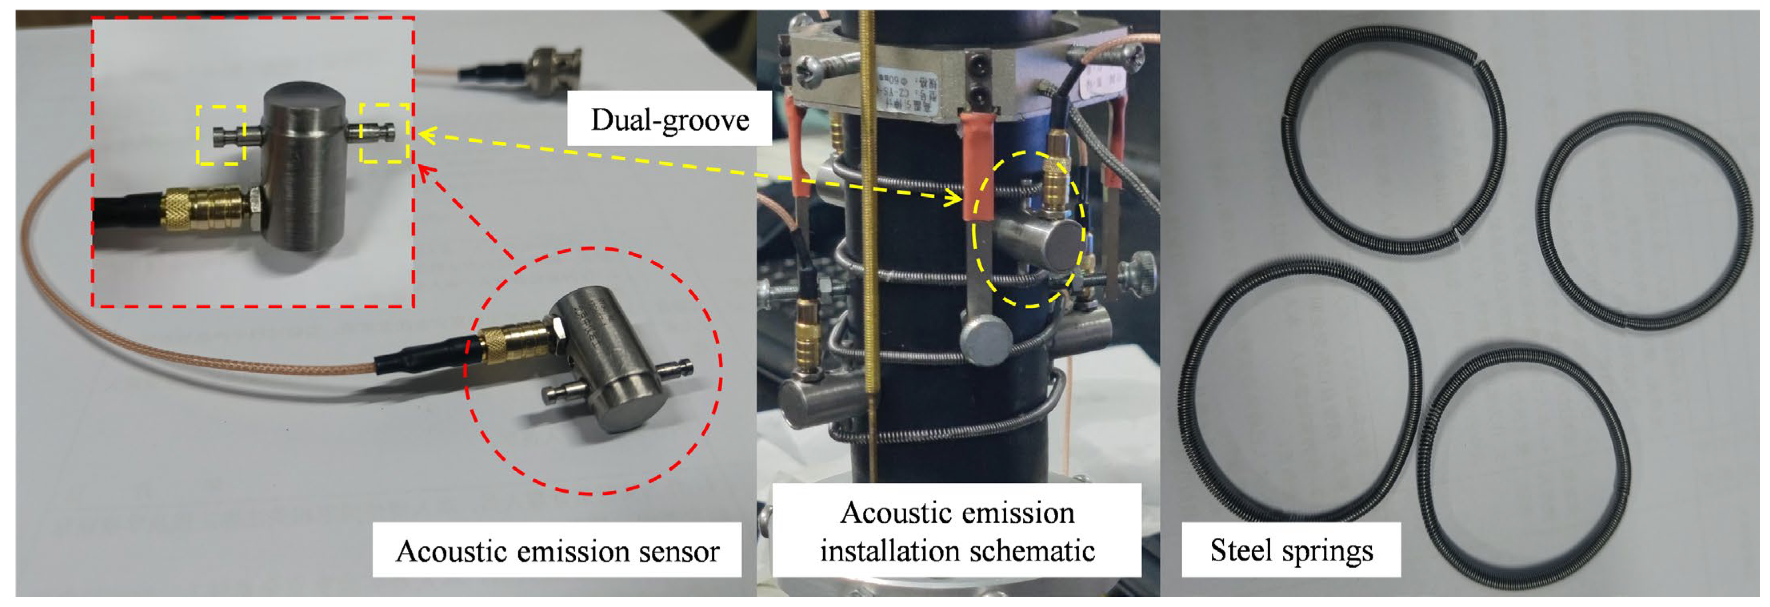
In this study, five factors were selected: the number of freeze–thaw cycles (5 levels), grouting material (5 levels), crack inclination angle (5 levels), roughness (4 levels), and confining pressure (4 levels). Peak stress and elastic modulus were chosen as the evaluation indicators. First, a single-factor comparison test was conducted using the control variable method, followed by an orthogonal test using a mixed L36 (42 53) table (see Table 4).

2.3. Test Methods

This section introduces the experimental methods of the freeze–thaw cycling test and triaxial compression test. The freeze–thaw cycling test simulates the impact of temperature variations in cold regions on the mechanical properties of rocks, investigating the changes in rock mechanical behavior during the freeze–thaw process. The triaxial compression test evaluates the mechanical characteristics of rocks under different confining pressures and incorporates an acoustic emission monitoring system to record the crack propagation process in real time.

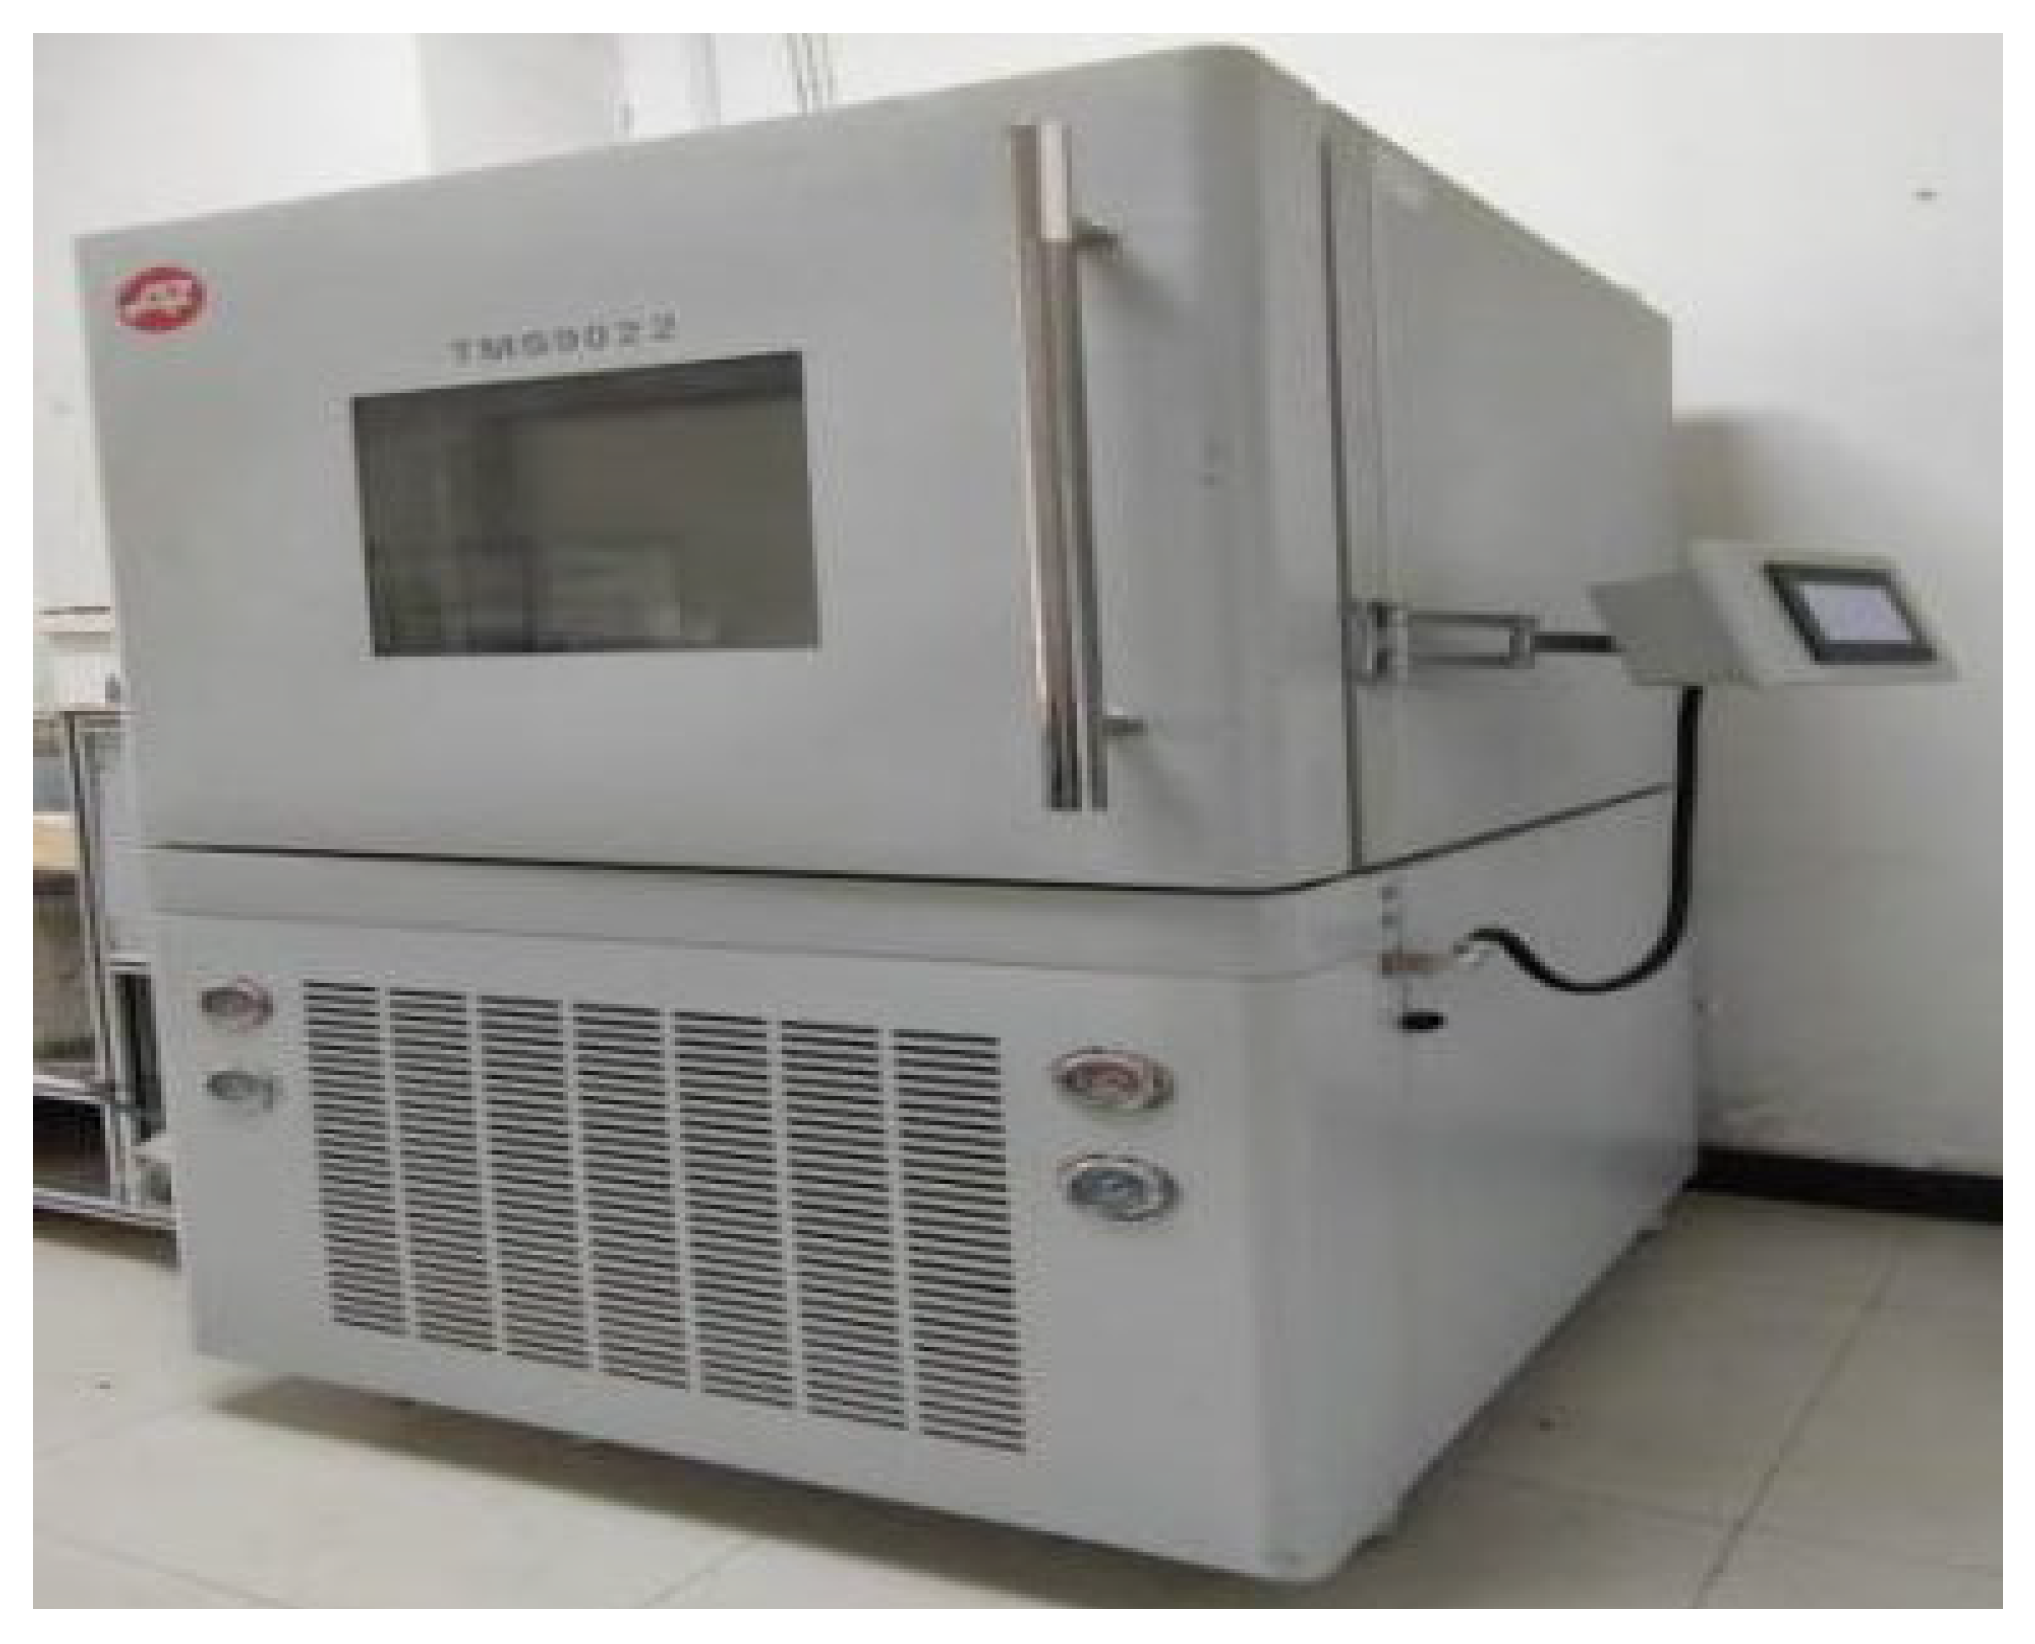
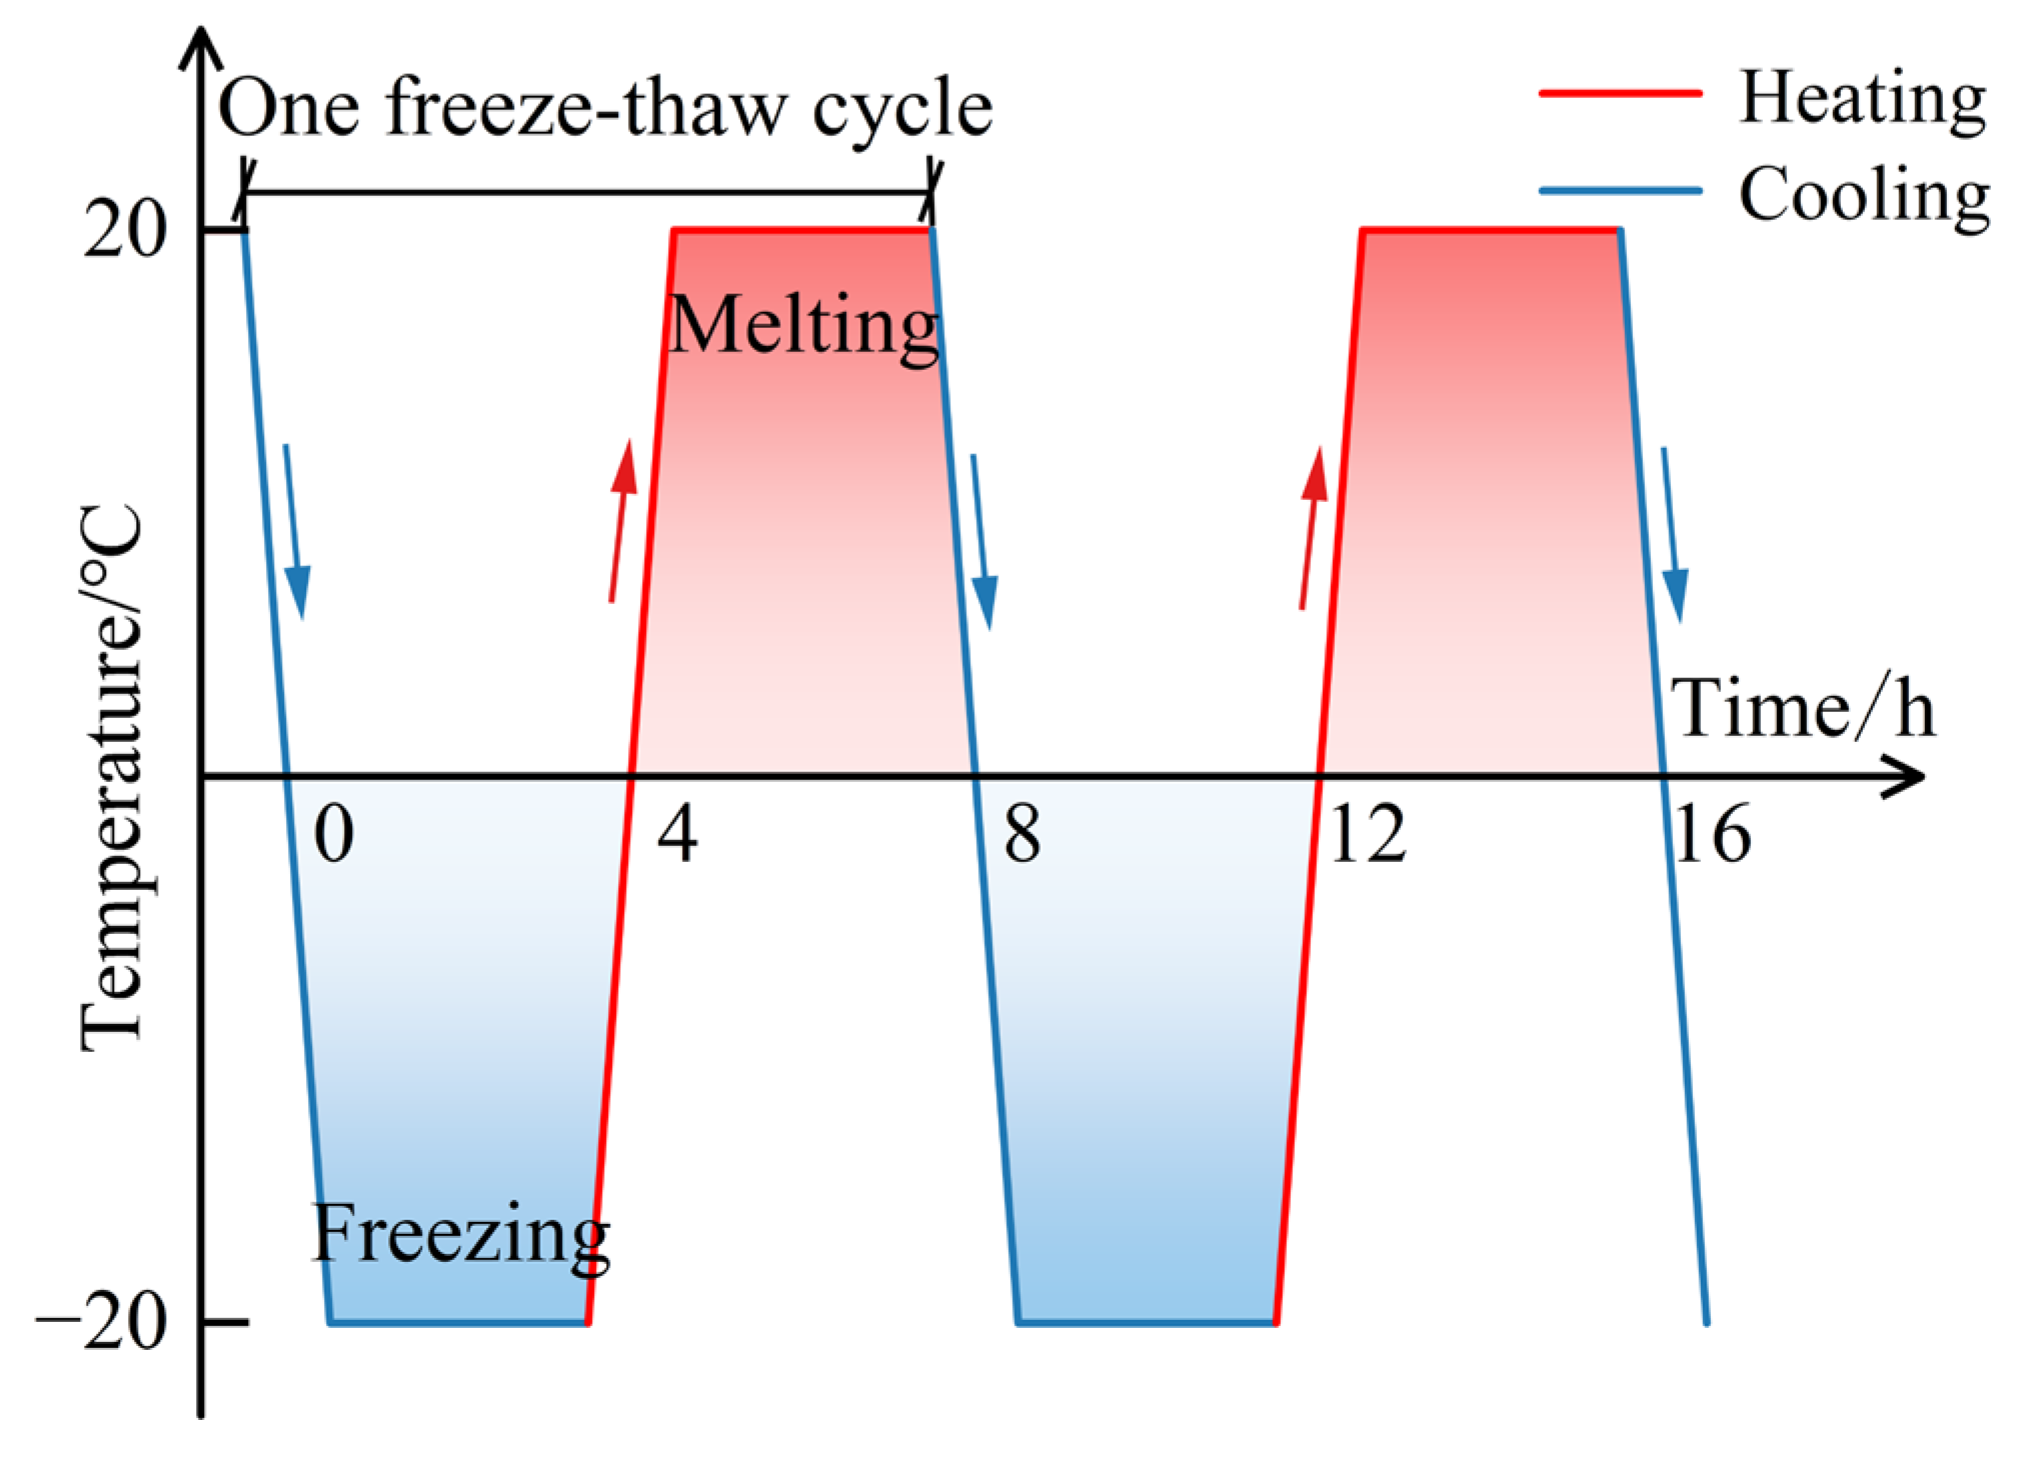
2.3.1. Freeze–Thaw Cycling Test

Based on the actual working conditions in cold regions and the standard engineering rock mass testing method, the freeze–thaw temperature was set to ±20 °C, with each freeze–thaw cycle lasting 8 h. The samples were subjected to 0, 5, 10, 20, and 40 freeze–thaw cycles, respectively. The experimental apparatus (Thermo Scientific, Shanghai, China) is depicted in Figure 2, and the freeze–thaw process is illustrated in Figure 3.

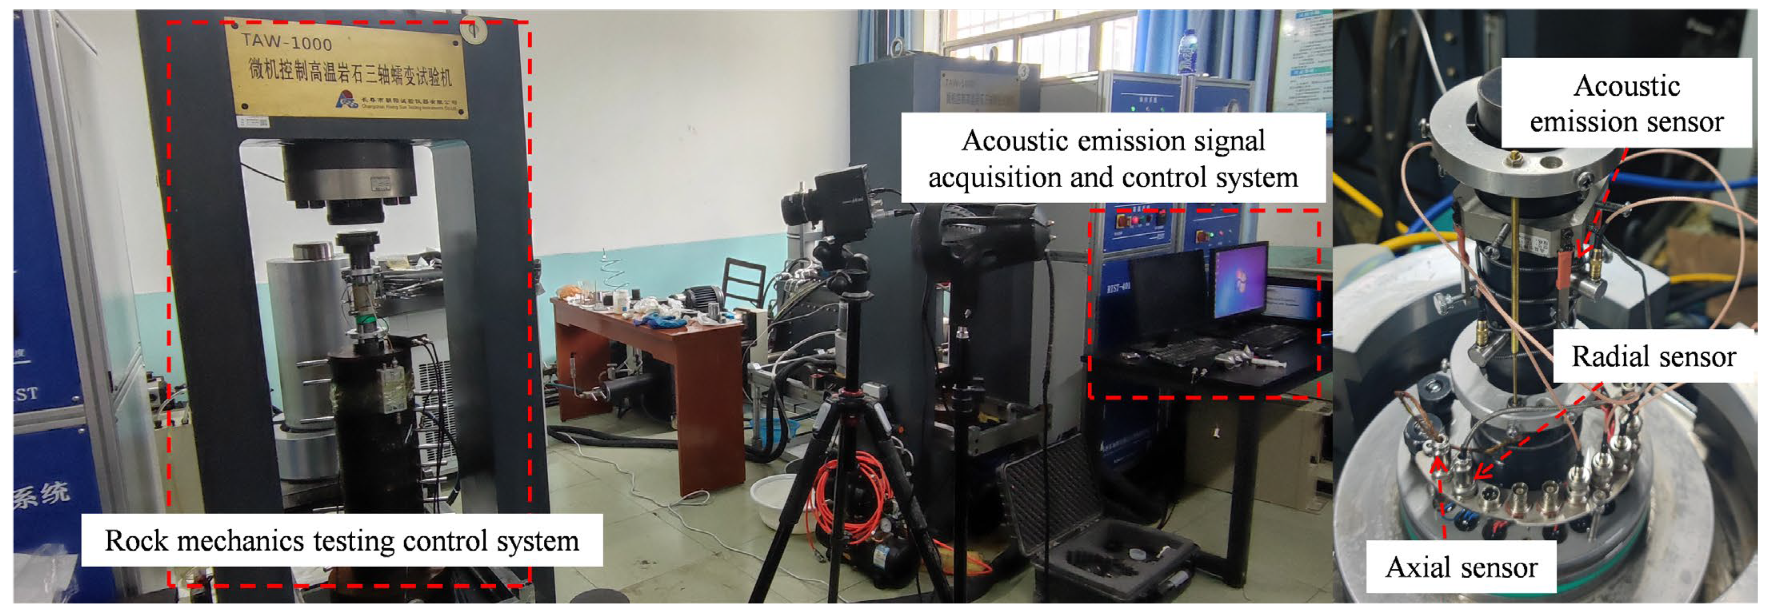
2.3.2. Uniaxial and Triaxial Compression Tests

The primary equipment used in this test consisted of a rock mechanics testing machine (TW-1000) (Shanghai Institute of Civil Engineering and Architecture, Shanghai, China) and an acoustic emission monitoring system (Express-8) (Beijing Huace Tianyu Technology Co., Ltd., Beijing, China). During the uniaxial and triaxial compression tests on rock specimens, deformation control was applied at a rate of 0.05 mm/min. Stress–strain curves and other mechanical parameters were obtained. Simultaneously, an acoustic emission monitoring system was used to record acoustic emission signals throughout the compression process, capturing valid AE signals. The AE signal sampling rate was set to 2 MHz, with the AE threshold and preamplifier both set to 40 dB. For the acoustic emission measurements, four RT-50AE sensors were attached to the surface of the rock specimen. To ensure optimal coupling between the sensors and the specimen, vacuum silicone grease was applied to the sensor surfaces. The acoustic emission receiver, which has a cylindrical body with a concave end surface, was positioned along the curved boundary of the specimen using custom-designed steel springs. The degree of concavity in the receiver’s end surface was precisely matched to the curvature of the cylindrical rock specimen, ensuring a secure and stable fit. This concave design facilitated an optimal contact with the specimen’s surface, further enhancing the stability and accuracy of the measurements during the testing process. Each acoustic emission sensor was equipped with two specially designed grooves—one at the top and one at the bottom—to securely accommodate the steel springs. This dual-groove configuration ensured that the steel springs were effectively fixed, thereby maintaining the stable positioning of the sensors throughout the test. The confining pressure was varied during the test at 0, 3, 6, and 9 MPa to simulate the stress conditions of the rock mass in various geological environments. Thus, 0 MPa represents the initial state without confining pressure, while 3, 6, and 9 MPa represent low, medium, and high confining pressures, respectively, covering the typical range of ground pressures found in real-world projects. The test setup and rock specimen installation are shown in Figure 4. A detailed diagram of the acoustic emission installation and auxiliary components is shown in Figure 5.

3. Analysis of Test Results

This section first analyzes the stress–strain curves and acoustic emission data of sandstone under the influence of individual factors, revealing the mechanisms through which different factors affect the mechanical properties of sandstone, particularly their impact on peak stress and elastic modulus. Subsequently, through regression analysis, a regression model accounting for the interaction of multiple factors is established, further uncovering the interaction mechanisms among these factors.

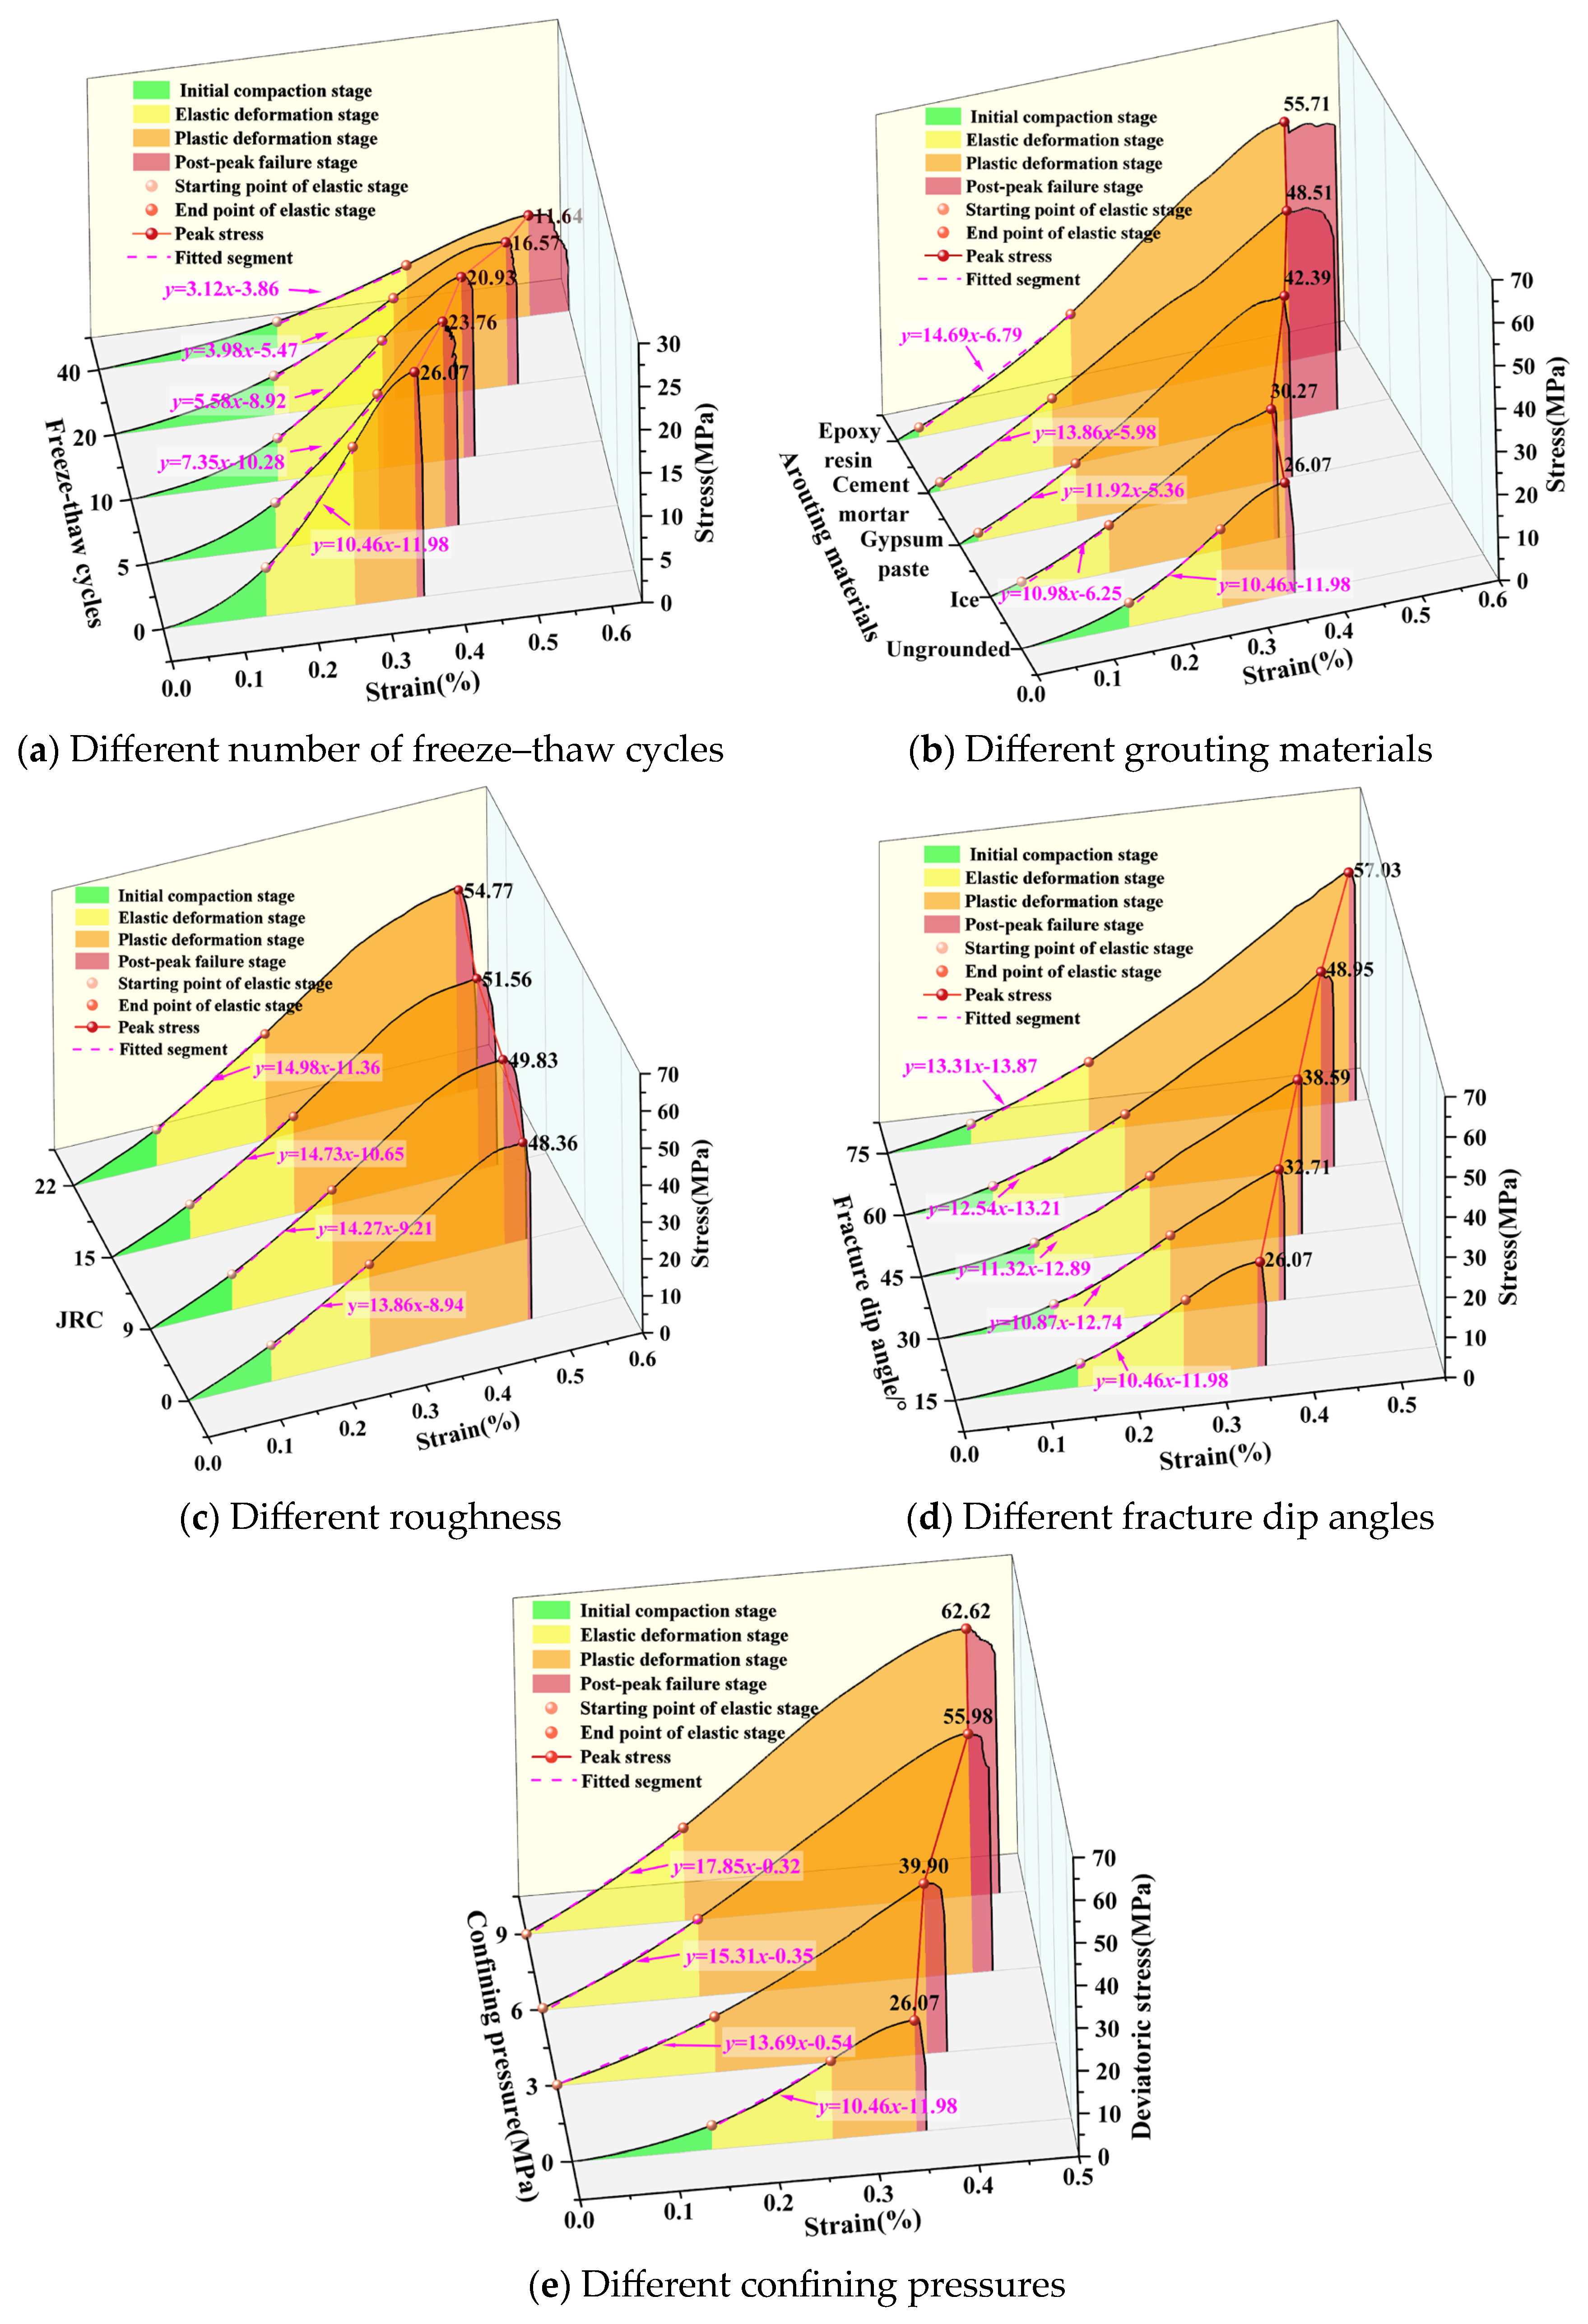
3.1. Mechanical Properties of Sandstone Under the Action of a Single Factor

Based on the method of controlling variables, three samples are selected for each test in the single-factor comparison experiments. These samples are screened using a velocity meter to minimize the influence of sample variability on the experimental results. The most representative stress–strain curve is then selected for analysis. Based on the gradual changes in the stress–strain curve under different factors (see Figure 6), the curve can be divided into four distinct stages: (I) initial compaction stage: the curve is nonlinear and concave; (II) elastic deformation stage: the curve is linear, with the slope representing the elastic modulus; (III) plastic deformation stage: the curve becomes nonlinear and convex; (IV) post-peak failure stage: the rock specimen fails when peak stress is reached.
Figure 6a shows the stress–strain curve of sandstone subjected to different freeze–thaw cycles. These cycles significantly weaken the rock’s mechanical properties through repeated freezing and thawing. As the number of freeze–thaw cycles increases, the peak stress of the rock specimen decreases, and the peak strain shifts to the right. The maximum shift occurs when the number of freeze–thaw cycles increases from 10 to 20 cycles. Stage I: As the number of freeze–thaw cycles increases, the axial strain increases, the axial stress decreases, and the curve becomes less concave. This is due to the increase in micropores and microcracks within the rock specimen. Stage II: The slope of the curve negatively correlates with the number of freeze–thaw cycles. The elastic modulus of the rock specimen decreases by 76.78% after 40 freeze–thaw cycles, compared to the unfrozen sample. This reduction is due to the frost heave force caused by the phase change of water ice during the freeze–thaw process [26]. Stage III: The convexity of the stress–strain curve decreases as the number of freeze–thaw cycles increases, and the peak strain shifts to the right. Compared to the unfreeze–thawed rock specimen, the peak stress of the rock specimen subjected to 40 freeze–thaw cycles decreases by 55.37%. This indicates that increasing the number of freeze–thaw cycles exacerbates rock damage. Stage IV: As the number of freeze–thaw cycles increases, the axial strain increases. For cycles less than 20, the rock specimen exhibits noticeable brittle failure characteristics. At 40 freeze–thaw cycles, the rock specimen transitions from brittle failure to ductile failure. This transition is primarily attributed to the cumulative damage induced by frost heave forces during the repeated freezing and thawing cycles. As the number of cycles increases, microcracks within the rock specimen propagate, coalesce, and interconnect, leading to the formation of a more fragmented microstructure. This process progressively weakens the rock’s internal cohesion and alters its fracture mechanics, resulting in a shift from the characteristic brittle failure, which is sudden and catastrophic, to ductile failure, where the material undergoes more plastic deformation prior to failure. The increased microstructural damage from frost-induced cracking reduces the rock’s ability to sustain localized stresses, allowing for more gradual failure under continued loading. This transition is a well-documented phenomenon in brittle materials subjected to freeze–thaw cycles, where repeated cycles progressively degrade the material’s integrity and induce a shift in the failure mode.
Figure 6b shows the stress–strain curve of sandstone subjected to different grouting materials. Grouting materials improve the rock specimen’s bearing capacity by enhancing the bond strength and overall stiffness of the sandstone, which in turn improves its stress–strain behavior. As the strength of the grouting material increases, both the peak stress and peak strain of the rock specimen’s stress–strain curve shift upward and to the right, respectively. The greatest shift occurs when the grouting material changes from ice to gypsum paste. This is because gypsum paste forms a strong crystalline structure during hydration, which better distributes external stress, enabling the rock specimen to withstand greater deformation. In contrast, ice has low strength and poor hardness, which limits its ability to provide continuous support. As a result, the increase in peak strain is minimal. Stage I: The compaction stage of the grouted rock specimen is shorter than that of the ungrouted sample. This suggests that the grouting material fills the micropores and microcracks in the sandstone, thereby increasing its density. Stage II: The slope of the curve is positively correlated with the strength of the grouting material. Compared to the ungrouted sample, the elastic modulus of the resin-injected rock specimen increases by 40.44%, indicating that the rigidity of the grouting material enhances the overall rigidity of the rock. Stage III: The stress–strain curves of the rock specimens show varying fluctuations. These fluctuations may result from the local destruction of filled cracks, causing stress redistribution. Stage IV: The peak stress is positively correlated with the strength of the grouting material. Compared to the ungrouted rock specimen, the peak stress of the resin-injected sample increases by 113.61%. The stress drop point shifts backward, and residual strength persists longer, indicating that the strong grouting material maintains bonding force even after the rock is damaged, continuing to provide support until final failure.
Figure 6c shows the stress–strain curves of sandstone under different roughness conditions. Roughness enhances the anchoring effect of the slurry on the crack surface, improving stress distribution and transmission. This, in turn, slows crack propagation and enhances the rock specimen’s stability, thereby improving its mechanical properties. As roughness increases, both the peak stress and peak strain of the rock specimen’s stress–strain curve increase linearly, shifting the overall trend to the upper right. Stage I: The curves show no significant difference. Stage II: The slope of the curve increases with roughness intensity. Compared to the rock specimen without roughness, the elastic modulus of the rock with a JRC of 22 increases by 8.08%. This is due to the concave–convex structure of the rough fracture surface, which enhances the anchoring effect of the grouting material, making it more stable within the fracture. Phases III and IV: As roughness increases, both the peak strain and peak stress of the rock specimen gradually increase. Compared to the rock specimen without roughness, the peak stress of the rock with a JRC of 22 increases by 13.25%. This indicates that a rougher fracture surface disperses stress more evenly, reduces stress concentration, and delays the fracture propagation and instability of the rock specimen.
Figure 6d shows the stress–strain curve of sandstone under different crack inclinations. The crack inclination angle alters the angle between the crack plane and the direction of principal stress, promoting more efficient transmission of external stress to the rock’s interior. This reduces the likelihood of slip and cracking on the fracture plane, optimizes stress distribution, and improves the rock’s mechanical properties. As the fracture inclination increases, both the peak stress and peak strain of the rock specimen’s stress–strain curve increase linearly, with the overall curve shifting notably to the upper right. Stage I: No significant difference is observed in the curves. Stage II: The slope of the curve increases with the fracture inclination angle. Compared to the rock specimen with a 15° inclination angle, the elastic modulus of the rock specimen with a 75° inclination increases by 27.25%. This is because a larger fracture inclination creates a smaller angle with the principal stress direction, facilitating easier transmission of external stress into the rock. It also reduces the likelihood of slippage or cracking at the fracture surface. Stage III: As the crack inclination increases, the peak stress of the rock specimen rises, and the peak strain shifts to the right. Compared to the rock specimen with a 15° inclination, the peak stress of the sample with a 75° inclination increases by 118.76%. This is because, at smaller crack inclination angles, the crack direction is more perpendicular to the applied axial stress, leading to stress concentration near the crack. This accelerates crack propagation, resulting in earlier instability and failure of the rock specimen. Stage IV: Regardless of the crack inclination, the stress–strain curve shows a rapid decline, indicating clear characteristics of brittle failure.
Figure 6e shows the stress–strain curve of sandstone under various confining pressures. Confining pressure enhances the rock’s density, restricts deformation, increases the elastic modulus and peak stress, and promotes the transition from brittle to ductile failure. As confining pressure increases, the peak stress of the rock specimen rises, and the peak strain shifts to the right. The greatest shift occurs when the confining pressure increases from 3 MPa to 6 MPa. This may result from the compaction effect being most significant in this range, causing notable changes in the rock’s microcracks and pore structure. Stage I: Compared to the rock specimen at 0 MPa, those at 3–9 MPa did not undergo further densification, suggesting that the initial pressure had already compacted the primary cracks. Stage II: The curve’s slope positively correlated with confining pressure. The elastic modulus of the rock specimen at 9 MPa is 70.65% higher than at 0 MPa. This is because confining pressure increases the rock’s density, enlarges the contact area between particles, and limits its deformation. Stage III: As confining pressure rises, the rock specimen remains in the plastic-yielding state longer, with increased peak strain and peak deviatoric stress. Compared to the rock specimen at 0 MPa, the peak deviatoric stress at 9 MPa increases by 140.2%, indicating that confining pressure inhibits crack development and propagation. Stage IV: As confining pressure increases, the stress drop rate slows, and the rock specimen transitions from brittle to ductile failure.
In summary, the freeze–thaw cycle weakens sandstone, whereas grouting material, fracture dip angle, roughness, and confining pressure all strengthen it. The differences in the influence of various factors on sandstone are shown in Table 5.
In practical engineering, multiple factors often affect sandstone’s mechanical properties, interacting, synergizing, or restricting one another, leading to complex changes. For example, both fracture dip angle and roughness significantly influence stress transfer, while the coupling of grouting material and confining pressure further reinforces the fracture surface. Therefore, studying a single factor cannot fully capture the rock’s behavior in practical engineering. In complex environments, interactions between factors can cause nonlinear effects, altering the mechanical properties of the rock. An in-depth exploration of how multiple factors interact to affect sandstone’s mechanical properties can provide a more comprehensive basis for rock mass stability analysis and optimal design.

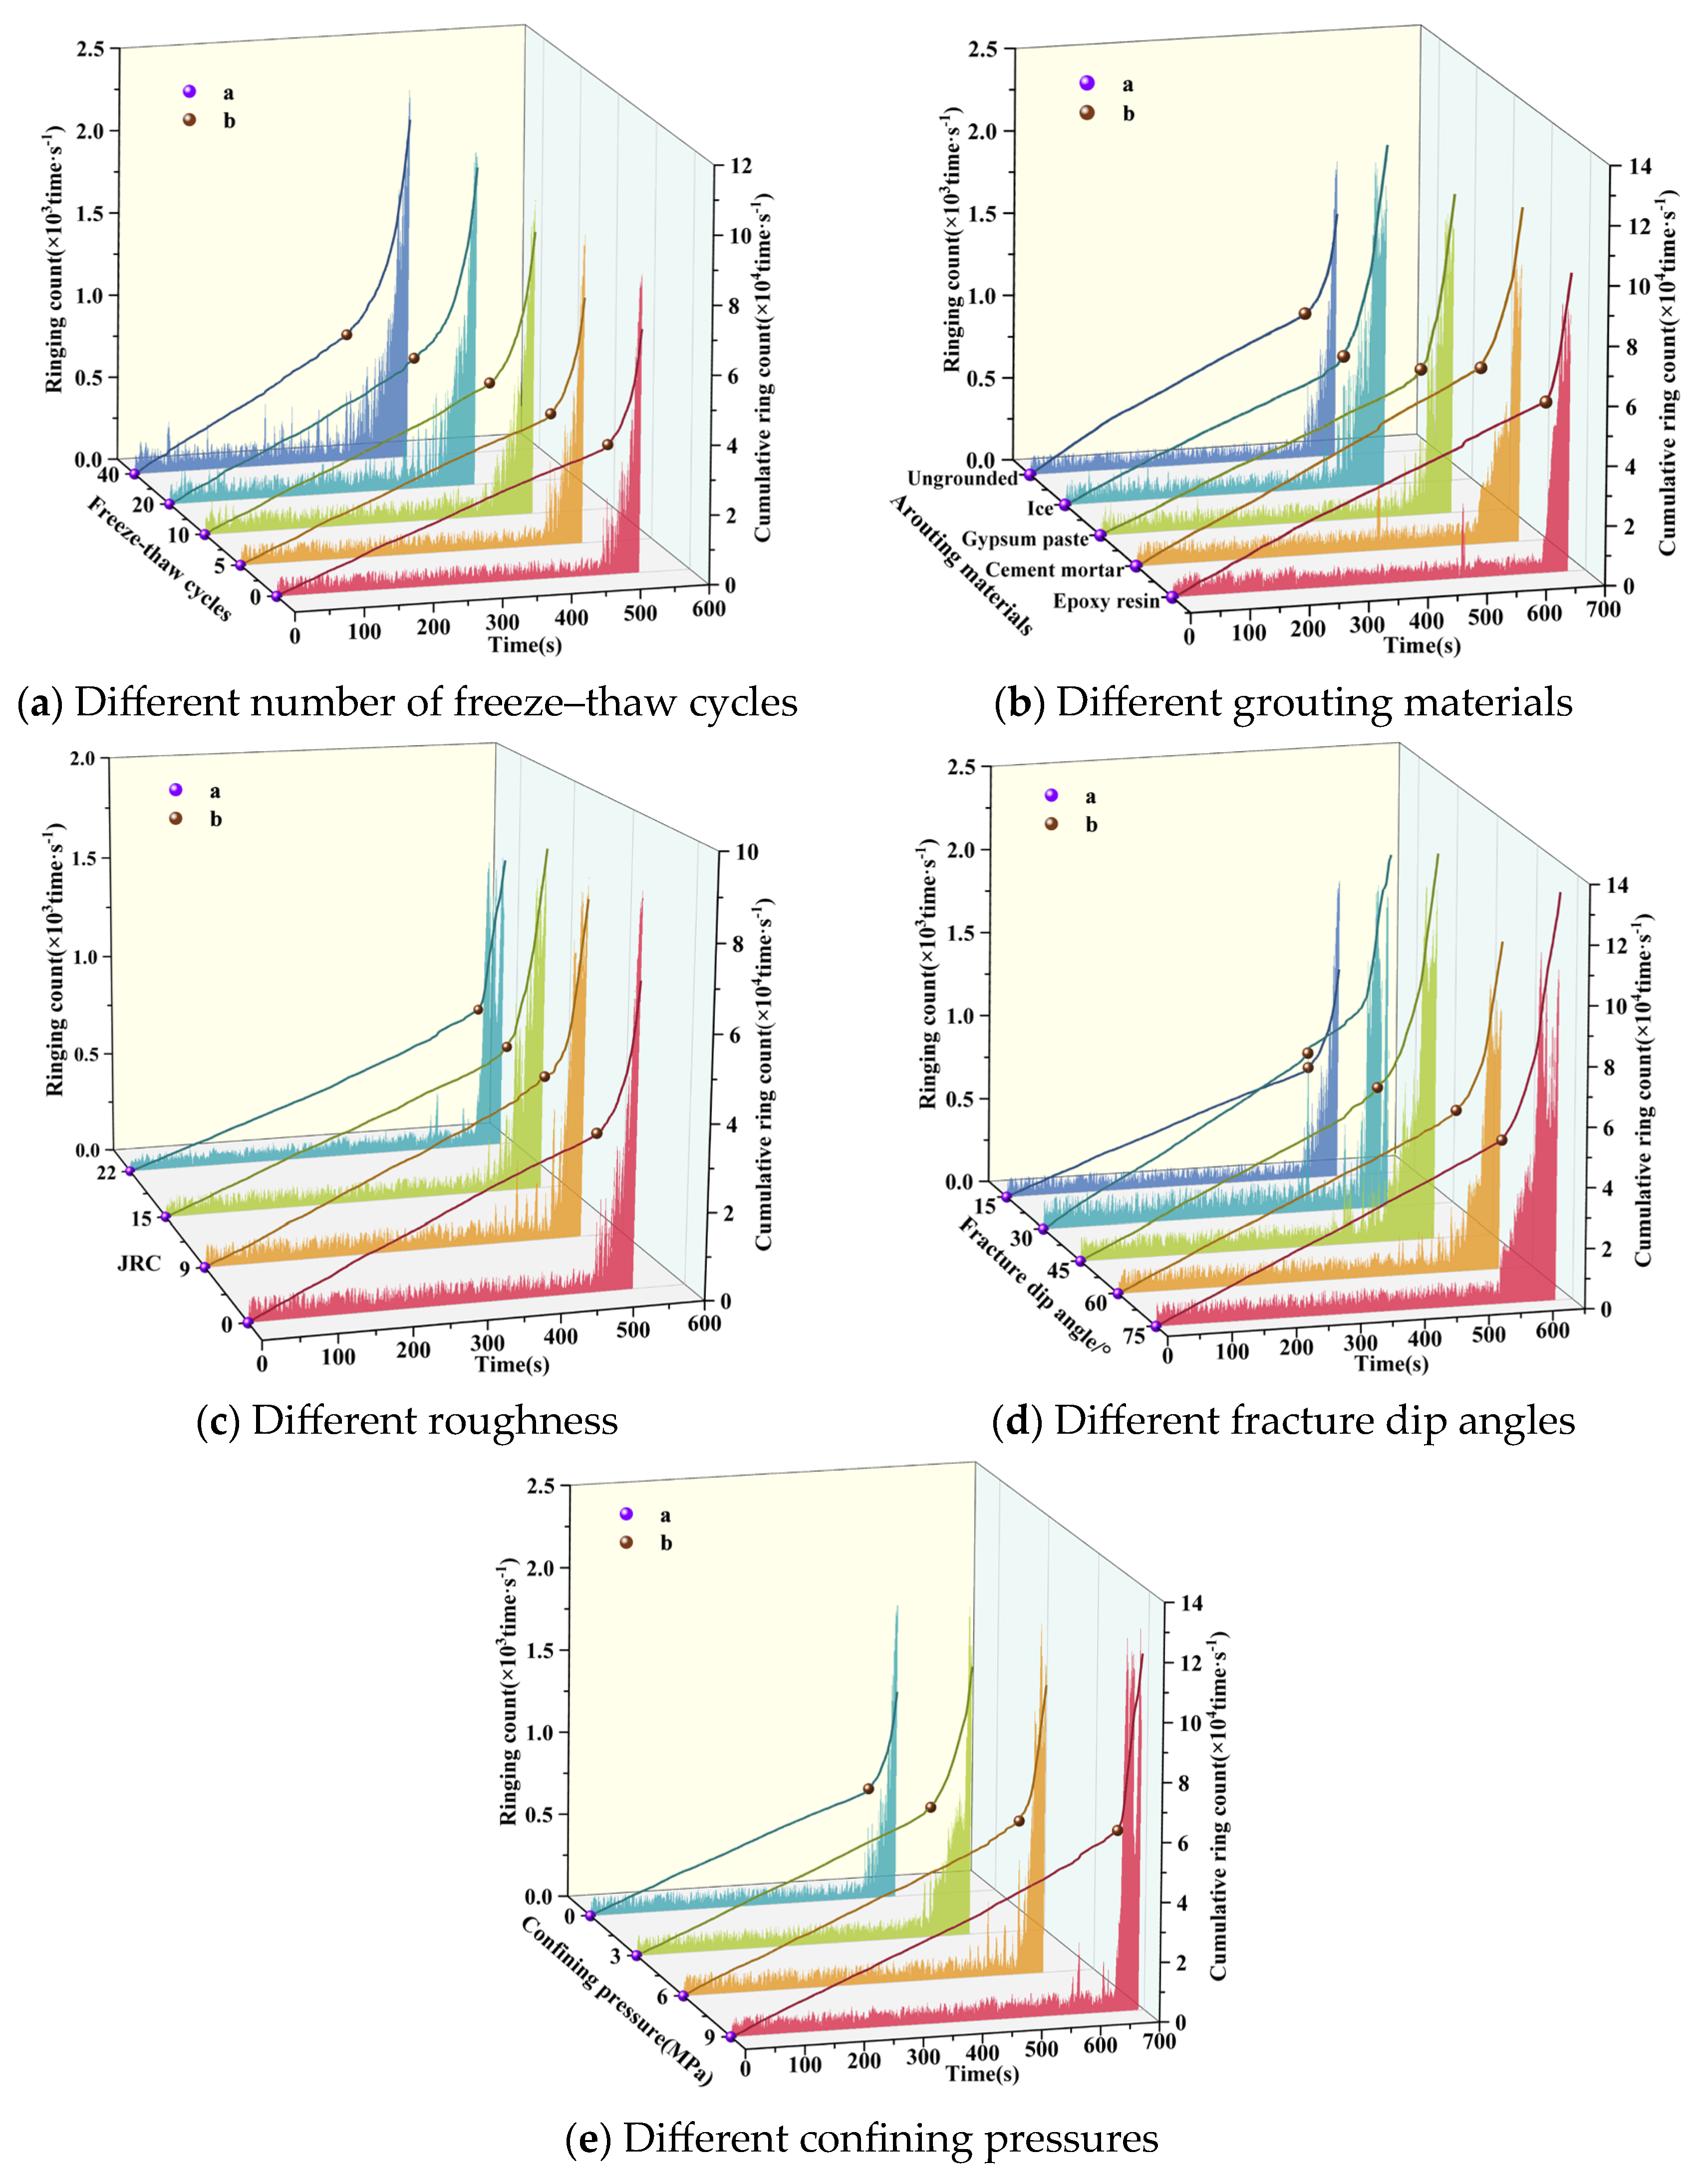
3.2. Characterization of the Acoustic Emission Evolution of Sandstone Under the Action of a Single Factor

Acoustic emission is used to monitor elastic waves generated during rock failure, providing real-time insight into the failure status of the rock [27], as shown in Figure 7.
As shown in Figure 6 and Figure 7, the evolution curves of sandstone ringing counts under various factors can be divided into a steady growth phase and a sudden increase phase. During the steady growth phase (section ab), acoustic emission events are relatively few, and the cumulative ringing count increases gradually, corresponding to sections I and II of the stress–strain curve. This phase reflects the closure and initial expansion of microcracks in the rock specimen. After point b (the sudden increase point), acoustic emission activity rises sharply, and the cumulative ringing count increases rapidly, marking the start of the sudden increase phase. This phase corresponds to stages III and IV of the stress–strain curve, representing crack expansion and macroscopic penetration, leading to rock failure.
Figure 7a illustrates the effect of freeze–thaw cycles on the ringing count. As the number of freeze–thaw cycles increases, the number of steady-state acoustic emission events rises, the characteristic frequency of microcracks becomes evident, and the sudden increase point shifts earlier (by 34.73% for 40 freeze–thaw cycles compared to the unfrozen rock specimen). Additionally, rupture activity occurs earlier, the sudden increase period is prolonged, and the time for microcrack expansion into macrocracks increases. Both the peak ringing count and the cumulative ringing count increase, while the energy released during rock failure also rises. In the initial compaction stage, the ringing count temporarily increases with the number of freeze–thaw cycles. After 40 freeze–thaw cycles, the initial cumulative ringing count of the rock specimen is 1.52-times that of the unfrozen sample, indicating that freeze–thaw cycles increase the number of micropores and microcracks within the rock. Under compression, internal micropores gradually connect, leading to the formation of more cracks. During the plastic deformation stage, the frequency of sudden increases in the ringing count rises significantly, and the slope of the cumulative ringing count curve increases, indicating that freeze–thaw cycles accelerate crack expansion and connection. In the post-peak failure stage, the peak ringing count increases with the number of freeze–thaw cycles, suggesting that freeze–thaw cycles exacerbate internal damage, causing the rock to store more energy, which is rapidly released upon rupture.
Figure 7b shows the effect of grouting material on the ringing count. As the strength of the grouting material increases, the stabilization period is prolonged, the sudden increase point shifts later (the resin-injected rock specimen is delayed by 24.96% compared to the uninjected sample), and the peak cumulative ringing count of the grouted sample is higher than that of the uninjected sample. During the initial compaction stage, the cumulative ringing count of the grouted rock specimens was slightly lower than that of the ungrouted samples, suggesting that the grouting material effectively penetrates the microcracks and micropores in the sandstone. In the plastic deformation stage, the grouted rock specimens experienced a brief surge in ringing count, corresponding to the fluctuation range of the stress–strain curve. This indicates that crack propagation led to localized damage in the rock specimens. In the post-peak failure stage, as the strength of the grouting material increases, the frequency of sudden increases in the ringing count decreases, and the sudden increase period shortens. This suggests that grout-free and weakly grouted rock specimens experience more frequent crack propagation, while stronger grouting material effectively limits crack propagation and slippage.
Figure 7c shows the effect of roughness on the ringing count. As roughness increases, the number of acoustic emission events during the stabilization period decreases, the sudden increase point shifts later (the rock specimen with a JRC of 22 is delayed by 14.68% compared to the sample with a JRC of 0), and the sudden increase period shortens. During the initial compaction stage, the number of acoustic emission events decreases as roughness increases, suggesting that higher roughness promotes better penetration of the slurry into the micropores and microcracks in the sandstone. In the plastic deformation stage, the frequency of sudden increases in ringing count decreased as roughness increased, suggesting that the development of internal cracks was slower and that the cementation between the rougher rock surface and slurry was stronger. In the post-peak failure stage, as roughness increased, the slope of the cumulative ringing count curve became steeper, the frequency of sudden increases in ringing count decreased, and the peak value dropped. This suggests that higher roughness inhibits crack expansion and the formation of macroscopic cracks.
Figure 7d illustrates the effect of fissure inclination on the ringing count. As fissure inclination increases, the stabilization period is extended, and the point of sudden increase shifts later (the rock specimen with a 75° inclination is delayed by 12.13% compared to the sample with a 15° inclination). The peak value of the ringing count and the cumulative ringing count differ among rock specimens with varying fissure inclinations. During the initial compaction stage and elastic deformation stages, the frequency of sudden increases in ringing count was low, regardless of fissure inclination. During the plastic deformation stage, as fissure inclination increased, the point of sudden increase shifted later, suggesting that rock specimens with smaller inclination angles are more prone to crack development and propagation. The sample with a 45° dip angle exhibited the highest peak ringing count at failure, indicating the weakest particle cementation and the highest energy release upon failure. Meanwhile, the 60° dip angle sample had the highest frequency of sudden increases in ringing count prior to failure, indicating the most intense crack propagation at this angle.
Figure 7e illustrates the effect of confining pressure on the ringing count. As confining pressure increases, the number of acoustic emission events during the stabilization period decreases, the point of sudden increase shifts later (the rock specimen with 9 MPa confining pressure is delayed by 36.19% compared to the sample with 0 MPa), the sudden increase period shortens, and both the peak and cumulative peak ringing counts decrease. Increased confining pressure significantly reduced acoustic emission activity during the initial compaction stage, indicating that it effectively compacts and closes the internal micropores of the rock. During the elastoplastic stage, the ringing count frequency decreased under high confining pressure, significantly inhibiting crack expansion. In the post-peak failure stage, as confining pressure increased, the frequency of sudden increases in the ringing count decreased, while the peak ringing count was reached in a shorter time. This indicates that confining pressure effectively inhibits crack propagation and releases higher energy during failure.
In summary, the freeze–thaw process promotes microcrack development and accelerates the release of stored damage energy. High-strength grouting materials and high roughness inhibit crack propagation and slippage. The crack inclination influences crack propagation by altering the crack stress mode. High confining pressure effectively inhibits crack propagation and concentrates energy release. Overall, various factors influence changes in the ringing count by affecting crack propagation rate, damage accumulation, and rupture energy release.

3.3. Rock Mechanical Properties Under the Interaction of Multiple Factors

Building upon the previous single-factor analysis, this section further investigates the influence of the interaction between multiple factors—including freeze–thaw cycles, grouting materials, confining pressure, fracture dip angle, and roughness—on the peak stress and elastic modulus of sandstone. Through regression analysis, two multiple regression models are established, focusing on how these factors interact and affect the mechanical behavior of sandstone.

3.3.1. Analysis of Interaction Effects

To clarify the interactive effects of each factor on peak stress and elastic modulus, an analysis was conducted using R software (RStudio, version 2023.03.0+386), considering the interactions between factors [28,29,30]. The results are presented in Table 6 and Table 7.
Based on the results presented in Table 6 and Table 7, the regression models for peak stress ( σ max ) and elastic modulus ( E ), incorporating interaction effects, are as follows in Equations (9) and (10):
σ max = 26.0712 + 27.754 X 1 14.392 X 2 + 29.299 X 3 + 33.886 X 4 + 5.957 X 5 11.307 X 1 X 2 + 16.075 X 1 X 4 + 5.111 X 1 X 5 10.134 X 2 X 4 + 9.476 X 3 X 5
E = 10.4785 + 3.9654 X 1 6.2846 X 2 + 2.1523 X 3 + 5.9667 X 4 + 1.0471 X 5 + 4.4513 X 1 X 5 2.2635 X 2 X 3 + 6.1807 X 3 X 4 + 2.9091 X 4 X 5
In the above equations, X 1 through X 5 represent the grouting material, number of freeze–thaw cycles, fracture dip angle, confining pressure, and roughness, respectively.
Table 6 and Table 7 show that the p-values of the single-factor explanatory variables grouting material, number of freeze–thaw cycles, fracture dip angle, confining pressure, and roughness are all below 0.05, indicating that each factor significantly affects peak stress and elastic modulus. Based on the absolute values of the effect coefficients, the order of the single factors’ effects on peak stress is confining pressure > fracture dip angle > grouting material > number of freeze–thaw cycles > roughness, while their effects on elastic modulus follow the order of freeze–thaw cycles > confining pressure > grouting material > fracture dip angle > roughness. This aligns with the previous discussion on the impact of individual factors. Further analysis of the p-values and effect coefficients revealed five significant interaction terms affecting peak stress. Among them, the interaction between grouting material and confining pressure had the strongest effect, with a coefficient of 16.075, surpassing the individual effects of the number of freeze–thaw cycles and roughness on peak stress. Additionally, four interaction terms significantly affected the elastic modulus, with their absolute effect coefficients exceeding the single effect of fracture dip angle on the elastic modulus. This suggests that interactions play a more complex and significant role in determining peak stress and elastic modulus. Single factors alone cannot fully explain changes in rock mechanical properties, highlighting the need to clarify the influence of various interaction effects.

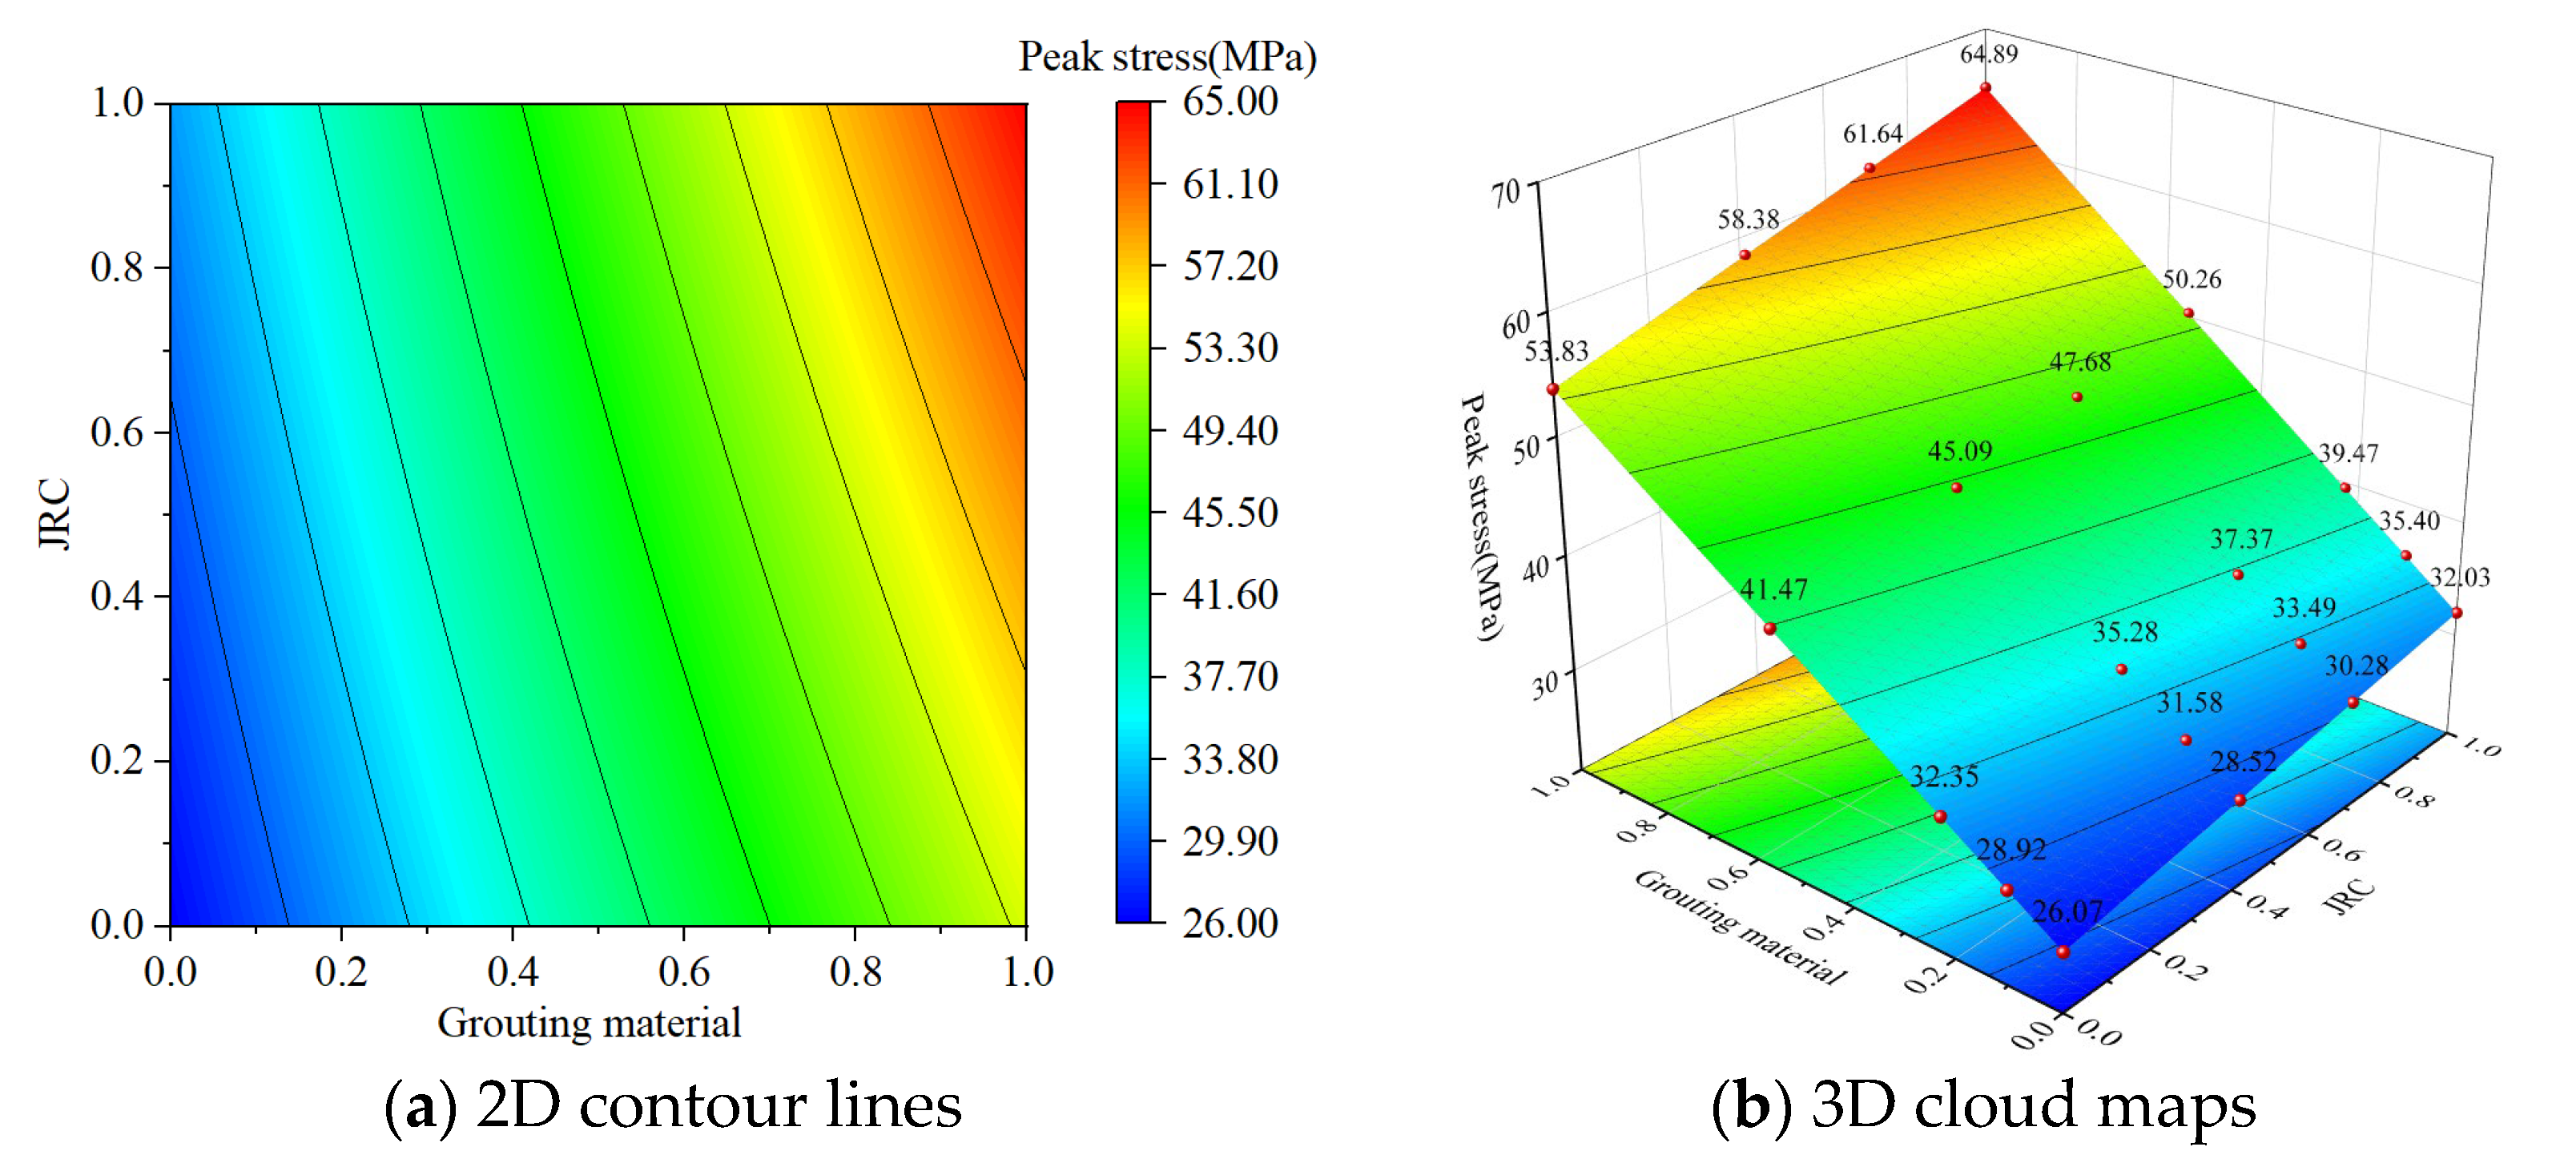
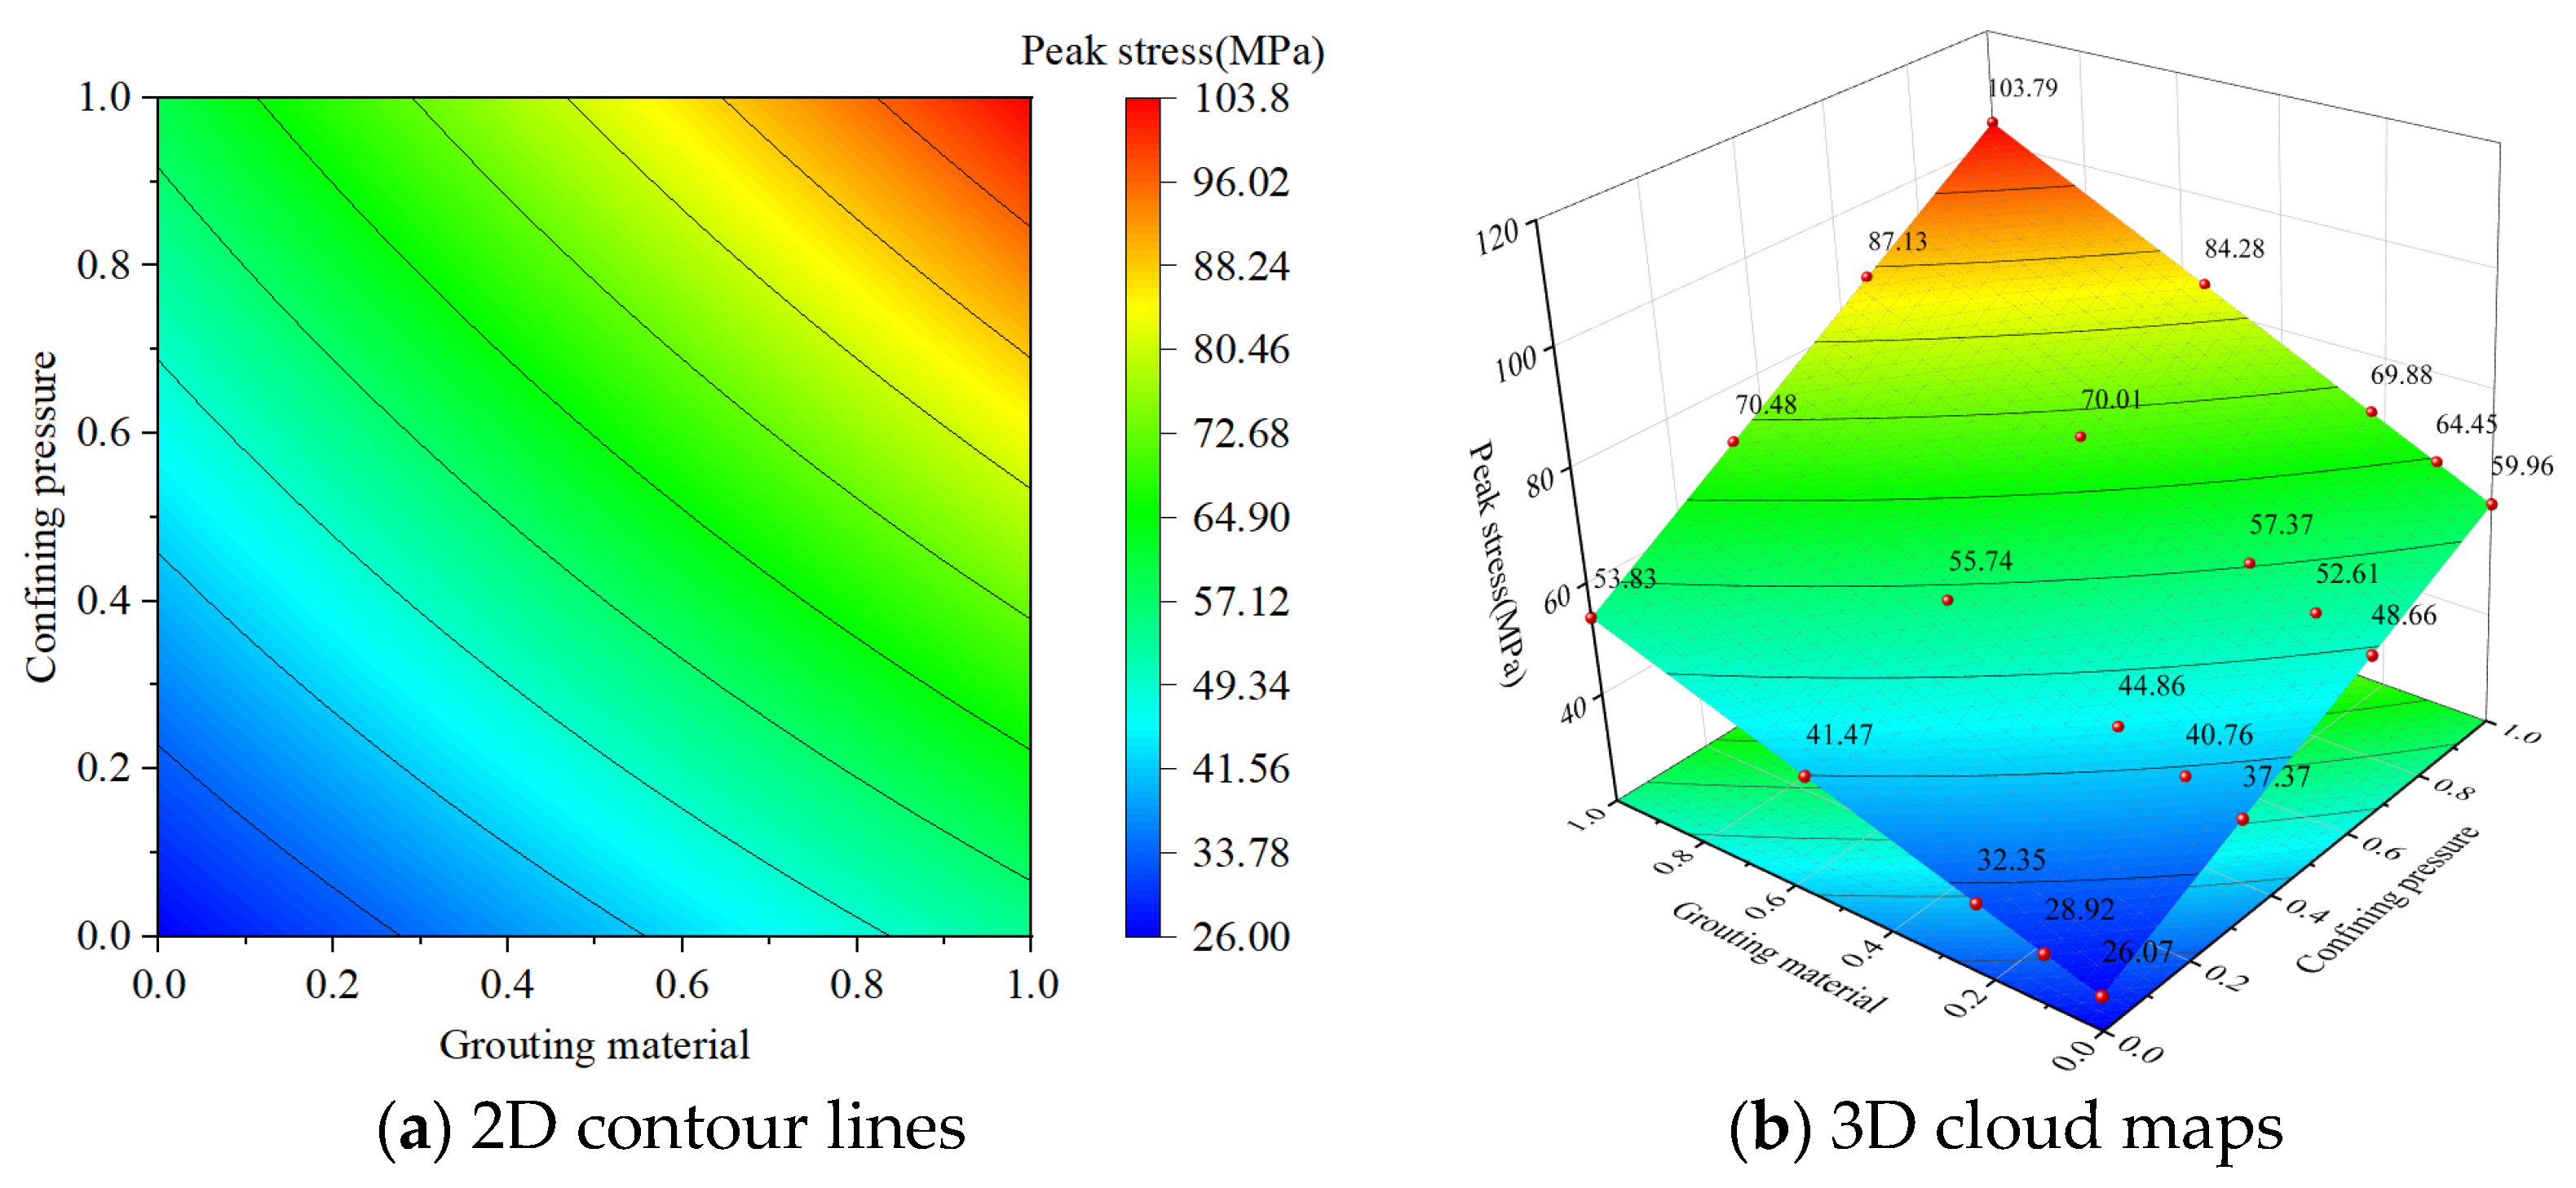
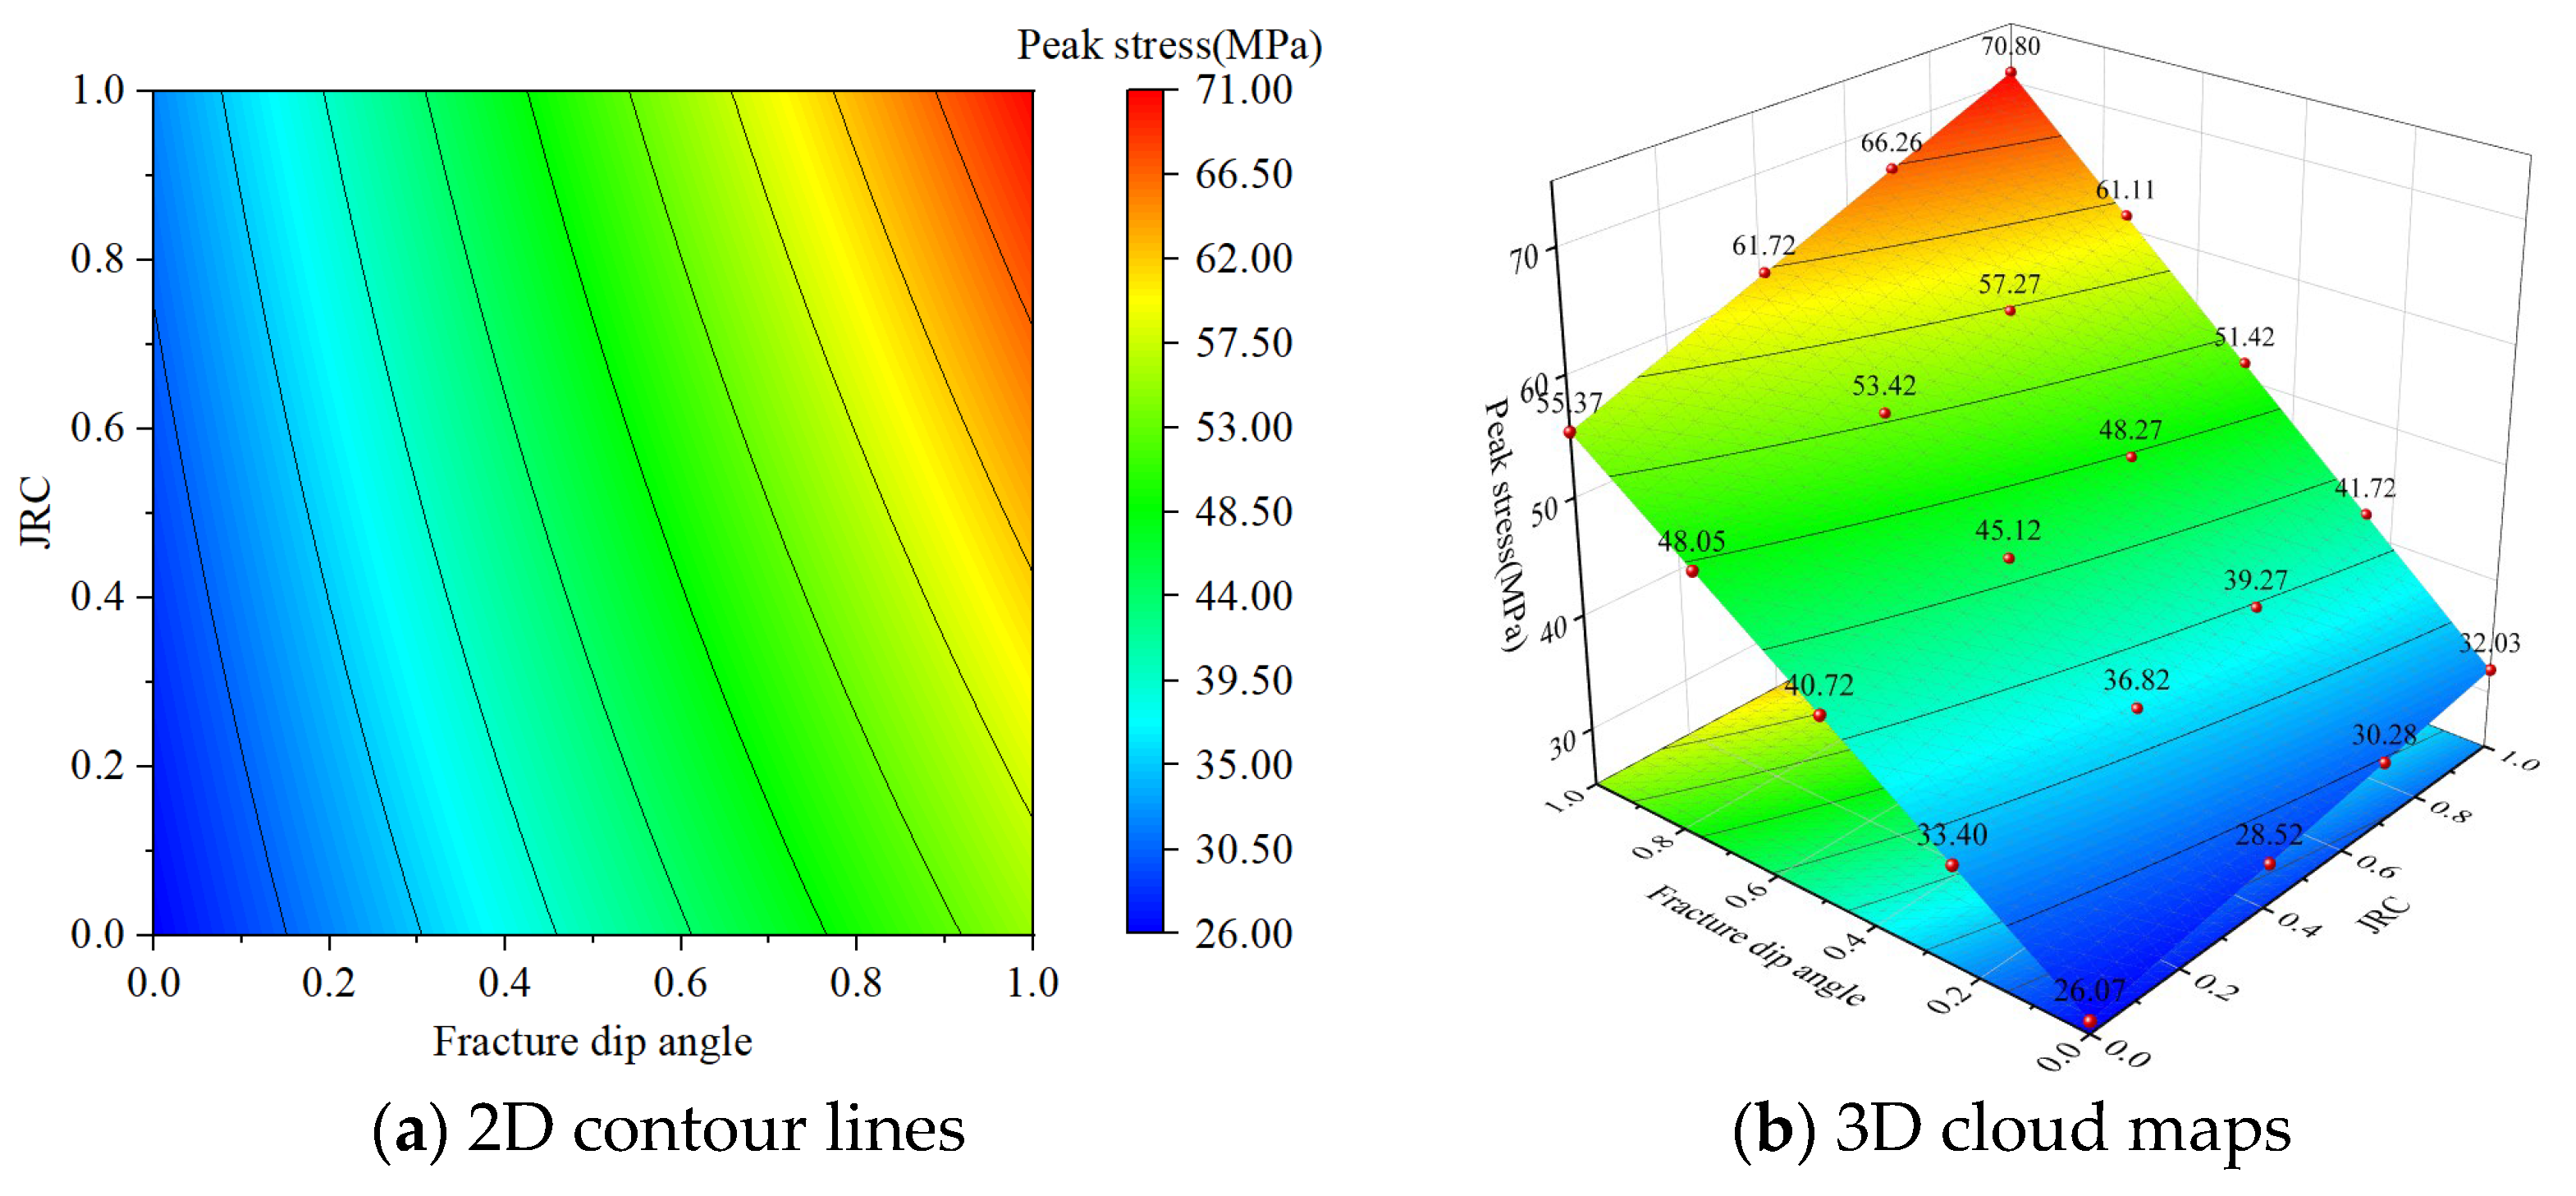
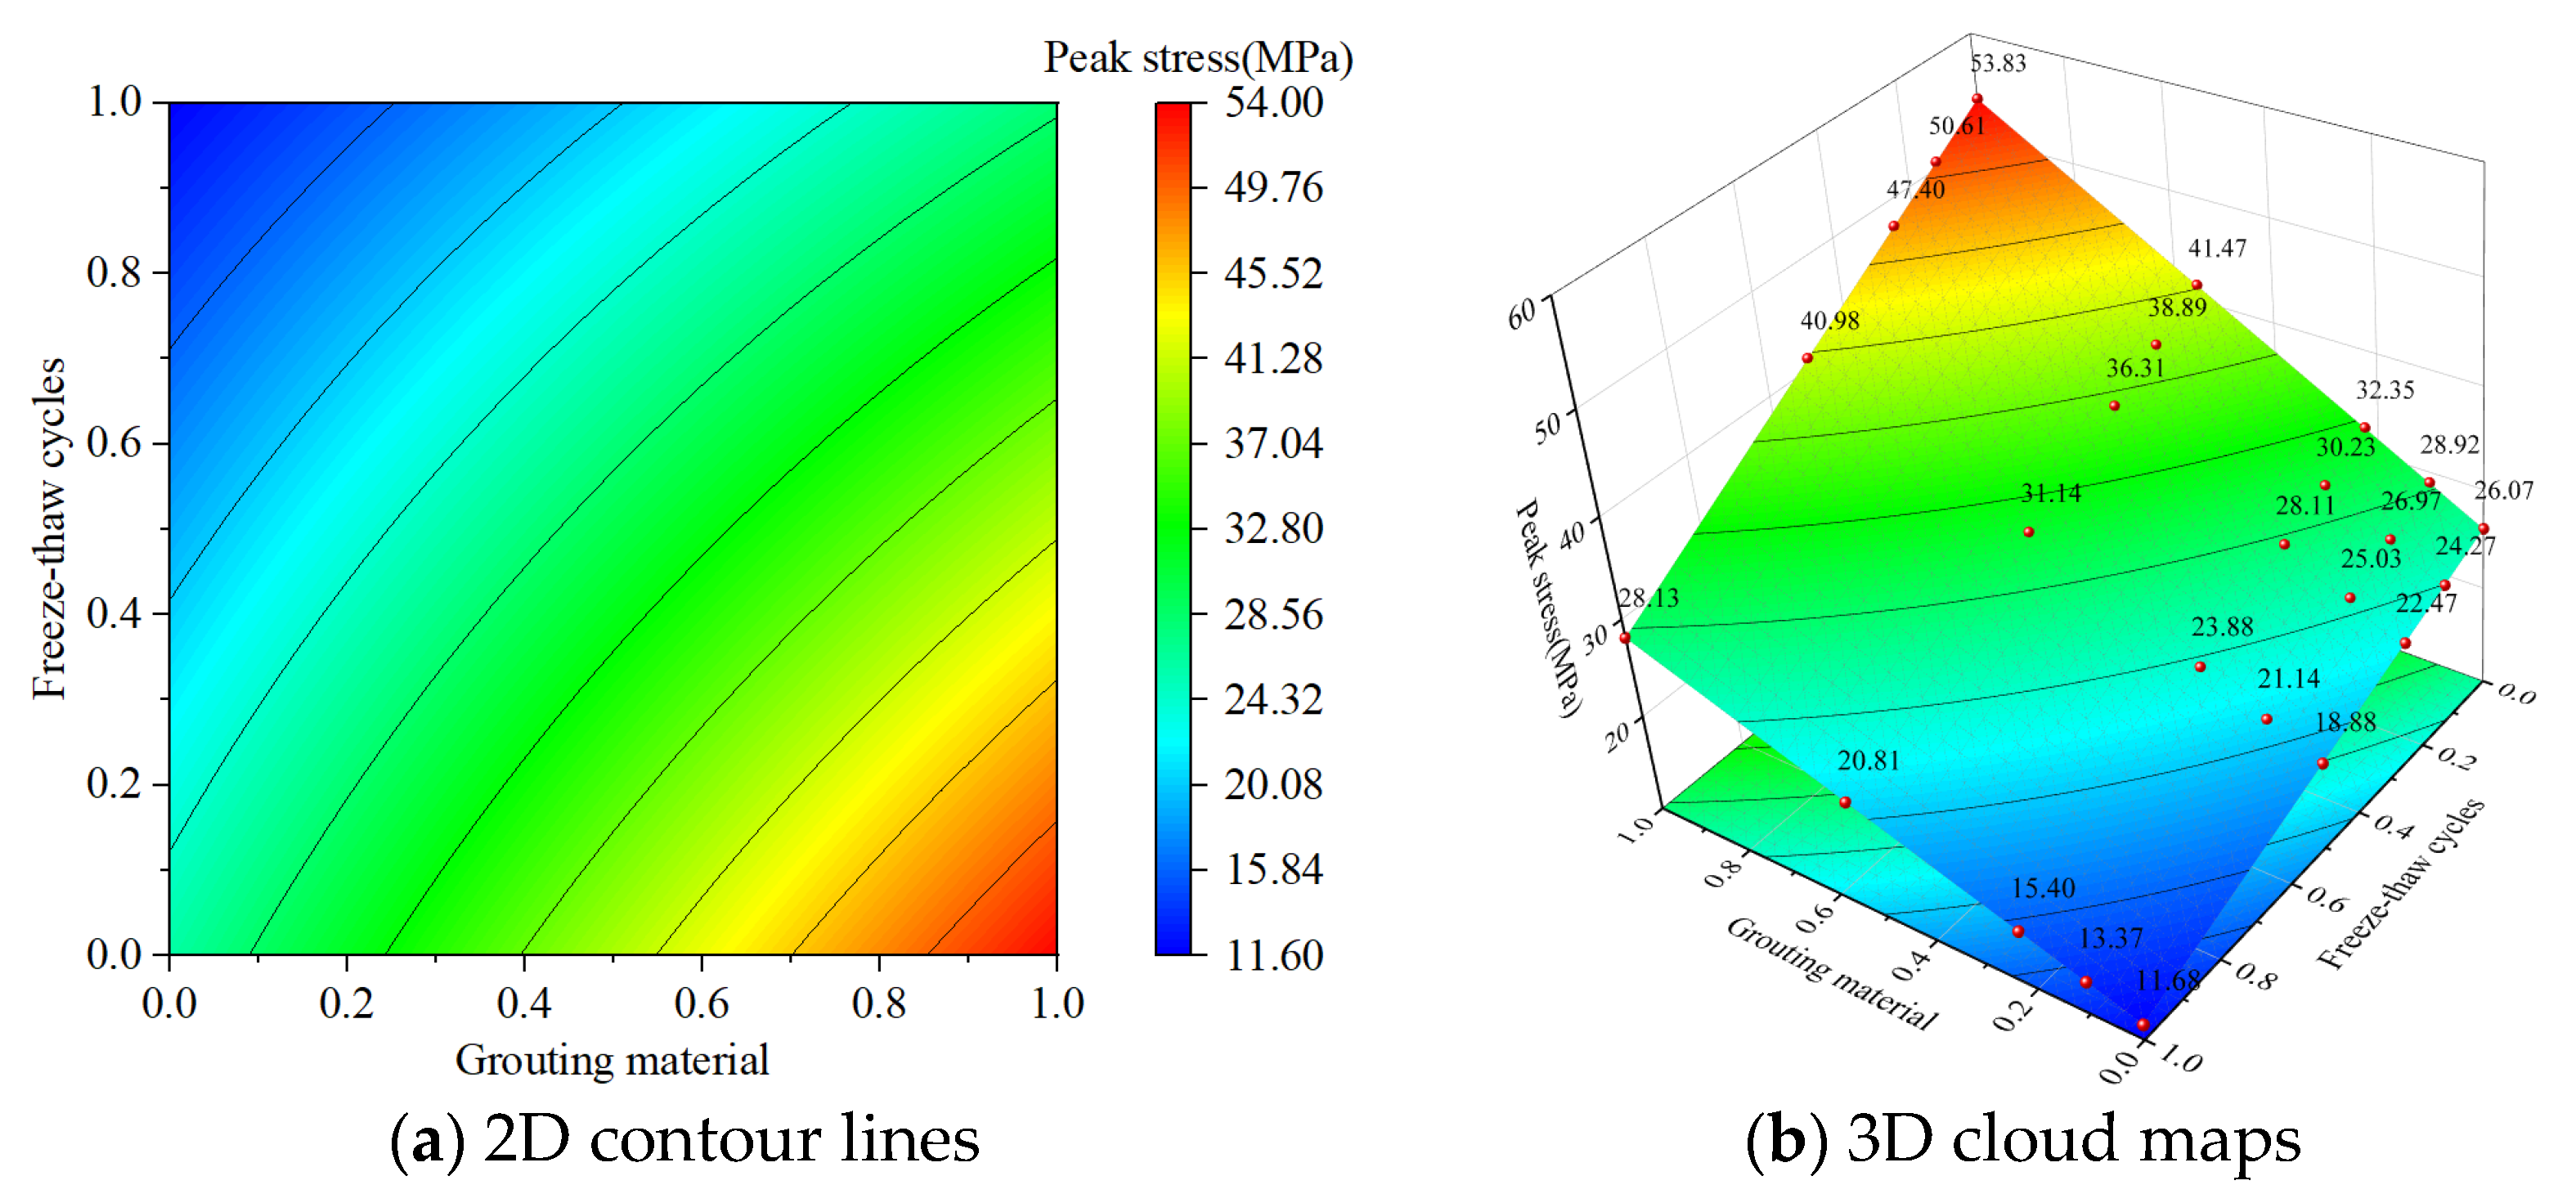
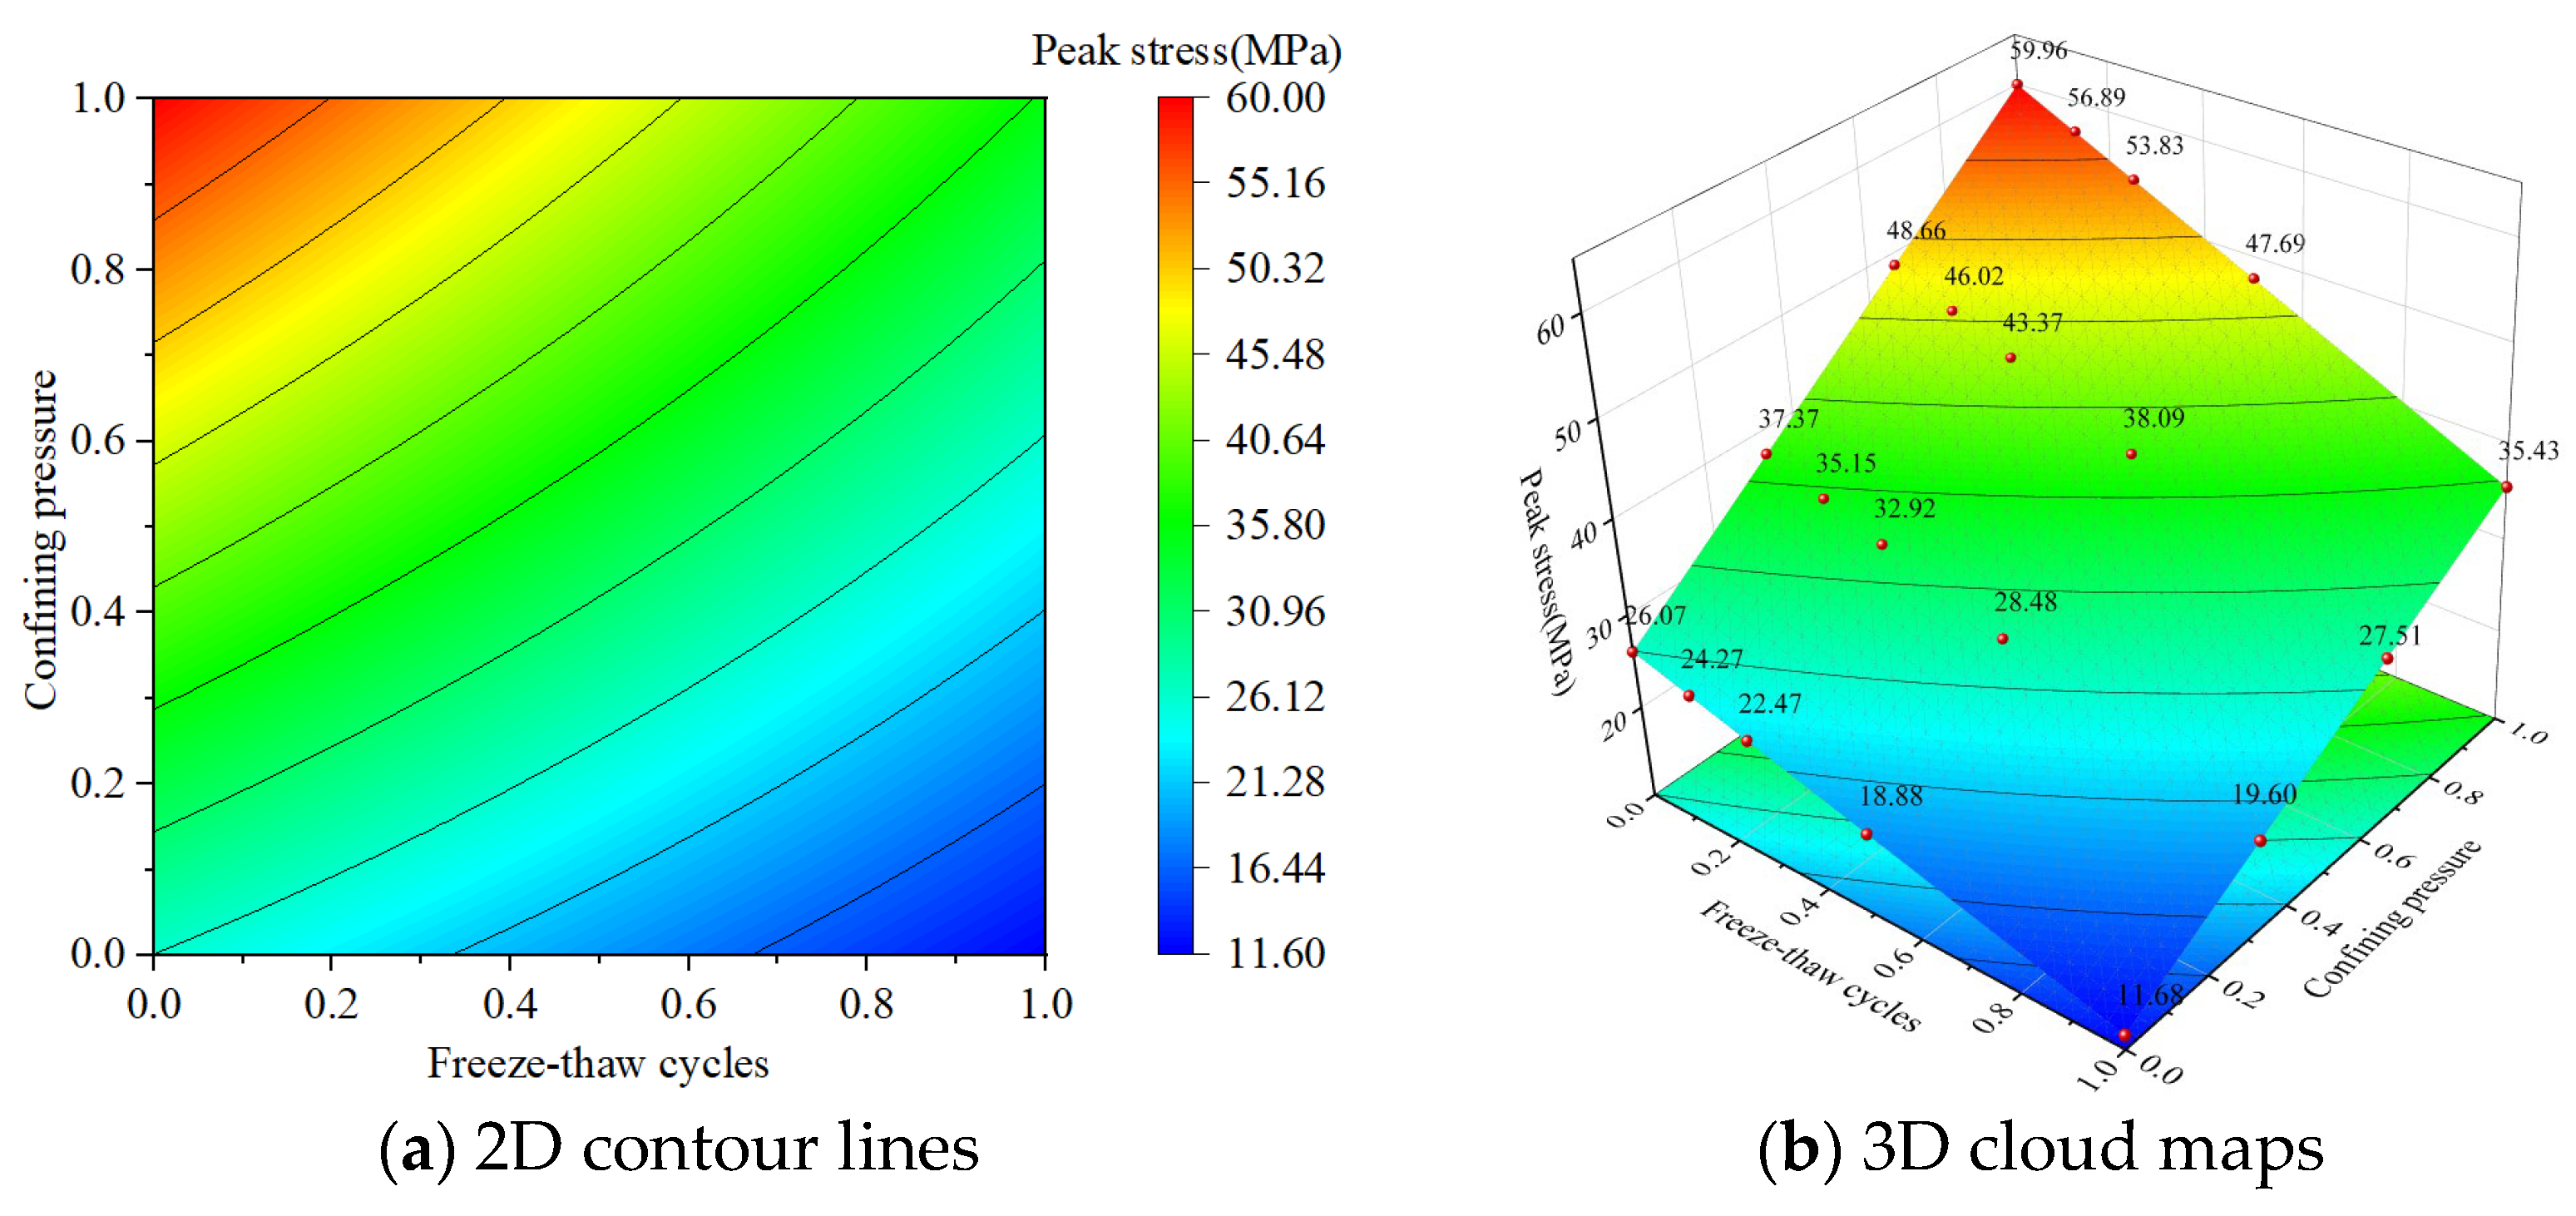
3.3.2. Factor Interactions on Peak Stresses

Figure 8, Figure 9 and Figure 10 show that under the combined effects of grouting material and roughness, grouting material and confining pressure, and fracture dip angle and roughness, the peak stress of the rock specimen increases. This increase is greater than the effect of the independent combination of the two factors: the increase in peak stress due to the interaction of grouting material and roughness is 7.68%, due to the interaction of grouting material and confining pressure is 17.42%, and due to the interaction of fracture dip angle and roughness is 19.69%. From the density of the contour lines, it is evident that confining pressure in the interaction between grouting material and confining pressure, fracture dip angle in the interaction between fracture dip angle and roughness, and grouting material in the interaction between grouting material and roughness have a more prominent influence on peak stress, respectively.
Interaction between grouting material and roughness: As the strength and roughness of the grouting material increase, the peak stress shows a clear increasing trend, and the interaction between the two further strengthens this effect. Specifically, when the strength and roughness of the grouting material are both at a high level, the increase in peak stress is the greatest; when they are at a medium or low level, the increase in peak stress tends to stabilize. Specifically, during the transition from low to high grout material strength, the peak stress gain increased nonlinearly from 5.96 MPa to 11.06 MPa, an increase of 1.86-times, as the roughness increased. Under the condition of low-strength grouting material, although the increase in roughness will enhance the frictional resistance and bite effect of the fracture surface, the reinforcement effect of the low-strength grouting material itself is limited, resulting in a small increase in peak stress. Under the condition of high-strength grouting material, the material forms a stronger anchoring system with the rough fracture surface, which not only effectively disperses the external stress but also further reduces the stress concentration effect at the fracture tip, thus significantly increasing the peak stress. In addition, during the transition from low to high roughness, as the strength of the grouting material increases, the peak stress gain increases nonlinearly from 27.76 MPa to 32.86 MPa, an increase of 1.18-times. Under low roughness conditions, the fracture surface is relatively smooth, and the bite with the grouting material is weak, so even if the strength of the grouting material increases, its effect on increasing the peak stress is relatively limited. Under high roughness conditions, the uneven structure of the fracture surface can significantly enhance the anchoring effect of the grouting material, so that the high-strength characteristics of the grouting material can be brought into full play, resulting in a greater increase in peak stress.
Interaction between grouting material and confining pressure: As the strength of the grouting material and confining pressure increase, the overall trend of peak stress variation is similar to the interaction between grouting material and roughness, exhibiting a strong synergistic effect. During the transition from low to high confining pressure, as the strength of the grouting material increases, the gain in peak stress increases nonlinearly from 27.76 MPa to 43.83 MPa, an increase of 1.58-times. Under low confining pressure conditions, the confining pressure has a weak inhibitory effect on crack propagation, and the increase in the strength of the grouting material only has a limited strengthening effect in the grouting crack area. However, under high confining pressure, the confining pressure effectively inhibits crack sliding, while the high-strength grouting material enhances the bonding force of the crack surface, and the synergistic effect of the two significantly improves the bearing capacity of the rock specimen. In addition, during the transition from low to high strength of the grouting material, the peak stress gain increased nonlinearly from 33.89 MPa to 49.96 MPa with increasing confining pressure, an increase of 1.47-times. The low-strength grouting material has a limited reinforcement effect on the fracture surface, and the increase in peak stress mainly depends on the confining pressure compacting the fracture; under the condition of high-strength grouting material, the increase in bearing capacity of the fracture surface and the confining effect of the confining pressure form a strong synergistic effect, which fully inhibits the slip and expansion of the fracture and greatly improves the overall strength of the rock mass.
Interaction between fracture dip angle and roughness: As the inclination and roughness of the crack increase, there is a strong superposition effect on the peak stress. During the transition from a low to a high inclination angle, the gain in peak stress increases nonlinearly from 5.96 MPa to 15.43 MPa, an increase of 2.59-times, as the roughness increases. At low crack inclination angles, the angle between the crack surface and the principal stress direction is large, and the external force is mainly shear. However, an increase in roughness only slightly increases the frictional resistance and interlocking effect of the crack surface, resulting in a small increase in peak stress. At high crack inclination angles, the angle between the crack surface and the principal stress direction decreases, and the external force is more easily transmitted to the interior of the crack. The increase in roughness significantly enhances the anchoring effect and anti-slip ability between the fracture surfaces, thereby greatly increasing the peak stress. In addition, during the transition from low to high roughness, as the fracture inclination angle increases, the peak stress gain increases nonlinearly from 29.3 MPa to 38.77 MPa, an increase of 1.32-times. At low roughness conditions, the fracture surface is relatively smooth, it is less sensitive to changes in the fracture inclination angle, and changes in the fracture inclination angle have a limited effect on increasing the peak stress. However, at high roughness conditions, the concave–convex structure of the fracture surface not only disperses the stress more evenly and reduces the stress concentration effect but also relieves the stress accumulation at the fracture tip, delaying the fracture propagation, so that the peak stress increases significantly with the increase in the fracture inclination angle.
In summary, the nonlinear gain effect of peak stress is particularly obvious under the interactive effects of grouting material and roughness, grouting material and confining pressure, and fracture inclination angle and roughness. There is a significant interactive enhancement mechanism. Due to the strong superposition effect of the two factors, the peak stress of the rock specimen is the largest under the conditions of high grouting material strength and high roughness, indicating that for rock masses with high fracture roughness, the selection of high-strength grouting materials can better enhance the bearing capacity and stability of the rock mass; under high levels of confining pressure and grouting material conditions, the peak stress of the rock specimen is the largest, indicating that in high confining pressure environments (such as deep tunnels or mines), high-strength grouting materials should be given priority to fully utilize the gain effect of confining pressure; under conditions of high fracture dip and high roughness, the peak stress of the rock specimen is the largest, indicating that in geological environments with a large fracture dip angle, optimizing the roughness of the fracture surface can effectively increase the peak stress and overall stability of the rock mass.
According to Figure 11 and Figure 12, under the interactive effect of grouting material and the number of freeze–thaw cycles, and the number of freeze–thaw cycles and confining pressure, as the interactive factors increase, the peak stress of the rock specimen increases, but the increase is less than the effect of the two factors being superimposed independently (the decrease in peak stress due to the interaction between grouting material and number of freeze–thaw cycles is 86.46%, and the decrease due to the interaction between the number of freeze–thaw cycles and confining pressure is 57.68%). From the density of the contour lines, it is evident that grouting material in the interaction between grouting material and the number of freeze–thaw cycles, and confining pressure in the interaction between confining pressure and number of freeze–thaw cycles, has a more prominent influence on peak stress, respectively.
Interaction between grouting material and number of freeze–thaw cycles: During the transition from low to high numbers of freeze–thaw cycles, the peak stress gain decreases from 27.76 MPa to 16.45 MPa, a decrease of 40.7%, as the strength of the grouting material increases. The unfrozen and thawed rock mass has a high initial strength, and the improvement in the strength of the grouting material can significantly enhance the rock mass’s resistance to freeze–thaw damage. However, at a high number of freeze–thaw cycles, the rock mass will experience crack expansion and strength degradation due to repeated freezing and thawing, and even if the strength of the grouting material is improved, its effect on increasing the peak stress is limited. In addition, under the condition of low-strength grouting material, the increase in the number of freeze–thaw cycles resulted in a 55.2% decrease in peak stress, while under high-strength grouting material, the increase in the number of freeze–thaw cycles resulted in a 47.7% decrease in peak stress. The low-strength grouting material has a limited reinforcing effect on the crack surface, and the cumulative effect of freeze–thaw cycles is more likely to cause a decrease in peak stress. High-strength grouting material, on the other hand, can effectively slow down freeze–thaw damage, thereby maintaining a higher peak stress.
Interaction between number of freeze–thaw cycles and confining pressure: As the number of freeze–thaw cycles changes from low to high, the peak stress gain decreases from 33.89 MPa to 23.75 MPa with increasing confining pressure, a decrease of 29.9%. The unfrozen rock mass has a relatively complete structure, and the confining pressure helps to compact the original microcracks and micropores, thereby improving the strength of the rock mass. However, under a high number of freeze–thaw cycles, the rock specimen has been severely damaged, and the compaction effect of the confining pressure is limited, resulting in a smaller increase in peak stress. In addition, under low confining pressure conditions, the increase in the number of freeze–thaw cycles resulted in a 55.2% decrease in peak stress, while under high confining pressure conditions, the increase in the number of freeze–thaw cycles resulted in a 40.9% decrease in peak stress. Under low confining pressure, the lack of constraints on crack expansion exacerbated the deterioration of the rock mass due to the frost heaving effect caused by freezing and thawing. However, under high confining pressure conditions, the confining pressure effectively constrained the expansion and penetration of cracks, resisting the structural damage caused by the frost heaving force during the freeze–thaw cycle.
In summary, high-strength grouting materials can inhibit the attenuation of peak stress caused by freeze–thaw cycles, while a high level of freeze–thaw cycles inhibits the reinforcing effect of grouting materials. Similarly, high confining pressure can inhibit the reduction in peak stress caused by freeze–thaw cycles, while a high number of freeze–thaw cycles also inhibits the strengthening effect of confining pressure. This indicates that there is an obvious interactive inhibition mechanism between grouting materials and the number of freeze–thaw cycles and between the number of freeze–thaw cycles and confining pressure at high levels. However, when each factor is at a low level, the inhibitory mechanism of the interaction has less of an effect. This shows that in the harsh environment of low confining pressure and high freeze–thaw cycles, attention should be focused on improving the frost resistance of the rock mass. Measures such as optimizing the grouting material and applying confining pressure to strengthen the material can be used to minimize the impact of strength attenuation on structural safety.

3.3.3. Factor Interaction on Elastic Modulus

According to Figure 13, Figure 14 and Figure 15, under the interactive effects of fracture dip angle and confining pressure, grouting material and roughness, and confining pressure and roughness, the elastic modulus of the rock specimen increases as the interactive factors rise. The increase is more significant than when the two factors are considered independently (the increase in elastic modulus due to the interaction of fracture dip angle and confining pressure is 39.65%, due to the interaction of grouting material and roughness is 76.82%, and due to the interaction of confining pressure and roughness is 16.57%). From the density of the contour lines, it is evident that confining pressure in the interaction between fracture dip angle and confining pressure, grouting material in the interaction between grouting material and roughness, and confining pressure in the interaction between confining pressure and roughness have a more prominent influence on the elastic modulus, respectively.
Interaction between fracture dip angle and confining pressure: During the transition from low to high confining pressure, the elastic modulus gain increases nonlinearly from 2.15 GPa to 8.33 GPa as the dip angle of the fault increases, an increase of 3.87-times. During the transition from low to high dip angle of the fault, the elastic modulus gain increases nonlinearly from 5.97 GPa to 12.15 GPa as the confining pressure increases, an increase of 2.04-times. This can be attributed to the combined effects of high confining pressure and high fracture dip angle, which restructure the fracture network’s distribution and contact state. Microfractures are fully compacted, particle contact area increases, the angle between the fracture surface and principal stress direction decreases, and external stress is more effectively transmitted from the particle contact surface into the rock specimen. This results in stronger interaction between fractures, fewer through fractures and shear slips, leading to a significant increase in the rock specimen’s elastic modulus.
Interaction between grouting material and roughness: During the transition from low to high strength of the grouting material, the elastic modulus gain increases nonlinearly from 1.05 GPa to 5.5 GPa with increasing roughness, an increase of 5.24-times. During the transition from low to high roughness, the elastic modulus gain increases nonlinearly from 3.96 GPa to 8.41 GPa with increasing strength of the grouting material, an increase of 2.12-times. This occurs because high-strength grouting materials effectively reinforce the crack tip region and inhibit crack propagation, while high roughness offers more anchoring points for the grouting material, maximizing its bonding and reinforcing capabilities. This synergistic effect relieves stress accumulation at the crack tip, delaying crack propagation and breakthrough, which significantly increases the overall stiffness of the rock specimen.
Interaction between confining pressure and roughness: During the transition from low to high confining pressure, the elastic modulus gain increases from 1.05 GPa to 3.95 GPa nonlinearly with increasing roughness, an increase of 3.76-times. During the transition from low to high roughness, the elastic modulus gain increases from 5.97 GPa to 8.87 GPa nonlinearly with increasing confining pressure, an increase of 1.49-times. This occurs because, under the synergistic effect of high confining pressure and roughness, microcracks are compacted, and the mechanical interlocking and frictional resistance of the high-roughness crack surfaces are fully utilized under the confining pressure. The slip between cracks is effectively suppressed, and the stress concentration at the crack tips is reduced, leading to a more significant increase in elastic modulus.
According to Figure 16, there is an interaction between the number of freeze–thaw cycles and the angle of inclination. As the interactive factor increases, the elastic modulus of the rock specimen decreases and the degree of decrease is greater than the independent superposition effect of the two factors (an increase of 42.54%). It can be seen from the density of the contour lines that in the interaction, the number of freeze–thaw cycles has a more prominent effect on the elastic modulus.
As the number of freeze–thaw cycles and the inclination of the fissures increase, the trend in the elastic modulus changes. Specifically, under low freeze–thaw cycles, an increase in the fissure inclination raises the elastic modulus of sandstone by 20.51%, consistent with previous trends under single-factor conditions. However, under high freeze–thaw cycles, an increase in fissure inclination reduces the elastic modulus by 2.63%. Under low freeze–thaw cycles, internal damage to the fractured rock has not accumulated. Increasing the fracture inclination optimizes the angle between the fracture surface and the principal stress direction, reducing slippage or expansion, and more effectively transferring stress, which increases the elastic modulus. Under high freeze–thaw cycles, numerous microfractures develop inside the rock, significantly weakening its structural integrity. The increase in fracture inclination not only fails to optimize stress transfer but may also accelerate the structural deterioration of the rock. Moreover, increasing the number of freeze–thaw cycles under low crack dip angles resulted in a 60.02% decrease in elastic modulus, while under high crack dip angles, it led to a 67.70% decrease. High crack inclination may promote the expansion of microcracks near the fracture surface, whose direction of expansion interacts negatively with the principal stress, further exacerbating structural deterioration and resulting in a greater decrease in elastic modulus.
In summary, there is a significant interactive enhancement mechanism for the elastic modulus under the combined action of the dip angle of the fissure and confining pressure, the grouting material and roughness, and the confining pressure and roughness. In particular, when both factors are at high levels at the same time, the elastic modulus gain is the greatest, indicating that in rock engineering design, the mechanical properties of the rock mass can be effectively improved by reasonably utilizing the interaction of multiple factors. In addition, under the interactive effect of the number of freeze–thaw cycles and the dip angle of the fissures, the freeze–thaw cycles reverse the trend of the influence of the dip angle of the fissures on the elastic modulus, and there is an interactive reversal mechanism. This indicates that in cold regions, special attention should be paid to the freeze–thaw damage in areas of rock mass with high dip angles of fissures, and targeted protective measures and optimization plans should be formulated.

4. Conclusions

This study investigates the changes in the mechanical properties of sandstone under the independent and interactive effects of five factors, utilizing experimental methods such as indoor freeze–thaw cycles, triaxial compression testing, and acoustic emission monitoring. This study uncovers the interactive mechanisms influencing the mechanical properties of rock in complex environmental conditions. The following conclusions were primarily drawn:
(1)
The degree of influence of each factor on the peak stress of sandstone under the action of each factor is ranked as follows: confining pressure > fracture dip angle > grouting material > number of freeze–thaw cycles > roughness. The degree of influence on the elastic modulus is ranked as follows: number of freeze–thaw cycles > confining pressure > grouting material > fracture dip angle > roughness. Freeze–thaw cycles lead to the expansion of microfractures and the deterioration of the pore structure, which is expressed as a weakening effect. Grouting materials have a strengthening effect by improving the adhesion and support of the rock, the dip of the fissures improves the efficiency of stress transmission, roughness enhances the anchoring effect of the grout, and confining pressure improves the compactness of the rock specimen and limits deformation.
(2)
Under the interactive effect of grouting materials and roughness, high-strength grouting materials and high-roughness fissure surfaces form a strong anchoring system, which can effectively disperse external stress and reduce the stress concentration, resulting in a significant gain in peak stress. Under the interactive effect of grouting material and confining pressure, confining pressure effectively inhibits crack sliding, and grouting material enhances the bonding force of the crack surface, and the synergistic effect of the two significantly increases the peak stress of the rock specimen. Under the interactive effect of crack inclination and roughness, high crack inclination and high roughness enhance the anchoring effect and anti-sliding ability of the crack surface, relieve the stress accumulation at the crack tip, and result in a significant increase in peak stress. By making reasonable use of the above-mentioned interactive enhancement mechanism, the bearing capacity of the rock mass can be effectively improved.
(3)
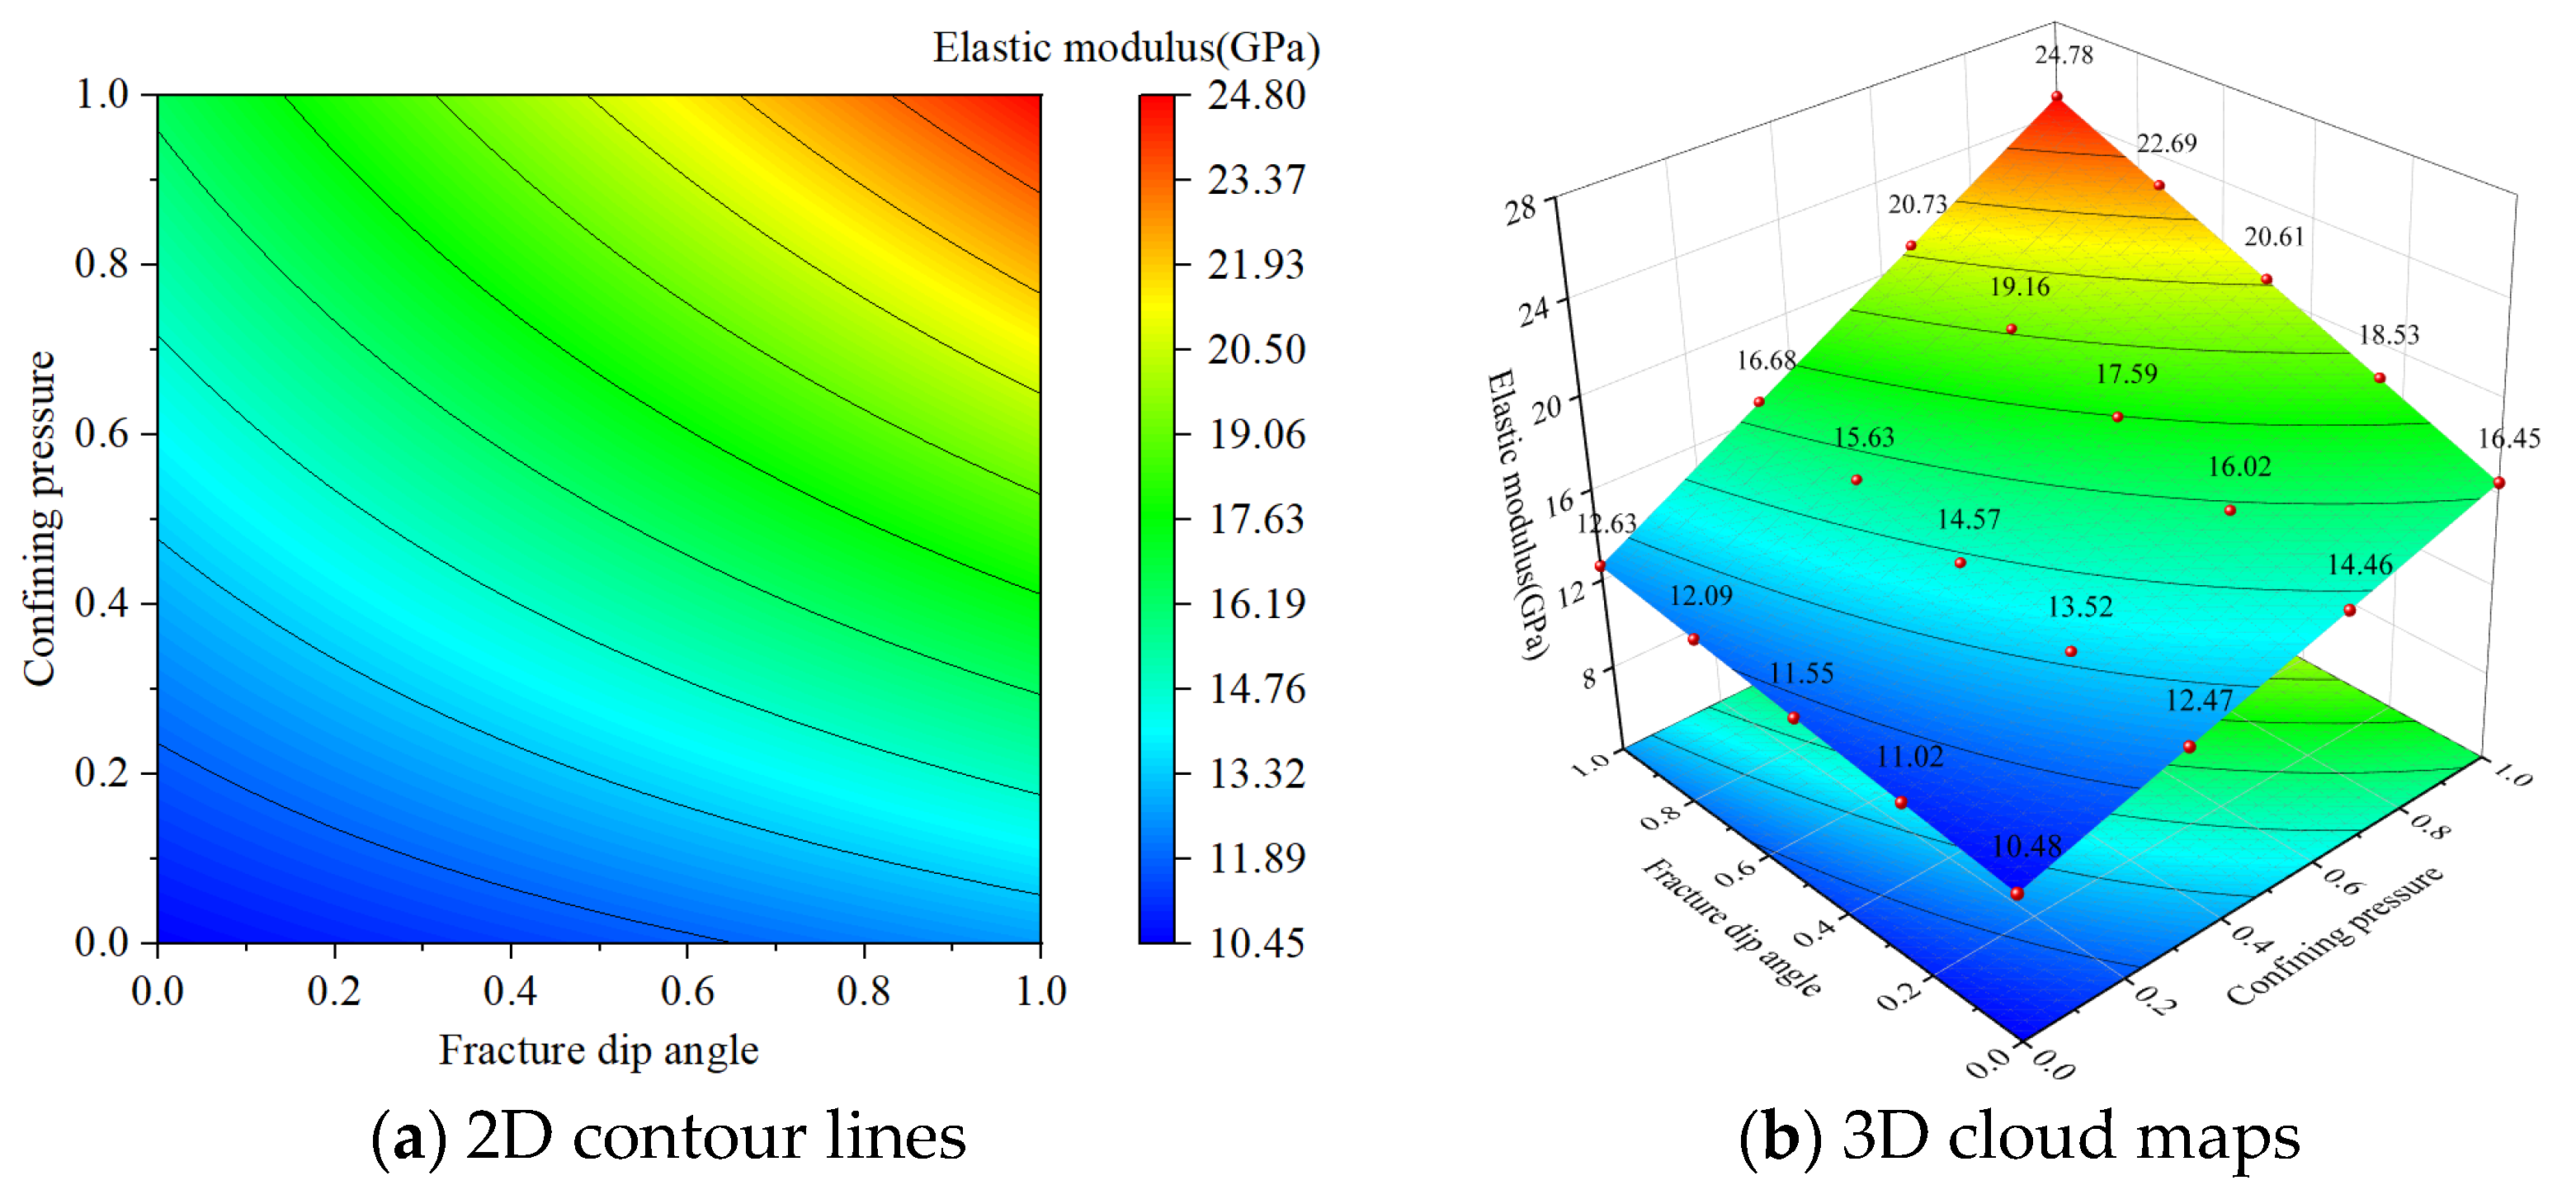
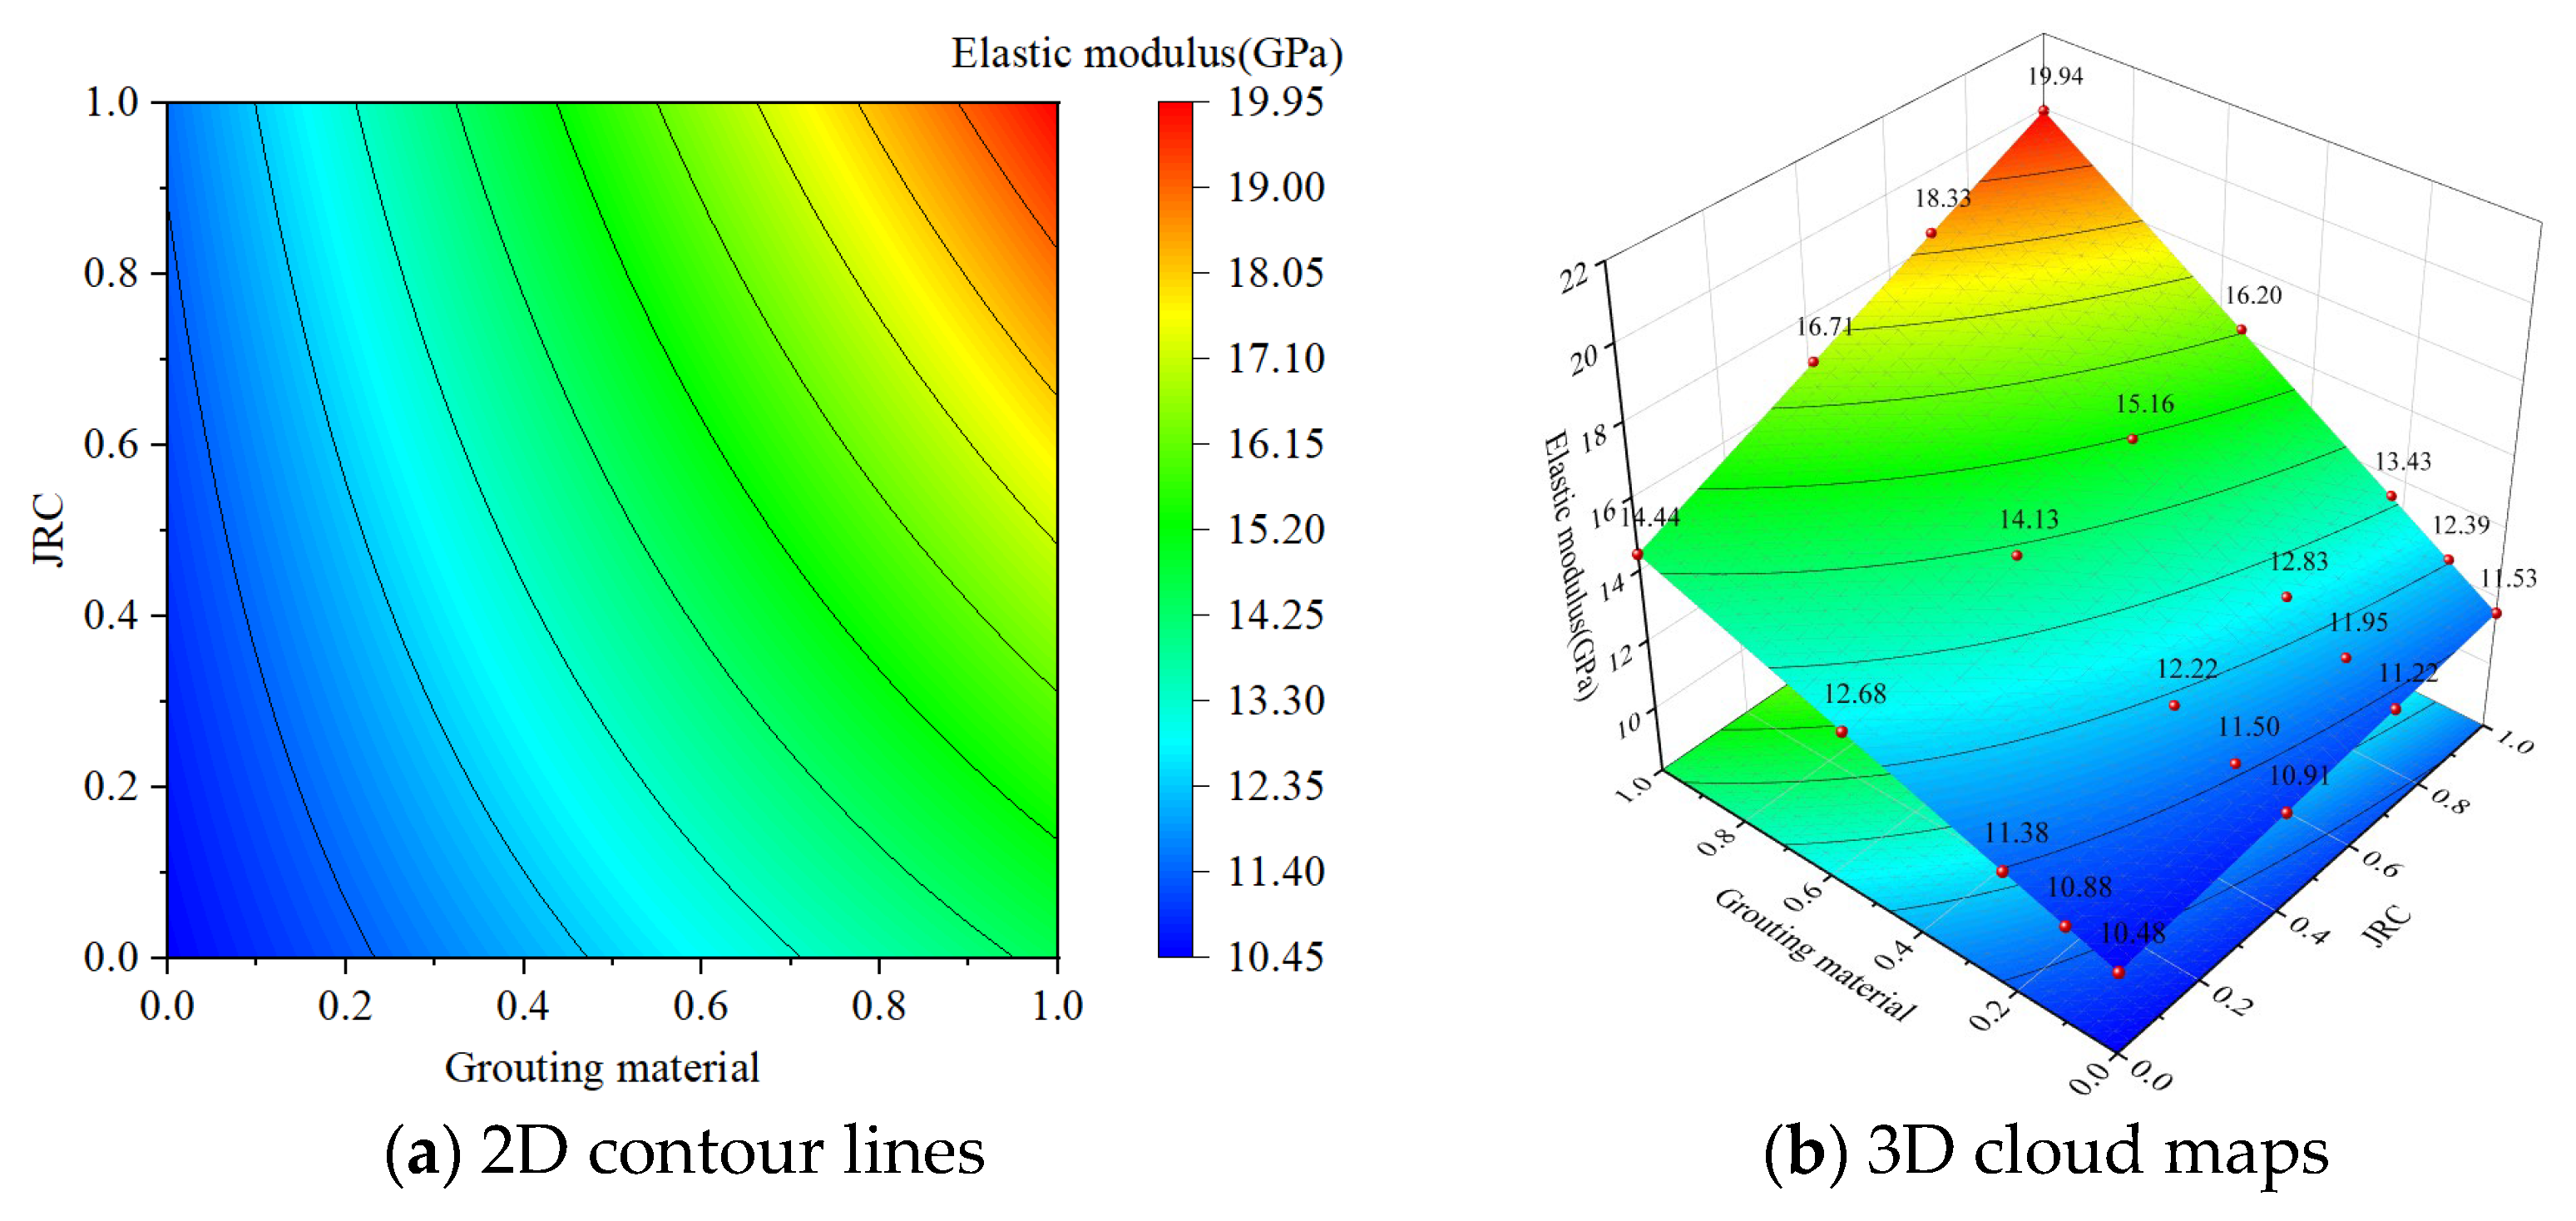
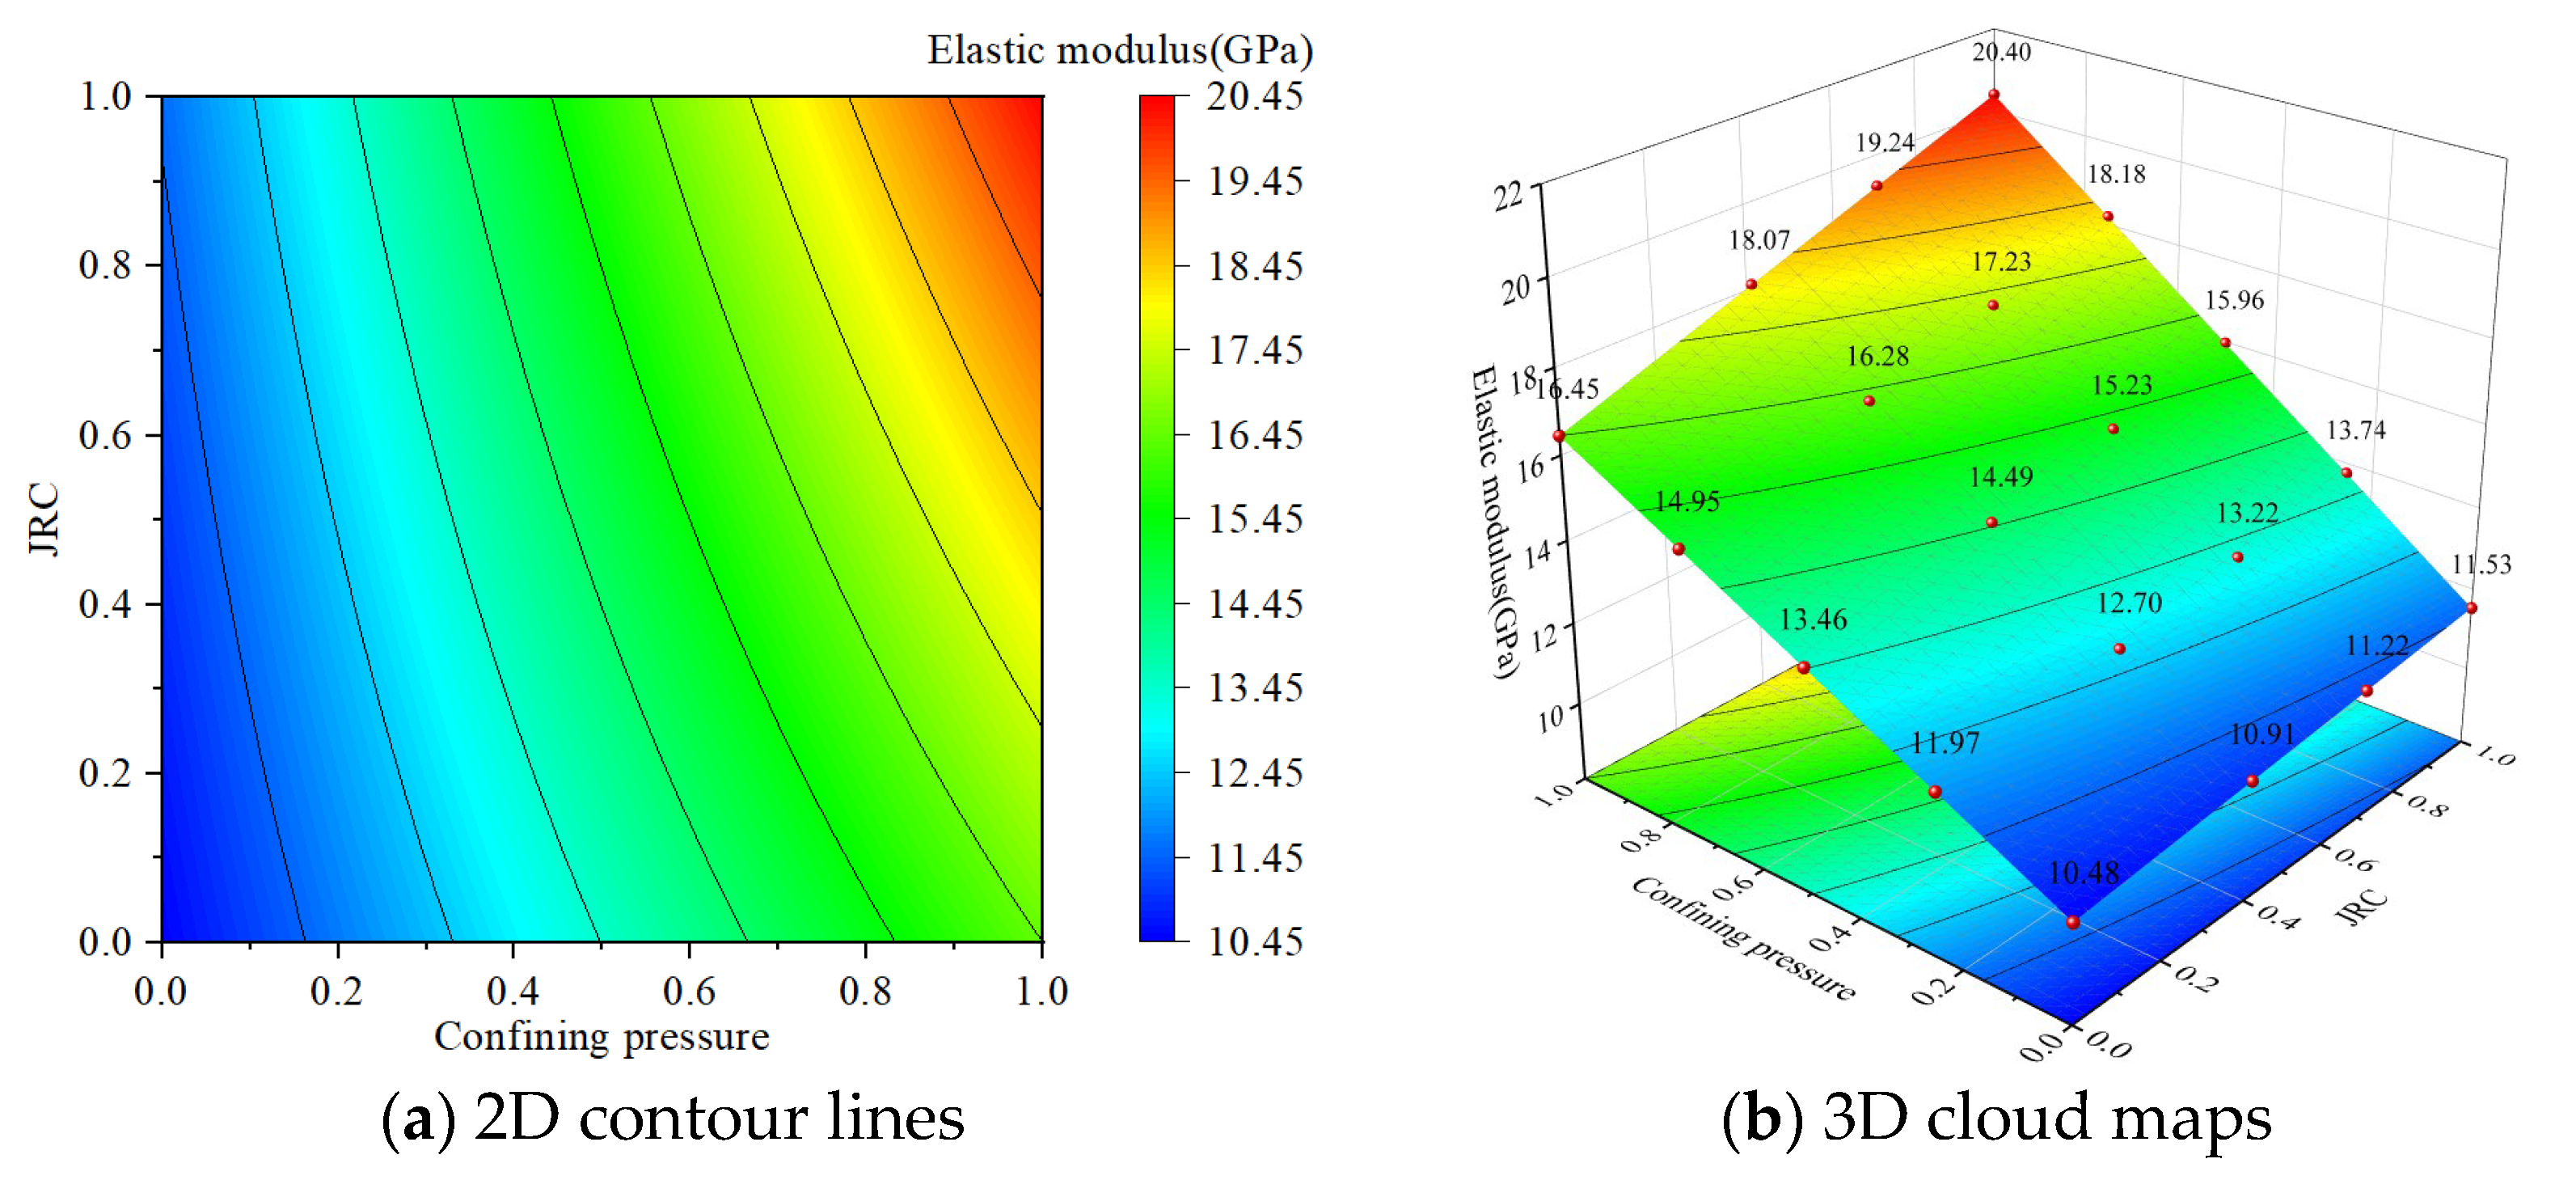
Under the interactive effect of confining pressure and fracture dip angle, high confining pressure and high fracture dip angle promote the reconstruction of the fracture network, the microfractures are fully compacted, the contact area of the particles increases, and the external stress is more effectively transmitted through the particle contact surface, resulting in a significant increase in the elastic modulus of the rock specimen. Under the interactive effect of grouting material and roughness, high-strength grouting material effectively reinforces the cracks, while high roughness provides more anchor points, further significantly increasing the elastic modulus of the rock specimen; under the interactive effect of confining pressure and roughness, high confining pressure and high roughness work together to compact the cracks and enhance the frictional resistance, significantly increasing the elastic modulus of the rock specimen. By reasonably utilizing the aforementioned interactive enhancement mechanisms, the deformation resistance of the rock mass can be effectively improved.
(4)
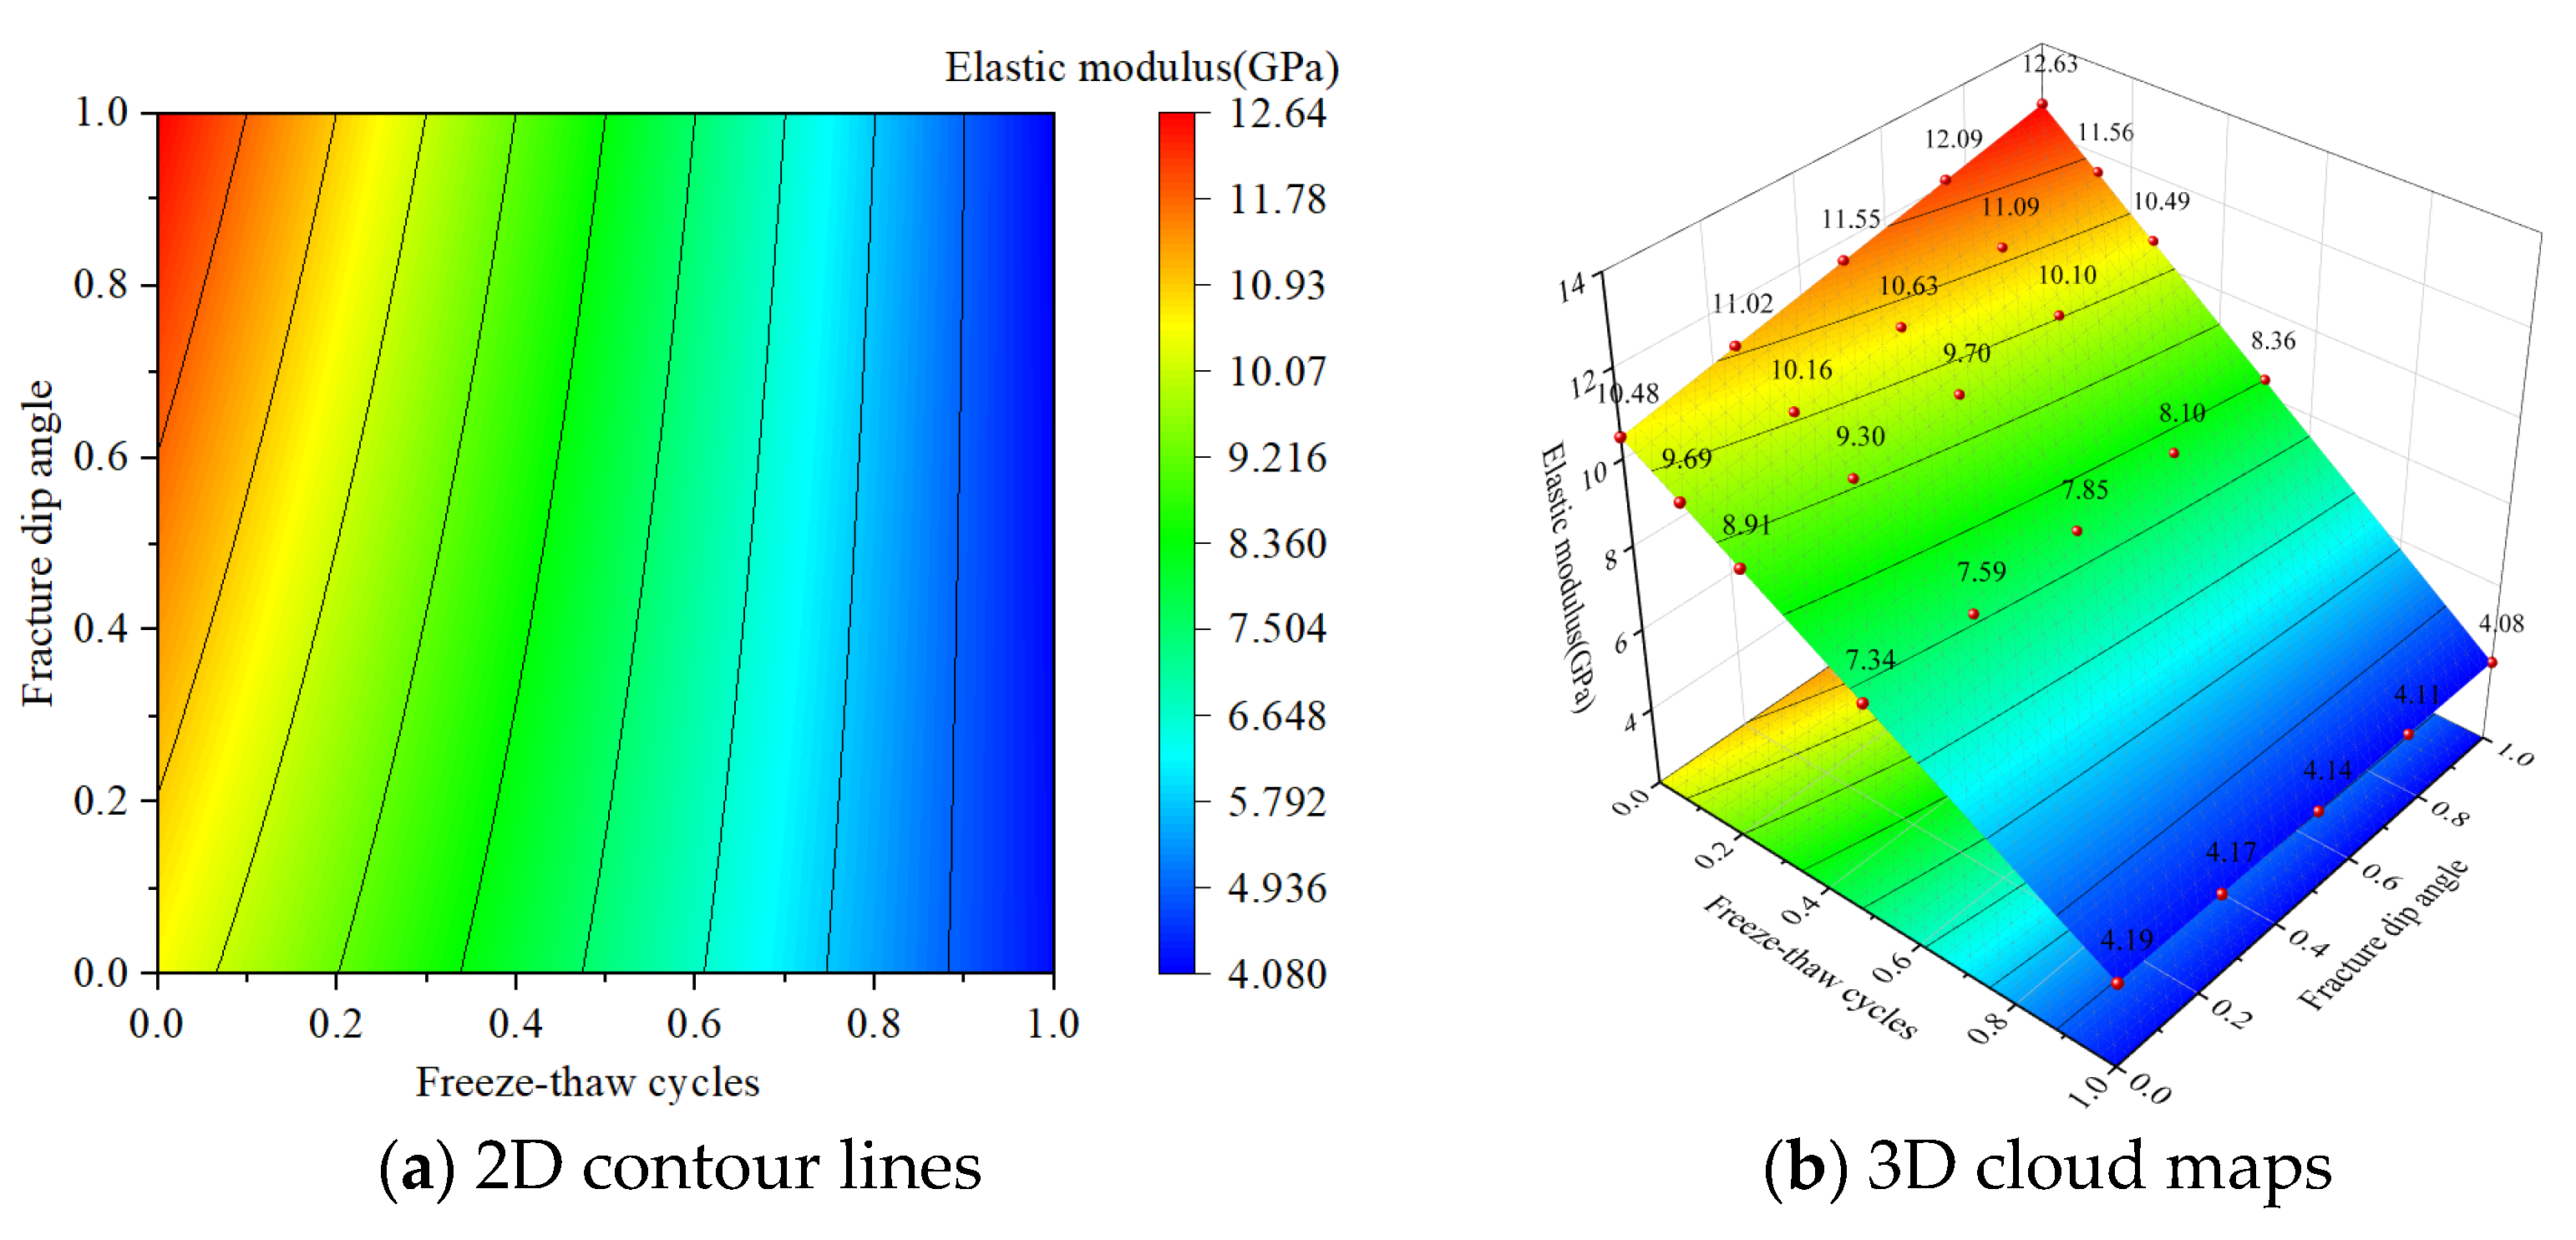
Under the interactive effect of grouting material and the number of freeze–thaw cycles, and the number of freeze–thaw cycles and confining pressure, both high levels of grouting material and confining pressure can reduce the impact of freeze–thaw cycles on peak stress. However, a high level of freeze–thaw cycles inhibits the reinforcing effect of grouting material and the strengthening effect of confining pressure, and there is an interactive inhibition mechanism for peak stress. Under the interactive effect of the number of freeze–thaw cycles and the inclination angle of the crack, the freeze–thaw cycle induces the expansion of microcracks near the surface of the crack with a high inclination angle. The direction of expansion of the microcracks has an adverse interaction with the direction of the principal stress, which in turn reverses the trend of the elastic modulus with the inclination angle of the crack. There is an interactive reversal mechanism.

Author Contributions

Conceptualization, R.B. and W.G.; methodology, R.B.; software, W.G.; validation, R.B. and W.G.; formal analysis, R.B.; investigation, R.B.; resources, R.B.; data curation, W.G.; writing—original draft preparation, R.B.; writing—review and editing, R.B. and W.G.; visualization, W.G.; supervision, R.B.; funding acquisition, R.B. All authors have read and agreed to the published version of the manuscript.

Funding

This research was funded by the National Natural Science Foundation of China (No. 11802230; 42377187).

Institutional Review Board Statement

Not applicable.

Informed Consent Statement

Not applicable.

Data Availability Statement

The data that support the findings of this study are available from the corresponding author upon reasonable request.

Acknowledgments

The authors would like to thank the anonymous reviewers for their careful reading of this article and valuable suggestions.

Conflicts of Interest

The authors declare no conflicts of interest.

Glossary

The following variables are used in this study:
ρ d Dry density of sandstone, g/cm3
ρ s a Saturated density of sandstone, g/cm3
m s Dry mass of the specimen, g
m s a Saturated mass of the specimen, g
A Cross-sectional area of the specimen, cm2
H Height of the specimen, cm
ω s a Saturated moisture content of sandstone, %
n 0 Porosity of sandstone, %
V Volume of the sandstone specimen, cm3
ρ ω Density of the pore water within the rock, assumed to be 1.0 g/cm3 for calculation purposes
l Average base length of the joint roughness, mm
h Average height of the joint roughness, mm
D Fractal dimension of the joint
JRC Joint roughness coefficient
Z 2 Root mean square of the first derivative
y i , y i + 1 Heights of consecutive data points
x i , x i + 1 Corresponding positions of the data points
n Total number of data points
σ max Peak stress
E Elastic modulus
X 1 Grouting material
X 2 Number of freeze–thaw cycles
X 3 Fracture dip angle
X 4 Confining pressure
X 5 Roughness

References

  1. Mortazavi, A.; Maadikhah, A. An investigation of the effects of important grouting and rock parameters on the grouting process. Geomech. Geoengin. 2016, 11, 219–235. [Google Scholar] [CrossRef]
  2. Cui, P.; Chen, R.; Xiang, L.; Su, F. Analysis of mountain disasters and their risks in the Tibetan Plateau under the background of climate warming. Prog. Clim. Change Res. 2014, 10, 103–109. [Google Scholar]
  3. Zhang, G.; Chen, G.; Xu, Z.; Yang, Y.; Lin, Z. Crack failure characteristics of different rocks under the action of frost heaving of fissure water. Front. Earth Sci. 2020, 8, 13. [Google Scholar] [CrossRef]
  4. Dan, R.; Bai, Y.; Sun, P.; Wu, Y.; Sui, S.; Yuan, H. Experimental study on freezing and expansion force characteristics of fractured red sandstone. J. China Coal Soc. 2019, 44, 1742–1752. [Google Scholar]
  5. Zhao, J.; Xie, M.; Yu, J.; Zhao, W. Experimental study on mechanical properties and damage evolution law of fracture-containing rocks under freeze-thaw action. J. Eng. Geol. 2019, 27, 1199–1207. [Google Scholar]
  6. Tian, S.; Zhao, Y.; Si, H.; Zhu, C.; Li, Q. Experimental study on freeze-thaw damage characteristics and mechanical properties of fractured rock mass of surface mine slope in cold region. J. China Coal Soc. 2024, 49, 4687–4700. [Google Scholar]
  7. Wu, X.; Ni, Z.; Zhu, J.; Qin, K.; Tang, K. Mechanical properties and crack extension characteristics of fissured chert under freeze-thaw cycles. J. Chongqing Univ. 2025; in press. [Google Scholar]
  8. Lu, Y.; Li, X.; Wu, X. Mechanism of crack penetration in freeze-thawed single-fissure rock specimens under triaxial compression conditions. Rock Soil Mech. 2014, 35, 1579–1584. [Google Scholar]
  9. Liu, Y.; Guo, Y.; Huang, S.; Cai, Y.; Li, K.; Wang, L.; Li, W. Study on fracture characteristics and strength loss of fissure-like sandstone under freeze-thaw action. Rock Soil Mech. 2018, 39, 62–71. [Google Scholar]
  10. Fu, H.; Zhang, J.; Huang, Z.; Huang, H.; Shi, Y. Study on elastic parameters and uniaxial compressive strength of slate under freeze-thaw cycle. Rock Soil Mech. 2017, 38, 2203–2212. [Google Scholar]
  11. Yang, H.; Zhang, J.; San, R.; Wu, F. Experimental study on mechanical properties of frozen water-saturated single-fissure rock body. Rock Soil Mech. 2018, 39, 1245–1255. [Google Scholar]
  12. Lv, S.; Zhu, J.; Wang, B.; Zhu, Y. Macroscopic and fine-scale damage modeling of open-fractured sandstone under freeze-thaw load coupling. Chin. J. Rock Mech. Eng. 2023, 42, 1124–1135. [Google Scholar]
  13. Liu, H.; Liu, Y.; Xing, C.; Zhang, L.; Ma, M. Experimental study on damage destruction of jointed rock mass under cyclic freezing and thawing conditions. Rock Soil Mech. 2014, 35, 1547–1554. [Google Scholar]
  14. Yang, L.; Zhang, Y.; Tang, M.; Li, R.; Xu, Z.; Yin, H. Mechanical properties and damage mode of split grouting and solidification in water-rich and weak surrounding rock. J. Cent. South Univ. (Sci. Technol.) 2024, 55, 649–664. [Google Scholar]
  15. Lu, H.; Zhang, Q. Investigations on shear properties of soft rock joints under grouting. Rock Mech. Rock Eng. 2021, 54, 1875–1883. [Google Scholar]
  16. Liu, Q.; Lei, G.; Lu, C.; Peng, X.; Zhang, J.; Wang, J. Experimental study on the effect of grouting reinforcement on the mechanical properties of rock fracture. Chin. J. Rock Mech. Eng. 2017, 36, 3140–3147. [Google Scholar]
  17. Zhu, Y.; Ren, H.; Wang, P.; Li, P.; Wang, X.; Wei, M. Analysis of grouting test and reinforcement mechanism in rocks with single penetration rupture surface. Rock Soil Mech. 2022, 43, 3221–3230. [Google Scholar]
  18. Niu, Y.; Hu, Y.; Wang, J. Cracking characteristics and damage assessment of filled rocks using acoustic emission technology. Int. J. Geomech. 2023, 23, 04023013. [Google Scholar] [CrossRef]
  19. Tang, J.; Liu, Q.; Dai, Z.; Wang, Y. Research on mechanical properties and damage mode of grouted fissured sandy mudstone. Chin. J. Undergr. Space Eng. 2021, 17, 1028–1037. [Google Scholar]
  20. Shen, J.; Liu, B.; Chen, J.; Li, Y.; Cheng, Y.; Song, Y. Experimental study on the physical and mechanical properties of grouting in gabbroic fissures. Chin. J. Rock Mech. Eng. 2020, 39, 2804–2817. [Google Scholar]
  21. Brown, E.T. Rock Characterization, Testing and Monitoring: ISRM Suggested Methods; Pergamon Press: Oxford, UK, 1981; pp. 107–110. ISBN 978-0-080-27308-2. [Google Scholar]
  22. Culshaw, M.G.; Ulusay, R. (Eds.) The ISRM suggested methods for rock characterization, testing and monitoring: 2007–2014: Cham, Switzerland: Springer. Bull. Eng. Geol. Environ. 2015, 74, 1499–1500. [Google Scholar]
  23. ASTM D4543-19; Standard Practices for Preparing Rock Core as Cylindrical Test Specimens and Verifying Conformance to Dimensional and Shape Tolerances. ASTM International: West Conshohocken, PA, USA, 2019.
  24. Xie, H. Fractal description of rock joints. Chin. J. Geotech. Eng. 1995, 17, 18–23. [Google Scholar]
  25. Chen, S.J.; Zhu, W.C.; Wang, C.Y.; Zhang, F. Review of research progresses of the quantifying joint roughness coefficient. Chin. J. Theor. Appl. Mech. 2017, 49, 239–256. [Google Scholar]
  26. Jia, H.L.; Zhao, S.Q.; Ding, S.; Wang, T.; Dong, Y.H.; Tan, X.J. Study on the evolution and influencing factors of frost heaving force of waterbearing cracks during freezing-thawing process. Chin. J. Rock Mech. Eng. 2022, 41, 1832–1845. [Google Scholar]
  27. Liu, H.; Lin, J.H.; Yang, G.S.; Yun, Y.; Zhang, H.; Liang, B.; Zhang, Y. Acoustic emission test on tensile damage characteristics of sandstone under freeze-thaw cycle. J. Min. Saf. Eng. 2020, 38, 830–839. [Google Scholar]
  28. Amini, M.; Younesi, H.; Bahramifar, N. Statistical modeling and optimization of the cadmium biosorption process in an aqueous solution using Aspergillus niger. Colloids Surf. A Physicochem. Eng. Asp. 2009, 337, 67–73. [Google Scholar]
  29. Yetilmezsoy, K.; Demirel, S.; Vanderbei, R.J. Response surface modeling of Pb (II) removal from aqueous solution by Pistacia vera L.: Box-Behnken experimental design. J. Hazard. Mater. 2009, 171, 551–562. [Google Scholar]
  30. Li, H.; Zhang, G.; Li, X.; Zhang, H.; Zhang, Q.; Liu, W.; Mu, G. Calibration of the discrete element method parameters in living juvenile Manila clam (Ruditapes Philippinarum) and seeding verification. Agriengineering 2021, 3, 894–906. [Google Scholar] [CrossRef]
Figure 1. Flow chart for preparation of slurry-fractured sandstone.
Applsci 15 04101 g001
Figure 2. TMS9022 Environmental Test Chamber.
Applsci 15 04101 g002
Figure 3. Freeze–thaw cycle process.
Applsci 15 04101 g003
Figure 4. Rock mechanics tester and rock specimen installation.
Applsci 15 04101 g004
Figure 5. Detailed diagram of the acoustic emission installation and auxiliary components.
Applsci 15 04101 g005
Figure 6. Stress–strain curve of sandstone under the action of different factors.
Applsci 15 04101 g006
Figure 7. Plot of ringer counts: cumulative ringer counts versus time for single–factor effects.
Applsci 15 04101 g007
Figure 8. Visualization of the interaction effect between grouting material and roughness on peak stress.
Applsci 15 04101 g008
Figure 9. Visualization of the interaction effect between grouting material and confining pressure on peak stress.
Applsci 15 04101 g009
Figure 10. Visualization of the interaction effect between fracture dip angle and roughness on peak stress.
Applsci 15 04101 g010
Figure 11. Visualization of the interaction effect between grouting material and the number of freeze–thaw cycles on peak stress.
Applsci 15 04101 g011
Figure 12. Visualization of the interaction effect between the number of freeze–thaw cycles and confining pressure on peak stress.
Applsci 15 04101 g012
Figure 13. Visualization of the interaction effect between fracture dip angle and confining pressure on the elastic modulus.
Applsci 15 04101 g013
Figure 14. Visualization of the interaction effect between grouting material and roughness on the elastic modulus.
Applsci 15 04101 g014
Figure 15. Visualization of the interaction effect between confining pressure and roughness on the elastic modulus.
Applsci 15 04101 g015
Figure 16. Visualization of the interaction effect between the number of freeze–thaw cycles and fracture dip angle on the elastic modulus.
Applsci 15 04101 g016
Table 1. Mineral composition of sandstone (%).
QuartzCalciteAlbiteKaolinChlorite
45.26.832.17.58.4
Table 2. Mean values of physical parameters of sandstone.
Longitudinal Wave Velocity (m·s−1)Dry Density (g·cm−3)Saturated Density
(g·cm−3)
Saturated Moisture Content
(%)
Porosity
(%)
2.9681.5611.6384.9287.695
Table 3. Basic mechanical properties of grouting materials.
MaterialUniaxial Compressive Strength (MPa)Young’s Modulus (GPa)Poisson’s Ratio
Ice (−20 °C)6.74.60.28
Gypsum paste14.82.10.24
Cement mortar36.28.40.27
Epoxy resin65.34.80.39
Table 4. Table of orthogonal experimental designs.
Rock Specimen NumberGrouting MaterialFreezing–Thawing
Cycles
Fissured Angles
(°)
JRCConfining Pressures
(MPa)
1/01500
2/53093
3/1045156
4/2060229
5Ice030159
6Ice515226
7Ice106003
8Ice204590
9Gypsum paste045223
10Gypsum paste560150
11Gypsum paste101599
12Gypsum paste203006
13Cement mortar06096
14Cement mortar54509
15Cement mortar1030220
16Cement mortar2015153
17Epoxy resin407500
18Epoxy resin407593
19Epoxy resin4075156
20Epoxy resin4075229
21/07503
22Ice57590
23Gypsum paste1075159
24Cement mortar2075226
25Epoxy resin01596
26Epoxy resin53009
27Epoxy resin1045220
28Epoxy resin2060153
29/4015150
30Ice4030223
31Gypsum paste404506
32Cement mortar406099
33/54593
34/103006
35Ice06000
36Ice201509
Table 5. Influence of factors on sandstone’s mechanical properties.
FactorEffect on StrengthEffect on StiffnessInfluence Mechanism
Freeze–thaw CyclesPeak stress decreases by 55.37%Elastic modulus decreases by 76.78%Freeze–thaw cycles cause microcrack expansion and deterioration of pore structure, resulting in a gradual decrease in strength and stiffness, exhibiting typical cumulative damage effects.
Grouting MaterialPeak stress increases by 113.61%Elastic modulus increases by 40.44%Grouting materials improve adhesion and support, extending residual strength, enhancing peak stress, and improving overall stiffness.
Roughness (JRC)Peak stress increases by 13.25%Elastic modulus increases by 8.08%Roughness improves slurry anchoring, optimizes stress distribution, delays crack propagation, and enhances the rock’s stability, thereby improving mechanical properties.
Fracture Dip AnglePeak stress increases by 118.76%Elastic modulus increases by 27.25%Fracture dip angle optimizes stress transfer, reduces slippage and cracking, increasing elastic modulus and peak stress, thereby enhancing stability.
Confining PressurePeak stress increases by 140.2%Elastic modulus increases by 70.65%Confining pressure increases rock density, limits deformation, enhances stiffness and strength, and promotes the transition from brittle to ductile failure.
Table 6. Interaction effect analysis of peak stress.
Explanatory VariableCoefficient of InfluenceStandard Errort-Valuep-Value
(Pr > |t|)
interception26.07121.30119.761<2 × 10⁻¹⁶***
grouting material27.7541.8667.907<2 × 10⁻¹⁶***
number of freeze–thaw cycles−14.3921.658−5.867<2 × 10⁻¹⁶***
fracture dip angle29.2992.0467.479<2 × 10⁻¹⁶***
confining pressure33.8862.75512.301<2 × 10⁻¹⁶***
roughness, respectively5.9571.2672.3640.00494**
grouting material: number of freeze–thaw cycles−11.3072.59410.268<2 × 10⁻¹⁶***
grouting material: confining pressure16.0752.78513.496<2 × 10⁻¹⁶***
grouting material: roughness, respectively5.1112.812.8870.00414**
number of freeze–thaw cycles: confining pressure−10.1343.434−5.5715.11 × 10−8***
fracture dip angle: roughness, respectively9.4762.9494.9091.42 × 10−6***
R2 = 0.9613
Note: ** indicates a result is strongly significant with p < 0.01, and *** indicates an extremely significant result with p < 0.001.
Table 7. Interaction effect analysis of elastic modulus.
Explanatory VariableCoefficient of InfluenceStandard Errort-Valuep-Value
(Pr > |t|)
interception10.47850.423629.162<2 × 10⁻¹⁶***
grouting material3.96540.54815.216<2 × 10⁻¹⁶***
number of freeze–thaw cycles−6.28460.6117−7.894<2 × 10⁻¹⁶***
fracture dip angle2.15230.42963.218<2 × 10⁻¹⁶***
confining pressure5.96670.67017.106<2 × 10⁻¹⁶***
roughness, respectively1.04710.66462.2080.03564*
grouting material: roughness, respectively4.45130.9278−4.7983.58 × 10−6***
number of freeze–thaw cycles: fracture dip angle−2.26350.48533.4060.000828**
fracture dip angle: confining pressure6.18070.78069.801<2 × 10⁻¹⁶***
confining pressure: roughness, respectively2.90910.8633−3.370<2 × 10⁻¹⁶***
R2 = 0.9529
Note: * indicates a result is statistically significant with p < 0.05, ** indicates a result is strongly significant with p < 0.01, and *** indicates an extremely significant result with p < 0.001.
Disclaimer/Publisher’s Note: The statements, opinions and data contained in all publications are solely those of the individual author(s) and contributor(s) and not of MDPI and/or the editor(s). MDPI and/or the editor(s) disclaim responsibility for any injury to people or property resulting from any ideas, methods, instructions or products referred to in the content.

