
Analysis of Building Platform Inhomogeneities in PBF-LB/M Process on Alloy 718


 ,
,  ,
,  and
and
Abstract
1. Introduction
2. Materials and Methods
3. Results and Discussion
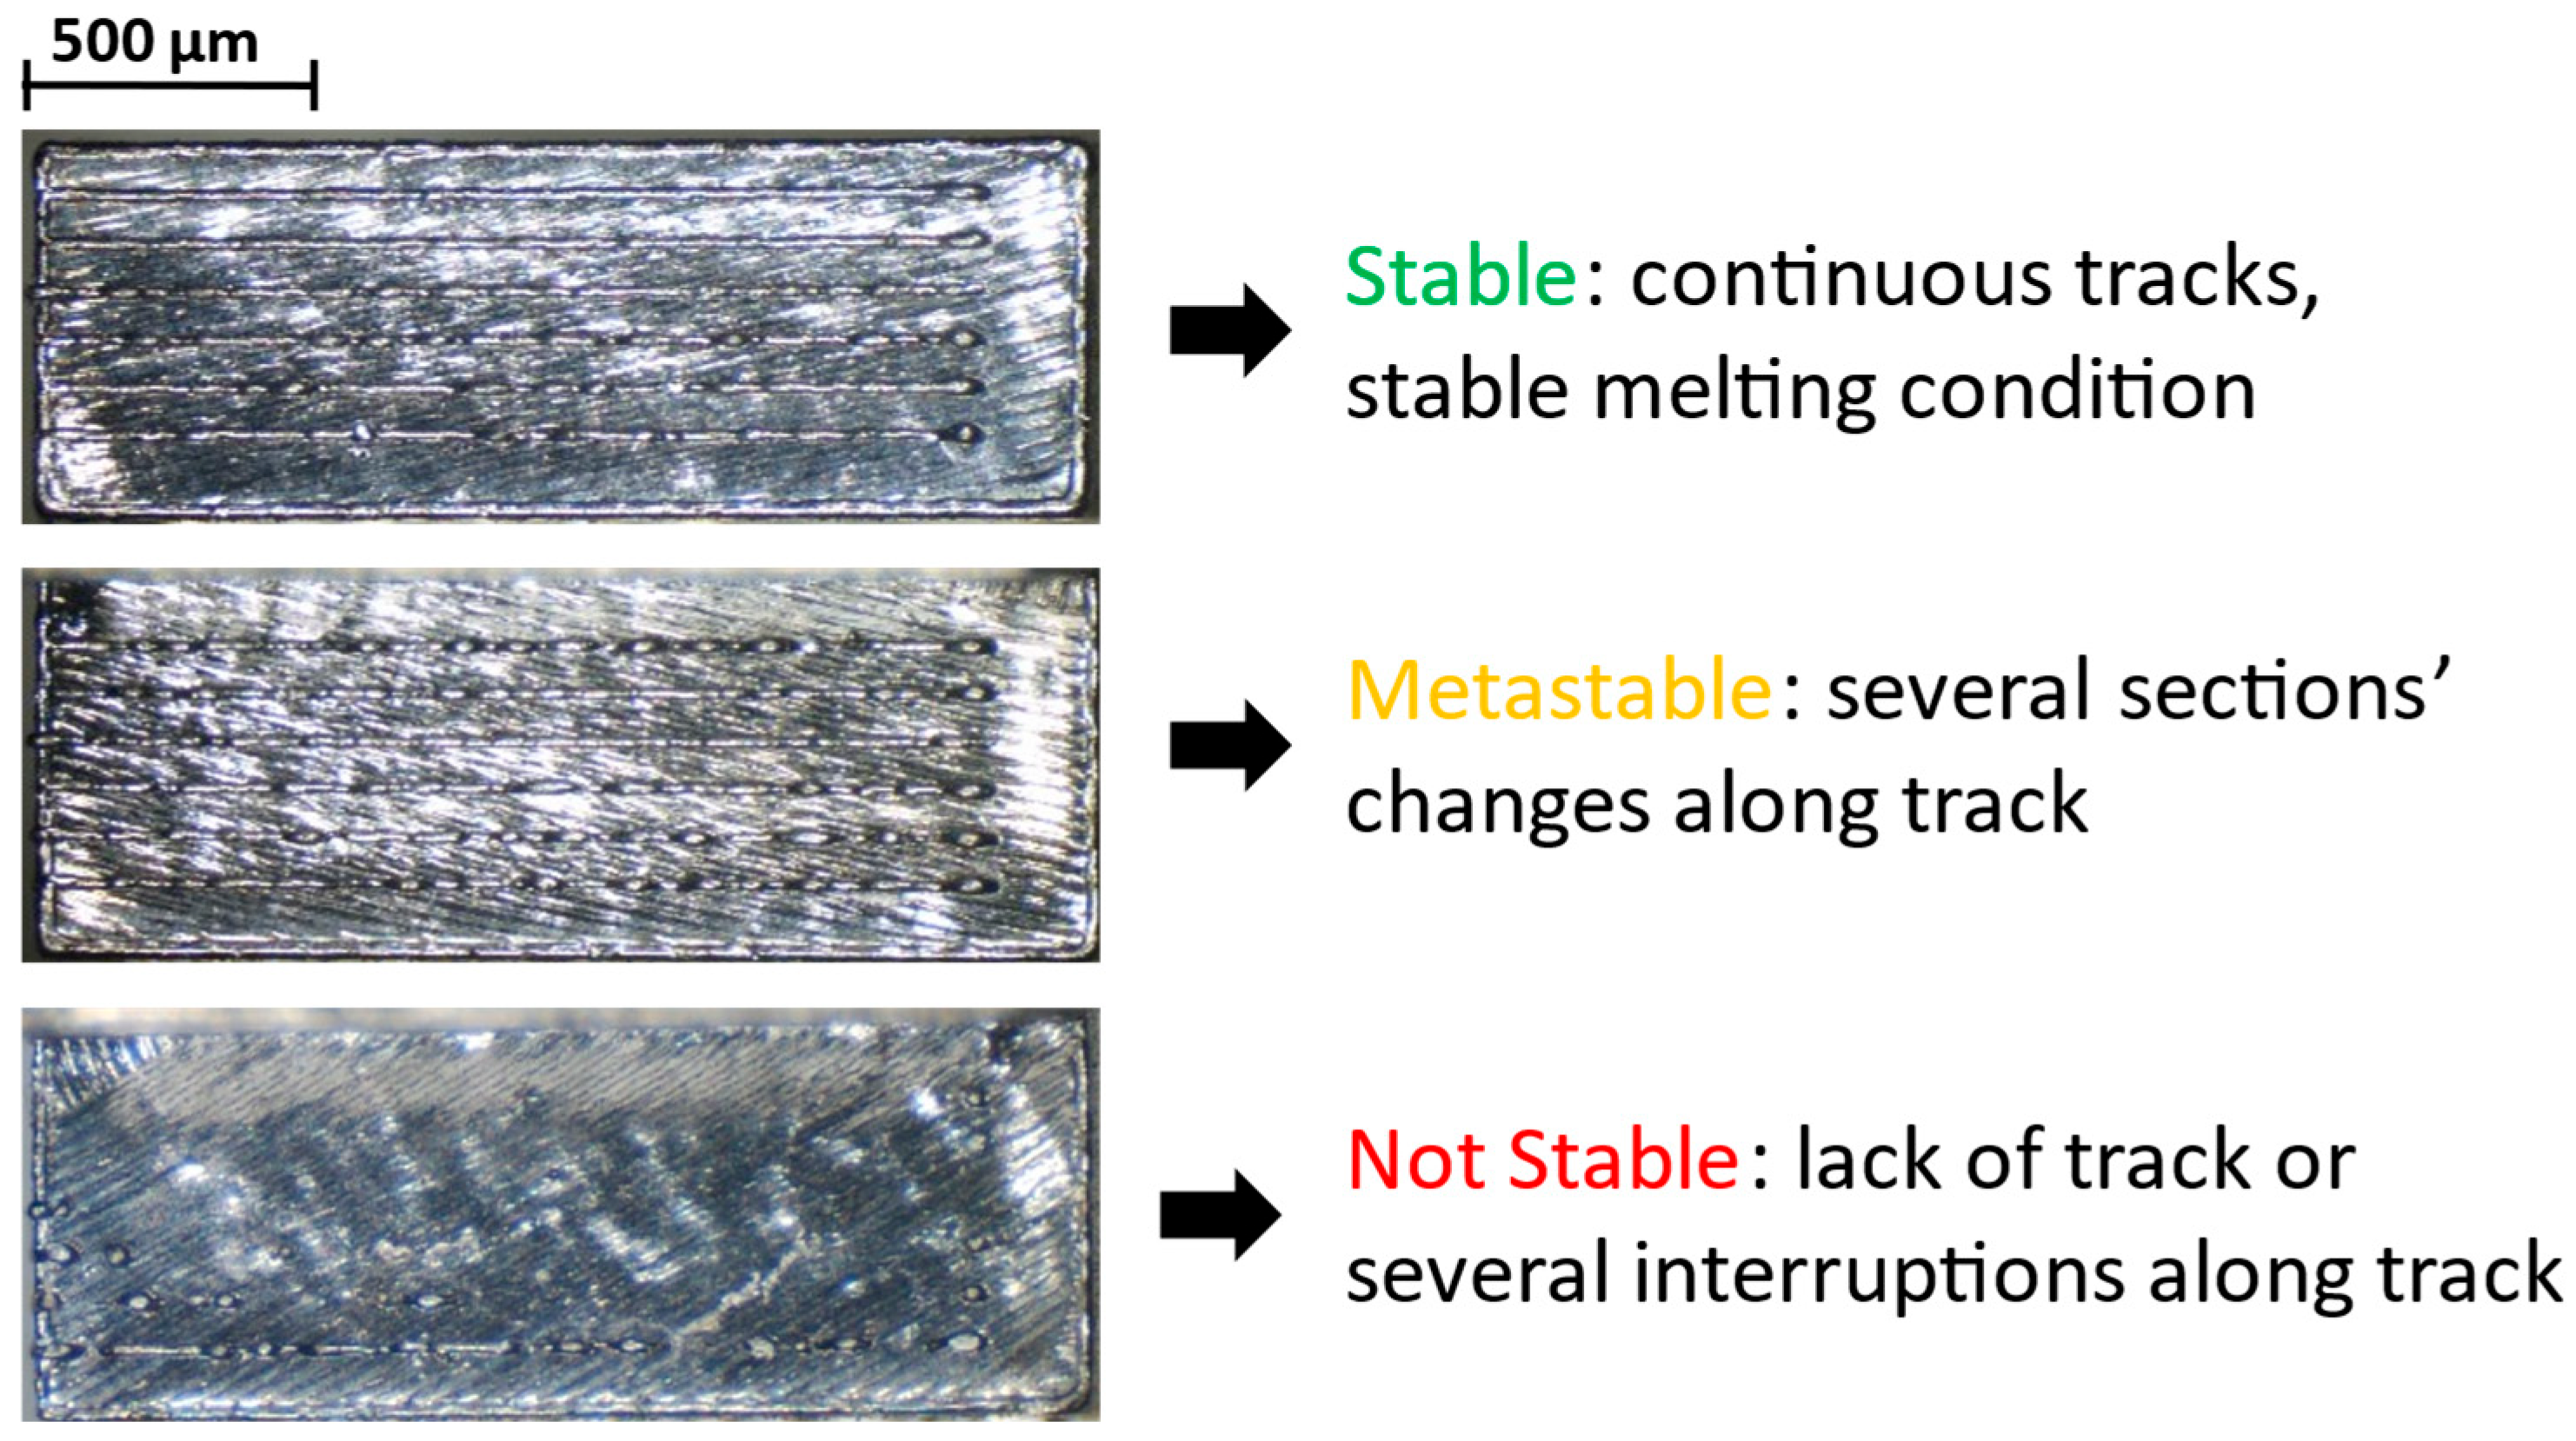
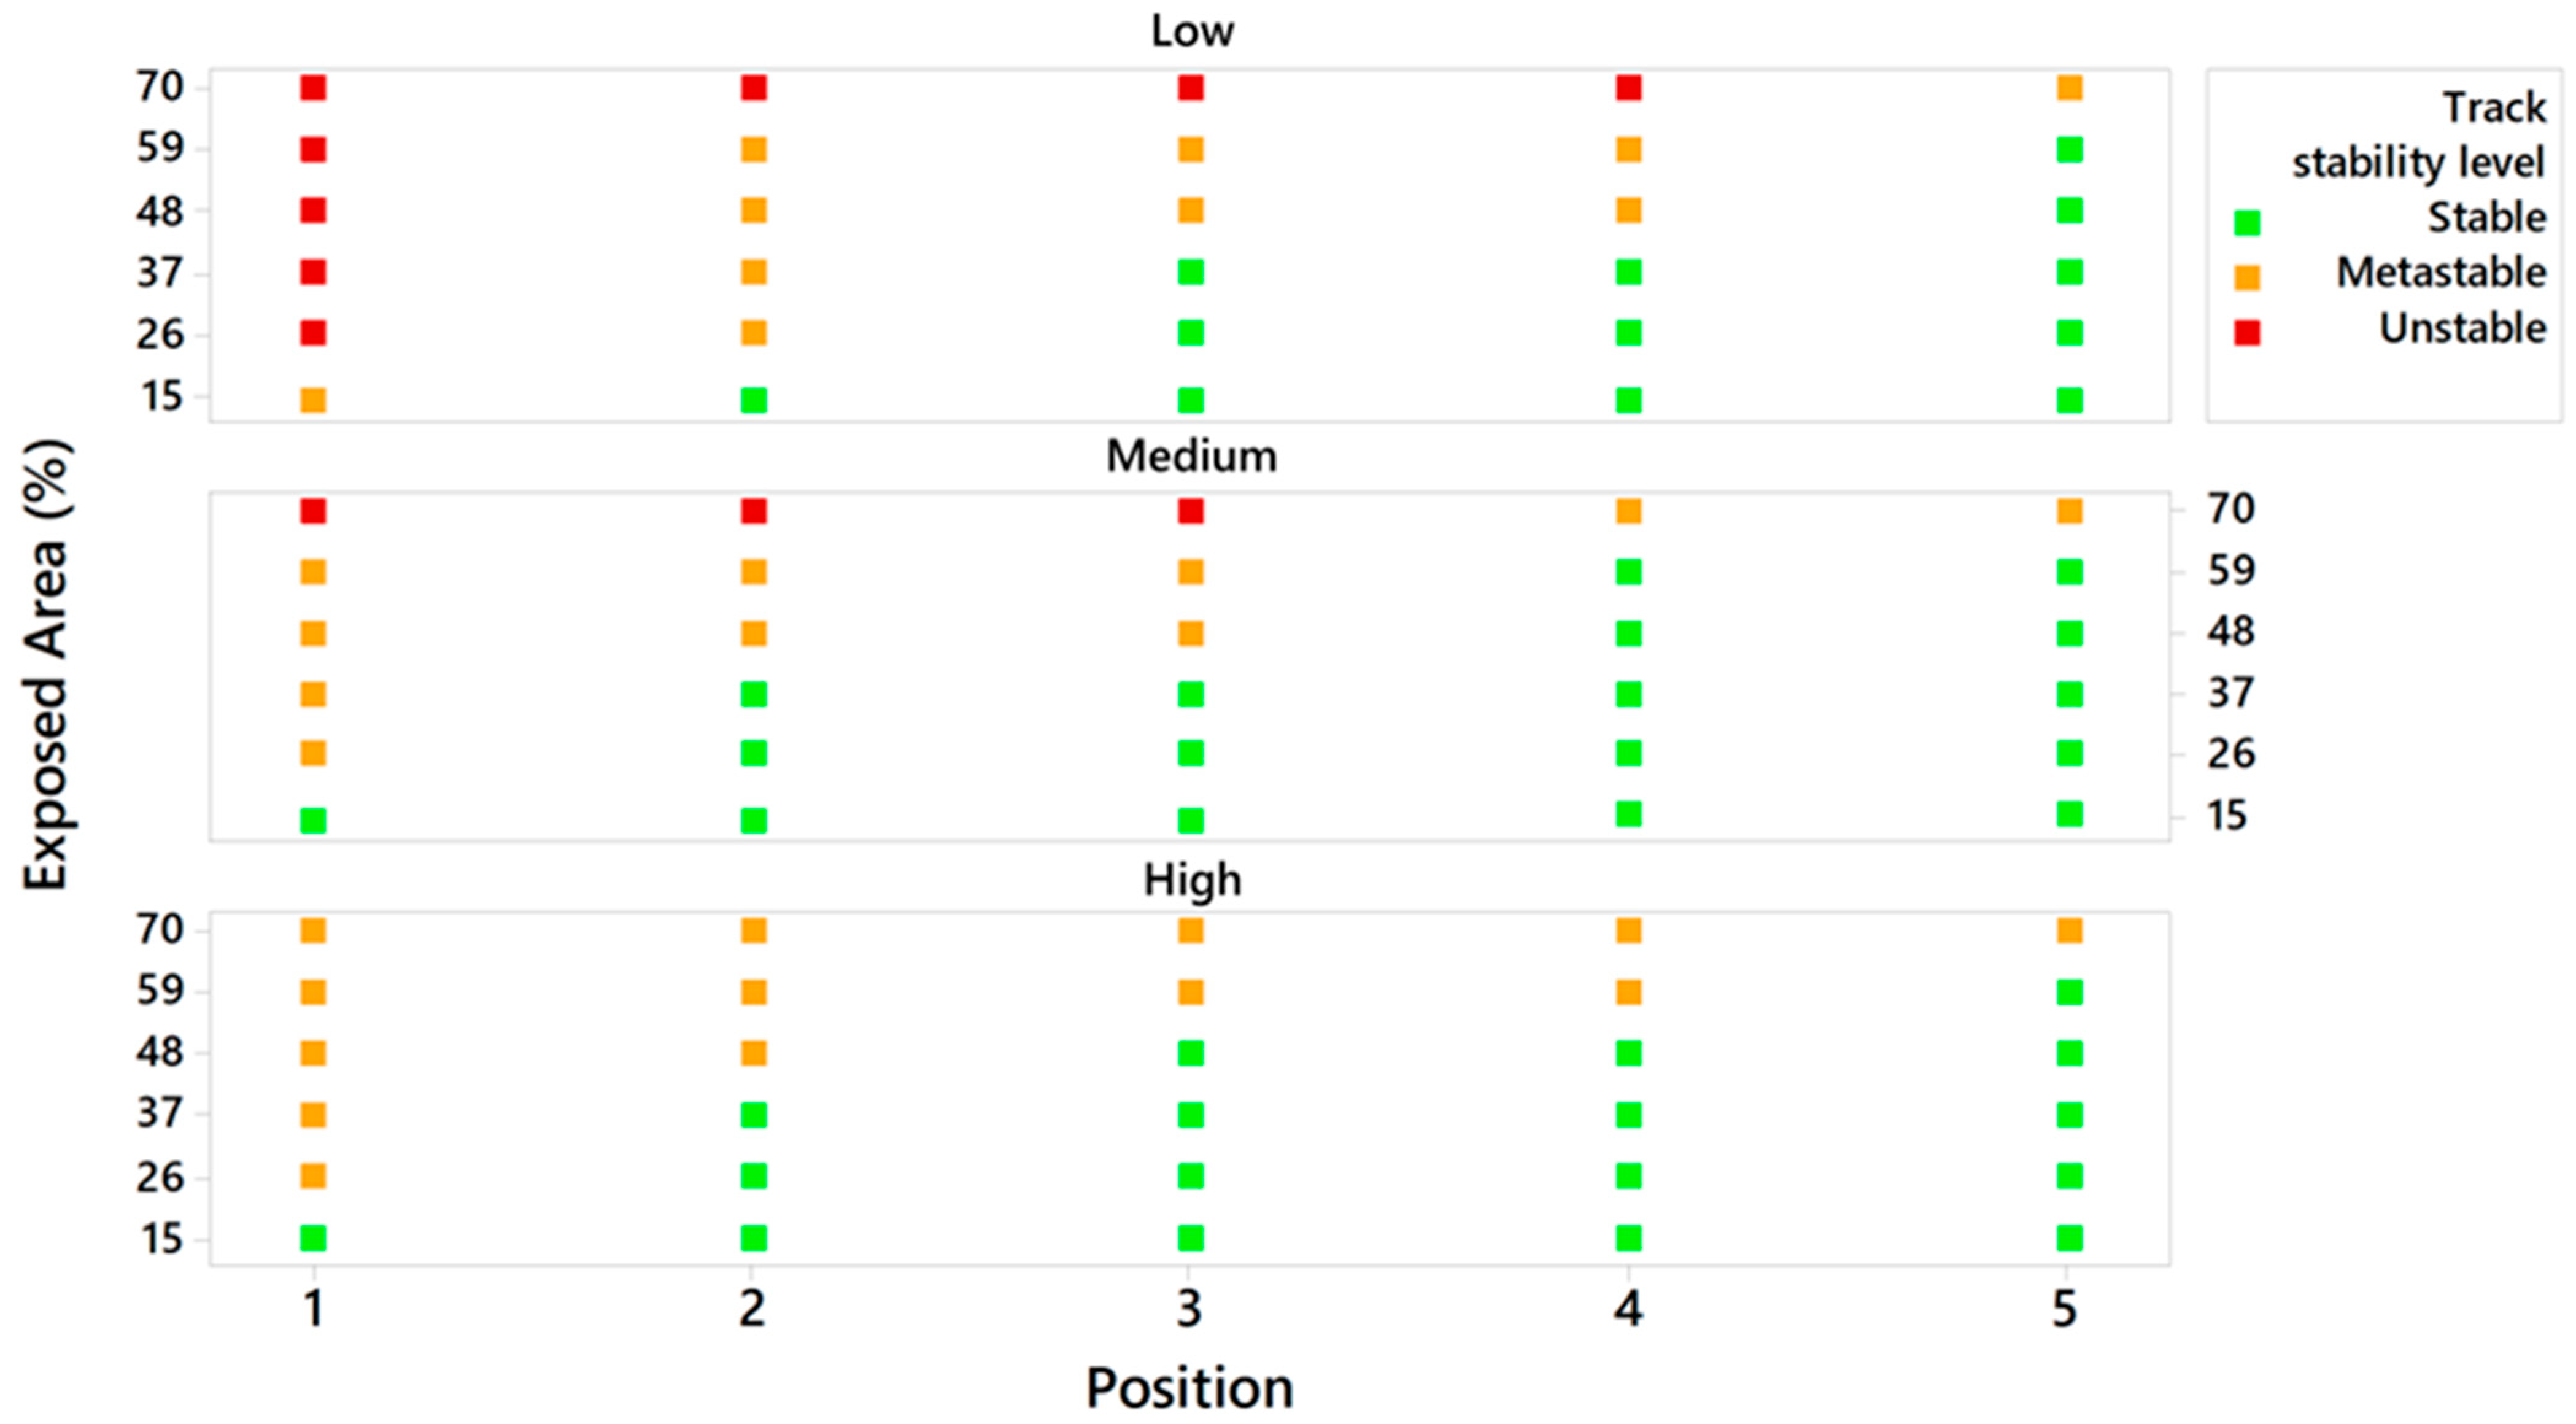
3.1. Track Stability Analysis
- Not stable.
- Metastable.
- Stable.
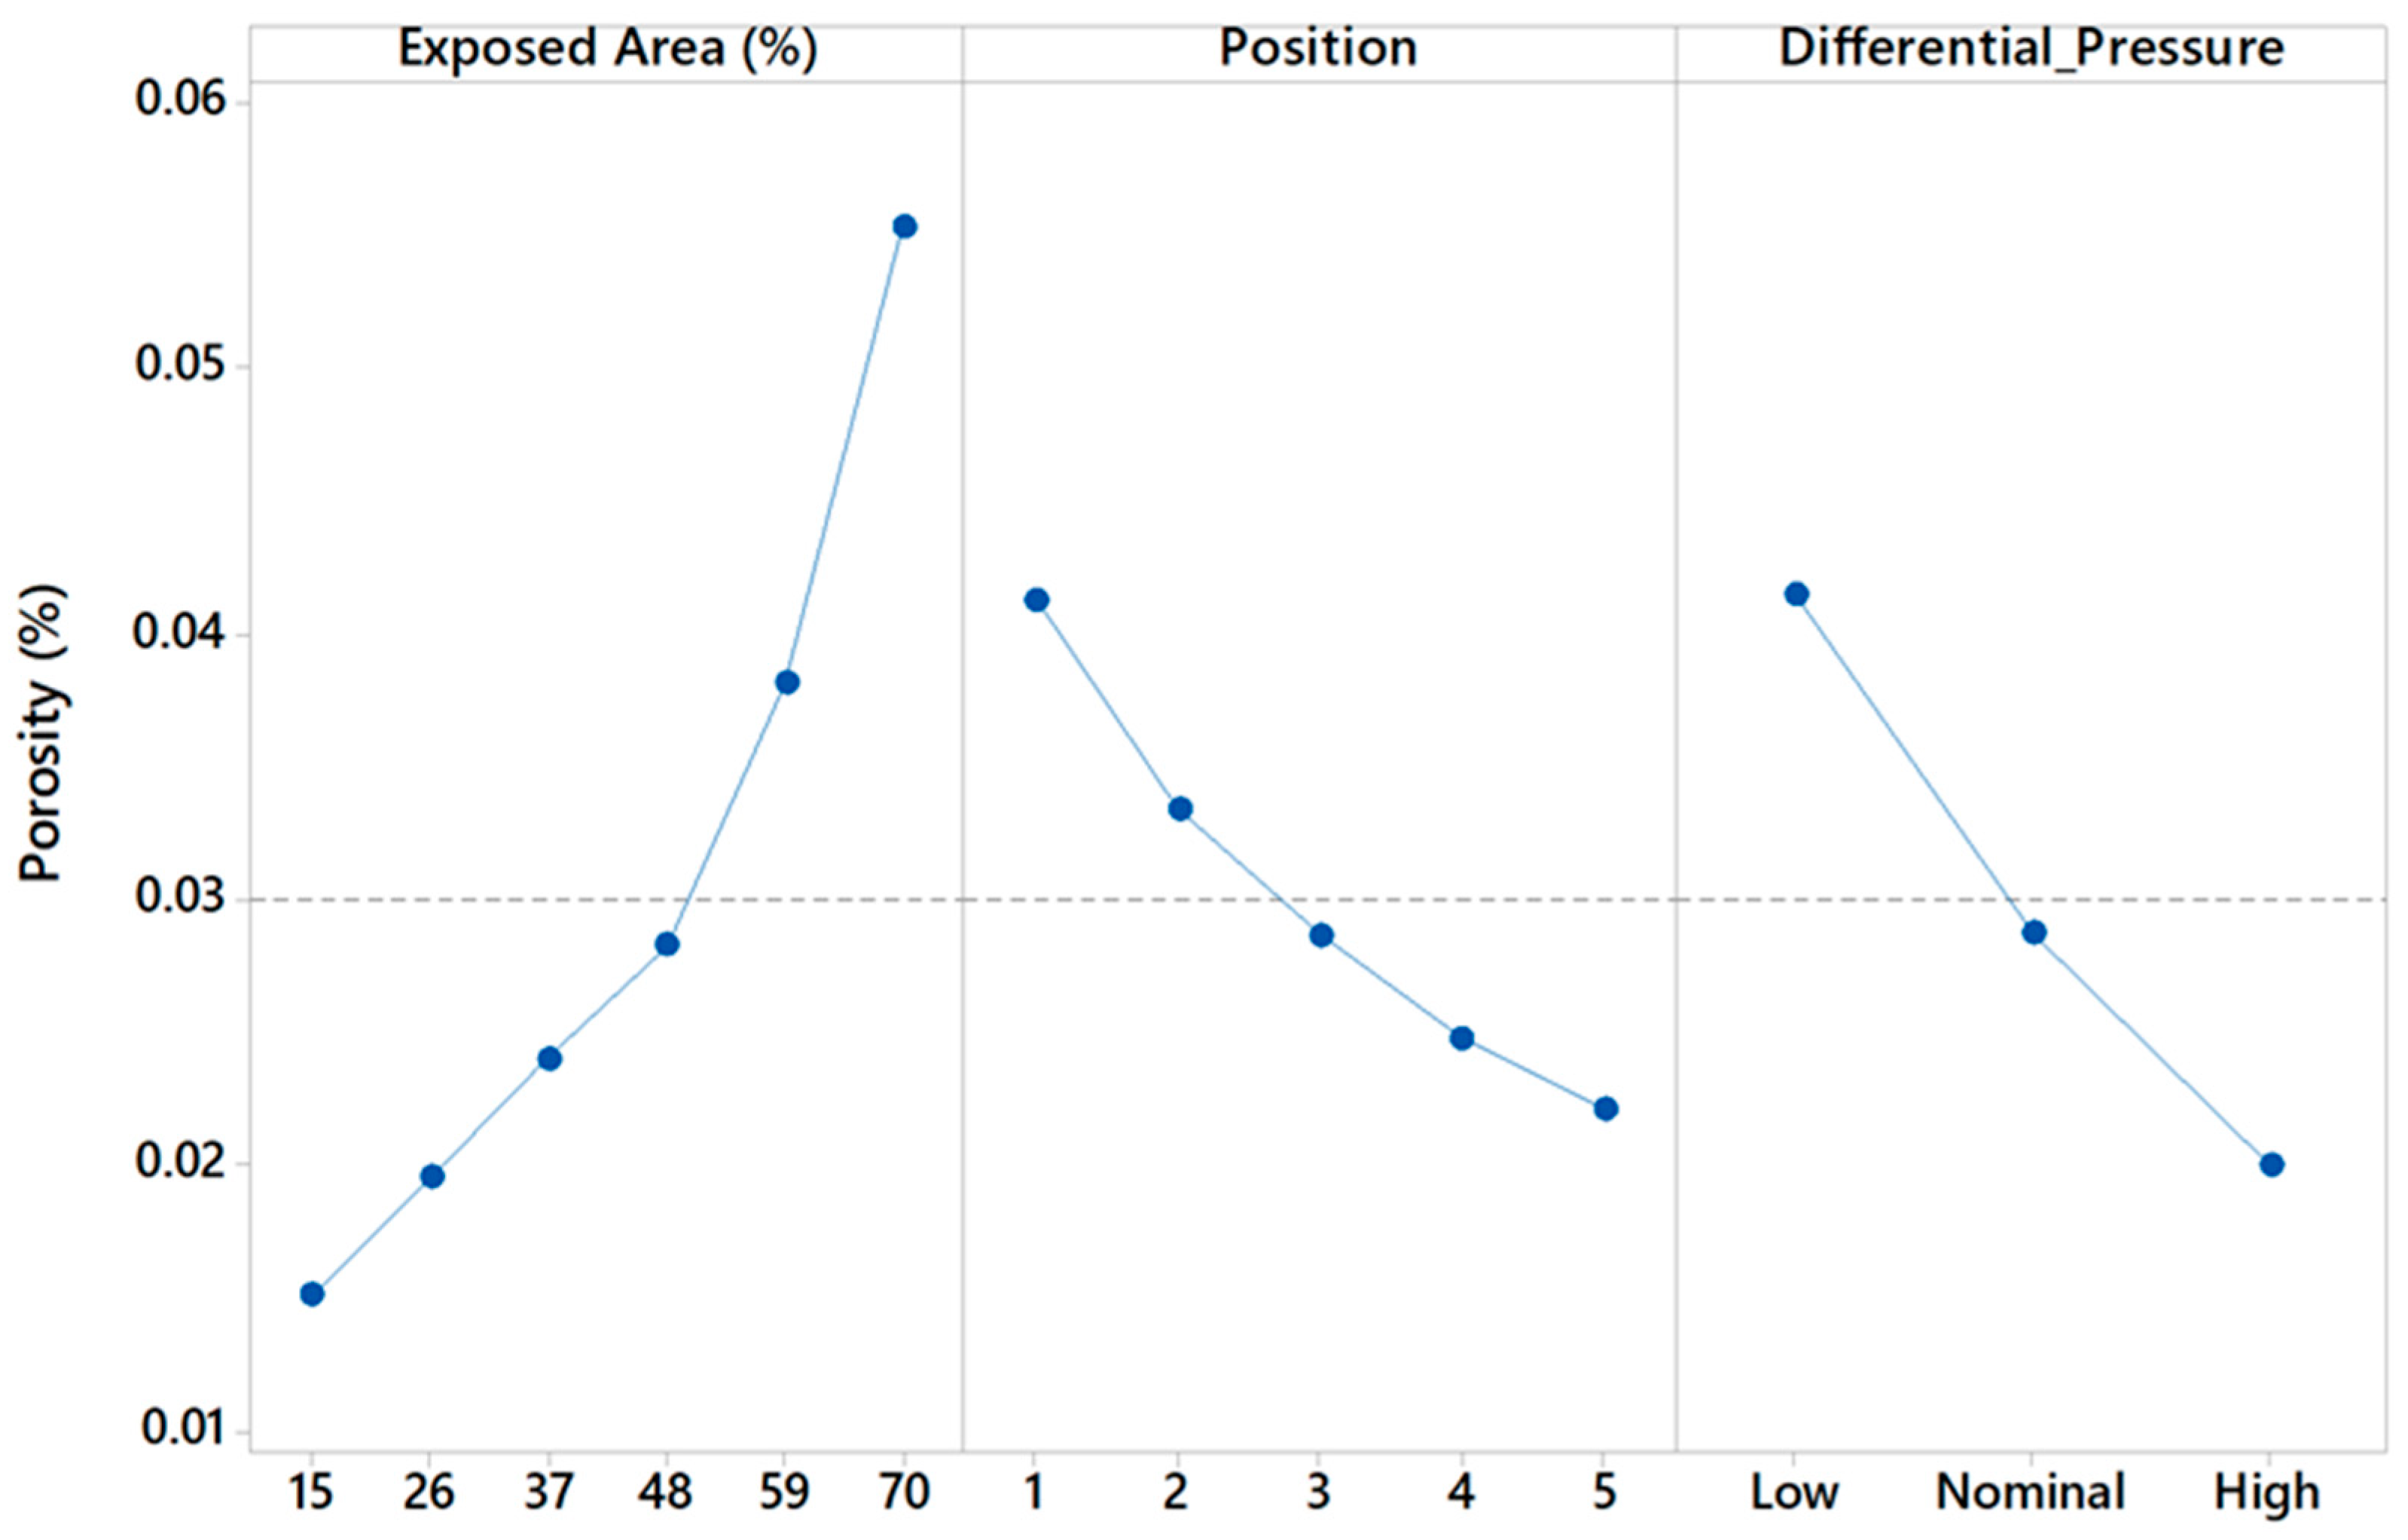
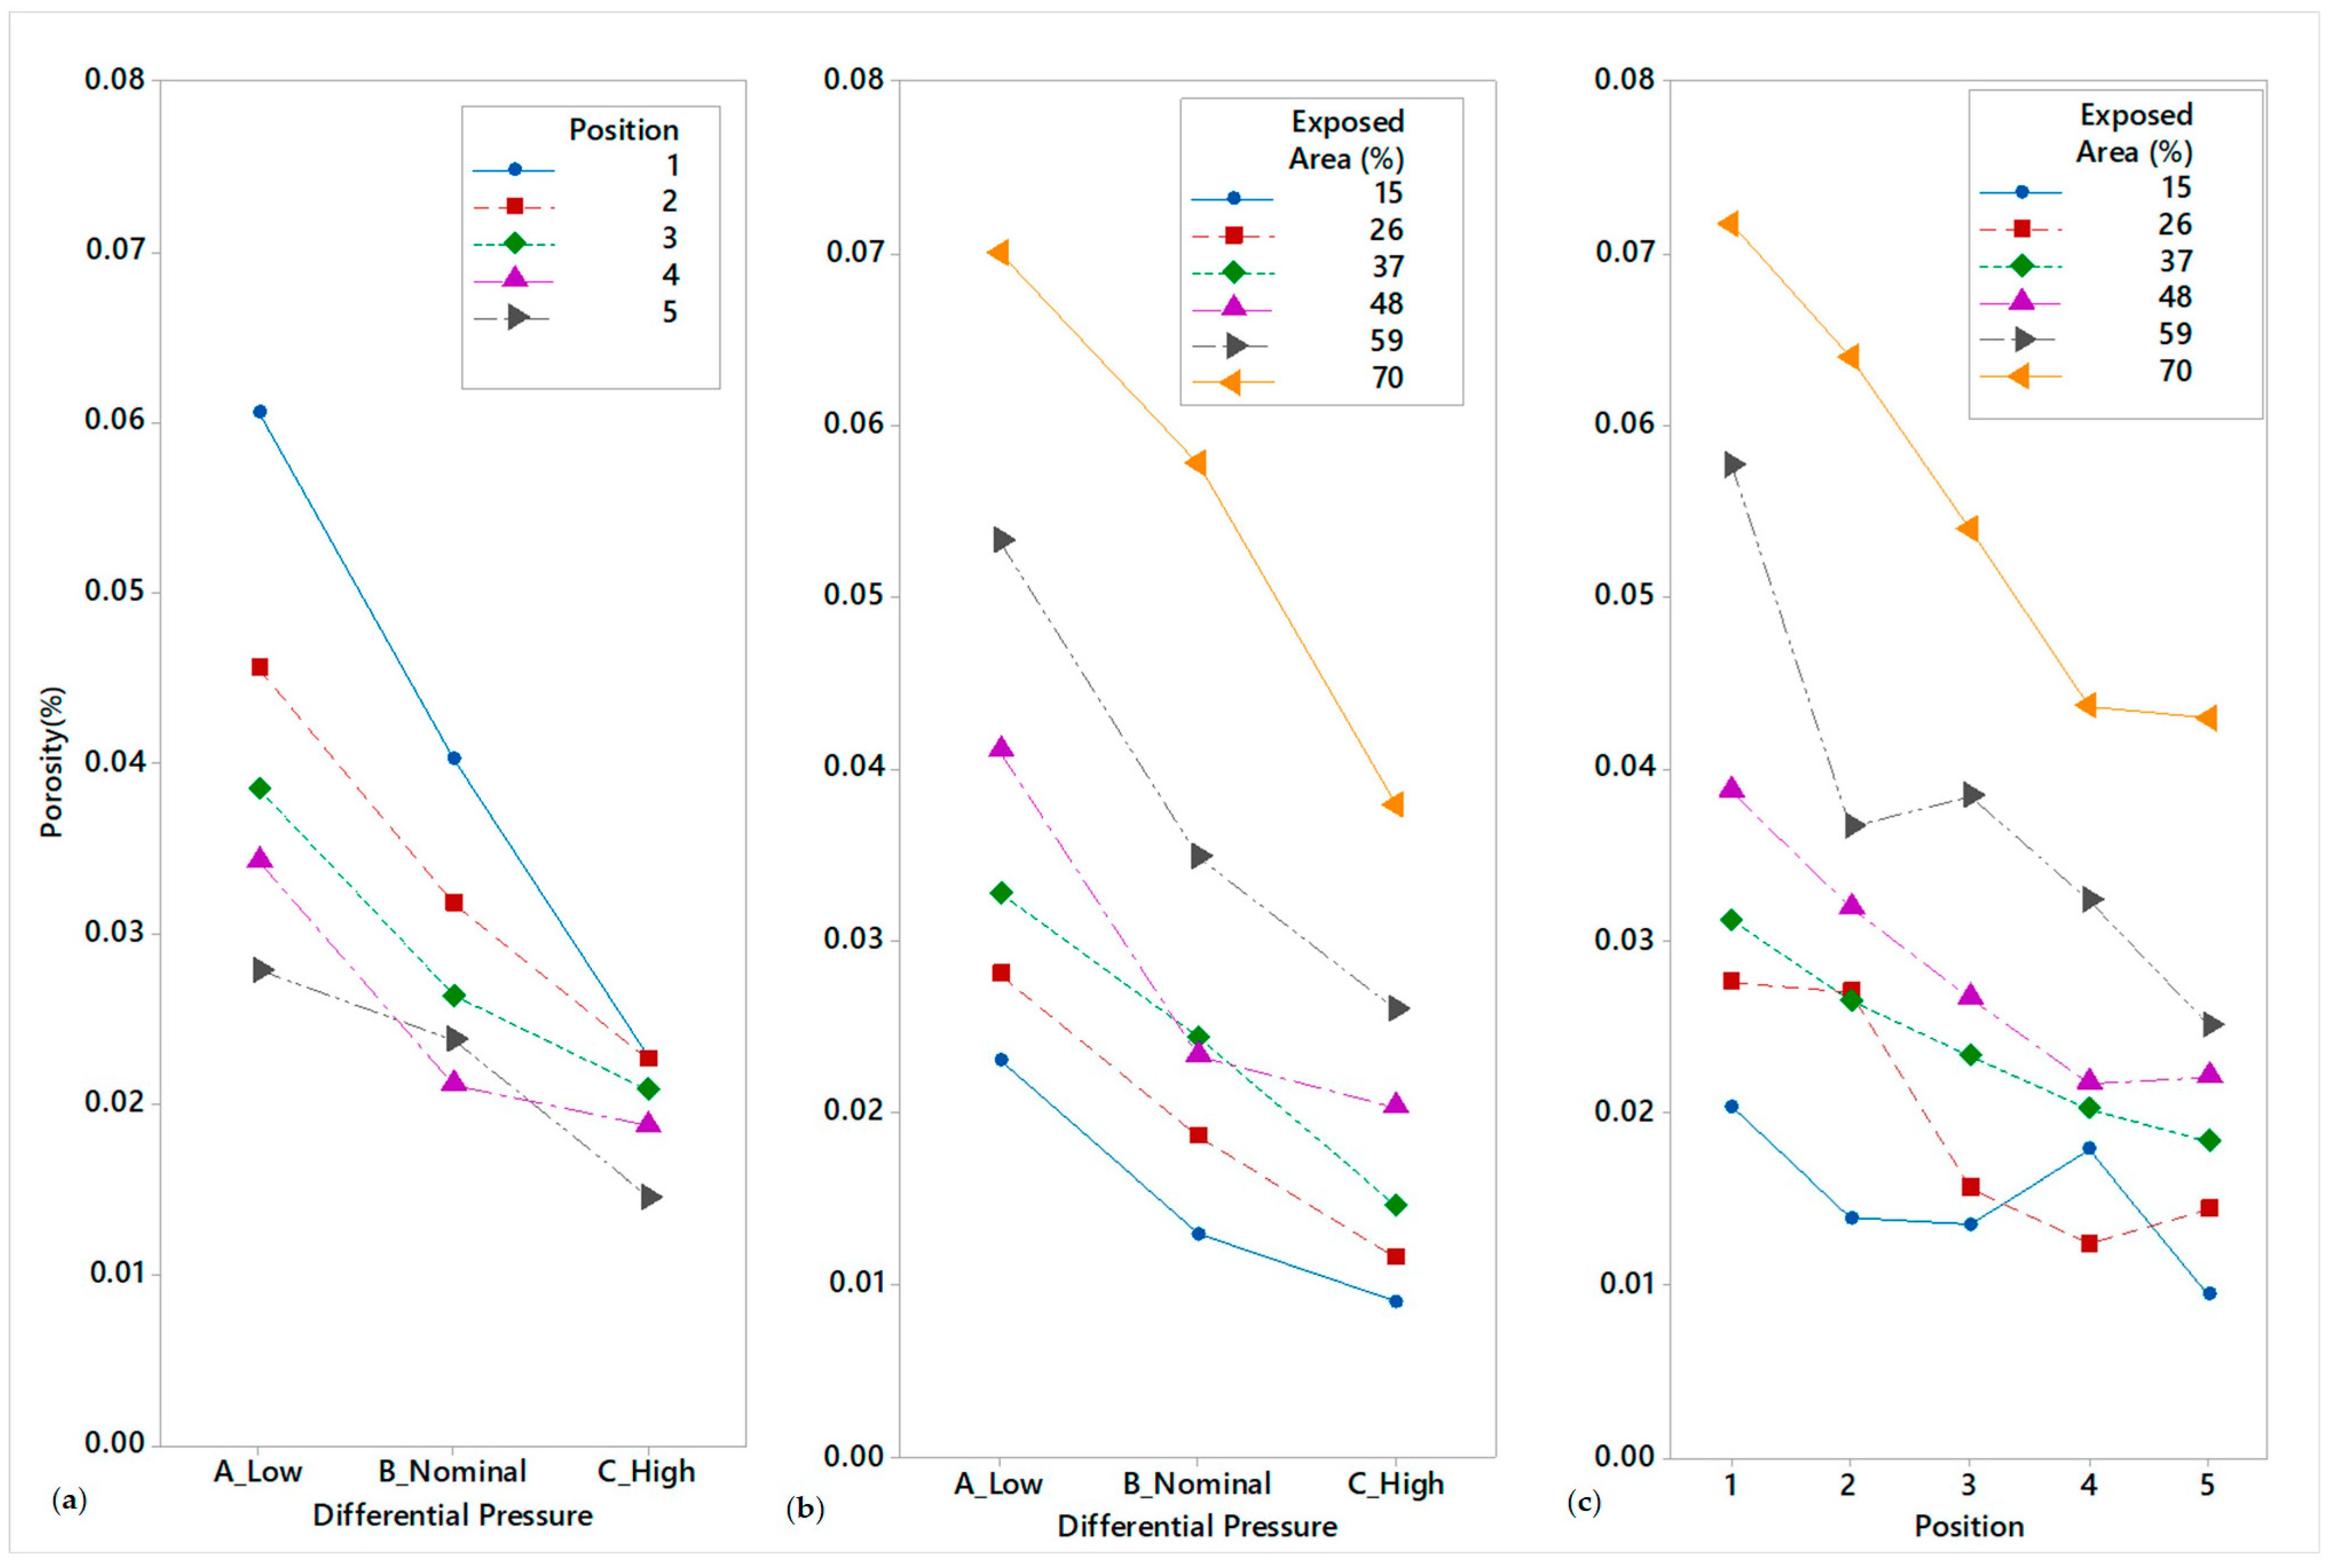
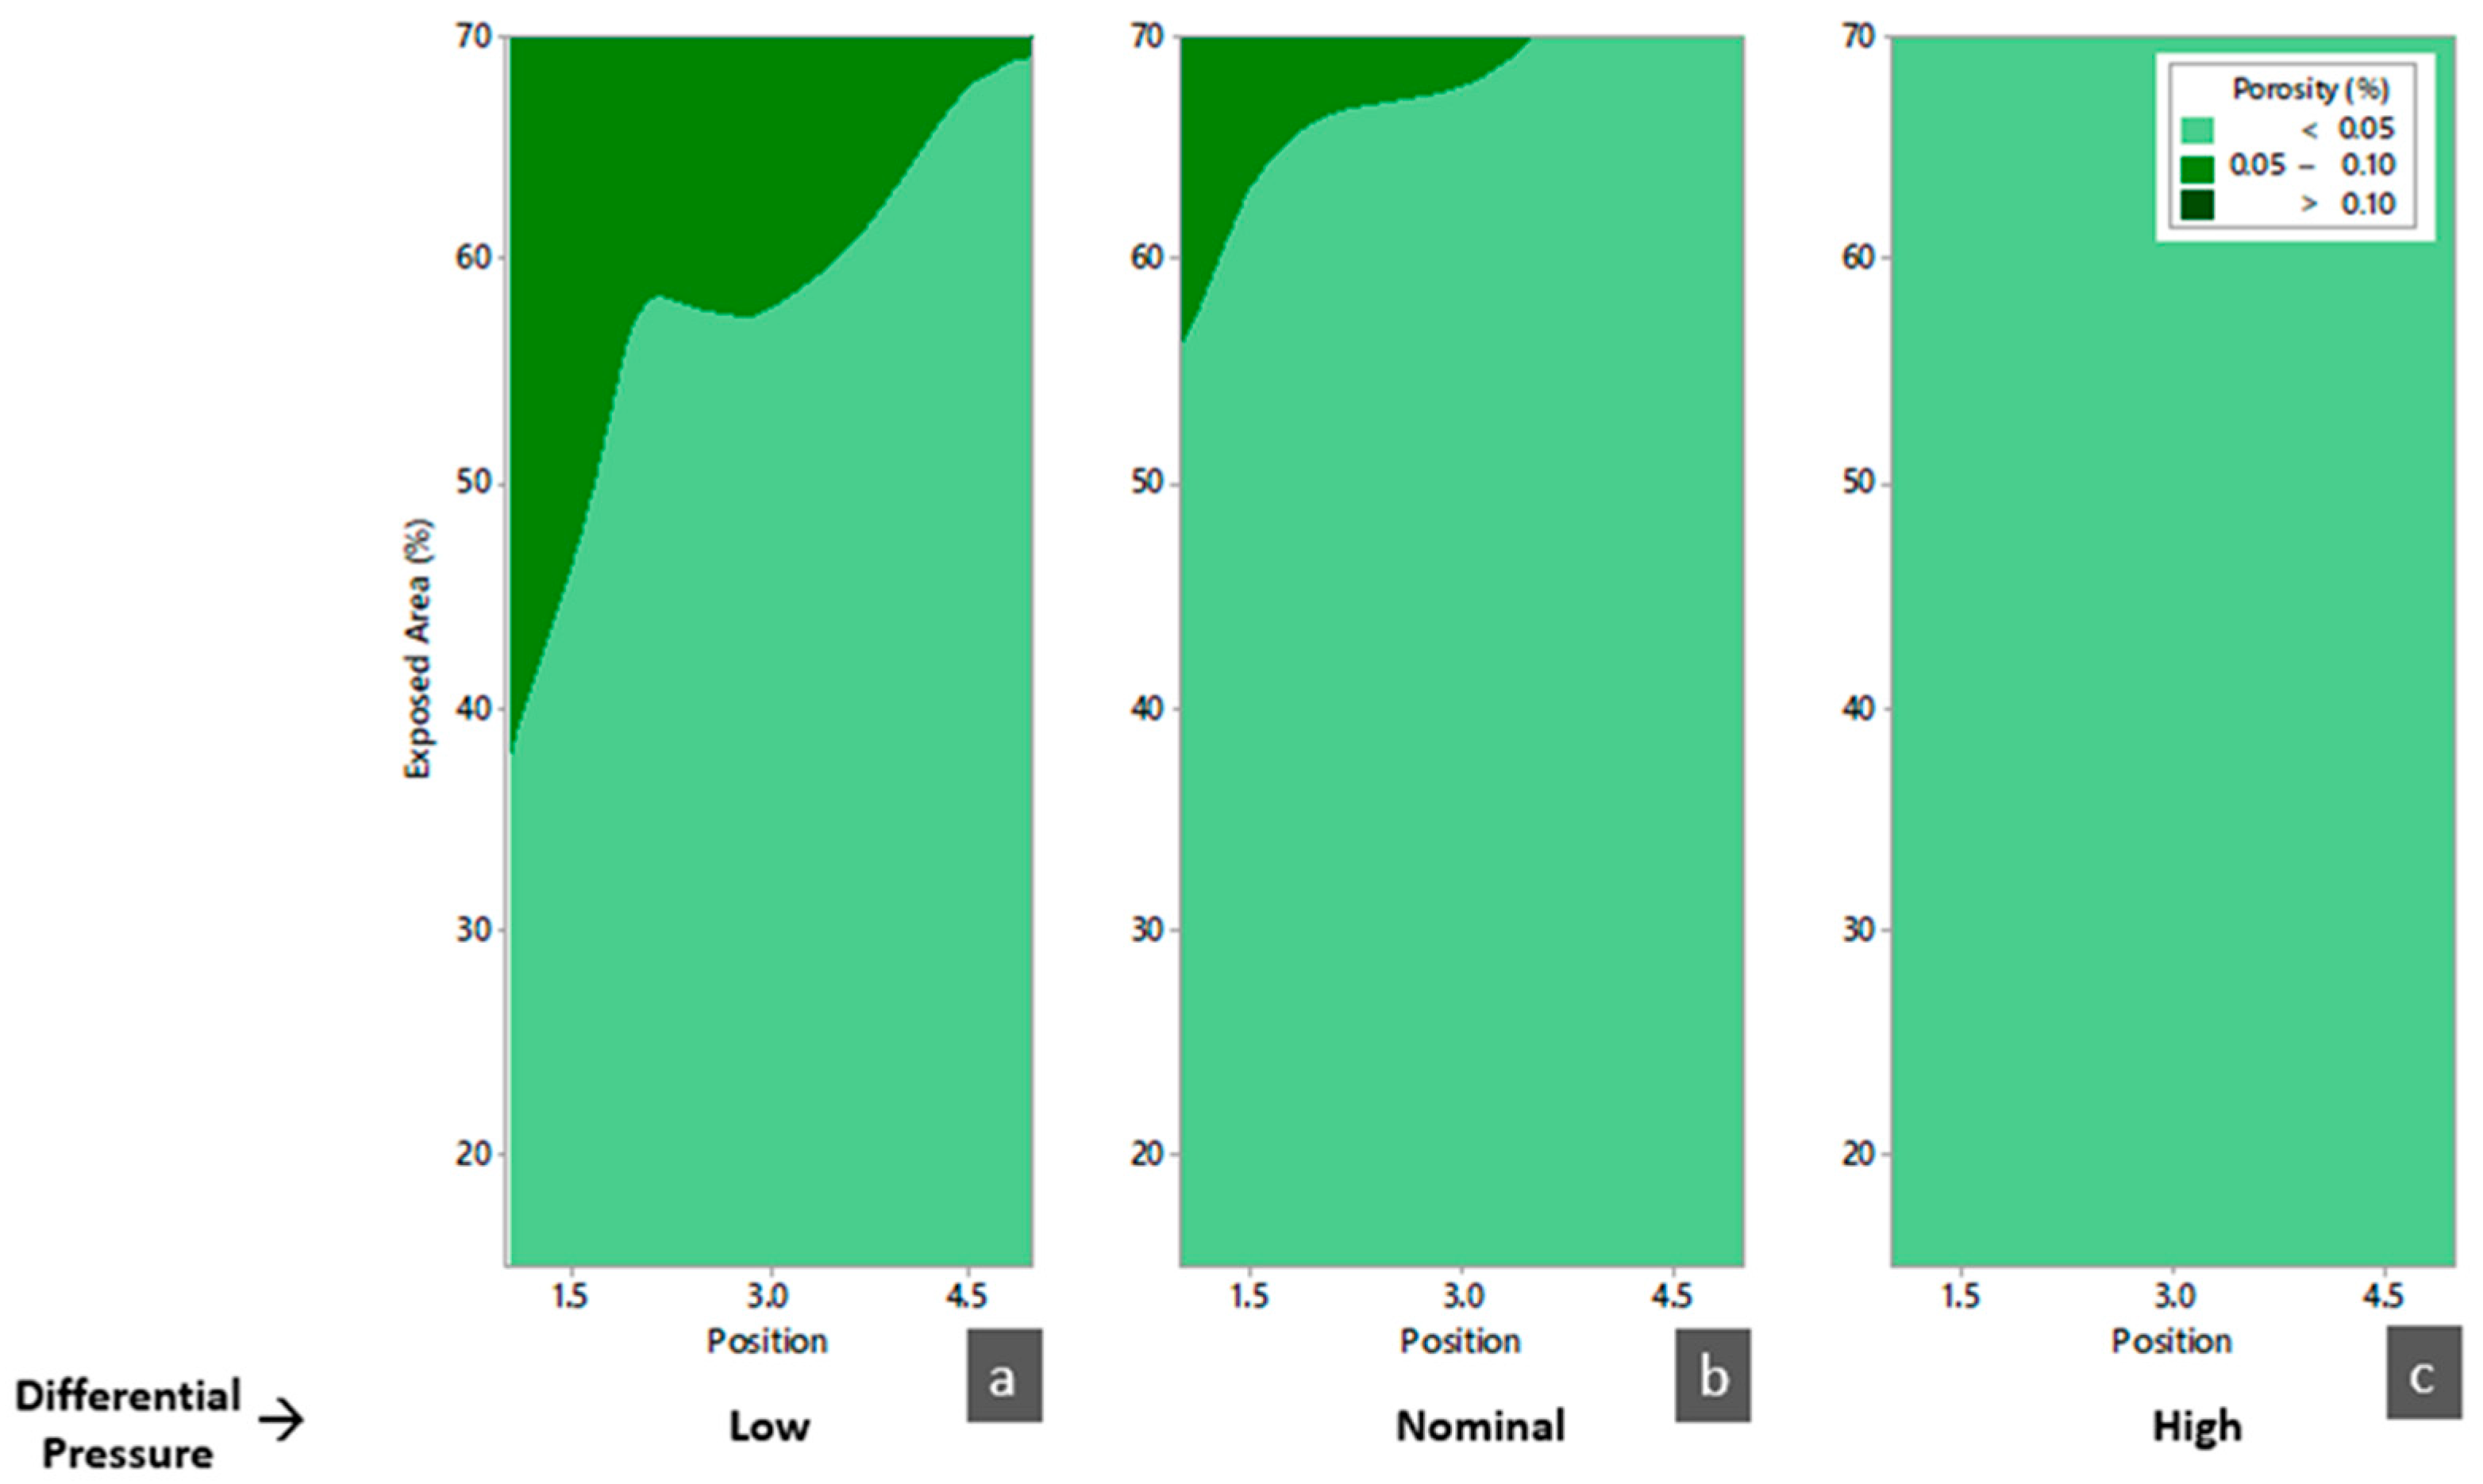
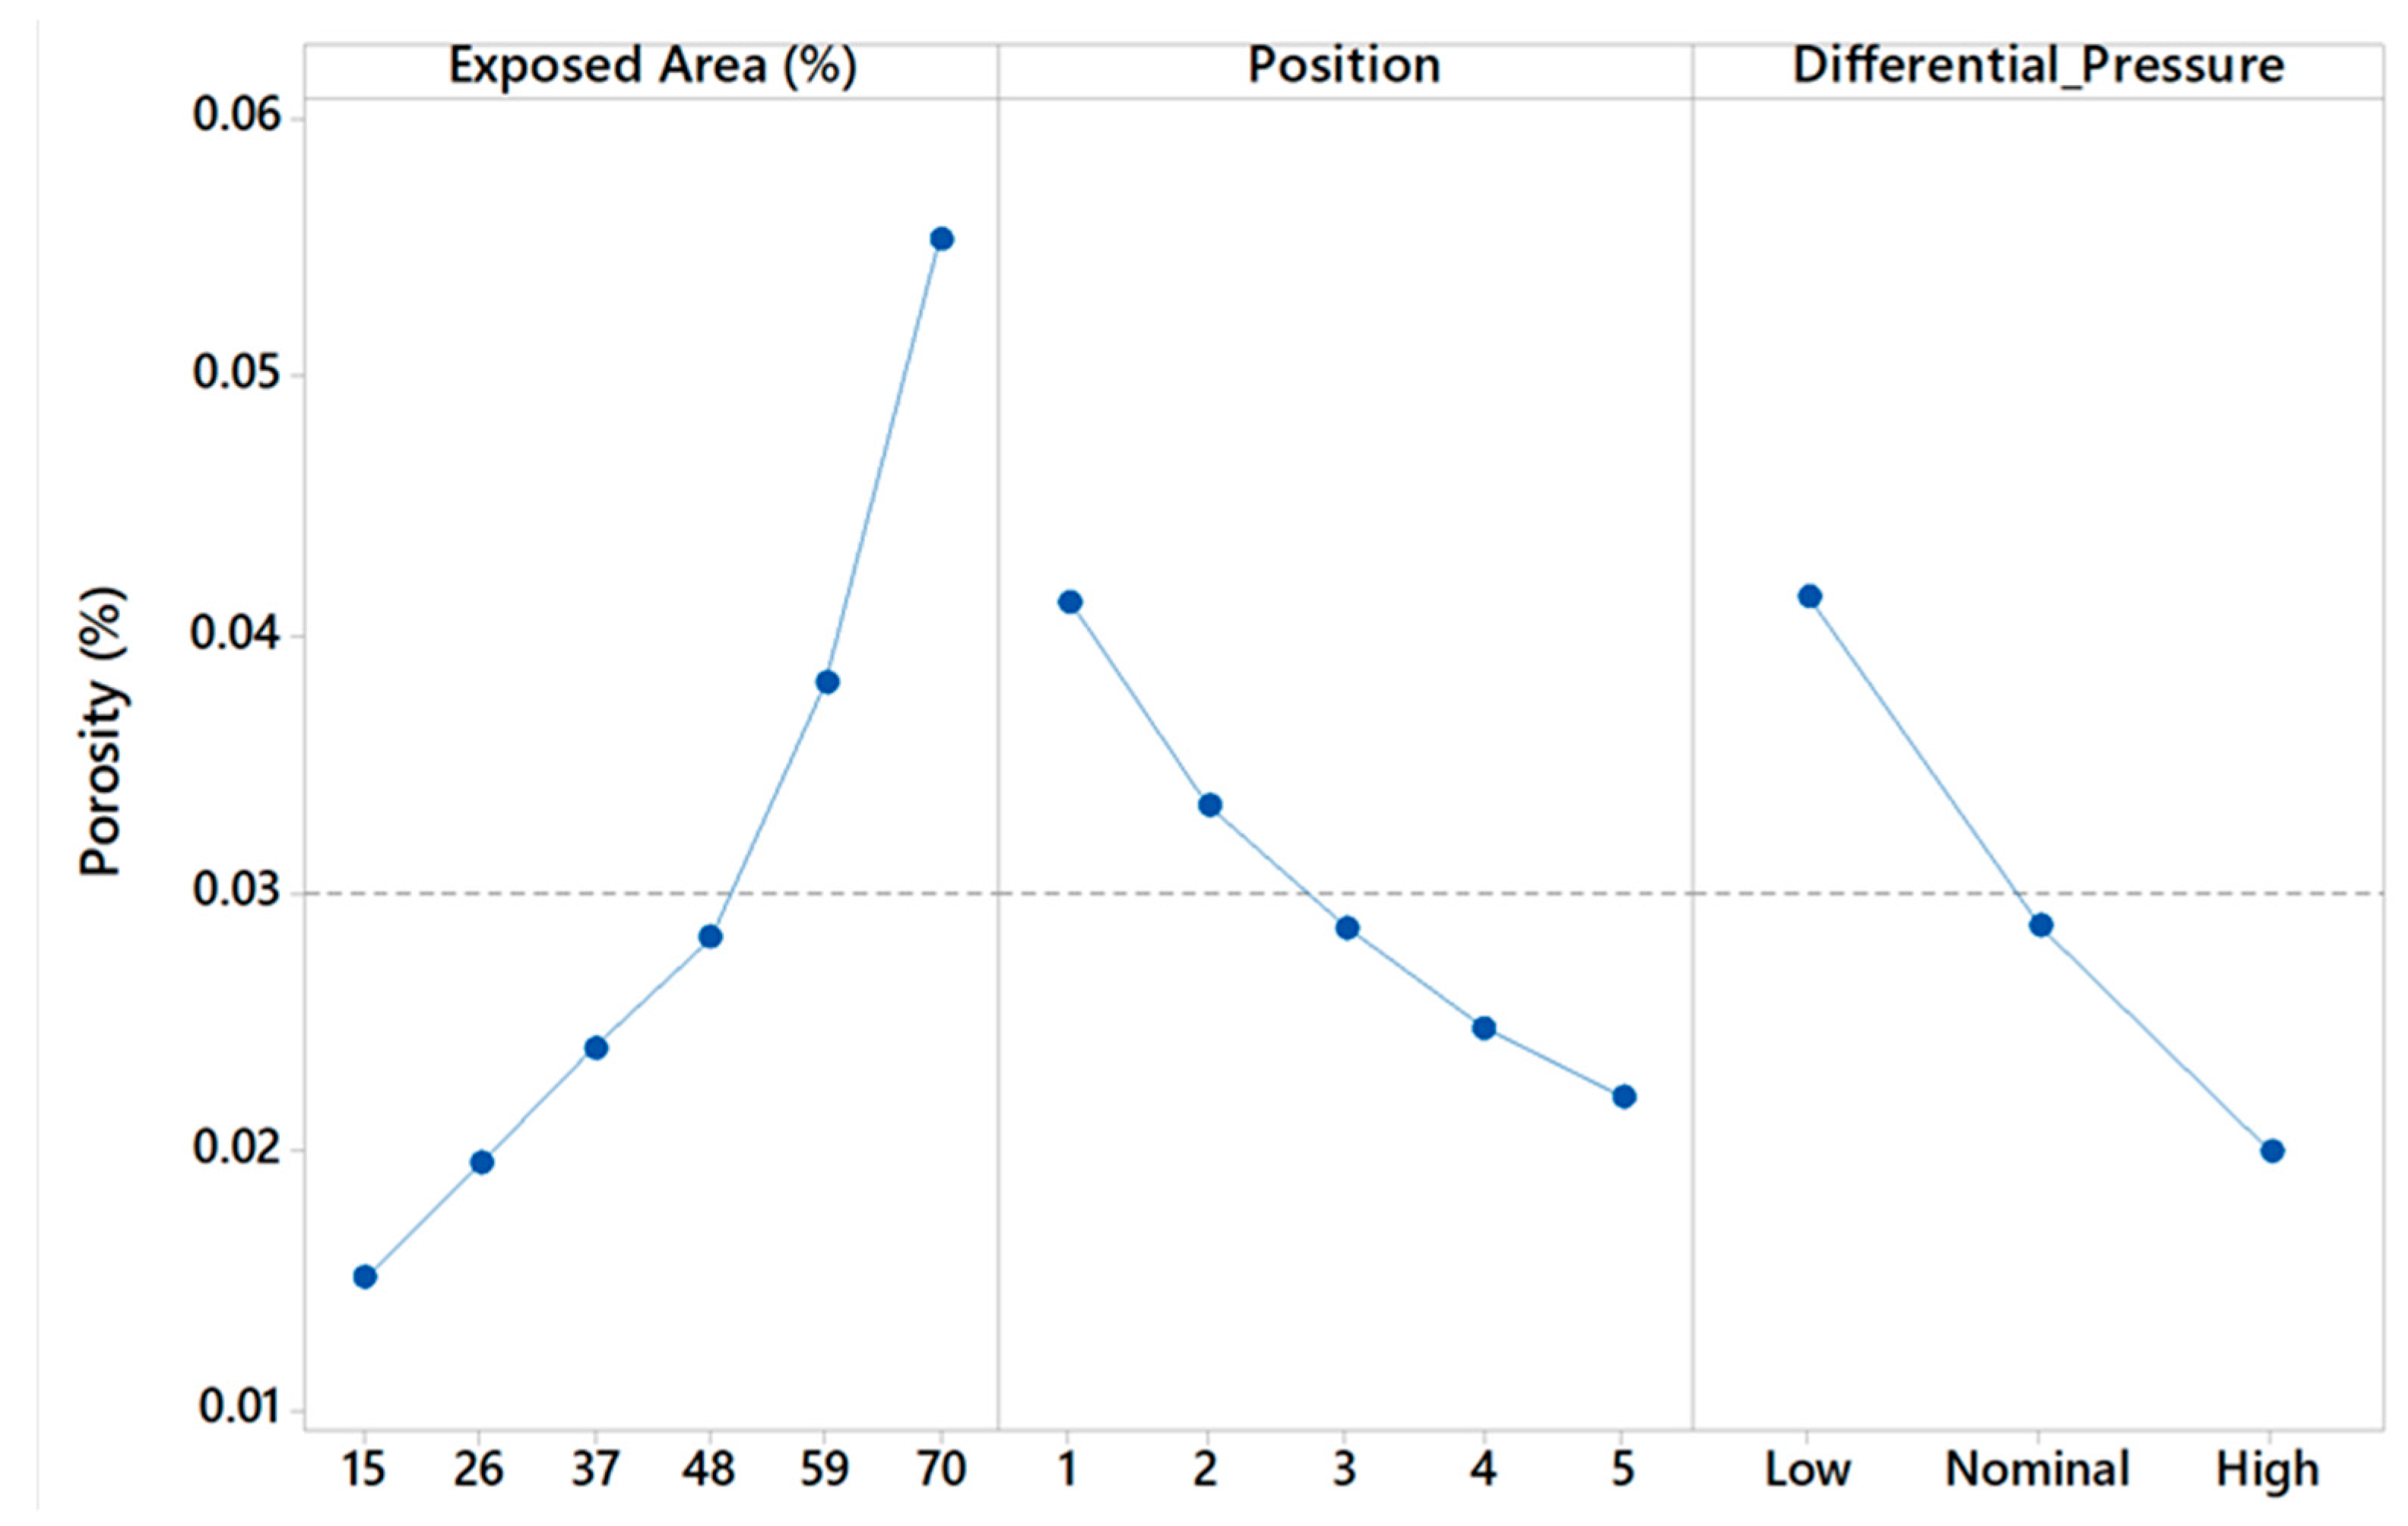
3.2. Porosity Analysis
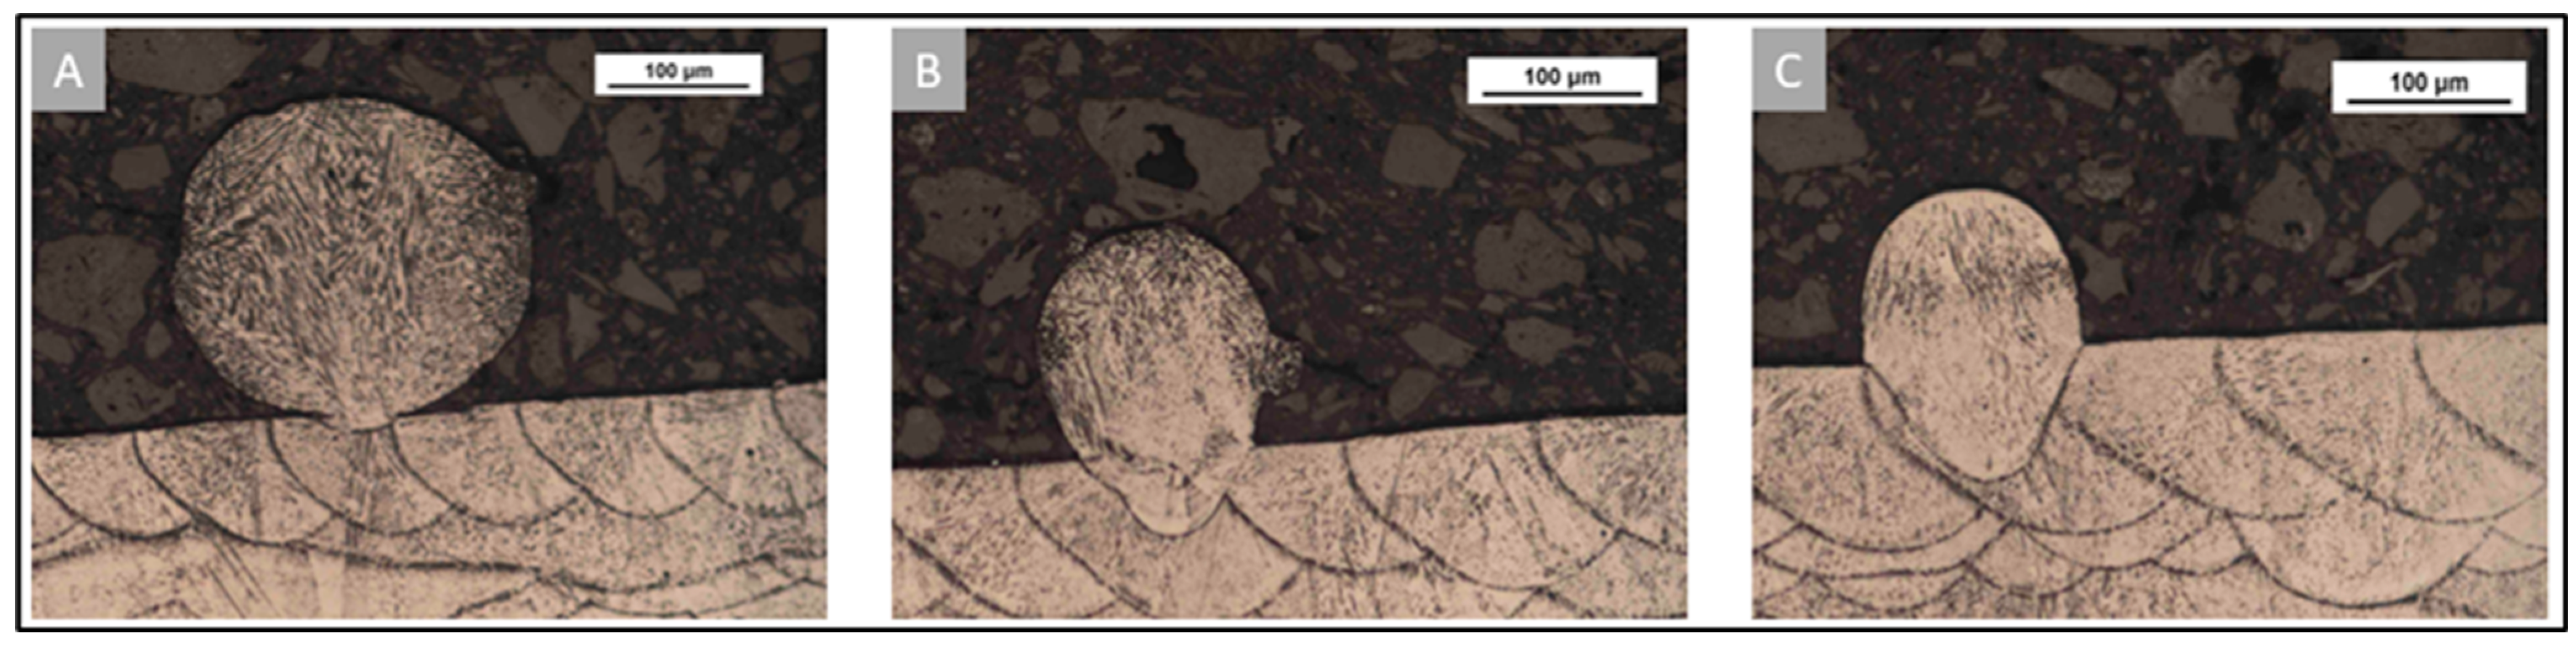
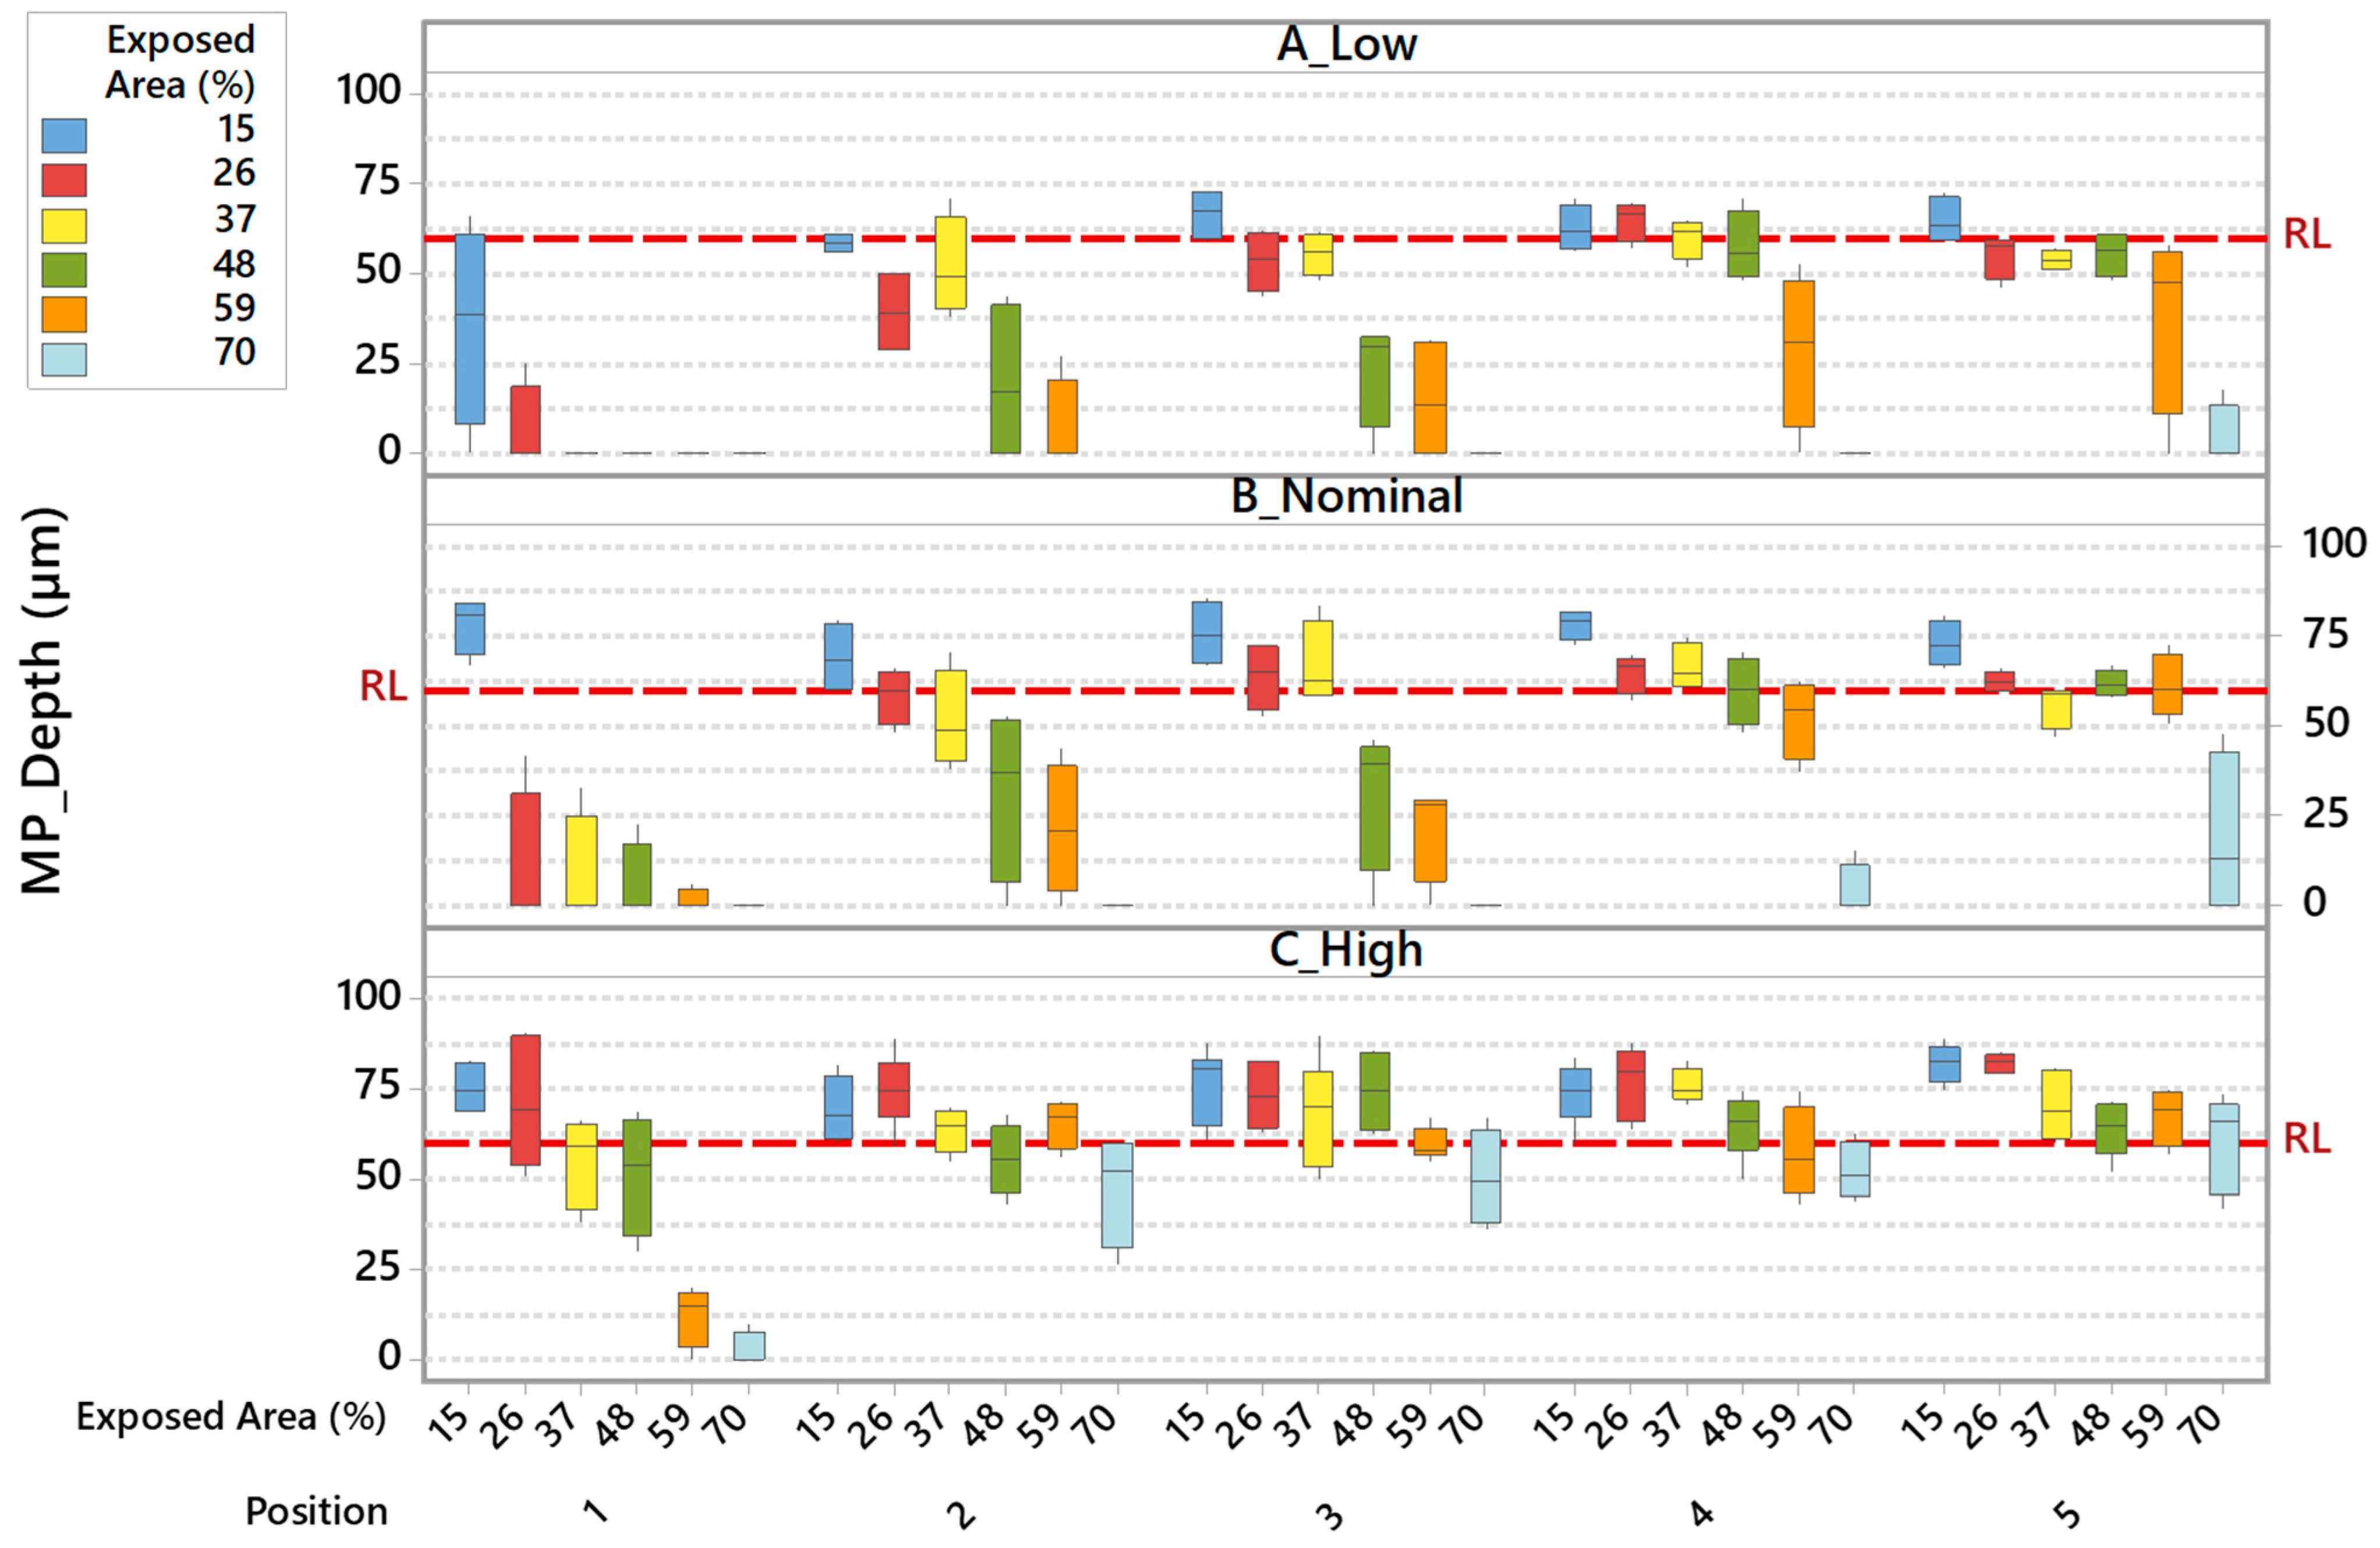
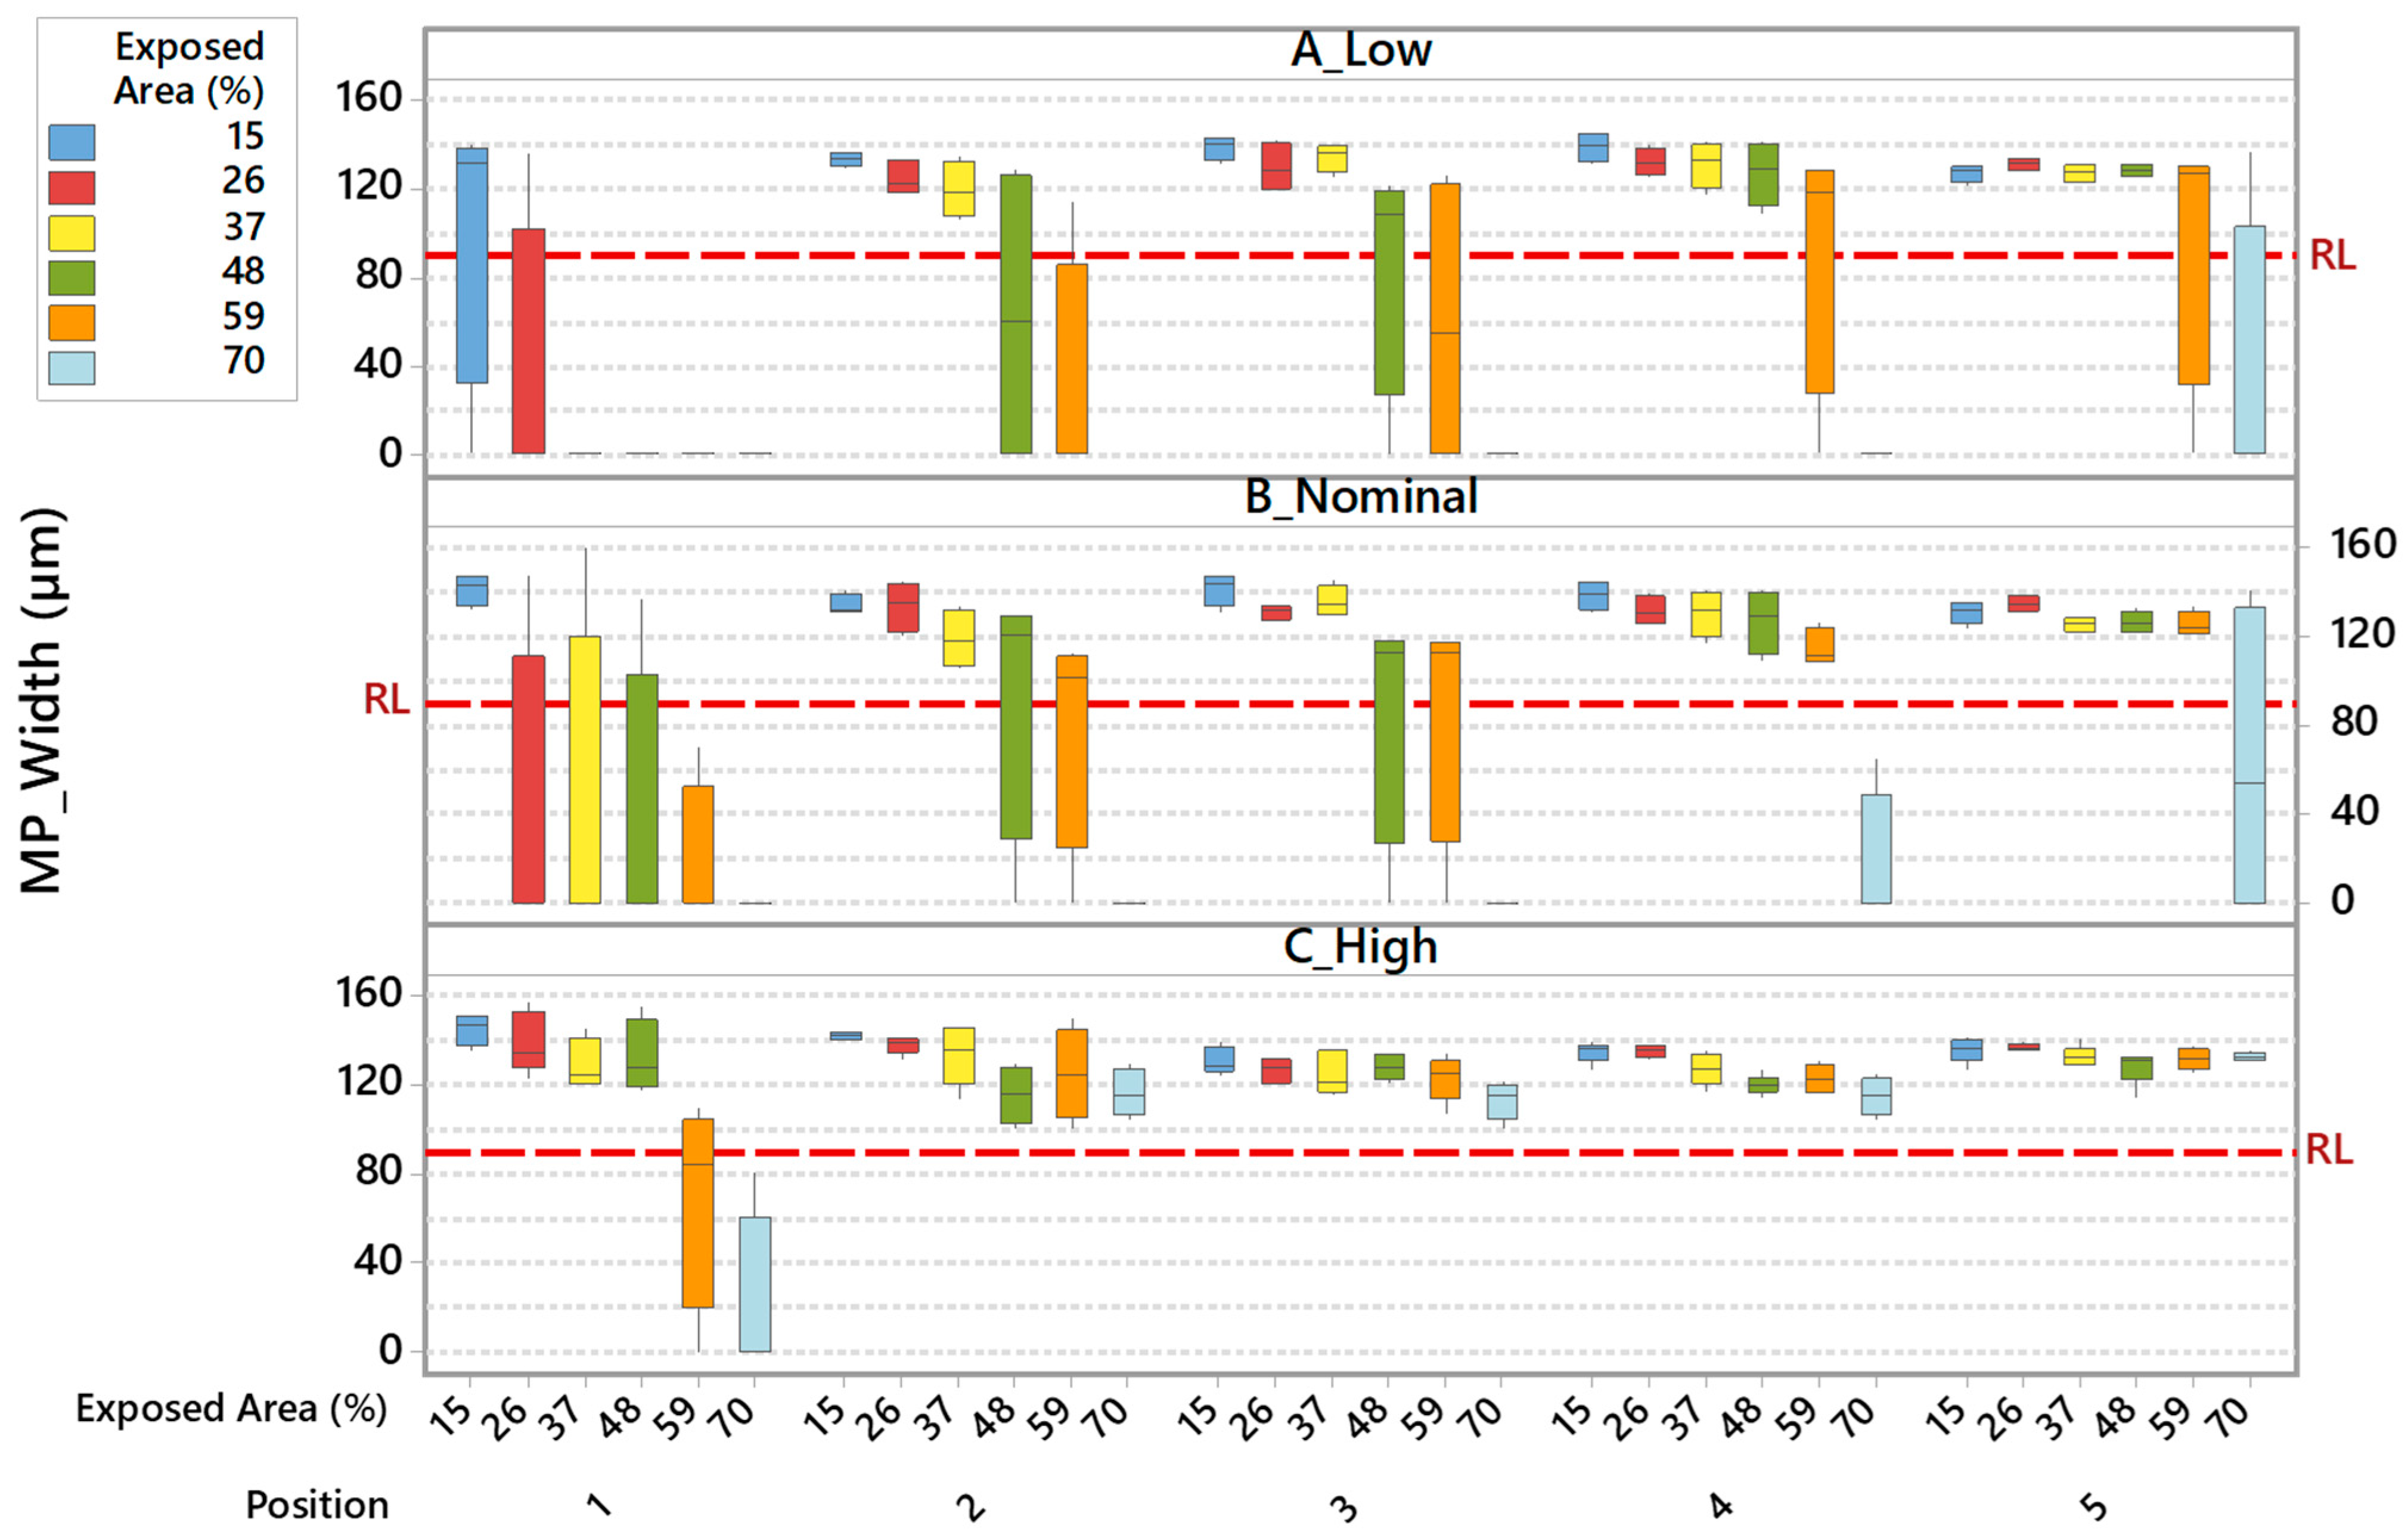
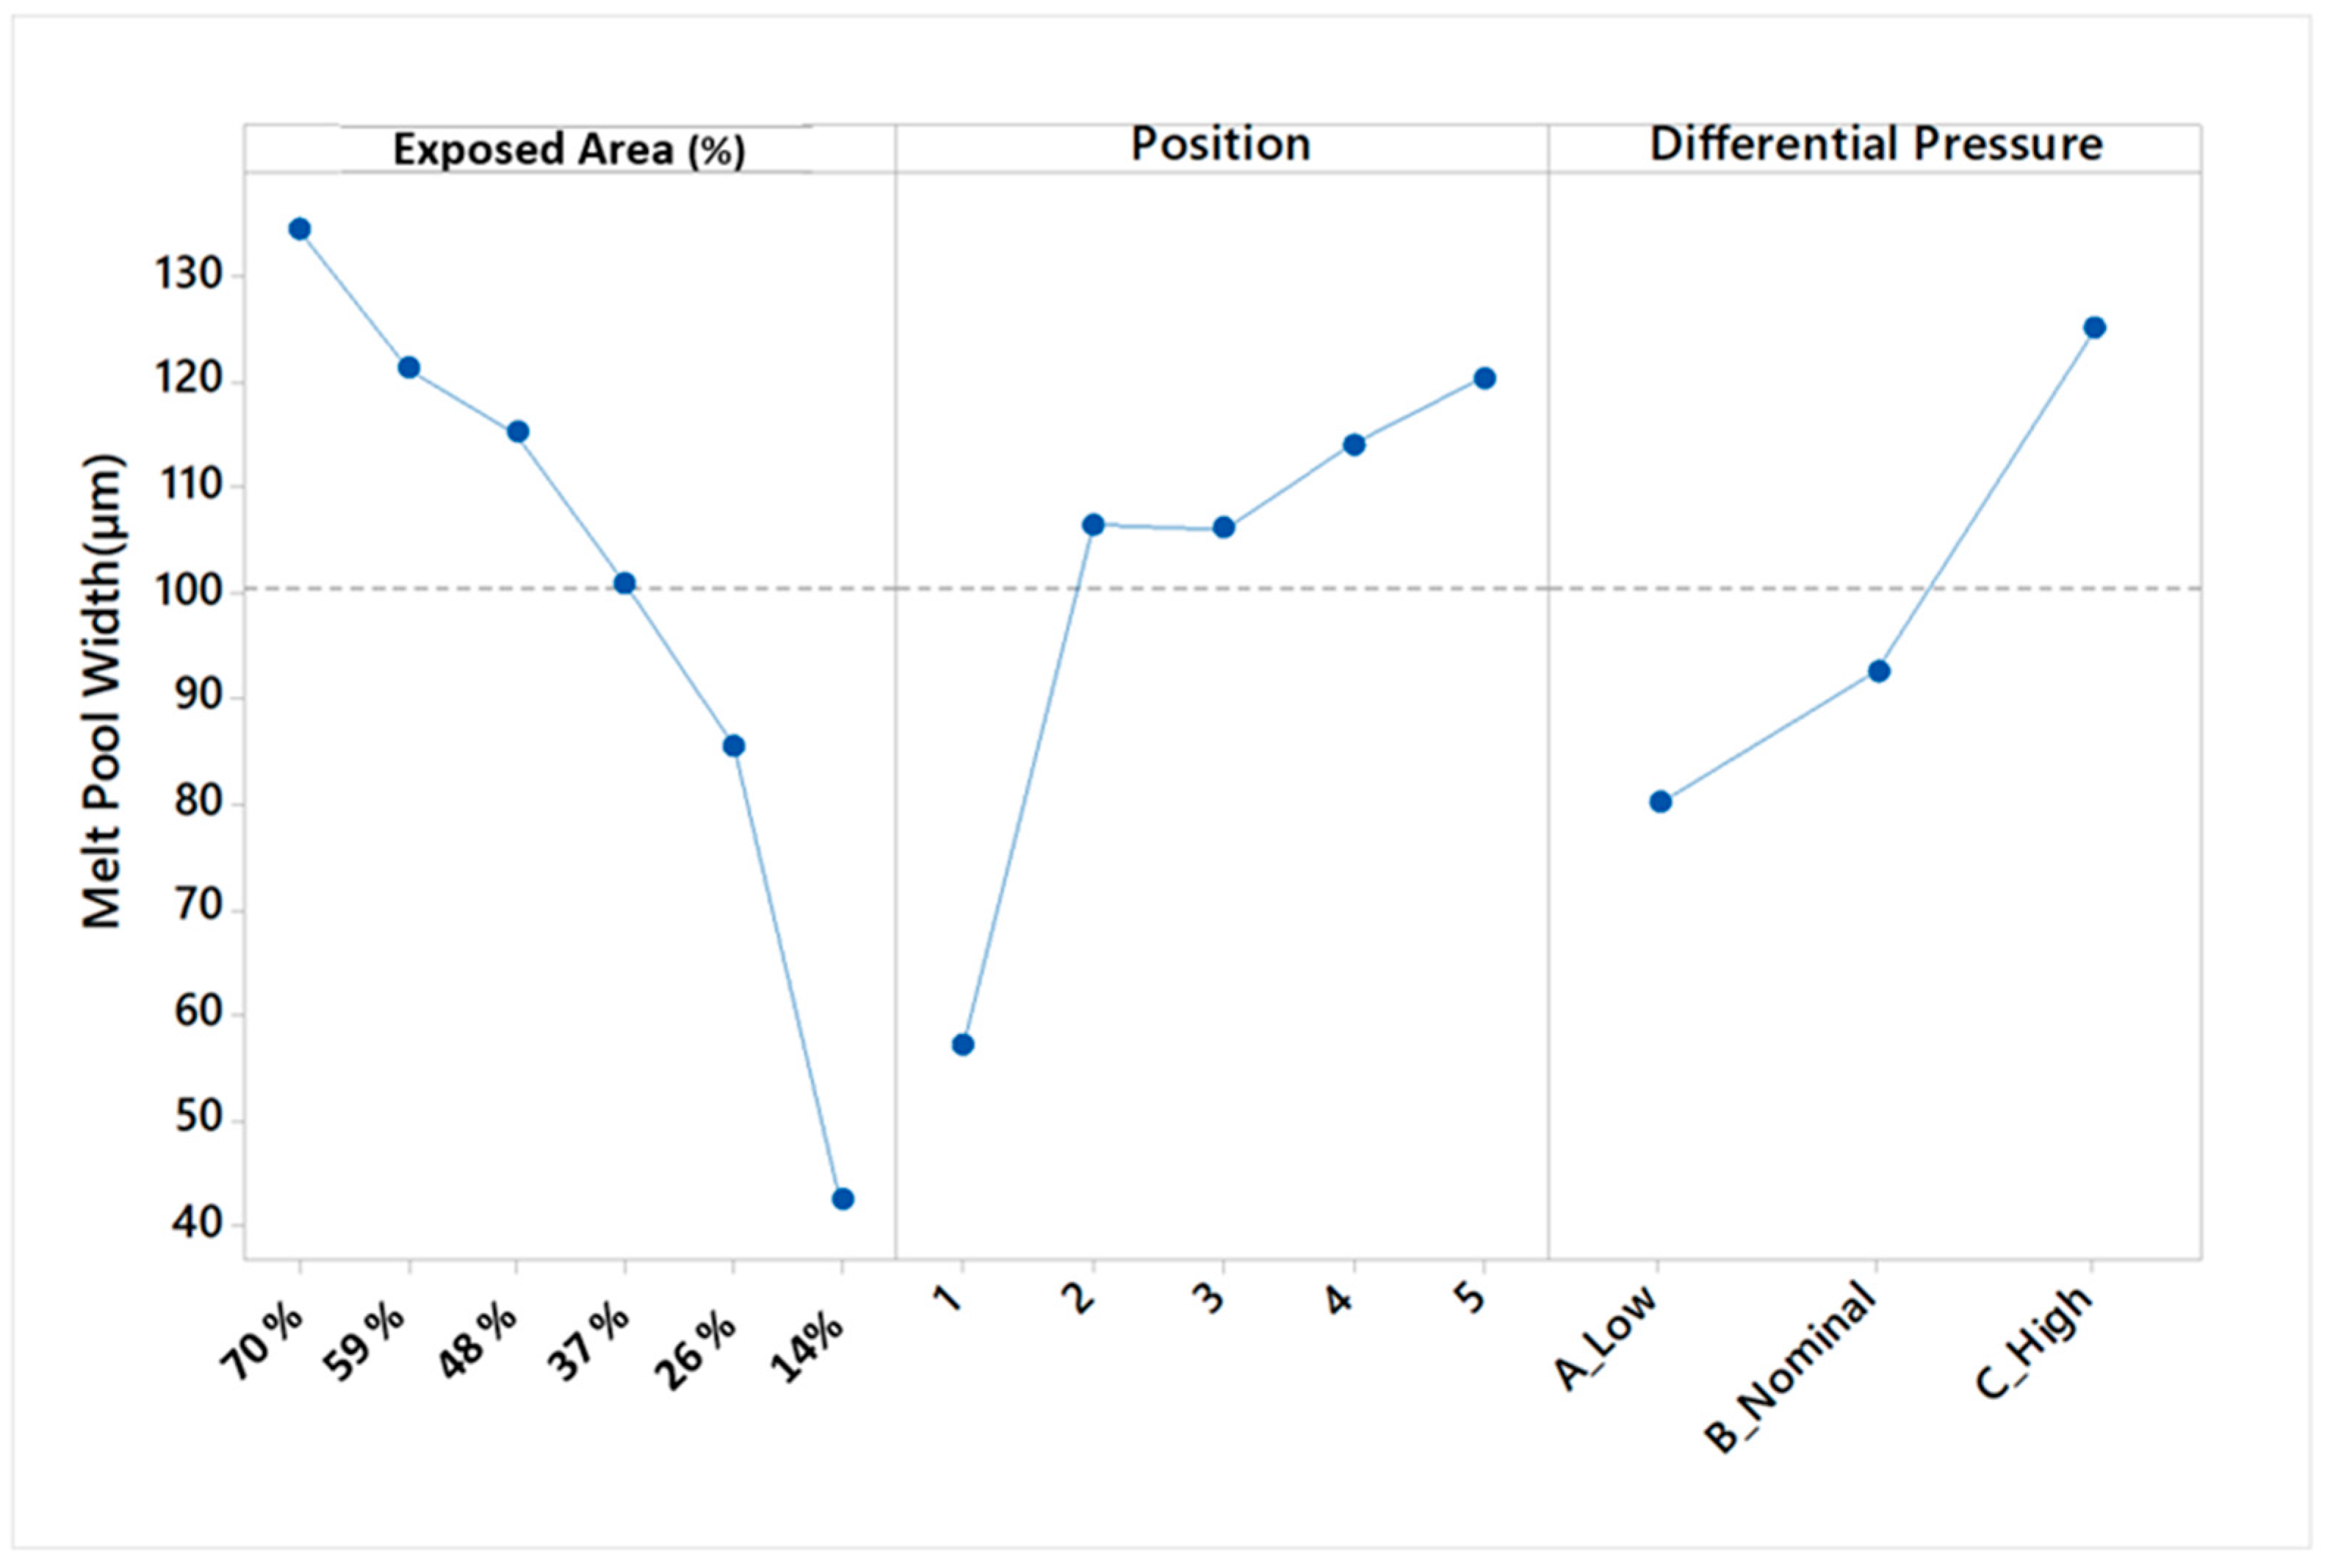
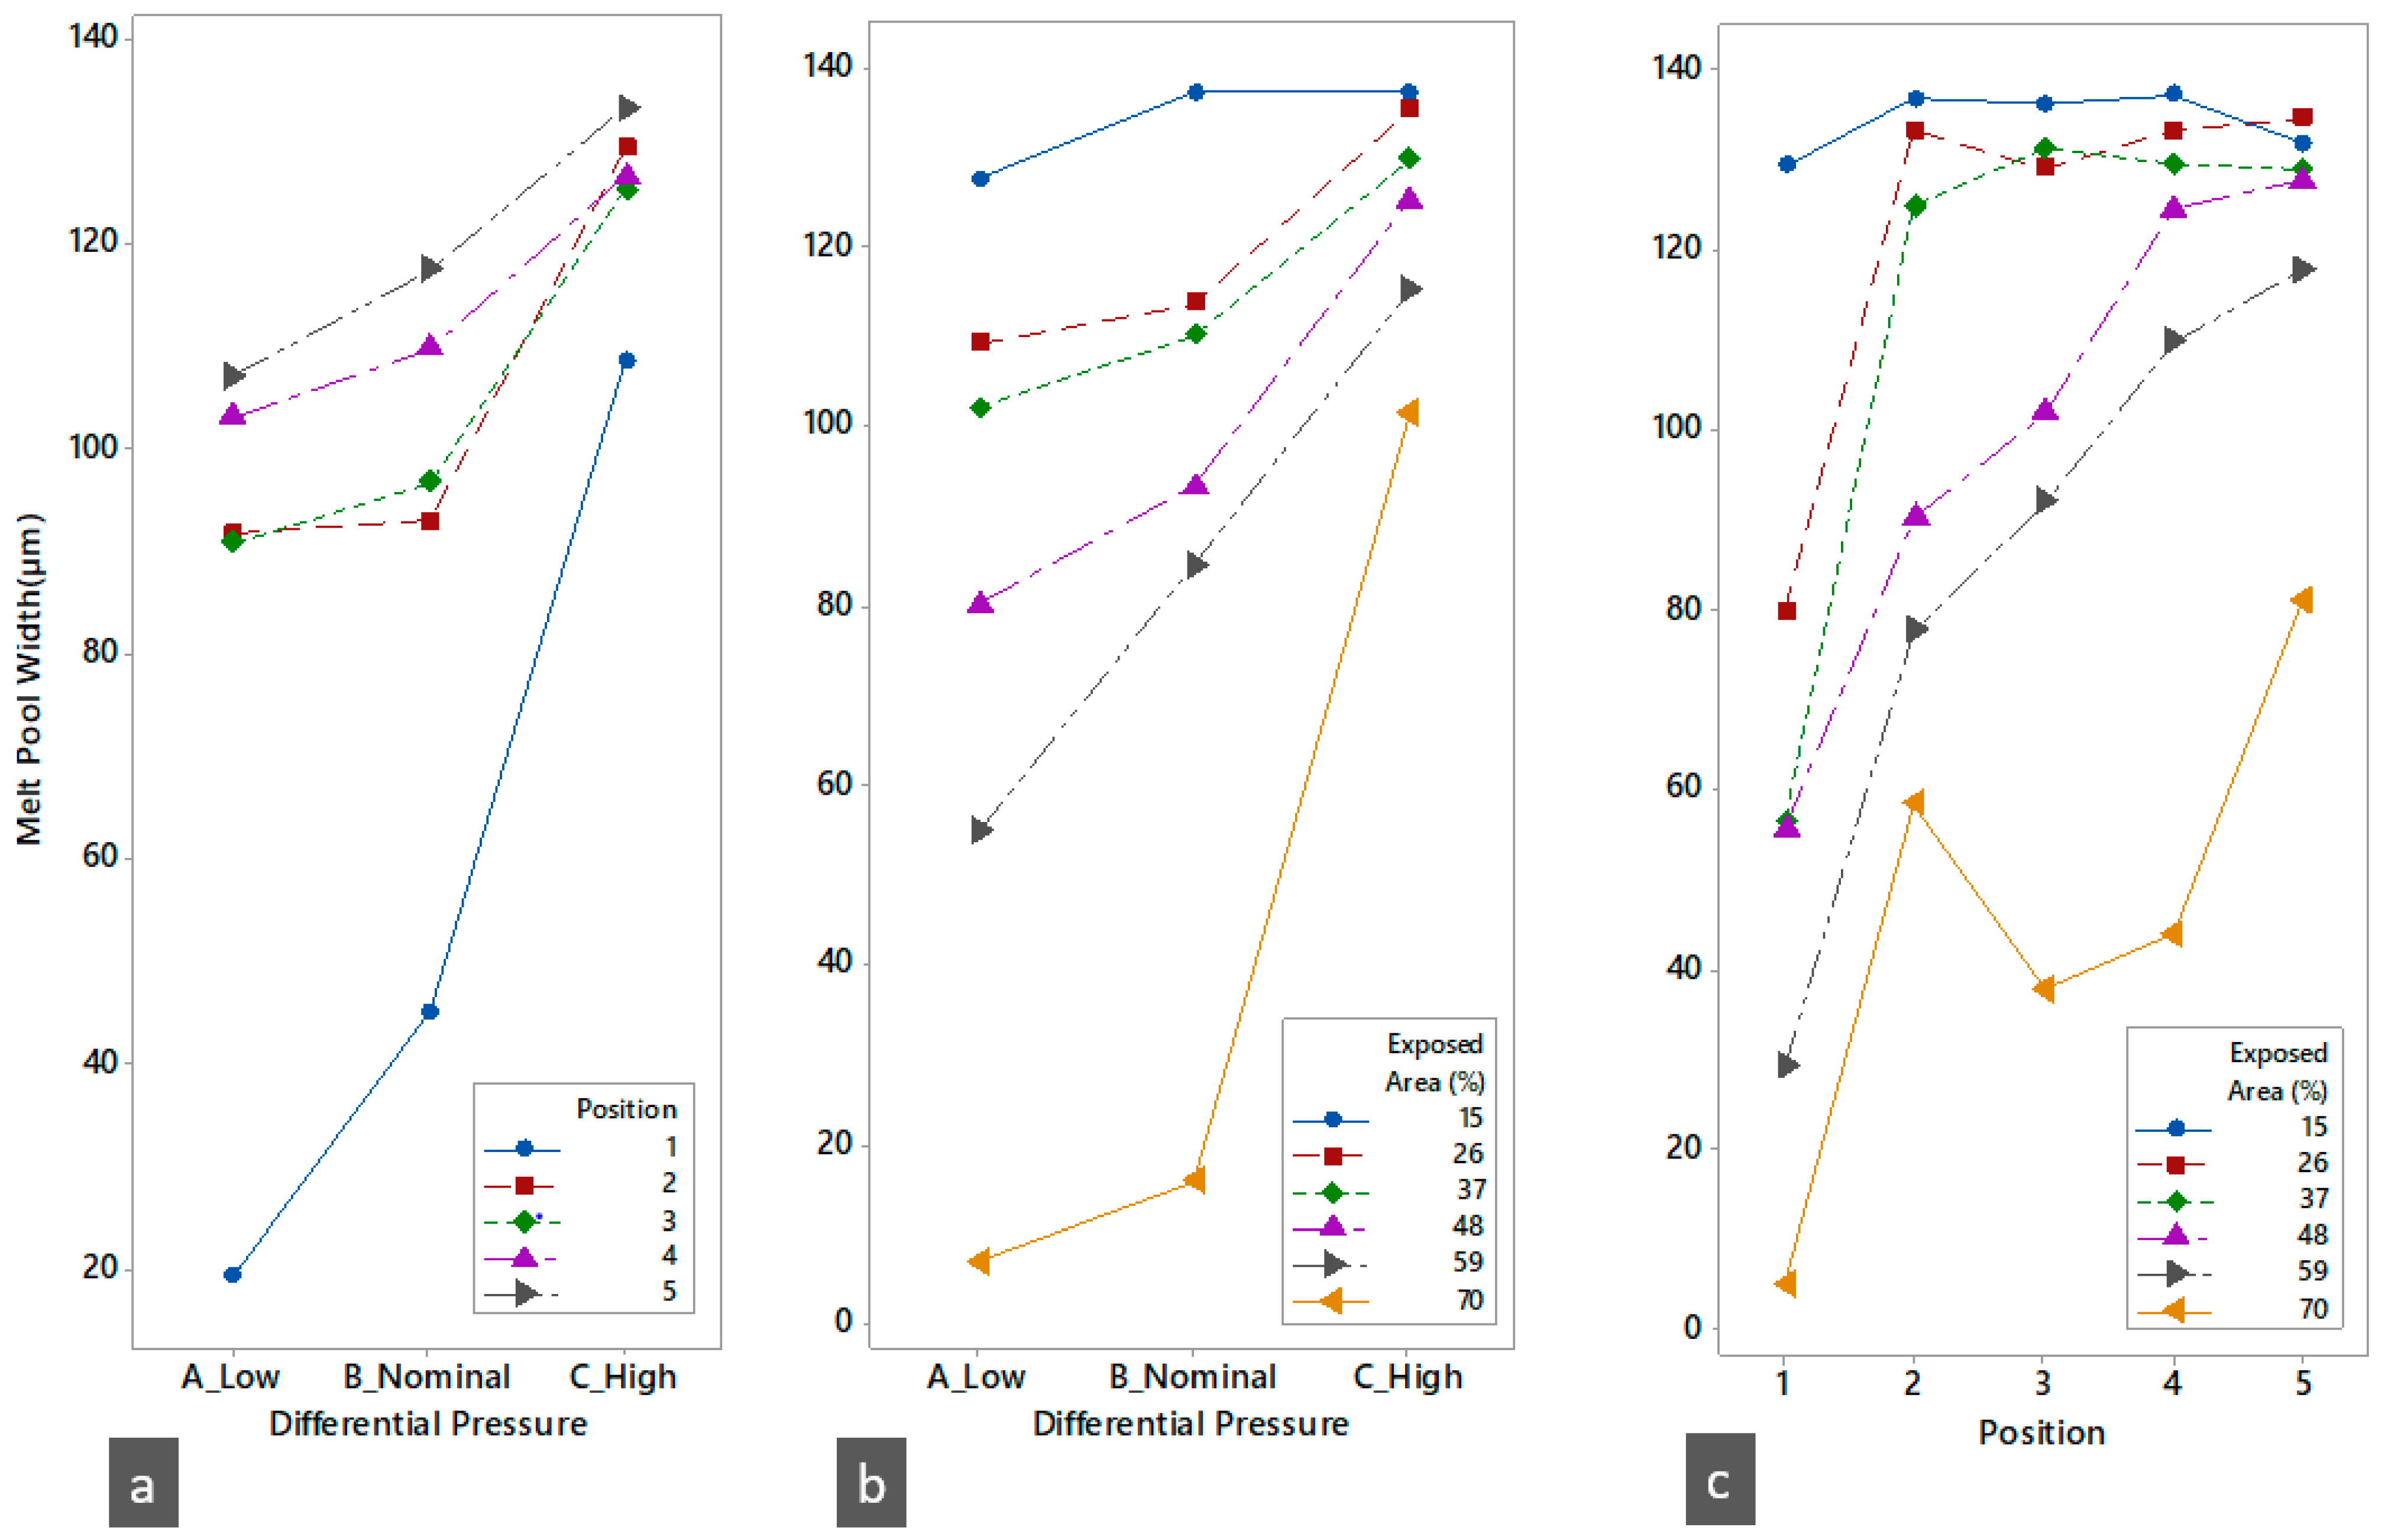
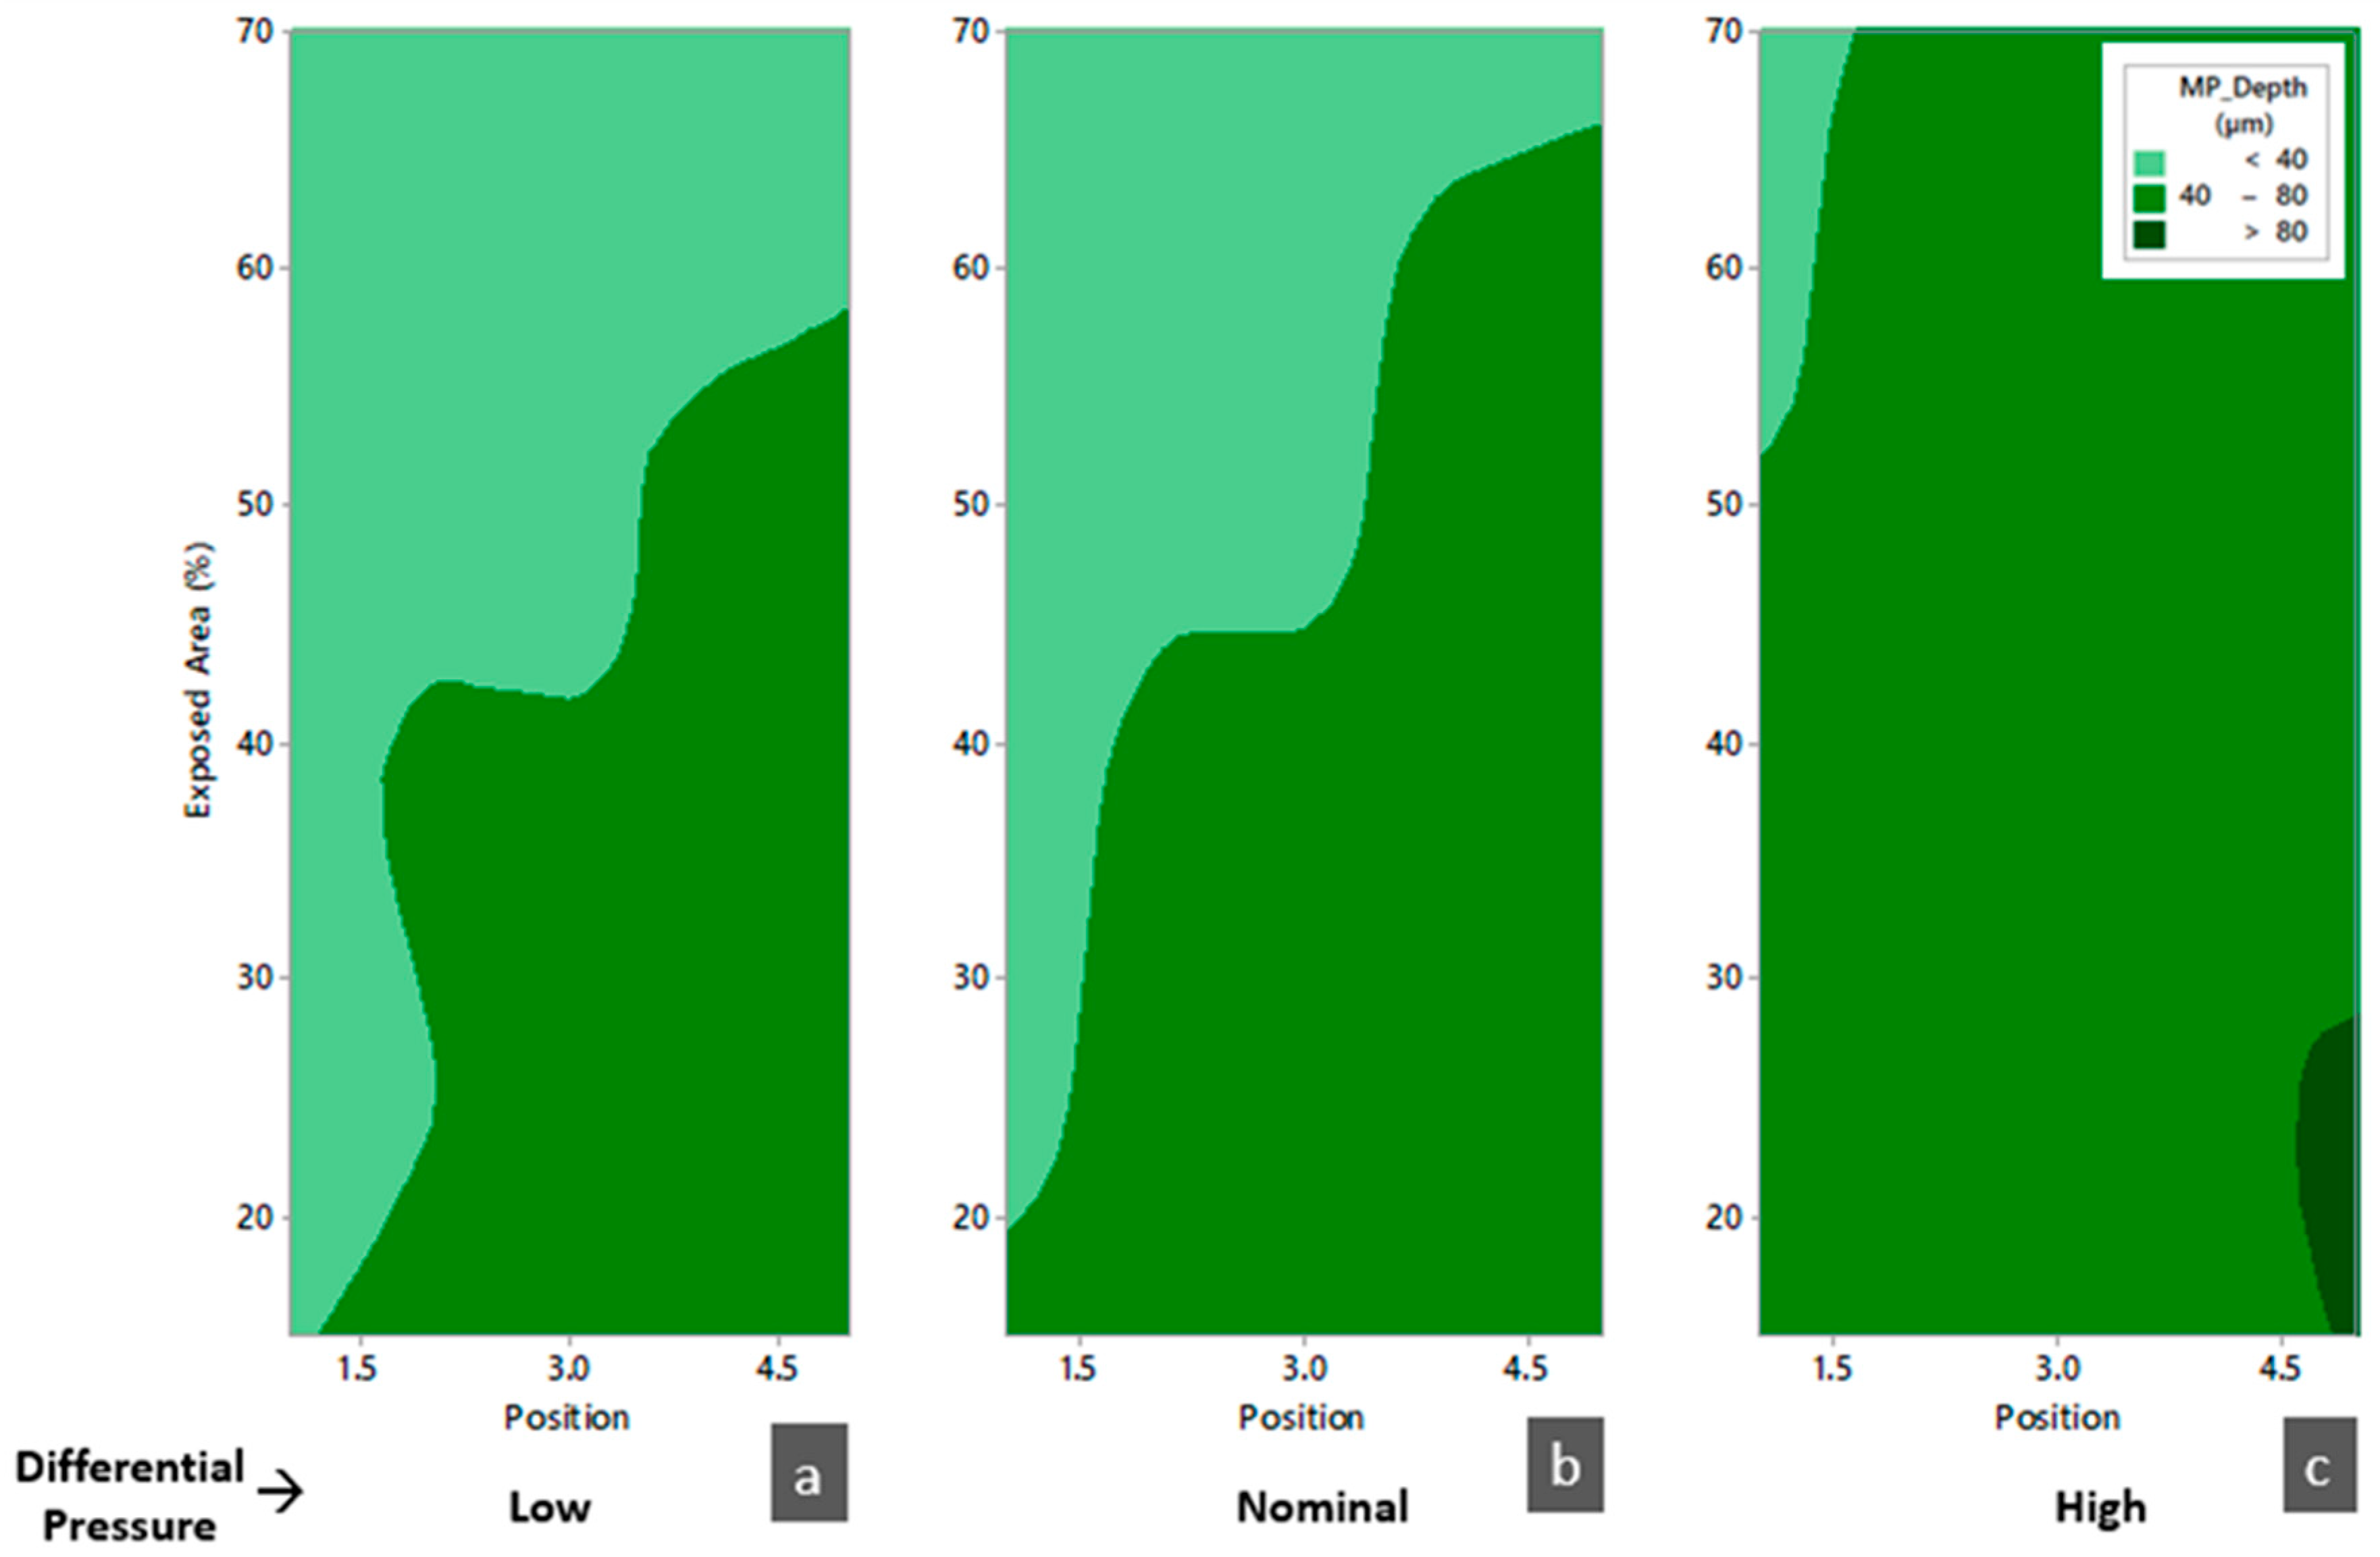
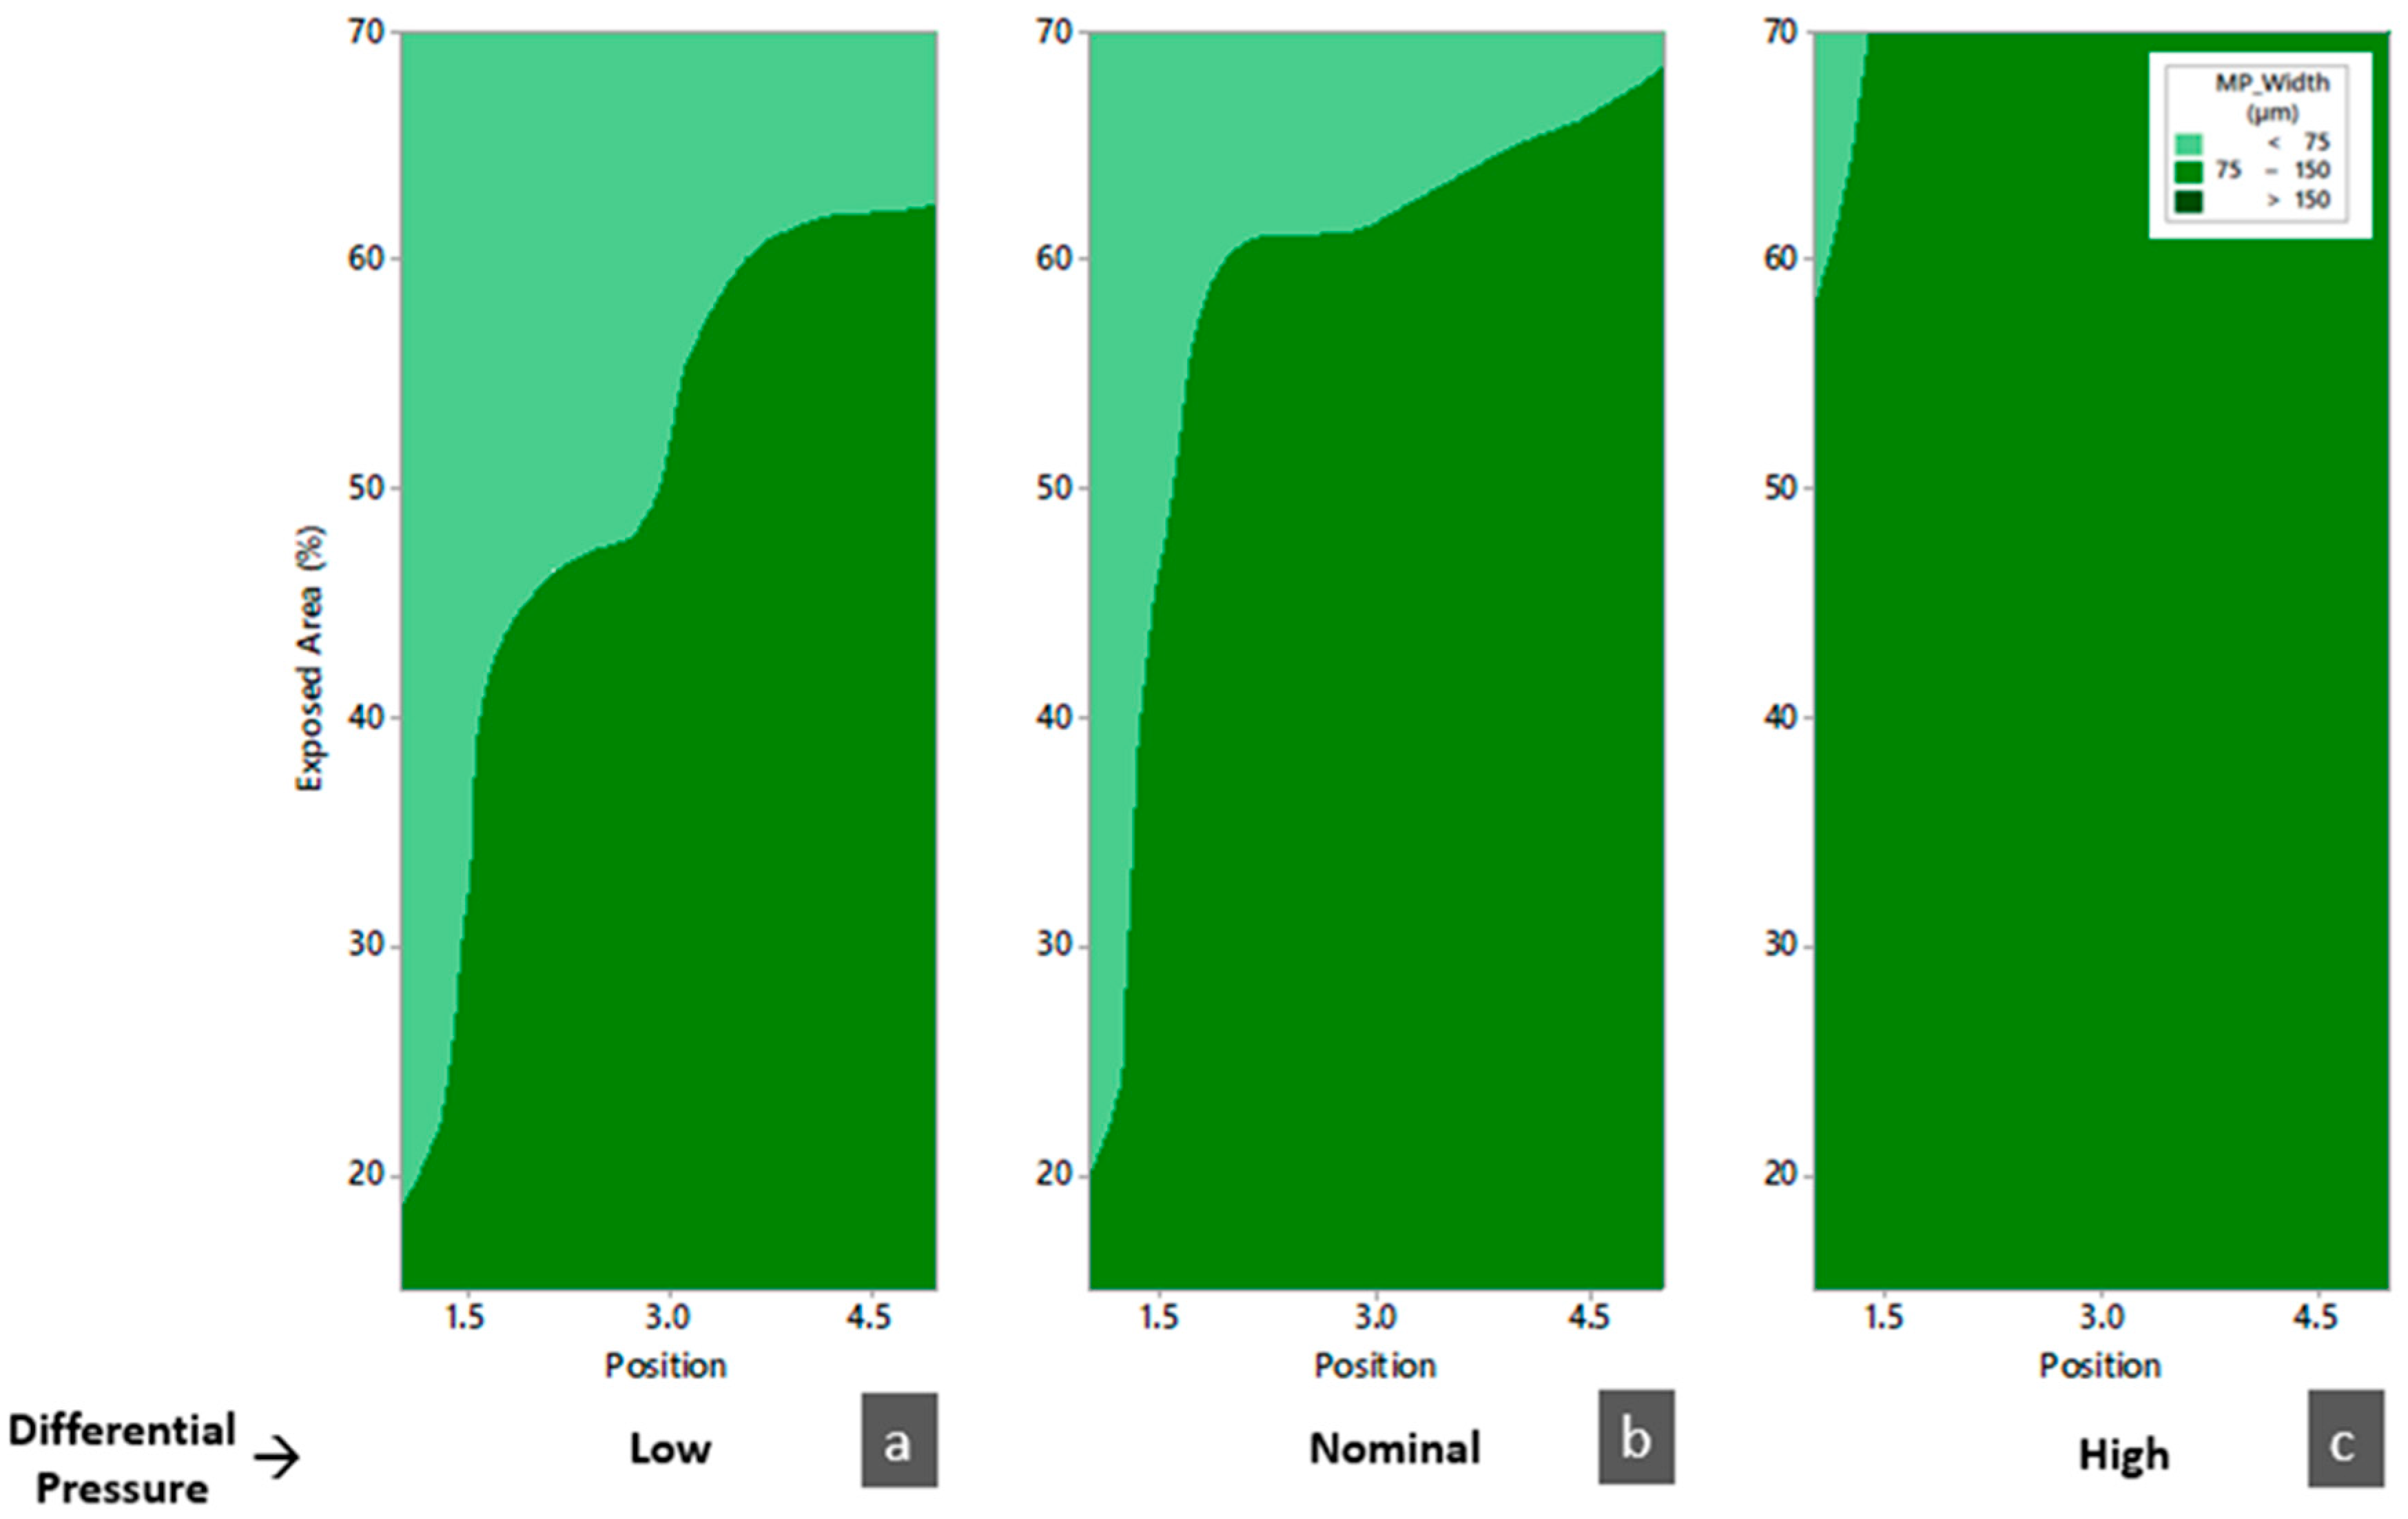
3.3. Melt Pool Analysis
4. Conclusions
- The Exposed Area increase promotes Single Track instability, loss of conductive regime and defect formation;
- Criticality for printability of Alloy 718 in the EOS M290 machine at the position closed to the outlet nozzle and in general when the Exposed Area is more than about 50% of the build platform has been detected;
- A mitigation is possible increasing the value of the Differential Pressure and thus shielding the gas flow velocity, facilitating the removal of the melting’s subproducts, such as spatter particles;
- The interaction between the parameters is quite low or null, allowing us to optimize each one without having any effect on the other.
Author Contributions
Funding
Institutional Review Board Statement
Informed Consent Statement
Data Availability Statement
Conflicts of Interest
Appendix A

| Differential Pressure | Position | Exposed Area (%) | Track Stability Level |
|---|---|---|---|
| Low | 1 | 70 | Unstable |
| Low | 1 | 59 | Unstable |
| Low | 1 | 48 | Unstable |
| Low | 1 | 37 | Unstable |
| Low | 1 | 26 | Unstable |
| Low | 1 | 14 | Metastable |
| Low | 2 | 70 | Unstable |
| Low | 2 | 59 | Metastable |
| Low | 2 | 48 | Metastable |
| Low | 2 | 37 | Metastable |
| Low | 2 | 26 | Metastable |
| Low | 2 | 14 | Stable |
| Low | 3 | 70 | Not stable |
| Low | 3 | 59 | Metastable |
| Low | 3 | 48 | Metastable |
| Low | 3 | 37 | Stable |
| Low | 3 | 26 | Stable |
| Low | 3 | 14 | Stable |
| Low | 4 | 70 | Unstable |
| Low | 4 | 59 | Metastable |
| Low | 4 | 48 | Metastable |
| Low | 4 | 37 | Stable |
| Low | 4 | 26 | Stable |
| Low | 4 | 14 | Stable |
| Low | 5 | 70 | Metastable |
| Low | 5 | 59 | Stable |
| Low | 5 | 48 | Stable |
| Low | 5 | 37 | Stable |
| Low | 5 | 26 | Stable |
| Low | 5 | 14 | Stable |
| Nominal | 1 | 70 | Unstable |
| Nominal | 1 | 59 | Metastable |
| Nominal | 1 | 48 | Metastable |
| Nominal | 1 | 37 | Metastable |
| Nominal | 1 | 26 | Metastable |
| Nominal | 1 | 14 | Stable |
| Nominal | 2 | 70 | Unstable |
| Nominal | 2 | 59 | Metastable |
| Nominal | 2 | 48 | Metastable |
| Nominal | 2 | 37 | Stable |
| Nominal | 2 | 26 | Stable |
| Nominal | 2 | 14 | Stable |
| Nominal | 3 | 70 | Unstable |
| Nominal | 3 | 59 | Metastable |
| Nominal | 3 | 48 | Metastable |
| Nominal | 3 | 37 | Stable |
| Nominal | 3 | 26 | Stable |
| Nominal | 3 | 14 | Stable |
| Nominal | 4 | 70 | Metastable |
| Nominal | 4 | 59 | Stable |
| Nominal | 4 | 48 | Stable |
| Nominal | 4 | 37 | Stable |
| Nominal | 4 | 26 | Stable |
| Nominal | 4 | 14 | Stable |
| Nominal | 5 | 70 | Metastable |
| Nominal | 5 | 59 | Stable |
| Nominal | 5 | 48 | Stable |
| Nominal | 5 | 37 | Stable |
| Nominal | 5 | 26 | Stable |
| Nominal | 5 | 14 | Stable |
| High | 1 | 70 | Metastable |
| High | 1 | 59 | Metastable |
| High | 1 | 48 | Metastable |
| High | 1 | 37 | Metastable |
| High | 1 | 26 | Metastable |
| High | 1 | 14 | Stable |
| High | 2 | 70 | Metastable |
| High | 2 | 59 | Metastable |
| High | 2 | 48 | Metastable |
| High | 2 | 37 | Stable |
| High | 2 | 26 | Stable |
| High | 2 | 14 | Stable |
| High | 3 | 70 | Metastable |
| High | 3 | 59 | Metastable |
| High | 3 | 48 | Stable |
| High | 3 | 37 | Stable |
| High | 3 | 26 | Stable |
| High | 3 | 14 | Stable |
| High | 4 | 70 | Metastable |
| High | 4 | 59 | Metastable |
| High | 4 | 48 | Stable |
| High | 4 | 37 | Stable |
| High | 4 | 26 | Stable |
| High | 4 | 14 | Stable |
| High | 5 | 70 | Metastable |
| High | 5 | 59 | Stable |
| High | 5 | 48 | Stable |
| High | 5 | 37 | Stable |
| High | 5 | 26 | Stable |
| High | 5 | 14 | Stable |
| Differential Pressure | Position | Exposed Area (%) | Porosity (%) | |
|---|---|---|---|---|
| Avg. | SD | |||
| Low | 1 | 70 | 0.093 | 0.020 |
| Low | 1 | 59 | 0.086 | 0.023 |
| Low | 1 | 48 | 0.062 | 0.014 |
| Low | 1 | 37 | 0.051 | 0.018 |
| Low | 1 | 26 | 0.045 | 0.018 |
| Low | 1 | 14 | 0.029 | 0.010 |
| Low | 2 | 70 | 0.082 | 0.020 |
| Low | 2 | 59 | 0.051 | 0.015 |
| Low | 2 | 48 | 0.045 | 0.020 |
| Low | 2 | 37 | 0.038 | 0.011 |
| Low | 2 | 26 | 0.041 | 0.013 |
| Low | 2 | 14 | 0.019 | 0.006 |
| Low | 3 | 70 | 0.068 | 0.018 |
| Low | 3 | 59 | 0.052 | 0.012 |
| Low | 3 | 48 | 0.039 | 0.009 |
| Low | 3 | 37 | 0.031 | 0.007 |
| Low | 3 | 26 | 0.023 | 0.010 |
| Low | 3 | 14 | 0.019 | 0.007 |
| Low | 4 | 70 | 0.056 | 0.013 |
| Low | 4 | 59 | 0.045 | 0.011 |
| Low | 4 | 48 | 0.029 | 0.010 |
| Low | 4 | 37 | 0.023 | 0.005 |
| Low | 4 | 26 | 0.016 | 0.004 |
| Low | 4 | 14 | 0.015 | 0.005 |
| Low | 5 | 70 | 0.052 | 0.012 |
| Low | 5 | 59 | 0.033 | 0.008 |
| Low | 5 | 48 | 0.031 | 0.009 |
| Low | 5 | 37 | 0.023 | 0.007 |
| Low | 5 | 26 | 0.016 | 0.006 |
| Low | 5 | 14 | 0.011 | 0.006 |
| Nominal | 1 | 70 | 0.077 | 0.031 |
| Nominal | 1 | 59 | 0.057 | 0.027 |
| Nominal | 1 | 48 | 0.027 | 0.014 |
| Nominal | 1 | 37 | 0.031 | 0.022 |
| Nominal | 1 | 26 | 0.026 | 0.014 |
| Nominal | 1 | 14 | 0.022 | 0.008 |
| Nominal | 2 | 70 | 0.064 | 0.024 |
| Nominal | 2 | 59 | 0.033 | 0.022 |
| Nominal | 2 | 48 | 0.027 | 0.009 |
| Nominal | 2 | 37 | 0.026 | 0.010 |
| Nominal | 2 | 26 | 0.026 | 0.006 |
| Nominal | 2 | 14 | 0.016 | 0.006 |
| Nominal | 3 | 70 | 0.057 | 0.018 |
| Nominal | 3 | 59 | 0.031 | 0.013 |
| Nominal | 3 | 48 | 0.024 | 0.009 |
| Nominal | 3 | 37 | 0.022 | 0.007 |
| Nominal | 3 | 26 | 0.014 | 0.009 |
| Nominal | 3 | 14 | 0.010 | 0.009 |
| Nominal | 4 | 70 | 0.043 | 0.013 |
| Nominal | 4 | 59 | 0.027 | 0.010 |
| Nominal | 4 | 48 | 0.014 | 0.009 |
| Nominal | 4 | 37 | 0.023 | 0.011 |
| Nominal | 4 | 26 | 0.010 | 0.005 |
| Nominal | 4 | 14 | 0.009 | 0.007 |
| Nominal | 5 | 70 | 0.047 | 0.010 |
| Nominal | 5 | 59 | 0.025 | 0.013 |
| Nominal | 5 | 48 | 0.024 | 0.006 |
| Nominal | 5 | 37 | 0.020 | 0.006 |
| Nominal | 5 | 26 | 0.016 | 0.010 |
| Nominal | 5 | 14 | 0.009 | 0.008 |
| High | 1 | 70 | 0.045 | 0.025 |
| High | 1 | 59 | 0.031 | 0.017 |
| High | 1 | 48 | 0.025 | 0.016 |
| High | 1 | 37 | 0.014 | 0.009 |
| High | 1 | 26 | 0.012 | 0.008 |
| High | 1 | 14 | 0.009 | 0.004 |
| High | 2 | 70 | 0.047 | 0.024 |
| High | 2 | 59 | 0.026 | 0.013 |
| High | 2 | 48 | 0.024 | 0.017 |
| High | 2 | 37 | 0.016 | 0.008 |
| High | 2 | 26 | 0.015 | 0.005 |
| High | 2 | 14 | 0.011 | 0.006 |
| High | 3 | 70 | 0.039 | 0.014 |
| High | 3 | 59 | 0.033 | 0.017 |
| High | 3 | 48 | 0.019 | 0.007 |
| High | 3 | 37 | 0.017 | 0.007 |
| High | 3 | 26 | 0.010 | 0.005 |
| High | 3 | 14 | 0.009 | 0.006 |
| High | 4 | 70 | 0.031 | 0.011 |
| High | 4 | 59 | 0.025 | 0.014 |
| High | 4 | 48 | 0.022 | 0.011 |
| High | 4 | 37 | 0.015 | 0.008 |
| High | 4 | 26 | 0.011 | 0.004 |
| High | 4 | 14 | 0.009 | 0.003 |
| High | 5 | 70 | 0.029 | 0.011 |
| High | 5 | 59 | 0.016 | 0.005 |
| High | 5 | 48 | 0.012 | 0.005 |
| High | 5 | 37 | 0.011 | 0.007 |
| High | 5 | 26 | 0.010 | 0.004 |
| High | 5 | 14 | 0.007 | 0.003 |
| Differential Pressure | Position | Exposed Area | Depth (µm) | Width (µm) | ||
|---|---|---|---|---|---|---|
| (mbar) | (%) | Avg. | SD | Avg. | SD | |
| Low | 1 | 70 | 0.0 | 0.0 | 0.0 | 0.0 |
| Low | 1 | 59 | 0.0 | 0.0 | 0.0 | 0.0 |
| Low | 1 | 48 | 0.0 | 0.0 | 0.0 | 0.0 |
| Low | 1 | 37 | 0.0 | 0.0 | 0.0 | 0.0 |
| Low | 1 | 26 | 6.25 | 12.5 | 34.0 | 68 |
| Low | 1 | 14 | 35.8 | 27.6 | 100.7 | 67.3 |
| Low | 2 | 70 | 0.0 | 0.0 | 0.0 | 0.0 |
| Low | 2 | 59 | 19.5 | 22.9 | 61.7 | 71.4 |
| Low | 2 | 48 | 51.7 | 13.9 | 119.0 | 13.2 |
| Low | 2 | 37 | 29.5 | 21.5 | 93.2 | 7.8 |
| Low | 2 | 26 | 58.5 | 2.4 | 133.2 | 3.3 |
| Low | 3 | 14 | 0.0 | 0.0 | 0.0 | 0.0 |
| Low | 3 | 70 | 14.8 | 17.1 | 58.7 | 68.2 |
| Low | 3 | 59 | 23.0 | 15.4 | 84.2 | 56.6 |
| Low | 3 | 48 | 55.5 | 5.8 | 134.1 | 6.5 |
| Low | 3 | 37 | 53.8 | 8.6 | 129.5 | 10.8 |
| Low | 3 | 26 | 66.8 | 6.8 | 138.5 | 5.3 |
| Low | 4 | 14 | 0.0 | 0.0 | 0.0 | 0.0 |
| Low | 4 | 70 | 28.8 | 21.8 | 91.2 | 61.4 |
| Low | 4 | 59 | 57.5 | 9.9 | 127 | 14.8 |
| Low | 4 | 48 | 60.2 | 5.7 | 130.7 | 10.4 |
| Low | 4 | 37 | 65.0 | 5.6 | 131.7 | 6.4 |
| Low | 4 | 26 | 62.8 | 6.3 | 138.2 | 6.2 |
| Low | 5 | 14 | 4.5 | 9.1 | 34.1 | 68.5 |
| Low | 5 | 70 | 38.2 | 26.1 | 95.7 | 63.9 |
| Low | 5 | 59 | 55.4 | 6.1 | 128.0 | 3.2 |
| Low | 5 | 48 | 54.0 | 2.6 | 126.7 | 4.1 |
| Low | 5 | 37 | 55.2 | 6.4 | 131 | 2.9 |
| Low | 5 | 26 | 64.8 | 6.2 | 127 | 4.1 |
| Nominal | 1 | 14 | 0.0 | 0.0 | 0.0 | 0.0 |
| Nominal | 1 | 70 | 1.5 | 3.0 | 17.5 | 35 |
| Nominal | 1 | 59 | 5.8 | 11.5 | 34.25 | 68.5 |
| Nominal | 1 | 48 | 8.2 | 16.5 | 40.0 | 80.0 |
| Nominal | 1 | 37 | 42.0 | 21.0 | 37.0 | 74.0 |
| Nominal | 1 | 26 | 78.5 | 7.9 | 141.2 | 6.9 |
| Nominal | 2 | 14 | 0.0 | 0.0 | 0.0 | 0.0 |
| Nominal | 2 | 70 | 21.5 | 18.3 | 79.0 | 53.1 |
| Nominal | 2 | 59 | 31.8 | 24.2 | 92.7 | 62.1 |
| Nominal | 2 | 48 | 51.7 | 13.9 | 119.1 | 13.2 |
| Nominal | 2 | 37 | 58.5 | 7.9 | 133.7 | 11.1 |
| Nominal | 2 | 26 | 69.25 | 9.8 | 134.2 | 4.6 |
| Nominal | 3 | 14 | 0.0 | 0.0 | 0.0 | 0.0 |
| Nominal | 3 | 70 | 21.5 | 14.4 | 86.0 | 57.4 |
| Nominal | 3 | 59 | 31.3 | 21.1 | 86.0 | 57.4 |
| Nominal | 3 | 48 | 67.0 | 11.8 | 135.7 | 7.3 |
| Nominal | 3 | 37 | 64.2 | 9.1 | 131.2 | 3.4 |
| Nominal | 3 | 26 | 76.1 | 9.0 | 141.5 | 7.2 |
| Nominal | 4 | 14 | 3.8 | 7.5 | 16.2 | 32.5 |
| Nominal | 4 | 70 | 52.5 | 11.1 | 114.7 | 8.3 |
| Nominal | 4 | 59 | 60.0 | 9.6 | 127.0 | 14.8 |
| Nominal | 4 | 48 | 66.5 | 6.8 | 130.7 | 10.4 |
| Nominal | 4 | 37 | 65.2 | 5.6 | 131.7 | 6.4 |
| Nominal | 4 | 26 | 78.5 | 4.1 | 138.5 | 6.2 |
| Nominal | 5 | 14 | 18.7 | 23.2 | 62.5 | 73.3 |
| Nominal | 5 | 70 | 61.2 | 9.1 | 125.5 | 5.9 |
| Nominal | 5 | 59 | 62.0 | 3.7 | 126.5 | 5.1 |
| Nominal | 5 | 48 | 59.5 | 6.2 | 125.2 | 3.4 |
| Nominal | 5 | 37 | 62.8 | 2.7 | 134.7 | 3.9 |
| Nominal | 5 | 26 | 73.1 | 6.5 | 131.2 | 5.1 |
| High | 1 | 14 | 2.5 | 5.0 | 20.2 | 40.5 |
| High | 1 | 70 | 12.2 | 8.6 | 70.0 | 48.3 |
| High | 1 | 59 | 51.8 | 16.9 | 132.5 | 16.5 |
| High | 1 | 48 | 55.5 | 12.8 | 129.2 | 11.6 |
| High | 1 | 37 | 71.1 | 16.8 | 138.8 | 13.4 |
| High | 1 | 26 | 75.5 | 7.04 | 145.7 | 7.1 |
| High | 2 | 14 | 47.8 | 16.1 | 116.7 | 10.4 |
| High | 2 | 70 | 65.1 | 8.2 | 125.2 | 21.1 |
| High | 2 | 59 | 58.2 | 10.2 | 116.1 | 13.0 |
| High | 2 | 48 | 63.6 | 6.1 | 134 | 13.5 |
| High | 2 | 37 | 74.8 | 10.6 | 138.4 | 3.8 |
| High | 2 | 26 | 67.6 | 8.8 | 139.6 | 7.3 |
| High | 3 | 14 | 50.5 | 13.2 | 113.5 | 8.9 |
| High | 3 | 70 | 60.1 | 4.6 | 123.4 | 10.3 |
| High | 3 | 59 | 74.8 | 10.8 | 128.6 | 5.9 |
| High | 3 | 48 | 67.4 | 15.3 | 125.4 | 9.5 |
| High | 3 | 37 | 73.6 | 9.3 | 126.8 | 5.6 |
| High | 3 | 26 | 79.6 | 8.2 | 131.8 | 6.6 |
| High | 4 | 14 | 52.2 | 8.1 | 115.5 | 8.3 |
| High | 4 | 70 | 57.2 | 13.2 | 123.5 | 6.5 |
| High | 4 | 59 | 65.2 | 9.3 | 120.4 | 4.3 |
| High | 4 | 48 | 76.4 | 4.7 | 127.4 | 7.2 |
| High | 4 | 37 | 76.9 | 10.4 | 135.6 | 2.7 |
| High | 4 | 26 | 74.2 | 8.8 | 135.2 | 4.9 |
| High | 5 | 14 | 59.8 | 13.6 | 133.2 | 1.9 |
| High | 5 | 70 | 67.8 | 8.1 | 132.1 | 5.2 |
| High | 5 | 59 | 64.2 | 7.9 | 128.4 | 7.6 |
| High | 5 | 48 | 70.6 | 9.6 | 133.4 | 4.6 |
| High | 5 | 37 | 82.4 | 2.9 | 137.2 | 1.9 |
| High | 5 | 26 | 82.0 | 5.3 | 136.0 | 5.7 |
References
- Blakey-Milner, B.; Gradl, P.; Snedden, G.; Brooks, M.; Pitot, J.; Lopez, E.; Leary, M.; Berto, F.; Du Plessis, A. Metal Additive Manufacturing in Aerospace: A Review. Mater. Des. 2021, 209, 110008. [Google Scholar] [CrossRef]
- Amano, H.; Ishimoto, T.; Hagihara, K.; Suganuma, R.; Aiba, K.; Sun, S.-H.; Wang, P.; Nakano, T. Impact of Gas Flow Direction on the Crystallographic Texture Evolution in Laser Beam Powder Bed Fusion. Virtual Phys. Prototyp. 2023, 18, e2169172. [Google Scholar] [CrossRef]
- Wang, Z.; Guan, K.; Gao, M.; Li, X.; Chen, X.; Zeng, X. The Microstructure and Mechanical Properties of Deposited-IN718 by Selective Laser Melting. J. Alloys Compd. 2011, 513, 518–523. [Google Scholar] [CrossRef]
- Osakada, K.; Shiomi, M. Flexible Manufacturing of Metallic Products by Selective Laser Melting of Powder. Int. J. Mach. Tools Manuf. 2006, 46, 1188–1193. [Google Scholar] [CrossRef]
- Kruth, J.; Mercelis, P.; Van Vaerenbergh, J.; Froyen, L.; Rombouts, M. Binding Mechanisms in Selective Laser Sintering and Selective Laser Melting. Rapid Prototyp. J. 2005, 11, 26–36. [Google Scholar] [CrossRef]
- Yadroitsev, I.; Gusarov, A.; Yadroitsava, I.; Smurov, I. Single Track Formation in Selective Laser Melting of Metal Powders. J. Mater. Process. Technol. 2010, 210, 1624–1631. [Google Scholar] [CrossRef]
- Hagedorn, Y. Laser Additive Manufacturing of Ceramic Components; Elsevier: Amsterdam, The Netherlands, 2016; pp. 163–180. [Google Scholar]
- Smith, J.; Xiong, W.; Yan, W.; Lin, S.; Cheng, P.; Kafka, O.L.; Wagner, G.J.; Cao, J.; Liu, W.K. Linking Process, Structure, Property, and Performance for Metal-Based Additive Manufacturing: Computational Approaches with Experimental Support. Comput. Mech. 2016, 57, 583–610. [Google Scholar] [CrossRef]
- Jo, A.R.; An, J.S.; Kim, S.H.; Park, D.Y.; Moon, Y.H.; Hwang, S.K. Optimal Process Conditions for Powder Bed Fusion and Analysis of Properties of Maraging Steel. Met. Mater. Int. 2023, 29, 2865–2877. [Google Scholar] [CrossRef]
- Metelkova, J.; Kinds, Y.; Kempen, K.; De Formanoir, C.; Witvrouw, A.; Van Hooreweder, B. On the Influence of Laser Defocusing in Selective Laser Melting of 316L. Addit. Manuf. 2018, 23, 161–169. [Google Scholar] [CrossRef]
- Gokcekaya, O.; Ishimoto, T.; Nishikawa, Y.; Kim, Y.S.; Matsugaki, A.; Ozasa, R.; Weinmann, M.; Schnitter, C.; Stenzel, M.; Kim, H.S.; et al. Novel Single Crystalline-like Non-Equiatomic TiZrHfNbTaMo Bio-High Entropy Alloy (BioHEA) Developed by Laser Powder Bed Fusion. Mater. Res. Lett. 2022, 11, 274–280. [Google Scholar] [CrossRef]
- Liu, S.Y.; Li, H.Q.; Qin, C.X.; Zong, R.; Fang, X.Y. The Effect of Energy Density on Texture and Mechanical Anisotropy in Selective Laser Melted Inconel 718. Mater. Des. 2020, 191, 108642. [Google Scholar] [CrossRef]
- Ekubaru, Y.; Gokcekaya, O.; Ishimoto, T.; Sato, K.; Manabe, K.; Wang, P.; Nakano, T. Excellent Strength–Ductility Balance of Sc-Zr-Modified Al–Mg Alloy by Tuning Bimodal Microstructure via Hatch Spacing in Laser Powder Bed Fusion. Mater. Des. 2022, 221, 110976. [Google Scholar] [CrossRef]
- Ishimoto, T.; Hagihara, K.; Hisamoto, K.; Sun, S.-H.; Nakano, T. Crystallographic Texture Control of Beta-Type Ti–15Mo–5Zr–3Al Alloy by Selective Laser Melting for the Development of Novel Implants with a Biocompatible Low Young’s Modulus. Scr. Mater. 2017, 132, 34–38. [Google Scholar] [CrossRef]
- Ren, Y.; Liang, L.; Shan, Q.; Cai, A.; Du, J.; Huang, Q.; Liu, S.; Yang, X.; Tian, Y.; Wu, H. Effect of Volumetric Energy Density on Microstructure and Tribological Properties of FeCoNiCuAl High-Entropy Alloy Produced by Laser Powder Bed Fusion. Virtual Phys. Prototyp. 2020, 15, 543–554. [Google Scholar] [CrossRef]
- Gokcekaya, O.; Hayashi, N.; Ishimoto, T.; Ueda, K.; Narushima, T.; Nakano, T. Crystallographic Orientation Control of Pure Chromium via Laser Powder Bed Fusion and Improved High Temperature Oxidation Resistance. Addit. Manuf. 2020, 36, 101624. [Google Scholar] [CrossRef]
- Liu, X.; Wang, K.; Hu, P.; He, X.; Yan, B.; Zhao, X. Formability, Microstructure and Properties of Inconel 718 Superalloy Fabricated by Selective Laser Melting Additive Manufacture Technology. Materials 2021, 14, 991. [Google Scholar] [CrossRef]
- Mukherjee, T.; Zuback, J.S.; De, A.; DebRoy, T. Printability of Alloys for Additive Manufacturing. Sci. Rep. 2016, 6, 19717. [Google Scholar] [CrossRef]
- Oliveira, J.P.; LaLonde, A.D.; Ma, J. Processing Parameters in Laser Powder Bed Fusion Metal Additive Manufacturing. Mater. Des. 2020, 193, 108762. [Google Scholar] [CrossRef]
- Giorgetti, A.; Baldi, N.; Palladino, M.; Ceccanti, F.; Arcidiacono, G.; Citti, P. A Method to Optimize Parameters Development in L-PBF Based on Single and Multitracks Analysis: A Case Study on Inconel 718 Alloy. Metals 2023, 13, 306. [Google Scholar] [CrossRef]
- Johnson, L.; Mahmoudi, M.; Zhang, B.; Seede, R.; Huang, X.; Maier, J.T.; Maier, H.J.; Karaman, I.; Elwany, A.; Arróyave, R. Assessing Printability Maps in Additive Manufacturing of Metal Alloys. Acta Mater. 2019, 176, 199–210. [Google Scholar] [CrossRef]
- Agarwal, N.; Monu, M.C.C.; Selvam, K.T.; Obeidi, M.A.; Brabazon, D. Study of the Effects of Laser Power and Scanning Speed on the Microstructural Morphologies and Physical Properties of L-PBF Produced Ni52.39Ti47.61. J. Mater. Res. Technol. 2023, 27, 8334–8343. [Google Scholar] [CrossRef]
- Tenbrock, C.; Fischer, F.G.; Wissenbach, K.; Schleifenbaum, J.H.; Wagenblast, P.; Meiners, W.; Wagner, J. Influence of Keyhole and Conduction Mode Melting for Top-Hat Shaped Beam Profiles in Laser Powder Bed Fusion. J. Mater. Process. Technol. 2019, 278, 116514. [Google Scholar] [CrossRef]
- King, W.E.; Barth, H.D.; Castillo, V.M.; Gallegos, G.F.; Gibbs, J.W.; Hahn, D.E.; Kamath, C.; Rubenchik, A.M. Observation of Keyhole-Mode Laser Melting in Laser Powder-Bed Fusion Additive Manufacturing. J. Mater. Process. Technol. 2014, 214, 2915–2925. [Google Scholar] [CrossRef]
- Khorasani, M.; Ghasemi, A.; Leary, M.; Downing, D.; Gibson, I.; Sharabian, E.G.; Veetil, J.K.; Brandt, M.; Bateman, S.; Rolfe, B. Benchmark Models for Conduction and Keyhole Modes in Laser-Based Powder Bed Fusion of Inconel 718. Opt. Laser Technol. 2023, 164, 109509. [Google Scholar] [CrossRef]
- Tian, Y.; Tomus, D.; Rometsch, P.; Wu, X. Influences of Processing Parameters on Surface Roughness of Hastelloy X Produced by Selective Laser Melting. Addit. Manuf. 2016, 13, 103–112. [Google Scholar] [CrossRef]
- Ning, J.; Wang, W.; Zamorano, B.; Liang, S.Y. Analytical Modeling of Lack-of-Fusion Porosity in Metal Additive Manufacturing. Appl. Phys. A 2019, 125, 1–11. [Google Scholar] [CrossRef]
- Mukherjee, T.; DebRoy, T. Mitigation of Lack of Fusion Defects in Powder Bed Fusion Additive Manufacturing. J. Manuf. Process. 2018, 36, 442–449. [Google Scholar] [CrossRef]
- Makoana, N.W.; Yadroitsava, I.; Möller, H.; Yadroitsev, I. Characterization of 17-4PH Single Tracks Produced at Different Parametric Conditions towards Increased Productivity of LPBF Systems—The Effect of Laser Power and Spot Size Upscaling. Metals 2018, 8, 475. [Google Scholar] [CrossRef]
- Manvatkar, V.; De, A.; DebRoy, T. Heat Transfer and Material Flow during Laser Assisted Multi-Layer Additive Manufacturing. J. Appl. Phys. 2014, 116, 124905. [Google Scholar] [CrossRef]
- Liu, Z.; Yang, Y.; Wang, D.; Chen, J.; Xiao, Y.; Zhou, H.; Chen, Z.; Song, C. Flow Field Analysis for Multilaser Powder Bed Fusion and the Influence of Gas Flow Distribution on Parts Quality. Rapid Prototyp. J. 2022, 28, 1706–1716. [Google Scholar] [CrossRef]
- Wen, P.; Qin, Y.; Chen, Y.; Voshage, M.; Jauer, L.; Poprawe, R.; Schleifenbaum, J.H. Laser Additive Manufacturing of Zn Porous Scaffolds: Shielding Gas Flow, Surface Quality and Densification. J. Mater. Sci. Technol. 2018, 35, 368–376. [Google Scholar] [CrossRef]
- Wen, P.; Jauer, L.; Voshage, M.; Chen, Y.; Poprawe, R.; Schleifenbaum, J.H. Densification Behavior of Pure Zn Metal Parts Produced by Selective Laser Melting for Manufacturing Biodegradable Implants. J. Mater. Process. Technol. 2018, 258, 128–137. [Google Scholar] [CrossRef]
- Zhang, W.; Guo, D.; Wang, L.; Davies, C.M.; Mirihanage, W.; Tong, M.; Harrison, N.M. X-Ray Diffraction Measurements and Computational Prediction of Residual Stress Mitigation Scanning Strategies in Powder Bed Fusion Additive Manufacturing. Addit. Manuf. 2022, 61, 103275. [Google Scholar] [CrossRef]
- Huang, T.-C.; Hung, C.-H.; Lin, Y. Residual Stress Reduction in Ti-6Al-4V Parts Fabricated by Laser-Foil-Printing Process. Opt. Laser Technol. 2024, 177, 111157. [Google Scholar] [CrossRef]
- Zhang, L.; Zhang, S.; Zhu, H. Effect of Scanning Strategy on Geometric Accuracy of the Circle Structure Fabricated by Selective Laser Melting. J. Manuf. Process. 2021, 64, 907–915. [Google Scholar] [CrossRef]
- Marattukalam, J.J.; Karlsson, D.; Pacheco, V.; Beran, P.; Wiklund, U.; Jansson, U.; Hjörvarsson, B.; Sahlberg, M. The Effect of Laser Scanning Strategies on Texture, Mechanical Properties, and Site-Specific Grain Orientation in Selective Laser Melted 316L SS. Mater. Des. 2020, 193, 108852. [Google Scholar] [CrossRef]
- Amano, H.; Ishimoto, T.; Suganuma, R.; Aiba, K.; Sun, S.-H.; Ozasa, R.; Nakano, T. Effect of a Helium Gas Atmosphere on the Mechanical Properties of Ti-6Al-4V Alloy Built with Laser Powder Bed Fusion: A Comparative Study with Argon Gas. Addit. Manuf. 2021, 48, 102444. [Google Scholar] [CrossRef]
- Bidare, P.; Bitharas, I.; Ward, R.M.; Attallah, M.M.; Moore, A.J. Laser Powder Bed Fusion in High-Pressure Atmospheres. Int. J. Adv. Manuf. Technol. 2018, 99, 543–555. [Google Scholar] [CrossRef]
- Reijonen, J.; Revuelta, A.; Riipinen, T.; Ruusuvuori, K.; Puukko, P. On the effect of shielding gas flow on porosity and melt pool geometry in laser powder bed fusion additive manufacturing. Addit. Manuf. 2020, 32, 101030. [Google Scholar] [CrossRef]
- Pauzon, C.; Forêt, P.; Hryha, E.; Arunprasad, T.; Nyborg, L. Argon-Helium Mixtures as Laser-Powder Bed Fusion Atmospheres: Towards Increased Build Rate of Ti-6Al-4V. J. Mater. Process. Technol. 2019, 279, 116555. [Google Scholar] [CrossRef]
- Childs, T.H.C.; Hauser, C.; Badrossamay, M. Mapping and Modelling Single Scan Track Formation in Direct Metal Selective Laser Melting. CIRP Ann. 2004, 53, 191–194. [Google Scholar] [CrossRef]
- Guo, Y.; Jia, L.; Kong, B.; Wang, N.; Zhang, H. Single Track and Single Layer Formation in Selective Laser Melting of Niobium Solid Solution Alloy. Chin. J. Aeronaut. 2017, 31, 860–866. [Google Scholar] [CrossRef]
- Shrestha, S.; Chou, K. Single Track Scanning Experiment in Laser Powder Bed Fusion Process. Procedia Manuf. 2018, 26, 857–864. [Google Scholar] [CrossRef]
- Balbaa, M.; Mekhiel, S.; Elbestawi, M.; McIsaac, J. On Selective Laser Melting of Inconel 718: Densification, Surface Roughness, and Residual Stresses. Mater. Des. 2020, 193, 108818. [Google Scholar] [CrossRef]
- Yadroitsava, I.; Els, J.; Booysen, G.; Yadroitsev, I. Peculiarities of single track formation from TI6AL4V alloy at different laser power densities by selective laser melting. S. Afr. J. Ind. Eng. 2015, 26, 86–95. [Google Scholar] [CrossRef]
- Lerda, S.; Bassini, E.; Marchese, G.; Biamino, S.; Ugues, D. Rapid L-PBF Printing of IN718 Coupled with HIP-Quench: A Novel Approach to Manufacture and Heat Treatment of a Nickel-Based Alloy. J. Mater. Res. Technol. 2024, 30, 6983–6994. [Google Scholar] [CrossRef]
- Watring, D.S.; Carter, K.C.; Crouse, D.; Raeymaekers, B.; Spear, A.D. Mechanisms Driving High-Cycle Fatigue Life of as-Built Inconel 718 Processed by Laser Powder Bed Fusion. Mater. Sci. Eng. A 2019, 761, 137993. [Google Scholar] [CrossRef]
- Baldi, N.; Giorgetti, A.; Palladino, M.; Arcidiacono, G.; Citti, P. Thermal Design Considerations for a L-PBF Built Metal Component: Effects of Inter-Layer Cooling Time, Preheating Temperature and Gas Flow. IOP Conf. Ser. Mater. Sci. Eng. 2024, 1306, 012020. [Google Scholar] [CrossRef]
- Baldi, N.; Giorgetti, A.; Palladino, M.; Giovannetti, I.; Arcidiacono, G.; Citti, P. Study on the Effect of Preheating Temperatures on Melt Pool Stability in Inconel 718 Components Processed by Laser Powder Bed Fusion. Metals 2023, 13, 1792. [Google Scholar] [CrossRef]
- Kan, W.H.; Chiu, L.N.S.; Lim, C.V.S.; Zhu, Y.; Tian, Y.; Jiang, D.; Huang, A. A critical review on the effects of process-induced porosity on the mechanical properties of alloys fabricated by laser powder bed fusion. J. Mater. Sci. 2022, 57, 9818–9865. [Google Scholar]
- Gasper, A.N.D.; Szost, B.; Wang, X.; Johns, D.; Sharma, S.; Clare, A.T.; Ashcroft, I.A. Spatter and Oxide Formation in Laser Powder Bed Fusion of Inconel 718. Addit. Manuf. 2018, 24, 446–456. [Google Scholar] [CrossRef]


| Element | % Weight |
|---|---|
| Ni | 55.37 |
| Cr | 18.37 |
| Fe | 17.80 |
| Nb + Ta | 5.34 |
| Nb | 5.33 |
| C | 0.040 |
| Mn | 0.08 |
| Si | 0.08 |
| P | <0.015 |
| S | 0.002 |
| Co | 0.23 |
| Mo | 3.04 |
| Ti | 0.98 |
| Al | 0.5 |
| B | 0.004 |
| Ta | 0.005 |
| Cu | 0.04 |
| Ca | <0.01 |
| Mg | <0.01 |
| Pb | 0.0001 |
| Bi | 0.0001 |
| Se | <0.001 |
| Elastic Modulus (Gpa) | Density (kg/m3) | Thermal Conductivity (W/mK) | Yield Strength (MPa) | Tensile Stress (MPa) | Strain (%) |
|---|---|---|---|---|---|
| 206 | 8470 | 11.2 | 1100 | 1310 | 23.3 |
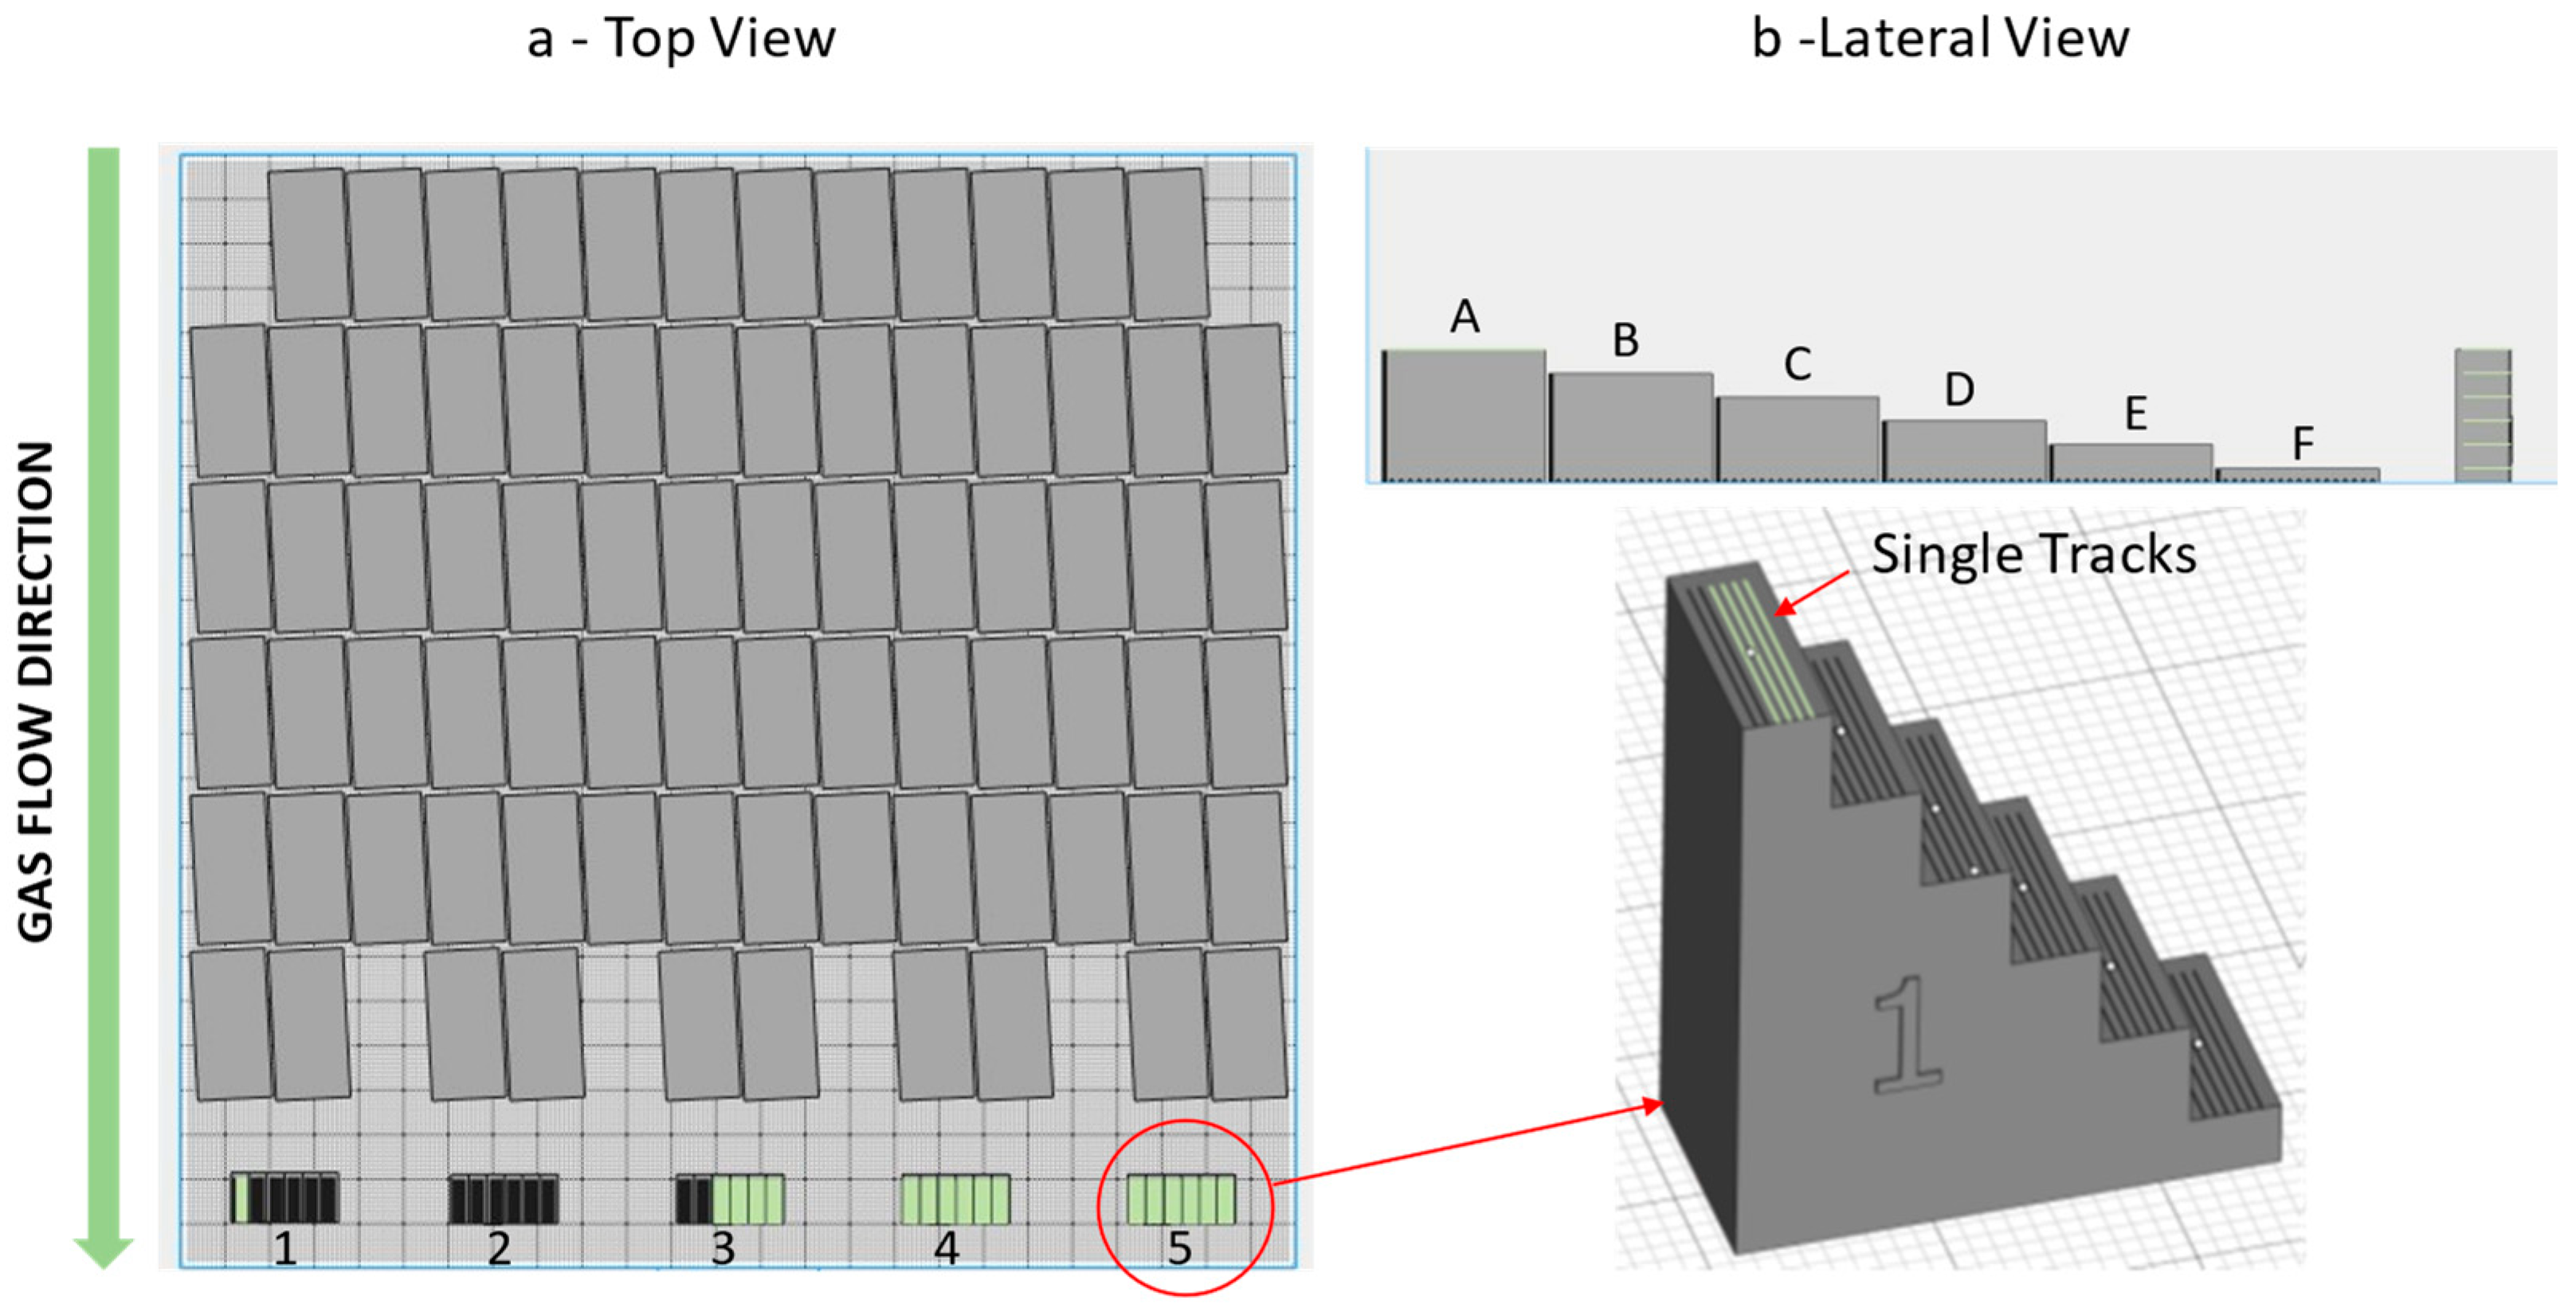
| Section | Exposed Area (% in Terms of Building Platform Overall Area) |
|---|---|
| A | 70 |
| B | 59 |
| C | 48 |
| D | 37 |
| E | 26 |
| F | 15 |
Disclaimer/Publisher’s Note: The statements, opinions and data contained in all publications are solely those of the individual author(s) and contributor(s) and not of MDPI and/or the editor(s). MDPI and/or the editor(s) disclaim responsibility for any injury to people or property resulting from any ideas, methods, instructions or products referred to in the content. |
© 2025 by the authors. Licensee MDPI, Basel, Switzerland. This article is an open access article distributed under the terms and conditions of the Creative Commons Attribution (CC BY) license (https://creativecommons.org/licenses/by/4.0/).
Share and Cite
Baldi, N.; Chandrabalan, L.; Manetti, M.; Giorgetti, A.; Arcidiacono, G.; Citti, P.; Palladino, M. Analysis of Building Platform Inhomogeneities in PBF-LB/M Process on Alloy 718. Appl. Sci. 2025, 15, 4042. https://doi.org/10.3390/app15074042
Baldi N, Chandrabalan L, Manetti M, Giorgetti A, Arcidiacono G, Citti P, Palladino M. Analysis of Building Platform Inhomogeneities in PBF-LB/M Process on Alloy 718. Applied Sciences. 2025; 15(7):4042. https://doi.org/10.3390/app15074042
Chicago/Turabian StyleBaldi, Niccolò, Lokesh Chandrabalan, Marco Manetti, Alessandro Giorgetti, Gabriele Arcidiacono, Paolo Citti, and Marco Palladino. 2025. "Analysis of Building Platform Inhomogeneities in PBF-LB/M Process on Alloy 718" Applied Sciences 15, no. 7: 4042. https://doi.org/10.3390/app15074042
APA StyleBaldi, N., Chandrabalan, L., Manetti, M., Giorgetti, A., Arcidiacono, G., Citti, P., & Palladino, M. (2025). Analysis of Building Platform Inhomogeneities in PBF-LB/M Process on Alloy 718. Applied Sciences, 15(7), 4042. https://doi.org/10.3390/app15074042