1. Introduction
Diabetes mellitus, commonly known simply as diabetes, is a long-lasting condition where the body struggles either to produce enough insulin or to use it effectively. Insulin is a hormone secreted by the pancreas that facilitates the transport of glucose from food into the body’s cells to be stored or converted into energy. Without sufficient insulin, blood glucose levels can become dangerously high, a state known as hyperglycemia, which over time can lead to serious complications affecting both large and small blood vessels. Diabetes is mainly categorized into three forms: insulin-dependent diabetes (Type 1), Type 2, and gestational diabetes mellitus. In individuals with Type 1 diabetes, the immune system incorrectly attacks and damages the beta cells in the pancreas that produce insulin, leaving the body with very low or no insulin. This form is most common in children and young adults, who must rely on lifelong insulin therapy. In people with Type 2 diabetes, the pancreas either fails to produce enough insulin or the body becomes resistant to its action. Although it is mostly seen in adults, its occurrence is rising among younger populations. Management often includes dietary adjustments, physical activity, and oral medications, with insulin therapy needed in advanced cases. Gestational diabetes mellitus arises during pregnancy when the body cannot produce or use sufficient insulin to meet the heightened demand [
1].
Global data on diabetes shows a concerning rise in prevalence. According to the International Diabetes Federation (
https://idf.org (accessed on 18 February 2025)), around 537 million adults aged 20 to 79 were affected by diabetes in 2021. It is anticipated that this figure will grow significantly, with 643 million people projected to have diabetes by 2030, and 783 million by 2045. The rise is particularly pronounced in low- and middle-income countries, where three out of four adults live with diabetes. These statistics underscore the increasing global burden of diabetes, driven by factors such as urbanization, aging populations, and rising obesity levels. According to the World Health Organization (
https://www.who.int (accessed on 18 February 2025)), diabetes is a major contributor to serious health complications, including strokes, blindness, kidney failure, heart attacks, and lower limb amputations.
Therapeutic education in diabetes (TED) is a structured educational process that helps individuals with diabetes understand their condition, manage it effectively, and adopt essential self-care practices into their daily routines. TED covers key areas such as understanding diabetes, monitoring blood glucose, administering insulin, planning nutrition and diet, engaging in physical activity, preventing complications, accessing psychosocial support, and building self-management skills. This educational approach aims to empower patients to take an active role in managing their diabetes [
2].
Effective nutritional management plays a crucial role in avoiding insulin resistance, delaying its advancement, and reducing the risk of vascular and neurological complications that arise from poor blood glucose control. As a result, nutrition is a fundamental aspect of education for individuals living with diabetes. Nutritional guidelines focus on managing daily energy consumption and its distribution throughout meals, in addition to maintaining a proper balance of fats, proteins, and carbohydrates. Since carbohydrates have a direct impact on the levels of glucose in blood, knowing the right amount of carbohydrates to consume with each meal is essential for managing the condition. This regulation supports the achievement of an optimal diet and helps maintain the levels of glucose in blood within a near-normal range.
Integrating assistive technology systems can significantly improve therapeutic education. These systems, which may incorporate extended reality technologies such as Mixed Reality (MR), Augmented Reality (AR), and Virtual Reality (VR), can enhance the user experience. VR generates completely immersive digital worlds, fully isolating users from their physical surroundings [
3]. AR overlays virtual elements onto the real world, which requires precise spatial alignment to integrate digital and physical components seamlessly [
3]. MR does not have a universally agreed-upon definition, but in this publication, the term will be used to refer to an interactive and immersive blend of real and virtual elements, allowing both environments to coexist and interact dynamically [
3,
4]. No MR system for TED has been presented to date. While VR has been the most widely used technology in education [
5], healthcare [
6], and TED [
7], AR has also been applied in educational applications [
8], healthcare [
9], and TED [
10].
This research is motivated by the increasing need for innovative tools to improve therapeutic education for patients. Conventional learning methods often fail to maintain patients’ engagement effectively. The development of user-friendly and self-guided applications would provide patients with more engaging and accessible resources. This research provides several contributions, including the development of the first MR application specifically designed for individuals with diabetes in Ecuador, providing an interactive and easily accessible tool for diabetes education. The study presented here evaluates learning outcomes by comparing the effectiveness of the MR application (using both grayscale and color passthrough) with the equivalent AR application and traditional educational methods. The results highlight the potential of MR-based applications as a more captivating alternative to conventional approaches. Ultimately, this work seeks to promote the adoption of innovative, patient-focused solutions as part of the global effort to improve chronic disease management.
3. Materials and Methods
3.1. Description of the MR Application
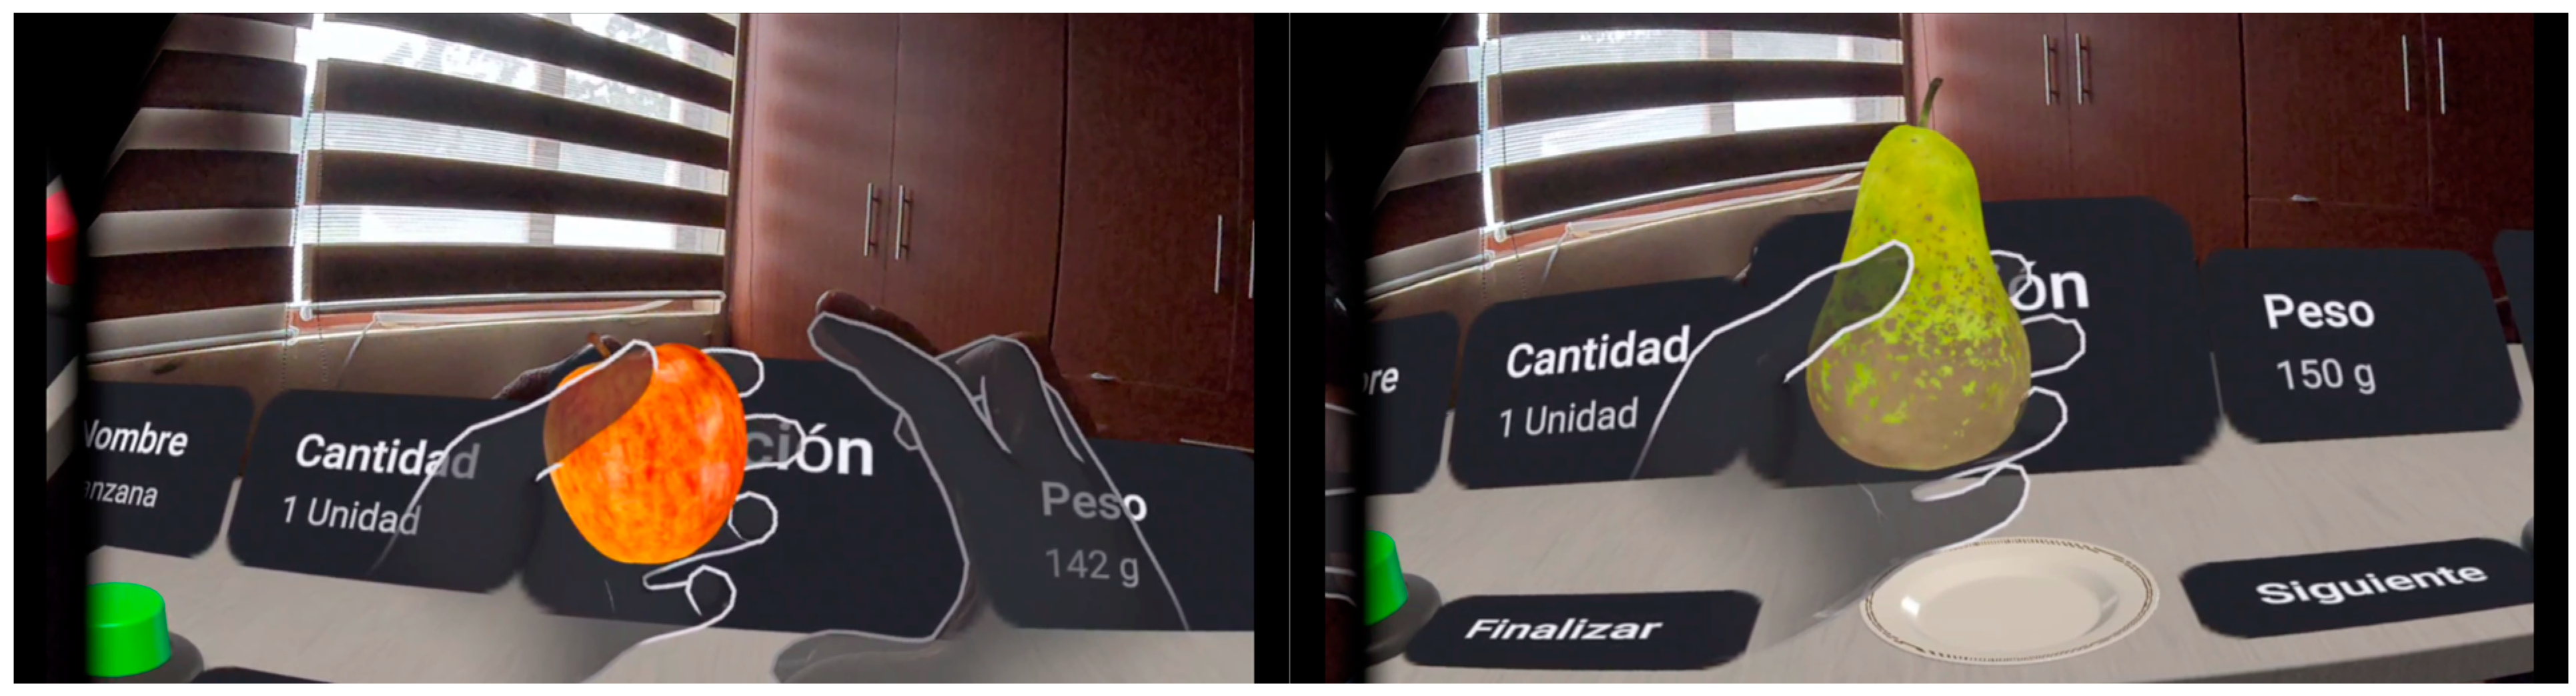
Our MR application is designed for patients with Type 1 diabetes, allowing direct interaction with virtual food in a real-life environment. Thanks to the passthrough technology of the Meta Quest 2 and Meta Quest 3 headsets, patients can visualize food in their real environment and manipulate it with their own hands (
Figure 1 and
Figure 2). The real environment is displayed in color (Meta Quest 3) or grayscale (Meta Quest 2), but the virtual elements embedded in the scene are displayed in color on both devices (
Figure 1 and
Figure 2). The application detects the position and movements of the hands, allowing users to pick up the virtual food, examine it from different angles, and facilitate a better understanding of the carbohydrate choices. The immersive approach makes it easier for patients to focus on the learning task.
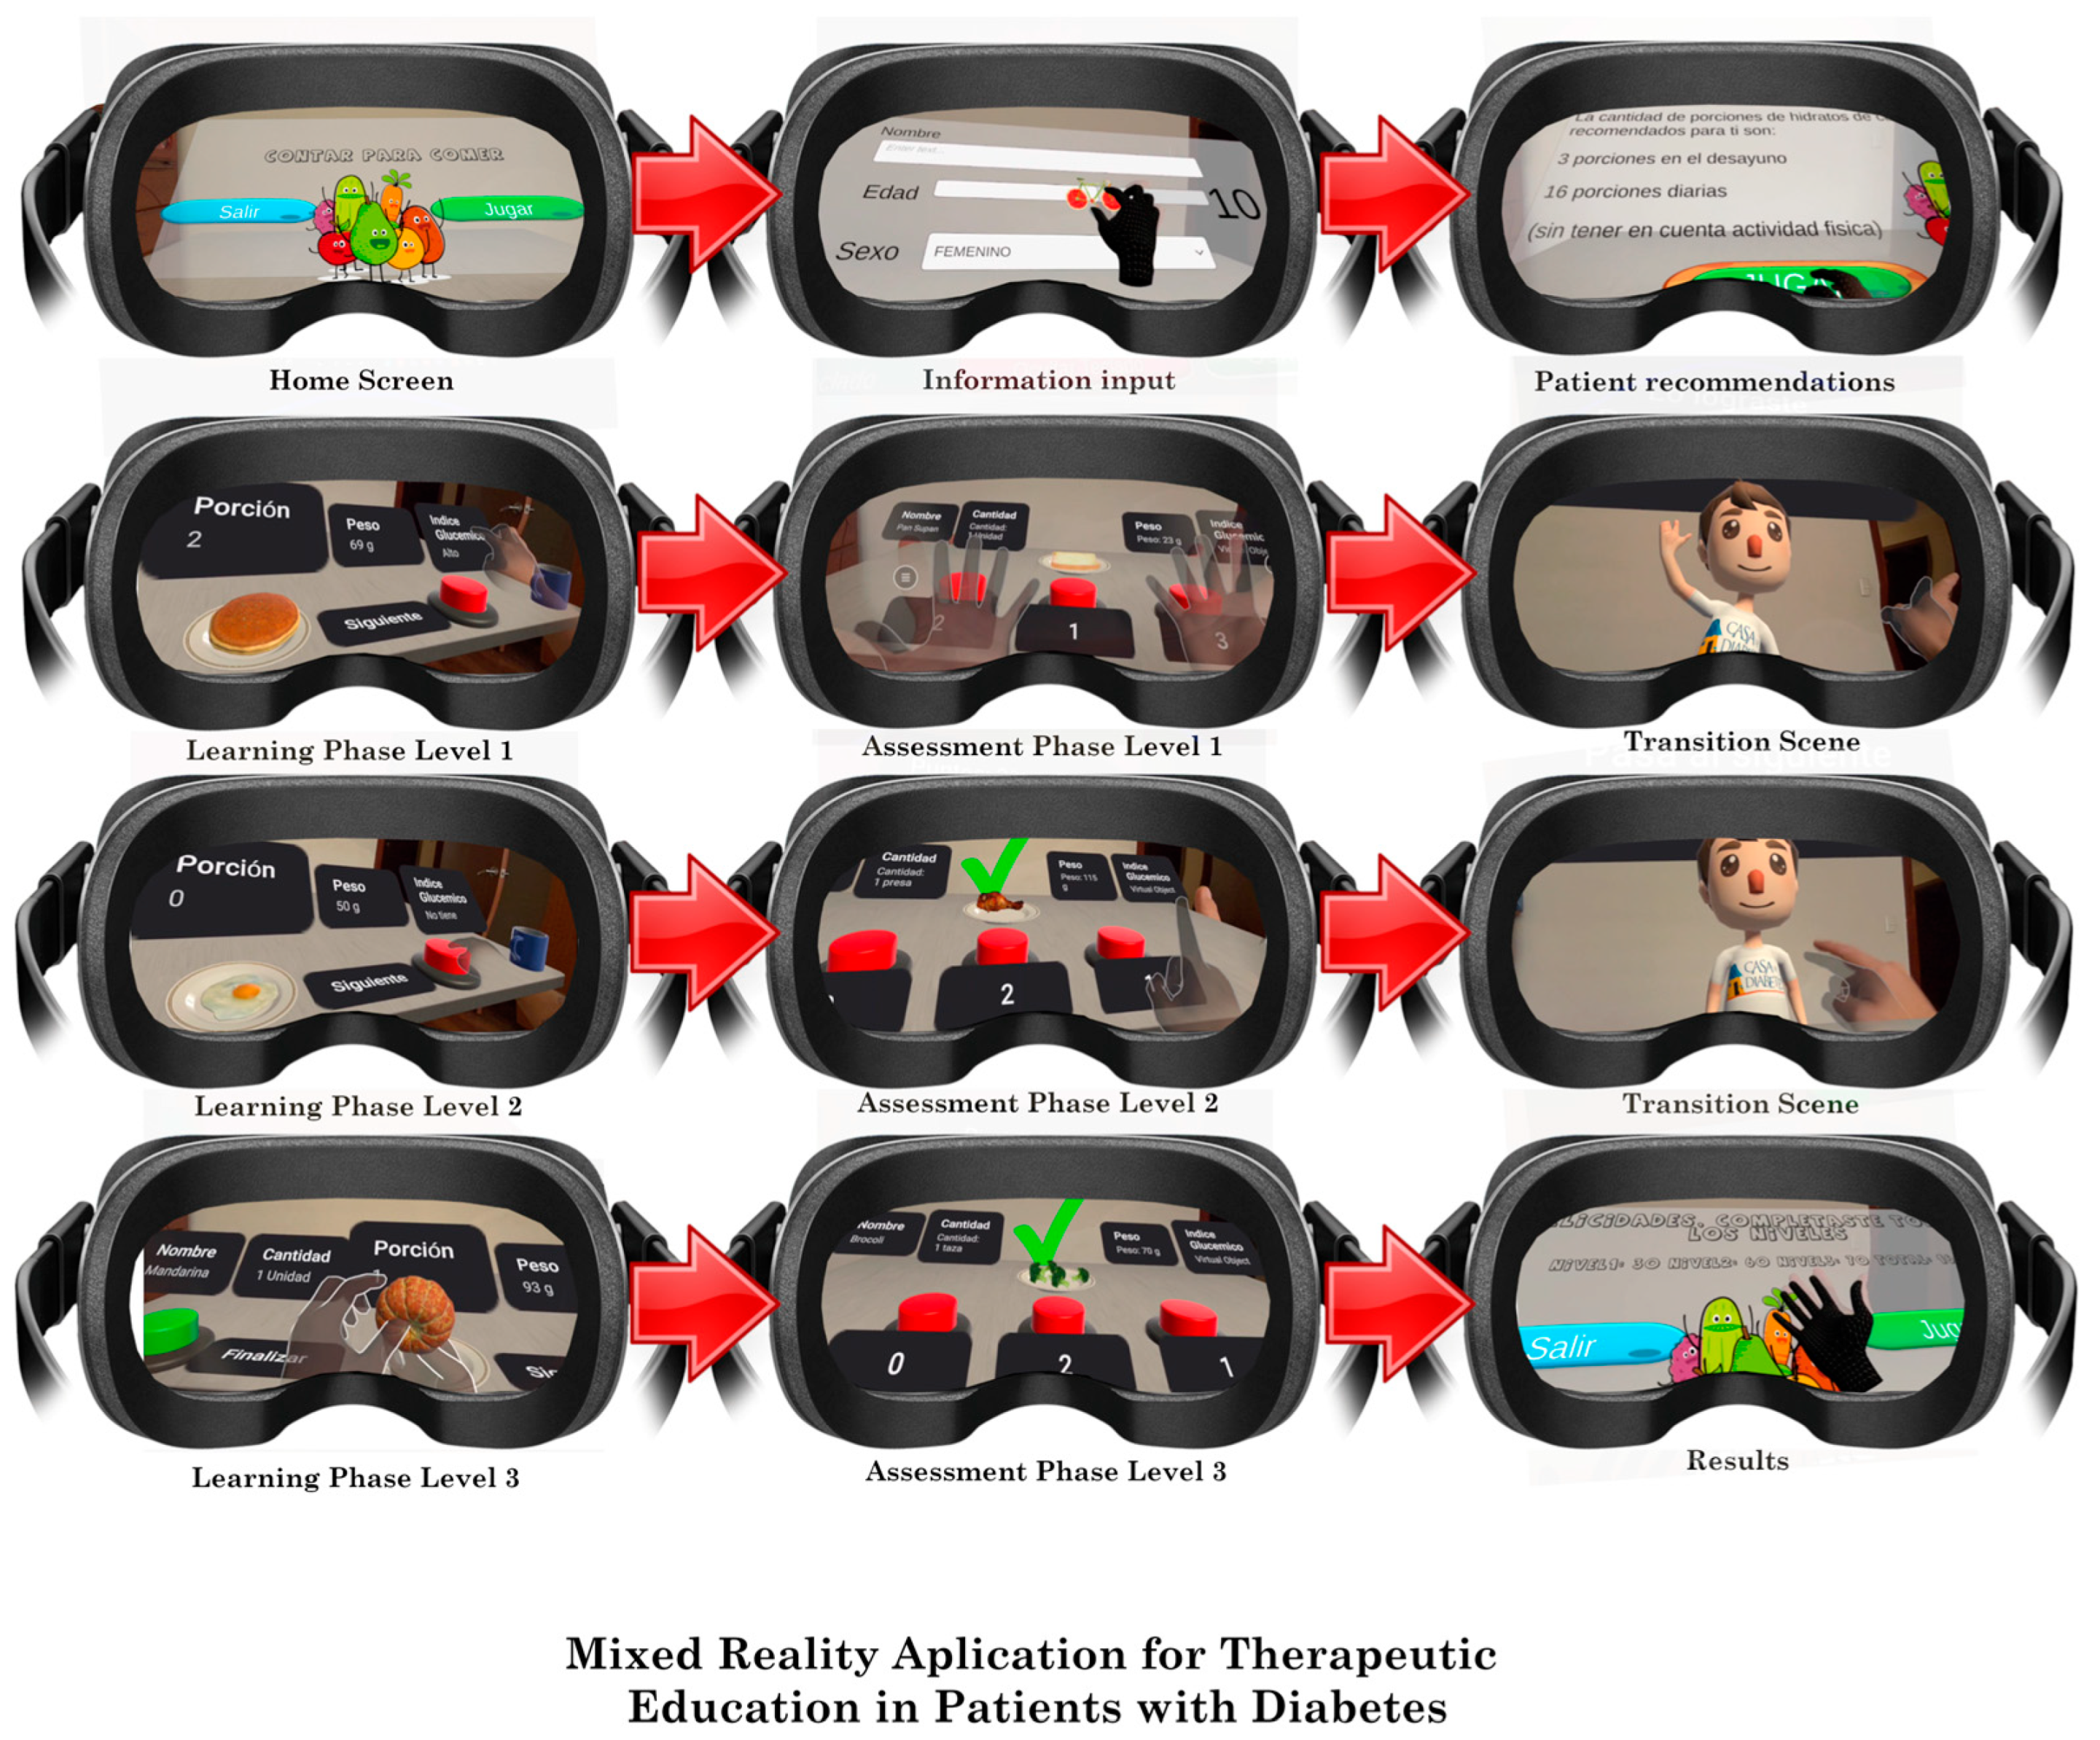
The use of hands as a visual and physical reference in an MR environment enhances understanding of proper portion size. By interacting with 3D models superimposed on the real world, users can easily compare suggested portions with those they might consume. The patients completed the following steps. A graphical summary of the steps is shown in
Figure 3.
Enter personal details. To start, the patients are required to provide their age and gender. Based on this information, the application then displays the recommended carbohydrate choices per day and specifically for breakfast, where 1 carbohydrate choice equals 15 g of carbohydrates. This standard is widely used in Ecuador, Mexico, the United States, and most of Latin America, though it differs in some other countries. For instance, in Spain, 1 carbohydrate choice equals 10 g, while in Austria, it equals 12 g.
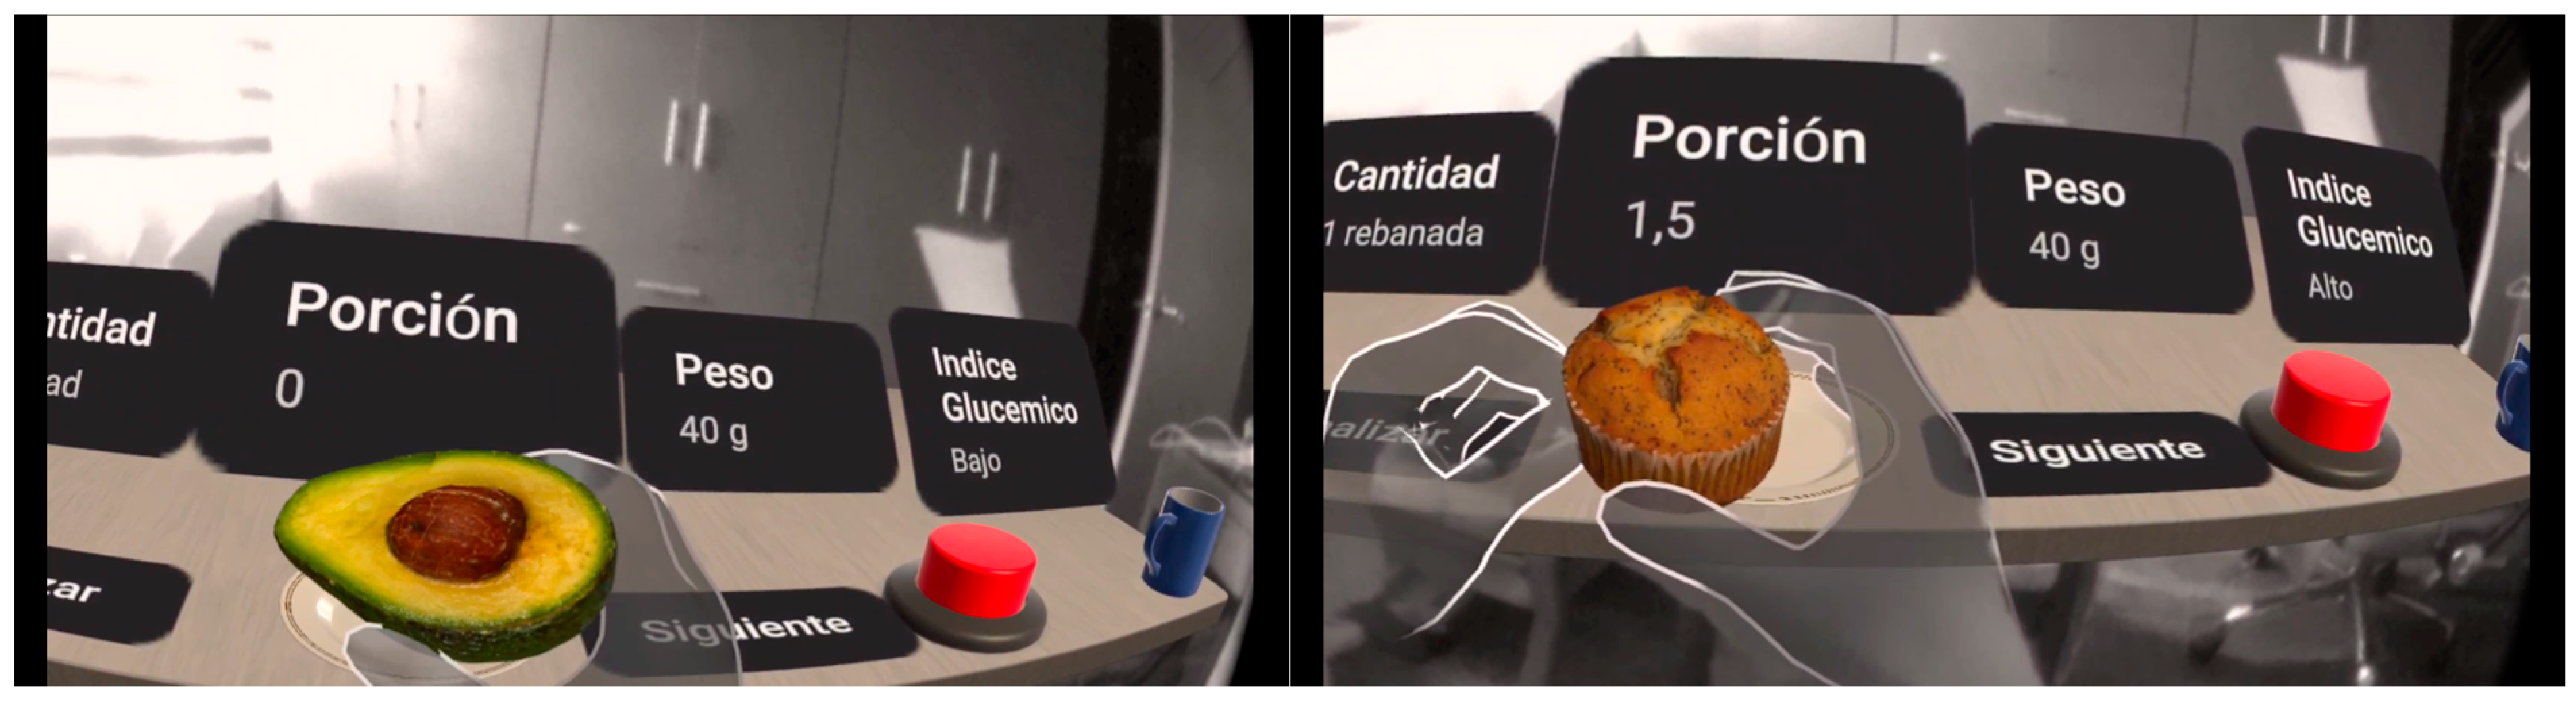
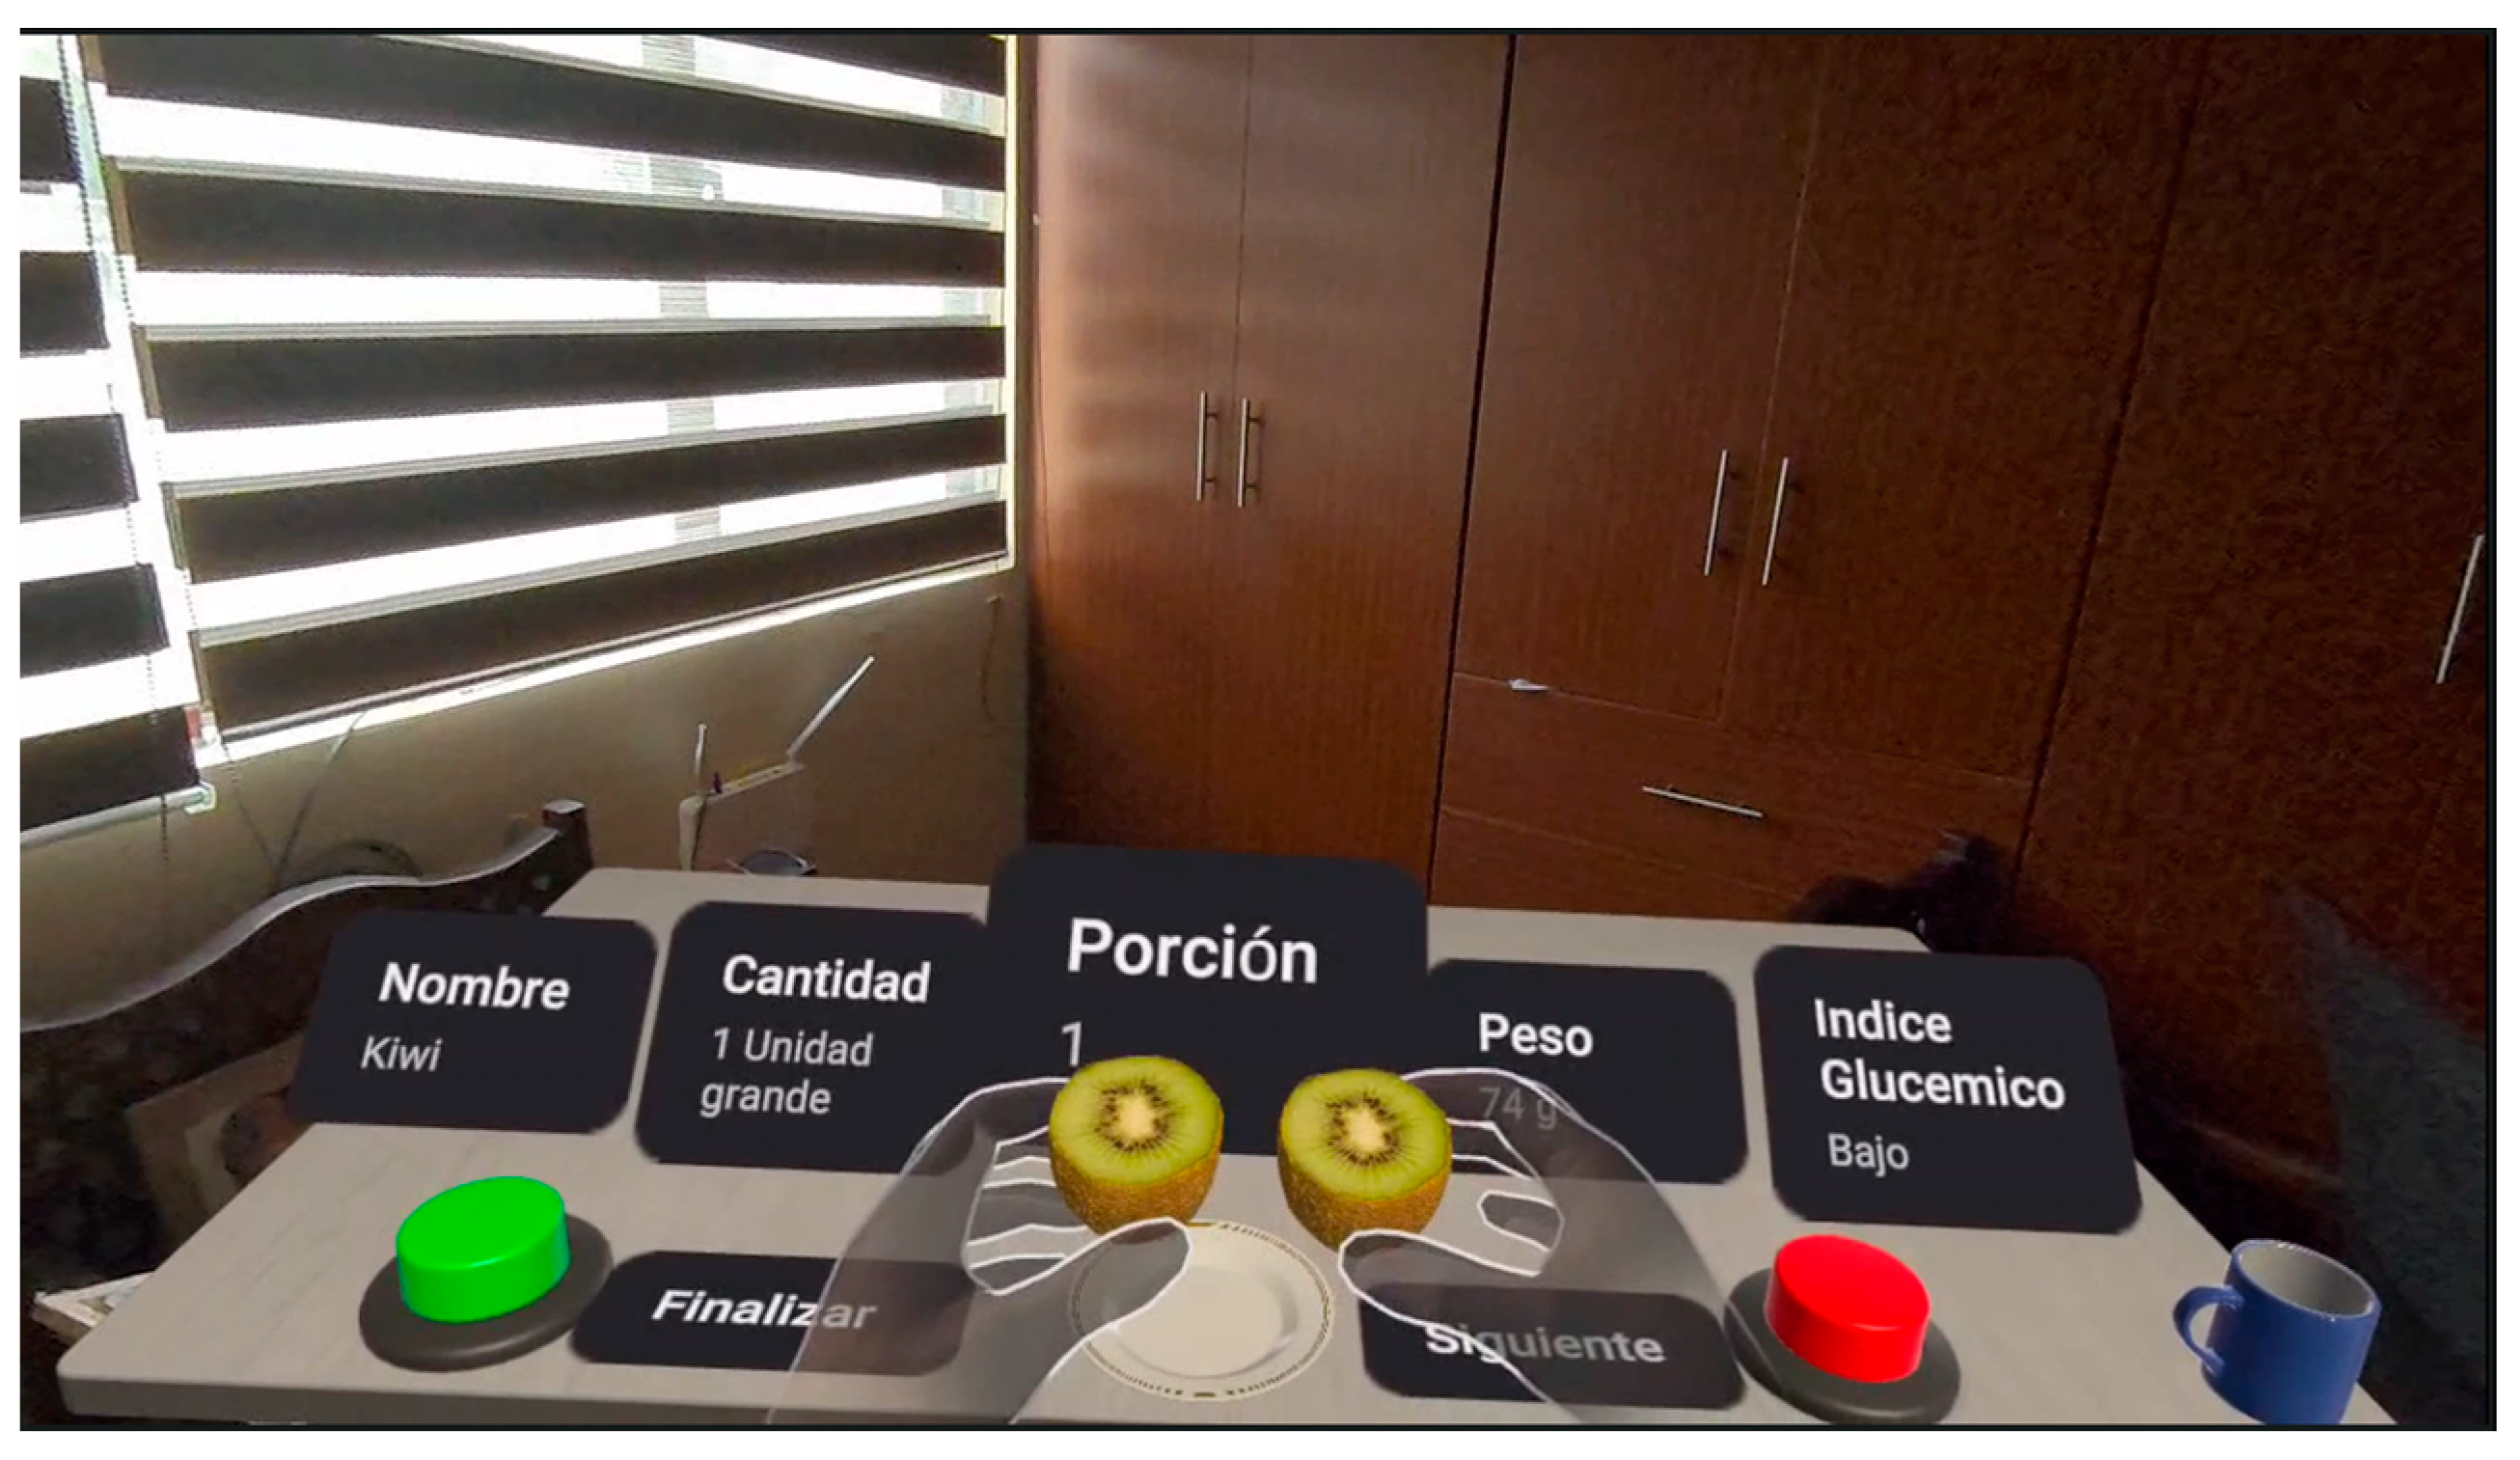
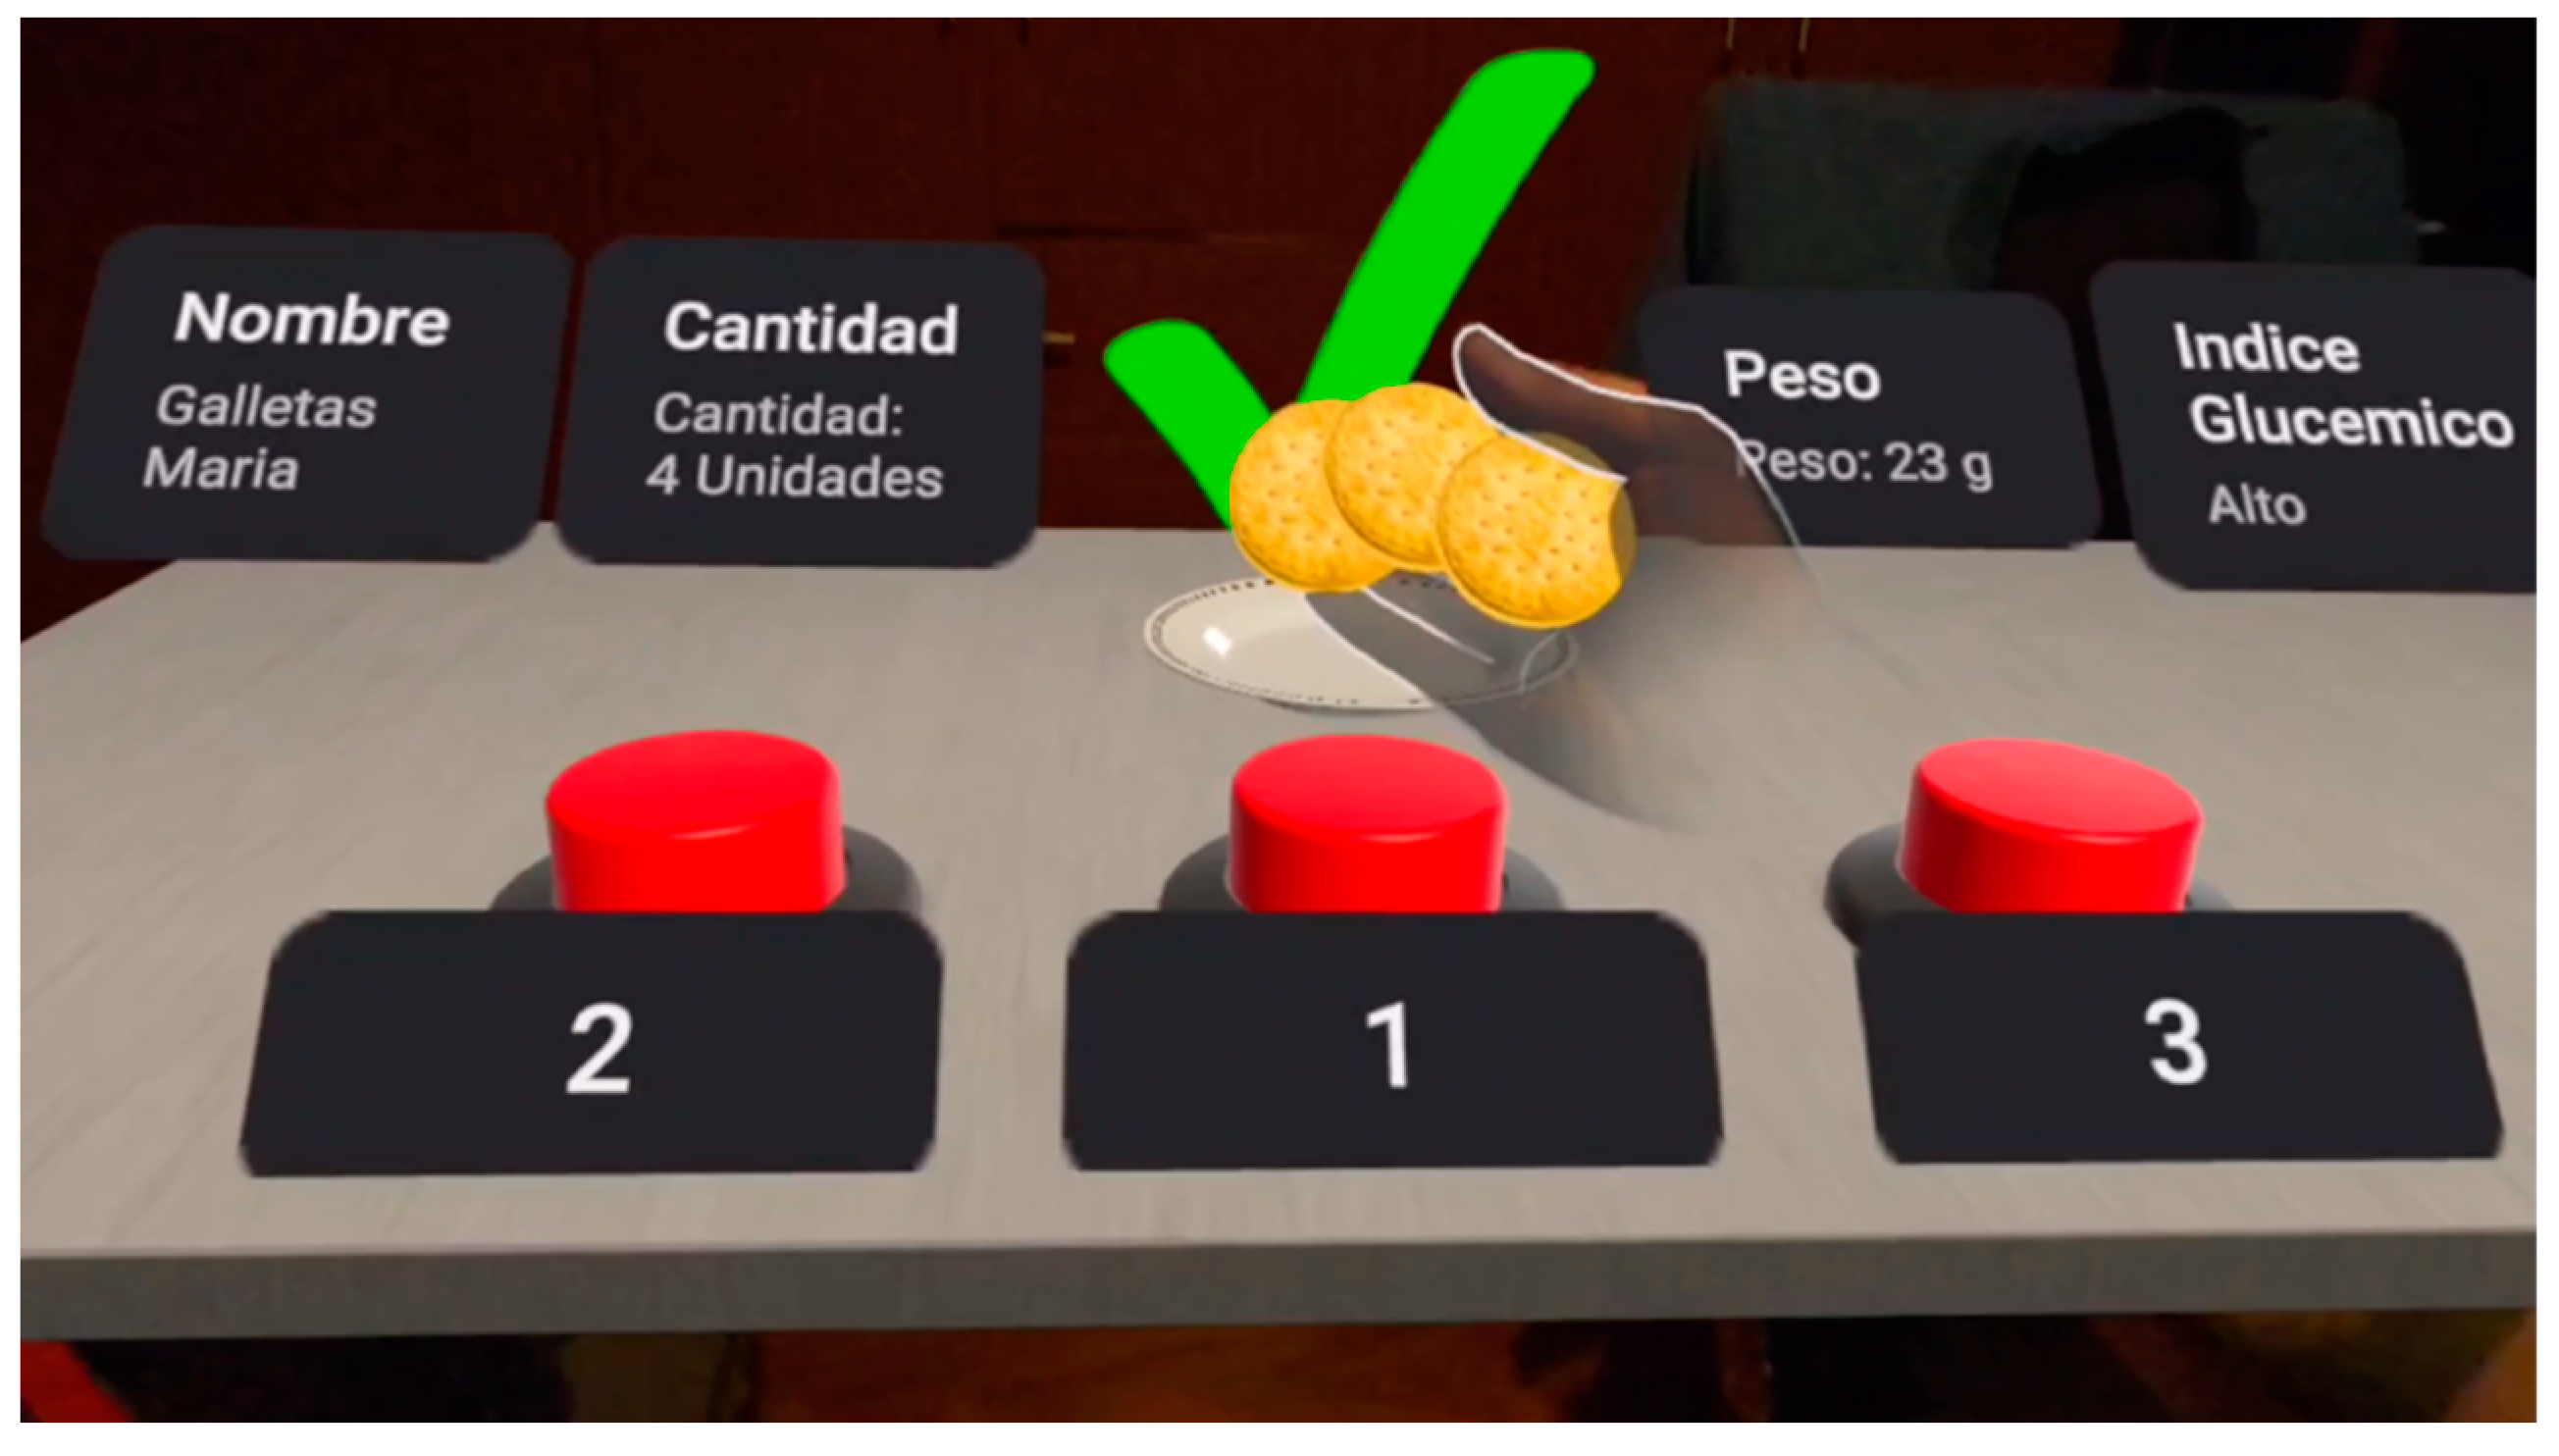
The MR application is organized into three levels, each focusing on a different food category: the first level covers dairy products, the second level addresses grains, and the third level focuses on fruits. The first level includes 7 foods, the second level presents 8 foods, and the third level consists of 10 foods. At each level, a realistic simulation of the foods is presented, allowing for tactile interaction, and the content is organized in two phases: (a) the learning phase, where patients observe the foods in real size and can see their name, quantity, weight, glycemic index, carbohydrate choices, and homemade portions of food, like a cup or tablespoon (these details are provided by the Foundation in its educational resources) (
Figure 4); (b) the assessment phase, where the patients must remember the learning information. Each of the 25 foods is shown, and the patient is required to choose the correct number of carbohydrate choices from the three available options (
Figure 5). The application then informs the patient whether the answer is correct or not. The decision to provide three options for selection was made to speed up the process, as requiring the patient to write the carbohydrate choices for each food item would significantly increase the time needed for a learning session.
3.2. Design and Development
During the design of the MR application, we consulted five diabetes experts. Additionally, we incorporated elements that, according to Lange et al. [
20], are essential for an effective educational intervention. Once the problem was understood and the needs of this group were identified, we established the application’s functional specifications and overall design.
With regard to hardware, the Meta Quest 2 provides a lower-resolution grayscale passthrough, which reduces clarity when viewing the physical environment, whereas the Meta Quest 3 offers a high-resolution color passthrough for enhanced visual quality.
Our MR application was developed in Unity 2021.3.11f1 (
https://unity.com/ (accessed on 18 February 2025)), a powerful and versatile development platform that enables developers to create interactive 2D and 3D experiences. In our case, it allowed us to build interactive AR and MR applications for deployment across multiple devices. Additionally, we imported the Oculus Integration package from the Unity Asset Store.
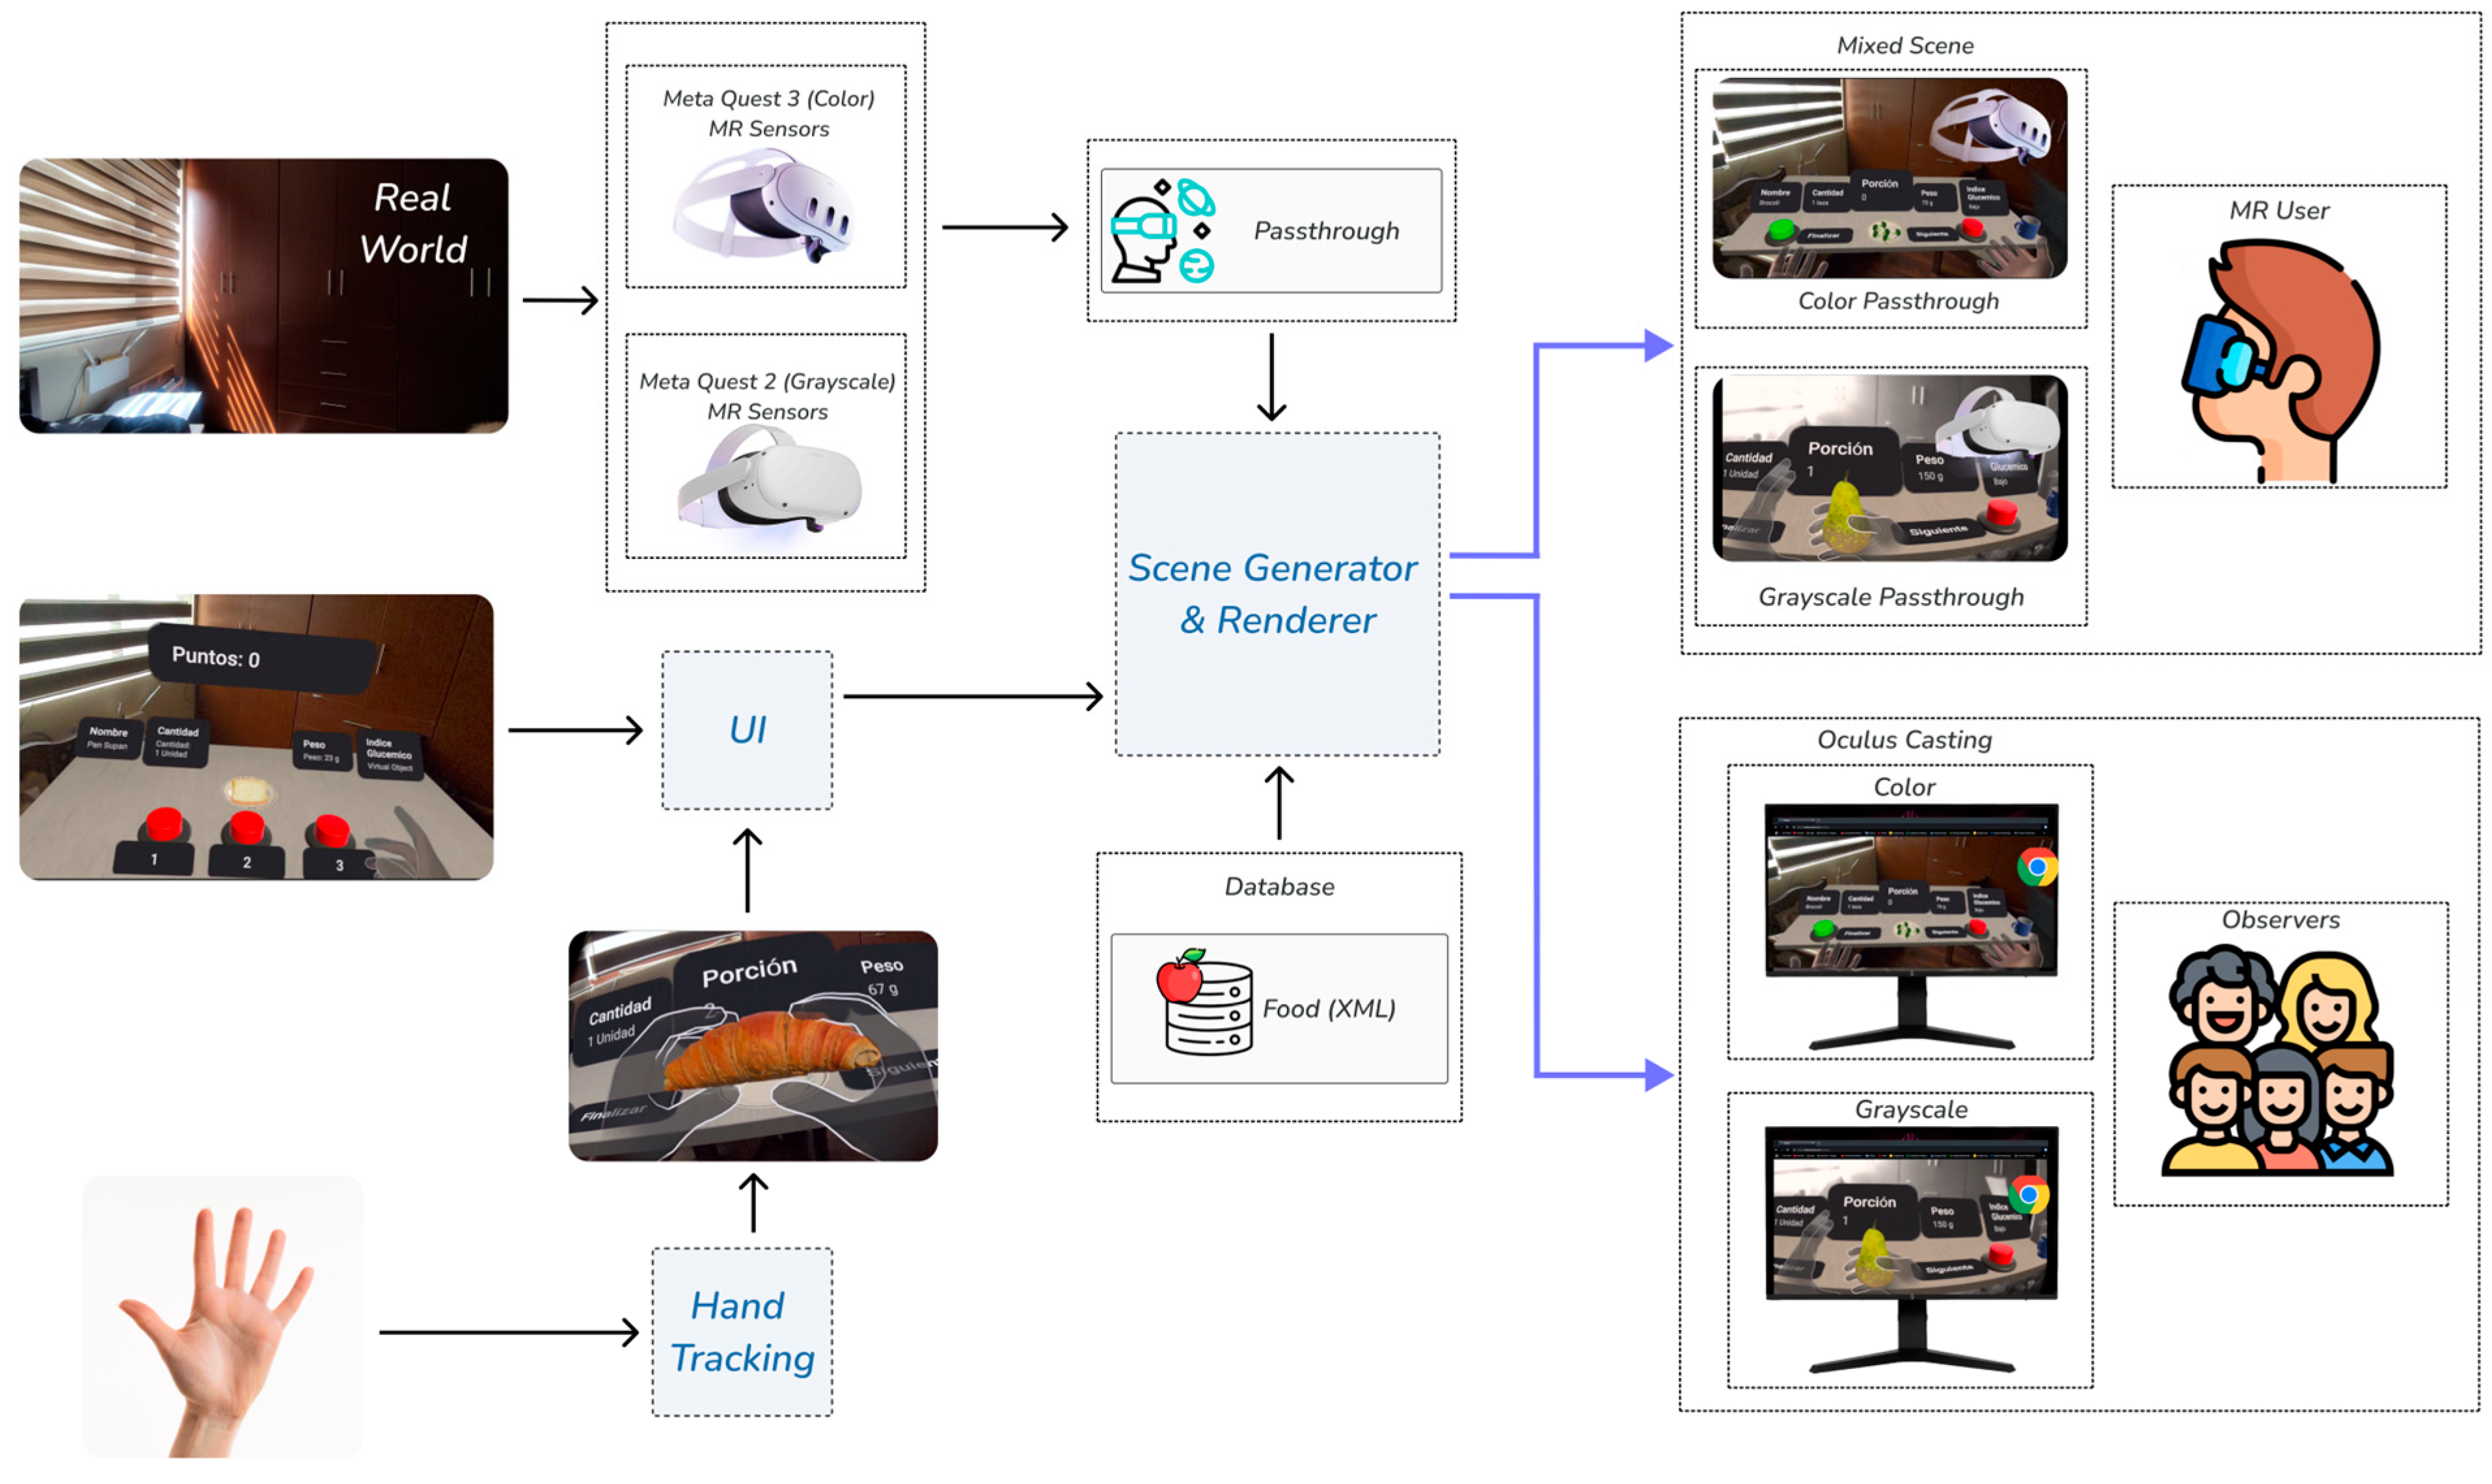
Figure 6 shows the architecture of the MR application. The Oculus Integration package facilitates the integration of advanced MR features by providing an all-in-one source for core MR components, scripts, and plugins, which enhances the application development process in Unity. It includes several SDKs, such as the Platform SDK, Interaction SDK, Utilities package, Voice SDK, and more, offering advanced rendering, social, and community-building capabilities and tools for creating immersive experiences (
https://developers.meta.com/horizon/documentation/unity/unity-import/ (accessed on 18 February 2025)). Notably, the package provides GameObjects (e.g., OVRCameraRig) and scripts (e.g., OVRManager), which are essential for enabling features such as passthrough and Mixed Reality Capture on Meta Quest headsets. By using Oculus Integration, the interaction of users with virtual objects in a real physical environment is optimized, implementing advanced technologies that enhance their experience.
When VR support is enabled in Unity, the headset automatically transfers head and positional tracking information to Unity, allowing the camera’s position and orientation to align closely with the user’s real-world position and orientation. The camera’s transform values are overridden by the head-tracked pose data, so the camera stays in a position relative to the user’s avatar.
In a standard first-person configuration, rather than relying on a fixed camera, the camera must move along with or track the user’s avatar, as implemented in our application. This is achieved by making the camera a child object of the user avatar. In our application, we attached the OVRCameraRig script to the OVRCameraRig GameObject (
https://developers.meta.com/horizon/documentation/unity/unity-ovrcamerarig/ (accessed on 18 February 2025)).
The OVRCameraRig GameObject contains the Transform object that defines the tracking space for the headset. Within the primary child of OVRCameraRig, known as TrackingSpace GameObject, are several anchors: RightEyeAnchor and LeftEyeAnchor (which serve as anchors for each eye), CenterEyeAnchor (which serves as the anchor for the main Unity camera), and RightHandAnchor and LeftHandAnchor (which act as anchors for the controllers).
The OVRManager script is attached to OVRCameraRig GameObject and is a key part of the application development. This script facilitates the interaction between the hardware (Meta Quest 2/3) and our application, configuring and managing essential functions such as passthrough and Mixed Reality Capture.
OVRManager script acts as an intermediary between our application and advanced viewer configurations, allowing the integration of the user’s physical world with virtual elements. By enabling the OVRManager in our application, it is possible to do the following:
Control VR activation and user tracking: The OVRManager allows real-time adjustment of the user’s position and rotation to ensure a smooth experience when interacting with virtual food in their physical environment.
Optimize visual quality and performance: Configure the graphic level and performance to make the experience as natural as possible, without interruptions or frame drops.
Passthrough is an essential feature that is incorporated through the OVRManager by enabling the is Passthrough Enabled property. This feature allows the users to view their physical environment while interacting with overlaid virtual objects. With passthrough, users can do the following:
View their physical environment and manipulate virtual objects: When passthrough is enabled, patients can view their actual space, such as a table or their hands, while manipulating virtual food.
Interact safely: Passthrough allows the user to be aware of their physical environment, avoiding the risk of collision with real objects and making the experience safer.
Superimpose virtual elements on the real world: By viewing the physical world through passthrough, patients can directly compare virtual food with the real objects around them, improving their understanding of real-life portion sizes.
Mixed Reality Capture (MRC) is managed through the OVRManager, which activates its functionality by enabling the use Mixed Reality Capture setting. MRC is used to capture the user’s image with an external camera, synchronize the VR camera view with the real-world camera, and seamlessly blend the application environment with live video. In our application, MRC is used to capture and blend the user’s environment with virtual elements, while Oculus Casting is a capability that enables the real-time streaming of the user’s MR experience to an external display (e.g., a computer or laptop screen), allowing others to observe exactly what the user is experiencing in the mixed reality environment. This capability is essential for assessing and documenting the patient’s interaction with the application, as it allows others to see exactly what the patient is seeing and doing. It is crucial for the supervisor to observe the patient’s actions and assist if any issues arise and for healthcare professionals to monitor the patient’s learning process. In our case, we use oculus.com/casting in a Chrome browser to display the MR experience.
In our MR application, the combined use of the OVRManager, passthrough, Mixed Reality Capture, and Oculus Casting provides a complete and immersive experience. For example, when selecting a virtual food, the passthrough feature enables the patient to see their hands as they pick up the virtual food and examine it within the physical environment. At the same time, Mixed Reality Capture blends the user’s physical environment with virtual elements, and Oculus Casting streams the MR experience to an external screen so that other users can see what the user is seeing, for example, allowing healthcare professionals to analyze the patient’s performance in real time. This approach facilitates learning about portion sizes, allowing users to compare virtual portions with their own perceptions and adjust their practice of managing carbohydrate choices in everyday situations.
The AR application adapted for Ecuadorian patients [
10] was used for comparison with the MR application. The foods included in the AR application were those recommended by the specialists who contributed to its design for Ecuadorian patients, and they were the same as those used in the MR application.
The Meta Quest 2 and Meta Quest 3 were used for development and validation. Meta Quest 2 offers a resolution of 1832 × 1920 pixels per eye, up to a 90 Hz refresh rate, grayscale passthrough, and a 97-degree horizontal field of view. Meta Quest 3 features a resolution of 2064 × 2208 pixels per eye at a 90 Hz refresh rate, color passthrough, and a 110-degree horizontal field of view.
3.3. Participants
The study involved patients who participated in one of two activities organized by the Diabetes House, located in Cuenca and Portoviejo, Ecuador. The first activity was carried out in the facilities of the Diabetes House in Cuenca and Portoviejo (Ecuador) during a single session on a Saturday morning (10:00 to 12:00). The second activity was carried out in one session, on a Saturday during the whole day at the Diabetes House camp held in August. The Diabetes House (
https://casadeladiabetes.org.ec (accessed on 18 February 2025)) offers therapeutic learning sessions and provides educational resources available on its website for individuals with Type 1 diabetes. Ninety-two patients with Type 1 diabetes, aged between 5 and 36 years (51 men and 41 women), from Ecuador were involved in the study, with a mean age of 15.78 ± 6.142 years old. The patients were divided into four groups. One group used a traditional learning method, with 25 patients with a mean age of 16.28 ± 6.67. The other three were experimental groups: a first group used the AR application, with 27 patients with a mean age of 15.81 ± 5.91; a second group used the application of MR with Quest 2, with 20 patients with a mean age of 14.7 ± 5.69; and a third group used the application of MR with Quest 3, with 20 patients with a mean age of 16.2 ± 6.53. The patients or their parents (for minors) were given information about the study, and informed consent was obtained prior to participation. The study followed the principles outlined in the Declaration of Helsinki and was approved by the Ethics Committee at the University of Cuenca (Ecuador).
3.4. Measures
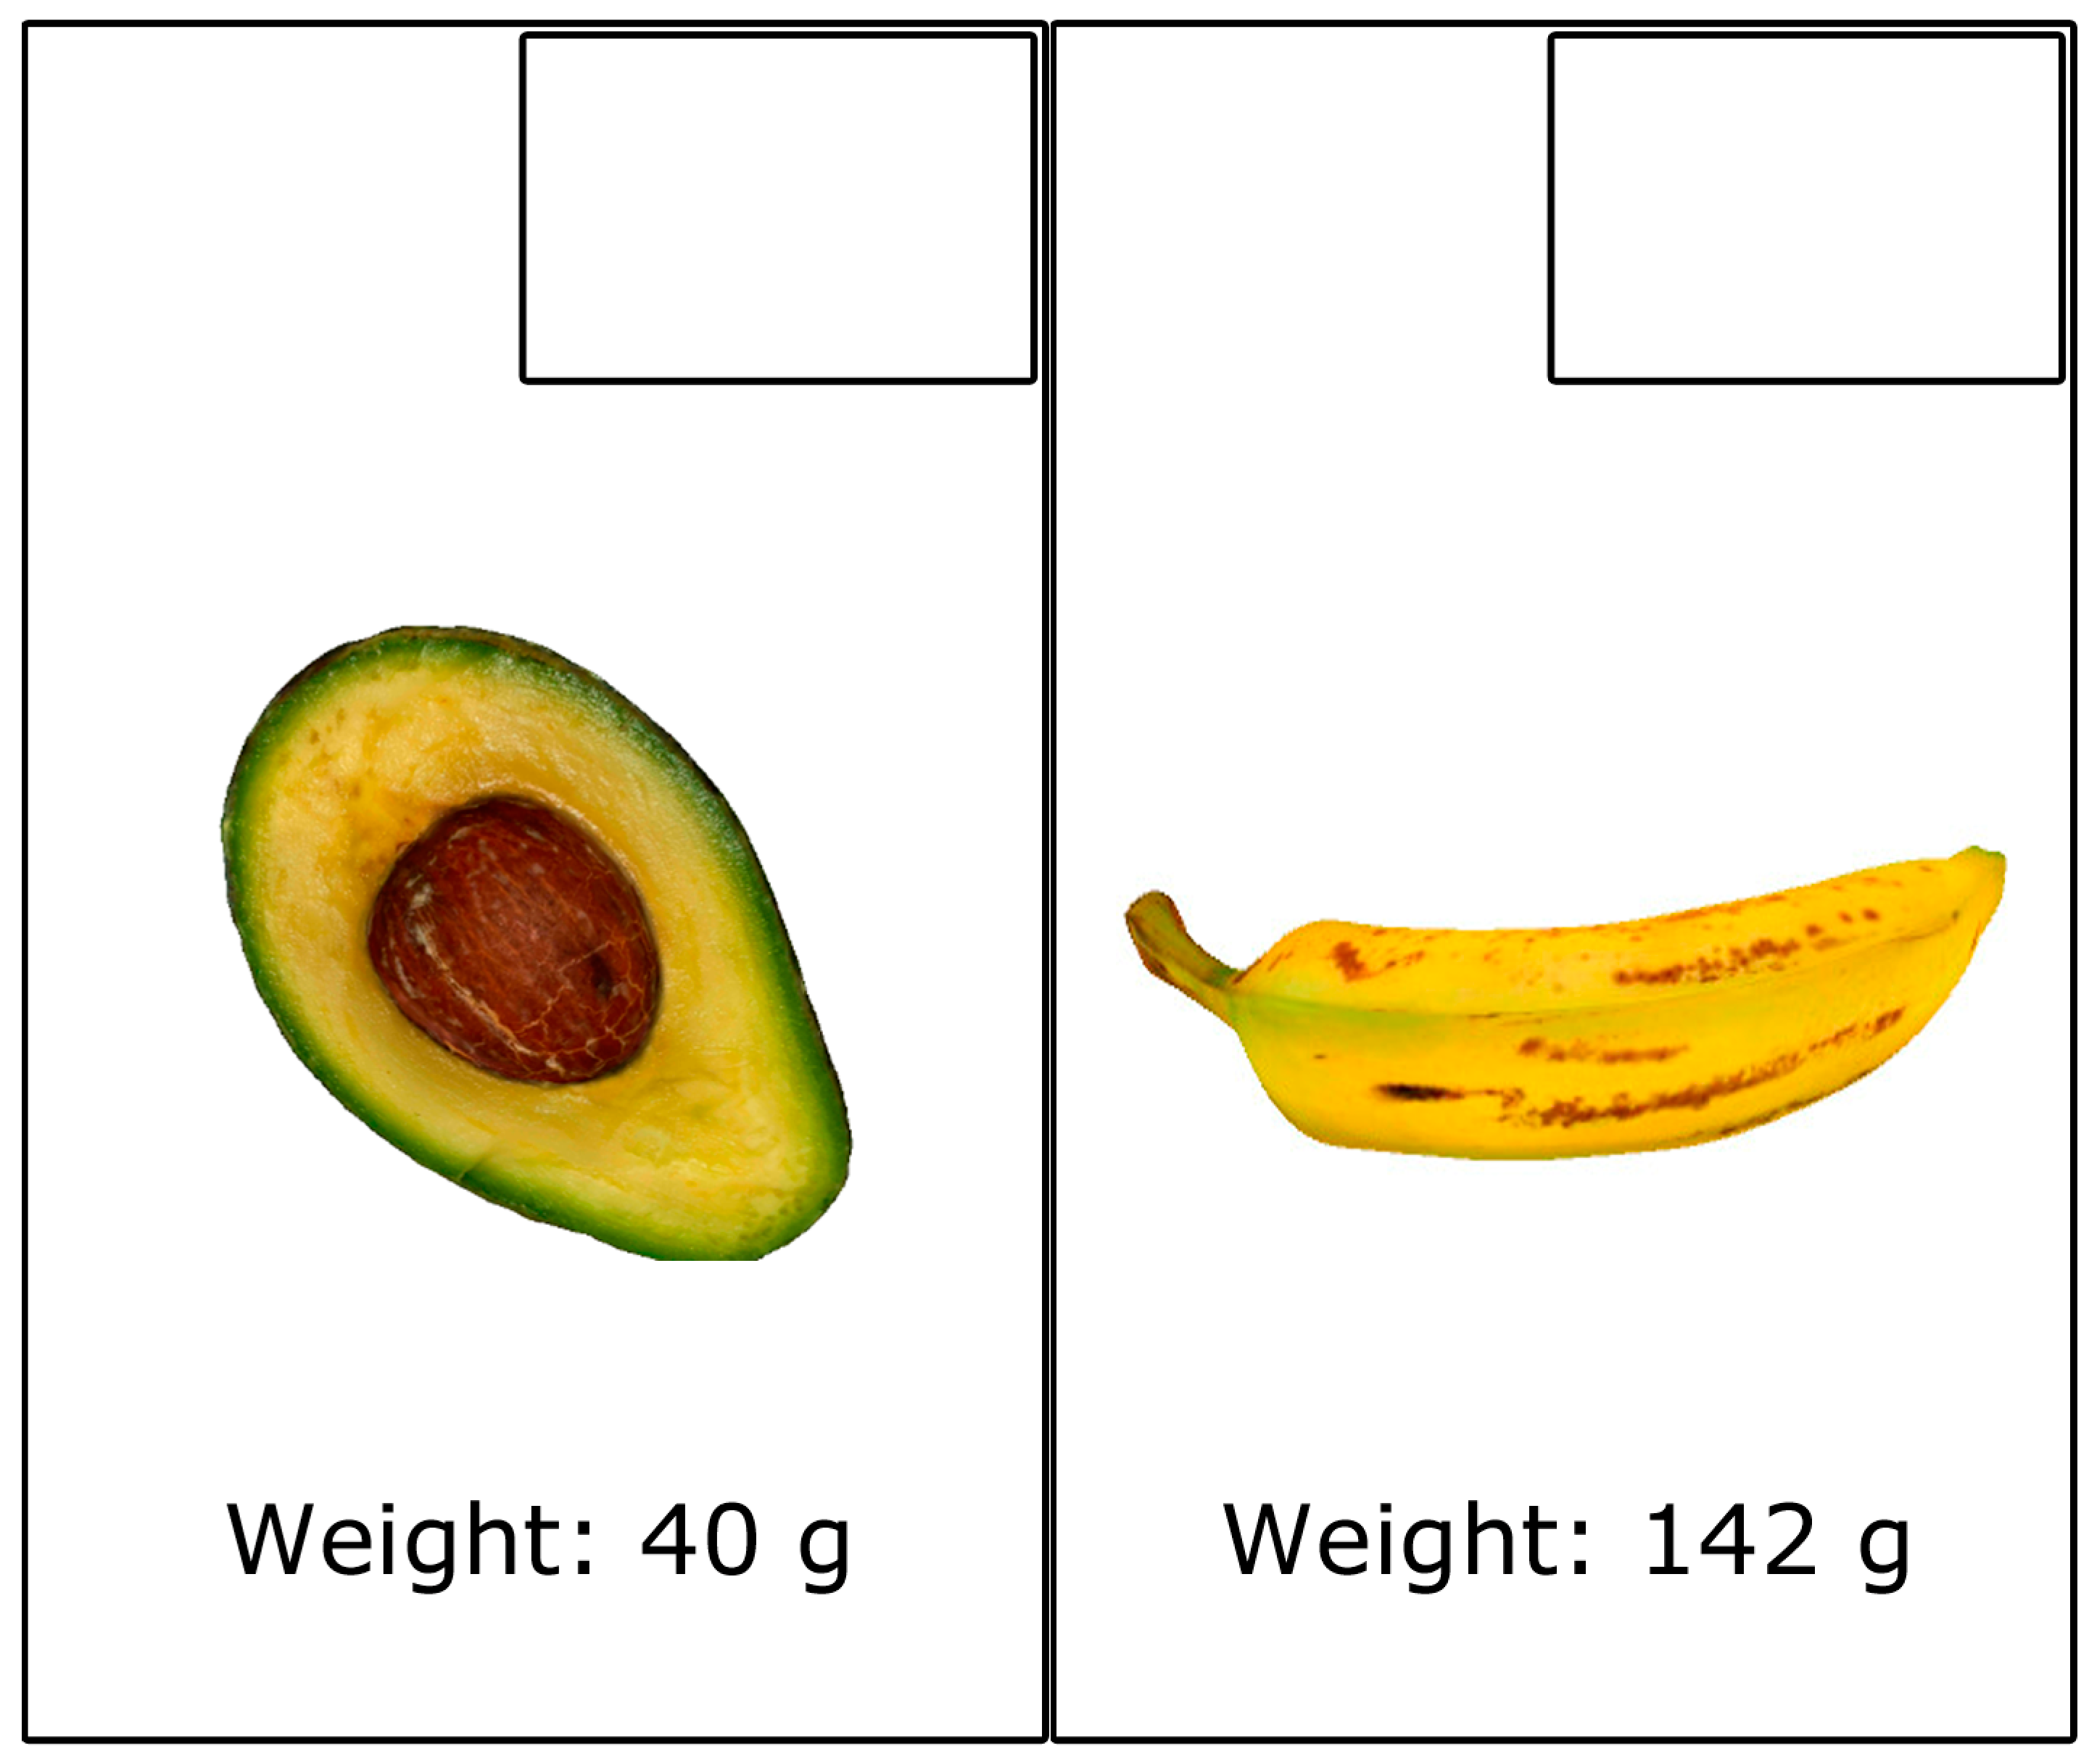
Knowledge questionnaire: To evaluate the acquired knowledge about carbohydrate choices, a questionnaire was administered. In this questionnaire, the patients were asked to write the number of carbohydrate choices for nine different foods, taken from the 25 items displayed in the application. The nine food items included in the questionnaire are a slice of pizza, three Maria cookies, a slice of white bread, an apple, a banana, half an avocado, a glass of milk, six pieces of broccoli, and a lightly fried sunny-side up egg.
Figure 7 presents an example of two food items that were part of the knowledge questionnaire. All of the foods featured in the questionnaire were part of the four different learning methods (traditional, AR application, MR application with Quest 2, and MR application with Quest 3), and patients were provided with information about the carbohydrate content of each food. The same questionnaire was administered at two different stages of the study to evaluate the knowledge level regarding carbohydrate choices (pre-test and post-test). Specifically, the pre-test was used to determine prior knowledge and the post-test was used to determine post-session knowledge with the four learning methods. Knowledge was scored based on the total number of correct answers, ranging from 0 to 9.
Subjective questionnaires: The following questionnaires were administered:
3.5. Protocol
The study followed a between-subjects design. This involved four separate groups (a control group that used traditional learning and three experimental groups). The three experimental groups used a mobile AR application, an MR application using Meta Quest 2 (grayscale passthrough), and the same MR application using Meta Quest 3 (color passthrough). The patients followed these steps:
Complete the pre-knowledge questionnaire, filled out on paper with physical writing.
Learn by using one of the four different learning methods (traditional, AR application, MR application with Quest 2, and MR application with Quest 3).
Complete the post-knowledge questionnaire, also filled out on paper.
Complete the remaining questionnaires (usability, satisfaction, and data questionnaires), all of which are filled out on paper.
In the traditional method, a nutritionist conducted the class as she typically does in her regular sessions. She presented the food items one by one and explained them, with the students taking notes during the lesson, but at this stage, they did not handle the food items. During the class, the nutritionist presented 2D color images of food at real size on plastic-coated paper and cropped to match the shape of each food item. The duration of the class was one hour. The nutritionist discussed the foods featured in the applications and presented all of the information included in the applications. All of the foods tested were also covered in the class. Additionally, the session covered other important concepts, such as the healthy plate. For instance, she demonstrated how to combine these foods to create a healthy meal. After explaining each food, there was a question-and-answer section where patients could ask questions. Some questions included: “Is it advisable to have five meals a day?”, “Can I eat my healthy meal in parts?”, and “How can I identify food choices that are not listed in the manual?”. Patients further requested suggestions for meal preparation, including home-cooked recipes and alternatives to the manual. The nutritionist addressed all of the questions thoroughly. After the traditional class and before the knowledge assessment, patients were allowed to observe and handle the paper-printed food items for as long as they wished, typically spending up to 30 s per item. There was no limit on the number of rounds. Participants could spend as much time as they wanted with each food item and revisit them as many times as they wished.
The study was conducted in two parts. The first part was carried out in the facilities of the Diabetes House in Cuenca and Portoviejo (Ecuador) during a single session on a Saturday morning (10:00 to 12:00). The second part was carried out in one session, on a Saturday during the whole day at the Diabetes House camp held in August. Patients needed approximately 30 min to use the MR and AR applications, and fill out the questionnaires.
4. Results
To assess the normality of the variables, the Shapiro–Wilk test was conducted. The majority of them showed a non-normal distribution. Consequently, non-parametric tests were employed for the full dataset. The statistical results are shown as (
Mdn: median;
IQR: interquartile range), with all test outcomes reported as (
U test: Mann–Whitney
U/
W test: Wilcoxon Signed-rank, Z value for normal approximation,
p-value,
r effect size). The results with a
p-value below 0.05 are considered statistically significant and are emphasized in bold. The statistical analysis was performed using the R software package (
http://www.r-project.org (accessed on 18 February 2025)).
4.1. Short-Term Learning Outcomes
First, we checked whether the patients in the different groups learned using the learning method of their group (traditional, mobile AR application, MR application using Meta Quest 2, MR application using Meta Quest 3).
The Wilcoxon Signed-rank test was applied to determine if patients showed learning improvements through the traditional method (W = 0, Z = −4.396, p < 0.001, r = 0.622). This analysis involved comparing the scores before the traditional learning session (Mdn = 3.0; IQR = 4.0) with those obtained afterward (Mdn = 7.0; IQR = 2.0).
The Wilcoxon Signed-rank test was applied to evaluate whether students learned using the mobile AR application (W = 0.0, Z = −4.526, p < 0.001, r = 0.616). This analysis compared the scores from before (Mdn = 4.0; IQR = 3.0) and after using the AR application (Mdn = 8.0; IQR = 1.0).
The Wilcoxon Signed-rank test was applied to evaluate whether students learned using the MR application with Quest 2 (W = 0, Z = −3.917, p < 0.001, r = 0.619). This analysis compared the scores from before (Mdn = 4.0; IQR = 2.25) and after using the MR application with Quest 2 (Mdn = 7.0; IQR = 2.0).
The Wilcoxon Signed-rank test was applied to evaluate whether students learned using the MR application with Quest 3 (W = 0, Z = −3.925, p < 0.001, r = 0.621). This analysis compared the scores from before (Mdn = 3.5; IQR = 3.0) and after using the MR application with Quest 3 (Mdn = 8.0; IQR = 2.0).
Second, the Kruskal–Wallis test was applied to assess whether the patients’ initial knowledge differed among the different groups (traditional, mobile AR application, MR application using Meta Quest 2, MR application using Meta Quest 3). This analysis revealed that there were no significant differences among the different groups (d.f. = 3, H = 4.7155, p = 0.1939).
Third, the Kruskal–Wallis test was applied to assess whether the knowledge after using the different learning methods (traditional, mobile AR application, MR application using Meta Quest 2, MR application using Meta Quest 3) differed between the different groups. This analysis revealed that there were significant differences among the different groups (d.f. = 3,
H = 17.061,
p < 0.001). For this reason, the different methods were compared two by two using Mann–Whitney
U tests. The results of these tests are shown in
Table 2. Significant differences were found for three of the comparisons: for learning between the traditional method and the mobile AR application, in favor of mobile AR application; for learning between the traditional method and the MR application with Quest 3, in favor of the MR application with Quest 3; and for learning between the MR application with Quest 2 and the application of MR with Quest 3, in favor of Quest 3. The means (standard deviations) of post-learning knowledge scores after using the different learning methods are shown in
Table 3. The highest post-learning knowledge means, in descending order, are for MR Quest 3, Mobile AR, MR Quest 2, and Traditional.
Fourth, the Kruskal–Wallis test was used to assess whether the increase in knowledge (score after learning with the method minus the initial score) differed when using the different learning methods. This analysis revealed that there were no significant differences among the different groups (d.f. = 3,
H = 1.7449,
p = 0.627). The means (standard deviations) of knowledge increase after using the different learning methods are shown in
Table 4. The highest knowledge increase means, in descending order, are for MR Quest 3, MR Quest 2, Traditional, and Mobile AR.
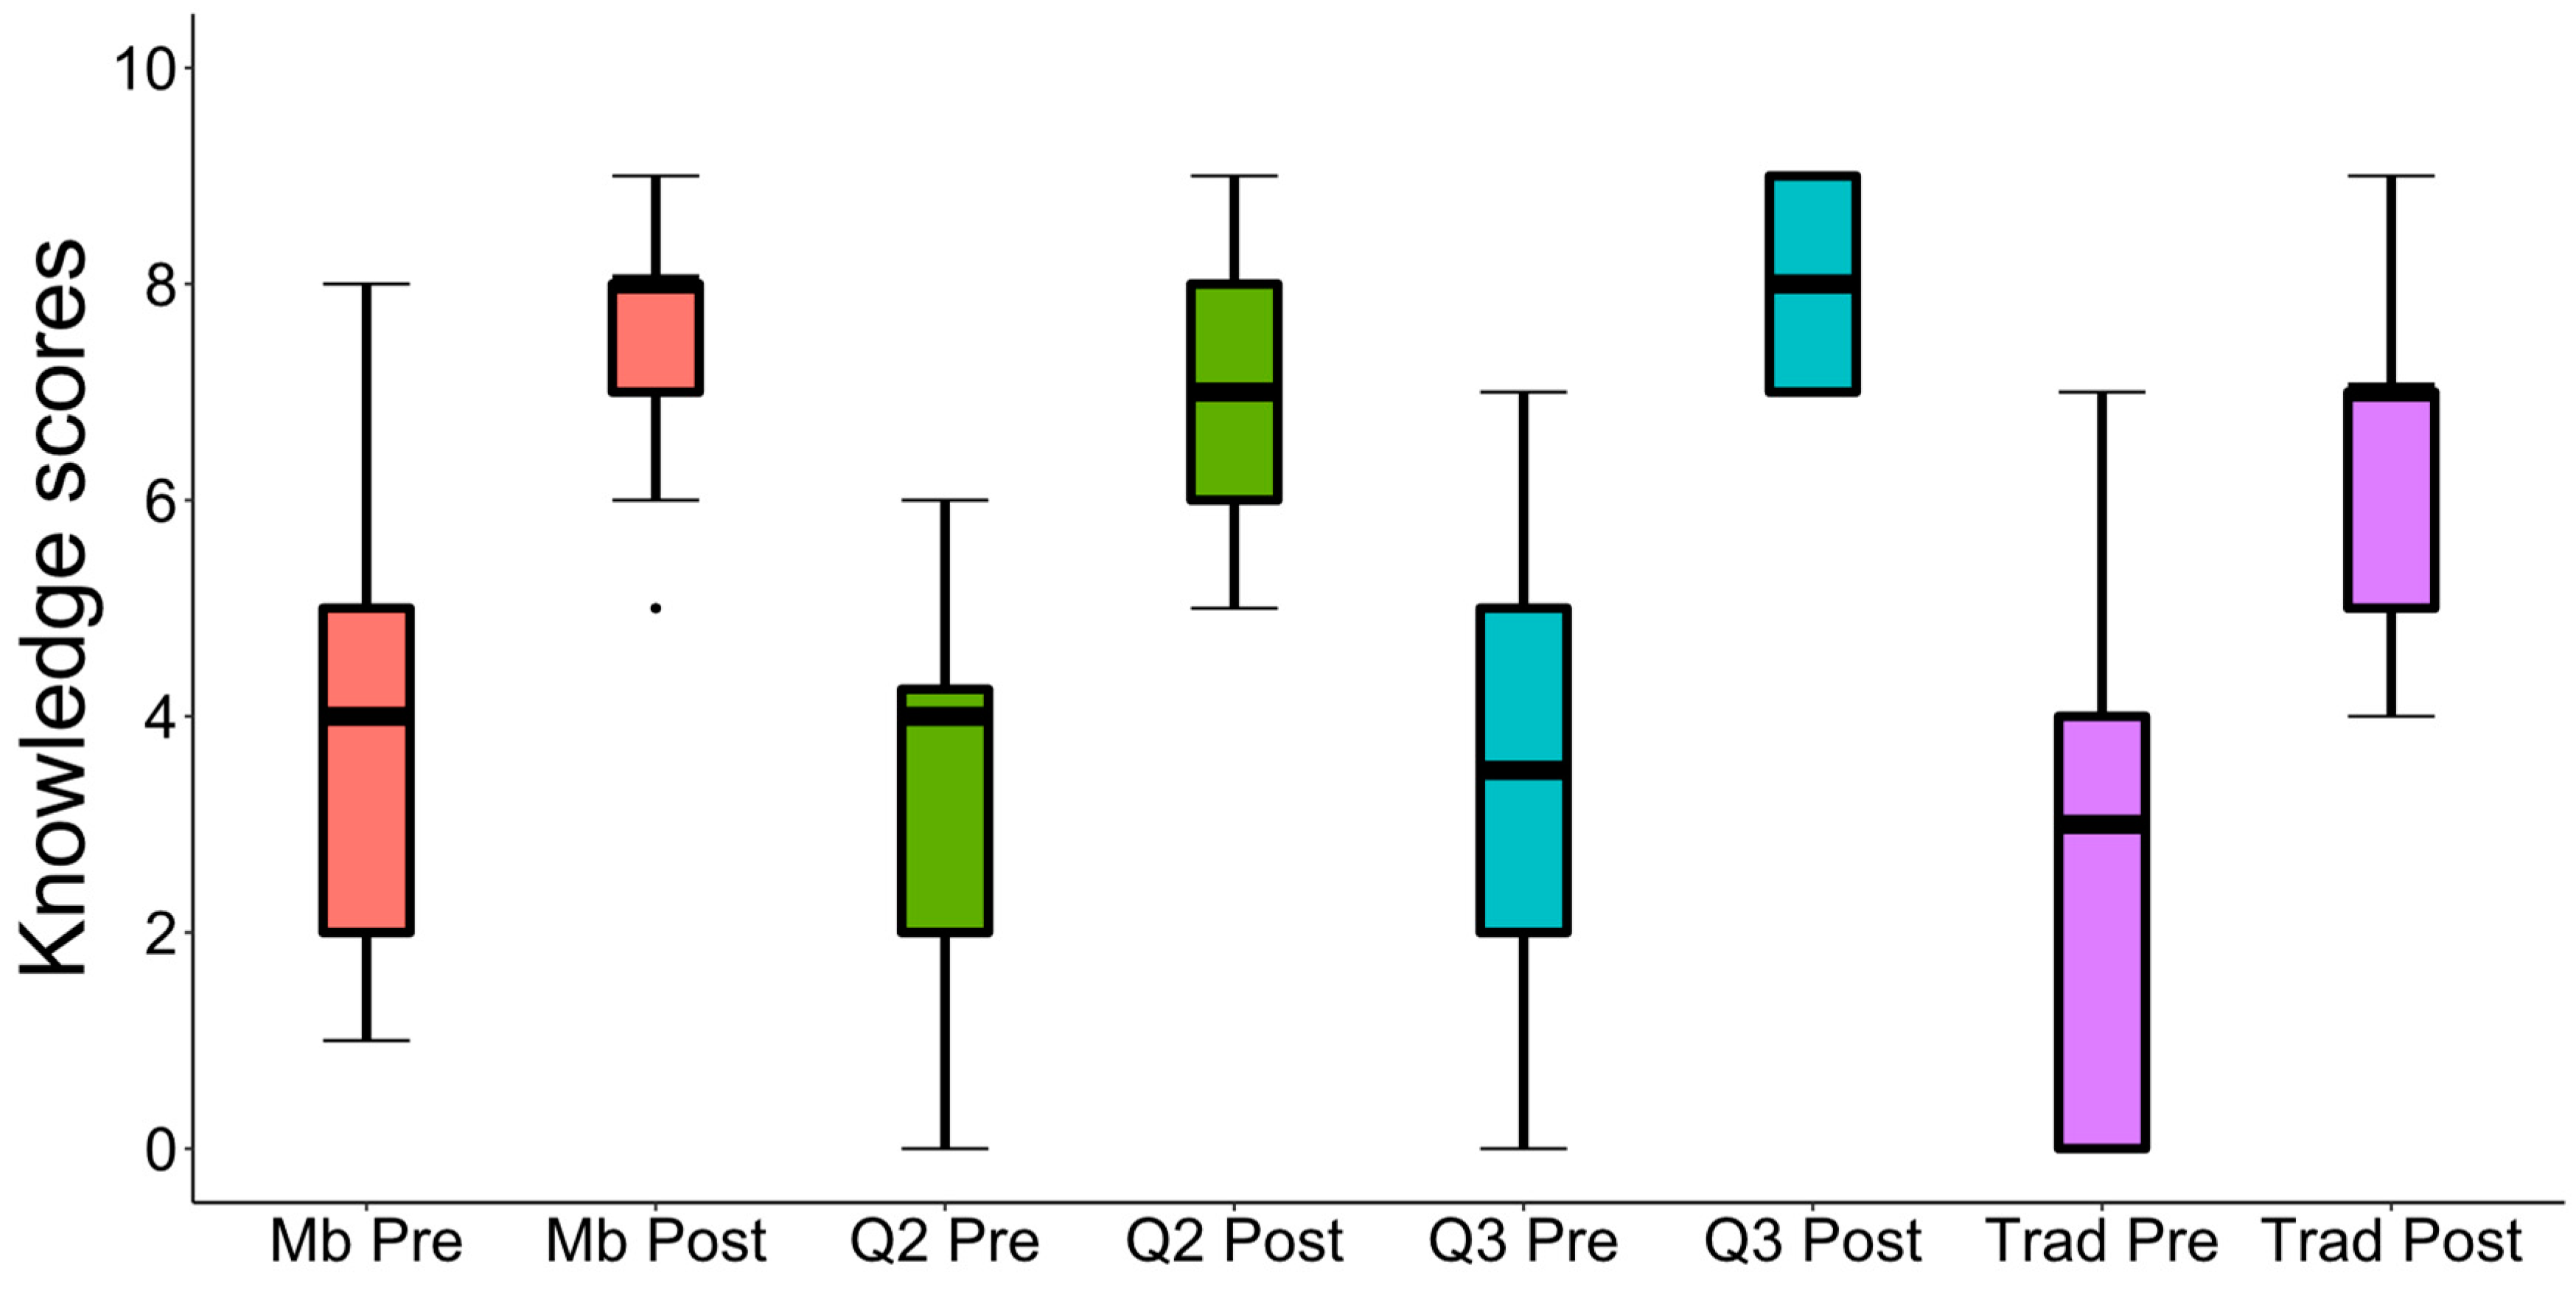
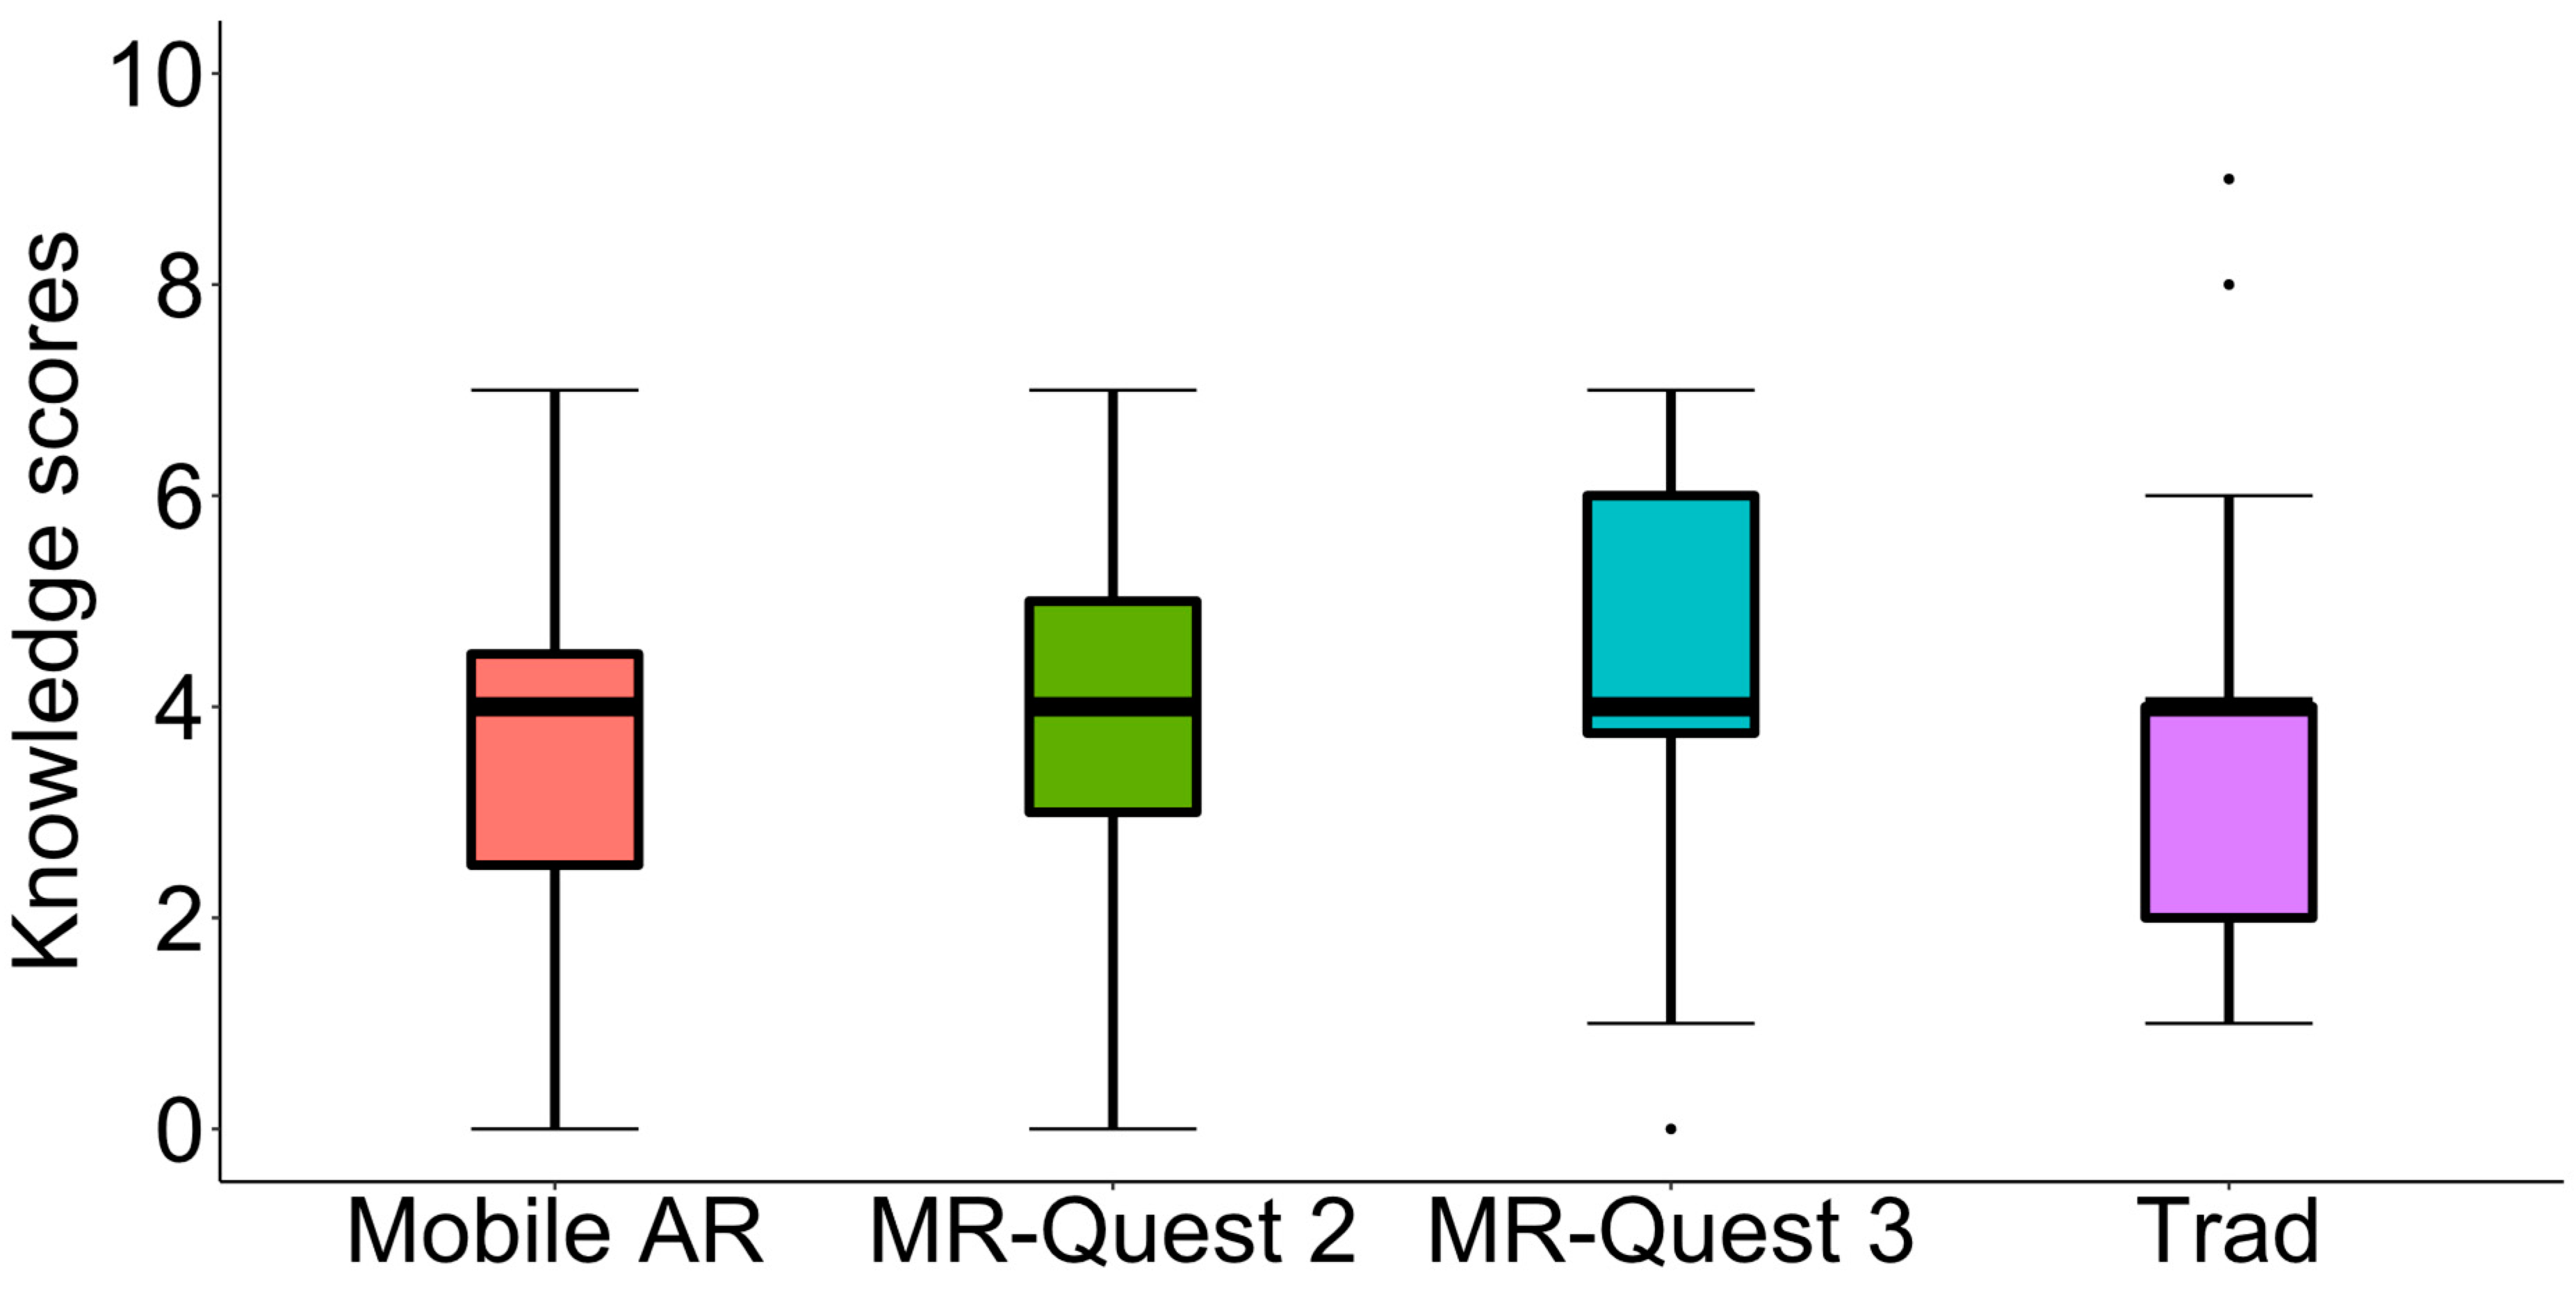
Figure 8 presents a box plot for the scores obtained by the patients before and after learning with the different learning methods.
Figure 9 presents a box plot of the leaning gains with the different learning methods. From all of these results, we can conclude that the use of all four learning methods was effective for short-term knowledge transfer. The method that contributed to the most learning was the use of MR using Meta Quest 3.
4.2. User Experience
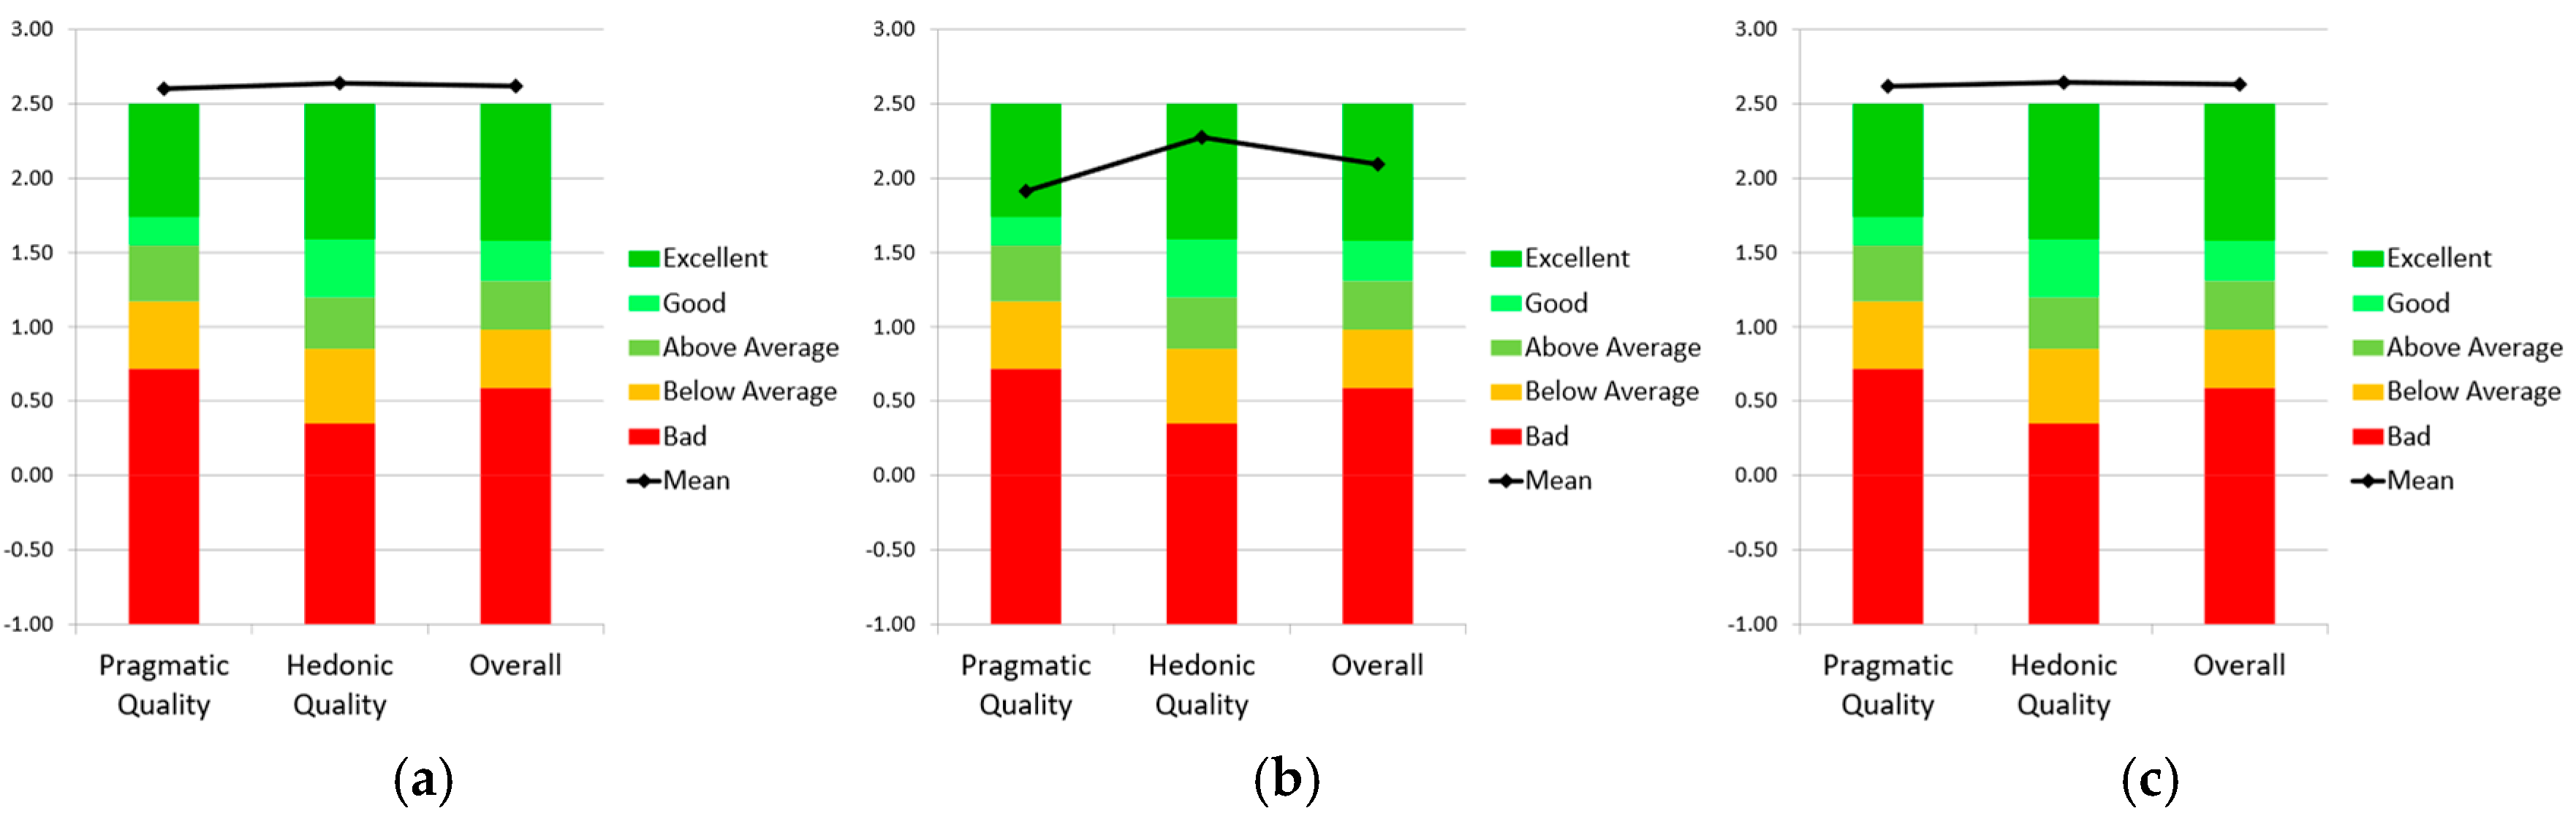
After using the AR and MR applications, the patients completed the short-UEQ questionnaire, and their responses were analyzed using the UEQ Data Analysis Tool (
https://www.ueq-online.org (accessed on 18 February 2025)). Three graphs were generated (
Figure 10) using one of the downloadable Excel templates from UEQ to assess the quality of our MR and AR applications in comparison with the products included in the UEQ benchmark dataset [
22]. The graphs indicate that the Mobile AR application and the two MR applications with Quest 2 and Quest 3 significantly outperform the UEQ benchmark. According to the interpretation guidelines in the UEQ tool and reference [
22], the three applications rank in the top 10% across all three variables.
Mann–Whitney
U tests were used to check whether the learning application affected the three UEQ variables. The results of the analyses and the pairwise comparisons are presented in
Table 5. From these analyses, it can be observed that there are significant differences in favor of the MR application with Quest 3 and the AR application when compared to the MR application with Quest 2. Furthermore, considering the data included in
Table 5, the results favor the experience with Quest 3.
Mann–Whitney
U tests were used to check whether the learning application affected the usability and satisfaction questions listed in
Table 1. After applying the test to the three applications compared two by two, it can be observed that in most of the tests, no significant differences were found. Significant differences were only obtained for three of these comparisons, which are shown in
Table 6. From these analyses, it can be observed that there are significant differences in favor of the AR application when compared with the MR application with Quest 2 for US#2 and SA#4, and the MR application with Quest 3 for US#2. With regard to question US#2, “I have gotten used to the application quickly”, the patients got used to the AR application more quickly given that a tablet was used and users are very familiar with devices of this type. With regard to question SA#4, “I think I have learned with this application”, the patients believed they had learned more with the AR application than with the MR application with Quest 2, and, indeed, the learning results indicate that this was the case, although no statistically significant differences were found for such learning (
Table 2).
4.3. Gender and Age
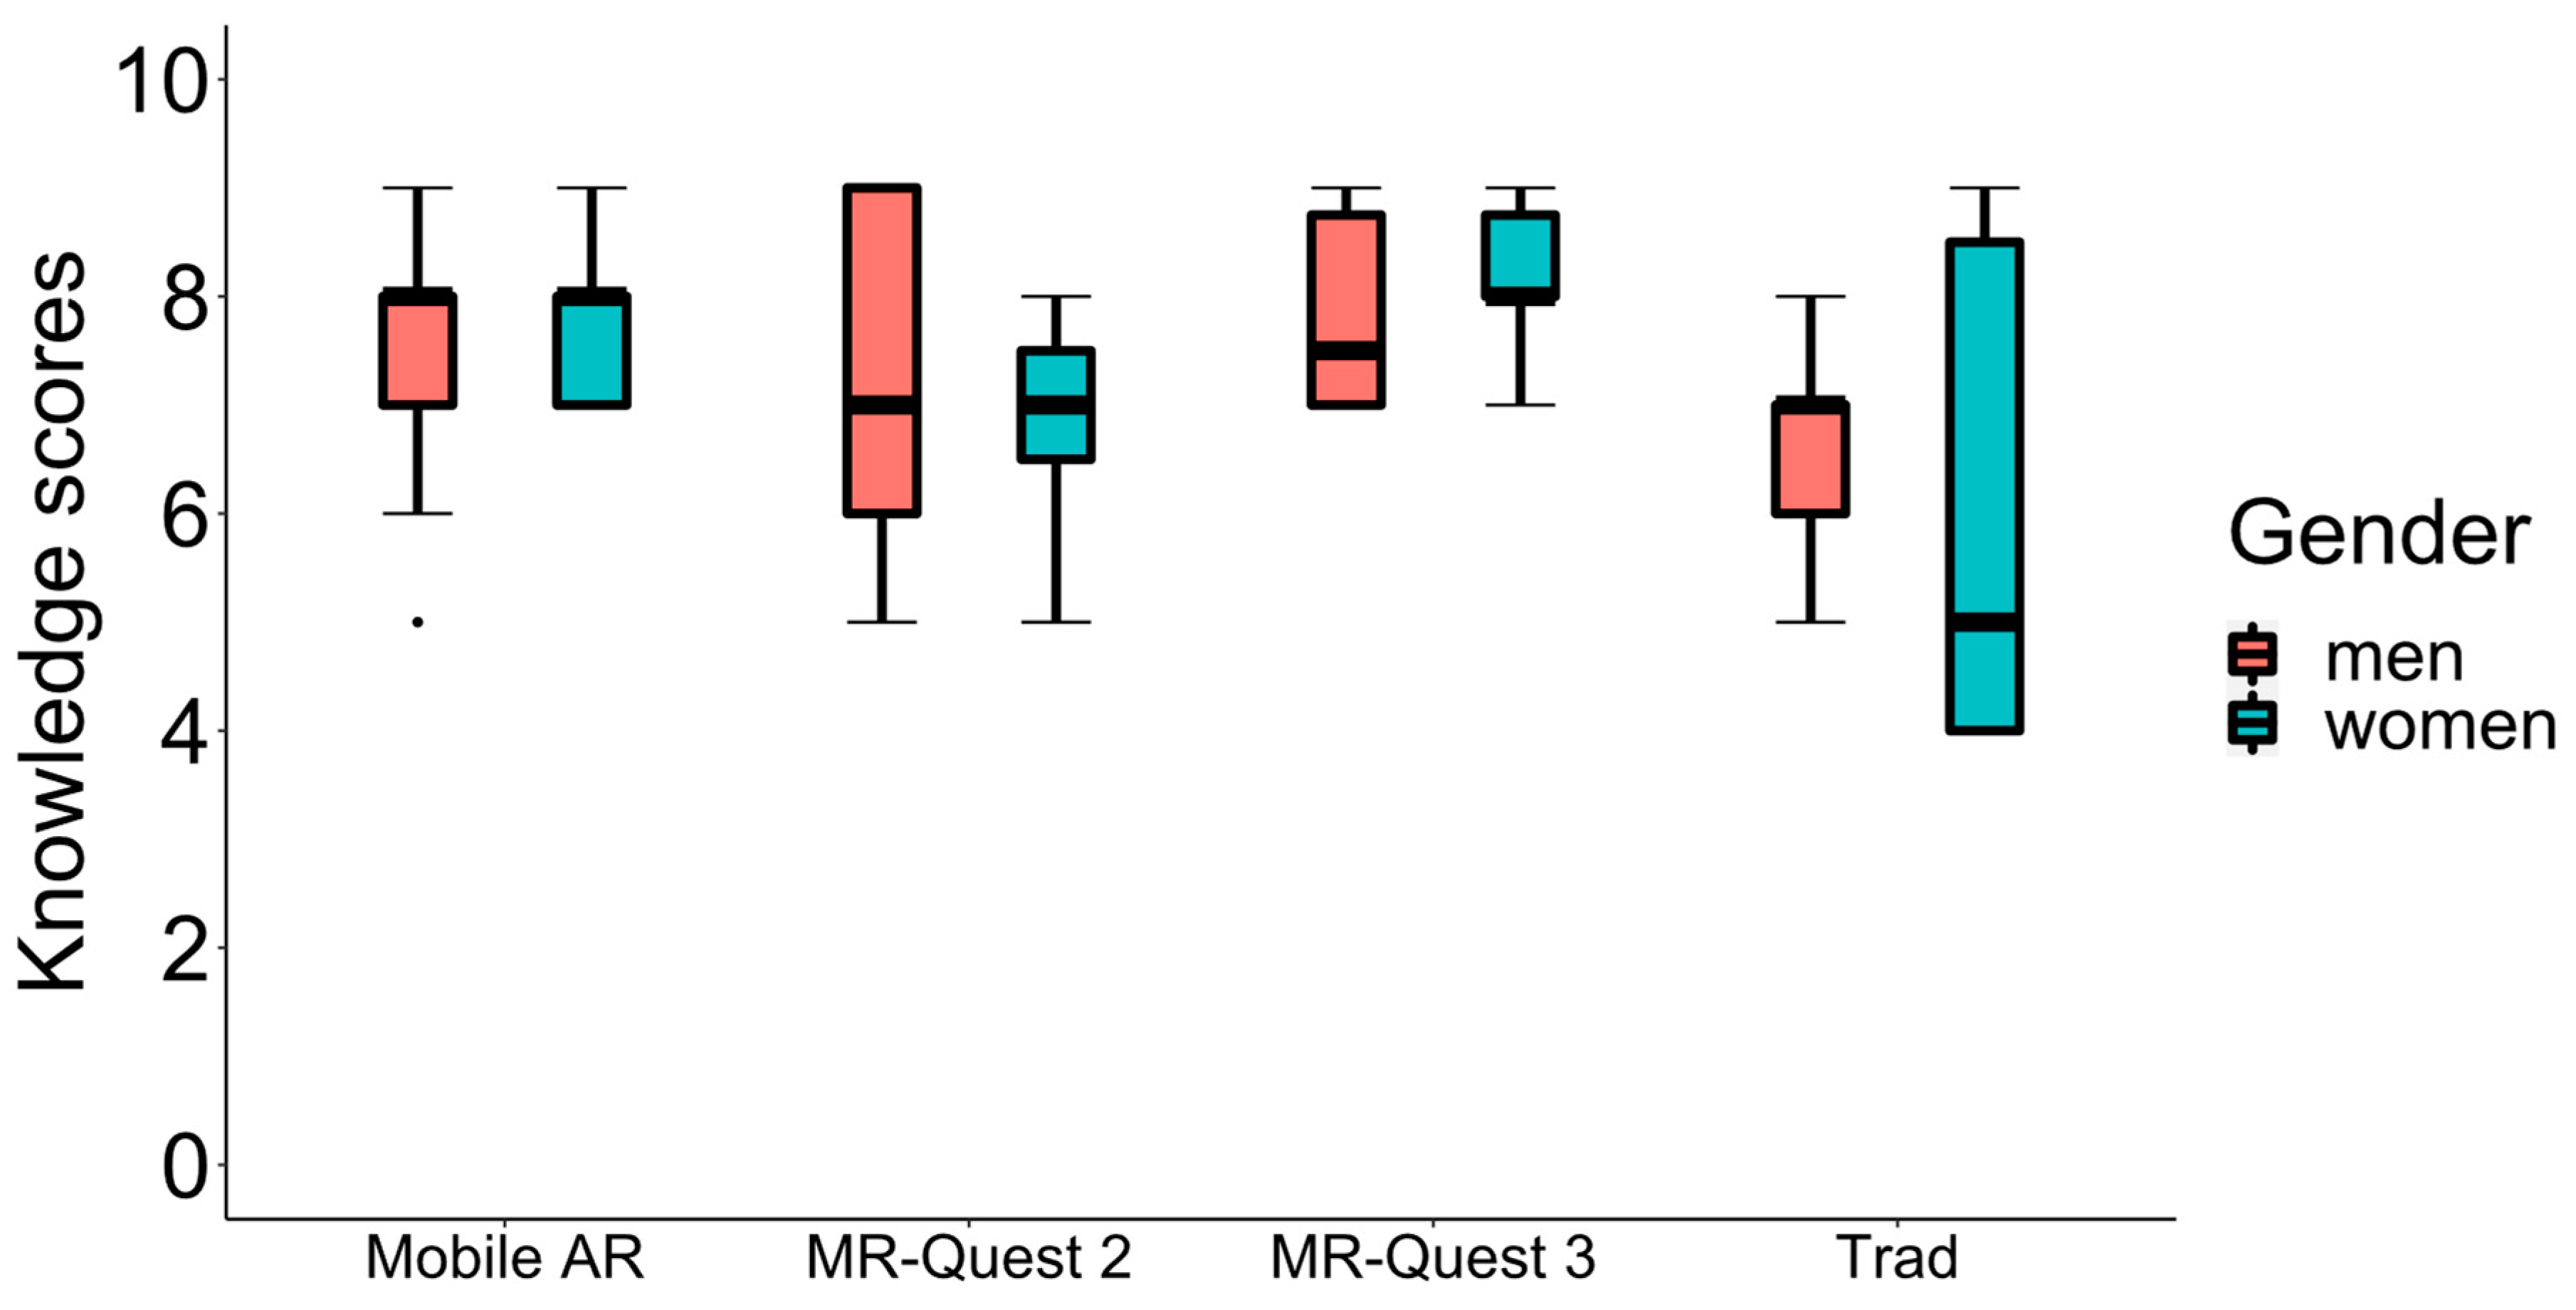
We applied the Mann–Whitney
U test to assess whether gender had an impact on the patients’ outcomes. The post-learning scores of women and men were compared across the traditional method, the AR application, and the MR applications with Quest 2 and Quest 3. No significant differences were found for any learning method considering gender (
Table 7).
Figure 11 shows box plots for the post-knowledge scores obtained by women and men after learning with the four different methods.
The Mann–Whitney U tests were applied to determine if gender affected the UEQ, the satisfaction and usability variables for the three different applications. All of these variables were compared for women and men. No significant differences were found in any of the analyses and they are not included in this publication.
To assess whether age had an impact on the post-learning questionnaires completed by the patients, the Kruskal–Wallis tests were conducted (
Table 8). Kruskal–Wallis tests were also applied to evaluate if age influenced the UEQ, as well as the usability and satisfaction variables. No significant differences were found in any of the analyses and they are not included in this publication.
4.4. Correlations
For clarity and relevance, only the correlations that offer valuable insights have been included in this section.
Table 9 shows the correlation among some of the variables using data from all of the patients who used the AR, MR with Quest 2, and MR with Quest 3 applications.
Table 9 also indicates the only significant correlation obtained when analyzing all of the experimental groups separately. Similarly, four additional correlations are indicated where the use of Quest 2 and Quest 3 provided significant correlations.
5. Discussion
In this publication, we present the first MR application that uses both grayscale and color passthrough to assist TED and aid patients in learning how to count carbohydrates. Our MR application blends virtual food, specifically designed for patients in Ecuador, into a real environment. Diet management plays a vital role in maintaining overall health, and for individuals with diabetes, controlling food intake is essential [
23]. The amount of insulin needed is directly affected by the quantity of carbohydrates ingested during meals. Thus, understanding the carbohydrate content in food enables patients to better manage their condition autonomously and to enhance their glycemic control. While our study did not assess the impact of the application on patients’ glycemic control, this remains a key area for future research.
Our application exploits MR technology to enhance the learning experience in a way that traditional methods cannot. While the task of associating a number with a food item to indicate the amount of carbohydrate choices may seem simple, the use of MR offers several key advantages that enhance the learning experience. The immersive nature of MR increases participant engagement and attention, which can lead to better retention and understanding of the knowledge. Additionally, MR facilitates more realistic and dynamic interactions with 3D models of food items, providing a lifelike experience that helps participants better contextualize and transfer their learning to real-world situations. This interaction strengthens the ecological validity of the learning process, ensuring that the skills learned are more readily applicable in real-life contexts. The use of passthrough technology further enhances the experience by seamlessly blending virtual elements with the real environment, something that traditional 2D images or simpler learning methods cannot achieve.
Incorporating MR technology, the Meta Quest 3 introduces hardware advancements that further enhance user immersion. Meta Quest 3 has higher resolution and a larger field of view that enhances the immersive user experience. However, with respect to MR, a key improvement in the Meta Quest 3 is its color passthrough, which offers a significantly enhanced experience. This improvement is not only due to the addition of color but also the increased image stability. On the other hand, with the Meta Quest 2, image distortion begins below 0.6 m [
17]. While distortion still occurs with Meta Quest 3, it only appears at much closer distances, such as when a hand is brought close to the face or the headset is near a real table. Meta Quest 3 remains stable at distances of over 40 cm. The distance used by users for food handling is usually greater than this distance. If users picked up the food and brought it close to their faces, they could perceive this distortion even when using Meta Quest 3. Another advantage of Meta Quest 3 over its predecessor, Meta Quest Pro, is that the Meta Quest 3 controllers use replaceable batteries, similar to those of Meta Quest 2. In contrast, Meta Quest Pro uses self-recharging controllers, which have been reported to cause problems in previous works [
18].
In our research, even though we track the learning process, the application is designed for independent use at any time and location, providing greater flexibility in learning, as noted in other studies [
8]. Moreover, previous research also indicates that flexible, technology-driven methods could effectively engage younger audiences [
24].
To evaluate the practical implications of our MR-based application, we conducted a study comparing the effectiveness of short-term learning of carbohydrate choices using Meta Quest 3, Meta Quest 2, mobile AR, and traditional methods. The significant differences in the knowledge of patients before and after using the four learning methods indicate that all four methods have been effective for knowledge transfer. When comparing the different learning methods two by two to assess the post-learning knowledge scores, it was observed that the MR application using Meta Quest 3 and the mobile AR application significantly outperformed the traditional method. The patients using the MR application with Meta Quest 3 also learned significantly more than those using Meta Quest 2. There were also greater learning outcomes than those using the mobile AR application. Considering all of the data shown in
Table 2, the learning methods can be ranked in order of effectiveness: MR using Meta Quest 3, the mobile AR application, the MR with Meta Quest 2, and the traditional method. Considering the data from
Table 3 and
Table 4, Meta Quest 3 is the method that yields the best results. The potential demonstrated by the MR applications aligns with previous research on AR applications, which has shown that mobile AR applications can enhance the learning process [
8,
25]. Furthermore, studies comparing AR applications with traditional learning methods did not reveal any statistically significant differences in learning outcomes [
8], suggesting that both approaches can be at least equally effective under certain conditions. Additional research, such as that by Chiang et al. [
26], found that groups using mobile AR applications achieved significantly higher average learning outcomes compared to non-mobile AR applications, which is consistent with our findings.
A limitation of our study is that the post-learning knowledge scores for MR Quest 3 are heavily concentrated at the upper end of the scale, with a considerable proportion of participants achieving the maximum score of 9. Specifically, 30% of participants achieved the highest possible score of 9, while 35% scored 8, which is also near the top of the scale, and the remaining 35% scored 7. In contrast, only 8% of participants in the traditional group, 14% in the mobile AR group, and 15% in the MR Quest 2 group scored 9. The clustering of scores at the upper limit for MR Quest 3 suggests the presence of a ceiling effect, which occurs when the measurement tool lacks sufficient range to capture further differences in participants’ performance. As a result, participants who reach the maximum score are unable to demonstrate higher levels of knowledge, even if such improvements are possible. This reduces the ability to detect true differences between the groups or methods, as many participants are already at the highest possible score. In the case of MR Quest 3, the high concentration of scores at the maximum (9) implies that once participants reach this ceiling, any further knowledge gains cannot be captured by the assessment. Consequently, although MR Quest 3 shows the highest post-learning score mean (7.95), the ceiling effect likely limits the detection of additional improvements in knowledge. Furthermore, statistical analysis of the learning gains (post-pre) does not reveal significant differences between methods, reinforcing the notion that the ceiling effect may have masked any further potential improvements in knowledge for participants using MR Quest 3. In conclusion, while MR Quest 3 demonstrates the highest post-learning knowledge scores, as well as the highest medians and means, the ceiling effect may have influenced the results, potentially limiting the ability to capture further improvements in knowledge. Nonetheless, these findings highlight the effectiveness of the method compared to others. In any case, to address this limitation, future studies could consider increasing the number of questions in the questionnaire to allow for a greater scoring range, which would provide more capacity to capture further knowledge improvements and reduce the potential for a ceiling effect.
All four of the learning methods were effective in increasing knowledge (post-scores), regardless of gender or age. However, the role of gender in learning outcomes and preferences remains a debated issue. The findings of this study align with the broader, mixed results reported in the literature. Numerous studies have explored gender differences in learning outcomes and preferences within immersive environments like VR, AR, and MR, yet no consensus has been reached. For instance, some research indicates gender-based disparities in attitudes and performance. Studies in VR environments, found men reporting more positive attitudes [
27] or outperforming women in specific tasks [
28]. Similarly, in AR-based studies, differences in spatial abilities and preferences have been observed, with some results favoring men in terms of spatial abilities [
29] and others favoring women with regarding preferences [
30,
31]. Conversely, other research highlights the absence of significant gender differences in performance within both VR (e.g., [
32,
33]) and AR environments (e.g., [
34]), as well as in AR acceptance [
35]. Furthermore, studies in MR contexts, such as Petruse et al. [
36], have consistently reported no significant impact of gender on academic performance. The inconsistent findings across these studies suggest that the influence of gender may be context-dependent, varying with the specific tasks, technologies, and educational settings involved. Our results contribute to this ongoing discourse by examining gender as a potential factor influencing learning outcomes and preferences. Considering the complexity and variability of previous findings, further research is needed to better understand the relationship between gender and the use of immersive technologies in educational settings, aiming to achieve gender equality in outcomes.
Usability has been widely recognized as a key factor in enhancing educational effectiveness [
37]. Sun et al. [
38] suggest that user-friendly systems allow learners to focus more deeply on the content. In our study, patients evaluated their experience on the Short-UEQ questionnaire as excellent, with scores placing our applications within the top 10% across all three benchmarked UEQ variables [
22]. These findings suggest that the MR and the AR applications effectively support patients in concentrating on learning about carbohydrate content in different foods. However, when comparing the three applications two by two (
Table 5), the MR with Quest 3 and the AR applications provide significantly better ratings than the MR application with Quest 2. When comparing AR and MR with Quest 3, no statistically significant differences are observed, but patients rated the MR experience with Quest 3 better.
With regard to the correlations (
Table 9), it is worth mentioning that the number of significant correlations differs when using the entire sample compared to analyzing the correlations within the three experimental groups. A higher number of correlations are observed when the entire sample is analyzed together. The relatively small sample size in each group could reduce the statistical power to detect significant correlations. As a result, in the separate group analyses, only the strongest correlations may be detected, and many potential relationships between variables might go unnoticed due to data variability and the smaller number of participants. This could be further explored in future studies with larger sample sizes to gain a deeper understanding of these relationships. In light of this, the analysis of the correlation matrix reveals several significant findings. A total of twenty-three correlations are statistically significant when using the sample of the three experimental groups, indicating meaningful relationships among variables. One of these significant correlations is between the knowledge acquired after using the applications (know) and ease of use (US#1). This suggests that when users interact with these technologies, the ease of use enhances their learning process. However, when the samples are analyzed separately, this correlation is not observed. As mentioned above, this correlation could be further explored in future studies with larger sample sizes. Notably, the correlation between “I have adapted quickly to the application” (US#2) and “I have focused more on the task than on the interaction mechanisms” (US#3) is significant across all of the three groups analyzed separately. This suggests that participants who adapt more quickly to the different applications tend to focus more on the task itself, rather than on the interaction mechanisms. Furthermore, according to
Table 9, in addition to the above correlations, there are four other significant correlations when the groups that used Quest 2 and Quest 3 are analyzed separately. They are as follows:
Correlation between “I have focused more on the task than on the interaction mechanisms” (US#3) and “The application is easy to use” (US#1). This significant correlation suggests that users who find the MR applications easy to use are more likely to focus on the task rather than on the mechanisms of interaction. This implies that ease of use may lead to a smoother, more intuitive experience, allowing users to concentrate on the primary objective of the application instead of struggling with interaction.
Correlation between “I believe I have learned from this application” (SA#4) and “The application is easy to use” (US#1). This significant correlation indicates that participants who found the MR applications easy to use were more likely to report having learned from it. This suggests that a seamless and intuitive user experience not only improves usability but also fosters a greater sense of learning. When users can easily interact with the application without frustration, they may feel more engaged and confident in the educational process, ultimately leading to a more positive perception of their learning outcomes.
Correlation between “I believe I have learned from this application” (SA#4) and “I have focused more on the task than on the interaction mechanisms” (US#3). This significant correlation suggests that when users concentrate more on the task rather than the interaction mechanisms, they are more likely to report having learned from the MR applications. This reinforces the idea that sustained focus on the content rather than on how to interact with the technology may enhance the learning experience. If users are not distracted by the mechanics of the applications, they can engage more deeply with the educational material, leading to the belief that better learning outcomes have been achieved.
Correlation between “I would use this application again” (SA#7) and “I would invite my friends to use this application” (SA#6). This significant correlation indicates that users who are willing to use the applications again are also more likely to recommend it to others. This relationship highlights the importance of user satisfaction and the likelihood of positive word-of-mouth. When users have a good experience and feel that the application is valuable, they are not only motivated to continue using it but also eager to share it with others. This kind of user engagement is crucial for the long-term success and widespread adoption of educational applications.
These correlations suggest that the ease of use, task focus, and overall user satisfaction play a vital role in enhancing the learning experience and encouraging continued use and recommendation of the MR applications. These findings emphasize that a positive user experience in using the Quest 3 or the Quest 2 is closely linked to both the perceived effectiveness of the applications and its potential for sustained engagement. In conclusion, our MR-based approach adds significant value by creating a more engaging, context-rich, and interactive learning environment, which favors effective learning.
Finally, the current and expected advancements in AR, MR, and robotics point to a wide range of opportunities for developing new tools for TED. The potential to develop immersive, interactive, and impactful educational tools for therapy has never been more promising.


