Article

Network Topology-Driven Vertiport Placement Strategy: Integrating Urban Air Mobility with the Seoul Metropolitan Railway System

Department of Civil Engineering, Seoul National University of Science and Technology, Seoul 01811, Republic of Korea
*
Author to whom correspondence should be addressed.
Appl. Sci. 2025, 15(7), 3965; https://doi.org/10.3390/app15073965
Submission received: 9 March 2025 / Revised: 29 March 2025 / Accepted: 1 April 2025 / Published: 3 April 2025
(This article belongs to the Special Issue Current Advances in Railway and Transportation Technology)

Abstract

:
We propose a vertiport location-allocation methodology for urban air mobility (UAM) from the perspective of transportation network topology. The location allocation of vertiports within a transportation network is a crucial factor in determining the unique characteristics of UAM compared to existing transportation modes. However, as UAM is still in the pre-commercialization phase, with significant uncertainties, there are limitations in applying location-allocation models that optimize objective functions such as maximizing service coverage or minimizing travel distance. Instead, vertiport location allocation should be approached from a strategic perspective, taking into account public capital investments aimed at improving the transportation network by leveraging UAM’s distinct characteristics compared to existing urban transportation modes. Therefore, we present a methodology for evaluating the impact of vertiport location-allocation strategies on changes in transportation network topology. To analyze network topology, we use the Seoul Metropolitan railway network as the base network and construct scenarios where vertiports are allocated based on highly connected nodes and those prioritizing structurally vulnerable nodes. We then compare and analyze global network efficiency, algebraic connectivity, average shortest path length, local clustering coefficient, transitivity, degree assortativity and modularity. We confirm that while allocating vertiports based on network centrality improves connectivity compared to vulnerability-based allocation, the latter approach is superior in terms of network efficiency. Additionally, as the proportion of vertiports increases, the small-world property of the network rapidly increases, indicating that the vertiport network can fundamentally alter the structure of multimodal transportation systems. Regardless of whether centrality or vulnerability is prioritized, we observe that connectivity increase exponentially, while network efficiency changes linearly with the increase in vertiport proportion. Our findings highlight the necessity of a network-based approach to vertiport location allocation in the early stages of UAM commercialization, and we expect our results to inform future research directions on vertiport allocation in multimodal transportation networks.

1. Introduction

We aim to propose a direction for the mid-to-long-term optimal allocation of vertiports during the initial commercialization phase of urban air mobility (UAM) from a transportation network perspective. The high uncertainty surrounding the characteristics of UAM as a transportation mode, its concept of operations, and public acceptability poses a significant challenge in allocating an optimal vertiport location. This results in the limitation of localized solutions that fail to account for a broader strategic framework [1]. Furthermore, the absence of long-term strategic planning for vertiport placement may lead to substantial opportunity costs, particularly in terms of planned UAM commercialization patterns and synergies with existing transportation systems [2]. To address this issue, we seek to provide insights into the development of a global solution for vertiport allocation from a transportation network perspective as a first step toward resolving these challenges.
Traditional location models face difficulties in securing concrete variables required for UAM deployment [3,4]. The optimal placement of transportation infrastructure is generally premised on maximizing service coverage and minimizing travel distance as objective functions [5,6,7,8,9,10,11,12,13,14]. To solve these objective functions, decision variables and constraints must be defined. From a transportation infrastructure perspective, decision variables should include the characteristics of the mode and network, while constraints must encompass resource limitations, supply–demand balance, and the boundaries of decision variables. At present, UAM lacks the necessary data and realistic parameters to conduct such an analysis effectively.
Before developing a concrete location allocation model, a methodological framework for conceptual vertiport location optimization is required. Existing studies addressing vertiport location have primarily relied on scenario-based approaches that assume hypothetical UAM services, questionnaire-based methods such as stated preference (SP) surveys to estimate demand [15,16,17,18,19,20]. However, current research on vertiport placement is limited due to the absence of real-world operational data, making it difficult to accurately model real-world conditions [3,21,22,23]. Additionally, given the distinct characteristics of UAM compared to conventional transportation modes, no studies were found within the scope of this research that consider vertiport placement from a transportation network perspective. Therefore, it is crucial to develop a methodological framework for optimizing vertiport locations at a conceptual level.
At this stage, it is necessary to explore robust network-based vertiport siting methodologies that can accommodate future uncertainties while contributing to the strategic development of a resilient transportation network. Urban air mobility (UAM) is emerging as a promising mode of future transportation but remains in the early phase of commercialization, with key operational constraints (e.g., vehicle types, flight methods, takeoff and landing standards) not yet fully established [24,25]. The commercialization of UAM will serve as an inflection point in reshaping urban transportation paradigms as it will significantly influence the structure of transportation networks [26]. Moreover, given the competitive nature of investments in vertiports for new transportation modes the rate of network transformation is accelerating [27,28]. The increasing uncertainty surrounding the commercialization of autonomous vehicles, user behavior toward UAM, and societal acceptance further complicates the prediction of competitive and cooperative dynamics between different modes of transport [29,30,31,32]. In this context, establishing a directional approach for optimizing vertiport placement from a network perspective is of paramount importance. We hypothesize that the structural characteristics of transportation networks vary depending on the adopted network scenarios (i.e., degree centrality focused, betweenness centrality focused, or vulnerability focused) used for vertiport location allocation. To verify this, we employ a network analysis-based approach to examine how different strategies influence key network indicators. Based on the empirical findings, this study offers strategic insights into vertiport placement planning during the early, pre-commercialization phase of urban air mobility (UAM).
To enhance the synergy between UAM and existing urban transportation networks, it is necessary to develop a methodological framework for network-based vertiport allocation. Since UAM requires vertiports for takeoff and landing, the placement of vertiports within the transportation network will be a key determinant of UAM’s role within the broader system [33,34]. UAM operates as a high-speed, small-scale urban transport mode that requires dedicated stations while utilizing designated airspace and flight corridors, making it distinct from traditional terrestrial modes. Furthermore, UAM is expected to overcome the limitations of helicopter transport while achieving a higher passenger capacity. Consequently, how vertiports are positioned within transportation networks will play a crucial role in shaping the future development of UAM.
This study proposes a network science-based methodology for allocating optimal vertiport locations and applies it to the urban railway network of the Seoul Metropolitan Area, South Korea. Section 2 reviews network methodologies for analyzing transportation structures, prior research on airport and infrastructure siting, and existing studies on vertiport placement. Section 3 details the proposed methodology, datasets, and case study procedures. Section 4 presents a comparative analysis of changes in network characteristics under different vertiport placement scenarios. Finally, Section 5 discusses the findings, academic contributions, and concluding remarks.

2. Literature Review

2.1. Location-Allocation Planning in Transportation: Traditional Approaches and Network Perspectives

Traditionally, the location of transportation infrastructure—particularly stops and stations—has been determined primarily through demand-based models and survey-driven analyses. Hensher (1994) provided a comprehensive overview of the practical application of stated preference (SP) analysis in mode choice studies, highlighting that demand forecasting based on user behavior data plays a central role in location decision-making [35,36]. Fulton and Hoch (1959) demonstrated that socioeconomic variables such as population distribution, employment centers, and commuting patterns have historically been key factors in determining the siting of transportation facilities [37]. In recent years, advancements in GIS-based spatial data, real-time traffic volumes, and mobile-based demand analytics have enabled data-driven approaches to site selection. For example, Ahas et al. (2017) conducted a multidimensional analysis of accessibility and efficiency in public transportation systems using spatial network data [38]. Considering the early stage of UAM development, traditional demand-based siting methodologies present inherent limitations when applied to vertiports.
Research on the characteristics of transportation networks has been continuously conducted. Jia et al. (2019) analyzed the public transportation network of Xi’an, selecting and optimizing the locations of public transport hubs [39]. They identified an imbalance in the network due to the excessively high centrality of certain hub nodes and proposed optimal hub locations to address this limitation. Hammad et al. (2021) proposed a conceptual framework for the establishment and operation of global logistics energy hubs and evaluated the efficiency of energy supply chains by utilizing network centrality and connectivity indicators [40]. Aydin et al. (2022) employed the WASPAS (weighted aggregated sum product assessment) methodology, which assigns appropriate weights to network centrality measures (degree centrality, betweenness centrality, and closeness centrality) to evaluate their significance and determine the optimal locations for sustainable urban mobility hubs [28]. Zhang et al. (2015) conducted a comparative analysis on how different transportation network topologies affect disaster response resilience, demonstrating that structures with higher average degree and cyclicity tend to exhibit greater robustness [41]. Similarly, Ganin et al. (2017), through an analysis of road networks in 40 U.S. cities, argued that efficiency and resilience are independent properties. By developing a model that incorporates network features, such as shortest path-based traffic load, population density, and commuting demand, they empirically showed that some cities, although inefficient under normal conditions, perform more robustly during disasters [42]. These studies suggest that transportation infrastructure siting plays a critical role in shaping network characteristics and highlight the importance of establishing strategic direction for initial vertiport siting, particularly by considering changes in the transportation network.

2.2. Airport Location-Allocation Strategies

For airport site selection, numerous studies have employed multi-criteria decision-making (MCDM) methodologies such as the analytic hierarchy process (AHP). Saaty (1980) established AHP as a systematic approach that decomposes complex decision-making problems into a hierarchical structure and derives the relative importance of factors through pairwise comparisons by experts [43]. Min (1994) applied AHP to the airport facility location problem in the United States, organizing key considerations for airport expansion into four hierarchical levels and analyzing the relative weight of each element [44]. Ballis (2003) proposed an MCDM-based evaluation model for airport siting using the island of Samothraki in Greece as a case study, incorporating factors such as local demand, tourism capacity, environmental impact, and technical feasibility [45].
Furthermore, a range of airport site selection studies have proposed more complex and sophisticated models beyond AHP. For instance, Liao and Bao (2014) proposed an airport site selection method using triangular fuzzy numbers to address complex multi-attribute decision-making problems [46]. Zhang et al. (2019) applied a multi-objective genetic algorithm to determine the optimal locations for general airports, designing a multi-objective optimization model that considers obstacle constraints and flight safety [47]. Sennaroglu et al. (2018) utilized the analytic hierarchy process (AHP) to determine the optimal locations for military airports, setting 9 primary criteria (e.g., climate, geographical features, infrastructure) and 33 sub-criteria for evaluation [48].
More recent studies have introduced hybrid or spatially enhanced approaches. For example, Zhao and Sun (2013) used lattice order decision making to integrate subjective judgment with normalized data [49], while Alves et al. (2020) developed the MESA (Metodologia de Escolha de Sítios Aeroportuários) framework for selecting regional airport locations in Brazil, integrating geographic information system (GIS) analysis with AHP [50]. Wang et al. (2016) proposed the PRIME-LS model, a probabilistic mobility-aware approach that introduced the MinMax Radius metric for candidate site filtering [51]. Gao et al. (2009) addressed the optimal location selection (OLS) problem in spatial databases by defining an optimization metric based on distances between spatial objects, refining and filtering candidate sites to enhance computational efficiency [52].
Existing literature on airport siting has predominantly focused on the formulation of decision variables and the advancement of methodological frameworks for site-specific evaluations. Nevertheless, in the absence of any operational vertiports, such approaches remain insufficient for application to vertiport site allocation at the current stage.

2.3. Strategic Approaches to Vertiport Location Allocation in the Context of UAM

While prior studies on airport location have primarily focused on defining decision variables and proposing optimization methodologies, these approaches often present limitations when directly applied to the early stages of UAM commercialization. In this nascent phase, uncertainties in demand forecasting, operational feasibility, and social acceptance necessitate a more strategic and adaptive approach to vertiport allocation. Rather than immediately pursuing detailed site selection, a broader framework that considers spatial structure, network integration, and systemic efficiency is needed.
To this end, several methodological studies have explored different perspectives on vertiport location strategies. Jiang et al. (2024) combined simulation-based optimization (SBO) with a machine learning-based surrogate model to solve the vertiport location optimization problem, applying their methodology to the San Francisco Bay Area [53]. Kotwicz et al. (2024) proposed a combinatorial optimization approach for vertiport placement in UAM services, aiming to maximize demand and minimize travel time [54]. Yoon et al. (2025) proposed a GIS-based methodology for optimizing vertiport locations in the Seoul Metropolitan Area by analyzing aviation restrictions and accessibility to existing transport systems, emphasizing that integration with current infrastructure significantly improves traffic efficiency and passenger satisfaction [55]. Rahman et al. (2023) employed a GIS-based approach to optimize vertiport placement by integrating them with existing public transportation networks [56]. Chae et al. (2023) developed a local search algorithm to explore optimal vertiport locations in the Seoul Metropolitan railway area, applying a mode choice model based on real transportation data to predict demand and employing partial search techniques to reduce computational complexity in site selection [57]. Kim and Park (2022) identified key decision factors, such as public acceptance and transportation network connectivity, through focus group interviews (FGI) and the analytic hierarchy process (AHP), establishing evaluation indicators based on expert judgment [58]. Cohen (1996) analyzed how vertiports could function as urban transportation hubs, ensuring seamless integration with rail, road, and air networks while emphasizing the challenges of site selection and community acceptance in Urban railway areas [59]. In addition to vertiport placement and operations, integrated technologies are increasingly important for the monitoring and maintenance of transportation infrastructure. Wang et al. (2024) proposed a multi-layered monitoring framework integrating satellite, drone, ground-based, and structural sensors, highlighting its potential to improve infrastructure sustainability through digital twin-based monitoring and optimized sensor deployment [60].
While much of the existing research has focused on defining objective functions and employing algorithm-based optimization techniques, Brunelli et al. (2023) conducted a systematic review comparing various vertiport design and location strategies [3]. Their findings indicate that achieving a balance between structural layout and urban transportation accessibility is central to UAM performance [3].
Within the scope of this study, we found that most existing research focuses on defining objective functions and establishing normative goals for optimization. However, some studies have argued that vertiport placement, taking into account accessibility and spatial layout, significantly affects UAM performance [3], highlighting the need to consider network characteristics. Taking these aspects into account, our network topology-based approach presents a new perspective that could contribute academically by shifting the existing paradigm of vertiport allocation.

3. Methodology

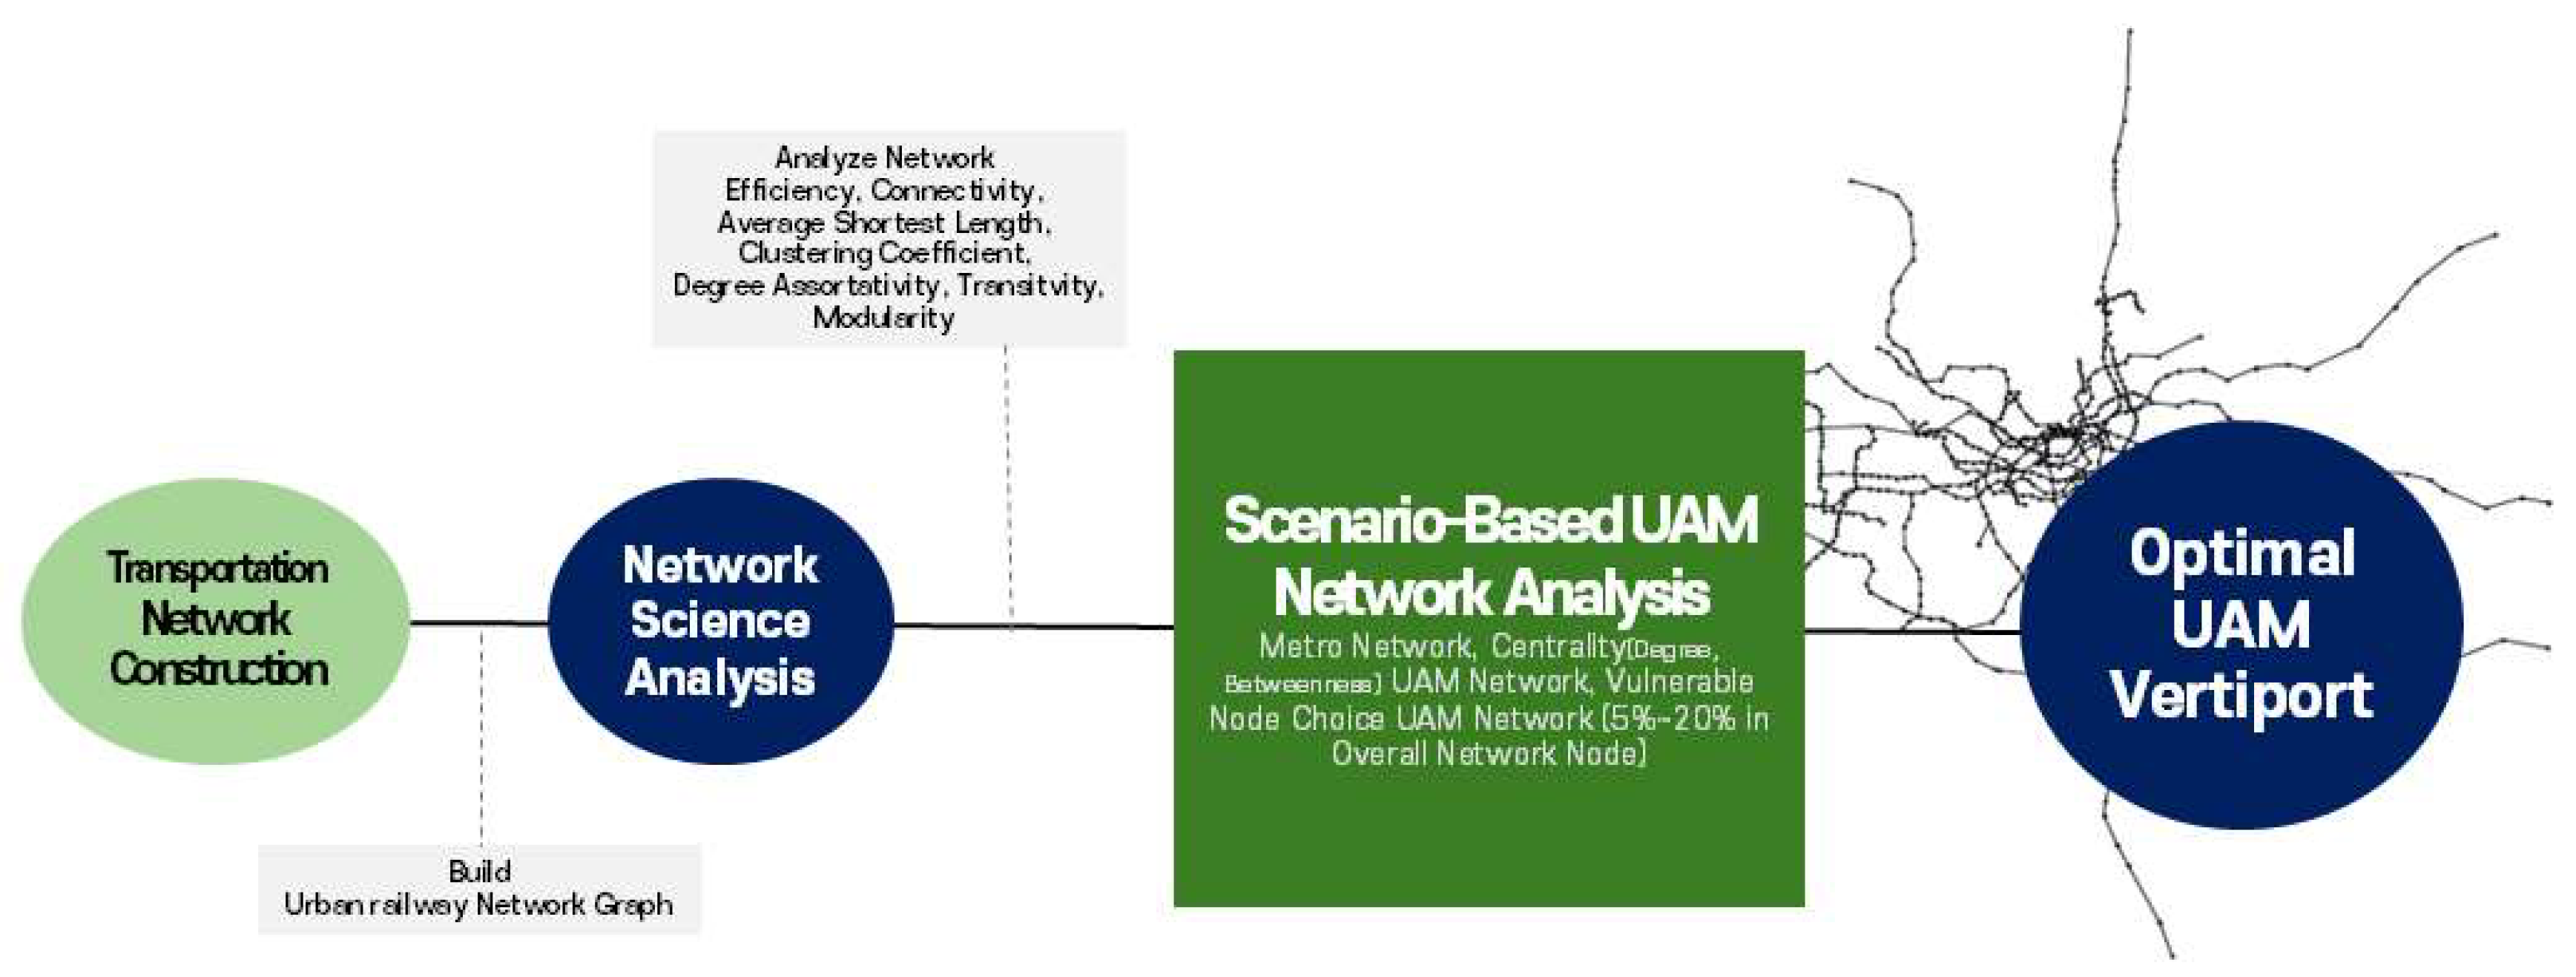
3.1. Overall Research Landscape

We propose a network topology-based methodology for the optimal allocation of vertiports’ locations. To evaluate the network, we establish global network efficiency, algebraic connectivity, and average shortest path length as key performance indicators, while average local clustering coefficient, transivity, degree assortativity, and modularity are set as metrics to assess structural changes in the network. The overall research procedure is illustrated in Figure 1.
The network indicators are analyzed using NetworkX 3.4.2, a Python 3.12.7 library that supports the examination of structural and topological properties of networks. Using the urban railway network of the Seoul Metropolitan Area as the baseline network, we formulate alternative strategies that prioritize nodes based on centrality and vulnerability, where higher indicator values correspond to higher priority for vertiport placement. Centrality is evaluated using degree centrality and betweenness centrality, while vulnerability is assessed using the metric proposed by Bozzo et al. (2015) [61].
For the centrality- and vulnerability-based strategies, we conduct simulations at 5% increments up to 20% to examine changes in network characteristics. Since this study approaches vertiport allocation from a network perspective, a 20% upper bound is considered a realistic maximum and is deemed appropriate for analyzing variations in network indicators.

3.2. Network Topology Analysis Methodology

The network efficiency metric is a methodology for analyzing the link structure between nodes in a system, and it is widely utilized to quantitatively assess the characteristics of various complex networks. Originally introduced by Latora and Marchiori (2001), this metric has been extensively validated and applied in a wide range of disciplines [62]. Vragović et al. (2005) applied the efficiency metric to a real-world transportation network, the subway system, and empirically demonstrated its effectiveness in explaining both the structural properties and functional performance of the network [63]. The efficiency metric used in this study is defined as follows:
E f f i c i e n c y = 1 N ( N 1 ) i j 1 d i j
  • N : Number of nodes;
  • d i j : Shortest path length between node i and j.
The connectivity metric, which measures how effectively all nodes within the network remain connected, is based on Menger’s Theorem [64]. This metric evaluates the extent to which a network remains intact when specific nodes or edges are removed. Connectivity is expressed as follows:
(1)
Connectivity of Nodes
m i n ( S   : S V ,   G S   i s   s e p a r a t e d )
  • S : Minimum set of nodes that must be removed to disconnect the network;
  • V : Set of all nodes in graph G .
(2)
Connectivity of Edges
m i n ( F   : F E ,   G F   i s   s e p a r a t e d )
  • F : Minimum set of edges that must be removed to disconnect the network;
  • E : Set of all edges in graph G.
In addition, it defined the average shortest path length as the mean of the shortest distances between all pairs of nodes in a network. A lower average shortest path length indicates a network structure that facilitates efficient information transmission and overall higher connectivity. The shortest path length has been widely used to quantitatively evaluate the performance of transportation networks. Derrible and Kennedy (2010) employed the average shortest path length to analyze subway networks in major global cities, using it to assess both network efficiency and resilience to disruptions [65]. Their study empirically demonstrated that shorter path lengths indicate better accessibility and a more robust network structure [65].
A v e r a g e   S h o r t e s t   P a t h   L e n g t h   =   1 N ( N 1 ) i j d i j
  • N : Number of nodes;
  • d i j : Shortest path length between node i and j.
Watts and Strogatz (1998) introduced the concept of the clustering coefficient, which quantifies the proportion of triangles formed within a network [66]. The clustering coefficient measures the extent to which a given node’s neighbors are interconnected, with higher values indicating a greater degree of local connectivity. Lee et al. (2017) analyzed the spatial structure and transportation efficiency of road networks using average shortest path length, network centrality, and the clustering coefficient [67].
This metric is particularly useful for assessing the local structural properties of a network.
Clustering   Coefficient   =   2 E i k i ( k i 1 )
  • E i : Number of triangles formed by the neighbors of node I ;
  • k i : Degree of node i.
Fiedler (1973) introduced the concept of algebraic connectivity to assess the robustness of a network [68]. Wei et al. (2014) analyzed reinforcement strategies for real-world air transportation networks using algebraic connectivity and demonstrated that this metric serves as a useful quantitative criterion for assessing network robustness [69]. Algebraic connectivity is defined as the second-smallest eigenvalue of the network’s Laplacian matrix. A lower algebraic connectivity value suggests a higher likelihood of network fragmentation, indicating a greater susceptibility to disconnection:
A l g e b r i c   C o n n e c t i v i t y   =   λ 2
  • λ 2 : Second smallest eigenvalue of the network’s Laplacian matrix.
Newman (2002) introduced the concept of degree assortativity to quantitatively analyze the tendency of nodes with similar degree to form connections [70]. Chang et al. (2007) demonstrated through the analysis of collaboration networks that the assortativity metric is effective in explaining the structure and evolution of network connectivity and that the presence of assortativity in real-world networks reflects meaningful structural characteristics [71].
This measure enables the evaluation of whether a network exhibits homophily (high assortativity, where nodes of similar degree tend to connect) or heterophily (low assortativity, where nodes of different degrees are more likely to be connected).
D e g r e e   A s s o r t a t i v i t y   =   i j A i j k i k j 1 M i k i 2 i k i 2 1 M i k i 2
  • k i : Degree of node i
  • A i j : 1 if nodes i and j are connected; otherwise, 0;
  • M : Number of overall edges.
Newman (2003) proposed the concept of transitivity, which measures the proportion of triangular structures at the global network level [72]. While transitivity is conceptually similar to the clustering coefficient, it is computed for the entire network rather than individual nodes. A recent study analyzing public transportation networks from the perspective of complex systems demonstrated that transitivity is effective in quantifying the cohesiveness of local structures and the hierarchical characteristics of networks [73]. This metric was shown to serve as a critical indicator for understanding structural differences between hub and non-hub nodes [73]. A high transitivity value indicates a greater prevalence of triangular formations, suggesting a strong overall clustering tendency within the network.
T r a n s i t i v i t y   =   3 × N u m b e r   o f   t r i a n g l e s N u m b e r   o f   c o n n e c t e d   t r i p l e t s
Newman (2006) introduced modularity as a quantitative measure of community structure in networks [74]. Modularity evaluates the extent to which a network is partitioned into distinct communities, where high modularity values indicate well-defined groups of nodes. A recent study analyzing the global maritime transportation network employed the modularity metric to identify region-based modular structures and the strategic importance of gateway hubs connecting them. The study demonstrated that this modular configuration has a strong correlation with overall network integration and functional performance (e.g., trade volume) [75]. Given the demonstrated relevance of modularity in understanding network integration and performance, this study adopts it as a metric to assess the structural characteristics of functional subgroups and to identify strategically significant vertiport locations. This metric captures the balance between intra-community links (connections within the same community) and inter-community links (connections between different communities), with higher values implying stronger community structures characterized by dense internal connectivity and sparse external connections.
M o d u l a r i t y   =   1 2 M i j [ A i j k i k j 2 M ] × δ ( c i , c j )
  • A i j : Adjacency matrix indicating whether nodes i and j are connected;
  • k i ,   j : Degree of node i and j;
  • M : Number of overall edges;
  • δ ( c i , c j ) : 1 if nodes i and j belong to the same community; otherwise, 0.

3.3. Node Centrality and Vulnerability Assessment Methodology Based on Network Topology

Freeman, Linton C. (2002) defined centrality as a metric that quantifies the importance of specific nodes within a network based on graph theory [76]. Centrality indicates the position and role of a node within the network and serves as a fundamental concept in network structure analysis. In particular, degree centrality and betweenness centrality were proposed as key centrality measures. Degree centrality measures the number of direct connections a node has, with a higher degree centrality indicating that the node is highly connected and serves as a key hub within the network. It is defined as follows:
D e g r e e   C e n t r a l i t y = i = 1 n U ( p i ,   p k )
  • P i , P k : Node i ,   k ;
  • U ( p i , p k ) : 1 if nodes i and k are connected; otherwise, 0.
Betweenness centrality measures how often a node appears on the shortest paths between other nodes. A node with high betweenness centrality plays a crucial role in information transmission and acts as a key controller within the network. It is defined as follows:
B e t w e e n n e s s   C e n t r a l i t y =   s v t σ s t ( v ) / σ s t
  • σ s t : Number of shortest paths between node s and node t;
  • σ s t ( v ) : Number of shortest paths between node s and node t that pass through node v.
Bozzo et al. (2015) proposed a vulnerability metric that quantifies the vulnerability of a node by assessing the number of neighboring nodes it is connected to. A node is considered vulnerable if it has relatively fewer connections to the rest of the network compared to its immediate neighborhood. A positive vulnerability value indicates that the selected node is relatively isolated from its neighboring nodes [61]. The vulnerability metric is defined as follows:
V u l n e r a b i l i t y   =   T N ( T )
  • T : Selected set of nodes
  • N ( T ) : Neighboring nodes of T

4. Results

4.1. Base Network

To analyze the transportation network, we employed the urban rail network for the Seoul Metropolitan Area in 2022, which is sourced from the Korean Transport Database (KTDB). KTDB is a data package that officially provides transportation networks, ODs, etc., for transportation demand analysis by the Korean government. We constructed a rail transit network graph by mapping out the nodes and links of urban rail systems, taking into account their distinct types.
The network graph, constructed using nodes and links categorized by type, encompasses 834 nodes and 1018 links specifically for urban rail systems. In comparison, the rail network, which incorporates interregional railway lines and differs from urban railway systems, spans a more extensive configuration with 1924 nodes and 2058 links. Table 1 presents the configuration of the networks under analysis. Figure 2 shows the urban railway network, which is structured as a vast interconnected system.
Table 2 presents the results of the network topology analysis for the base network. The given indices represent the values of the initial strategy (0%) in which vertiports have not been introduced, serving as the baseline for scenario-based evaluations of vertiport implementation. The network in the Seoul Metropolitan Area is found to be fragmented, with low connectivity strength and a homogeneous structure, resembling a tree-like random network while exhibiting a distinct community structure.
The base network’s global efficiency, which ranges from 0 to 1, is found to be close to 0, indicating long paths or high fragmentation within the network. The algebraic connectivity value is also close to 0, suggesting weak connectivity and a high risk of disconnection if edges are removed. Degree assortativity is significantly greater than 0, implying that the network exhibits homophilic characteristics. The local clustering coefficient is close to 0, suggesting a tree-like structure and a tendency toward a random network. Additionally, the transitivity index indicates that the overall network does not have a high level of clustering.
In contrast, the modularity index is close to 0.9, indicating that the overall network has a well-defined community structure.

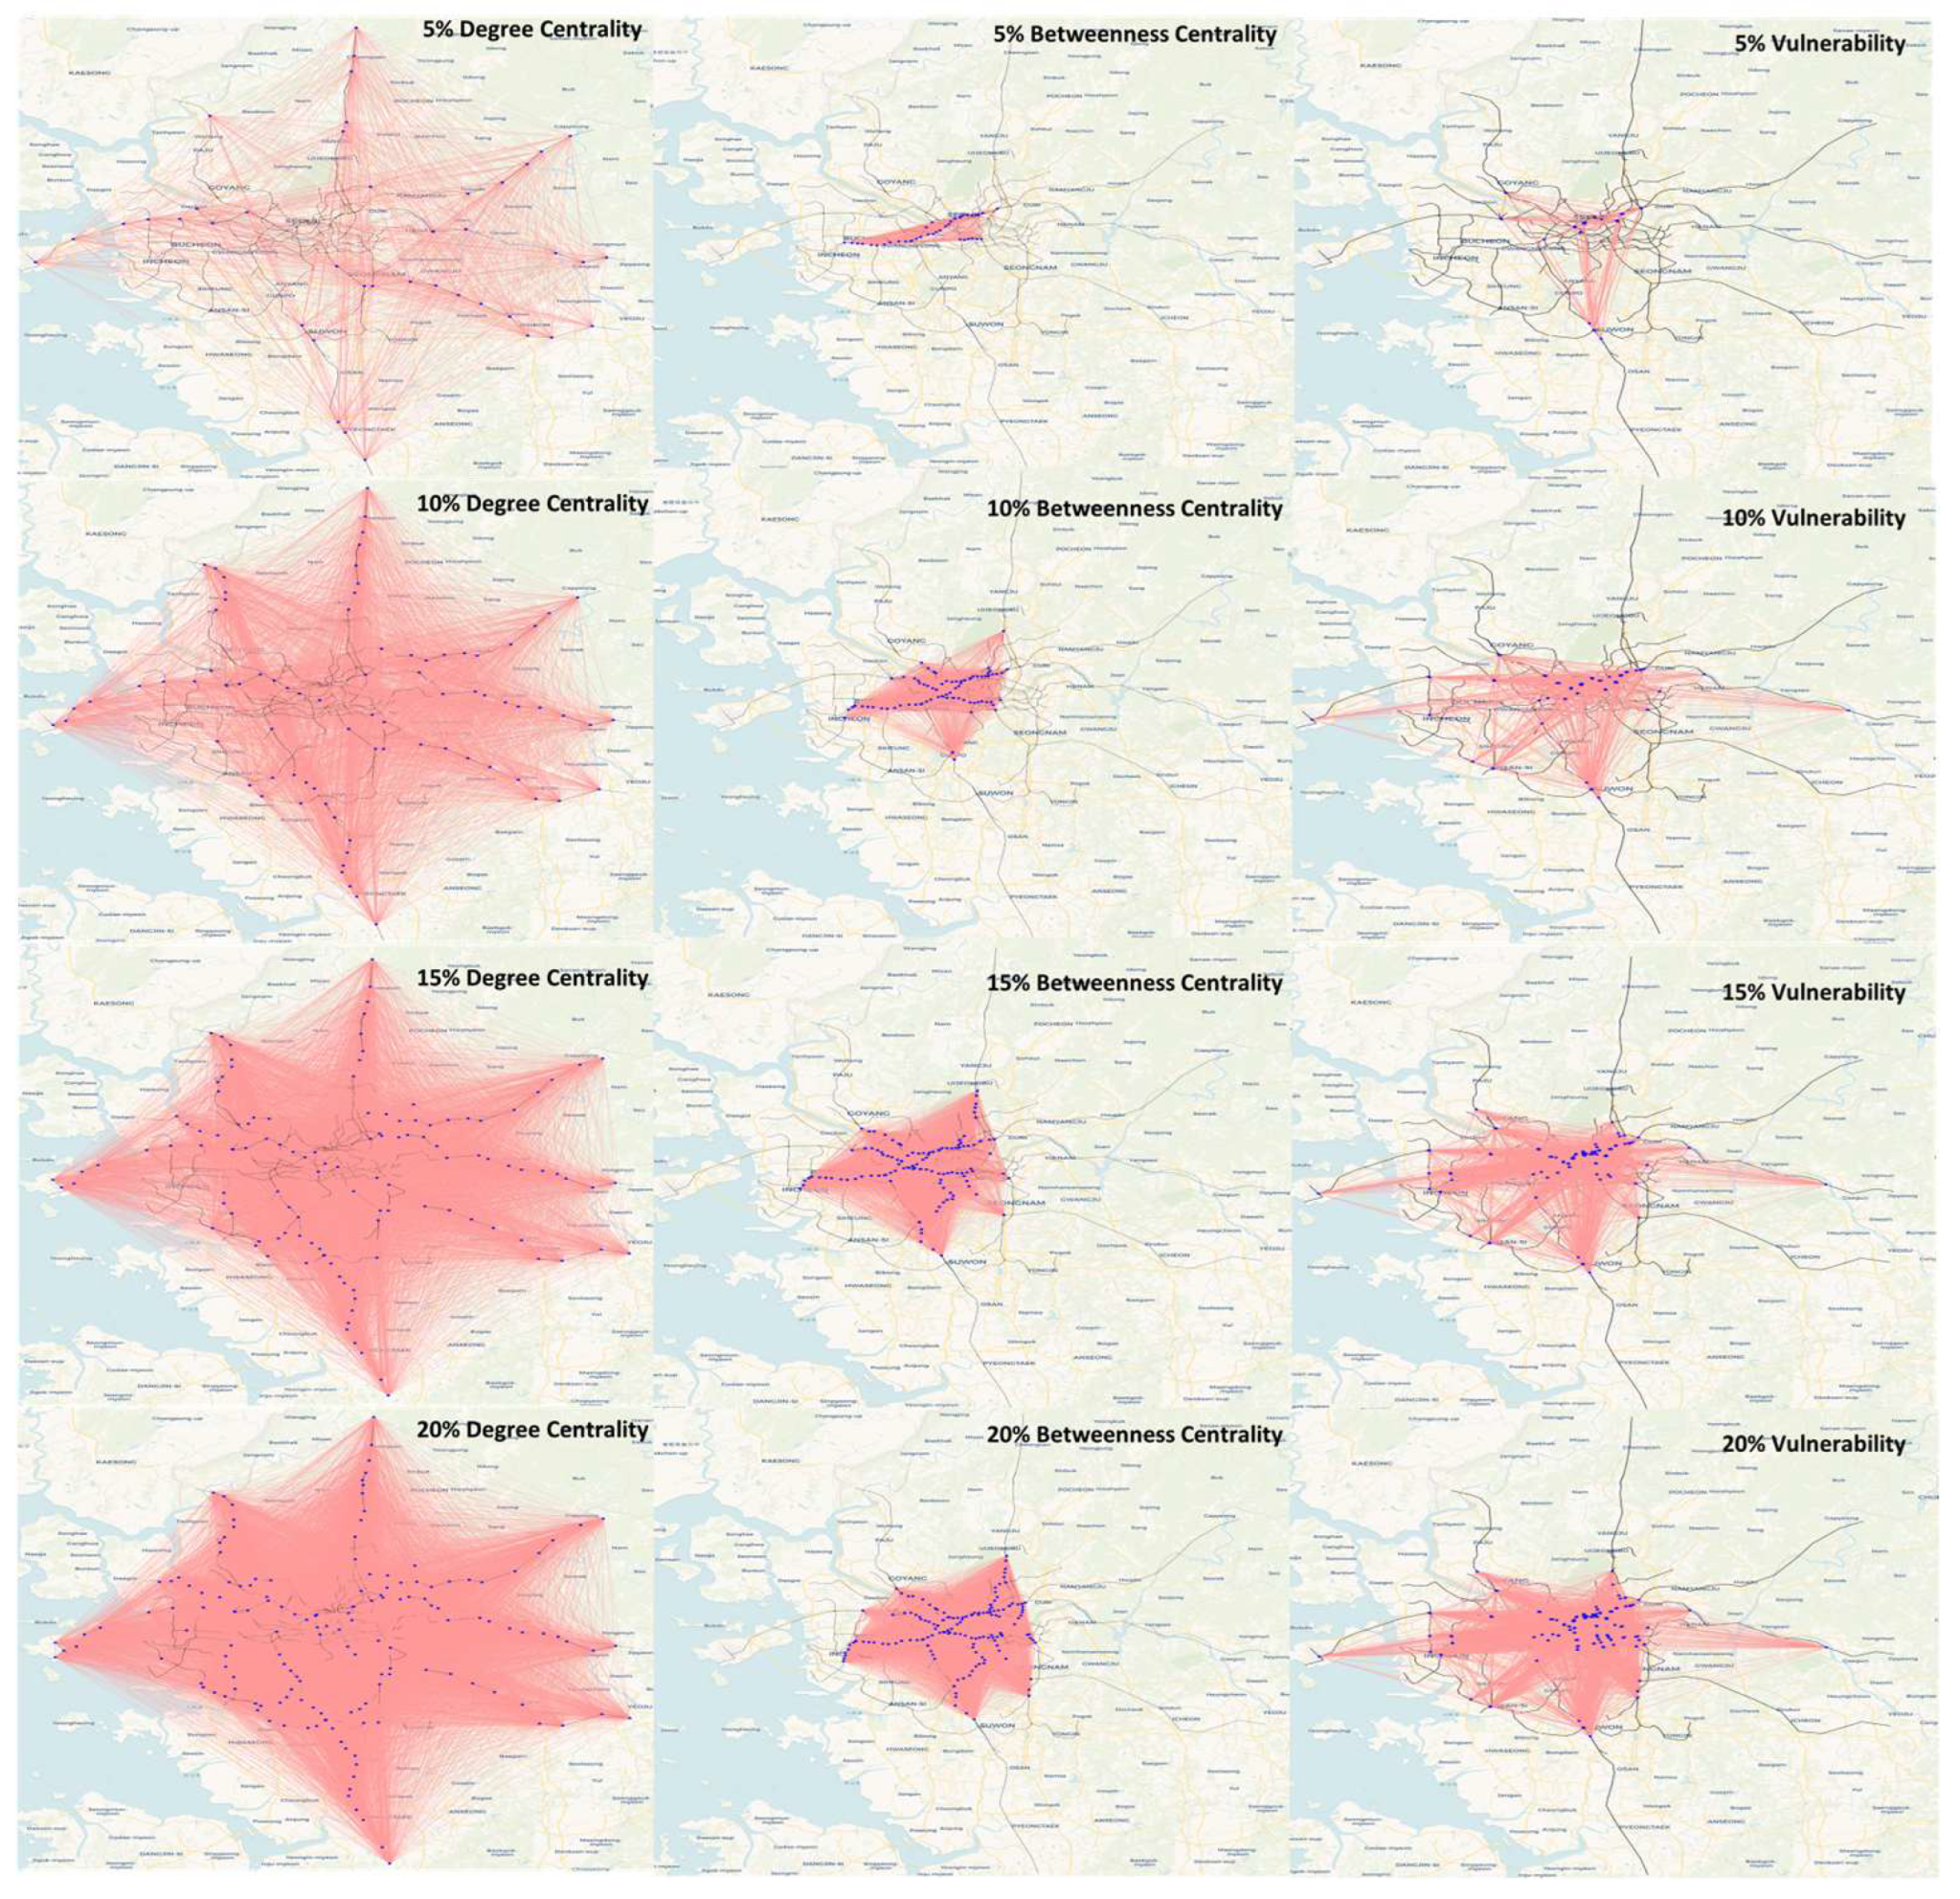
4.2. Scenario Evaluation Outcomes

The global efficiency increased in all three strategies—betweenness, degree centrality, and vulnerability—compared to the baseline network. Specifically, under the betweenness-based strategy (hereafter referred to as the betweenness scenario), global efficiency increased from approximately 0.087 to 0.200; under the degree centrality-based strategy (hereafter referred to as the degree scenario), it increased from 0.089 to 0.217; while under the vulnerability-based strategy (hereafter referred to as the vulnerability scenario), it increased from 0.096 to 0.238 (Table 3).
The placement of vertiports based on the vulnerability scenario reduces path lengths and mitigates network fragmentation more effectively than the betweenness and degree scenarios, leading to a maximum 19% higher global efficiency. When vertiports are installed at 20% of urban railway stations, global efficiency improves by 292% compared to the baseline network, resulting in a fundamentally different network in terms of efficiency.
Thus, the network under the vulnerability scenario exhibits relatively higher efficiency than those under the betweenness and degree scenarios. This suggests that prioritizing vertiport allocation at vulnerable nodes can shorten travel distances and address network fragmentation. In contrast, the betweenness scenario results in a network structure where central nodes are well-connected but with relatively lower efficiency. The degree scenario positions global efficiency between the other two strategies.
An analysis of the average shortest path length without assigning weights such as link distance revealed that in the scenario where vertiports are installed at 5% of urban railway stations, the average shortest path length was 17.3005 for the betweenness scenario, 16.0882 for the degree scenario, and 15.8778 for the vulnerability scenario (Table 4). This ranking remained unchanged even with an increase in vertiport placement up to 20%.
Additionally, even with vertiports installed at just 5% of urban railway stations, the average shortest path length decreased by 28.5%. As vertiport placement increased, the shortest path length continued to decrease, aligning with intuitive expectations. Similar to the minimum global efficiency index, the vulnerability scenario proved to be the most advantageous strategy from the perspective of average shortest path length.
In the scenario where 5% of all stations are equipped with vertiports, the algebraic connectivity index is higher than that of the baseline network, with values of 0.00293 for the betweenness scenario, 0.00356 for the degree scenario, and 0.00326 for the vulnerability scenario (Table 5). Connectivity continues to increase as vertiport placement reach 20%, and the relative ranking among the scenarios remains unchanged.
The degree scenario exhibits a relatively higher algebraic connectivity among the three strategies. The vulnerability scenario falls between the betweenness and the degree scenario in terms of connectivity. The fact that the vulnerability scenario ranks between the degree and the betweenness scenarios in terms of connectivity suggests that prioritizing vertiport placement based on vulnerability may lead to higher network connectivity than scenarios that allocate vertiports based solely on centrality measures.
The baseline network has a low local clustering coefficient, making it closer to a tree-structured random network. When vertiports are installed, the clustering coefficient increases across all scenarios compared to the baseline network, indicating a significant impact of intentional vertiport placement.
Among the scenarios, the betweenness scenario exhibits the highest clustering coefficient, though the difference compared to the other scenarios is not substantial. Table 6 illustrates these changes in the clustering coefficient.
Table 7 presents the transitivity index, which reflects the overall clustering of the network, in contrast to the clustering coefficient. In the scenario where 5% of all stations are equipped with vertiports, the betweenness scenario records the highest transitivity value at 0.91335, followed by the degree scenario (0.89679) and the vulnerability scenario (0.87188).
Notably, these values represent a 380% increase from the baseline network’s transitivity index of 0.18, indicating that vertiport installation enhances clustering across the entire network. This suggests that the network structure may transition into a small-world network, which aligns with the expectation that vertiport implementation leads to shorter average path lengths.
In the 20% vertiport installation scenario, transitivity approaches 1, further reinforcing the small-world network characteristics, suggesting a stronger clustering effect as vertiport density increases.
The modularity index, which evaluates the community structure of the network, is 0.879 in the baseline network. When vertiports are installed at 5% of all stations, the modularity decreases to a range of 0.657–0.688, and as the installation rate increases to 20%, it further declines to 0.609–0.771 (Table 8). This indicates a sharp decrease in modularity as vertiport placement increases.
This trend suggests that while urban rail networks traditionally maintain strong community structures along individual lines, the installation of vertiports accelerates inter-community connections, diminishing the network’s tendency to form small, isolated groups. The rate of this change varies among the betweenness, the degree, and the vulnerability scenarios, highlighting differences in how each strategy impacts the network’s community structure.
Table 9 presents the results of the degree assortativity analysis. The findings indicate that even with only 5% of stations equipped with vertiports, homophilic connectivity (the tendency for nodes with similar degrees to connect) significantly increases compared to the baseline network. However, as vertiport placement continue to rise, degree assortativity gradually decreases.
Among the scenarios, the betweenness scenario exhibits a slower decline in degree assortativity compared to the other scenarios, whereas the vulnerability scenario shows a faster decrease in homophilic connectivity.
Table 10 presents the two-way ANOVA results for the network indicators under different strategies and ratios. We conduct a two-way ANOVA to determine if different network strategies (global efficiency, degree centrality, and vulnerability) result in significant variations in network indicators. The results showed that at the 0.05 significance level, most indicators demonstrated statistically significant differences for both the strategy and ratio factors. All indicators demonstrated statistically significant differences between strategies at the 10% significance level, supporting the rejection of the null hypothesis. Therefore, the selected indicators are confirmed to be meaningful criteria for identifying and explaining the structural characteristics of different network strategies.

4.3. Comprehensive Analysis Findings

Figure 3 visually illustrates the changes in the network structure for each scenario as the proportion of vertiport placement increases. All scenarios exhibit distinct vertiport placement patterns.
In the degree scenario, the network is formed over the widest range, indicating a more evenly distributed connectivity pattern. The vulnerability scenario falls in an intermediate range among the three but displays more distinct connection lines compared to the other scenarios. The betweenness scenario shows the narrowest connectivity range, with broader inter-vertiport connections forming within this confined area.
These findings highlight that vertiport allocation strategies can significantly influence future network characteristics, demonstrating the importance of strategic planning in determining the overall network structure.
Figure 4 shows a comparative analysis of efficiency, connectivity, and average shortest path length. The results indicate that as the proportion of vertiport placement increases, all metrics show improvement; efficiency and connectivity indices increase, while the average shortest path length decreases.
From the perspective of efficiency and average shortest path length, the vulnerability scenario proves to be the most advantageous. In terms of connectivity, the degree scenario performs the best. Additionally, the vulnerability scenario demonstrates higher connectivity than the betweenness scenario.
These findings suggest that vulnerability should be a key consideration in developing vertiport allocation strategies as it plays a crucial role in enhancing both efficiency and network integration.
The network structural metrics presented in Table 6, Table 7, Table 8 and Table 9 indicate that vertiport placement are expected to significantly reshape the existing network structure. Even when disregarding the unique characteristics of urban air mobility (UAM), which differ from conventional transportation modes, substantial changes are anticipated.
Therefore, we recognize that traditional methodologies for location allocation, such as objective function-based approaches, expert judgment, and multi-criteria evaluation techniques, have limitations at this stage due to the high uncertainty of UAM characteristics. This underscores the necessity of incorporating network structural changes into vertiport allocation strategies to ensure an effective and adaptive planning approach.

5. Discussion and Conclusions

We propose a strategic framework for vertiport location allocation from a network structural perspective, offering a distinct alternative to conventional location-allocation approaches that are primarily based on localized optimization. While prior research has attempted to determine specific site locations despite the uncertainty surrounding UAM (e.g., aircraft types, flight operations, takeoff and landing requirements), we emphasize a methodology grounded in network analysis that accommodates such uncertainty during the early stages of commercialization.
Evaluating the potential structural transformation of urban transportation networks resulting from vertiport placement is essential for maximizing synergies with existing modes and alleviating congestion. Accordingly, we construct and compare vertiport allocation scenarios based on key network criteria (degree centrality, betweenness centrality, vulnerability) using the Seoul Metropolitan Subway as a reference network. Statistical analyses confirm that performance indicators vary significantly across strategies, thereby supporting the relevance of a network-oriented approach for early-stage vertiport planning within multimodal urban mobility systems.
We have determined that a network-oriented approach must be prioritized for vertiport location allocation. The placement of vertiports, considering centrality and vulnerability, significantly influences both the clustering and scalability of the network. As the proportion of vertiports in the network increases, the small-world property of the network strengthens rapidly, confirming that the introduction of a vertiport network can fundamentally alter the structure of Seoul Metropolitan railway transportation system. Additionally, we estimate that the network undergoes significant structural transformations as vertiport placement increase. Furthermore, the arbitrary allocation of vertiports introduces substantial uncertainty in the changes to clustering and scalability, reaffirming the necessity of a network-aware vertiport siting strategy. At this stage, before the construction of the first commercial vertiports, strategic decision-making regarding future network transformations is of paramount importance.
We argue that both centrality and vulnerability must be considered in vertiport allocation. Using the transportation network of the Seoul Metropolitan Area, we assessed strategies prioritizing either centrality or vulnerability by evaluating network efficiency, connectivity, and average shortest path length. The strategy of selecting nodes with high degree centrality outperformed the vulnerability-based approach in terms of network connectivity. From the perspective of network efficiency and average shortest path length, prioritizing nodes with high vulnerability indicators was found to be more advantageous.
These findings suggest that strategies prioritizing nodes with high centrality may enhance network connectivity but could also lead to structural imbalances by overburdening critical nodes. In contrast, we propose that allocating vertiports to structurally vulnerable nodes offers a viable alternative, promoting greater resilience and enabling more balanced network expansion in the context of urban transportation systems.
Since network efficiency is a crucial metric for identifying robust alternatives under future uncertainties [58], and since our analysis showed that vulnerability-based network scenarios resulted in higher efficiency scores, we verified that considering vulnerability is essential in vertiport location-allocation strategies to minimize potential losses and balance trade-offs among alternatives. Within the scope of our review, we found that previous studies have primarily focused on connectivity in vertiport site selection [77,78,79,80]. Therefore, we anticipate that this study provides an academic contribution by revealing that neglecting vulnerability leads to suboptimal solutions in terms of network efficiency.
Our methodology addresses the early-stage formation of vertiport networks, where no facilities currently exist and operational, technological, and regulatory standards remain undefined. As the UAM ecosystem evolves and concrete requirements emerge, future studies should extend this work by incorporating detailed constraints and developing site-specific optimization models. While our analysis is based on the urban railway network under infrastructure and airspace assumptions, we expect our findings to offer strategic insights for integrating UAM with existing modes through future research on modal interaction, demand shifts, and transfer connectivity.
As the commercialization of UAM becomes more tangible, vertiport placement is expected to become a critical factor in urban mobility planning. In this context, we expect that this study will serve as a foundation for integrating UAM into multi-modal urban transportation systems, contributing to its successful establishment as a viable urban mobility solution.

Author Contributions

Conceptualization, K.-H.S.; methodology, K.-H.S. and H.L.; software, K.-H.S. and H.L.; investigation, H.L.; resources, H.L.; formal analysis, K.-H.S. and H.L.; data curation, H.L.; writing—original draft preparation, H.L. and K.-H.S.; writing—review and editing, K.-H.S. and H.L.; supervision, K.-H.S.; project administration K.-H.S. All authors have read and agreed to the published version of the manuscript.

Funding

This research was supported by Seoul National University of Science and Technology.

Institutional Review Board Statement

Not applicable.

Informed Consent Statement

Not applicable.

Data Availability Statement

Publicly available datasets were analyzed in this study. This data can be found at the Korea Transport Database (KTDB): https://www.ktdb.go.kr/www/newAddPbldataReqstData.do?key=202&clTy=1.

Conflicts of Interest

The authors declare no conflicts of interest.

References

  1. Zhao, Y.; Feng, T. Strategic integration of vertiport planning in multimodal transportation for urban air mobility: A case study in Beijing, China. J. Clean. Prod. 2024, 467, 142988. [Google Scholar]
  2. Mendonca, N.; Murphy, J.; Patterson, M.D.; Alexander, R.; Juarex, G.; Harper, C. Advanced air mobility vertiport considerations: A list and overview. In Proceedings of the AIAA AVIATION 2022 Forum, Chicago, IL, USA, 27 June–1 July 2022; p. 4073. [Google Scholar]
  3. Brunelli, M.; Ditta, C.C.; Postorino, M.N. New infrastructures for Urban Air Mobility systems: A systematic review on vertiport location and capacity. J. Air Transp. Manag. 2023, 112, 102460. [Google Scholar]
  4. Rothfeld, R.; Fu, M.; Balać, M.; Antoniou, C. Potential urban air mobility travel time savings: An exploratory analysis of munich, paris, and san francisco. Sustainability 2021, 13, 2217. [Google Scholar] [CrossRef]
  5. Chen, S.; Zhuang, D. Evolution and evaluation of the Guangzhou metro network topology based on an integration of complex network analysis and GIS. Sustainability 2020, 12, 538. [Google Scholar] [CrossRef]
  6. Park, C.; Sohn, S.Y. An optimization approach for the placement of bicycle-sharing stations to reduce short car trips: An application to the city of Seoul. Transp. Res. Part A Policy Pract. 2017, 105, 154–166. [Google Scholar] [CrossRef]
  7. Mohring, H. Optimization and scale economies in urban bus transportation. Am. Econ. Rev. 1972, 62, 591–604. [Google Scholar]
  8. Mandl, C.E. Evaluation and optimization of urban public transportation networks. Eur. J. Oper. Res. 1980, 5, 396–404. [Google Scholar]
  9. Archetti, C.; Peirano, L.; Speranza, M.G. Optimization in multimodal freight transportation problems: A Survey. Eur. J. Oper. Res. 2022, 299, 1–20. [Google Scholar] [CrossRef]
  10. Ríos-Mercado, R.Z.; Borraz-Sánchez, C. Optimization problems in natural gas transportation systems: A state-of-the-art review. Appl. Energy 2015, 147, 536–555. [Google Scholar]
  11. Zitrický, V.; Gašparík, J.; Pečený, L. The methodology of rating quality standards in the regional passenger transport. Transp. Probl. 2015, 10, 59–72. [Google Scholar]
  12. Abramović, B.; Zitricky, V.; Biškup, V. Organisation of railway freight transport: Case study CIM/SMGS between Slovakia and Ukraine. Eur. Transp. Res. Rev. 2016, 8, 1–13. [Google Scholar] [CrossRef]
  13. Bukvić, L.; Pašagić Škrinjar, J.; Abramović, B.; Zitrický, V. Route selection decision-making in an intermodal transport network using game theory. Sustainability 2021, 13, 4443. [Google Scholar] [CrossRef]
  14. Stopka, O.; Zitricky, V.; Abramović, B.; Marinov, M.V.; Ricci, S. Innovative technologies for sustainable passenger transport. J. Adv. Transp. 2019, 2019, 1–2. [Google Scholar]
  15. Chen, M.; Lu, H. Analysis of transportation network vulnerability and resilience within an urban agglomeration: Case study of the greater Bay Area, China. Sustainability 2020, 12, 7410. [Google Scholar] [CrossRef]
  16. Liu, Y.; Wang, M.; Wang, Y. Location decision of emergency medical supply distribution centers under uncertain environment. Int. J. Fuzzy Syst. 2024, 26, 1567–1603. [Google Scholar]
  17. Bulková, Z.; Čamaj, J.; Šperka, A.; Jursová, S. Simulation of travel document purchase measures aimed at preventing the spread of COVID-19–Case study from Slovakia. Transp. Res. Interdiscip. Perspect. 2023, 20, 100853. [Google Scholar]
  18. Čamaj, J.; Nedeliaková, E.; Šperka, A.; Ližbetinová, L. The planning of investment activities in field of railway transport with support of simulation tools. Transp. Res. Procedia 2021, 53, 39–49. [Google Scholar]
  19. Mašek, J.; Kolarovszki, P.; Čamaj, J. Application of RFID technology in railway transport services and logistics chains. Procedia Eng. 2016, 134, 231–236. [Google Scholar]
  20. Gerhátová, Z.; Zitrický, V.; Klapita, V. Industry 4.0 implementation options in railway transport. Transp. Res. Procedia 2021, 53, 23–30. [Google Scholar]
  21. Wu, Q.; Li, Y.; Dan, P. Optimization of urban rail transit station spacing for minimizing passenger travel time. J. Rail Transp. Plan. Manag. 2022, 22, 100317. [Google Scholar]
  22. Macias, J.E.; Khalife, C.; Slim, J.; Angeloudis, P. An integrated vertiport placement model considering vehicle sizing and queuing: A case study in London. J. Air Transp. Manag. 2023, 113, 102486. [Google Scholar]
  23. Tuncal, A. Operational Challenges and Prioritization of Potential Solutions for Integrating Vertiports into Airports. Türkiye İnsansız Hava Araçları Derg. 2024, 6, 42–55. [Google Scholar] [CrossRef]
  24. Kopardekar, P.; Rios, J.; Prevot, T.; Johnson, M.; Jung, J.; Robinson, J.E. Unmanned aircraft system traffic management (UTM) concept of operations. In Proceedings of the AIAA AVIATION Forum and Exposition, Washington, DC, USA, 13–17 June 2016. [Google Scholar]
  25. Schweiger, K.; Preis, L. Urban air mobility: Systematic review of scientific publications and regulations for vertiport design and operations. Drones 2022, 6, 179. [Google Scholar] [CrossRef]
  26. Liu, J.; Lu, H.; Chen, M.; Wang, J.; Zhang, Y. Macro perspective research on transportation safety: An empirical analysis of network characteristics and vulnerability. Sustainability 2020, 12, 6267. [Google Scholar] [CrossRef]
  27. Koumoutsidi, A.; Pagoni, I.; Polydoropoulou, A. A new mobility era: Stakeholders’ insights regarding urban air mobility. Sustainability 2022, 14, 3128. [Google Scholar] [CrossRef]
  28. Aydin, N.; Seker, S.; Özkan, B. Planning location of mobility hub for sustainable urban mobility. Sustain. Cities Soc. 2022, 81, 103843. [Google Scholar]
  29. Lazari, V.; Chassiakos, A. Multi-objective optimization of electric vehicle charging station deployment using genetic algorithms. Appl. Sci. 2023, 13, 4867. [Google Scholar] [CrossRef]
  30. Rouhana, F.; Jawad, D. Transportation network resilience against failures: GIS-based assessment of network topology role. Int. J. Disaster Resil. Built Environ. 2021, 12, 357–370. [Google Scholar]
  31. Perera, P.; Hewage, K.; Sadiq, R. Electric vehicle recharging infrastructure planning and management in urban communities. J. Clean. Prod. 2020, 250, 119559. [Google Scholar]
  32. Hong, J.; Tamakloe, R.; Lee, S.; Park, D. Exploring the topological characteristics of complex public transportation networks: Focus on variations in both single and integrated systems in the Seoul Metropolitan Area. Sustainability 2019, 11, 5404. [Google Scholar] [CrossRef]
  33. Lim, E.; Hwang, H. The selection of vertiport location for on-demand mobility and its application to Seoul metro area. Int. J. Aeronaut. Space Sci. 2019, 20, 260–272. [Google Scholar] [CrossRef]
  34. Akbarzadeh, M.; Memarmontazerin, S.; Derrible, S.; Salehi Reihani, S.F. The role of travel demand and network centrality on the connectivity and resilience of an urban street system. Transportation 2019, 46, 1127–1141. [Google Scholar] [CrossRef]
  35. Hensher, D.A. Stated preference analysis of travel choices: The state of practice. Transportation 1994, 21, 107–133. [Google Scholar] [CrossRef]
  36. Leitham, S.; McQuaid, R.W.; Nelson, J.D. The influence of transport on industrial location choice: A stated preference experiment. Transp. Res. Part A Policy Pract. 2000, 34, 515–535. [Google Scholar] [CrossRef]
  37. Fulton, M.; Hoch, L.C. Transportation factors affecting locational decisions. Econ. Geogr. 1959, 35, 51–59. [Google Scholar] [CrossRef]
  38. Ahas, R.; Krisp, J.M.; Toivonen, T. Methodological aspects of using geocoded data from mobile devices in transportation research. J. Locat. Based Serv. 2017, 11, 75–77. [Google Scholar] [CrossRef]
  39. Jia, G.-L.; Ma, R.-G.; Hu, Z.-H. Urban transit network properties evaluation and optimization based on complex network theory. Sustainability 2019, 11, 2007. [Google Scholar] [CrossRef]
  40. Hammad, M.A.; Elgazzar, S.; Sternad, M. A Conceptual Framework to Establish and Operate a Global Logistics Energy Hub. Sustainability 2021, 13, 10976. [Google Scholar] [CrossRef]
  41. Zhang, X.; Miller-Hooks, E.; Denny, K. Assessing the role of network topology in transportation network resilience. J. Transp. Geogr. 2015, 46, 35–45. [Google Scholar] [CrossRef]
  42. Ganin, A.A.; Kitsak, M.; Marchese, D.; Keisler, J.M.; Seager, T.; Linkov, I. Resilience and efficiency in transportation networks. Sci. Adv. 2017, 3, e1701079. [Google Scholar] [CrossRef]
  43. Saaty, T.L. The analytic hierarchy process (AHP). J. Oper. Res. Soc. 1980, 41, 1073–1076. [Google Scholar]
  44. Min, H. Location planning of airport facilities using the analytic hierarchy process. Logist. Transp. Rev. 1994, 30, 79. [Google Scholar]
  45. Ballis, A. Airport site selection based on multicriteria analysis: The case study of the island of Samothraki. Oper. Res. 2003, 3, 261–279. [Google Scholar]
  46. Liao, Y.; Bao, F. Research on airport site selection based on triangular fuzzy number. Appl. Mech. Mater. 2014, 505, 507–511. [Google Scholar]
  47. Zhang, H.; Sun, F.; Qian, J. An optimization based on general airport of complex condition. In Proceedings of the 2019 International Conference on Computer, Information and Telecommunication Systems (CITS), Beijing, China, 28–31 August 2019; pp. 1–5. [Google Scholar]
  48. Sennaroglu, B.; Celebi, G.V. A military airport location selection by AHP integrated PROMETHEE and VIKOR methods. Transp. Res. Part D Transp. Environ. 2018, 59, 160–173. [Google Scholar]
  49. Zhao, S.; Sun, P. Scheme Comparison of New Airport Site Selection Based on Lattice Order Decision Making Method in the Integrated Transportation System. Int. J. Online Eng. 2013, 9, 95. [Google Scholar]
  50. Alves, C.J.P.; da Silva, E.J.; Müller, C.; Borille, G.M.R.; Guterres, M.X.; Arraut, E.M.; Peres, M.S.; dos Santos, R.J. Towards an objective decision-making framework for regional airport site selection. J. Air Transp. Manag. 2020, 89, 101888. [Google Scholar]
  51. Wang, M.; Li, H.; Cui, J.; Deng, K.; Bhowmick, S.S.; Dong, Z. Pinocchio: Probabilistic influence-based location selection over moving objects. IEEE Trans. Knowl. Data Eng. 2016, 28, 3068–3082. [Google Scholar]
  52. Gao, Y.; Zheng, B.; Chen, G.; Li, Q. Optimal-location-selection query processing in spatial databases. IEEE Trans. Knowl. Data Eng. 2009, 21, 1162–1177. [Google Scholar]
  53. Jiang, X.; Cao, S.; Mo, B.; Cao, J.; Yang, H.; Tang, Y.; Hansen, M.; Zhao, J.; Sengupta, R. Simulation-Based Optimization for Vertiport Location Selection: A Surrogate Model With Machine Learning Method. Transp. Res. Rec. 2024, 2678. [Google Scholar] [CrossRef]
  54. Kotwicz Herniczek, M.T.; German, B.J. Scalable Combinatorial Vertiport Placement Method for an Urban Air Mobility Commuting Service. Transp. Res. Rec. 2024, 2678, 1624–1641. [Google Scholar] [CrossRef]
  55. Yoon, D.; Jeong, M.; Lee, J.; Kim, S.; Yoon, Y. Integrating Urban Air Mobility with Highway Infrastructure: A Strategic Approach for Vertiport Location Selection in the Seoul Metropolitan Area. arXiv 2025, arXiv:2502.00399. [Google Scholar]
  56. Rahman, B.; Bridgelall, R.; Habib, M.F.; Motuba, D. Integrating urban air mobility into a public transit system: A GIS-based approach to identify candidate locations for vertiports. Vehicles 2023, 5, 1803–1817. [Google Scholar] [CrossRef]
  57. Chae, M.; Kim, S.H.; Kim, S.H.; Kim, M.; Park, H.-T. Vertiport Locations Optimization in Discrete Search Space. In Proceedings of the 2023 IEEE/AIAA 42nd Digital Avionics Systems Conference (DASC), Barcelona, Spain, 1–5 October 2023; pp. 1–6. [Google Scholar]
  58. Kim, W.-J.; Park, J.-H. A study on the factors affecting UAM vertiport location selection. J. Urban Stud. Real Estate 2022, 13, 119–137. [Google Scholar]
  59. Cohen, M.M. The Vertiport as an Urban Design Problem; 0148-7191; SAE Technical Paper; SAE: Warrendale, PA, USA, 1996. [Google Scholar]
  60. Wang, J.; Zhang, S.; Guo, H.; Tian, Y.; Liu, S.; Du, C.; Wu, J. Stereoscopic monitoring of transportation infrastructure. Autom. Constr. 2024, 164, 105472–105485. [Google Scholar] [CrossRef]
  61. Bozzo, E.; Franceschet, M.; Rinaldi, F. Vulnerability and power on networks. Netw. Sci. 2015, 3, 196–226. [Google Scholar] [CrossRef]
  62. Latora, V.; Marchiori, M. Efficient behavior of small-world networks. Phys. Rev. Lett. 2001, 87, 198701. [Google Scholar]
  63. Vragović, I.; Louis, E.; Díaz-Guilera, A. Efficiency of informational transfer in regular and complex networks. Phys. Rev. E—Stat. Nonlinear Soft Matter Phys. 2005, 71, 036122. [Google Scholar]
  64. Menger, K. Zur allgemeinen kurventheorie. Fundam. Math. 1927, 10, 96–115. [Google Scholar]
  65. Derrible, S.; Kennedy, C. The complexity and robustness of metro networks. Phys. A Stat. Mech. Its Appl. 2010, 389, 3678–3691. [Google Scholar]
  66. Watts, D.J.; Strogatz, S.H. Collective dynamics of ‘small-world’networks. Nature 1998, 393, 440–442. [Google Scholar] [CrossRef] [PubMed]
  67. Lee, H.; Lee, S. An Analysis of the Relationship between Neighborhood Road Network Structure and Pedestrian Traffic Accidents: Focusing on Seoul TAAS Data (2012–2014). J. Korea Plan. Assoc. 2017, 52, 141–161. [Google Scholar] [CrossRef]
  68. Fiedler, M. Algebraic connectivity of graphs. Czechoslov. Math. J. 1973, 23, 298–305. [Google Scholar] [CrossRef]
  69. Wei, P.; Chen, L.; Sun, D. Algebraic connectivity maximization of an air transportation network: The flight routes’ addition/deletion problem. Transp. Res. Part E Logist. Transp. Rev. 2014, 61, 13–27. [Google Scholar] [CrossRef]
  70. Newman, M.E. Assortative mixing in networks. Phys. Rev. Lett. 2002, 89, 208701. [Google Scholar] [CrossRef]
  71. Chang, H.; Su, B.-B.; Zhou, Y.-P.; He, D.-R. Assortativity and act degree distribution of some collaboration networks. Phys. A Stat. Mech. Its Appl. 2007, 383, 687–702. [Google Scholar] [CrossRef]
  72. Newman, M.E. The structure and function of complex networks. SIAM Rev. 2003, 45, 167–256. [Google Scholar] [CrossRef]
  73. Shanmukhappa, T.; Ho, I.W.-H.; Chi, K.T.; Leung, K.K. Recent development in public transport network analysis from the complex network perspective. IEEE Circuits Syst. Mag. 2019, 19, 39–65. [Google Scholar] [CrossRef]
  74. Newman, M.E. Modularity and community structure in networks. Proc. Natl. Acad. Sci. USA 2006, 103, 8577–8582. [Google Scholar]
  75. Xu, M.; Pan, Q.; Muscoloni, A.; Xia, H.; Cannistraci, C.V. Modular gateway-ness connectivity and structural core organization in maritime network science. Nat. Commun. 2020, 11, 2849. [Google Scholar]
  76. Freeman, L.C. Centrality in social networks: Conceptual clarification. Soc. Netw. Crit. Concepts Sociol. Lond. Routledge 2002, 1, 238–263. [Google Scholar]
  77. Chen, L.; Wandelt, S.; Dai, W.; Sun, X. Scalable vertiport hub location selection for air taxi operations in a metropolitan region. INFORMS J. Comput. 2022, 34, 834–856. [Google Scholar] [CrossRef]
  78. Bryan, D.L.; O′kelly, M.E. Hub-and-spoke networks in air transportation: An analytical review. J. Reg. Sci. 1999, 39, 275–295. [Google Scholar]
  79. Peksa, M.; Dandl, F.; Bogenberger, K. Hierarchical Vertiport Network for an Urban Air Mobility System: Munich Metropolitan Area Case Study. In Proceedings of the 2023 IEEE/AIAA 42nd Digital Avionics Systems Conference (DASC), Barcelona, Spain, 1–5 October 2023; pp. 1–6. [Google Scholar]
  80. Willey, L.C.; Salmon, J.L. A method for urban air mobility network design using hub location and subgraph isomorphism. Transp. Res. Part C Emerg. Technol. 2021, 125, 102997. [Google Scholar]
Figure 1. Overall research landscape.
Applsci 15 03965 g001
Figure 2. The urban railway network for the Seoul Metropolitan Area.
Applsci 15 03965 g002
Figure 3. Simulation (5~20%) networks by each scenario.
Applsci 15 03965 g003
Figure 4. Comparison of key network performance indicators.
Applsci 15 03965 g004
Table 1. Number of nodes and links in network data sourced from KTDB.
CategoryNodeLink
Road Network153,120196,850
Road and Railway Network156,354338,289
Railway Network19242058
Urban Railway Network8341018
Table 2. Network topology analysis result for the Seoul Metropolitan railway network.
GroupGlobal
Efficiency
Average Shortest Path LengthAlgebraic ConnectivityClustering
Coefficient
Degree
Assortativity
TransitivityModularity
Urban
Railway Network
0.0608024.201610.002120.054220.528060.180000.87862
Table 3. Network global efficiency results.
RatioBetweenness UAM
Network
Degree UAM
Network
Vulnerable UAM
Network
5%0.087060.089480.09556
10%0.127530.129320.14703
15%0.168420.165660.19674
20%0.199710.216650.23825
Table 4. Average shortest path length results.
RatioBetweenness UAM
Network
Degree UAM
Network
Vulnerable UAM
Network
5%17.300516.088215.8778
10%12.238411.972310.6847
15%9.73509.82968.2023
20%8.72877.36517.0458
Table 5. Network algebraic connectivity results.
RatioBetweenness UAM
Network
Degree UAM
Network
Vulnerable UAM
Network
5%0.002930.003560.00326
10%0.004400.005680.00362
15%0.005100.006450.00449
20%0.005500.009200.00646
Table 6. Network local clustering coefficient results.
RatioBetweenness UAM
Network
Degree UAM
Network
Vulnerable UAM
Network
5%0.050720.050810.04053
10%0.076460.075300.06419
15%0.101540.099370.09321
20%0.128150.126060.12512
Table 7. Network transitivity results.
RatioBetweenness UAM
Network
Degree UAM
Network
Vulnerable UAM
Network
5%0.913350.896790.87188
10%0.971690.968480.95549
15%0.984270.984090.97476
20%0.989200.987820.98188
Table 8. Network modularity results.
RatioBetweenness UAM
Network
Degree UAM
Network
Vulnerable UAM
Network
5%0.657030.688100.66245
10%0.310770.302450.28555
15%0.129370.143620.12440
20%0.073100.077110.06092
Table 9. Network degree assortativity results.
RatioBetweenness UAM
Network
Degree UAM
Network
Vulnerable UAM
Network
5%0.949940.928840.89724
10%0.940040.931930.88948
15%0.923650.923170.85936
20%0.902990.890320.81274
Table 10. Statistical results of network indicators based on two-way ANOVA.
GroupNetwork Strategy Effect
(p-Value)
Ratio Effect
(p-Value)
Global Efficiency0.00970.0000
Average Shortest Path Length0.00530.0000
Algebraic Connectivity0.02760.0051
Clustering Coefficient0.00670.0000
Degree Assortativity0.00050.0039
Transitivity0.03780.0000
Modularity0.05400.0000
Disclaimer/Publisher’s Note: The statements, opinions and data contained in all publications are solely those of the individual author(s) and contributor(s) and not of MDPI and/or the editor(s). MDPI and/or the editor(s) disclaim responsibility for any injury to people or property resulting from any ideas, methods, instructions or products referred to in the content.

