Article

Methodology for Studying the Reliability of Interlocking Devices in Bulgarian Railways

by
Emiliya Dimitrova
1 and
Vasil Dimitrov
2,*
1
Department of Telecommunications and Signalling, Faculty of Telecommunications and Electrical Equipment in Transport, Todor Kableshkov University of Transport, 158 Geo Milev Str., 1574 Sofia, Bulgaria
2
Department of Electrical Power Supply and Electrical Equipment in Transport, Faculty of Telecommunications and Electrical Equipment in Transport, Todor Kableshkov University of Transport, 158 Geo Milev Str., 1574 Sofia, Bulgaria
*
Author to whom correspondence should be addressed.
Appl. Sci. 2025, 15(8), 4178; https://doi.org/10.3390/app15084178
Submission received: 10 March 2025 / Revised: 3 April 2025 / Accepted: 6 April 2025 / Published: 10 April 2025
(This article belongs to the Special Issue Current Advances in Railway and Transportation Technology)

Abstract

:

Featured Application

The results can be used in planning procedures for modernization and rehabilitation of railway interlocking devices.

Abstract

Railway signalling systems must ensure the safe movement of trains and the reliability of the operation of their components is of utmost importance. One of the main components is the interlocking devices, which provide secure, safe and reliable interaction between points and signals in the controlled railway station area, and the safe movement of trains in this area depends on their proper functioning. In this article, the failures of the signalling devices in the Bulgarian railways over a three-year period (2020–2022) are analysed and processed according to a developed methodology. First, a statistical assessment of device failures is performed, comparing the number and duration of failures of different types of equipment, and calculating proportional ratios. Second, a reliability analysis is carried out and the reliability indicators are determined—mean time between failures MTBF, intensity of failure flow, availability and unavailability coefficients. The obtained results clearly demonstrate the need for determination of the complex reliability indicators. They give the clearest assessment of the state of the devices. If only a statistical assessment of failures and their duration is made or if only simple reliability indicators are calculated, erroneous conclusions can be drawn regarding maintenance and the need for modernization.

1. Introduction

The main priority in railway transport is ensuring safety and security of traffic. Rail transport is still a dangerous operation, where an accident can often result in many fatalities and significant material damage. Existing railway systems face significant challenges in terms of safety, operational efficiency, and sustainability, with one of the critical concerns being the risk of train collisions, which can have severe consequences for passengers, rail infrastructure and the environment. Causes of accidents related to train traffic safety are discussed in [1]. It is shown that safety systems of railway automation and remote control cannot ensure safety when reaching the limit states of railway infrastructure objects with which they do not interact directly. In [2], a combination of real-time monitoring, asset tracking and predictive maintenance is proposed to improve rail safety and efficiency. According to [3], it is necessary to modernise signalling systems and introduce new safety techniques due to the events and mishaps that occurred on the railway network and the growth in traffic. The theoretical principles for the safety train traffic control system synthesis is presented in [4], considering the capabilities of equipping infrastructure facilities with highly reliable and safe means of technical diagnostics and monitoring. An advanced train traffic control system architecture is developed in [5], which is based on the railway infrastructure facilities monitoring techniques integrated into the railway automation and remote-control equipment.
Another cause of serious accidents is discussed in [6]—this is the increased speed of the train, which can lead to abnormal interaction between the train and the control system. It is proposed to continuously monitor the operation of the systems during train’s movement in order to check the correctness of its own behaviour while generating control commands. A method of close headway analytical estimation when building railway safety management systems is presented in [7]. Analytical estimates of train spacings under railway safety and security terms with speed limits on the running line and minimal spacing between trains departing from and arriving at the station are provided, as the influence of the radio channel on the close headway is taken into account. The advantages of new communication technologies and their application in railway transport are also commented on in [8], but it is emphasised that very strict safety requirements must be met.
New methods for monitoring infrastructure facilities are being developed. In [9], a comprehensive detection program for space–air–vehicle–ground network integration based on unmanned aerial vehicles (UAVs) is presented. The methods of fastener safety status and foreign object detection are proposed, the railway safety level of the large-scale road network can be improved, and a platform support for a comprehensive railway safety detection system can be provided. Another method that will assist in preventing numerous rail accidents is developed in [10]—Railway Track Tracer technology for Crack Detection. This is a technology that detects cracks in railway tracks using machine learning. In [11], an Internet of Things (IOT)-based railway safety monitoring application is proposed to provide real-time assessment of the state of safety and efficiency in railroad bridges, tunnels and the welfare of residence areas surrounding the railroad infrastructure. In [12], a comprehensive solution utilising LoRa (long-range) communication modules, infrared (IR) sensors, and ultrasonic sensors to develop an advanced train tracking and railway gate safety system is proposed. An Enhanced Safety System for Unprotected Level Crossings is also examined in [13]—the proposed solution is a combination of devices based on advanced technologies and is designed to significantly reduce accidents at railway crossings. In [14], it is proposed to use the development of information technologies to support the labour safety system in the field of railway transport—implementation of risk management and quality management tools. To analyse the accidents and use the technology of such AI methods to enhance safety, the authors in [15] propose using unsupervised topic modelling to better understand the causes of extreme accidents. The use of the thematic machine learning method for systematic characterisation of on-site incidents to improve safety and risk management in stations is described and advanced analysis is provided. An AI-driven warning device to ensure the safety of railway track workers is proposed in [16]—a low-cost portable smart gadget detects the sounds of the approaching trains and provides a warning signal to track workers via a phone call. The introduction of the Artificial Intelligence in the railway operations is discussed in [17]—the paper presents an operation, administration, and maintenance (OAM) architecture that provides management services for both virtualized and physical railway functions. The important role of artificial intelligence technologies in the digitalization of the railway industry is also discussed in [18]. The paper considers Internet of Things and Digital twin technologies as key enablers for deployment of AI in the railway sector.
A paper [19] proposes another application of artificial intelligence (AI) in the Intelligent Transport Systems (ITS)—an object detection (OD) and activity recognition (AR) model for railway lines is presented with the goal of reducing accidents, fatalities, and improving safety.
One of the most significant components of the railway infrastructure are the interlocking devices and high requirements are placed on them for reliability in operation. The increasing rail traffic requires fast-response interlocking systems—in addition to rich functionality, such systems should be based on a single and simple safety principle that ensures high availability and safety at the same time [20]. The generic safety principles for designing a highly safe generic product for railway interlocking tasks are introduced, and the design of such a product based on a new microarchitecture concept is also shown.
The important role of safety computer platforms in railway signalling systems is discussed in [21]—the TYJL-III computer interlocking system has been developed and implemented in China. It has been proven that such a safety computer platform with reasonable structure, comprehensive function, unified interface, and strong compatibility can play an important role in the process of comprehensive upgrading of railway signalling equipment. Another railway signal safety control platform based on the functions and safety requirements of the railway signal is designed in [22] and is also studied from three aspects: design principle, hardware structure, and software structure. A computer interlocking system is discussed as an example of this platform, ensuring real-time communication and data transmission reliability.
The problems of building a unified information system for ensuring the reliability and safety of transport systems based on system analysis, risk management, process approach, and reliability theory are discussed in [23]. Software and hardware are proposed that increase the reliability and safety of work at the railway station. According to [24], with the increasing reach and applicability of software systems in railway infrastructure, their complexity and the demand for constant change increases and the introduction of online assurance is necessary to mark a paradigm shift in the railway domain, where the system safety is guaranteed by expert assessments.
In our previous research, we propose methods for integration of local interlocking systems for control on railway traffic into a SCADA-system for remote monitoring [25]. In this way, the security and safety of the transport process are improved, the probability of risks arising from the actions of the dispatcher on duty or related to the functioning of the relevant interlocking station is significantly reduced, conditions are created for an objective analysis of events of importance for traffic safety.
In this article, we propose a methodology for studying the reliability of railway interlocking stations using two types of research. First, a statistical assessment of failures should be performed, taking into account the collected data on damages, faults and breakdowns in the interlocking devices operating in Bulgarian railway transport. Second, a reliability analysis should be performed and the complex reliability and repairability metrics should be determined. Finally, comparative analysis is presented and the advantages of determining the complex indicators are described.
The results can be used in planning procedures for the modernization and rehabilitation of signalling systems.

2. Research Methods

The purpose of signalling systems is to ensure safe movements of trains on a railway infrastructure by locking movable track elements in a proper position, checking the clearance of track sections, locking out conflicting moves, and controlling train movements in a way to keep them safely apart [26]. The interlocking devices (IlD) are one of the main components of signalling systems and railway infrastructure. These internal devices provide secure, safe, and reliable interaction between points and signals in the area of the controlled railway station [26,27,28]. The interlocking area may contain tracks protected by controlled signals on which trains may originate, terminate, pass, and turn. These are the station tracks, and their arrangement forms the station area. The term “interlocking” comes from the fact that the signals governing train moves are interlocked with movable track elements (points, driven by point machines, also called switch machines) and signals governing conflicting routes. In the interlocking area, the controlled signals are interlocked with points and other signals. Therefore, interlocking is based on the principle that a safe route up to the authority limit is established, and this route must meet the following conditions [26]:
  • All points must be properly set and locked and must be kept locked as long as the train is allowed to run on them.
  • Conflicting routes must be locked out.
  • The route must be protected against unintended movements on converging tracks.
  • All sections of the track through which the train is allowed to pass must be clear.
The local interlocking devices consist of interlocking systems and user interfaces for the on-duty dispatcher. Contemporary interlocking stations also allow remote control from a main dispatcher centre.
In Bulgarian railways, the National Railway Infrastructure Company (NRIC) is responsible for the construction, development, repair, maintenance, and operation of the railway infrastructure. Specifically, regarding safety systems (including interlocking devices), there are three units (parts of the NRIC), called “Signalling and Telecommunications” Departments (STD) in Sofia, Plovdiv, and Gorna Oryahovitsa (G.Or.), which are responsible for the activities on the operation and maintenance of the devices in the respective area.
There are various types of interlocking devices in operation on Bulgarian railways that can be classified into the following main groups [28]: route-computer interlocking devices (RCID), route-relay interlocking devices (RRID), electromechanical interlocking devices (EMID), relay systems for key dependences (RSKD). The number of interlocking devices, systematised by type and location, is given in Table 1 (data are taken from the Reference documents of the railway network, issued by NRIC in the end of each year—links to publicly archived datasets are provided in the Data Availability Statement Section). Traffic lights control consoles are also still in operation—temporary (used during construction activities in renovated stations) or permanent (at stations without signalling installation), but their number is very small, and they are not the subject of this study (links to publicly archived datasets).
Each of the three STDs continuously collects data on failures of devices of signalling systems—not only of interlocking devices, but also of the following:
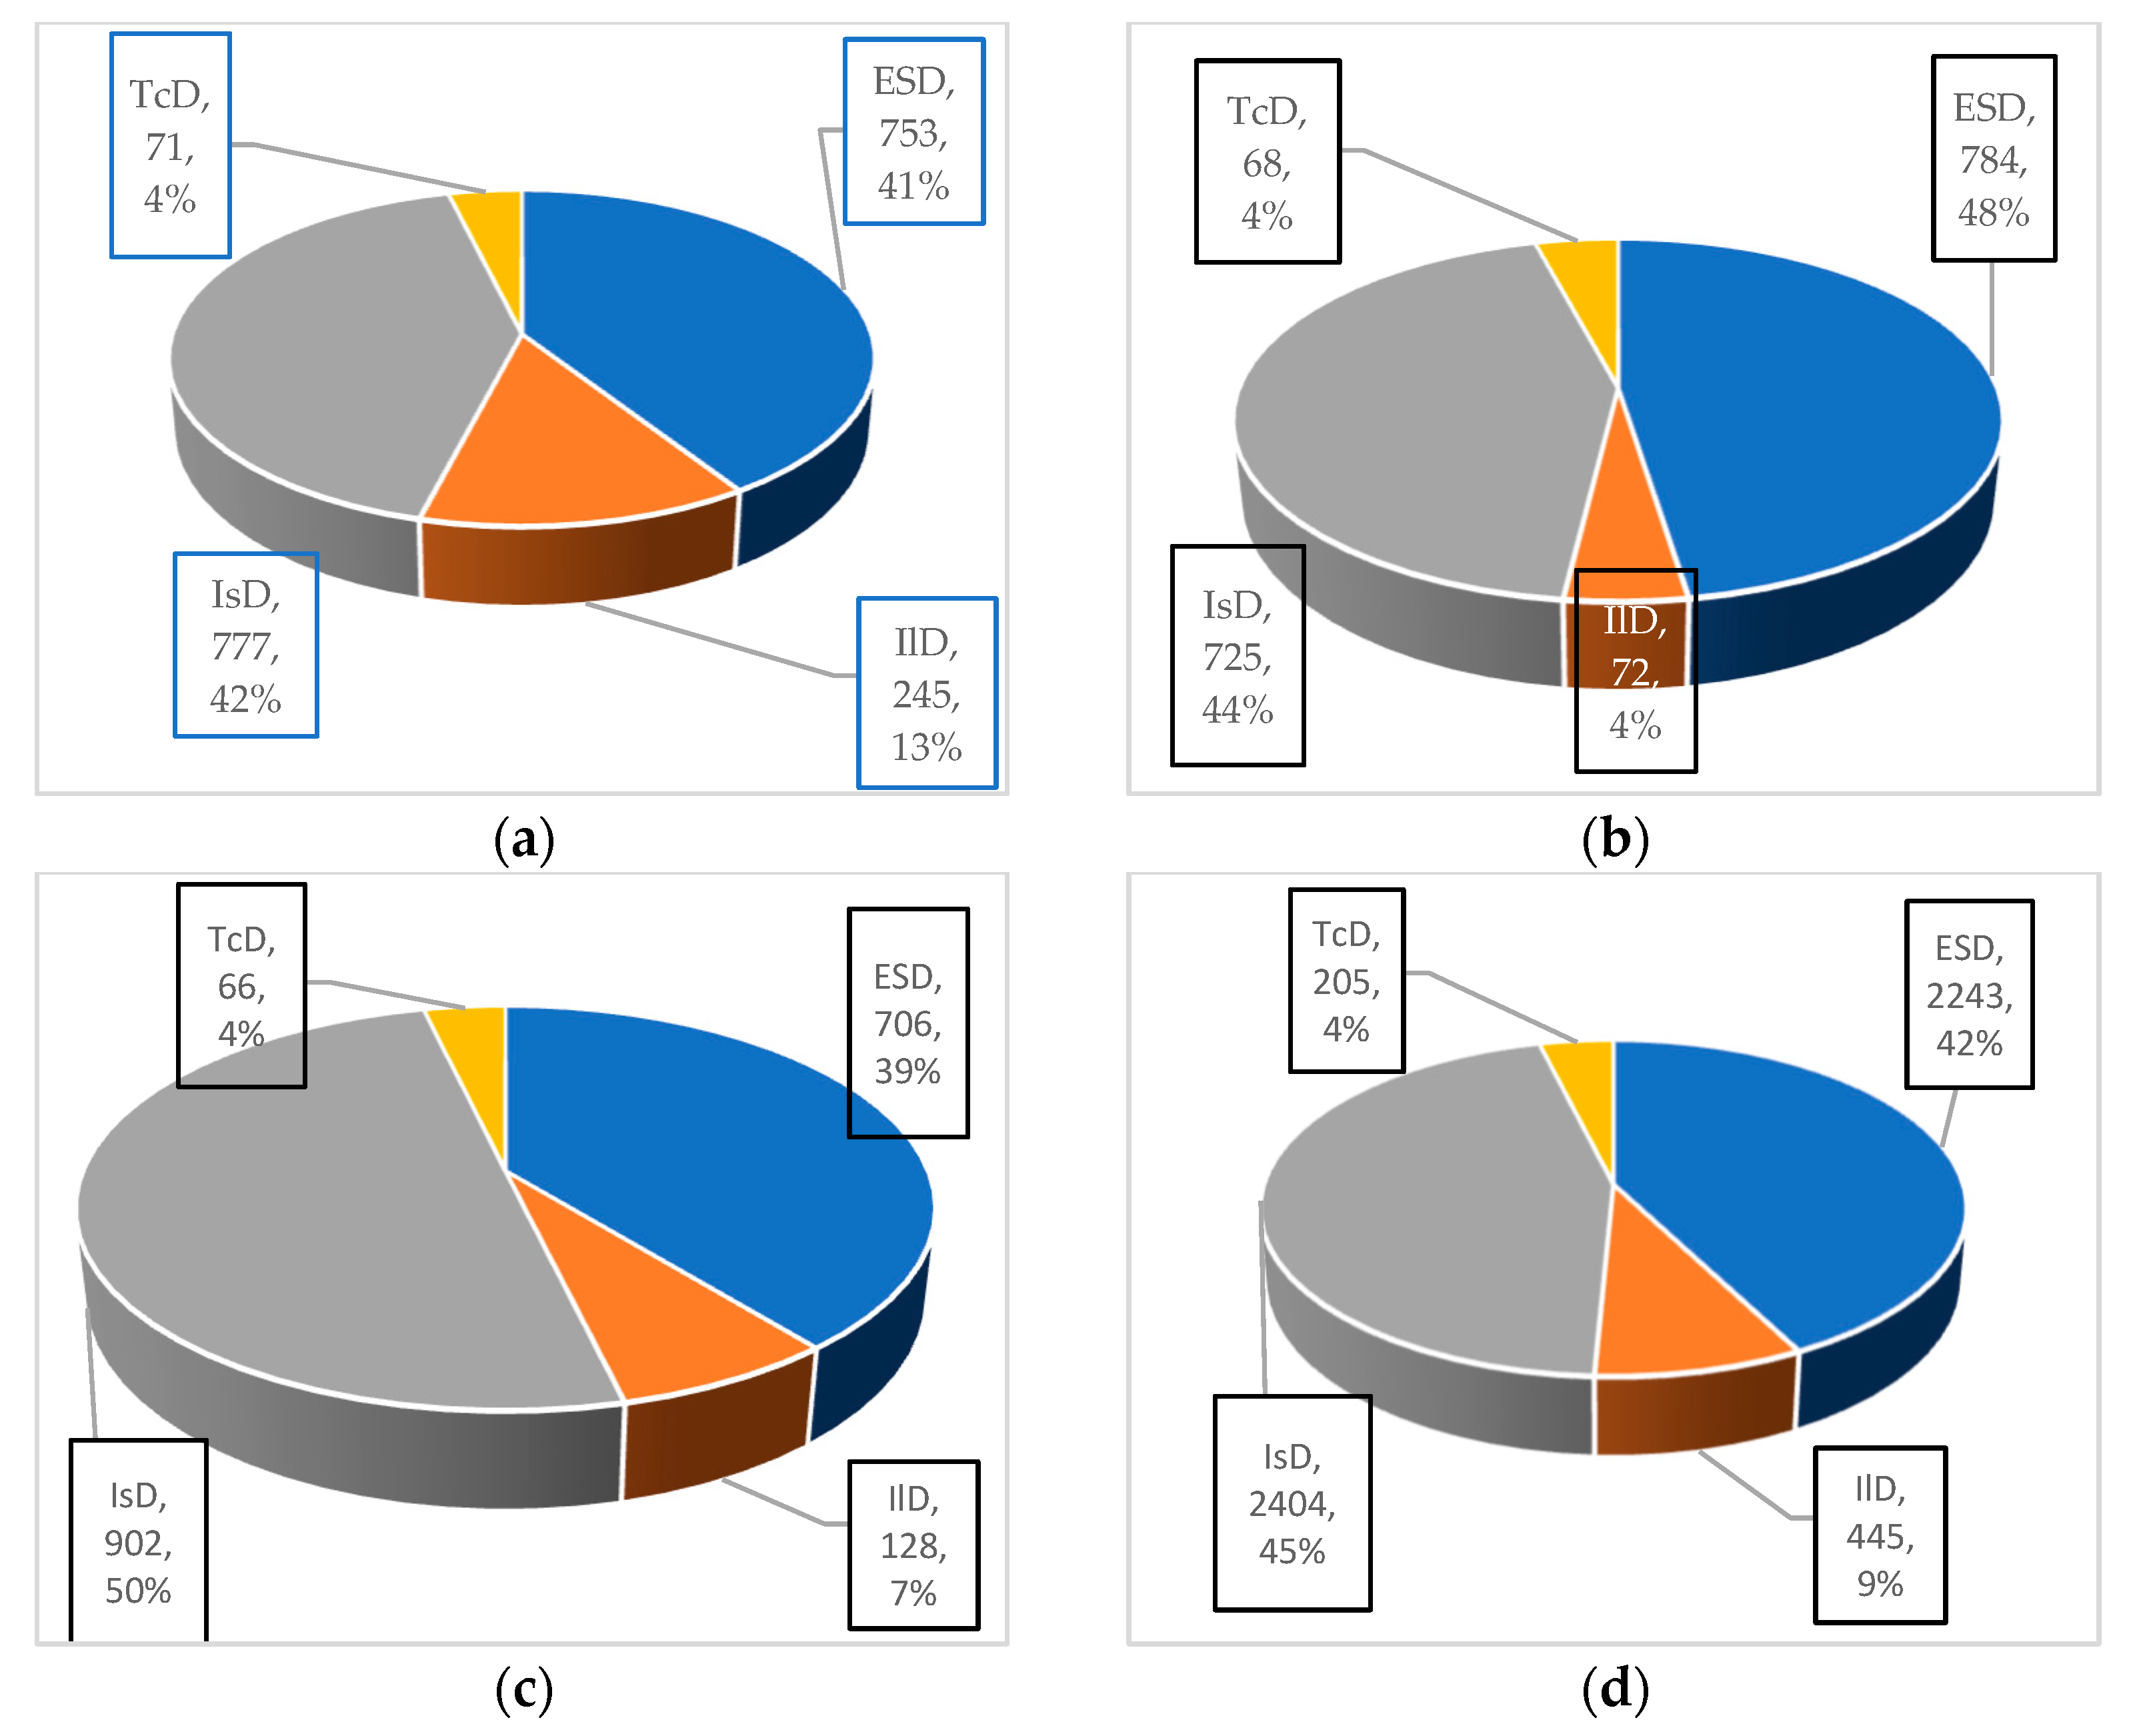
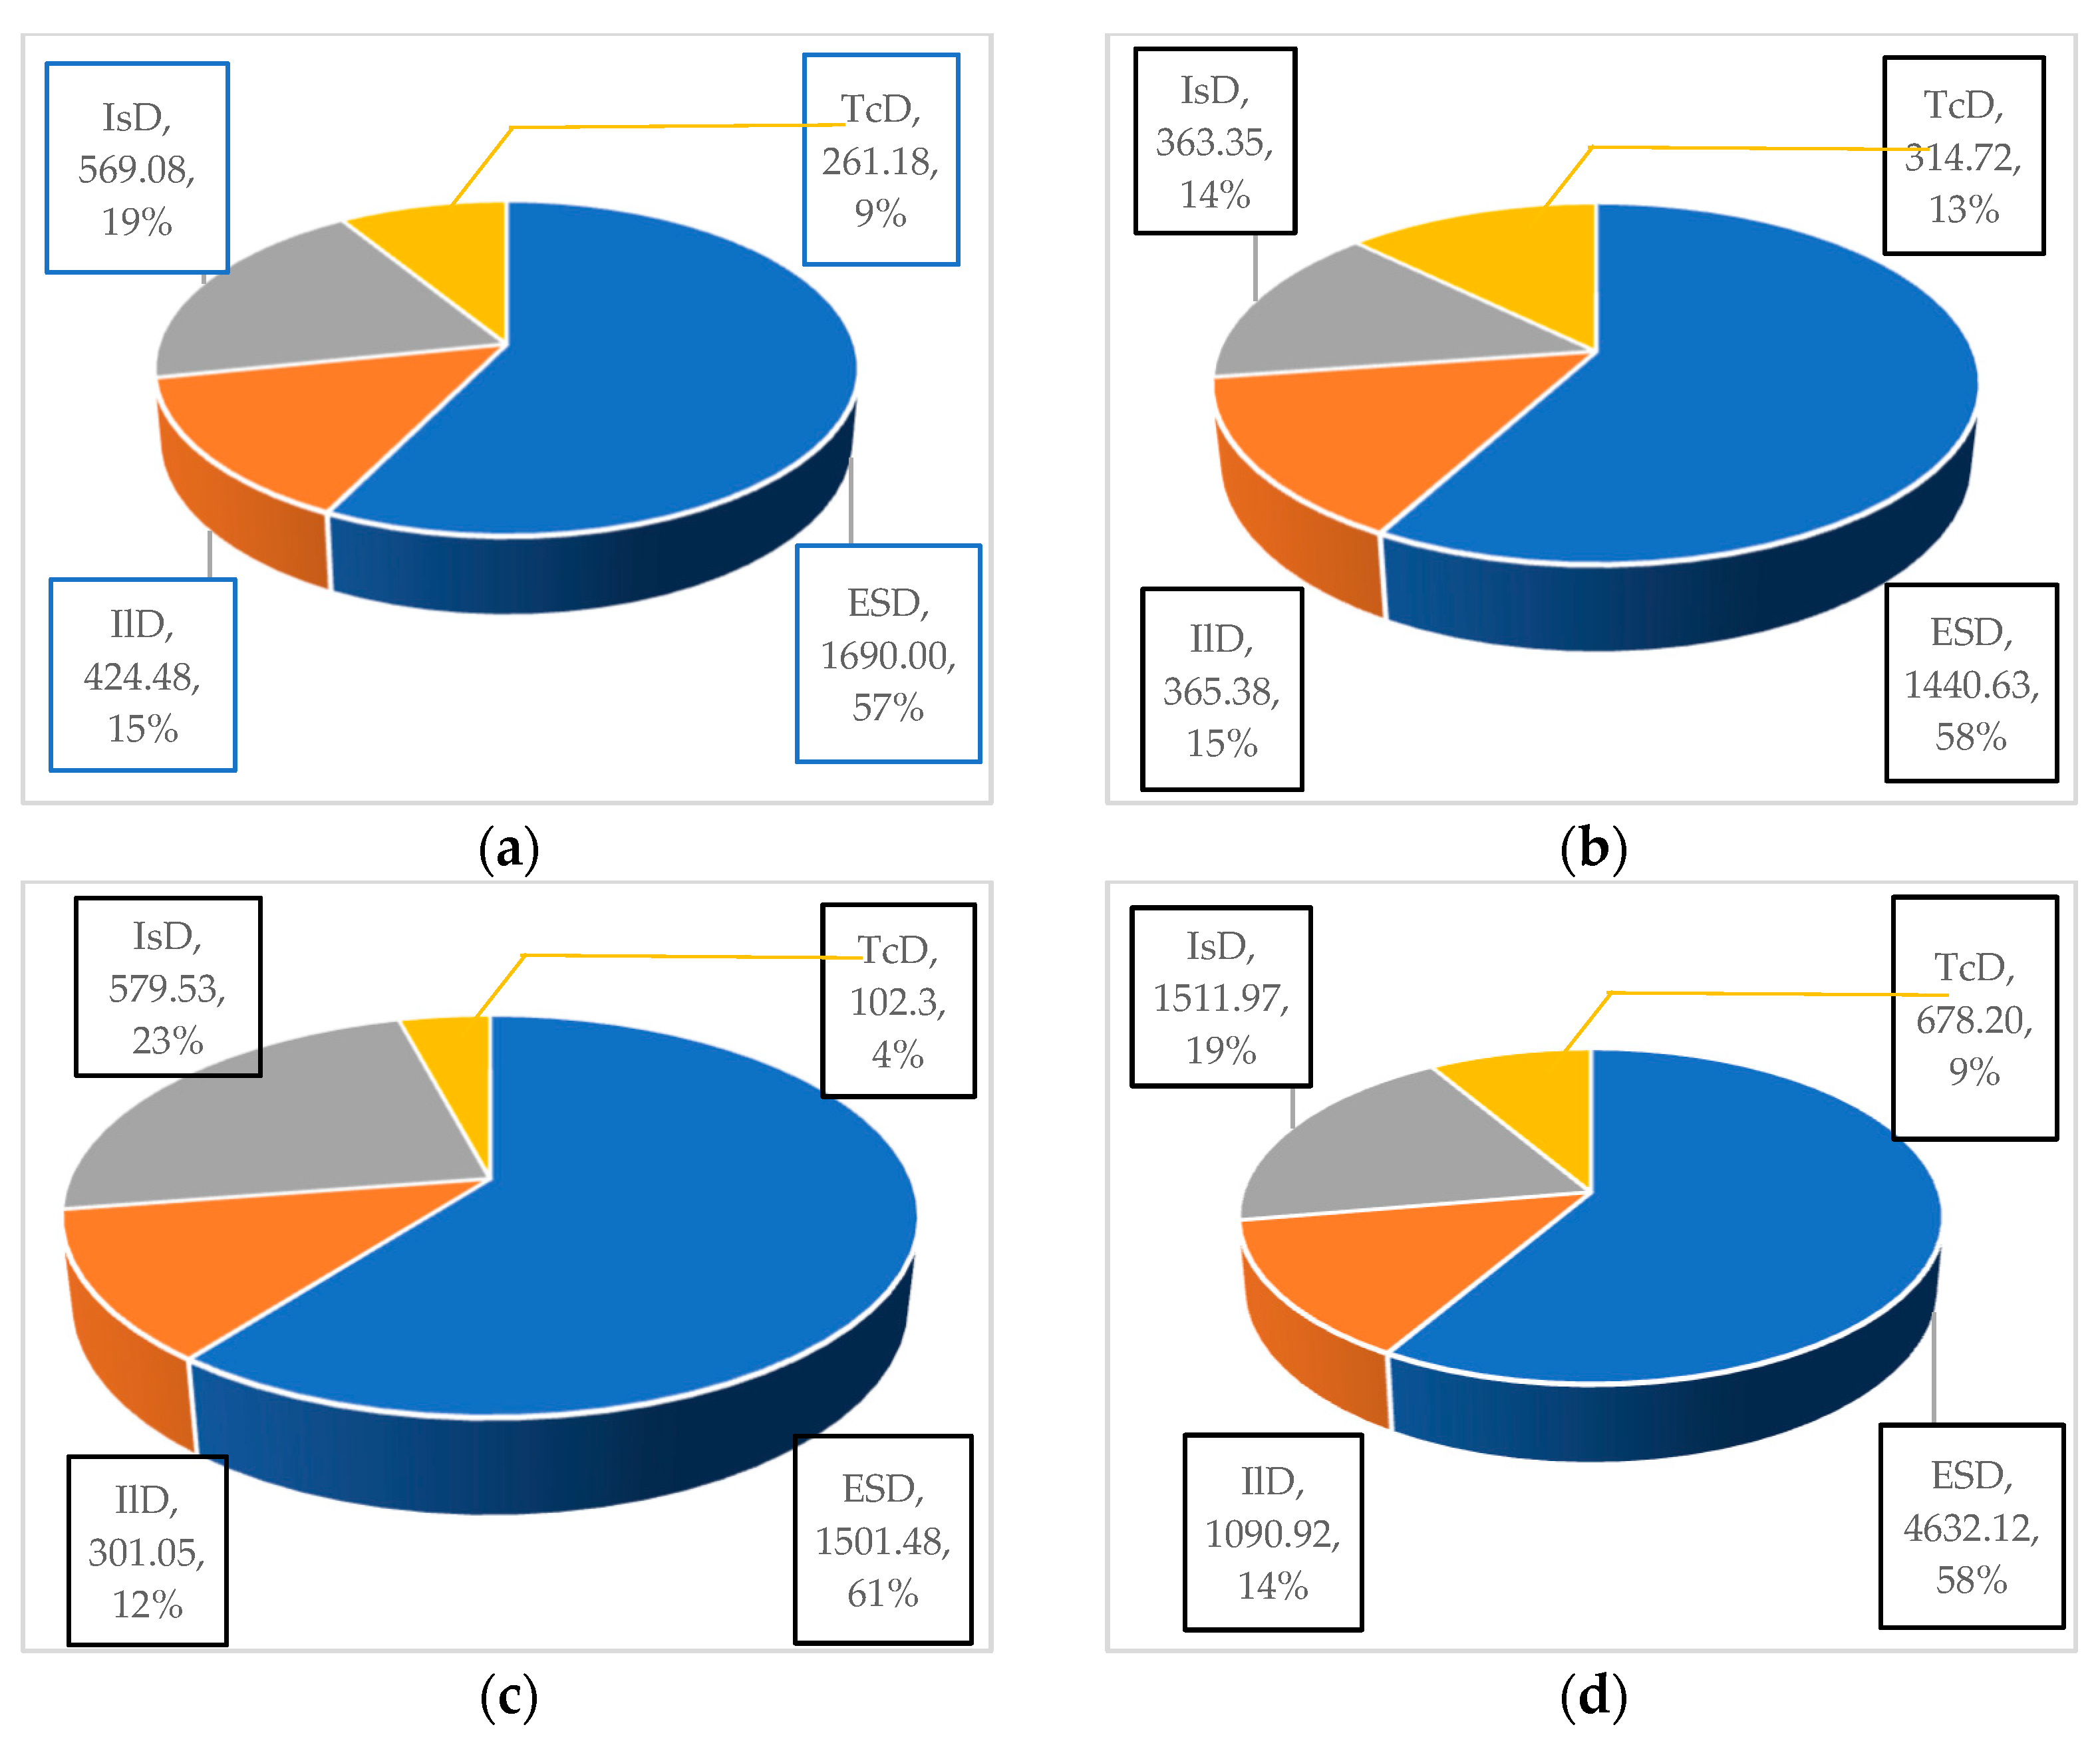
  • external station devices (ESD)—point machines, rail current circuits, counter points, traffic lights, etc.;
  • interstation devices (IsD)—automatic interlocking without passage signals (AB with axle counters), automatic interlocking with passage signals (type AB with rail circuits), relay semi-automatic interlocking (type PAB), automatic crossing devices (type APU), automatic locomotive signalling (type ALS), points on open road, etc.;
  • telecommunications devices (TcD)—automatic telephone exchanges (type ATC), external lines, etc.
The number and duration of failures by type of equipment and the reasons for their occurrence are specified—due to technical reasons or other causes (thefts, natural disasters, activities of external organisations, etc.). Failure represents the transition from a working state of the device to a non-working state. In principle, a possible failure in one device should not disrupt the proper functioning of the system as a whole. This is why it is necessary to analyse device failures in order to detect components that fail more frequently and to take timely measures to improve their maintenance.
Collected data are then summarised in annual consolidated activity reports issued by NRIC (links to publicly archived datasets are provided in the Data Availability Statement Section).
In this study, failures of interlocking devices over a period of three years (2020–2022) are analysed and processed according to the following methodology.
First, based on the number of failures given in the annual consolidated activity reports, a statistical assessment of devices failures is performed [29]. It starts with calculating the total number of failures of all devices for a given period:
n = i = 1 N r i t ,
where n—total number of failures;
N—total number of device types observed in the interval Δtt = 1 year or Δt = 3 years);
ri(Δt)—number of failures of a specific type of safety devices in the observed interval Δt.
Then, the percentage ratio by types of devices over the period is calculated using the equation
n f i = r i t n ×   100 ,   % ,   i = 1 N
where nf i—failure rate of the ith type of safety devices (in a percentage ratio);
rit)—number of failures of the ith device type in the observed interval Δt.
In a similar way, the total duration of failures of all devices for a given period is calculated (this is the total recovery time):
t = i = 1 N t i t ,   h ,
where t—total duration of failures;
ti(Δt)—duration of failures of a specific type of safety devices in the observed interval Δt.
The percentage ratio of the duration of failures by device types for the same period is calculated using the equation:
t f i = t i t t . 100 ,   % ,   i = 1 N
where tf i—failure duration percentage of the ith device type;
ti(Δt)—duration of failures (recovery time) of the corresponding device group in the observed interval Δt.
Using Equations (2) and (4), the percentage of failures and their duration by groups of devices is calculated (for each year 2020, 2021, 2022, and for the three-year period), as well as the percentage for each device type.
Second, an analysis of the reliability of the interlocking devices is carried out. In general, reliability is the ability of a device to maintain its basic properties during operation within certain limits. During the analysis, reliability indicators should be determined—they describe the random variables uptime, lifetime, and recovery time [30,31,32,33,34,35,36,37,38]. They are usually recorded by the mathematical expectation of the uptime (τ), the mean time between failures (MTBF), and the intensity of the failures flow ω(t).
The reliability analysis starts with determining simple indicators characterising one property of devices—fault tolerance and repairability parameters [32,33,34,35,36,37,38,39,40,41].
The time for failure-free operation τt) of each type of IlD for the observed time interval Δt is calculated using the equation:
τ i t = t t i ( t ) ,   h ,
where τit)—time for failure-free operation of the ith type of IlD for the observed interval Δt (i is RCID, RRID, EMID or RSKD);
Δt = 365 × 24 = 8760 h (1 year) or Δt = 3 × 365 × 24 = 26,280 h (3 years);
tit)—duration of failures of the ith type of IlD for the interval Δt (average recovery time, which is the main parameter for repairability when analysing recoverable objects).
The intensity of the flow of failures ω(t) for a given period Δt can be statistically evaluated by the equation:
ω ^ i t = r i t N I l D . τ i t ,   1 / h ,
where ω ^ i Δ t —statistical evaluation of the intensity of the failures flow ω(t) of ith type of IlD for the observed period Δt (i is RCID, RRID, EMID or RSKD);
ri t total number of failures of ith type of Ild in the interval Δt;
NIlD—total number of IlD of the corresponding type (given in Table 1 and was not changed over the three-year period under study)
τit)—time for failure-free operation of the ith type of IlD for the observed interval Δt.
Mean Time Between Failures MTBF of ith type of IlD is the reciprocal value of the corresponding value of ω ^ i Δ t :
M T B F i = 1 ω ^ i t ,   h .
MTBF is the main fault tolerance parameter (when analysing recoverable objects).
A more accurate assessment of the reliability of a given device is the complex indicators: they characterise both its failure-free operation and repairability [42,43,44,45,46,47,48]. The stationary coefficients of availability and unavailability are most often used and can be calculated by the equations:
A i = 1 ω ^ i t . t i ( t ) ,  
U i = ω ^ i t . t i ( t ) ,
where Ai—stationary coefficient of availability of the ith type of IlD for the observed interval Δt;
U i —stationary coefficient of unavailability of the ith type of IlD for the observed interval Δt.
It can be seen that the sum of these coefficients of the corresponding IlD at any moment of time is equal to 1:
A i + U i = 1 .
Using Equations (6)–(9), the simple and complex reliability indicators of each interlocking devices are determined for each year (2020, 2021, 2022) and for the three-year period.
The coefficients of availability and unavailability for the entire period can also be calculated as average values by the following equations:
A A v = A 2020 + A 2022 + A 2022 3
U A v = U 2020 + U 2022 + U 2022 3
where A A v , U A v —the average values of the availability and unavailability coefficients for the entire period;
A 2020 , A 2021 , A 2022 —the values of the coefficient of availability for the relevant year;
U 2020 , U 2021 , U 2022 —the values of the coefficient of unavailability for the relevant year.
In this way, a comparison can be made between the values for the three-year period obtained in different ways—through Equations (8) and (9) or Equations (11) and (12).

3. Results

According to the described methodology, a statistical assessment of the failures of the signalling equipment was performed and the reliability indicators of the interlocking devices were determined. The analysis was carried out separately for the devices belonging to the different divisions—STD in Bulgaria—Sofia, Plovdiv, and Gorna Oryahovitsa.

3.1. Statistical Assessment of Failures of the Interlocking Devices and Signallinig Equipment

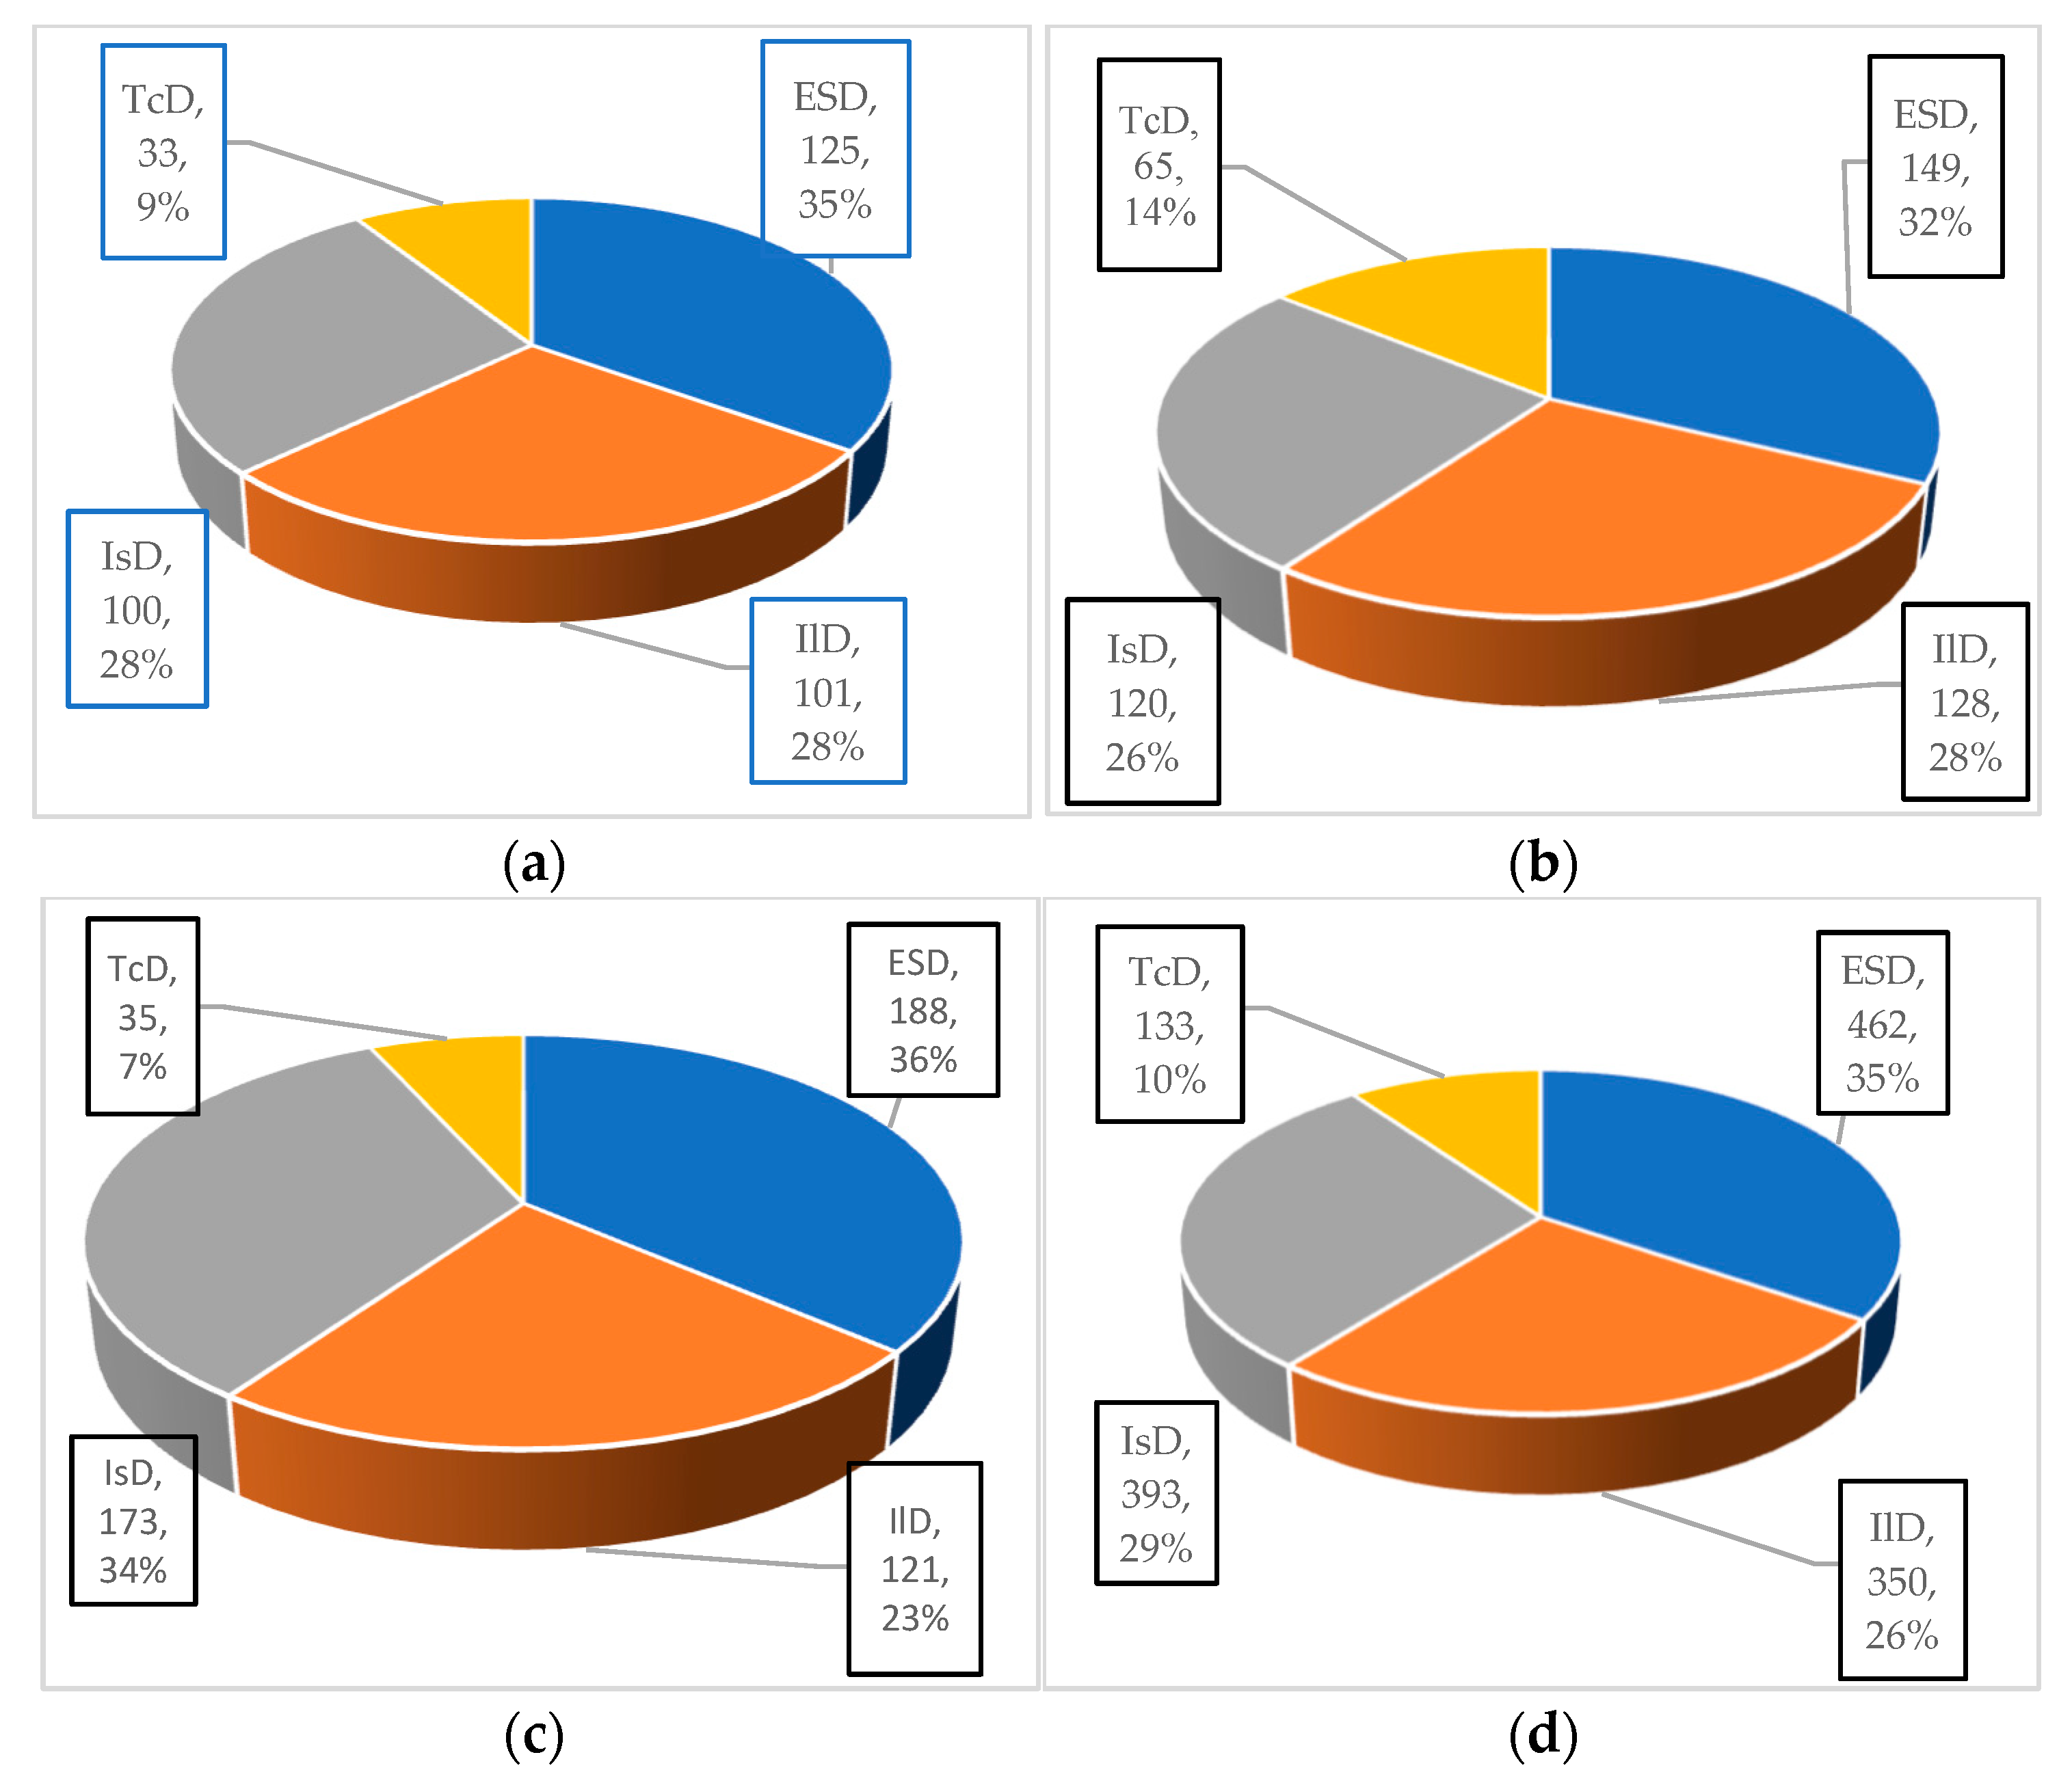
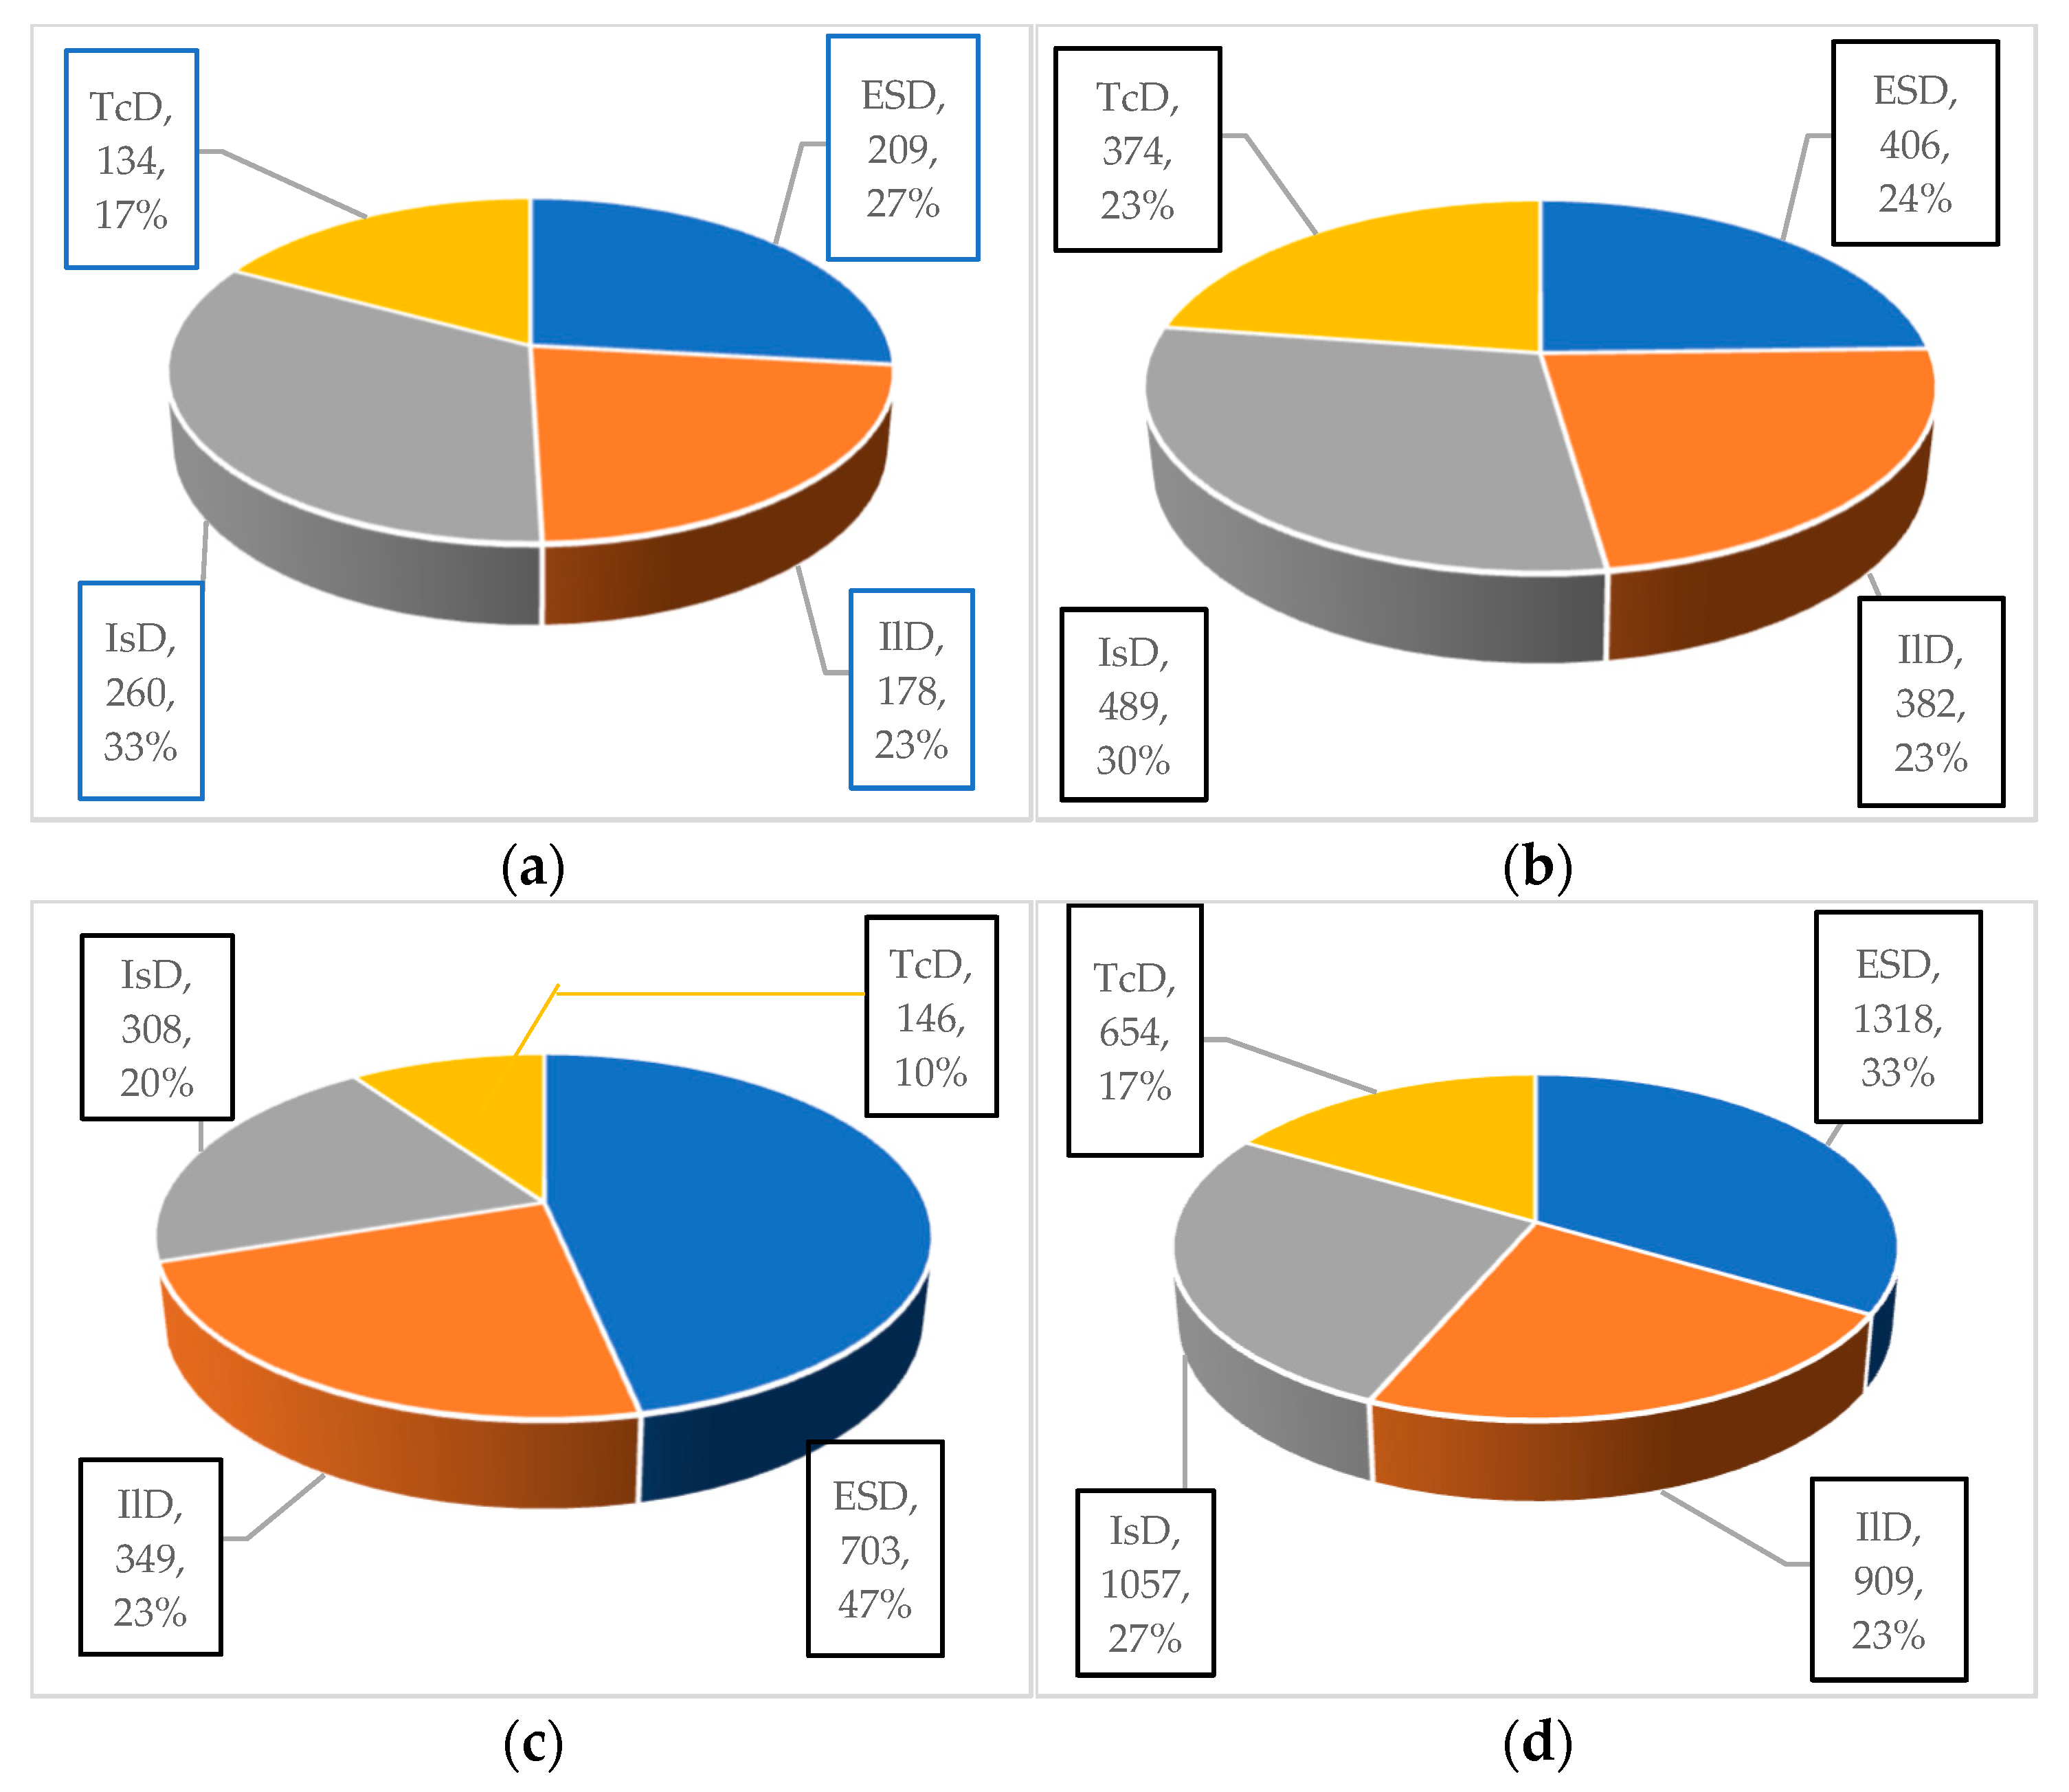
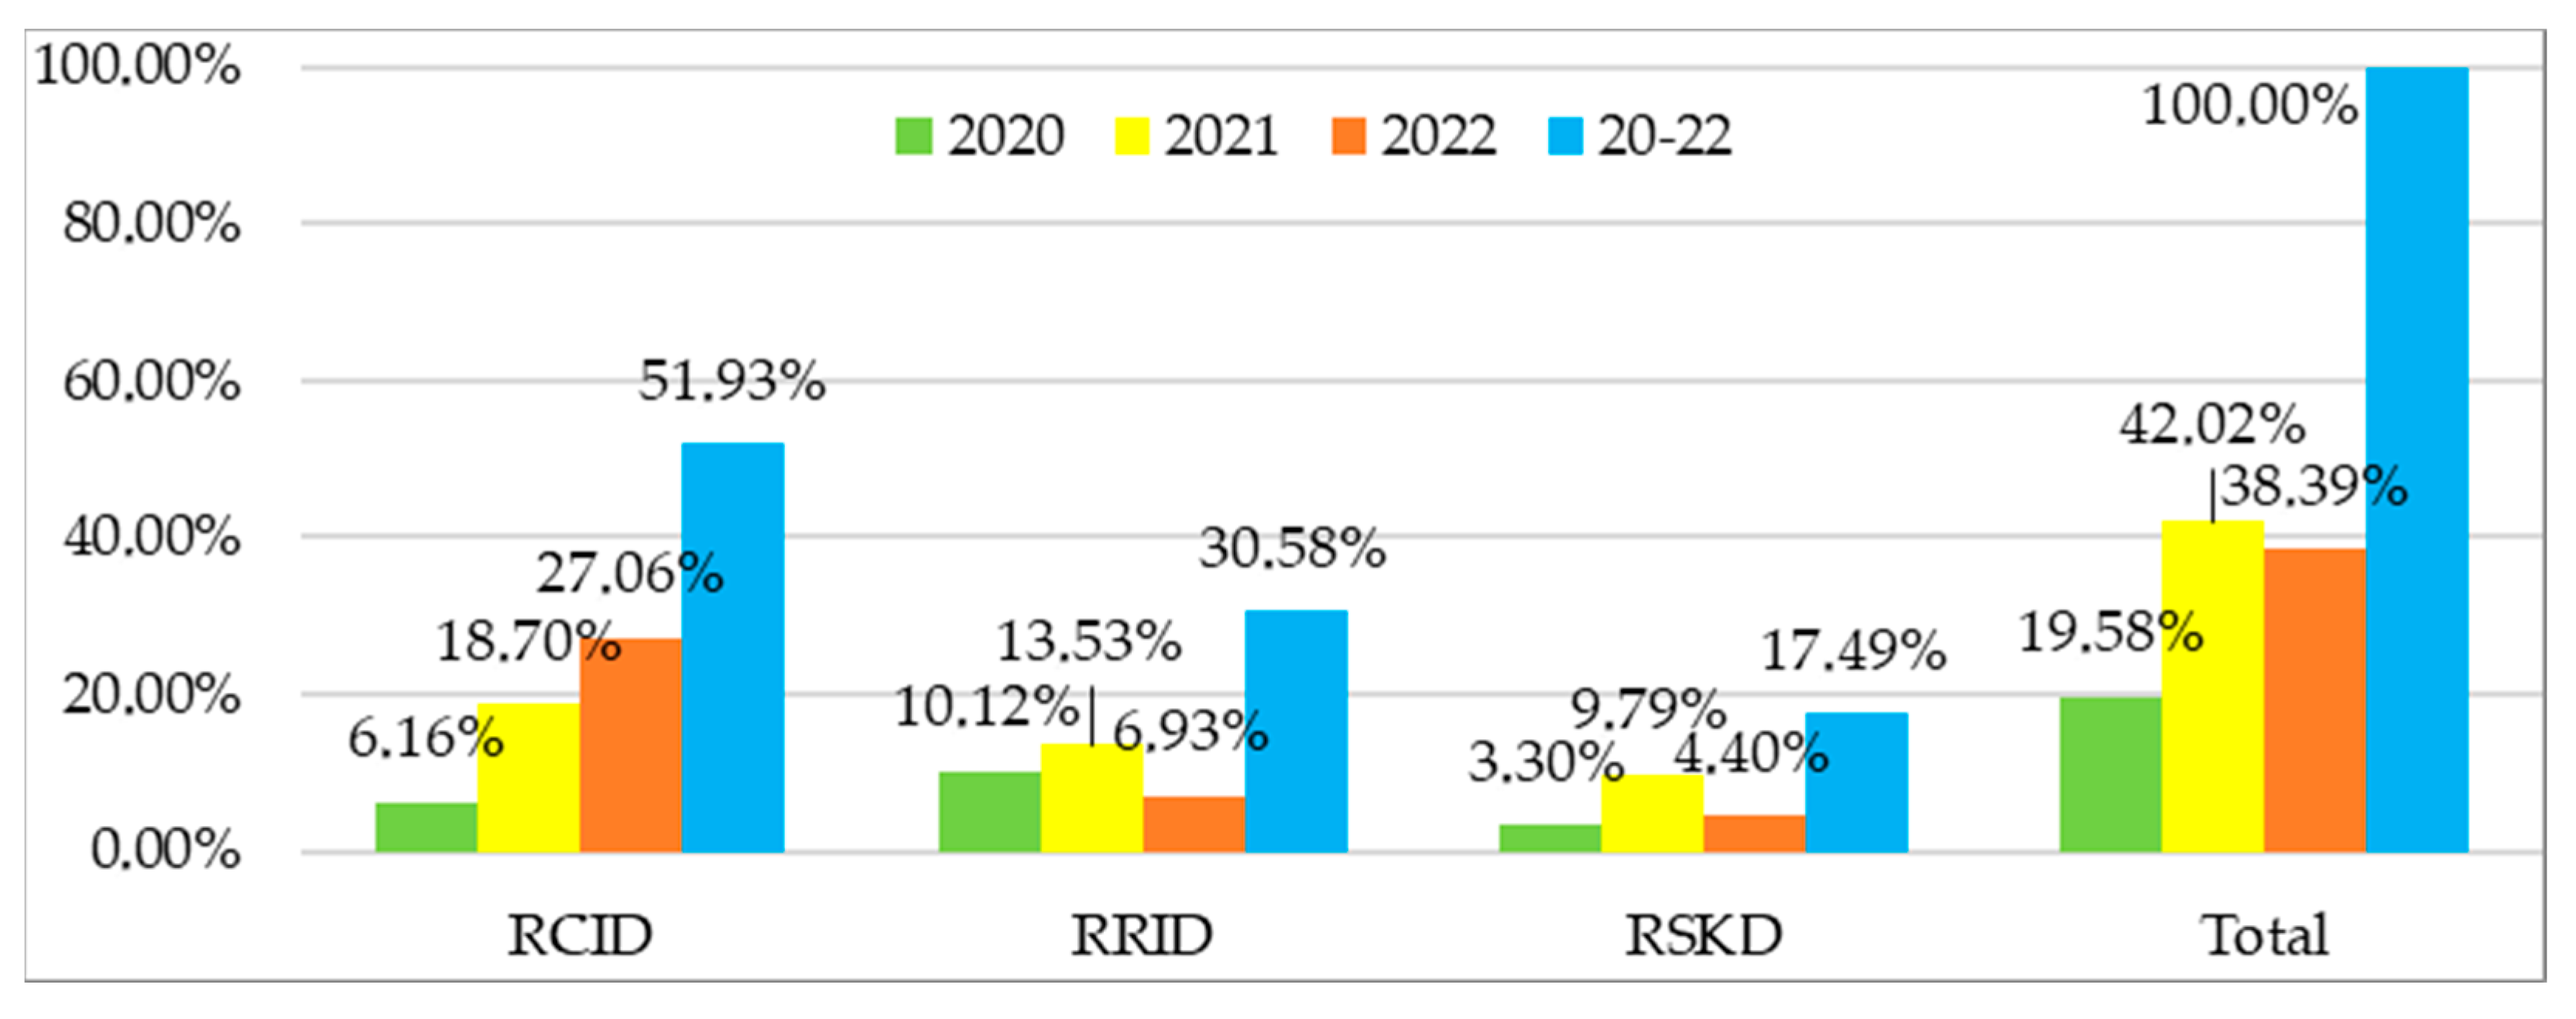
3.1.1. Statistical Assessment of Failures in STD—Sofia

Based on the number of failures given in the Annual consolidated activity reports and using Equations (1) and (2), the total number of failures of all device types and the corresponding percentage ratio was calculated. The results obtained are shown graphically in Figure 1a–d (respectively, for years 2020, 2021, 2022 and for the entire period).
Similarly, the total duration of failures of all device types and the corresponding percentage ratio for the four periods was calculated using the Equations (3) and (4).
It can be seen that the failures of interlocking devices and their duration have a relatively low proportion, as well as a relatively short recovery time. These are indoor devices located in special rooms at railway stations, unlike all other equipment, which is located outdoors (excluding ATC) and is subject to the effects of climatic conditions (rain, snow, humidity, temperature, etc.) [49,50,51]. There is also a greater likelihood of theft, vandalism, encroachment, and damage due to activities of external organisations, etc.
It can also be noted that despite the low number and proportion of failures of TcD, their duration is relatively high. These failures are mainly on the external telecommunications lines (only 3.74% of failures, but around 11% of the total recovery time), only seven failures are on the ATC for the entire period, or 0.13%, respectively; their recovery time is also short (only 50.48 h or 0.18%). In general, the duration of failures is the longest for all such devices (rail current circuits—23.24%, lines for providing semi-automatic and automatic interlocking—23.95%, automatic crossing devices—15%, etc.) due to the time required to locate the exact location of the fault and the need to move the repair team there.
The results obtained are shown graphically in Figure 2a–d (respectively, for years 2020, 2021, 2022, and for the entire period).
In the same way, the percentage of failures and their duration can be calculated for individual types of interlocking devices for the four periods.
The data on failures of different types of IlDs are presented graphically in Figure 3 and the data on their duration—in Figure 4. After processing according to the described methodology, results were obtained, which are shown graphically, respectively, in Figure 5 and Figure 6—for each type of IlD by year and for the entire period.
It should be noted that 100% are the values accepted only for IlDs, not for all devices.
The largest number of failures and, accordingly, the longest recovery time are observed with RRID—72.1% of failures and 79.2% of duration, but these are only 6.06% and 6.17% of failures and duration of all signalling devices for the three-year period.
It should be mentioned the low number and share of failures in route computer interlocking devices, as well as their duration. A trend towards a decrease, especially in their number, can be observed. One of the main reasons is a software crash and the need to restart some modules (applications) or the entire system.

3.1.2. Statistical Assessment of Failures in STD—Plovdiv

Similar to the analysis for STD—Sofia, a study of failures and their duration was conducted for the STD—Plovdiv region.
Using the Equations (1) and (2), the total number of failures of all types of signalling devices and the corresponding percentage ratio was calculated and the results obtained are shown graphically in Figure 7a–d (respectively, for years 2020, 2021, 2022, and for the entire period). The total duration of failures of all device types and the corresponding percentage ratio for the four periods was calculated using Equations (3) and (4) and the results obtained are shown graphically in Figure 8a–d (respectively, for years 2020, 2021, 2022, and for the entire period).
Overall, the failures are significantly fewer than those for STD—Sofia. However, it can be seen that the failures of interlocking devices and their duration have significantly higher values compared to those for STD—Sofia. Accordingly, their proportions approach the share of failures and duration of the ESD and IsD. The reason is the modernization of some railway sections in this area: the oldest point machines have been replaced with new ones (in terms of type and functionality requirements); the incandescent lamps of traffic lights have been replaced with LED ones; the network of railway lines equipped with automatic interlocking with axle counters has been expanded; in the PAB, replacement of existing copper cables with optical ones has also been carried out; analogue ATCs have been replaced with digital ones, etc.
All installation and assembly activities require time and are accompanied by a large number of failures until the correct adjustment, regulation, and fit of all elements is achieved—not only of the specific equipment, but also of all devices that work together in the signalling system.
The number of failures of different types of IlDs are presented graphically in Figure 9 and the data on their duration—in Figure 10. After calculating the proportions, results obtained are shown graphically, respectively, in Figure 11 and Figure 12—for each type of IlD by year and for the entire period (as 100% are the values accepted only for IlDs, not for all devices). In this STD, there are no EMIDs, they were replaced in stages with RCIDs and subsequently included in the SCADA system for remote monitoring and control. The large number of RCIDs failures and their duration, as well as the high values of corresponding proportions, are mainly due to the need to ensure the interoperability of the individual software modules (applications) of the computer interlocking device during its installation and especially during implementation into the SCADA system. After commissioning, a particular component may be incorrectly set or adjusted, manufacturing defects may appear in some electronic modules, etc.
On the other hand, the failures of the RRIDs and their duration are significantly lower compared than those for the STD—Sofia (most of them are registered in the oldest RRIDs WSSB type). The recovery time, however, is relatively higher than that of RCIDs—need to replace some relay groups.
The large number of failures and the correspondingly long recovery time of the RCIDs (58% of failures and 51.93% of their duration) represent only 15.17% of the failures of all signalling devices for the three-year period and 11.99% of their duration.

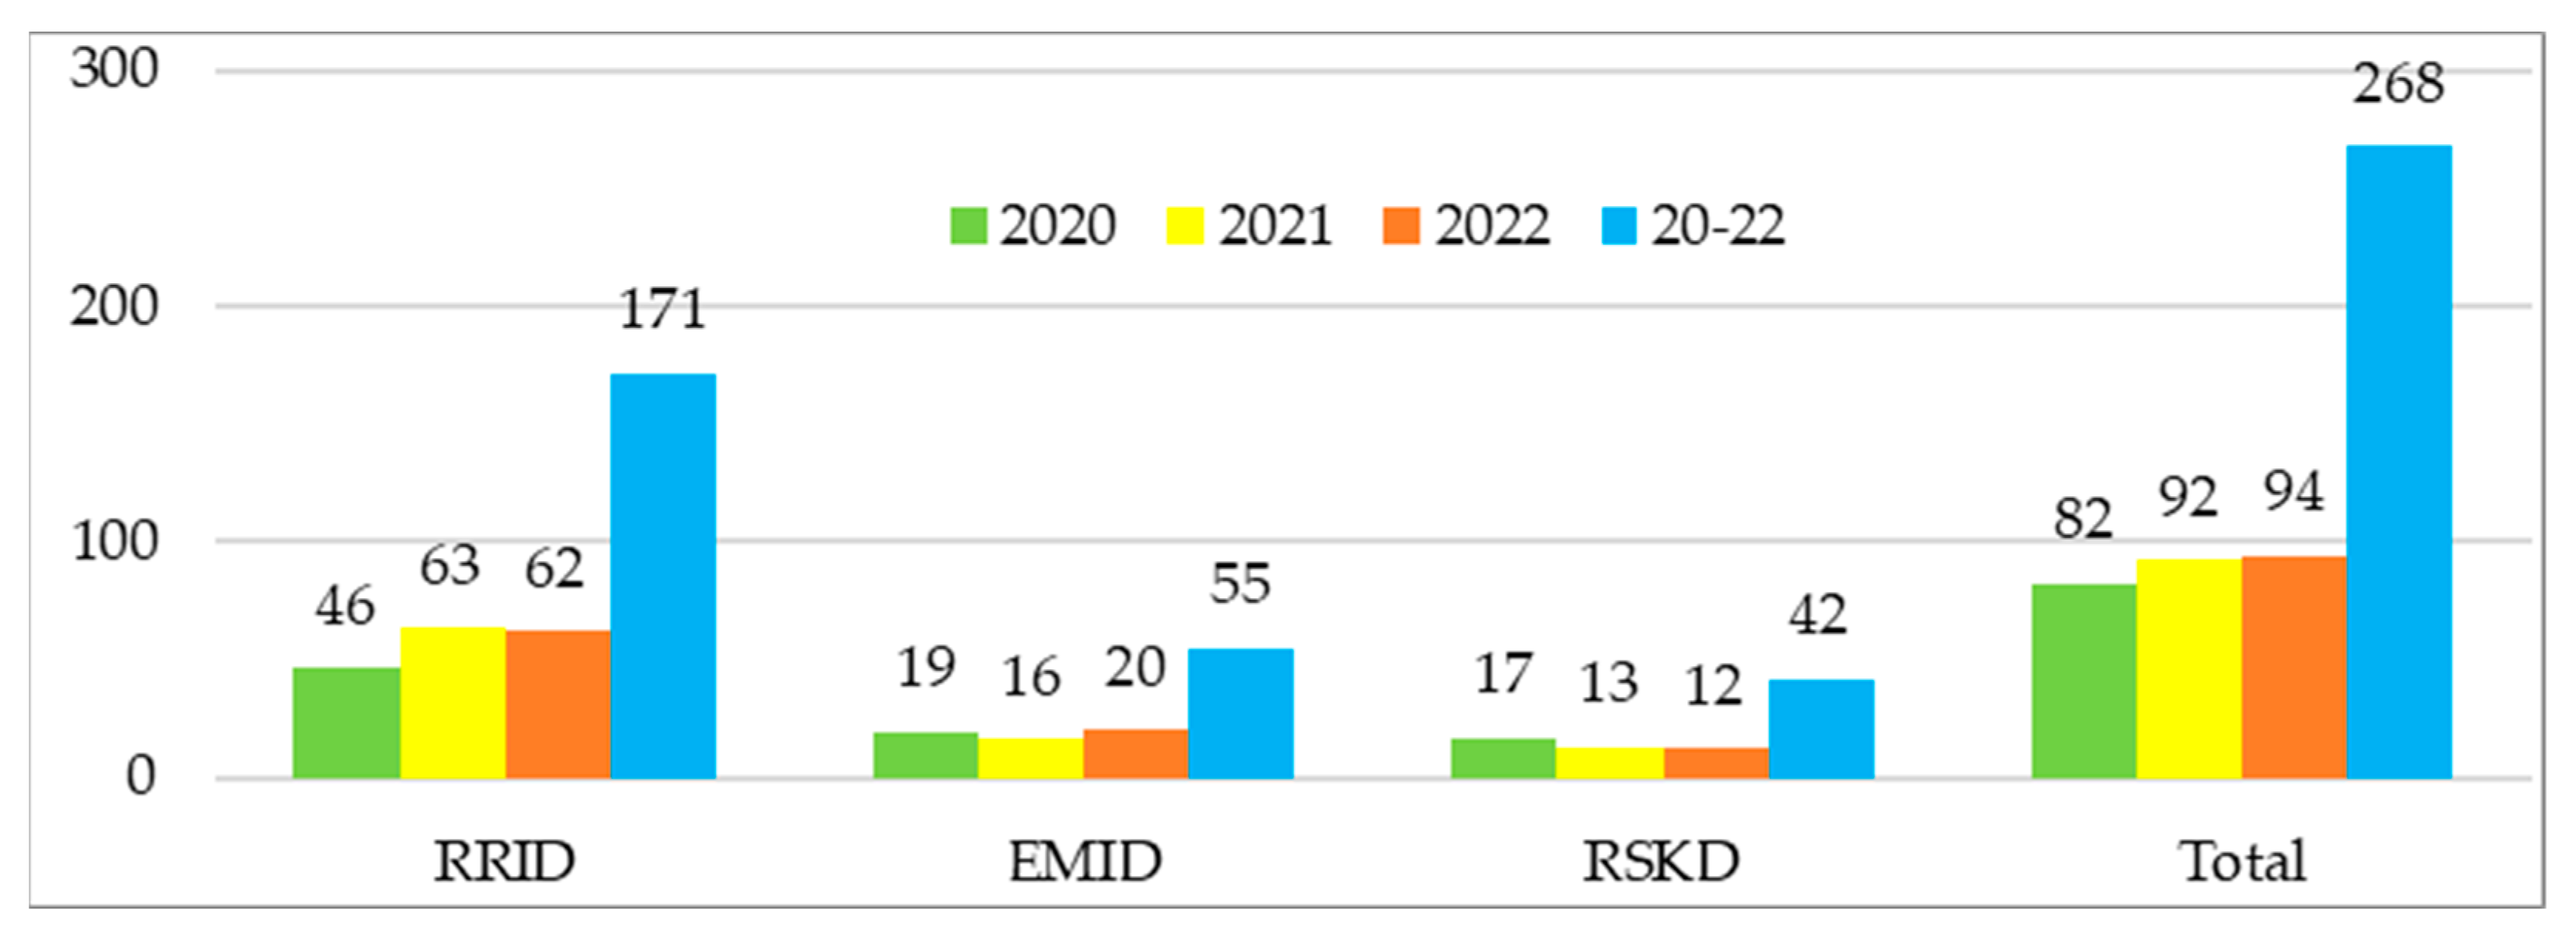
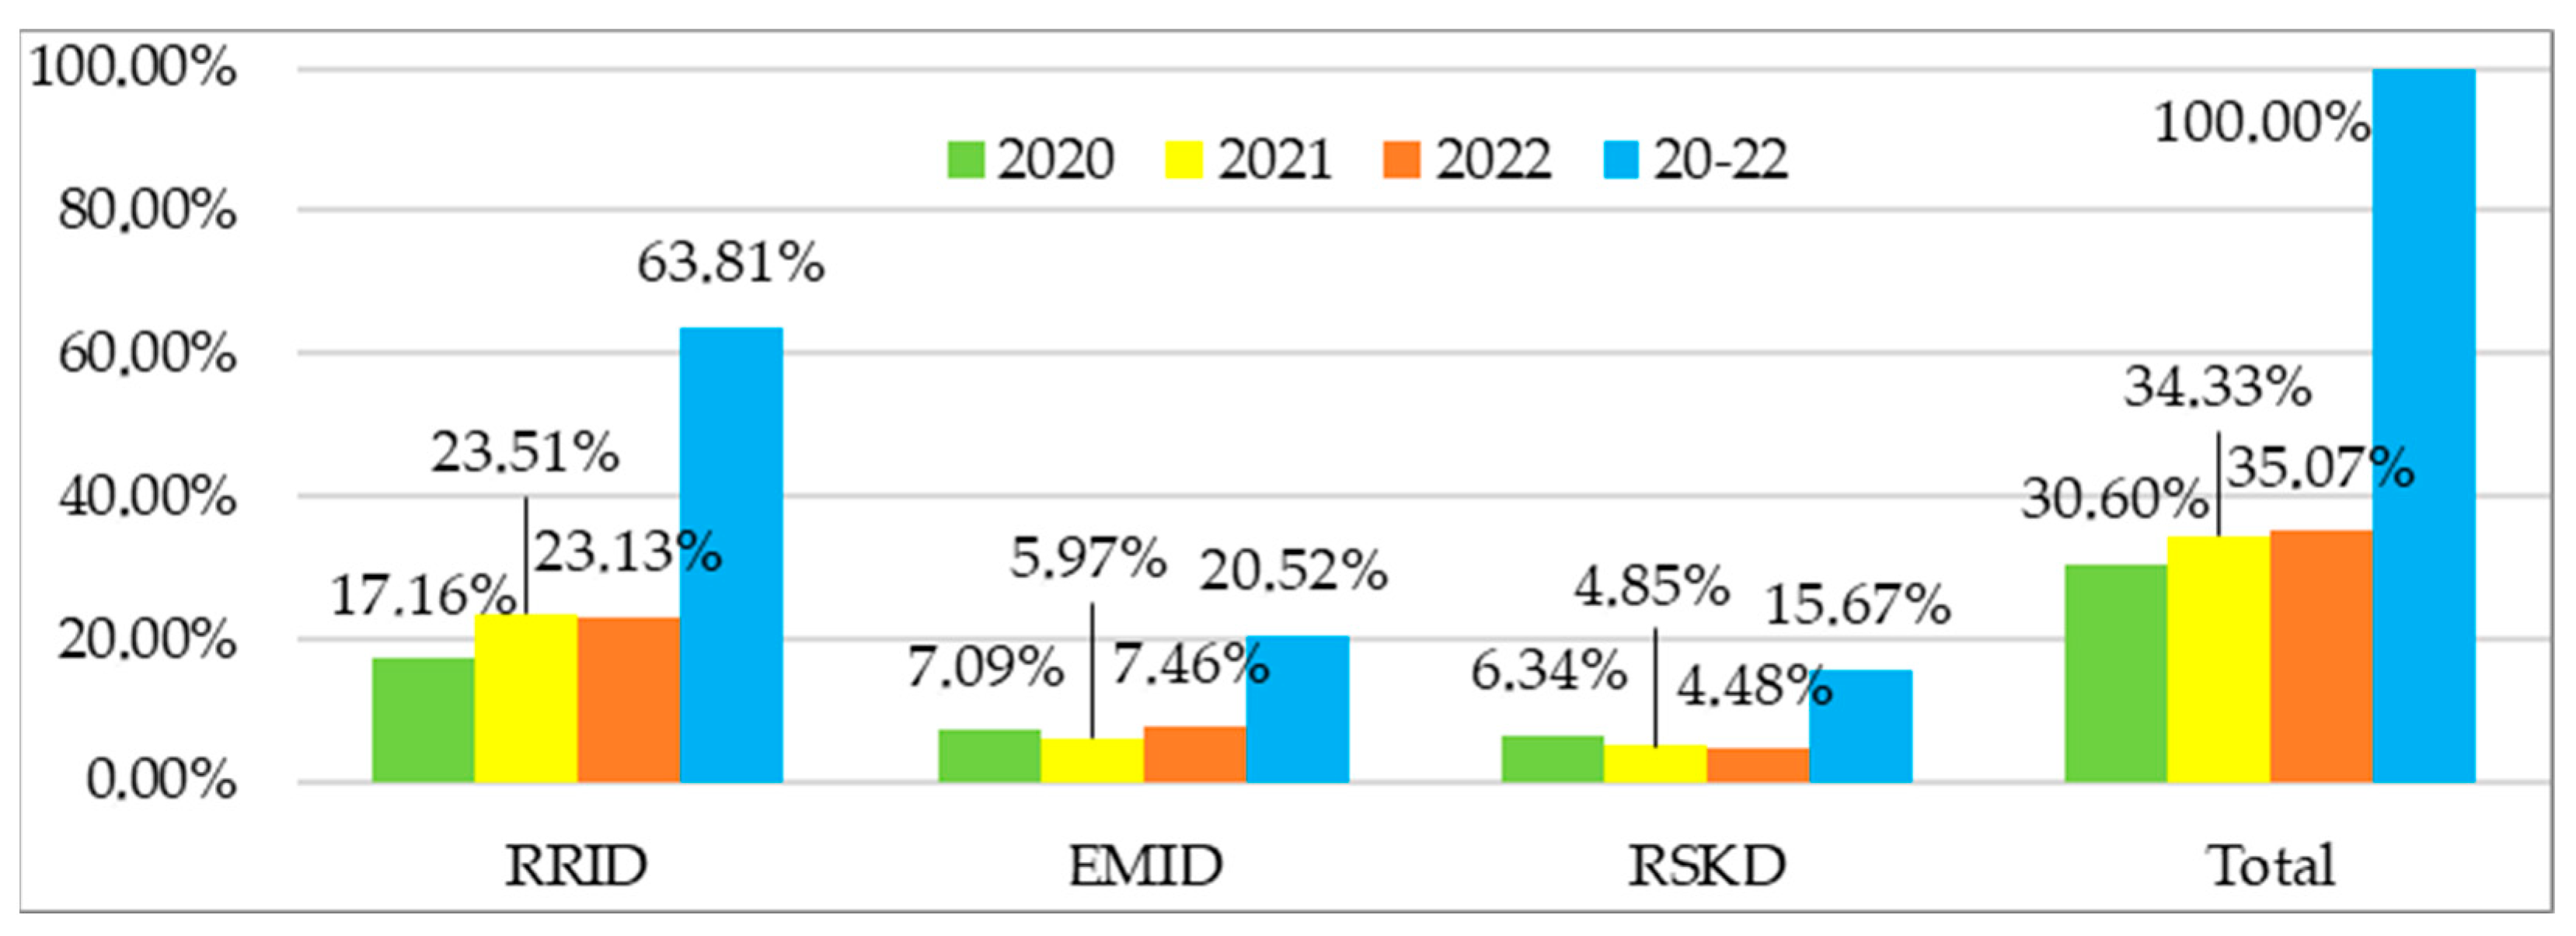
3.1.3. Statistical Assessment of Failures in STD—Gorna Oryahovitsa

Analysis of failures and their duration was carried out also for the region of STD—Gorna Oryahovitsa. Using the Equations (1)–(4), the total number of failures of all types of signalling devices and their duration, as well as the corresponding percentage ratios, were calculated, and the results obtained are shown graphically in Figure 13a–d and in Figure 14a–d (respectively, for years 2020, 2021, 2022 and for the entire period).
The significantly predominant number of ESDs failures and their duration are evident. These are mainly failures of rail current circuits in the station areas (30.12% of all failures and 36.34% of all recovery time)—the state of the isolated joints depends a lot on weather conditions [51]. The bulbs of traffic lights also burned out very often (17.41% of all failures and 12.91% of all recovery time). It should be noted that the signalling equipment in this area is relatively old; many of the installations are depreciated and outdated. A large part of them are more than 40 years old. That is why the failures are significantly more than those for STD—Plovdiv.
Modernization procedures have rarely been carried out. There are programs for the phased replacement of signalling equipment at stations, but they need to be implemented more quickly.
There are also a relatively large number of failures of the interlocking devices—more than those for STD—Sofia and their share is approaching that of IsDs, and in 2021 it even surpassed it.
It should be noted that at the time of the study there are no route computer interlocking devices in this area—the first RCID was put into operation at Sindel station in 2023.
Recovery time is generally shorter compared to IsDs, with the exception of 2021.
The data on failures of different types of IlDs are presented graphically in Figure 15 and the data on their duration—in Figure 16. The obtained results after processing for the proportions are displayed graphically, respectively, in Figure 17 and Figure 18—for each type of IlD by year and for the entire period (as 100% are the values accepted only for IlDs, not for all devices). There is a visible increase in the total number of failures, while their duration is decreasing.
The highest number of failures and, accordingly, the longest duration are observed at RRIDs—63.81% and 58.98%, respectively. These are 10.14% of failures of all signalling devices and 8.13% of the total recovery time. Due to the long-term operation of the relays and relay blocks, their contact systems have been corroded and burned. During the research period, there was still available spare relay equipment of various types, and in case of damage it has been replaced regularly.
An increase in the proportion of failures of EMIDs over the last year can be observed, which proves the need for their gradual replacement with RCIDs.
The largest number of failures and, accordingly, the longest recovery time are observed with RRID—72.1% of failures and 79.2% of duration, but these are only 6.06% and 6.17% of failures and duration of all signalling devices for the three-year period.

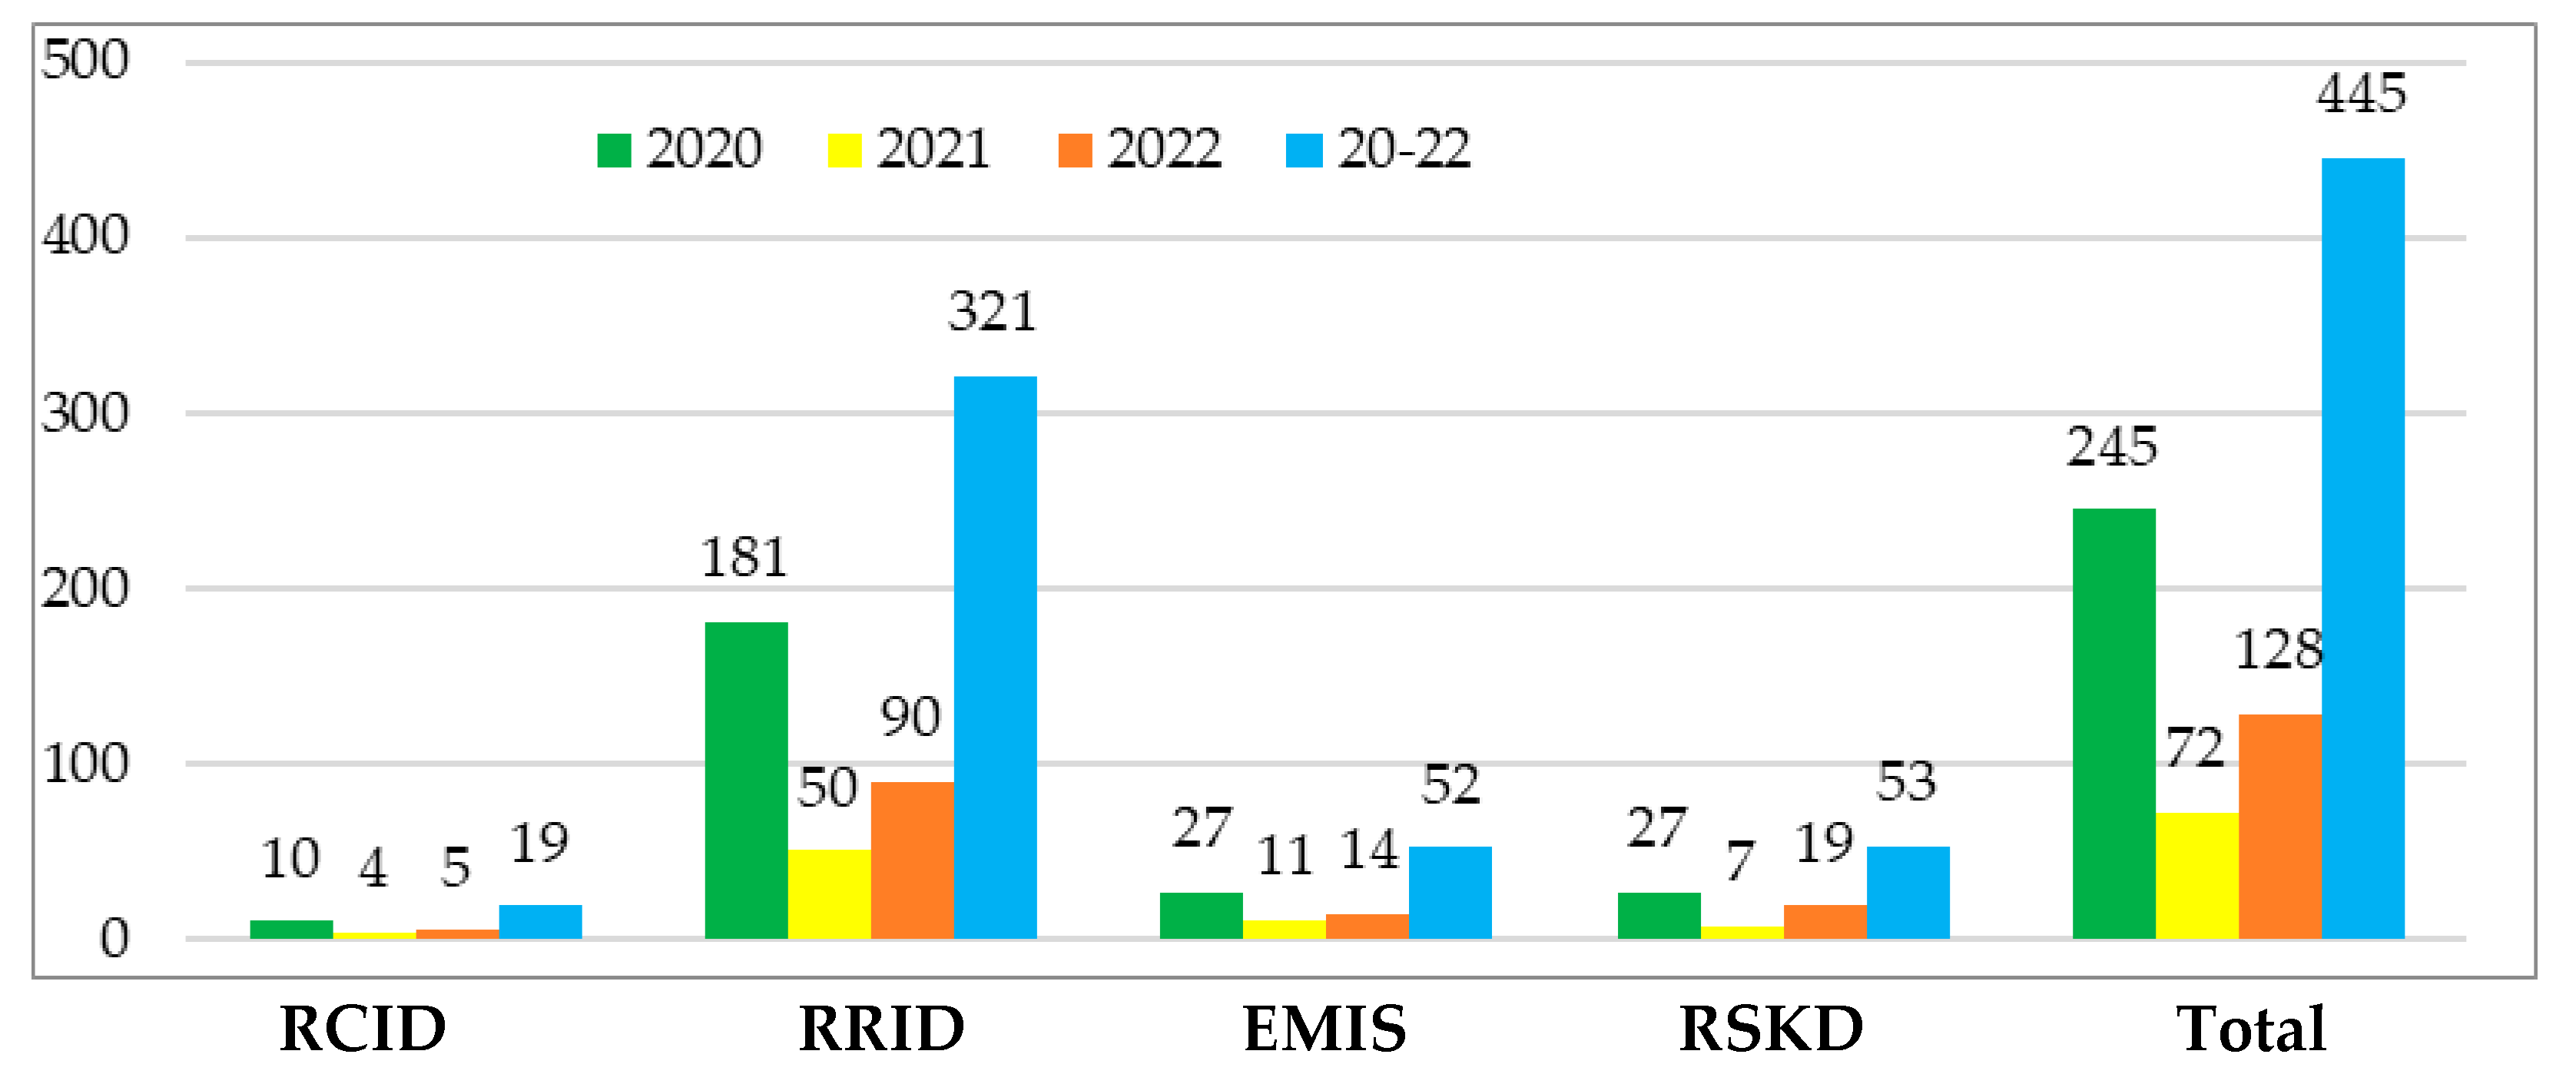
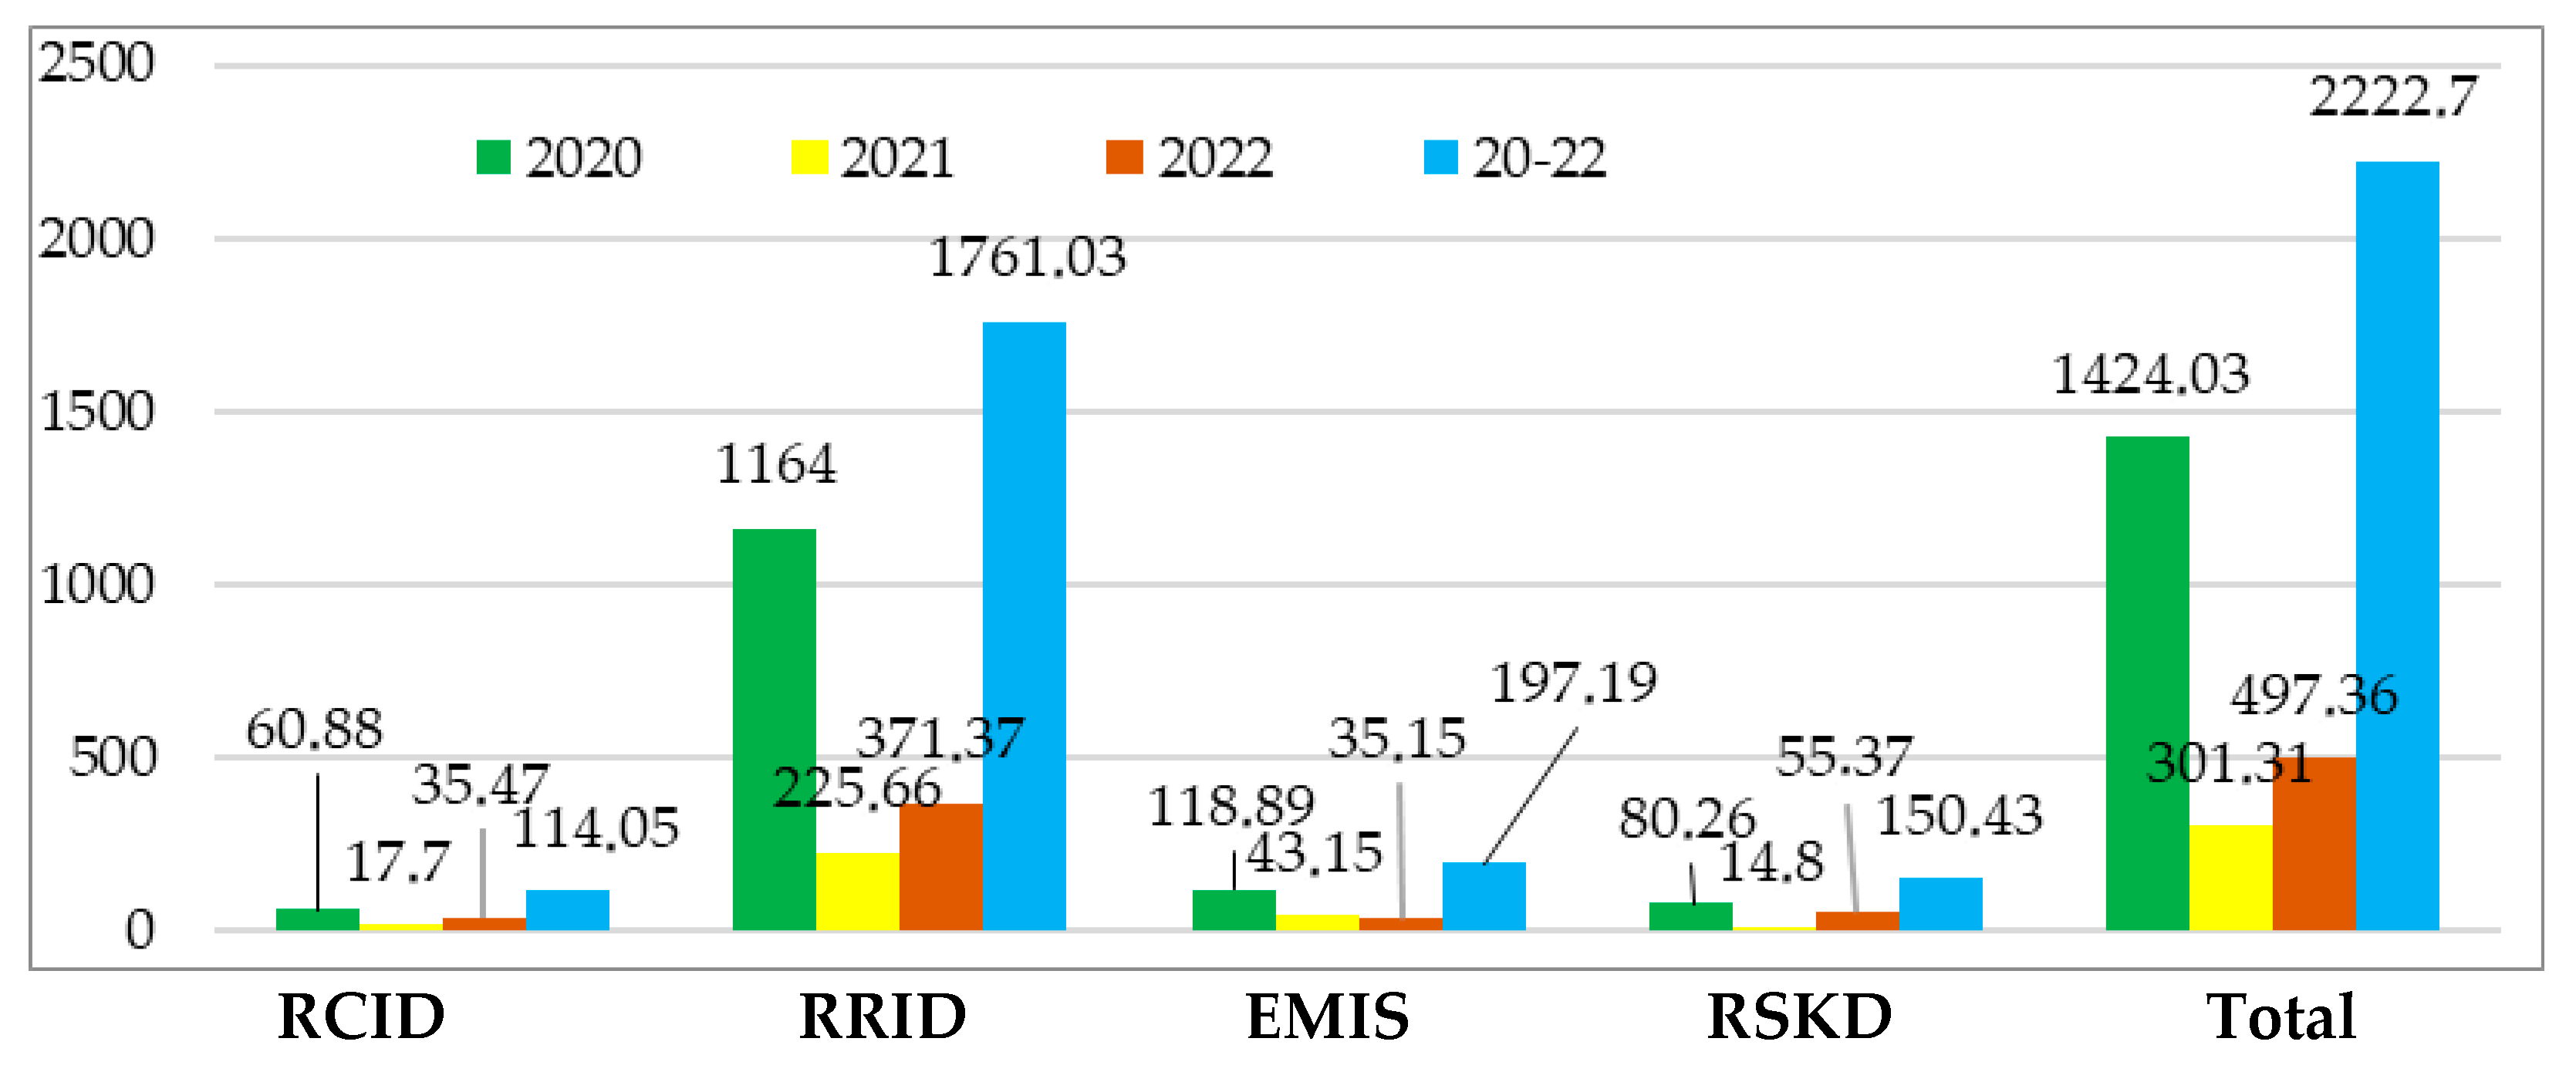
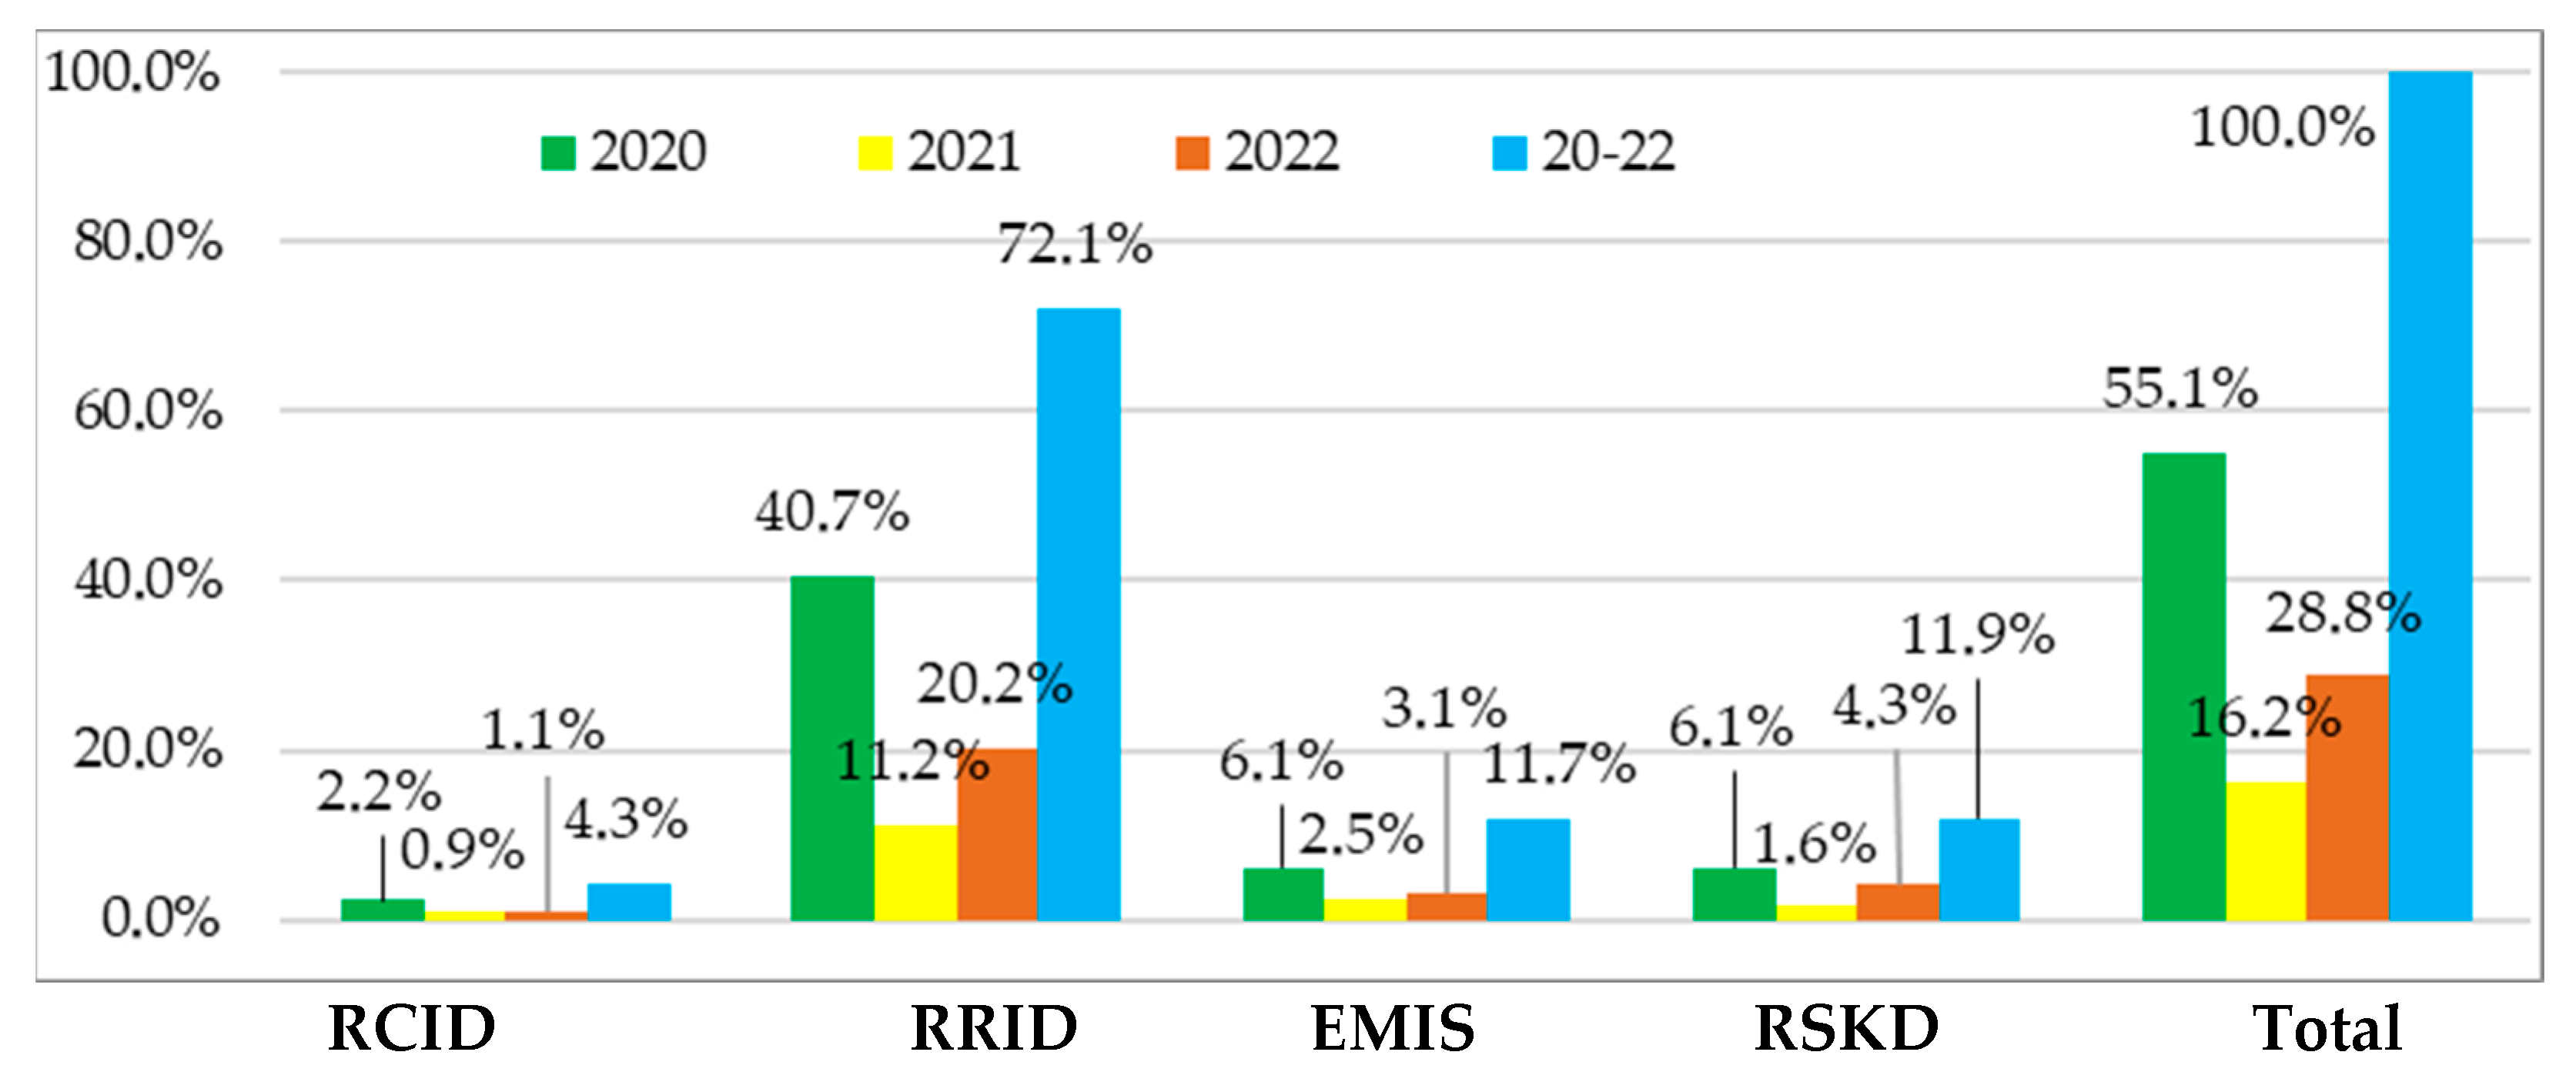
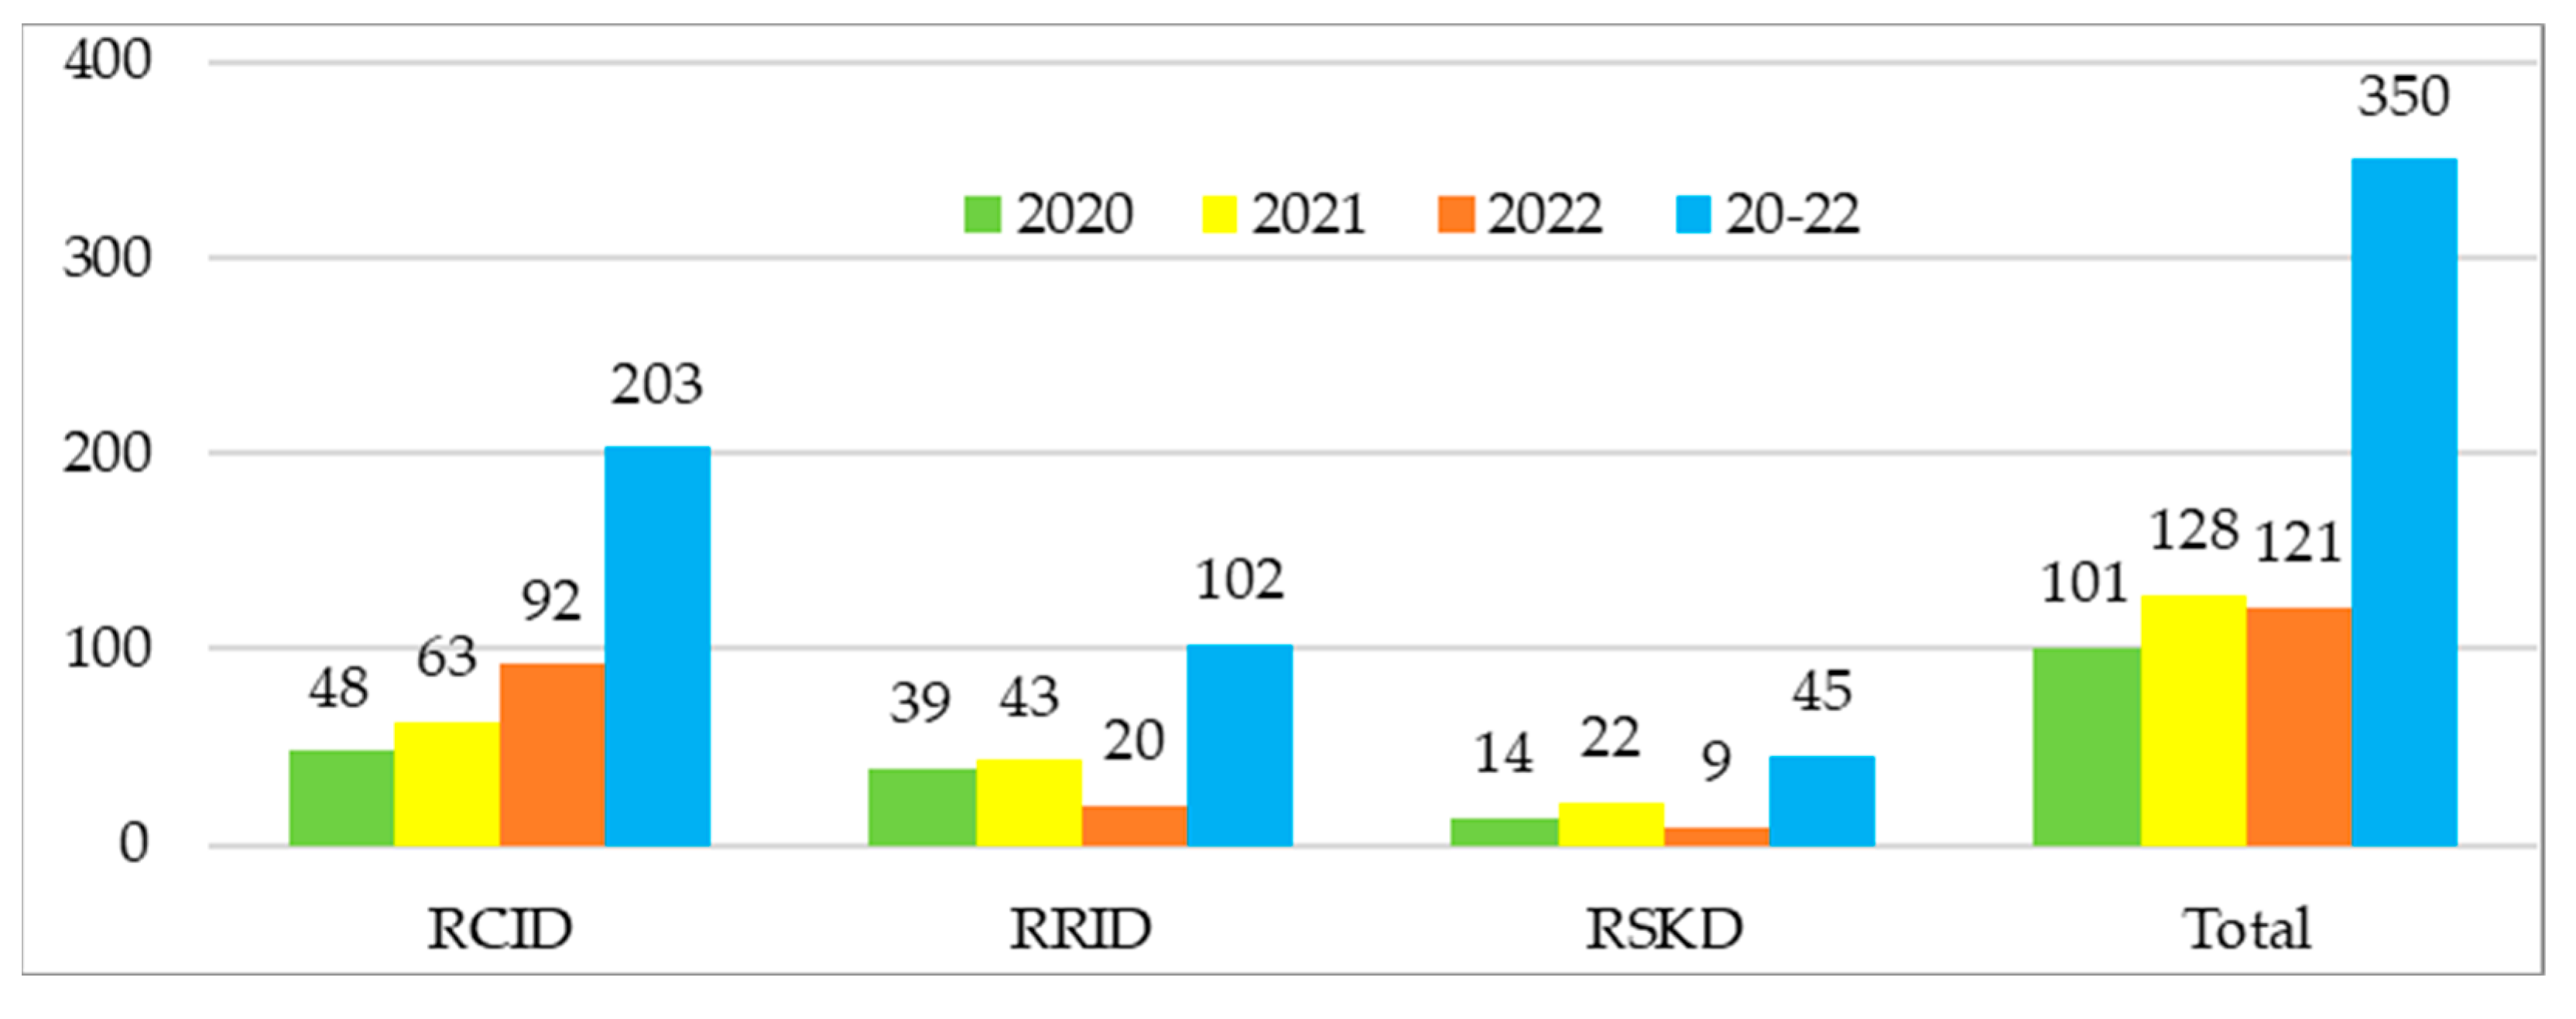
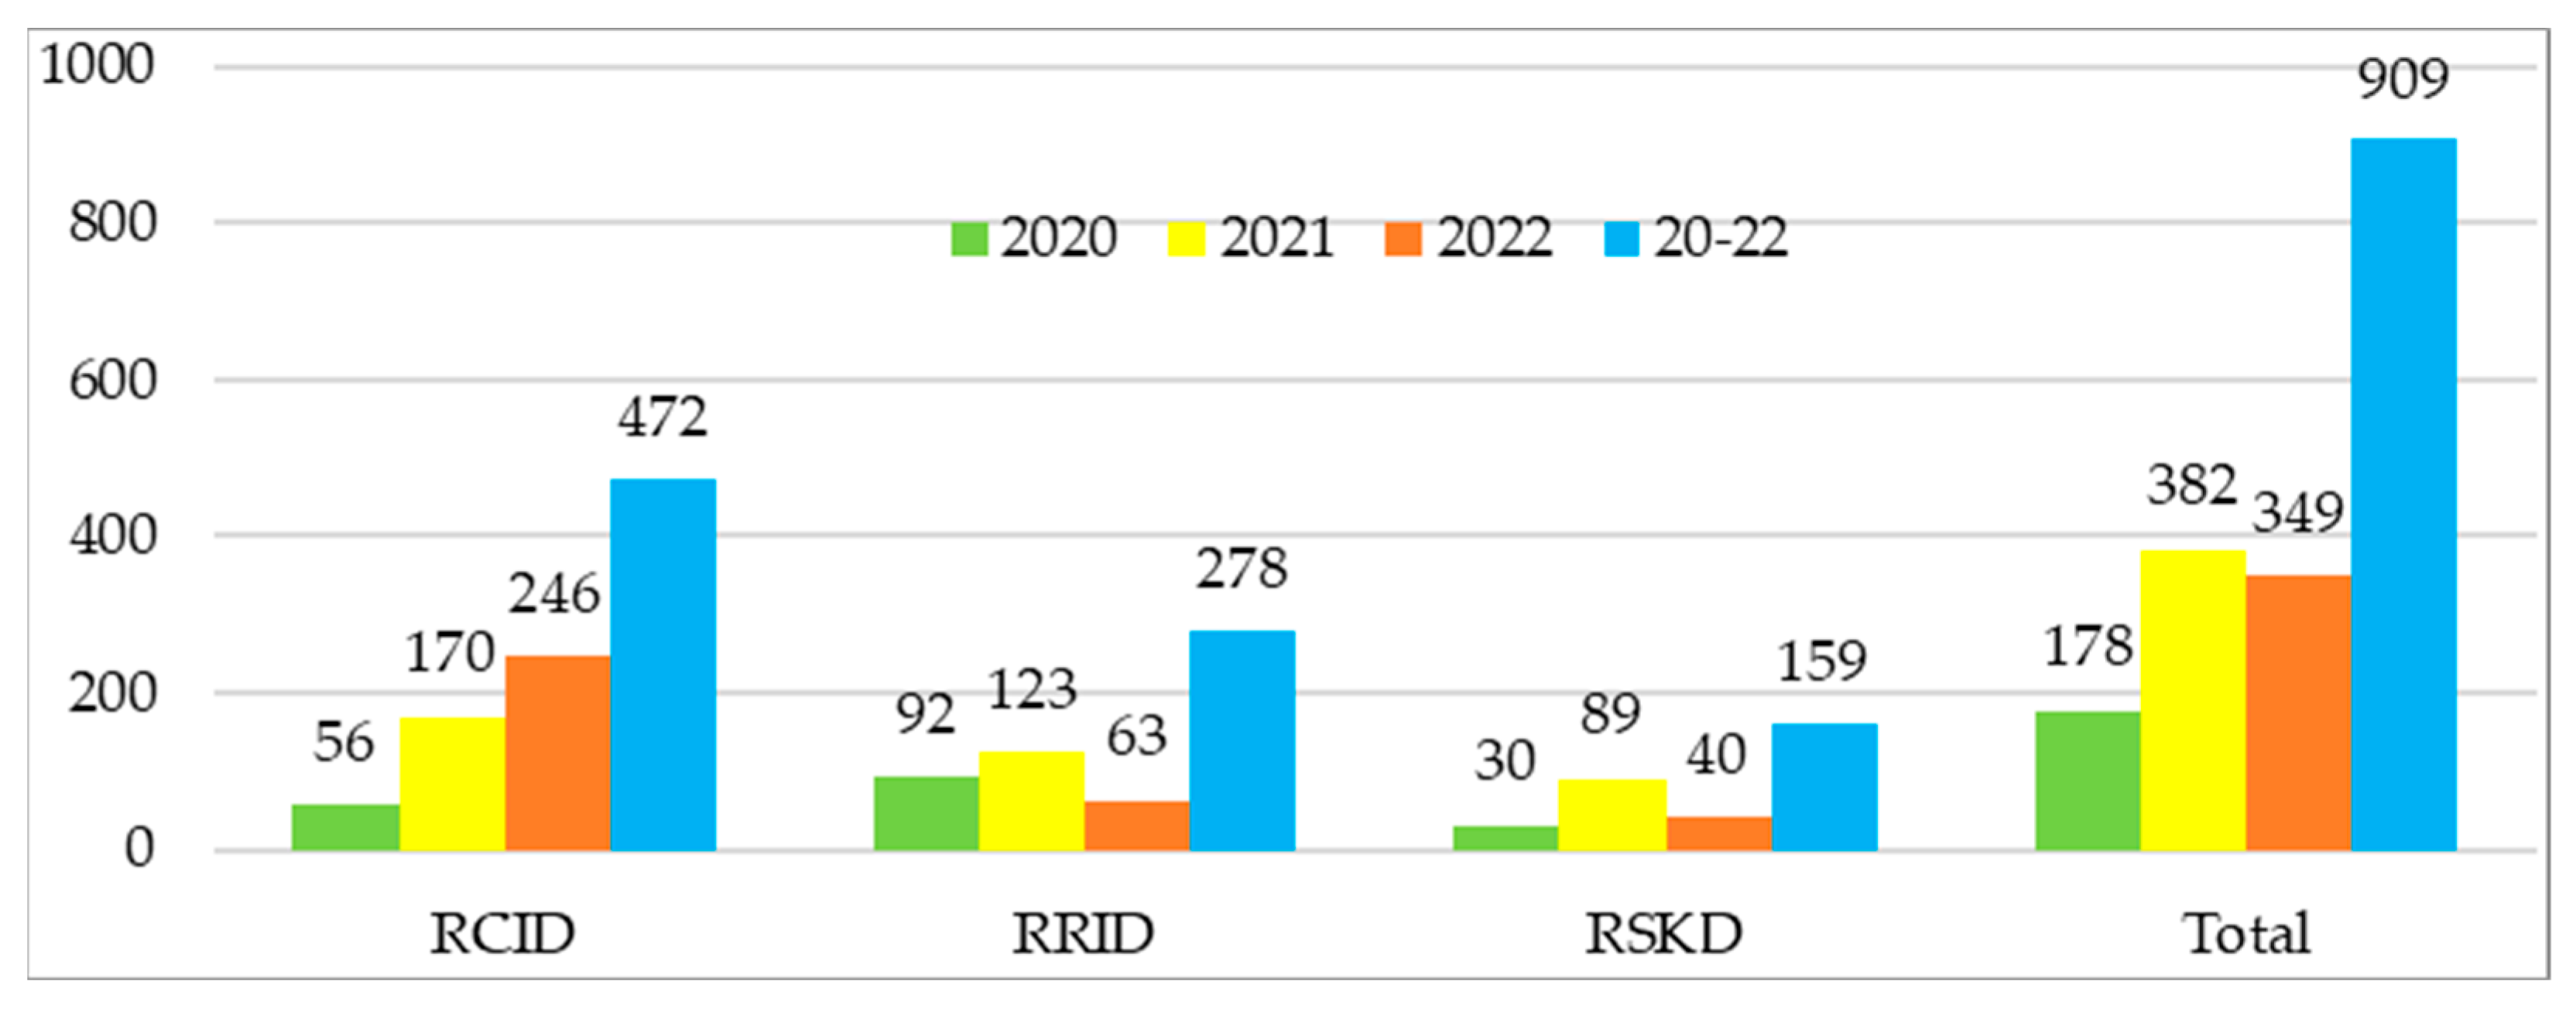
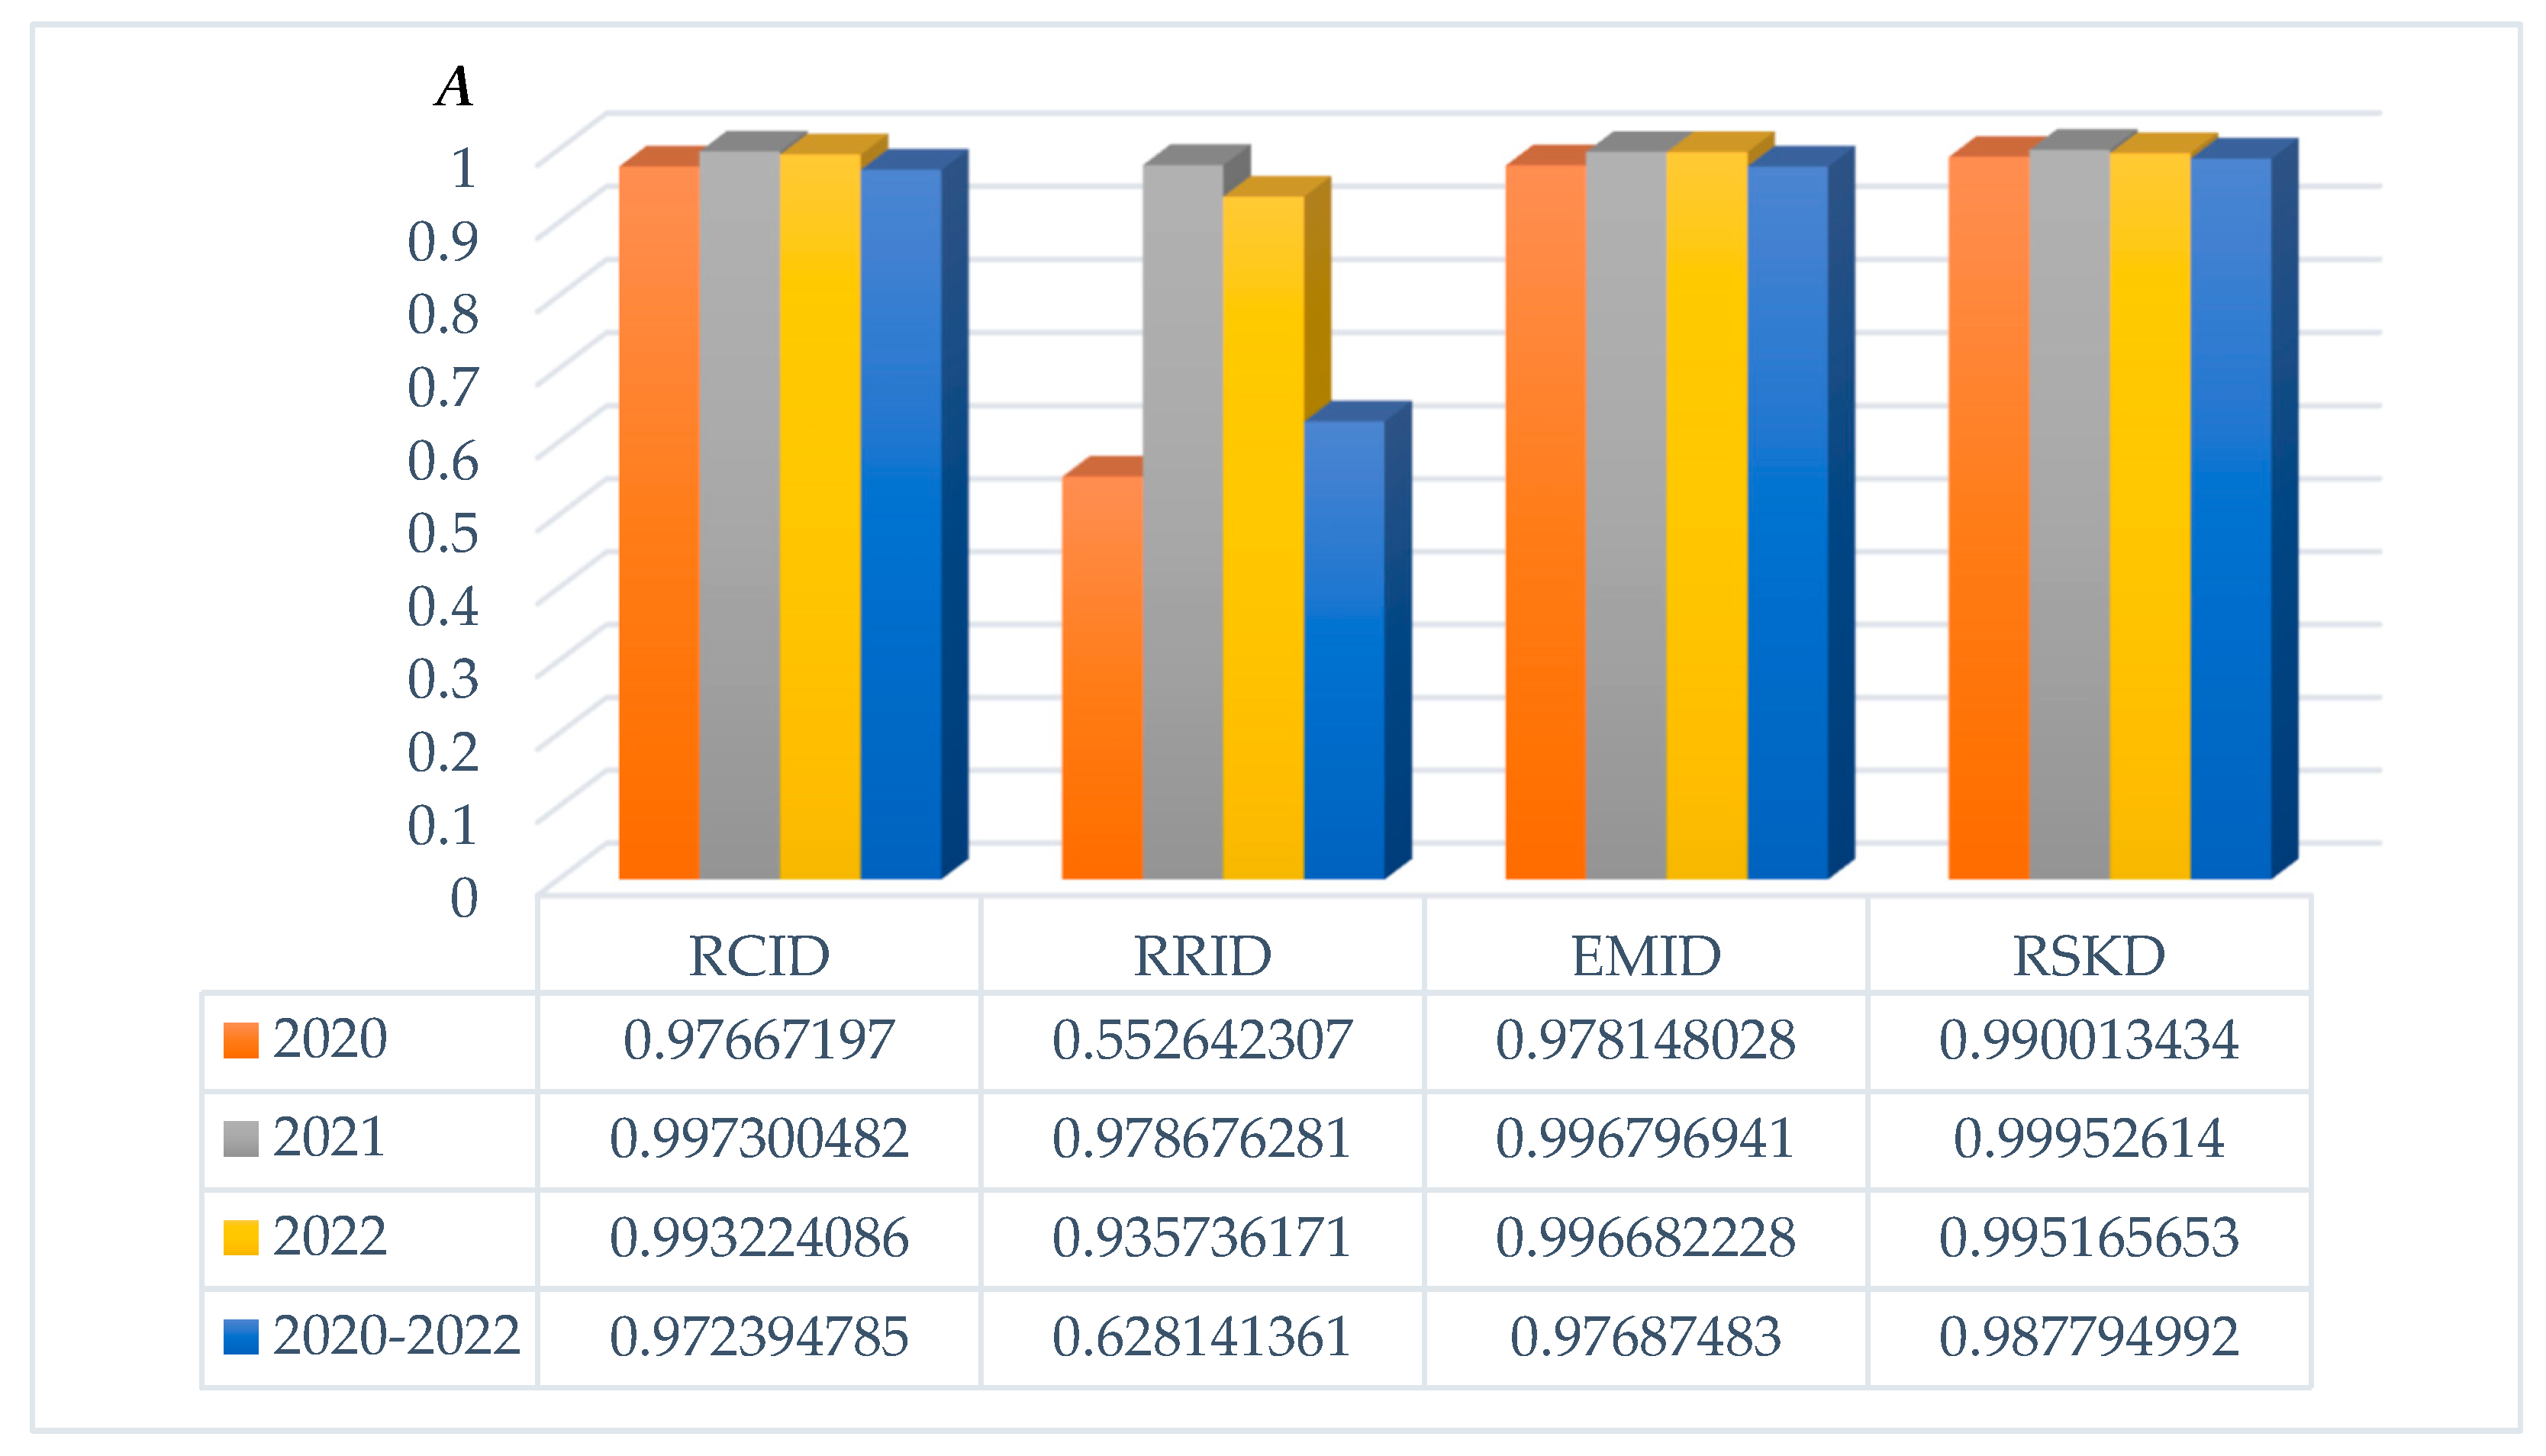
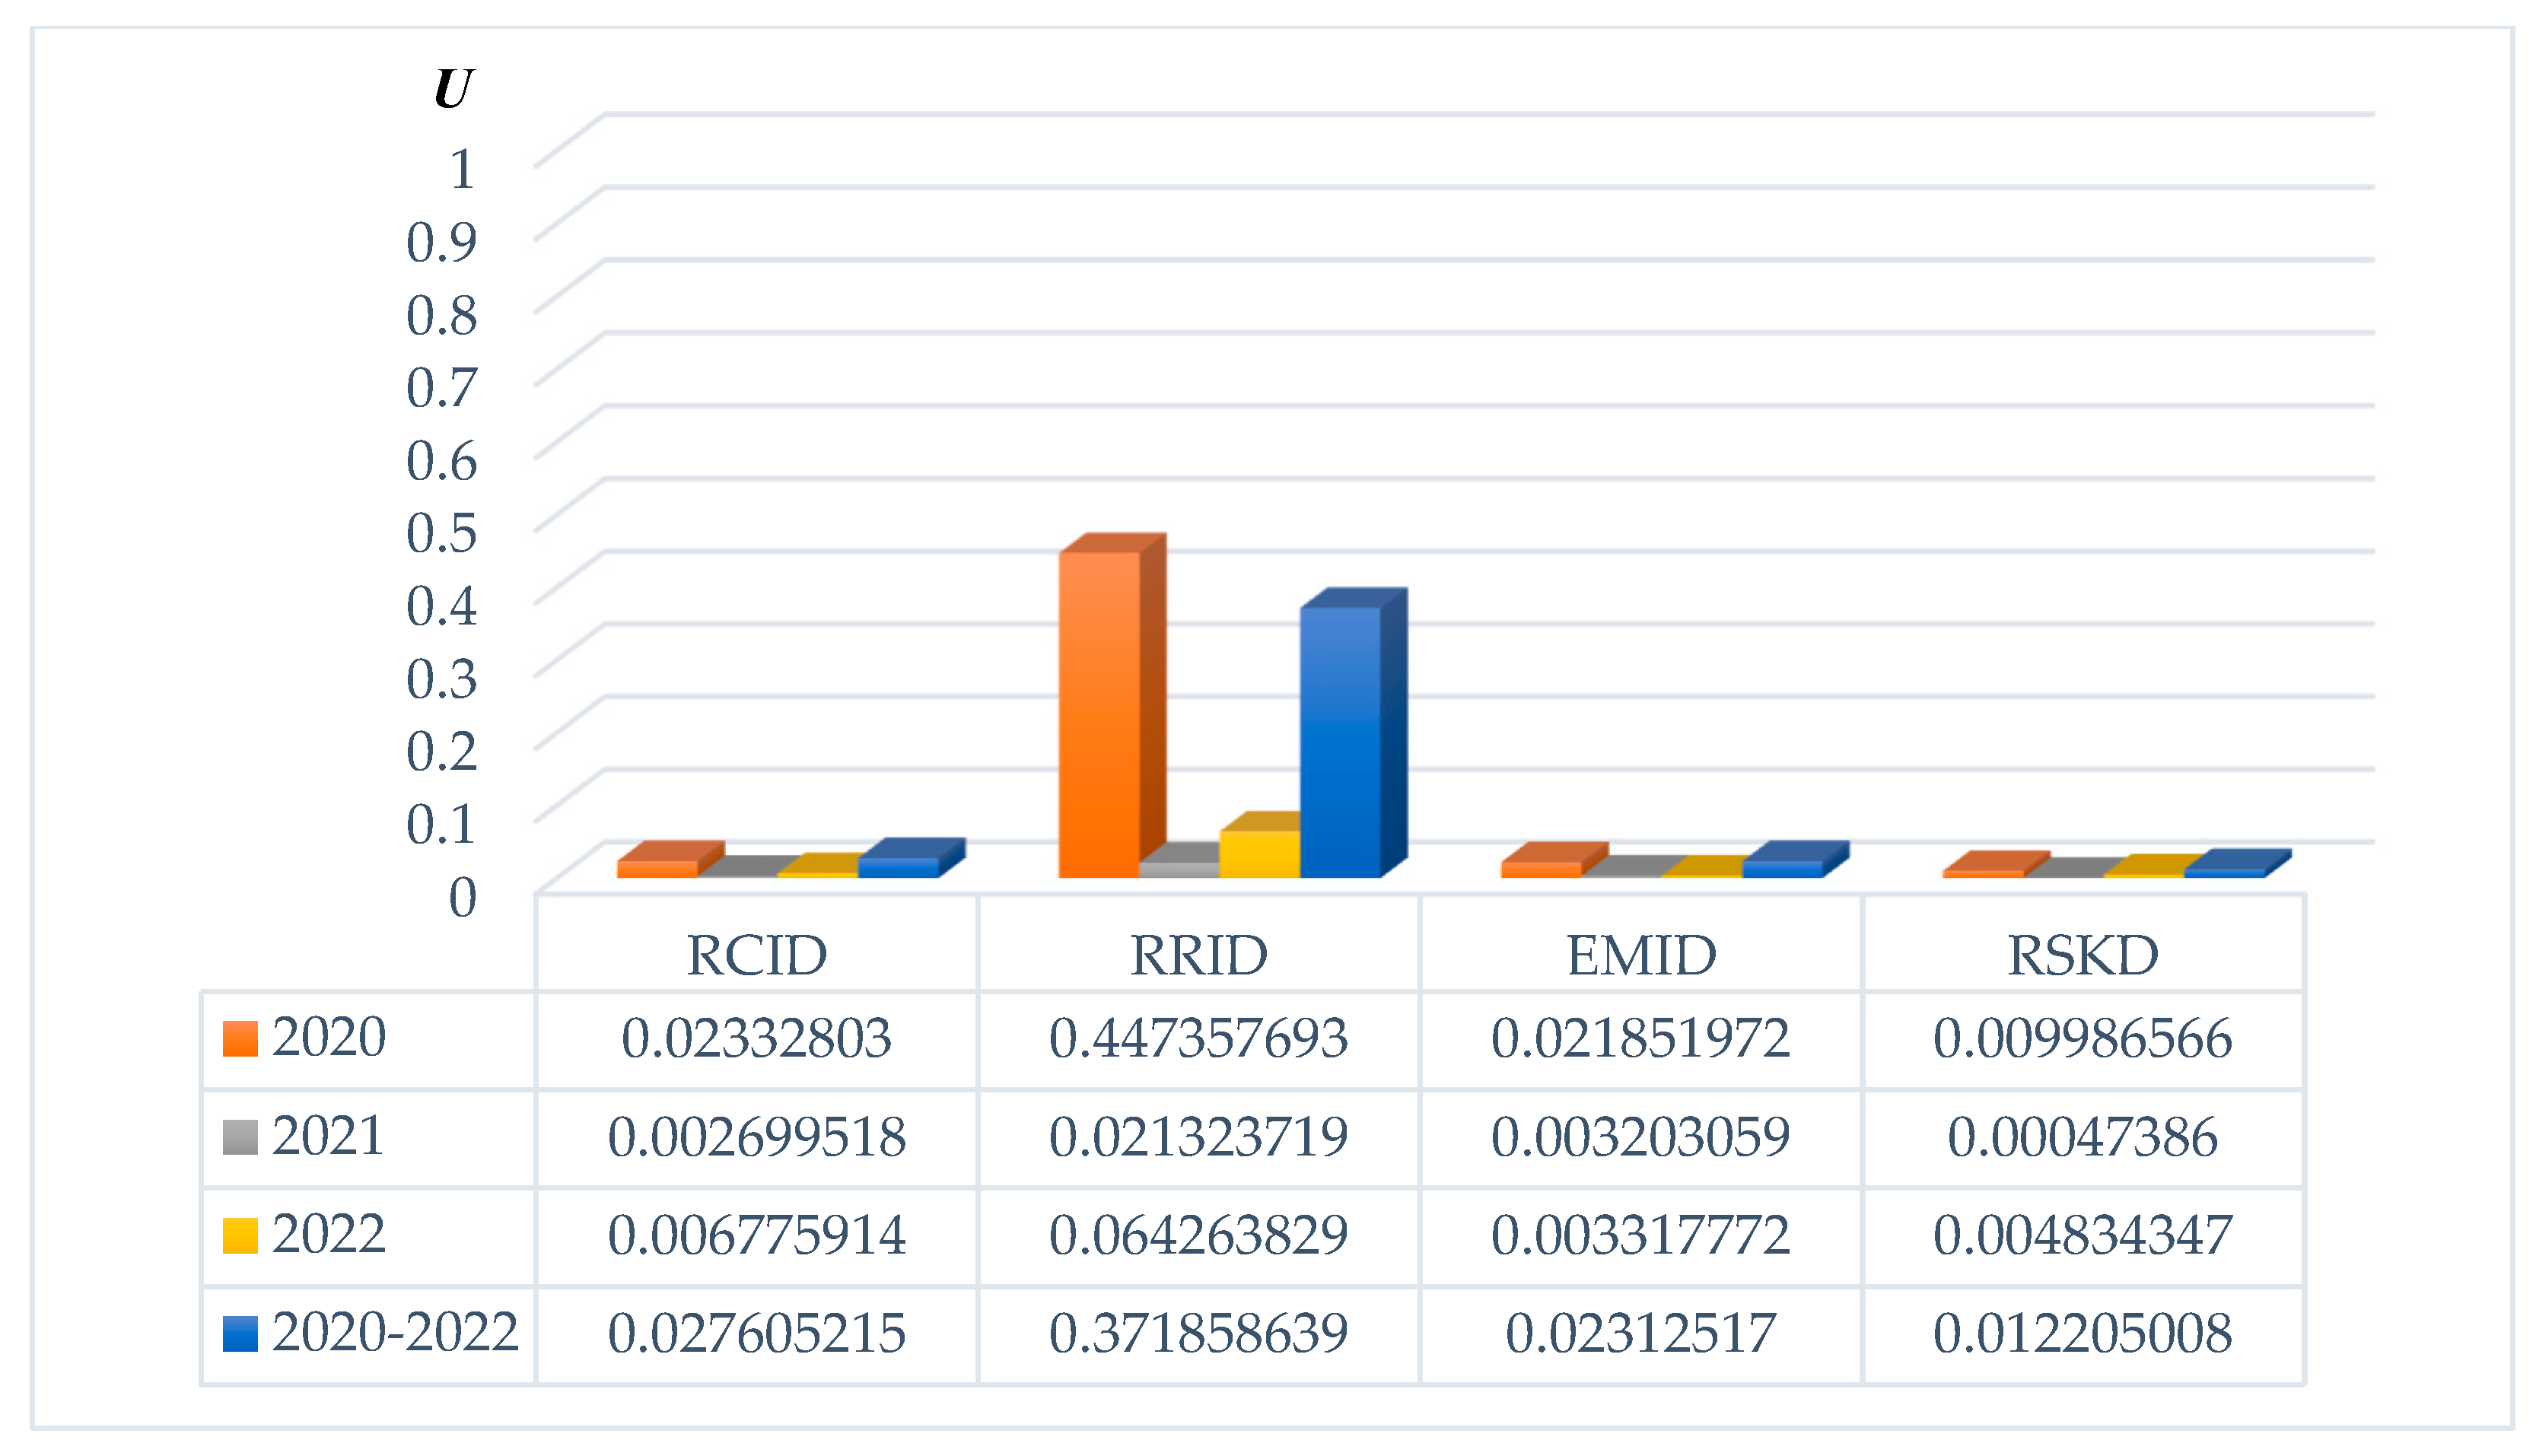
3.2. Reliability Analysis of Failures of the Interlocking Devices

This analysis starts with determining simple reliability indicators—the values of the time for failure-free operation τt) of each type of IlD for the observed time intervals Δt were calculated using the Equation (5), the statistical evaluation of the intensity of the failures flow ω ^ i Δ t —by the Equation (6), and MTBF—by the Equation (7).
Then, the stationary coefficients of availability and unavailability were determined using the Equations (8) and (9).

3.2.1. Reliability Analysis of Failures of the IlDs in STD—Sofia

The values of the time for failure-free operation τt) of each type of IlD for one year (2020, 2021, 2022) and for the three-year period are presented in Figure 19.
The obtained data for the statistical evaluation of the intensity of the failures flow ω ^ i Δ t is shown in Figure 20, and for MTBF—in Figure 21.
It can be seen that despite the small number of failures of RCIDs and their short duration, the values of the intensity of the failure flow of this equipment are high and MTBF is relatively short. This is due to the small number of route-computer interlocking stations in this division—only three, which were implemented at the beginning of the studied period at railway stations around Vidin. After passing the initial tests and adjustments, the MTBF is greater.
It should also be specifically noted that the MTBF of RRIDs has higher values than that of RCIDs.
These results lead to conclusions opposite to those drawn after statistical evaluation of the information. This proves the need for reliability analysis and determination of its indicators. In addition, it can be concluded that MTBF reflects the reliability of the equipment better than the time for failure-free operation τt), since it takes into account not only the recovery time, but also the number of the specific devices and the number or their failures. It can be seen that τt) varies within narrow limits for all devices, while MTBF varies significantly, decreasing for most of the older interlocking devices.
The values determined for the coefficient of availability are shown in Figure 22 and those for the coefficient of unavailability—in Figure 23.
It can be seen that the coefficient of availability of the RCIDs reaches high values regardless of the low MTBF (over 0.99 for 2021 and 2022 and over 0.97 for three-year period). Respectively, the coefficient of unavailability of these IlDs is low. This can be explained by the shorter recovery time than other types of IlD (see Figure 4).
The coefficient of unavailability is highest for RRIDs, which are a large part of IlDs in this area and are also relatively old. It reaches very high values, especially in 2020. The duration of failures of these IlDs is also significantly higher than that of all the devices under study. Therefore, some of the RRIDs should be gradually replaced by route-computer interlocking devices. Another way to reduce the recovery time is to implement RRIDs into a SCADA system for remote monitoring and control.
The average values of the availability and unavailability coefficients were also calculated using Equations (11) and (12), and the obtained values are systematised in Table 2 (compared with the values for the three-year period).
It is clearly visible that the average values of the availability coefficients for several years are higher than the values for a three-year period for all ILDs and therefore should not be calculated, as this may lead to wrong decisions regarding maintenance, system upgrades and modernization of the devices.
Coefficients of availability and unavailability for the entire research period should be determined only according to the described methodology.

3.2.2. Reliability Analysis of Failures of the IlDs in STD—Plovdiv

The values obtained for the time for failure-free operation τt), for the statistical evaluation of the intensity of the failures flow ω ^ i Δ t , and for MTBF of each type of IlD for the different periods are shown in Figure 24, Figure 25, and Figure 26, respectively.
It is noteworthy that the MTBF values for RCIDs are low. This can be explained as follows: the structure of the RCIDs includes a large number of electronic boards—processors (Local Control Unit LCU, Remote Control Unit RCU), modules for providing connection to the computer of the dispatcher on duty and man-machine interface MMI, central, element, communication, and interface controllers, etc. All of them are duplicated (permanent redundancy is implemented)—one component works as the main one (primary), and the second (the backup element) works together with the main one and in case of a failure of the primary element, it immediately begins to perform its functions.
The interface modules provide connection to external station devices—point machines, traffic lights, train presence detection systems. During modernization activities, when replacing old point machines with new ones and old incandescent lamps with LED ones, overvoltages sometimes occur during commissioning, which lead to damage to the interface modules of RCID connected to the control modules of the corresponding external devices.
Each of the electronic boards also includes diagnostic modules—they record all error and fault messages, including false alarms (for example, for cutting points from the control modules of the point machines). All these error messages are sent to the system server and are recorded as failures in the event logs and are subsequently included in the Annual consolidated activity reports issued by NRIC. In reality, most of them do not lead to a complete failure of the relevant RCID, but only to a short-term suspension of the operation of an individual main module until standby is activated (usually of a few seconds). In the worst case, it may be necessary to restart only the relevant module. However, the duration of the failure is recorded as the time for replacing the defective board and turning it on as a hot spare—only then is the module considered to be working correctly.
The values calculated for the coefficient of availability are shown in Figure 27 and these for the coefficient of unavailability—in Figure 28.
It can be seen that the values of the coefficient of availability of the RCIDs are relatively low and, accordingly, those of the coefficient of unavailability are relatively high. As mentioned above, these values are determined from the information in NRIC Annual consolidated activity reports. However, in them, there is no specific data only on the failures that led to the complete failure of a RCID—this happens if a large number of safety violations has been accumulated. In reality, for the three-year period there were only four such failures, and for the entire period of operation of the RCIDs there were about one per year. Therefore, it can be assumed that the availability coefficient A 1 and the unavailability coefficient U 0 .
The calculated average values of the availability and unavailability coefficients are systematised in Table 3 (compared with the values for the three-year period).
It is clearly visible again that the average values of the coefficients of availability for several years are higher than the values for a three-year period for all ILDs. This again proves that average values should not be calculated, as this can lead to wrong decisions regarding maintenance, system upgrades, and device modernization. Availability and unavailability ratios for the entire study period should be determined only according to the described methodology.

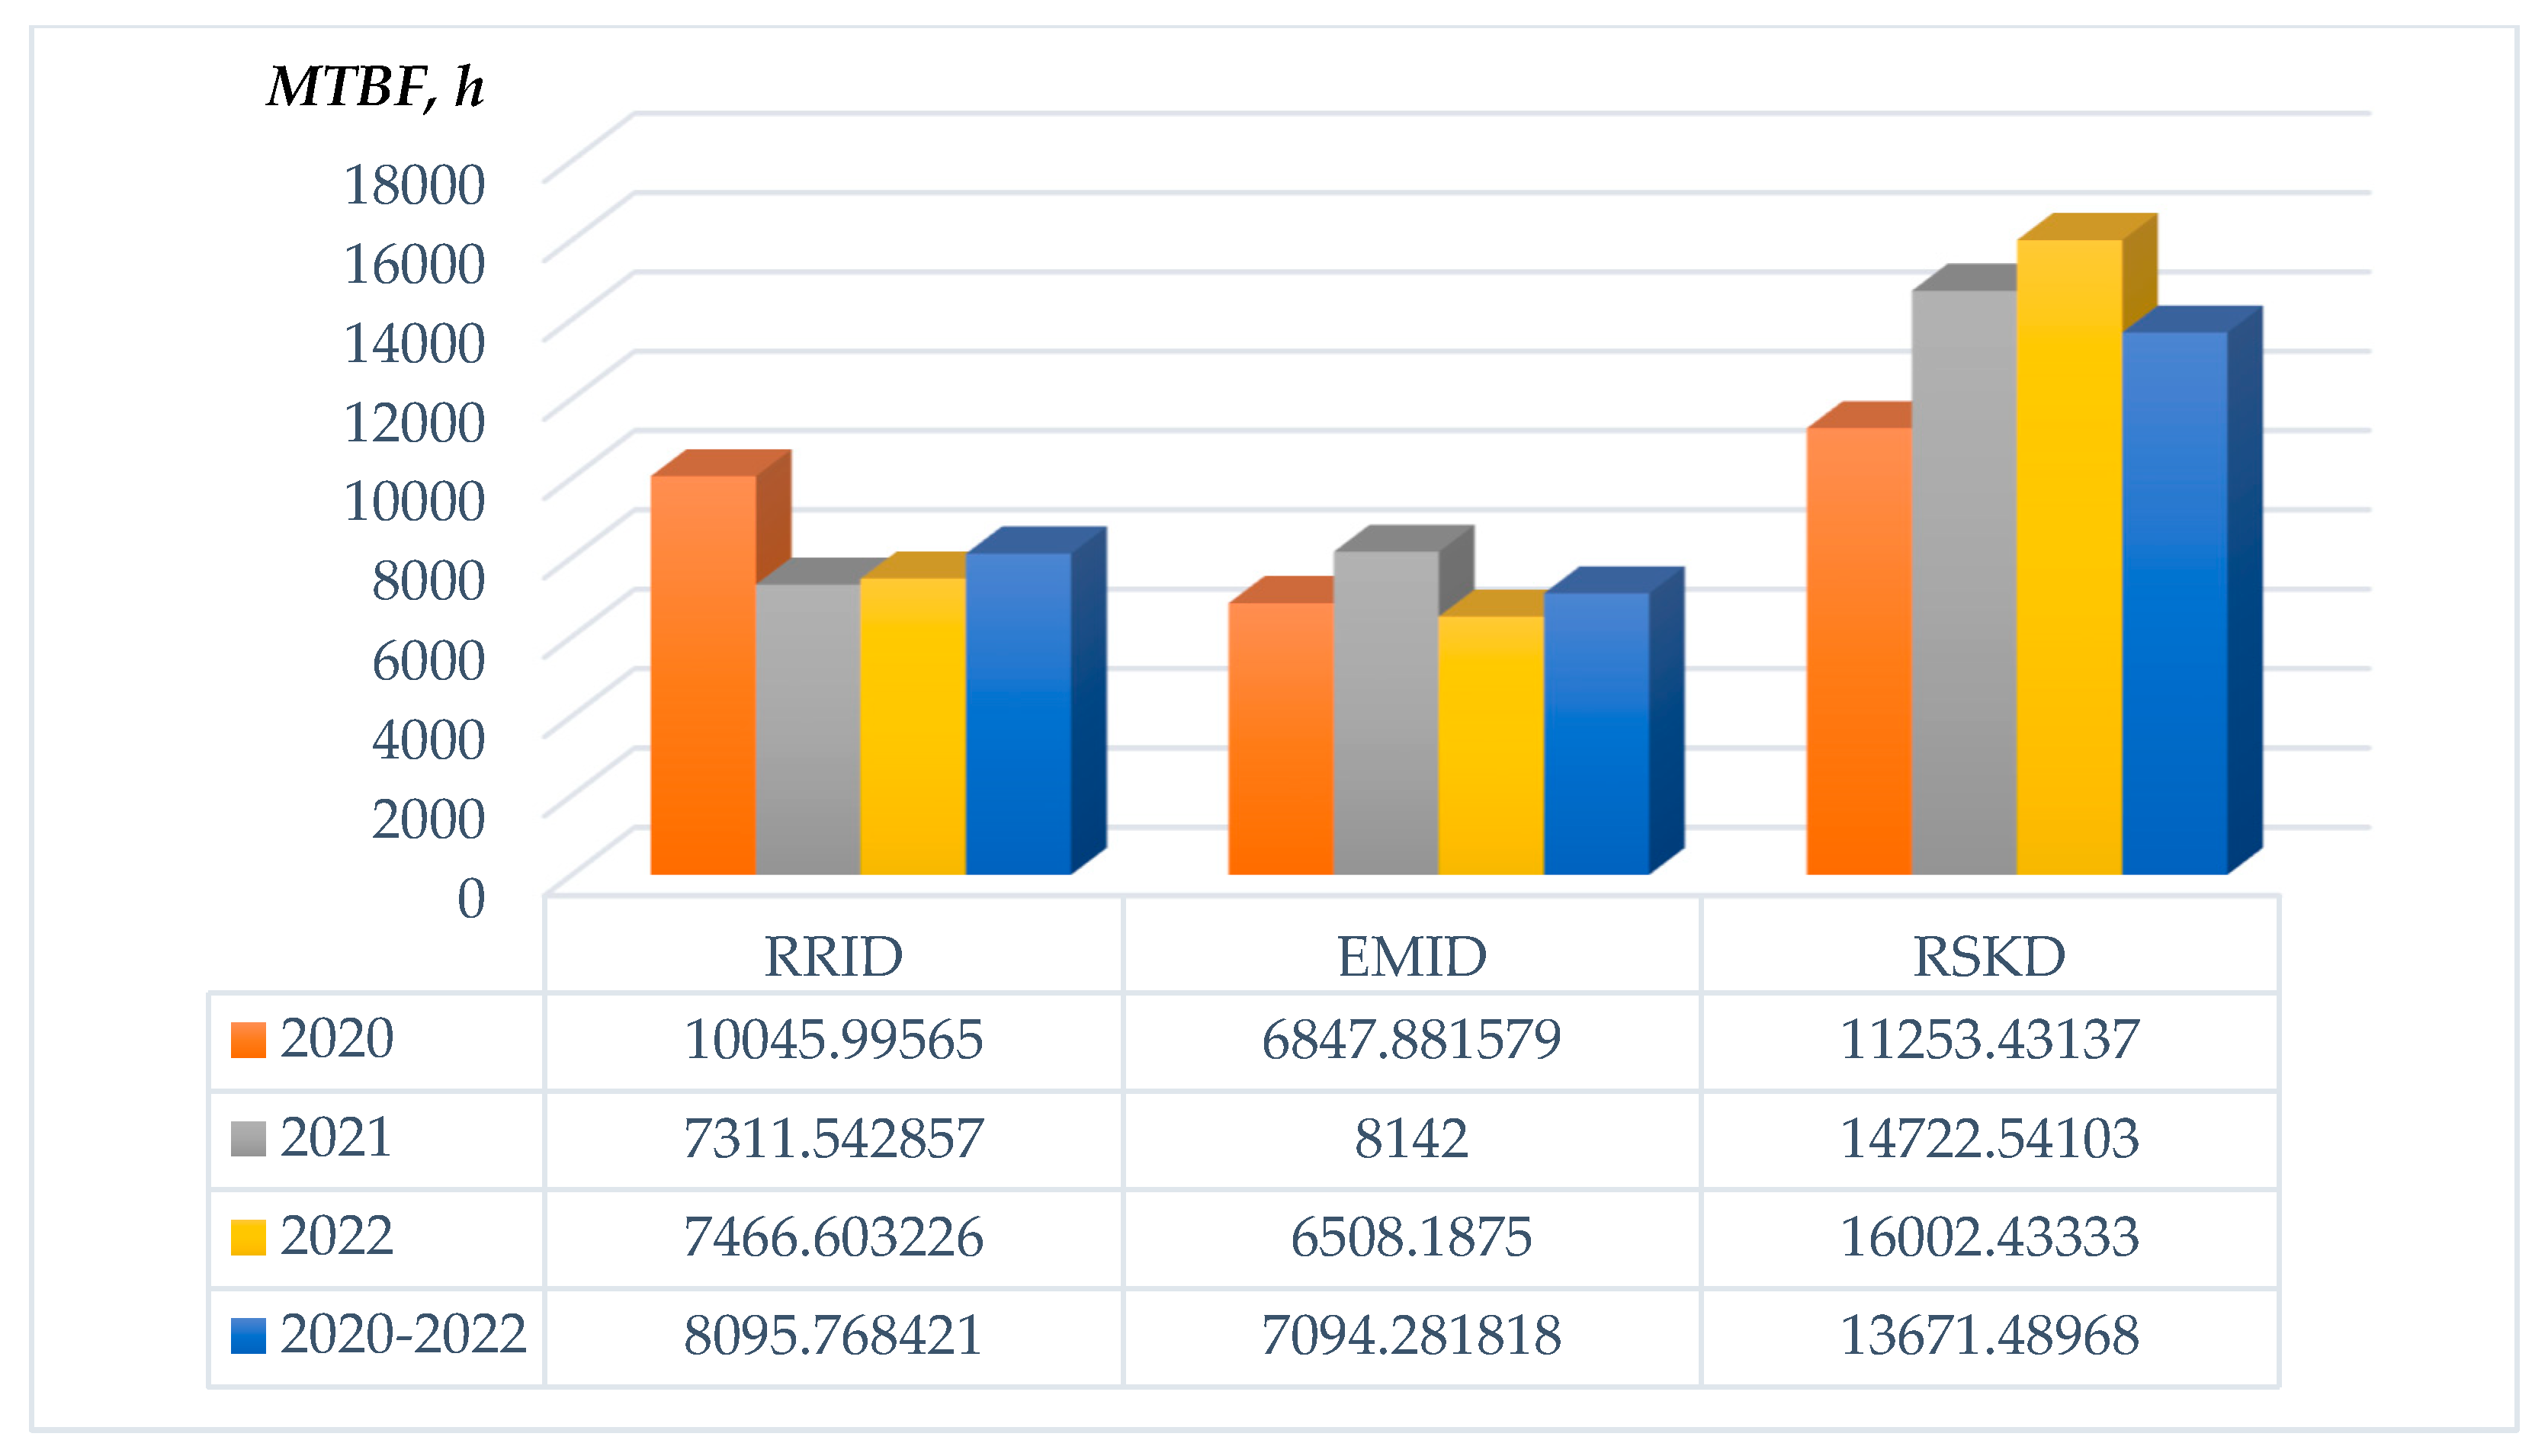
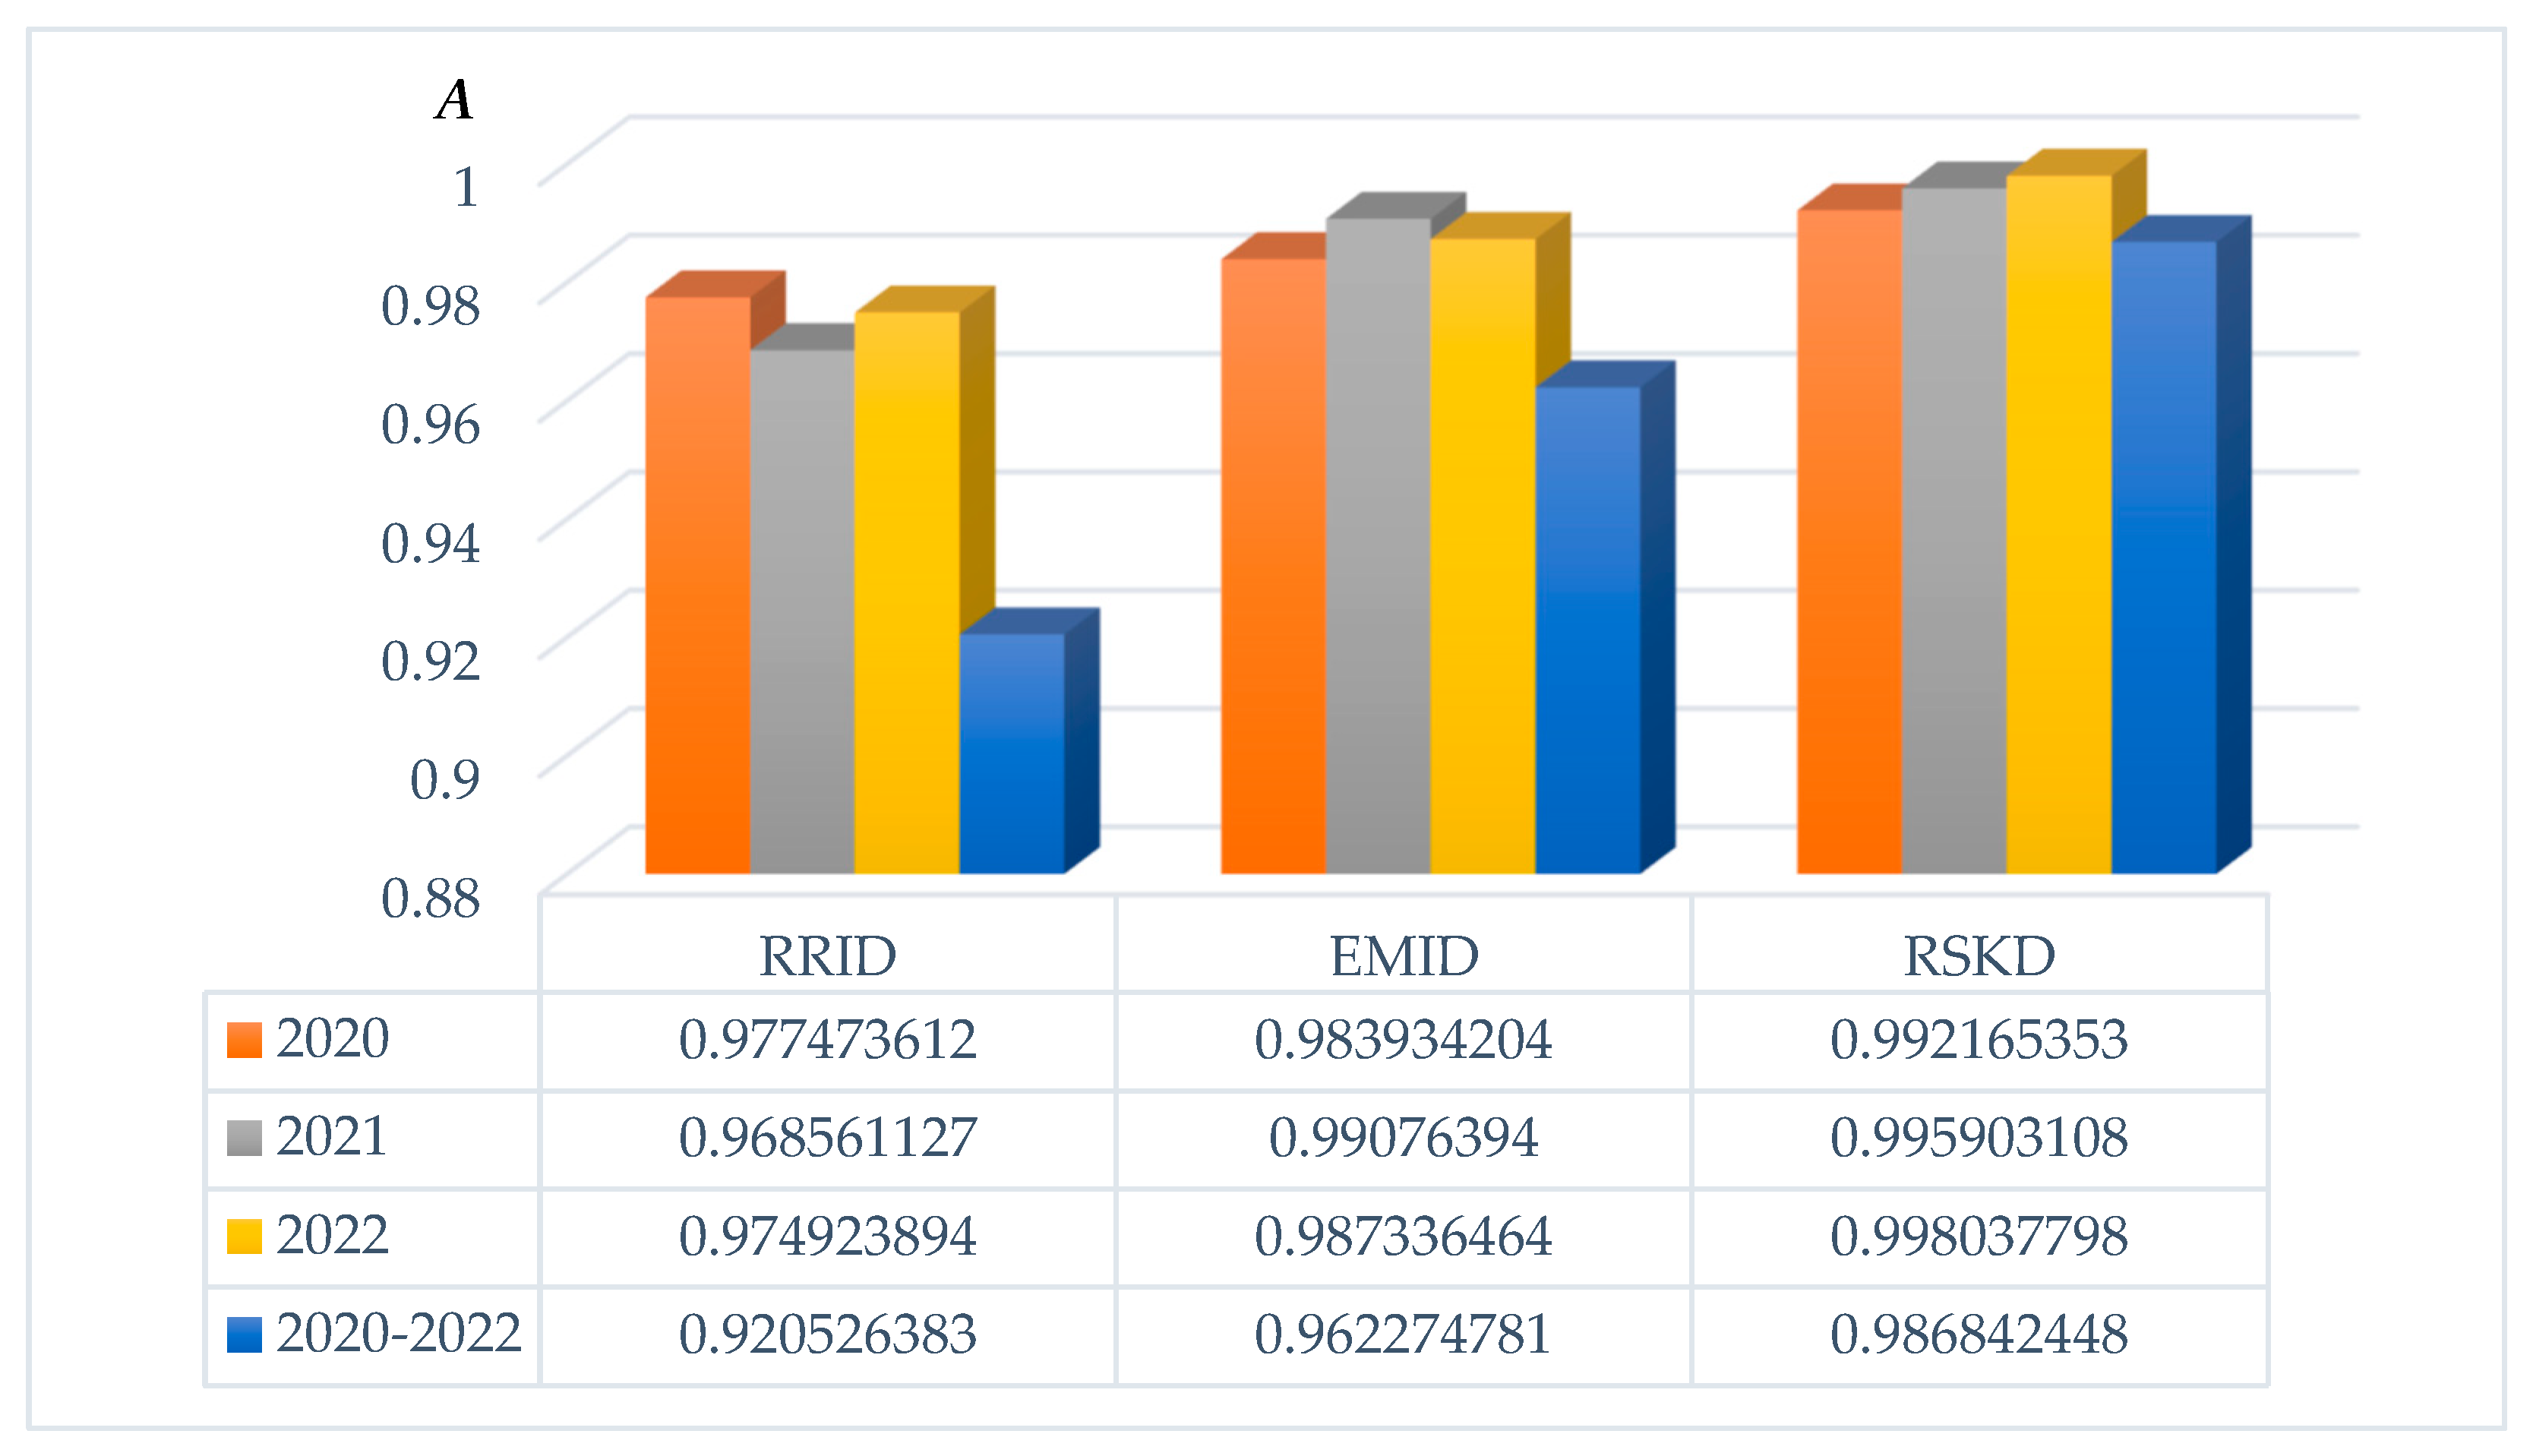
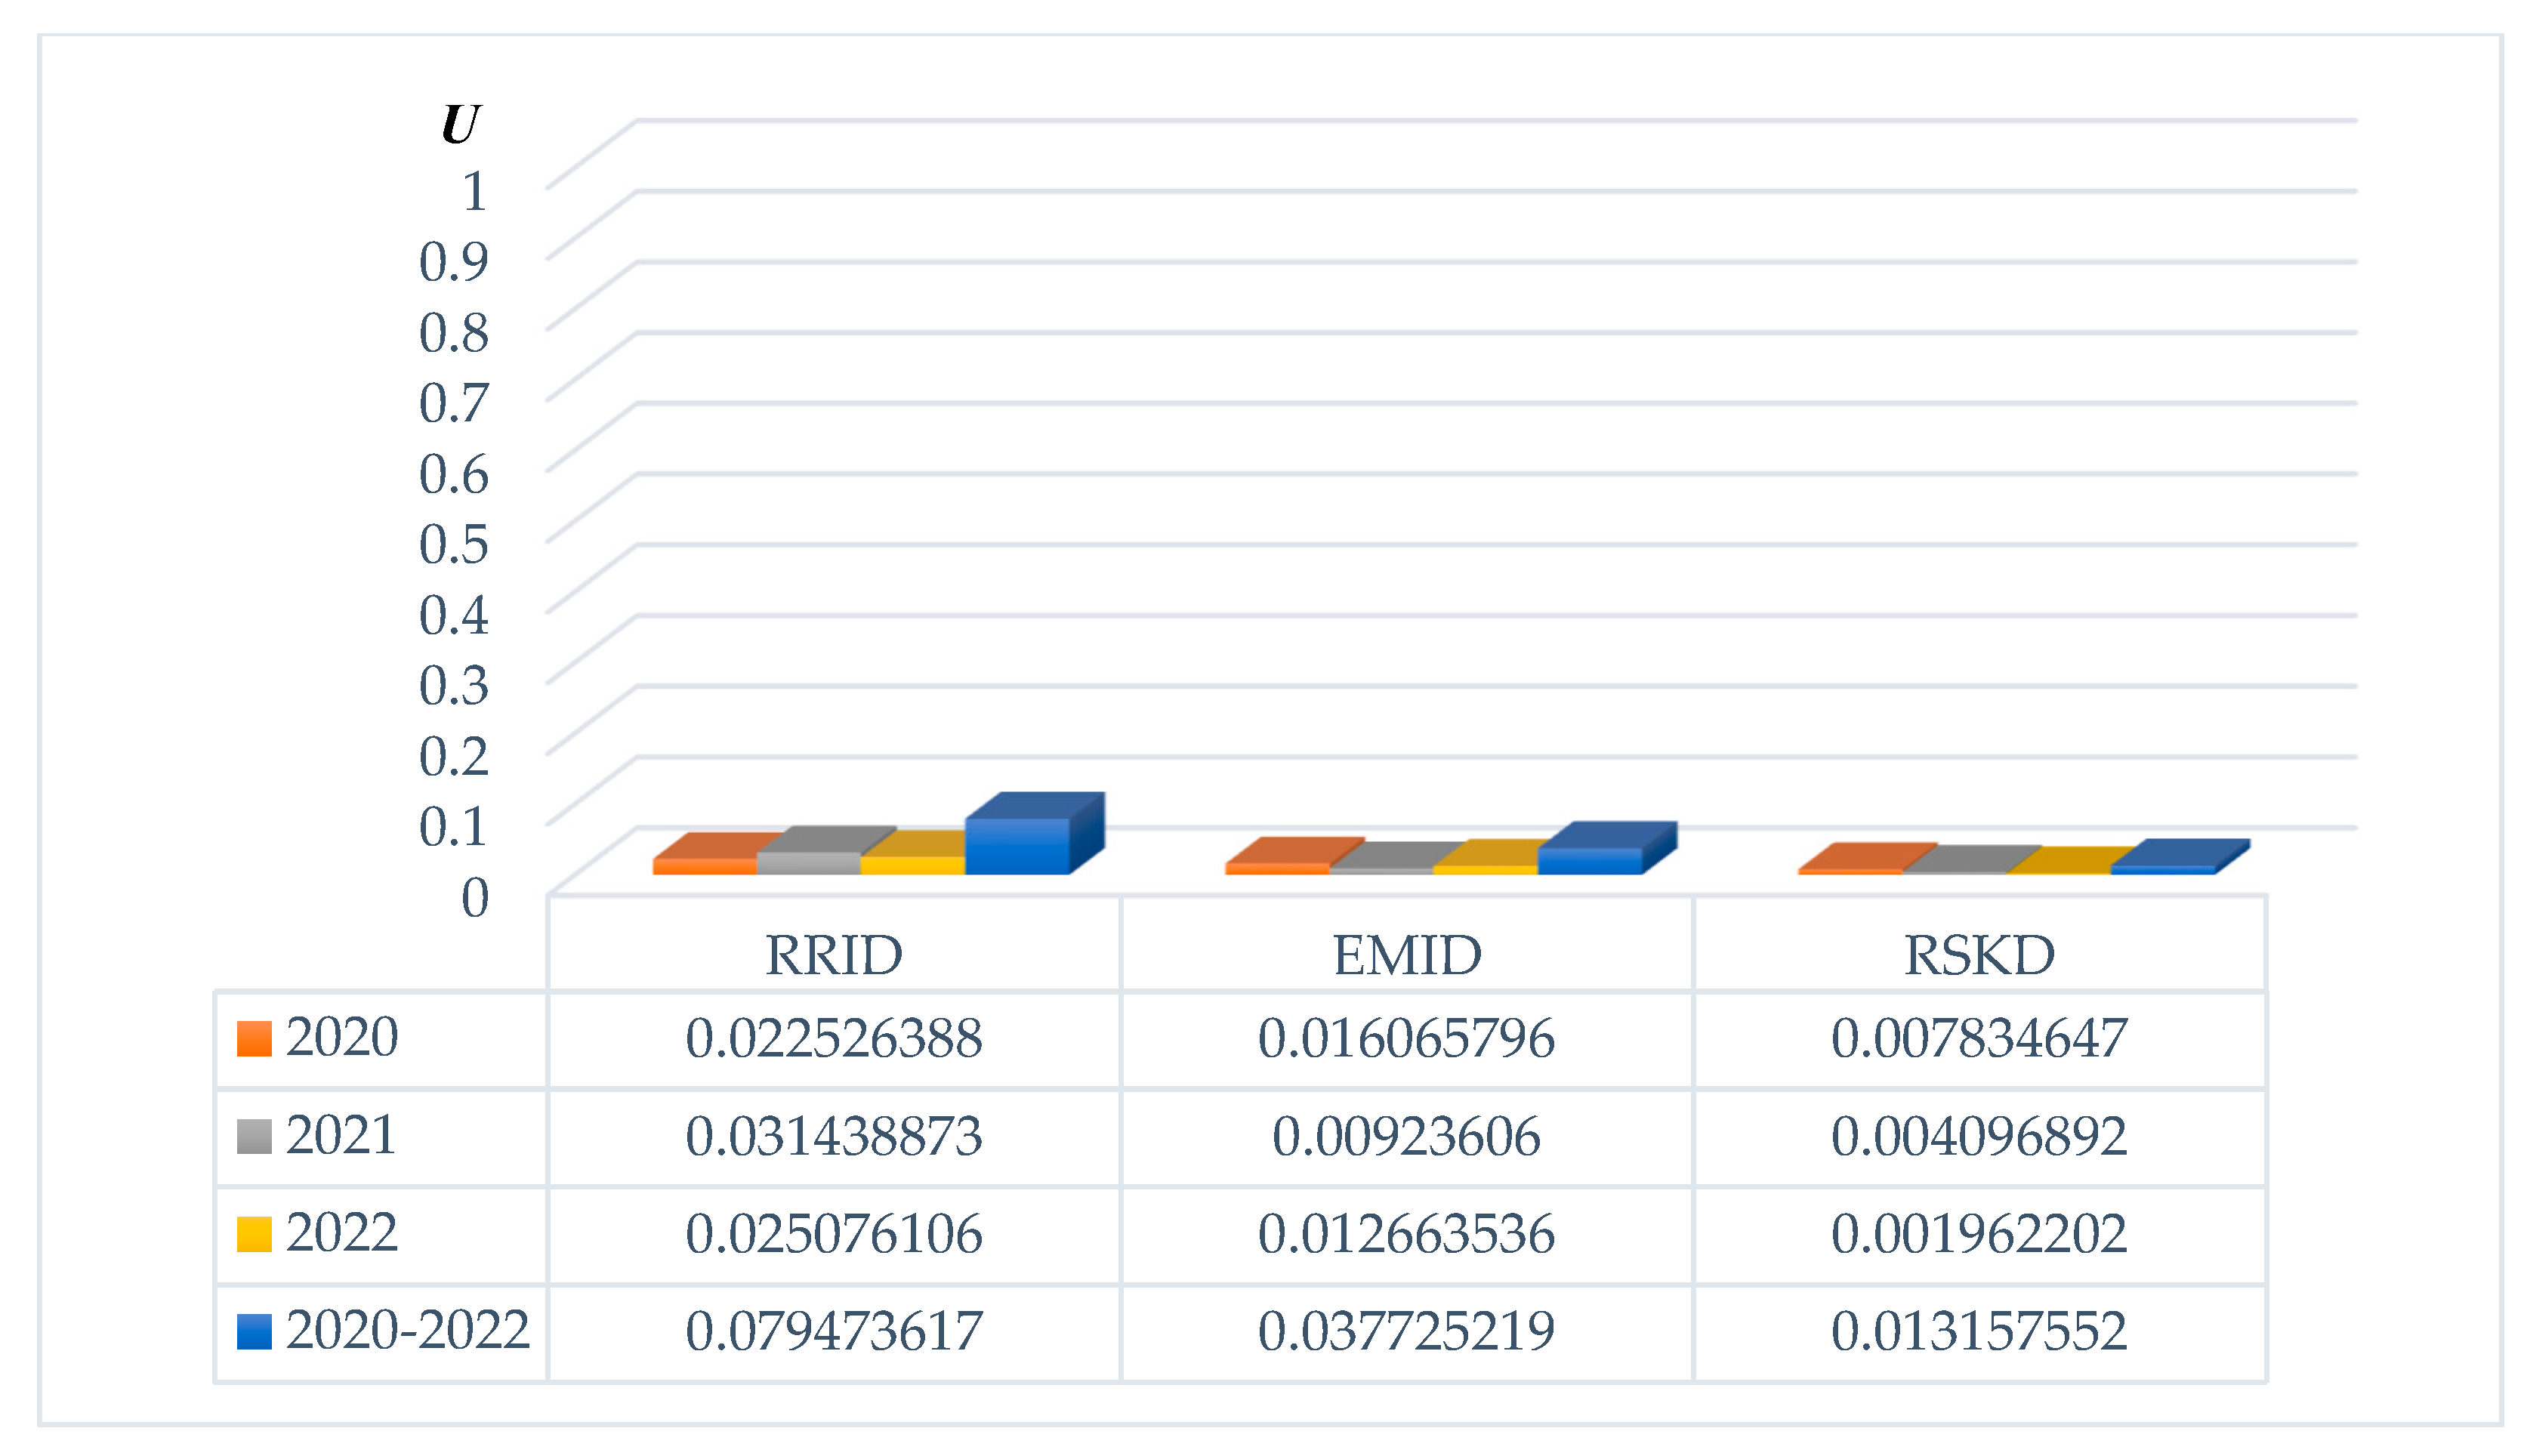
3.2.3. Reliability Analysis of Failures of the IlDs in STD—Gorna Oryahovitsa

The values of the simple reliability indicators are presented in Figure 29, Figure 30 and Figure 31.
It is obvious that the MTBF values of RRID and EMID are of the same order (except for 2020), despite the significantly higher proportions of failures of RRID and their duration compared to EMID. Overall, it should be noted, however, that the MTBF of EMIDs has lower values than that of RRIDs. An increase in the intensity of failures flow of EMIDs over the last year can be observed. This once again shows that a decision can be made to gradually replace them with RCIDs.
The values determined for the coefficients of availability and unavailability are shown in Figure 32 and Figure 33, respectively.
It can be seen that the coefficient of availability of the EMIDs reaches higher values than that of the RRIDs regardless of the lower MTBF. Respectively, the coefficient of unavailability of RRIDs is high—they are the most common and are relatively old. Therefore, some of them need to be replaced more urgently with route-computer ones instead of EMIDs. The duration of failures of RRIDs is the highest (see Figure 16). The recovery time can be reduced if RRIDs are included in a remote monitoring and control system (SCADA).
The average values of the availability and unavailability coefficients, compared with the values for the three-year period, are systematised in Table 4.
It is clearly visible again that the average values of the availability coefficients for several years are higher than the values for a three-year period for all ILDs and therefore should not be calculated.

4. Discussion

Any failure in the signalling systems requires time to restore the functions of the damaged device, which leads to increased operating costs and possible train delays. In order to ensure transport safety, all important components are redundant, and the system as a whole very rarely stops functioning—if one element fails, the backup element is immediately switched on. That is why in most cases the train delays are very small. The purpose of the study is to determine the components that have relatively low values of availability coefficients and to plan the technical maintenance correctly and to foresee a gradual modernization of the devices.
The obtained results for all STDs clearly demonstrate the need for reliability analysis and determination of its indicators. It also can be concluded that it is necessary to calculate the complex reliability indicators according to the presented methodology. They give the clearest assessment of the state of the devices. If only a statistical assessment of failures and their duration is made or if only simple reliability indicators are calculated, erroneous conclusions can be drawn regarding maintenance and the need for modernization. On the other hand, the availability coefficients of all devices for the three-year period are lower compared to the values for one year—therefore it is better to calculate the indicators for a longer period and obtain a more accurate reliability assessment.
The highest coefficients of availability are for RCIDs—complete failures of these interlocking devices are very rare. The values are also high for RSKD (over 0.98 for all STDs). However, these are devices located in small stations, where switching related to route ordering is very rarely required. That is why the elements wear out much more slowly and the failures are relatively few, but their restoration takes a relatively long time (usually over 4 h).
The most common are RRIDs, and their availability coefficients are relatively low—for the three-year period, below 0.98 for STD—Plovdiv, around 0.92—for STD—Gorna Oryahovitsa, and even under 0.63—for STD—Sofia.
The availability coefficients of EMIDs are also not particularly high—below 0.98 for the three-year period for all STDs.
This proves the need to gradually replace these interlocking devices with route-computer ones, especially in large railway stations. The implementation of RRIDs in a SCADA system for remote monitoring and control is also an option for reducing the unavailability coefficient of these devices.

5. Conclusions

The article analyzes the failures and their duration of signalling devices working on Bulgarian railways, using two approaches over a three-year period:
  • statistical analysis of data on the failures and their duration, with special attention paid to interlocking devices (RCIDs, RRIDs, EMIDs, RSKDs) and compared to external station devices (traffic lights, point machines, rail current circuits, and counter points), interstation devices (Type ALS, type PAB, AB with axle counters, AB with rail circuits, automatic crossing devices), telecommunications devices (automatic telephone exchanges, external lines);
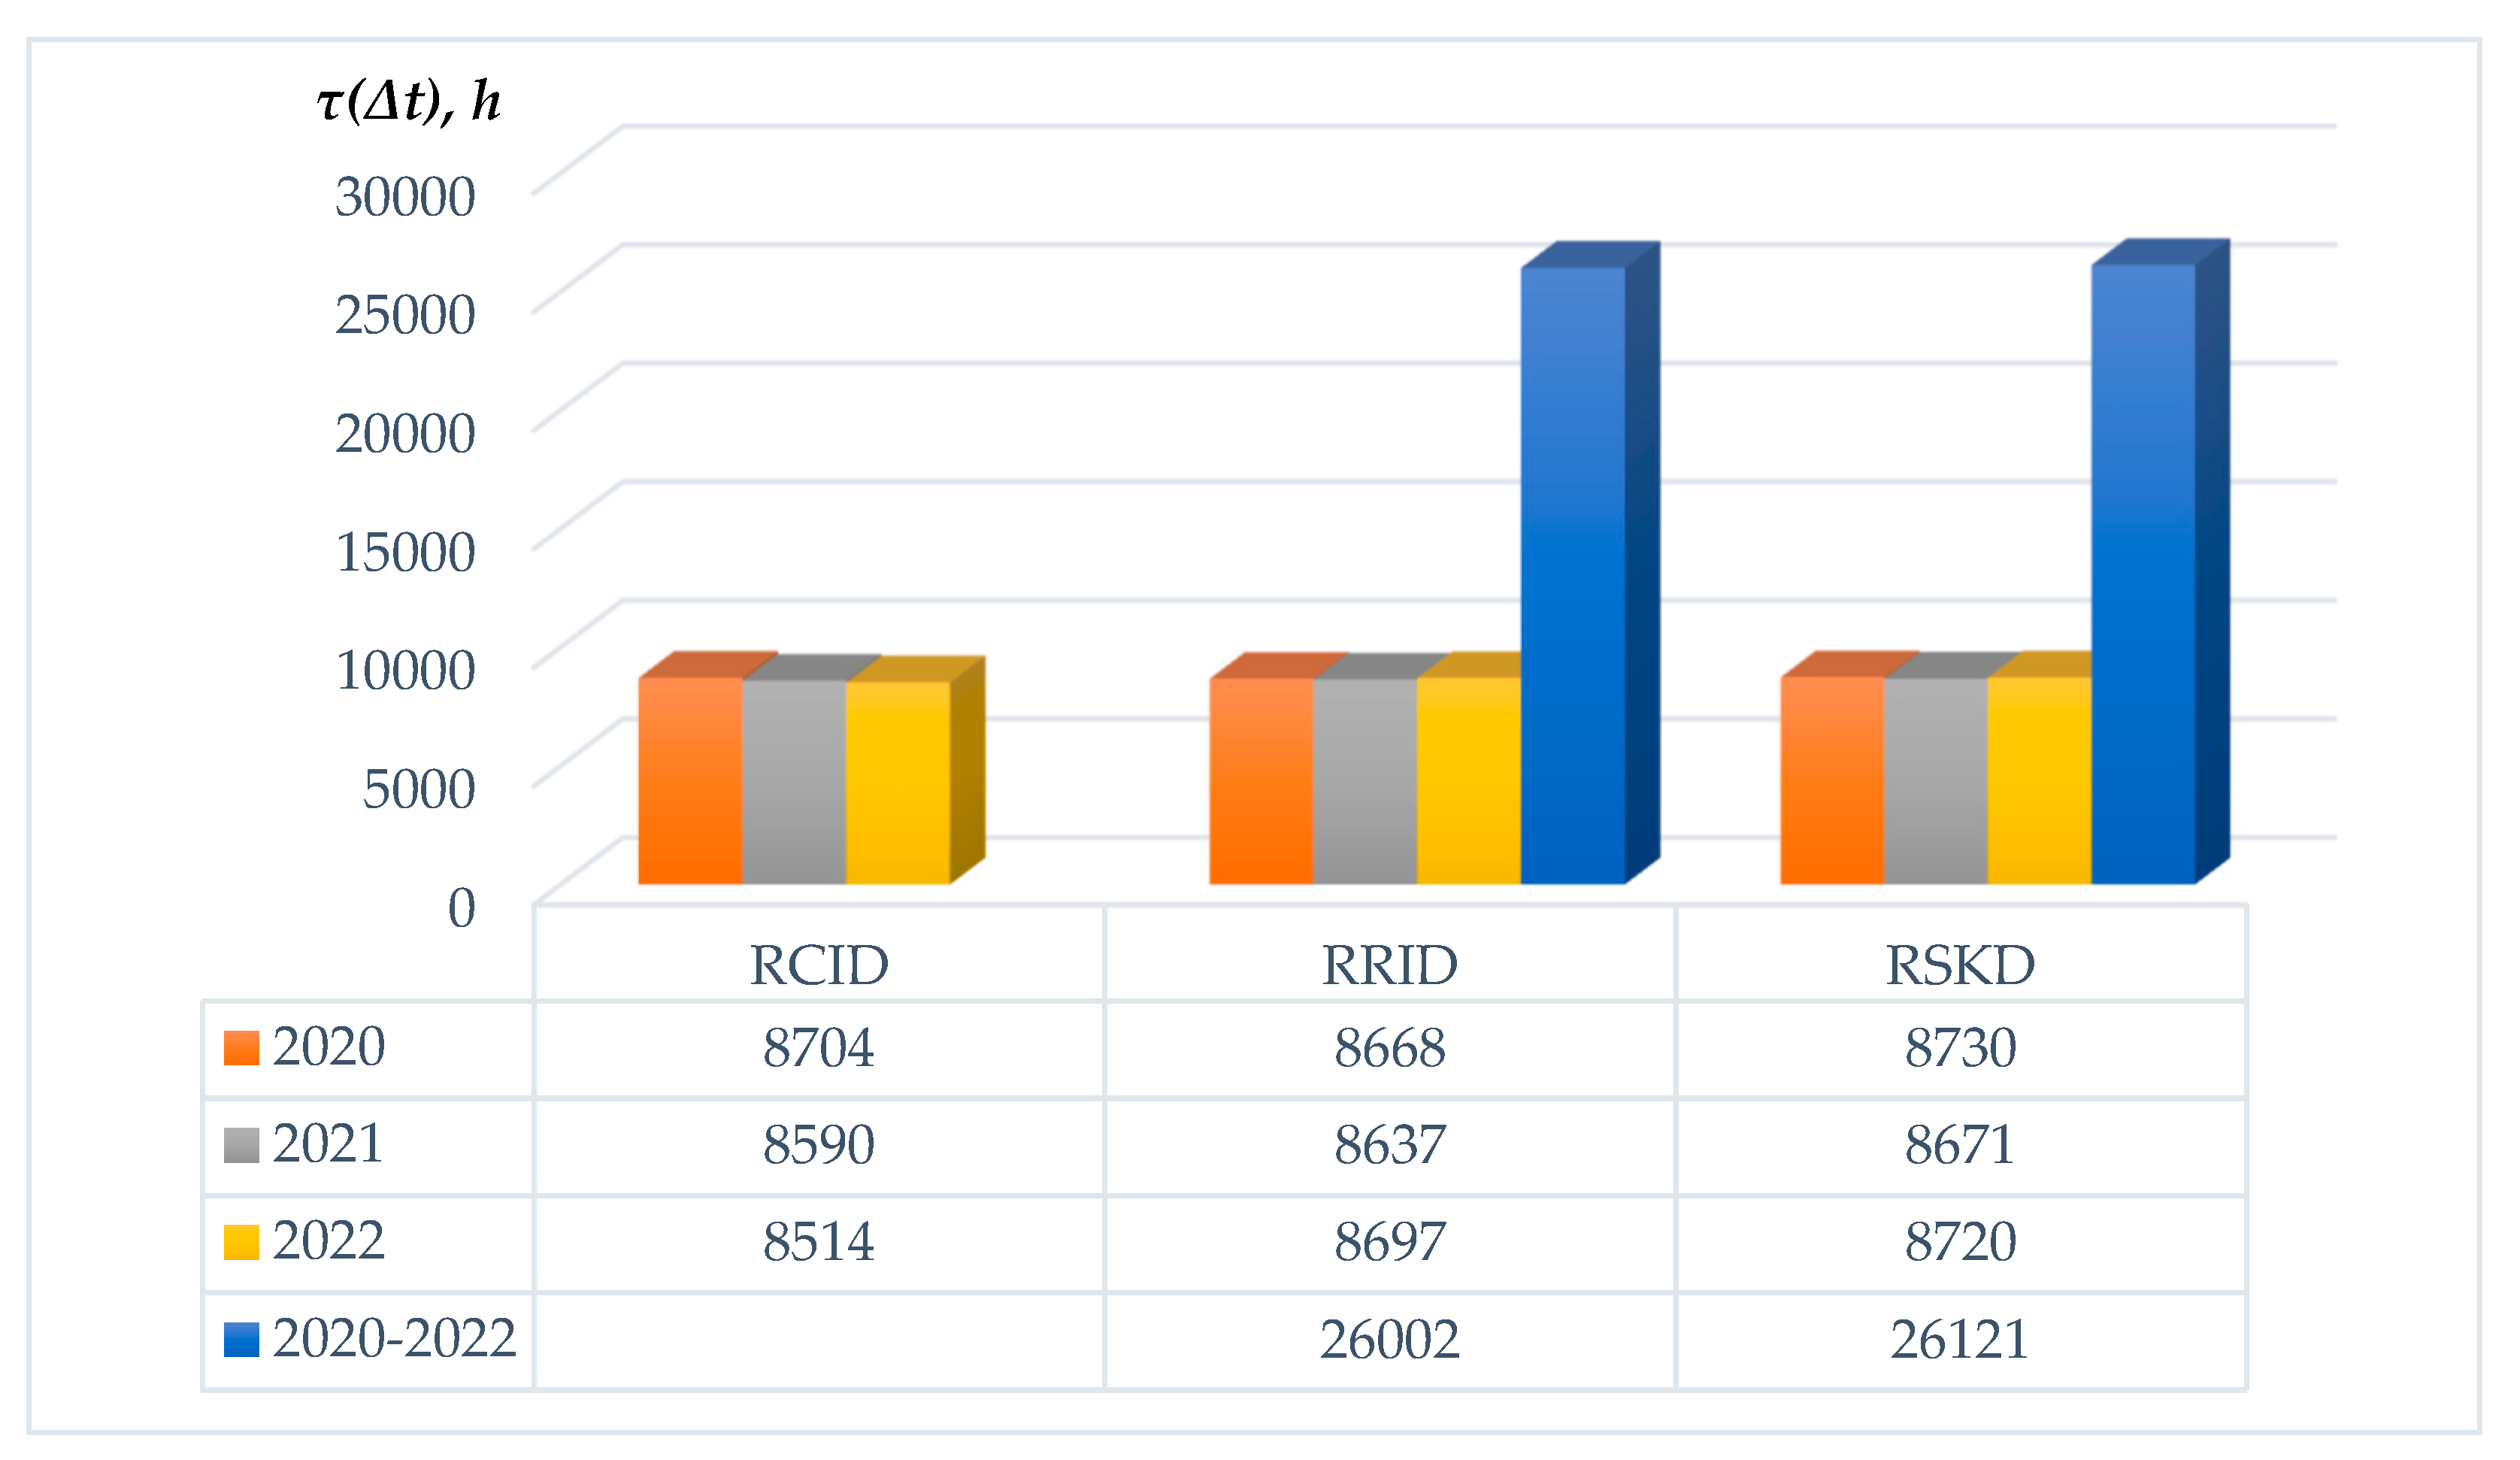
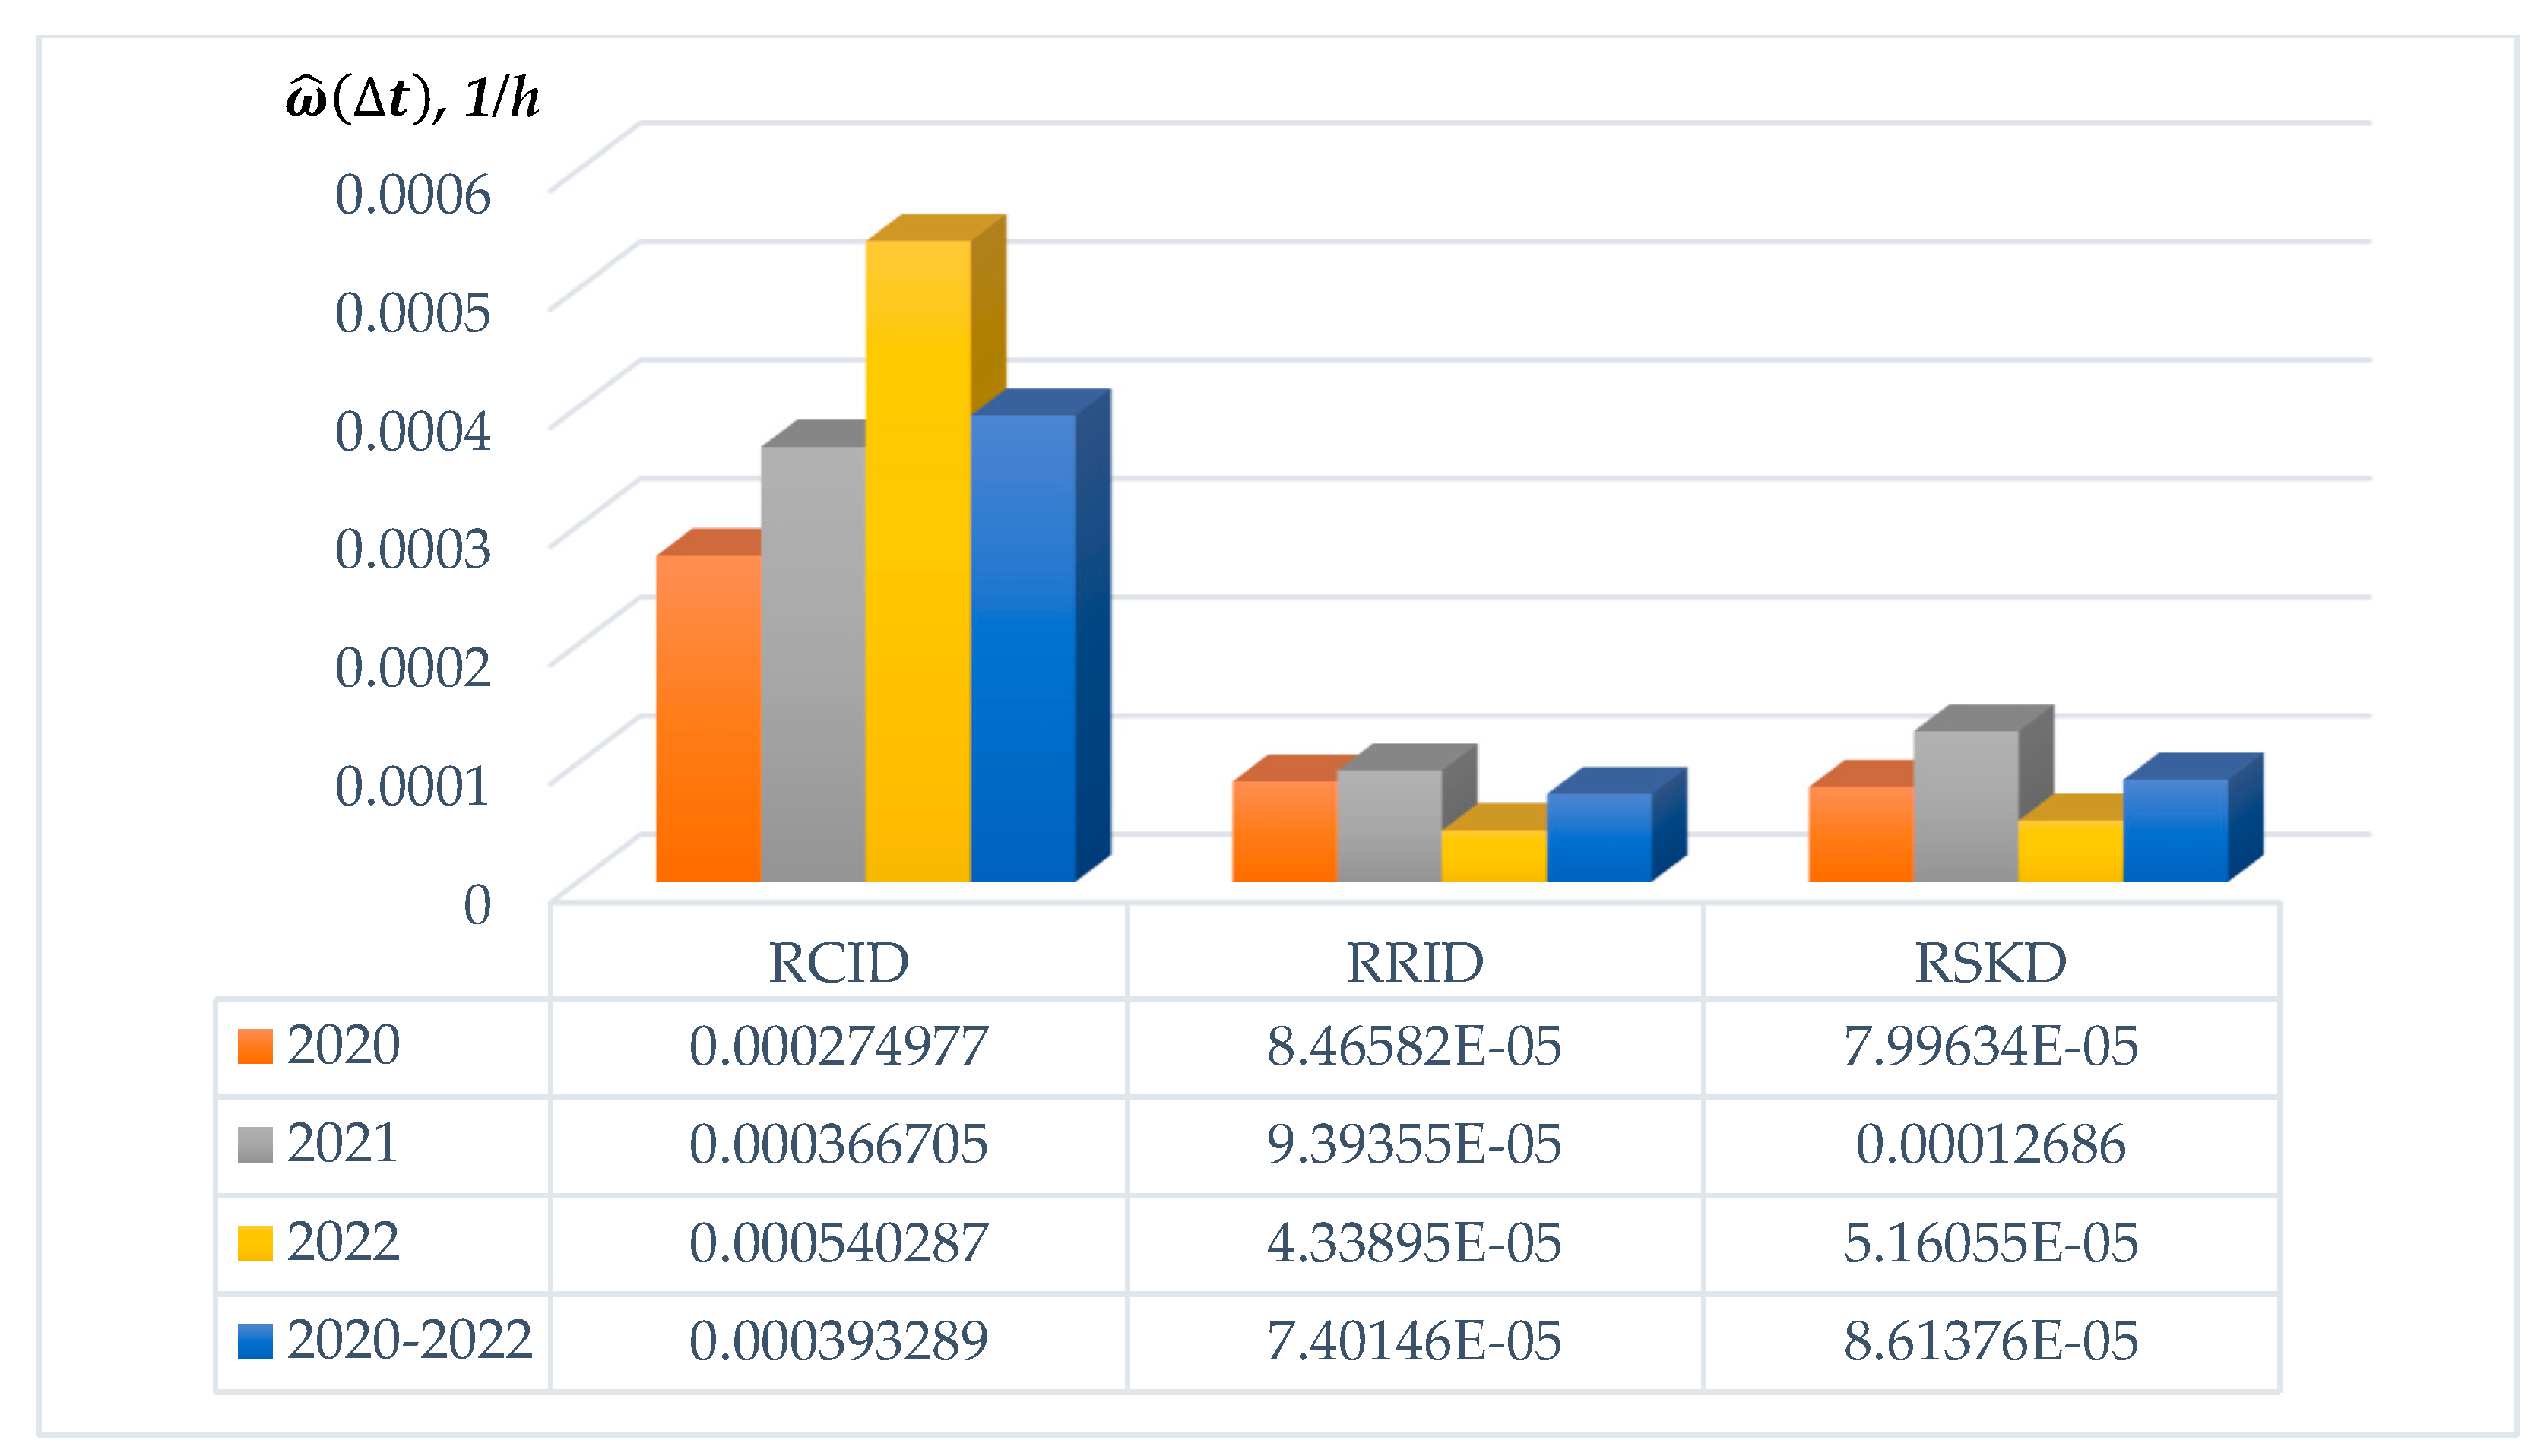
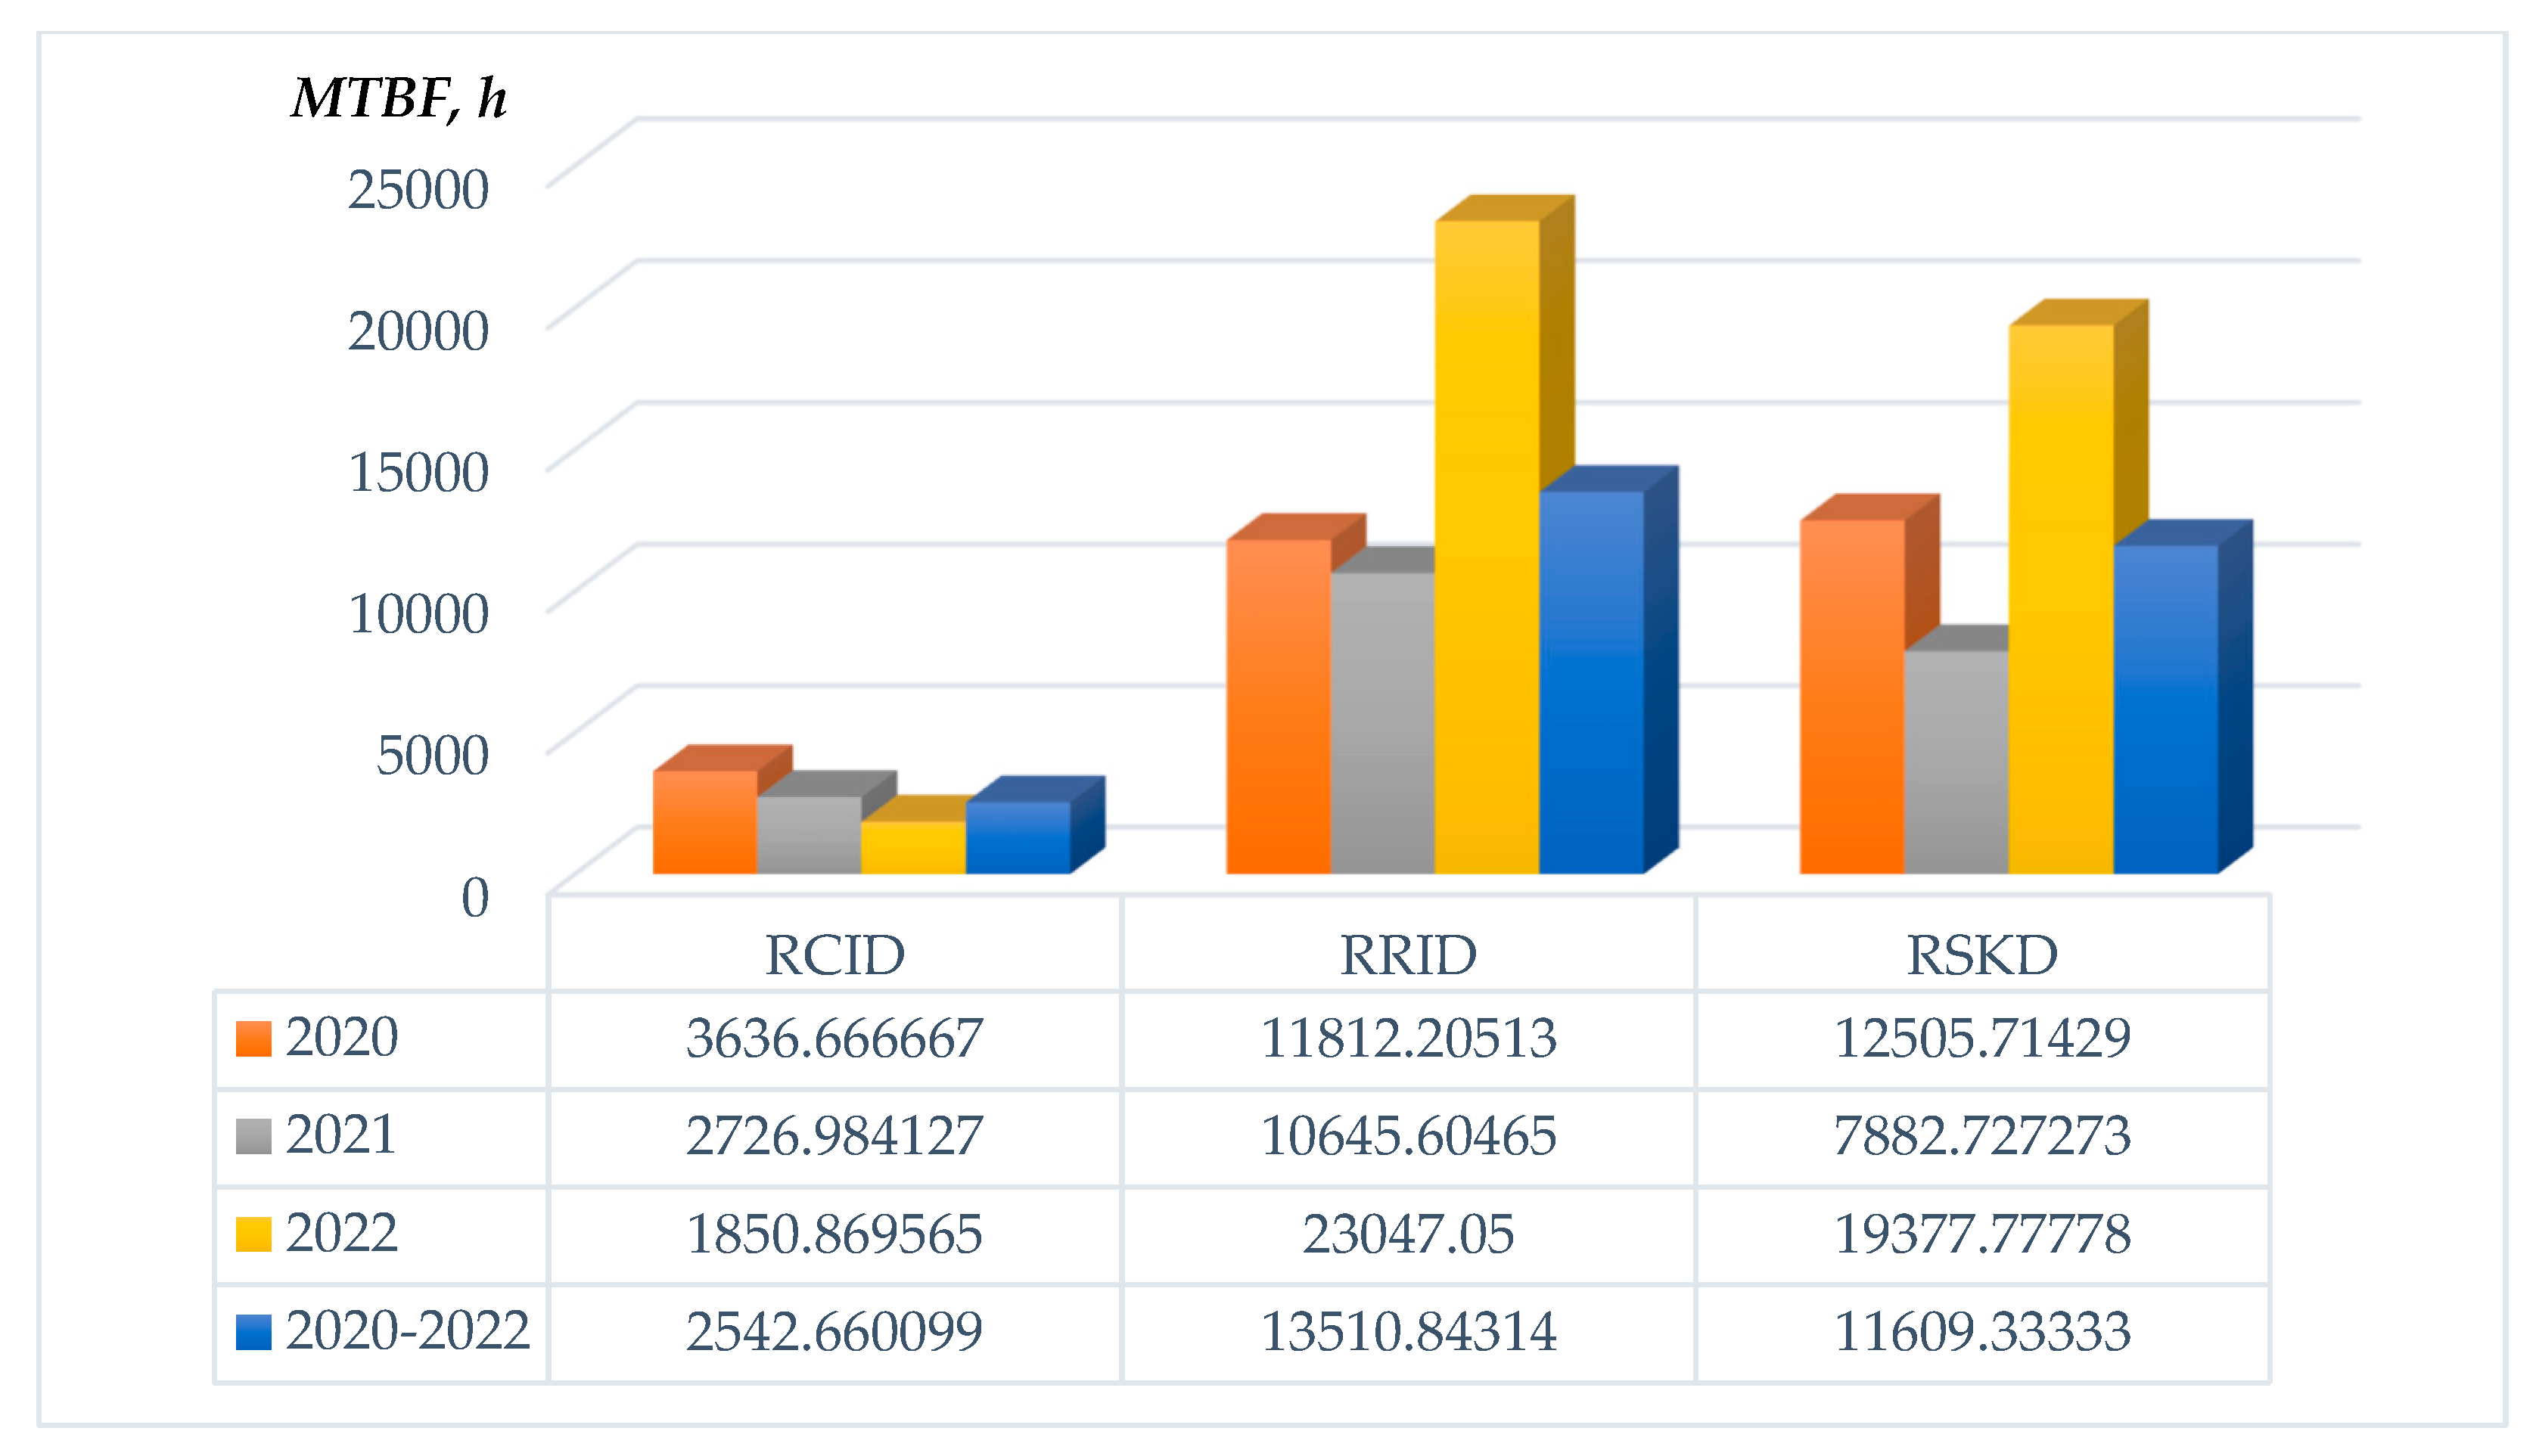
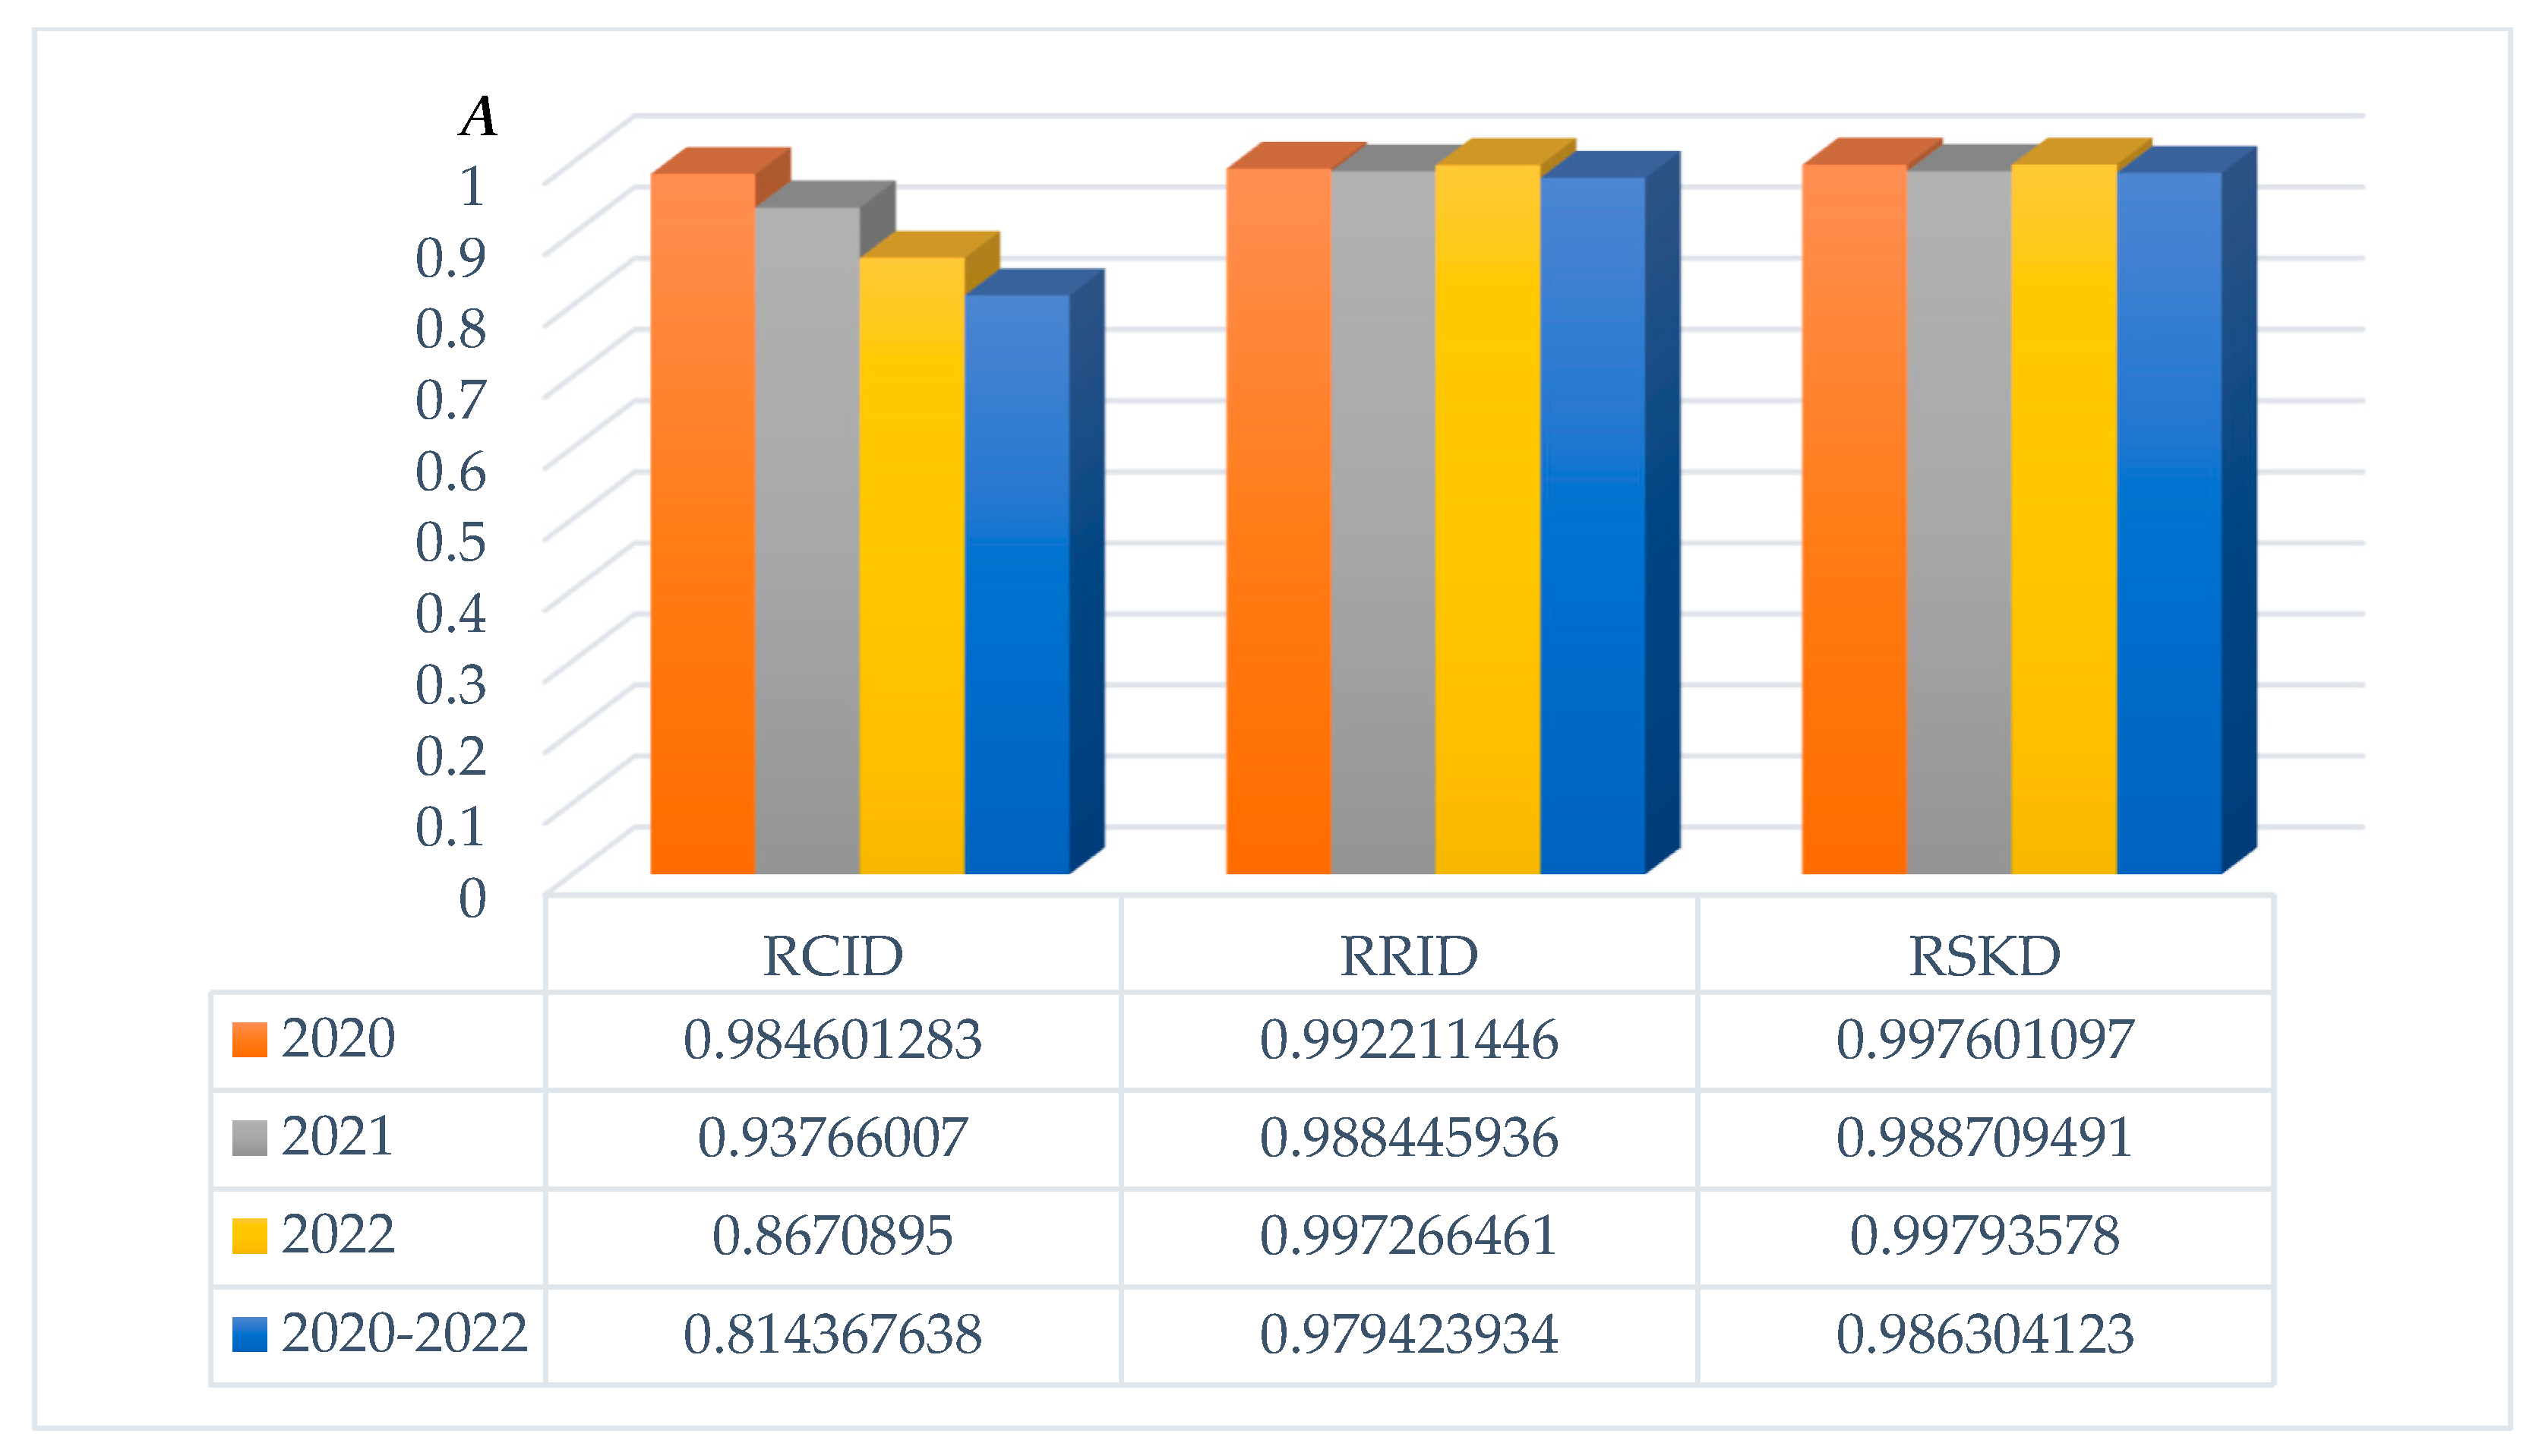
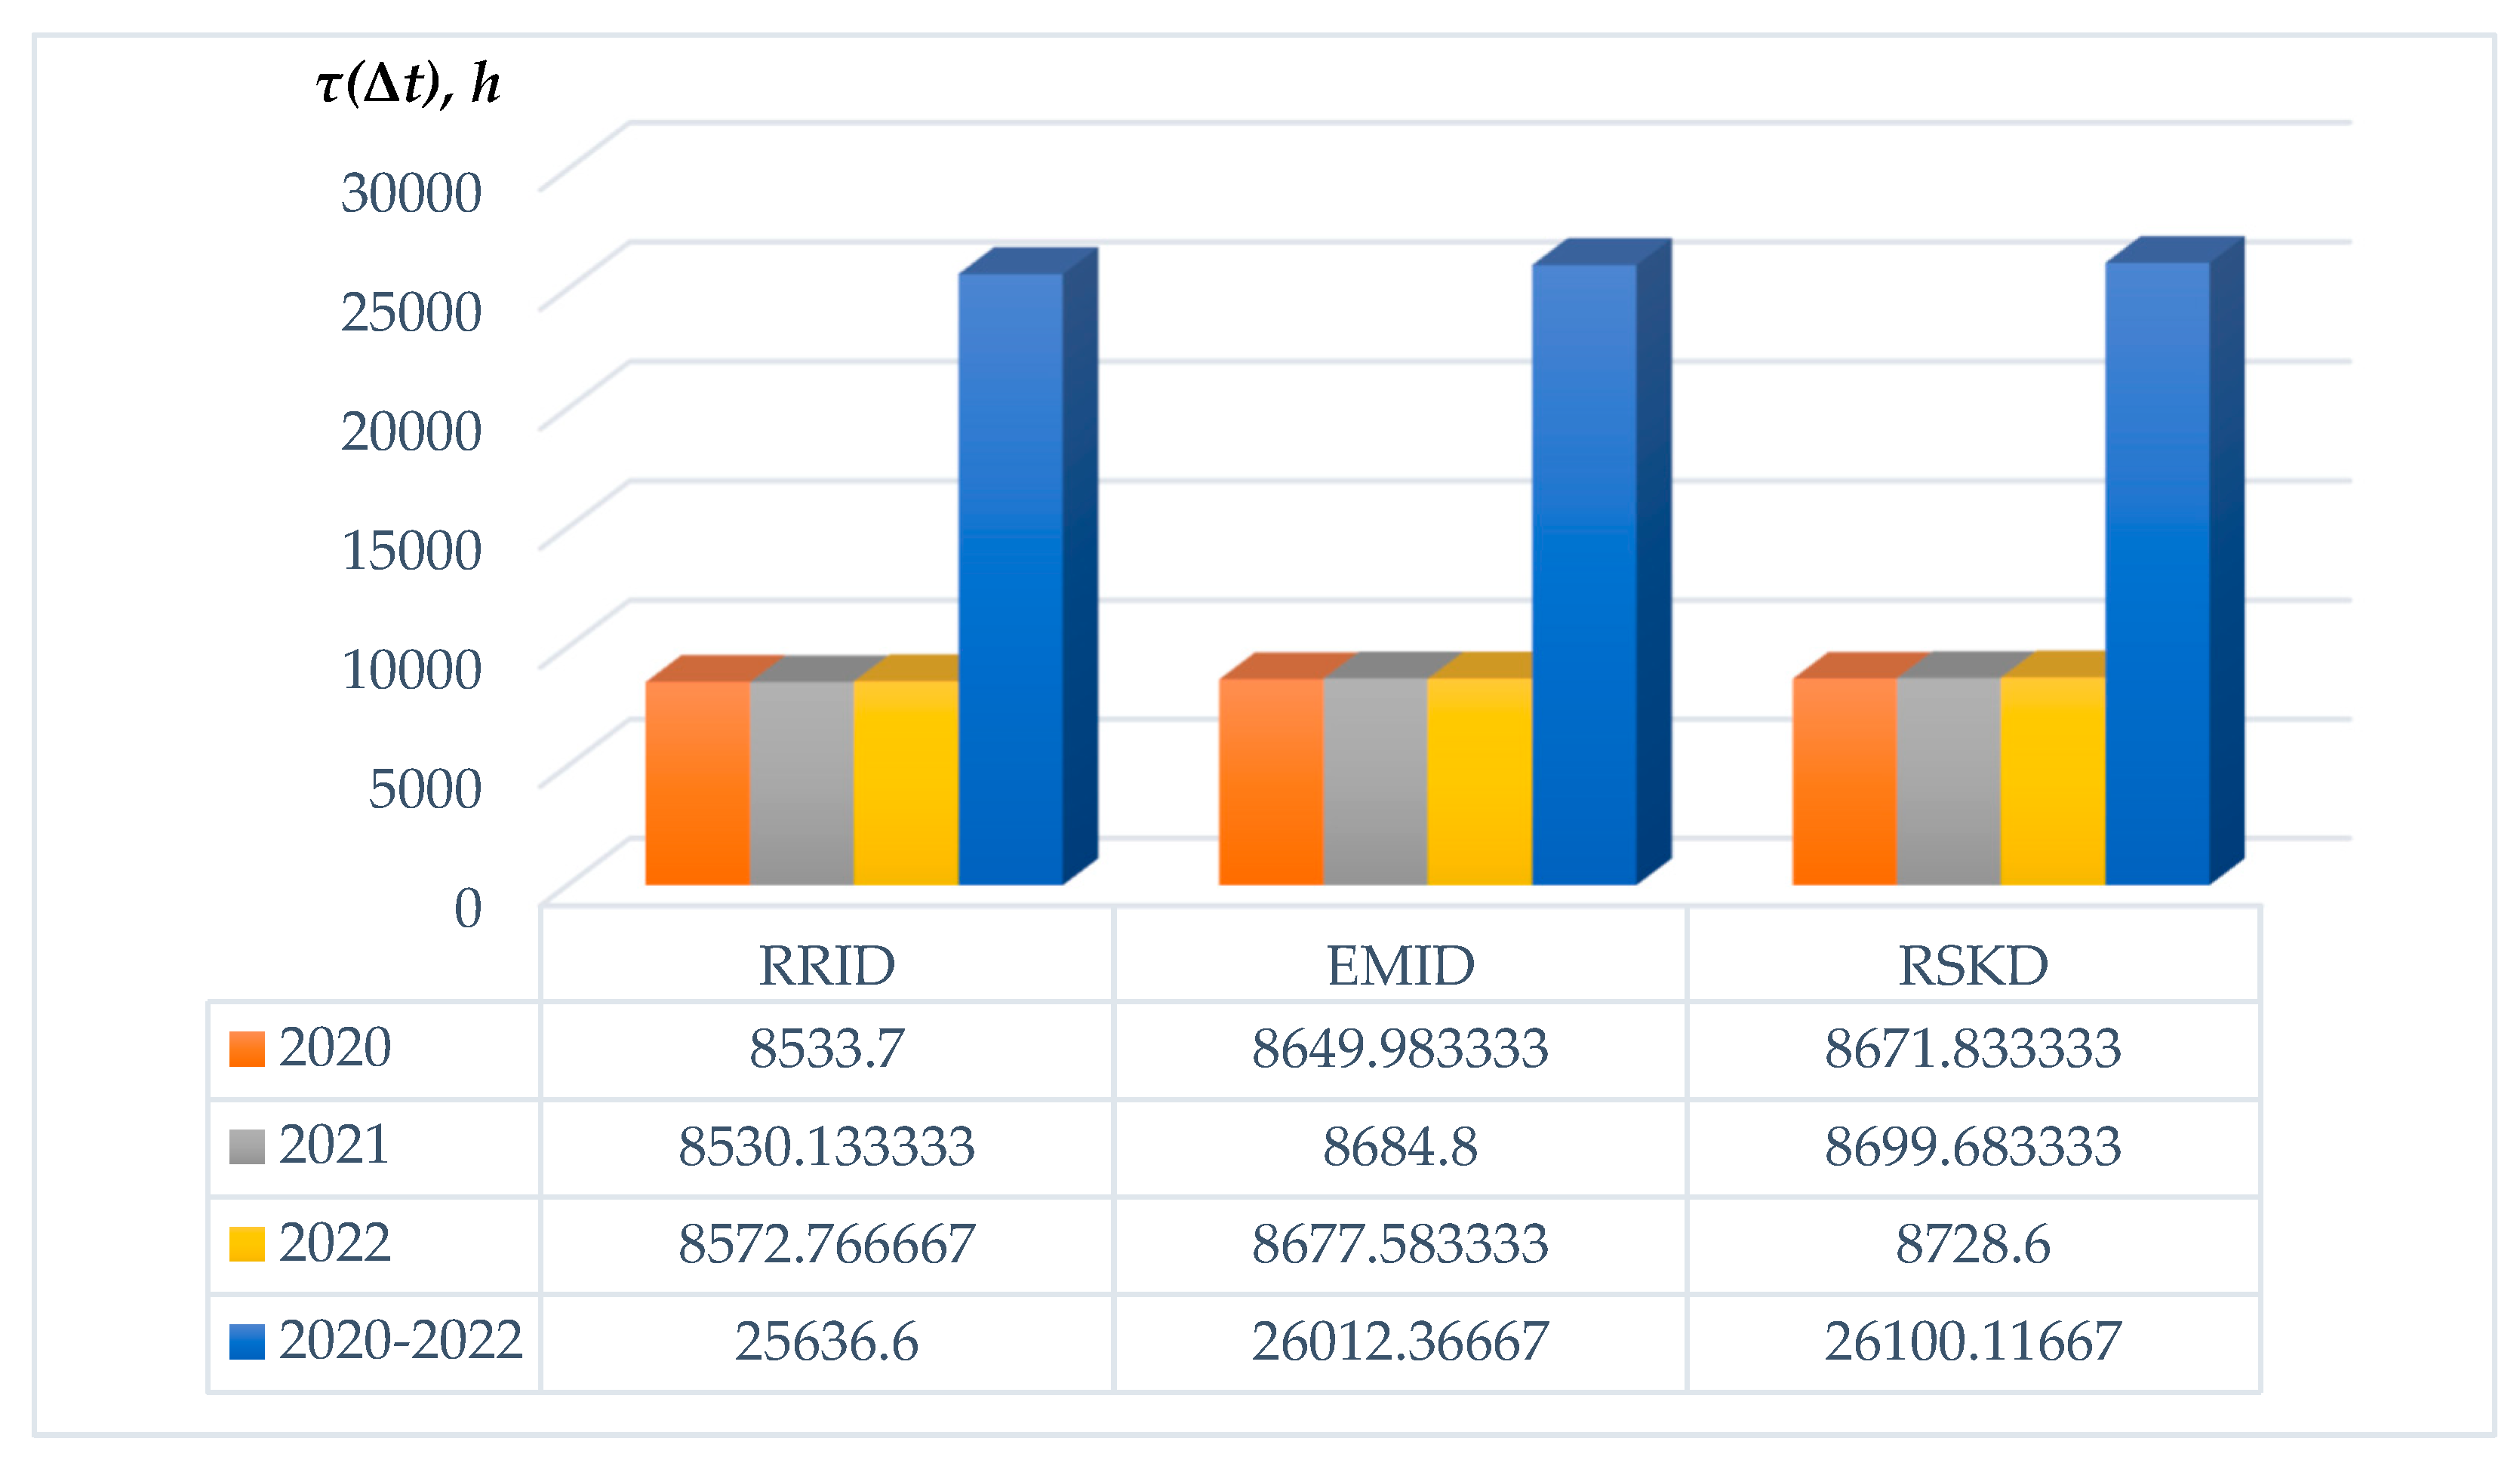
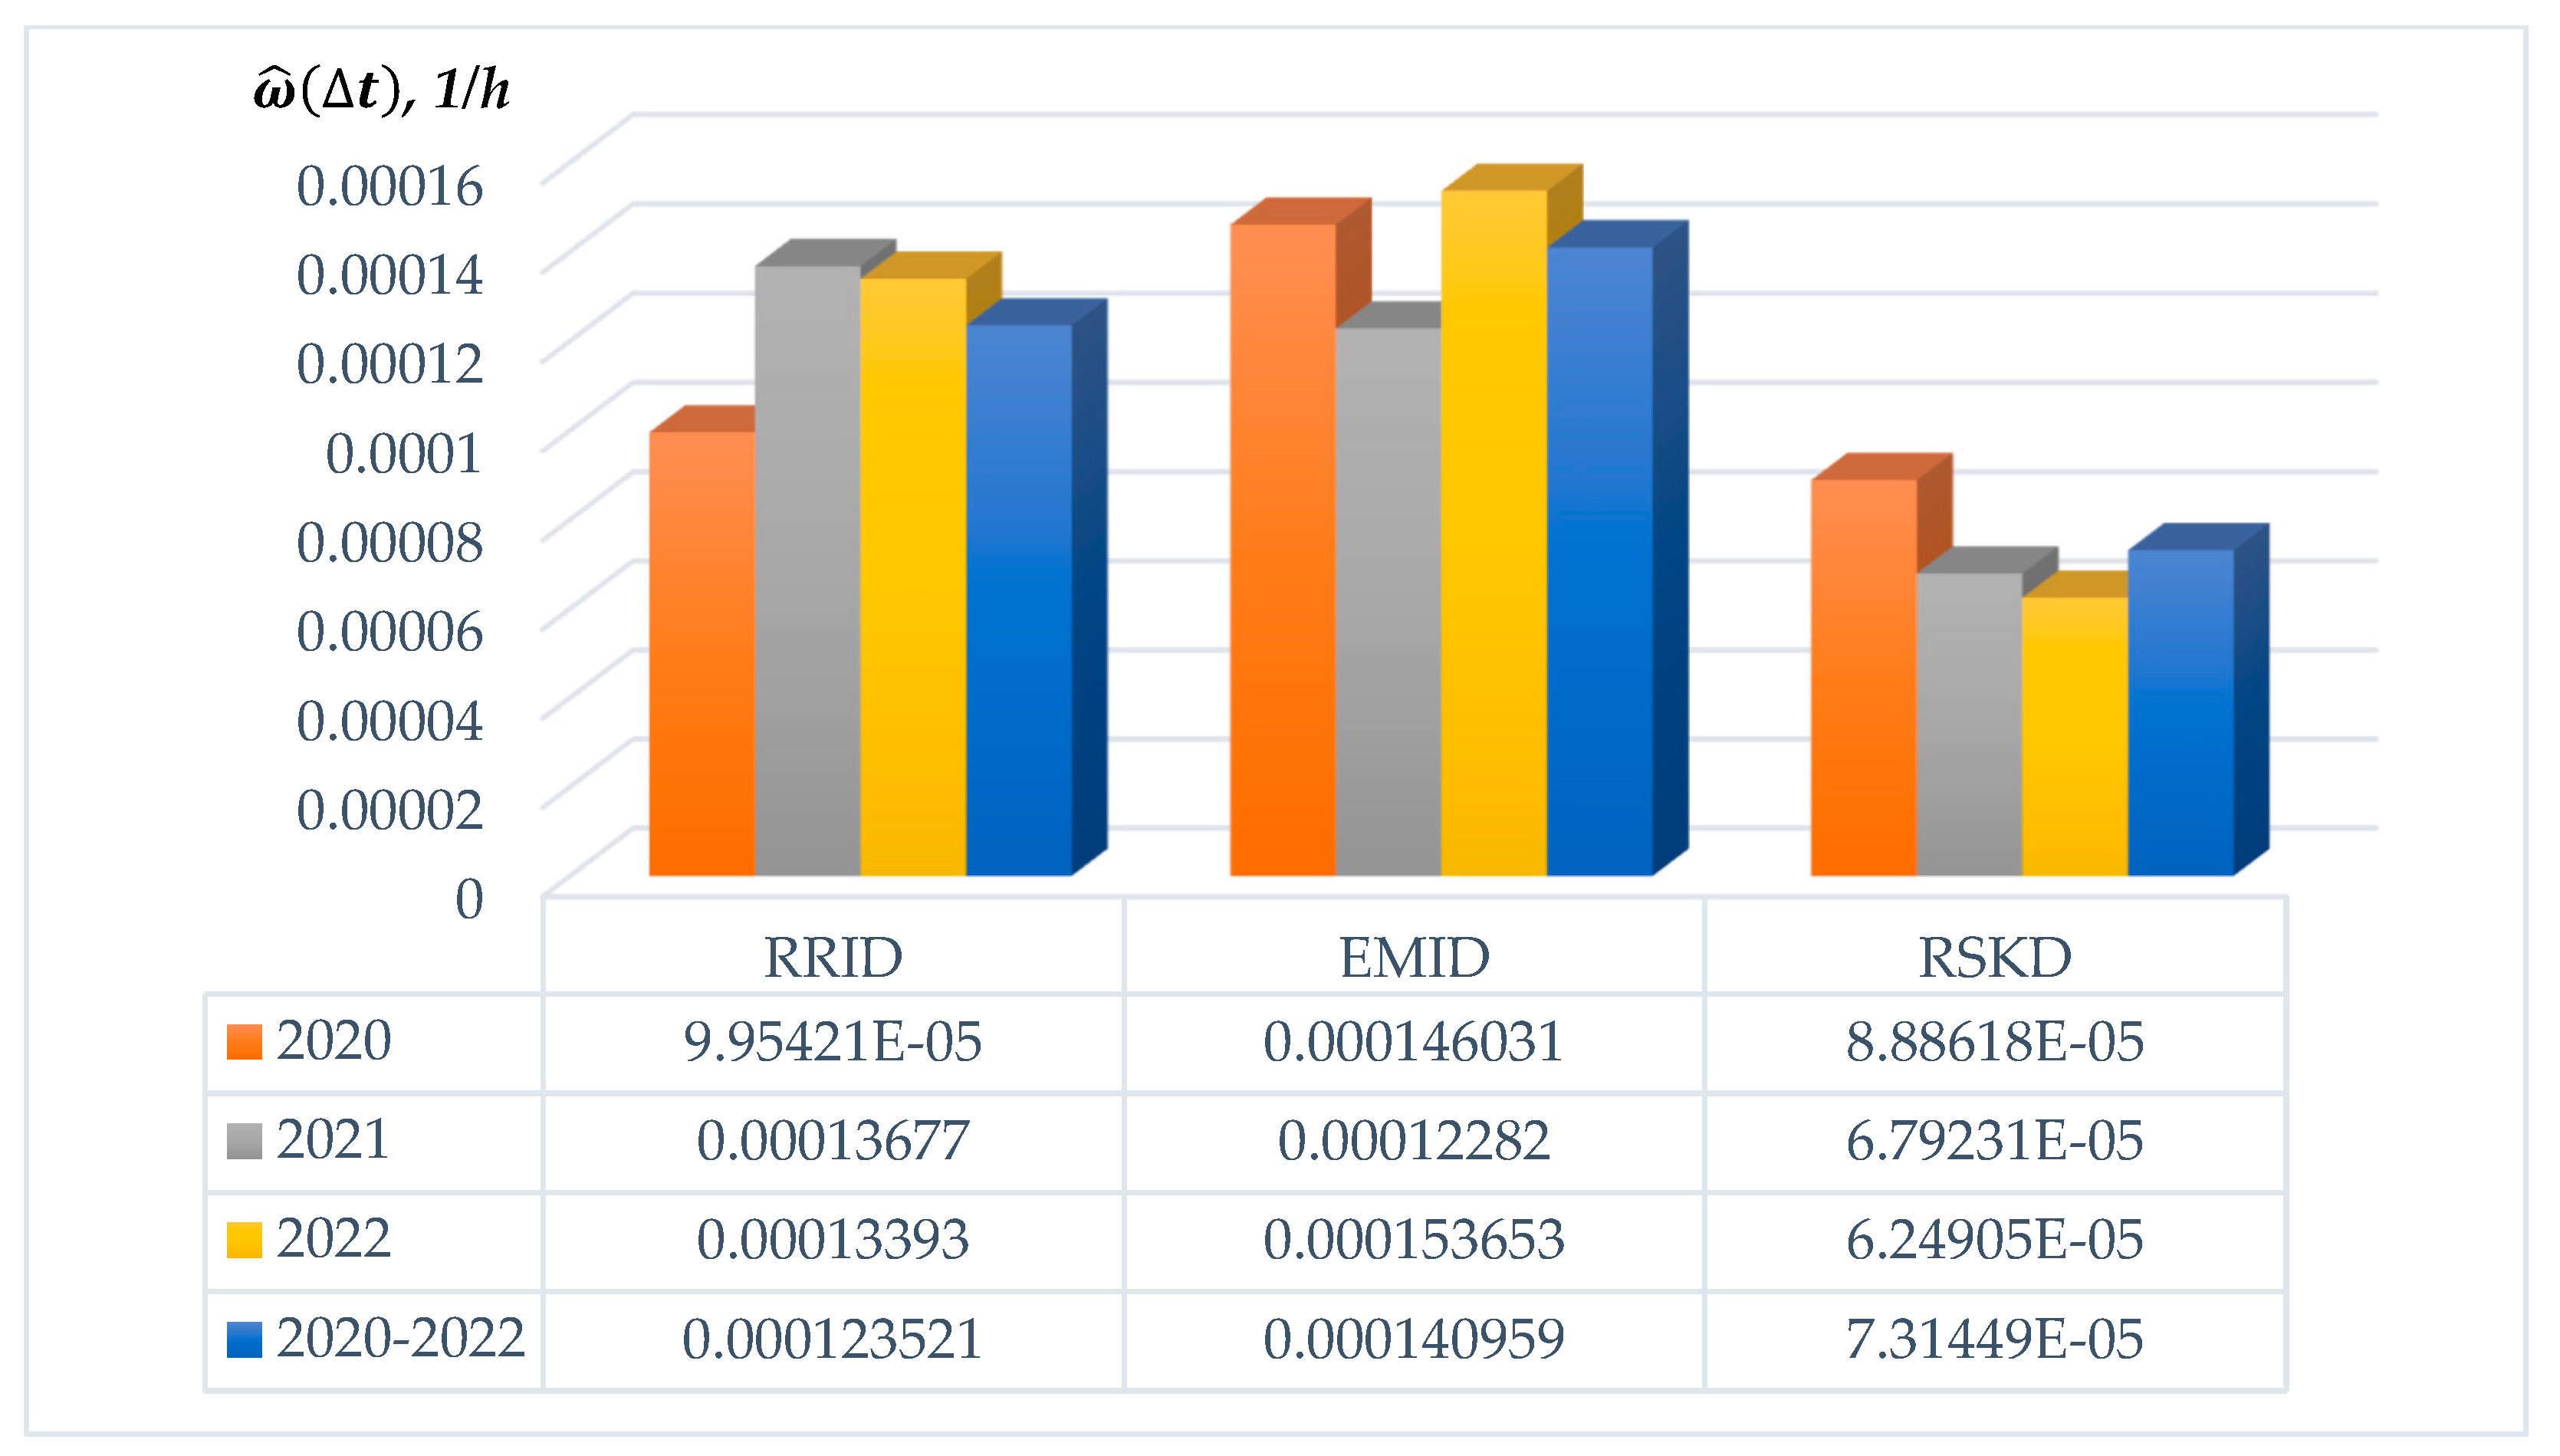
  • reliability analysis of interlocking devices, including the determination of the time for failure-free operation τt), the statistical assessment of the failure flow intensity ω ^ i Δ t , the Mean Time Between Failures MTBF and finally—the stationary indicators of availability and unavailability.
Reliability analysis provides a much more accurate evaluation of the operational reliability of devices than statistical data processing. Its use makes it possible to determine the elements of signalling systems that need to be upgraded, modernised, or replaced sooner. They also can be taken into account during the planning of technical maintenance of the specific devices. If data are available for specific lines, the methodology can be used to determine the reliability indicators for each individual section.
The proposed approach can be used to analyse the reliability of all other devices in signalling systems, as well as to determine the reliability indicators of any other systems, different in type, application, and structure, of course if the necessary data are available.

Author Contributions

Conceptualization, methodology, resources, project administration, funding acquisition, E.D.; writing—original draft preparation, formal analysis, E.D. and V.D.; software, investigation, data curation, writing—review and editing, supervision, V.D. All authors have read and agreed to the published version of the manuscript.

Funding

This research was funded by Bulgarian National Science Fund, grant number KP-06-H57/12.

Institutional Review Board Statement

Not applicable.

Informed Consent Statement

Not applicable.

Data Availability Statement

Publicly available datasets were analyzed in this study. This data can be found here: Reference documents of the railway network, NRIC, 2019, 2020, 2021, https://rail-infra.bg/bg/92 (accessed on 2 March 2025). Annual consolidated activity reports, NRIC, 2020, 2021, 2022, https://rail-infra.bg/bg/216 (accessed on 2 March 2025).

Conflicts of Interest

The authors declare no conflicts of interest.

Abbreviations

The following abbreviations are used in this manuscript:
EMIDElectromechanical Interlocking Devices
ESDExternal Station Devices
IlDInterlocking Devices
IsDInterstation Devices
NRICNational Railway Infrastructure Company (of Bulgaria)
RCIDRoute-Computer Interlocking Devices
RRIDRoute-Relay Interlocking Devices
RSKDRelay Systems For Key Dependences
STD“Signalling and Telecommunications” Department
TcDTelecommunications Devices

References

  1. Efanov, D.V.; Osadchy, G.V.; Aganov, I. Fundamentals of Implementation of Safety Movement of Trains under Integration of Control Systems with Hardware for Railway Infrastructure Facilities Monitoring. In Proceedings of the 2021 11th IEEE International Conference on Intelligent Data Acquisition and Advanced Computing Systems: Technology and Applications (IDAACS), Cracow, Poland, 22–25 September 2021; pp. 391–396. [Google Scholar] [CrossRef]
  2. Kamakshi, T.; Pritika, K. Smart Railway Infrastructure: Fusion of IoT, RFID and VANET for Enhanced Safety and Operational Efficiency. In Proceedings of the 2023 Second International Conference on Advances in Computational Intelligence and Communication (ICACIC), Puducherry, India, 7–8 December 2023; pp. 1–6. [Google Scholar] [CrossRef]
  3. Pop, I.; Festila, C. Railway Safety, from a Set of Rules to Cyber Physical Systems. In Proceedings of the 2024 IEEE International Conference on Automation, Quality and Testing, Robotics (AQTR), Cluj-Napoca, Romania, 16–18 May 2024; pp. 1–4. [Google Scholar] [CrossRef]
  4. Efanov, D.V.; Khóroshev, V.V.; Osadchy, G.V. Principles of Safety Signalling and Traffic Control Systems Synthesis on Railways. In Proceedings of the 2023 International Conference on Industrial Engineering, Applications and Manufacturing (ICIEAM), Sochi, Russia, 15–19 May 2023; pp. 634–638. [Google Scholar] [CrossRef]
  5. Efanov, D.V.; Mikhailiuta, E.M.; Khóroshev, V.V. Reliability Models for a Safe Train Traffic Control Systems Accounting the Railway Infrastructure States. In Proceedings of the 2023 International Russian Automation Conference (RusAutoCon), Sochi, Russia, 10–16 September 2023; pp. 266–270. [Google Scholar] [CrossRef]
  6. Zamouche, D.; Aissani, S.; Omar, M.; Saad, N. Safety-Oriented Train Control Systems Monitoring in Smart Railway Transportation: A Review. In Proceedings of the 4th International Conference on Pattern Analysis and Intelligent Systems (PAIS), Oum El Bouaghi, Algeria, 12–13 October 2022; pp. 1–8. [Google Scholar] [CrossRef]
  7. Baranov, L.A.; Godyaev, A.I. Potential Estimation of Train Spacing when Using Railway Safety Management Systems Based on a Radio Channel. In Proceedings of the 2019 International Multi-Conference on Industrial Engineering and Modern Technologies (FarEastCon), Vladivostok, Russia, 1–4 October 2019; pp. 1–6. [Google Scholar] [CrossRef]
  8. Kún, G.; Wührl, T. Classification of Communication Interfaces in Railway Systems. In Proceedings of the 2023 IEEE 17th International Symposium on Applied Computational Intelligence and Informatics (SACI), Timisoara, Romania, 23–26 May 2023; pp. 000749–000754. [Google Scholar] [CrossRef]
  9. Yang, J.; Cheng, X.; Wu, Y.; Qin, Y.; Jia, L. Railway Comprehensive Monitoring and Warning System Framework Based on Space-air-Vehicle-Ground Integration Network. In Proceedings of the 2018 Prognostics and System Health Management Conference (PHM-Chongqing), Chongqing, China, 26–28 October 2018; pp. 1314–1319. [Google Scholar] [CrossRef]
  10. Samantaray, R.R.; Azeez, A.; Yeshwanth, K.; Althaf, K.; Tarun, H.; Sudhakar, Y. Advanced IoT and Machine Learning Solutions for Railway Safety, 2nd. In Proceedings of the International Conference on Networking, Embedded and Wireless Systems (ICNEWS), Bangalore, India, 22–23 August 2024; pp. 1–6. [Google Scholar] [CrossRef]
  11. Abduvaytov, A.; Abdu Kayumbek, R.M.; Jeon, H.S.; Oh, R. The Real Time Railway Monitoring System suitable for Multi-View Object based on Sensor Stream Data Tracking. In Proceedings of the International Conference on Information Science and Communications Technologies (ICISCT), Tashkent, Uzbekistan, 4–6 November 2020; pp. 1–4. [Google Scholar] [CrossRef]
  12. Priyadharshini, D.; Yamuna, R.; Banu, G.; Bensam, S.D. IoT-based Railway Level Crossing Gate Control System. In Proceedings of the 2024 Second International Conference on Intelligent Cyber Physical Systems and Internet of Things (ICoICI), Coimbatore, India, 28–30 August 2024; pp. 293–297. [Google Scholar] [CrossRef]
  13. Kiruthika, S.; Sariba Munovara, A.; Nikitha, K.; Saranya, M. Enhanced Safety System for Unprotected Level Crossings: Train Distance Indicator and Opposite Train Detection. In Proceedings of the 10th International Conference on Advanced Computing and Communication Systems (ICACCS), Coimbatore, India, 14–15 March 2024; pp. 335–340. [Google Scholar] [CrossRef]
  14. Struchalin, V.G.; Narusova, E.Y.; Paruleva, I.V. Development of Labor Safety Information Systems for Railway Transport. In Proceedings of the 2023 International Conference on Quality Management, Transport and Information Security, Information Technologies (IT&QM&IS), Petrozavodsk, Russia, 25–29 September 2023; pp. 69–73. [Google Scholar] [CrossRef]
  15. ALawad, H.; Kaewunruen, S. Unsupervised Machine Learning for Managing Safety Accidents in Railway Stations. IEEE Access 2023, 11, 83187–83199. [Google Scholar] [CrossRef]
  16. Amjath MI, M.; Kuhanesan, S. TrackWarn: An AI-driven warning system for railway track workers. In Proceedings of the 2021 International Research Conference on Smart Computing and Systems Engineering (SCSE), Colombo, Sri Lanka, 16 September 2021; pp. 124–128. [Google Scholar] [CrossRef]
  17. Atanasov, I.; Pencheva, E. Operation and Maintenance Services in an Intelligent Railway Control System Architecture. In Proceedings of the 2024 International Conference on Control, Automation and Diagnosis (ICCAD), Paris, France, 15–17 May 2024; pp. 1–6. [Google Scholar] [CrossRef]
  18. Vatakov, V.; Pencheva, E.; Dimitrova, E. Recent Advances in Artificial Intelligence for Improving Railway Operations. In Proceedings of the 2022 30th National Conference with International Participation (TELECOM), Sofia, Bulgaria, 27–28 October 2022; pp. 1–4. [Google Scholar] [CrossRef]
  19. Narasimha Swamy, S.; Kushaal, S.; Kumar, S.; Aithal, R.; Vijayalakshmi, M.N. Enhancing Railway Safety Through Human Activity Recognition. In Proceedings of the 2024 8th International Conference on Computational System and Information Technology for Sustainable Solutions (CSITSS), Bengaluru, India, 7–9 November 2024; pp. 1–5. [Google Scholar] [CrossRef]
  20. Markovits, T.G.; Rácz, G. Safety principles for designing a generic product for railway signalling systems. In Proceedings of the Fifth World Conference on Smart Trends in Systems Security and Sustainability (WorldS4), London, UK, 29–30 July 2021; pp. 134–139. [Google Scholar] [CrossRef]
  21. Yu, J. A Domestical Safety Computer Platform for Railway Signal System. In Proceedings of the 2021 IEEE 5th Advanced Information Technology, Electronic and Automation Control Conference (IAEAC), Chongqing, China, 12–14 March 2021; pp. 26–30. [Google Scholar] [CrossRef]
  22. Zhang, L. Research and Design of the Safety Control Platform for the Railway Signaling. In Proceedings of the 2023 IEEE 7th Information Technology and Mechatronics Engineering Conference (ITOEC), Chongqing, China, 15–17 September 2023; pp. 339–342. [Google Scholar] [CrossRef]
  23. Narusova, E.Y.; Struchalin, V.G.; Paruleva, I.V. Development of Hardware and Software to Ensure Process Safety and Reliability in Railway Transport. In Proceedings of the 2023 International Conference on Quality Management, Transport and Information Security, Information Technologies (IT&QM&IS), Petrozavodsk, Russia, 25–29 September 2023; pp. 59–63. [Google Scholar] [CrossRef]
  24. Schmid, P.; Assaf, K.; Tiedt, C.; Reiter, F.; Friedenberger, D.; Polze, A. Managing Complexity in Safety-critical Railway Signaling Systems using Simplex Architectures. In Proceedings of the 2024 IEEE 27th International Symposium on Real-Time Distributed Computing (ISORC), Tunis, Tunisia, 22–25 May 2024; pp. 1–6. [Google Scholar] [CrossRef]
  25. Dimitrova, E.A.; Dimitrov, V.D. Systems for remote monitoring and control of objects in railway transport. In Proceedings of the International Conference Automatics and Informatics, Sofia, Bulgaria, 4–5 October 2016; John Atanasoff Society of Automatics and Informatics: Sofia, Bulgaria, 2016; pp. 45–48. [Google Scholar]
  26. Pachl, J. Railway Signalling Principles; Digitale Bibliothek Braunschweig: Braunschweig, Germany, 2020. [Google Scholar]
  27. Theeg, G.; Vlasenko, C. Railway Signalling and Interlocking, 3rd ed.; PMC Media House GmbH: Hamburg, Germany, 2020. [Google Scholar]
  28. Nedelchev, N.; Hristov, H. Electrical Interlocking Stations, 2nd ed.; Todor Kableshkov University of Transport: Sofia, Bulgaria, 2008. [Google Scholar]
  29. Rouaud, M. Probability, Statistics and Estimation; Creative Commons: Mountain View, CA, USA, 2013. [Google Scholar]
  30. Ash, R.B. Basic Probability Theory; Dover Publications: Mineola, NY, USA, 2008. [Google Scholar]
  31. Ross, S.M. Introduction to Probability Theory. In Introduction to Probability Models, 13th ed.; Elsevier Inc.: Amsterdam, The Netherlands, 2024. [Google Scholar]
  32. Sapozhnikov, V.; Sapozhnikov, V.l.; Efanov, D. Fundamentals of Reliability Theory and Technical Diagnostics; Lan: San Mateo, CA, USA, 2019. [Google Scholar]
  33. Balagurusamy, E. Reliability Engineering—Ch. 1: Basic Concept of Reliability; McGraw-Hill Education: Noida, Uttar Pradesh, India, 2010. [Google Scholar]
  34. Hu, C.; Youn, B.D.; Wang, P. Basic Concepts of Reliability. In Engineering Design Under Uncertainty and Health Prognostics; Springer Series in Reliability Engineering; Springer: Cham, Switzerland, 2019. [Google Scholar] [CrossRef]
  35. Ram, M.; Pham, H. Advances in Reliability Analysis and its Applications; Springer Series in Reliability Engineering; Springer: Cham, Switzerland, 2020. [Google Scholar]
  36. Unnikrishnan Nair, N.; Sankaran, P.G.; Balakrishnan, N. Reliability Modelling and Analysis in Discrete Time; Elsevier Inc.: Amsterdam, The Netherlands, 2018. [Google Scholar]
  37. Yampurin, N.; Baranova, A. Fundamentals of reliability of Electronic Devices; Publishing Center “Academy”: Moscow, Russia, 2010. [Google Scholar]
  38. Petrov, N. Reliability Studies of Risky Technical Systems; Publishing House “Zhelyo Uchkov”: Yambol, Bulgaria, 2007. [Google Scholar]
  39. Hristov, H.; Trifonov, V. Reliability and Security of Communications; Publishing House “Novi znania”: Sofia, Bulgaria, 2005. [Google Scholar]
  40. Verma, A.K.; Ajit, S.; Karanki, D.R. Reliability and Safety Engineering, 2nd ed.; Springer: Cham, Switzerland, 2016. [Google Scholar]
  41. Kumar, V.; Singh, L.; Tripathi, A.K. Reliability analysis of safety—Critical and control systems: A state-of-the-art review. IET Softw. 2018, 12, 1–18. [Google Scholar] [CrossRef]
  42. Petrov, N. Exploitation Reliability in Risky Technical Systems; University Prof. Dr. Asen Zlatarov: Burgas, Bulgaria, 2002. [Google Scholar]
  43. Sapozhnikov, V.; Sapozhnikov, V.l.; Shamanov, V. Reliability of Systems for Railway Automation, Remote Control and Communication; Publishing House Marshrut: Moscow, Russia, 2003. [Google Scholar]
  44. Gindev, E. Assurance Procedures in Reliability. In Introduction to Reliability Theory and Practice; Academic Publishing House “Prof. Marin Drinov”: Sofia, Bulgaria, 2002. [Google Scholar]
  45. Balagurusamy, E. Reliability mathematics. In Reliability Engineering; McGraw-Hill Education: Noida, Uttar Pradesh, India, 2010. [Google Scholar]
  46. Pang, S.; Bian, Z.; Zhang, Z.; Meng, L.; Jiao, J. A Safety Analysis Method Based on Model Checking. In Proceedings of the 2024 10th International Symposium on System Security, Safety, and Reliability (ISSSR), Xiamen, China, 16–17 March 2024; pp. 61–65. [Google Scholar] [CrossRef]
  47. Liu, J.; Feng, Y.; Lu, C.; Fei, C. Operational reliability assessment of complex mechanical systems with multiple failure modes: An adaptive decomposition-synchronous-coordination approach. Reliab. Eng. Syst. Saf. 2024, 253, 110494. [Google Scholar] [CrossRef]
  48. Bouissou, M.; Rogovchenko-Buffoni, L.; Thiele, B. From design to dependability: A bridge between physical simulation and risk analysis. In Proceedings of the Lambda Mu 20, Saint Malo, France, 11–14 October 2016. [Google Scholar]
  49. Havryliuk, V. Model of Propagation of Traction Current Harmonics from Trains to a Track Circuit Receiver. In Proceedings of the International Symposium on Electromagnetic Compatibility (APEMC), Nusa Dua—Bali, Indonesia, 27–30 September 2021; pp. 1–4. [Google Scholar] [CrossRef]
  50. Saiapina, I.; Holub, H.; Kulbovskyi, I. Improving Noise Immunity of Audio Frequency Track Circuits Using Neural Networks and Data Classification. In Transbaltica XIII: Transportation Science and Technology; Springer: Cham, Switzerland, 2023. [Google Scholar] [CrossRef]
  51. Tarasov, E.; Nadezhkin, V.; Nadezhkina, S. Insulating joints as a destabilizing factor in the operation of the track circuit. In Proceedings of the 6th International Conference APEC 2023, Moscow, Russia, 10 August 2023; E3S Web of Conferences. Volume 41110. Art. No. 01019. [Google Scholar]
Figure 1. Number and percentage distribution of failures of devices of signalling systems for STD—Sofia: (a) 2020; (b) 2021; (c) 2022; (d) period 2020–2022.
Applsci 15 04178 g001
Figure 2. Duration of failures of devices of signalling systems and their percentage distribution for STD—Sofia: (a) 2020; (b) 2021; (c) 2022; (d) period 2020–2022.
Applsci 15 04178 g002
Figure 3. Number of failures of different types of IlDs for STD—Sofia.
Applsci 15 04178 g003
Figure 4. Duration of failures of different types of IlDs for STD—Sofia.
Applsci 15 04178 g004
Figure 5. Proportion of failures of different types of IlDs for STD—Sofia.
Applsci 15 04178 g005
Figure 6. Proportion of duration of failures of different types of IlDs for STD—Sofia.
Applsci 15 04178 g006
Figure 7. Number and percentage distribution of failures of devices of signalling systems for STD—Plovdiv: (a) 2020; (b) 2021; (c) 2022; (d) period 2020–2022.
Applsci 15 04178 g007
Figure 8. Duration of failures of devices of signalling systems and their percentage distribution for STD—Plovdiv: (a) 2020; (b) 2021; (c) 2022; (d) period 2020–2022.
Applsci 15 04178 g008
Figure 9. Number of failures of different types of IlDs for STD—Plovdiv.
Applsci 15 04178 g009
Figure 10. Duration of failures of different types of IlDs for STD—Plovdiv.
Applsci 15 04178 g010
Figure 11. Proportion of failures of different types of IlDs for STD—Plovdiv.
Applsci 15 04178 g011
Figure 12. Proportion of duration of failures of different types of IlDs for STD—Plovdiv.
Applsci 15 04178 g012
Figure 13. Number and percentage distribution of failures of devices of signalling systems for STD—Gorna Oryahovitsa: (a) 2020; (b) 2021; (c) 2022; (d) period 2020–2022.
Applsci 15 04178 g013
Figure 14. Duration of failures of devices of signalling systems and their percentage distribution for STD—Gorna Oryahovitsa: (a) 2020; (b) 2021; (c) 2022; (d) period 2020–2022.
Applsci 15 04178 g014
Figure 15. Number of failures of different types of IlDs for STD—Gorna Oryahovitsa.
Applsci 15 04178 g015
Figure 16. Duration of failures of different types of IlDs for STD—Gorna Oryahovitsa.
Applsci 15 04178 g016
Figure 17. Proportion of failures of different types of IlDs for STD—Gorna Oryahovitsa.
Applsci 15 04178 g017
Figure 18. Proportion of duration of failures of different types of IlDs for STD—Gorna Oryahovitsa.
Applsci 15 04178 g018
Figure 19. Time for failure-free operation τt) of different types of IlDs for STD—Sofia.
Applsci 15 04178 g019
Figure 20. Statistical evaluation of the intensity of the failures flow ω ^ i Δ t of different types of IlDs for STD—Sofia.
Applsci 15 04178 g020
Figure 21. Mean time between failures flow MTBF of different types of IlDs for STD—Sofia.
Applsci 15 04178 g021
Figure 22. Coefficient of availability of different types of IlDs for STD—Sofia.
Applsci 15 04178 g022
Figure 23. Coefficient of unavailability of different types of IlDs for STD—Sofia.
Applsci 15 04178 g023
Figure 24. Time for failure-free operation τt) of different types of IlDs for STD—Plovdiv.
Applsci 15 04178 g024
Figure 25. Statistical evaluation of the intensity of the failures flow ω ^ i Δ t of different types of IlDs for STD—Plovdiv.
Applsci 15 04178 g025
Figure 26. Mean time between failures flow MTBF of different types of IlDs for STD—Plovdiv.
Applsci 15 04178 g026
Figure 27. Coefficient of availability of different types of IlDs for STD—Plovdiv.
Applsci 15 04178 g027
Figure 28. Coefficient of unavailability of different types of IlDs for STD—Plovdiv.
Applsci 15 04178 g028
Figure 29. Time for failure-free operation of different types of IlDs for STD—Gorna Oryahovitsa.
Applsci 15 04178 g029
Figure 30. Statistical evaluation of the intensity of the failures flow ω ^ i Δ t of different types of IlDs for STD—Gorna Oryahovitsa.
Applsci 15 04178 g030
Figure 31. Mean time between failures flow of different types of IlDs for STD—Gorna Oryahovitsa.
Applsci 15 04178 g031
Figure 32. Coefficient of availability of different types of IlDs for STD—Gorna Oryahovitsa.
Applsci 15 04178 g032
Figure 33. Coefficient of unavailability of different types of IlDs for STD—Gorna Oryahovitsa.
Applsci 15 04178 g033
Table 1. Number of interlocking devices (NIlD) in the different STD.
Type of IlDSTD—SofiaSTD—PlovdivSTD—G.Or.Total
RCID320-23
RRID625354169
EMID17-1532
RSKD25202267
Total1079391291
Table 2. Comparison between availability and unavailability coefficients obtained in different ways for STD—Sofia.
Type of IlD A 2020 2022 A A v U 2020 2022 U A v
RCID0.97239480.98906550.02760520.0109345
RRID0.62814140.82235160.37185860.1776484
EMID0.97687480.99054240.02312520.0094576
RSKD0.98779500.99490170.01220500.0050983
Table 3. Comparison between availability and unavailability coefficients obtained in different ways for STD—Plovdiv.
Type of IlD A 2020 2022 A A v U 2020 2022 U A v
RCID0.8143676380.9297836180.1856323620.070216382
RRID0.9794239340.9926412810.0205760660.007358719
RSKD0.9863041230.9947487890.0136958770.005251211
Table 4. Comparison between availability and unavailability coefficients obtained in different ways for STD—Gorna Oryahovitsa.
Type of IlD A 2020 2022 A A v U 2020 2022 U A v
RRID0.92052640.9736528780.07947360.026347122
EMID0.96227480.9873448690.03772520.012655131
RSKD0.98684240.9953687530.01315760.004631247
Disclaimer/Publisher’s Note: The statements, opinions and data contained in all publications are solely those of the individual author(s) and contributor(s) and not of MDPI and/or the editor(s). MDPI and/or the editor(s) disclaim responsibility for any injury to people or property resulting from any ideas, methods, instructions or products referred to in the content.

