
The Influence of Different Visual Elements of High-Density Urban Observation Decks on the Visual Behavior and Place Identity of Tourists and Residents


Abstract
1. Introduction
2. Literature Review
3. Method
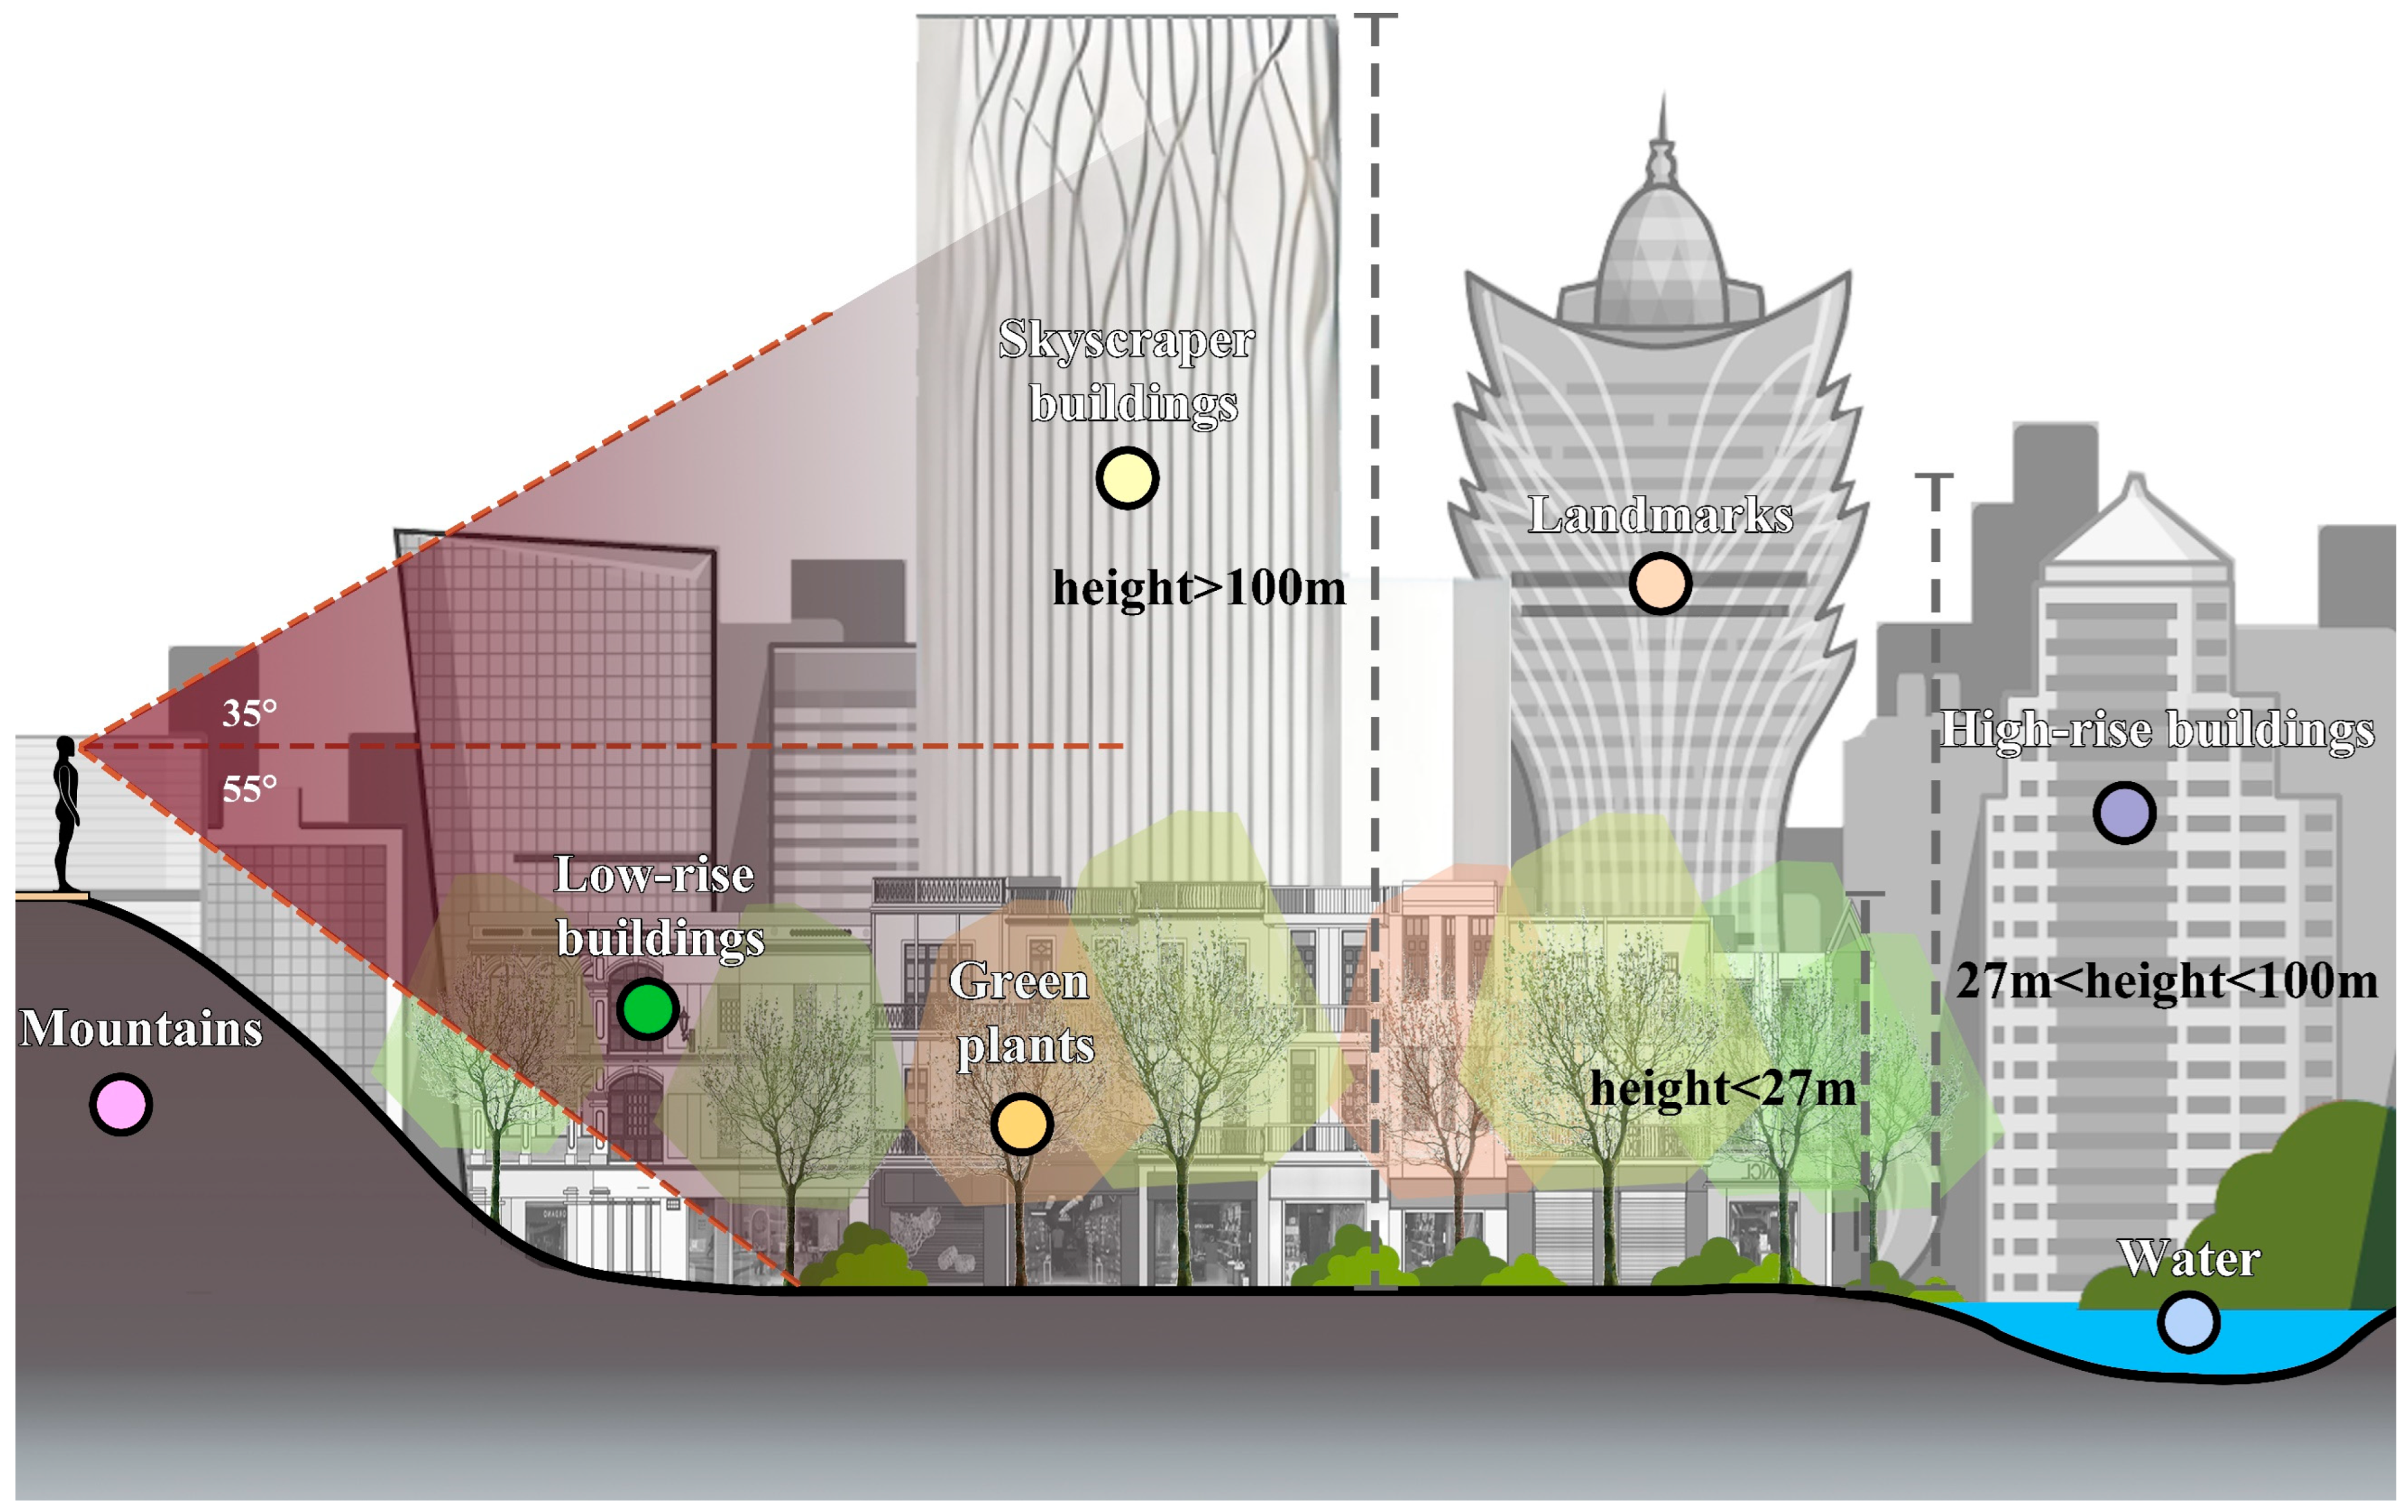
3.1. Study Scope and Stimulus Images
3.2. Eye-Tracking Experiments
3.2.1. Experimental Participants
3.2.2. Experimental Protocol
3.2.3. Drawing AOIs
3.2.4. Data Index Selection
3.3. Visual Aesthetics and Place Identity Scale
3.3.1. Questionnaire Design
3.3.2. Questionnaire Participants
3.3.3. Data Analysis
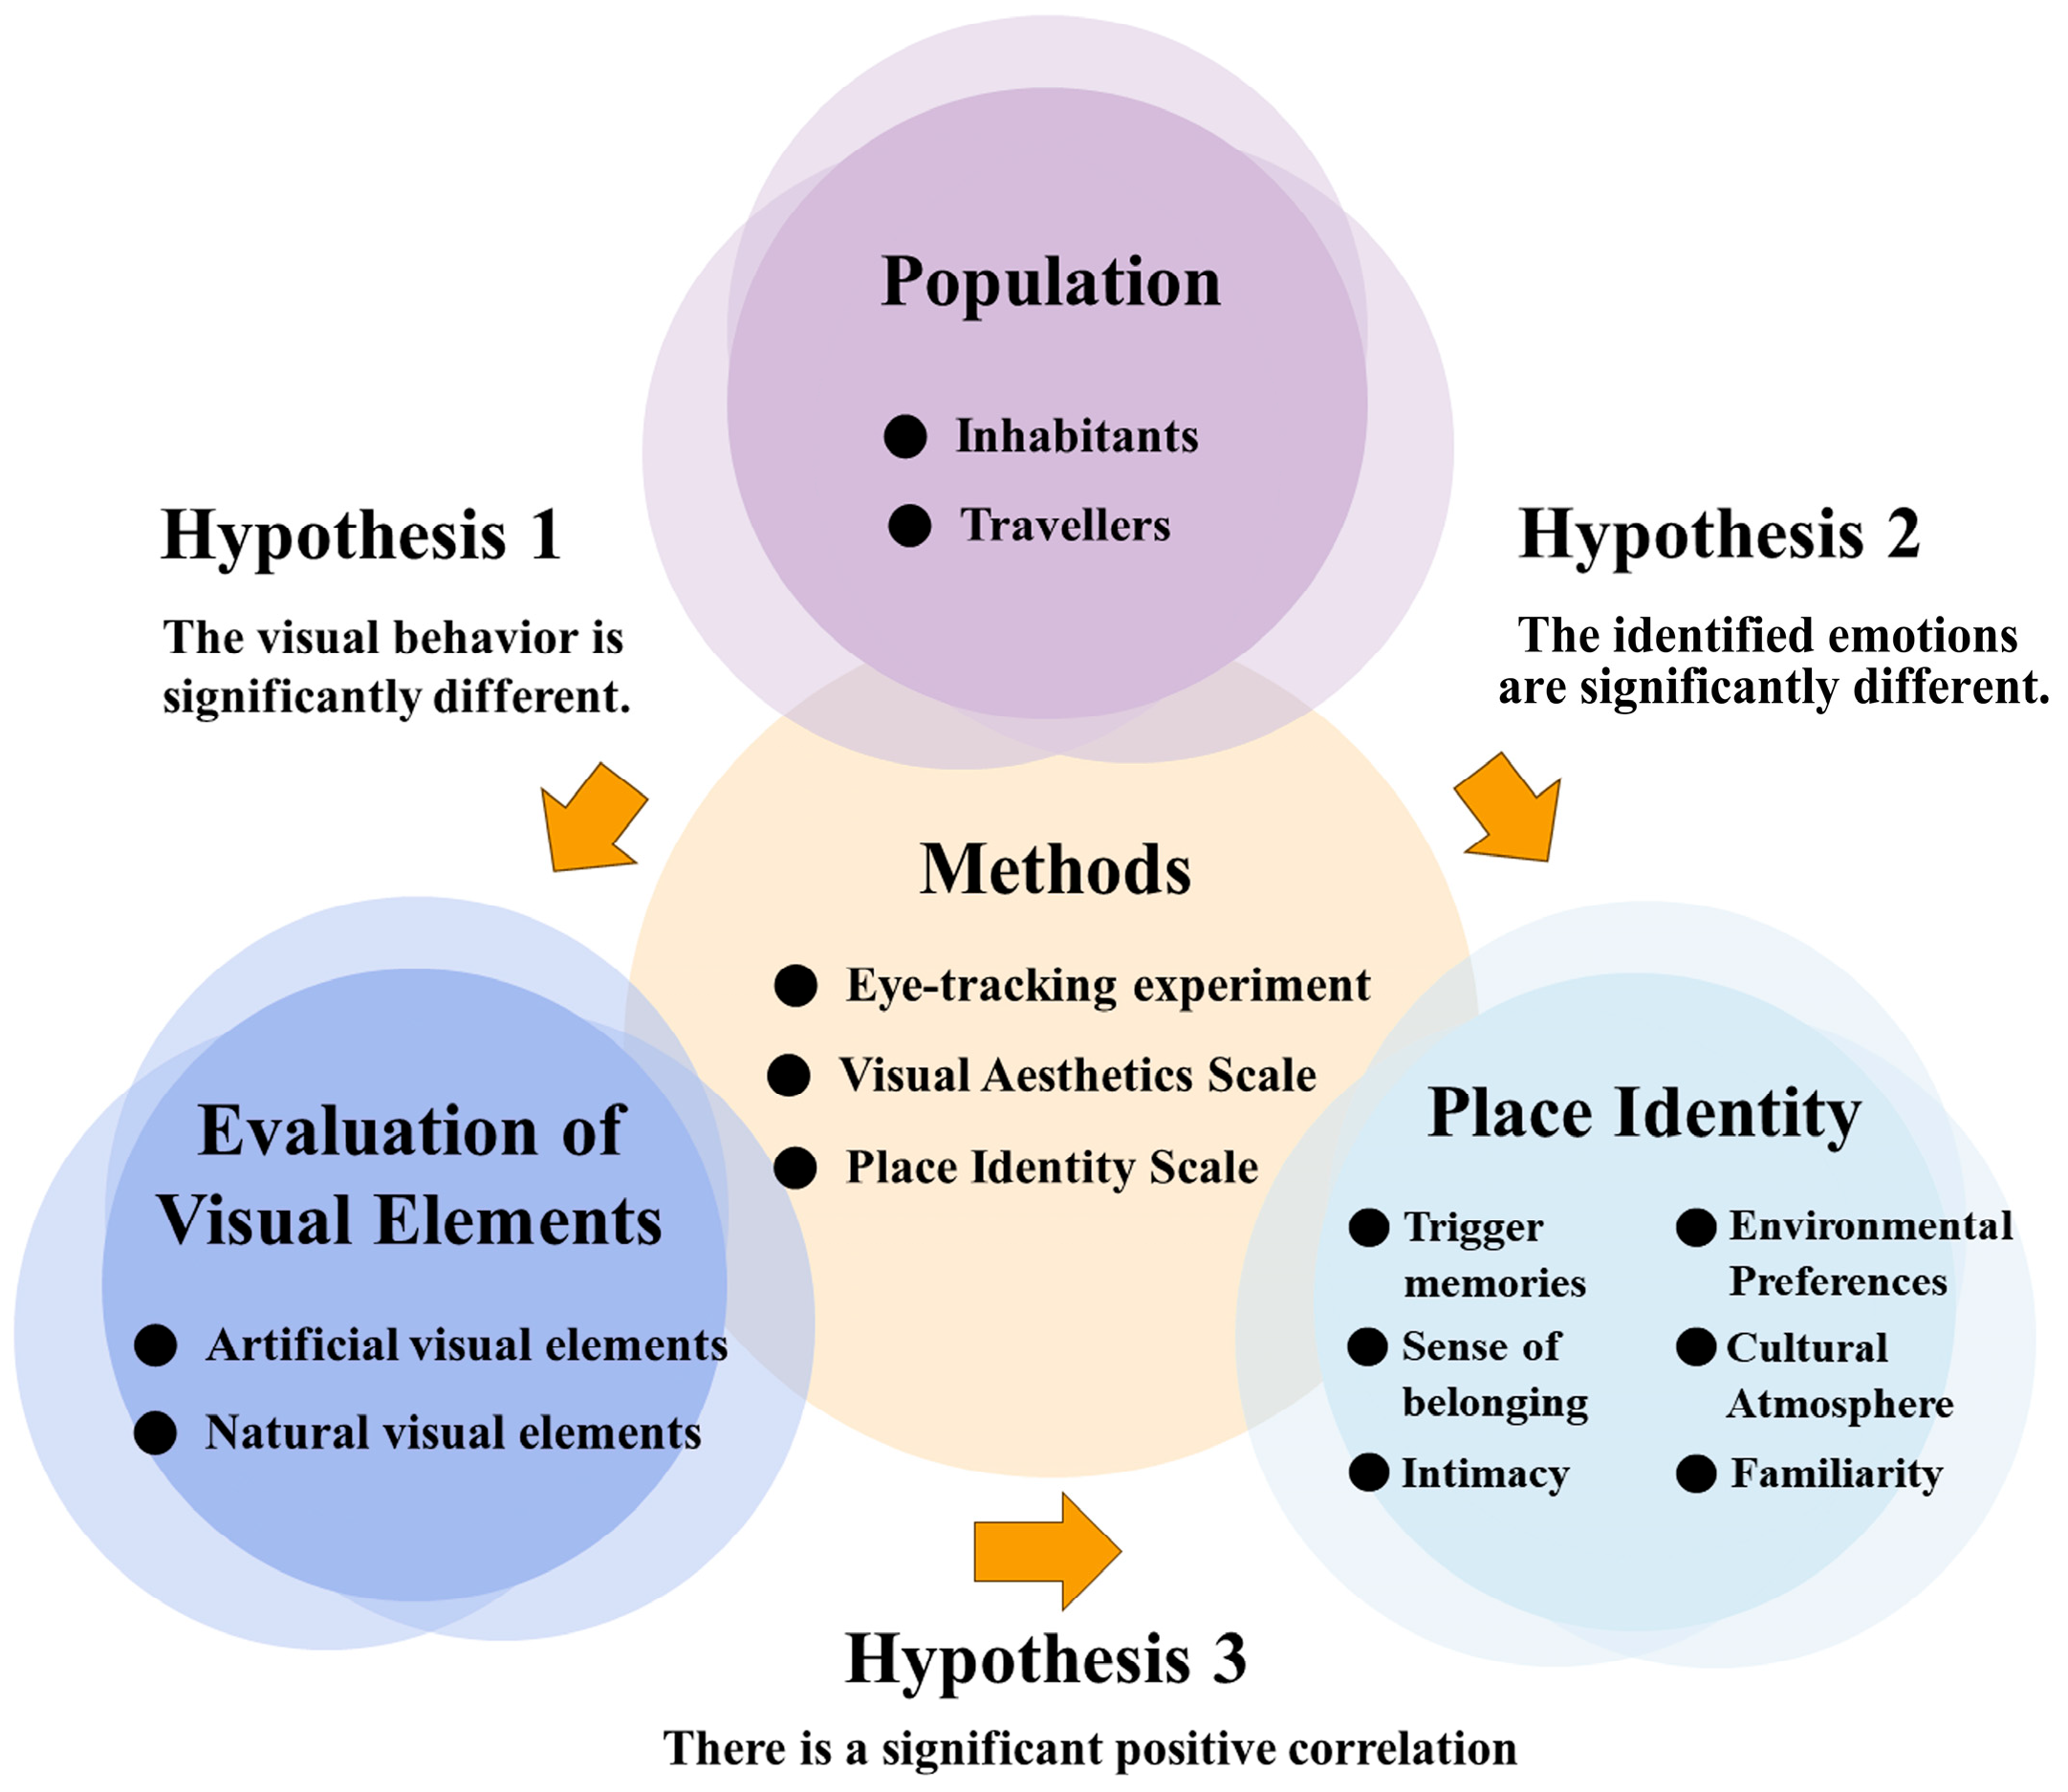
- (1)
- One-way analysis of variance (ANOVA) was used to analyze the differences in visual behavior indicators and to determine the differences between groups of people at the same viewing platform for the same image and different visual element eye movement indicators. An independent sample t-test and univariate analysis were performed, and H1 was verified.
- (2)
- A visual aesthetic evaluation and psychometric measurement of different scenes were carried out using the questionnaire data. Reliability and validity analyses and an independent sample t-test were carried out to determine the psychological differences between different groups of people in relation to places with the same overall landscape architecture. The aim was to verify H2.
- (3)
- Correlation analysis and multiple regression equations were used to determine the correlation between the aesthetic evaluation indexes of different visual elements and place identity, and H3 was verified.
4. Results and Analysis
4.1. Eye-Tracking Heat Map Distribution and Analysis
4.2. Perceptual Behavior of Visual Elements
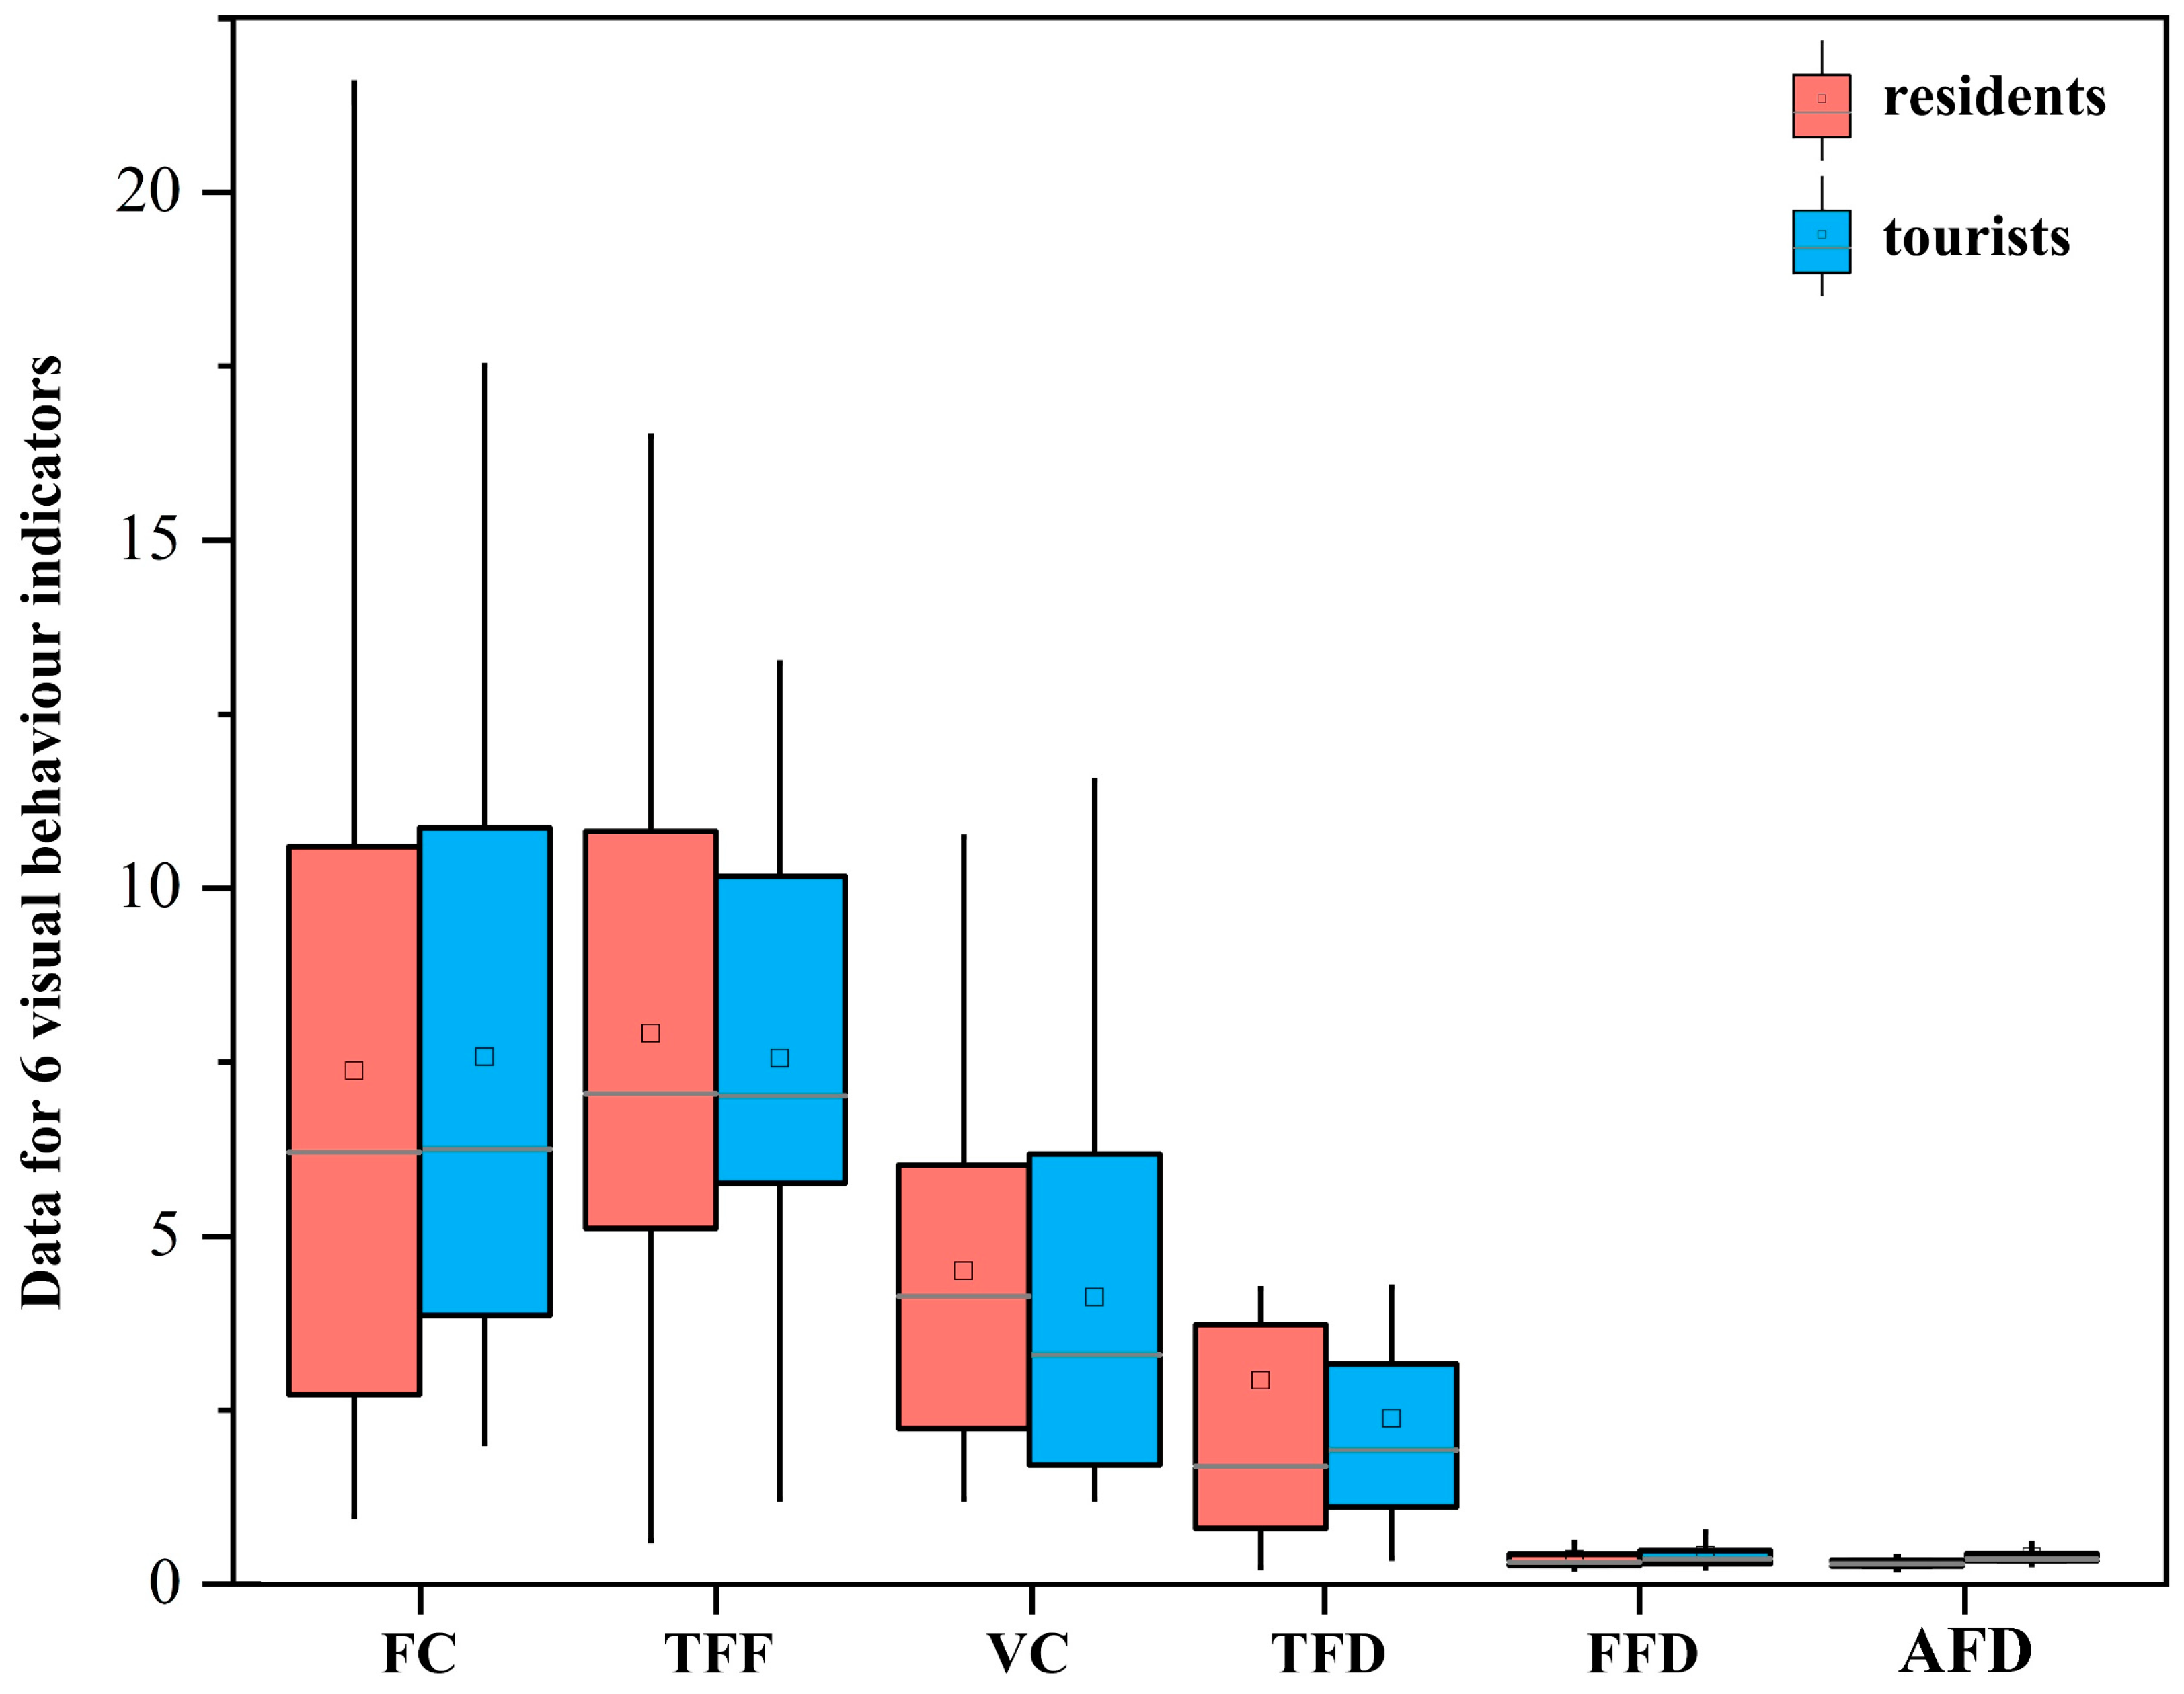
4.2.1. Visual Behaviors of Different Groups of Viewers
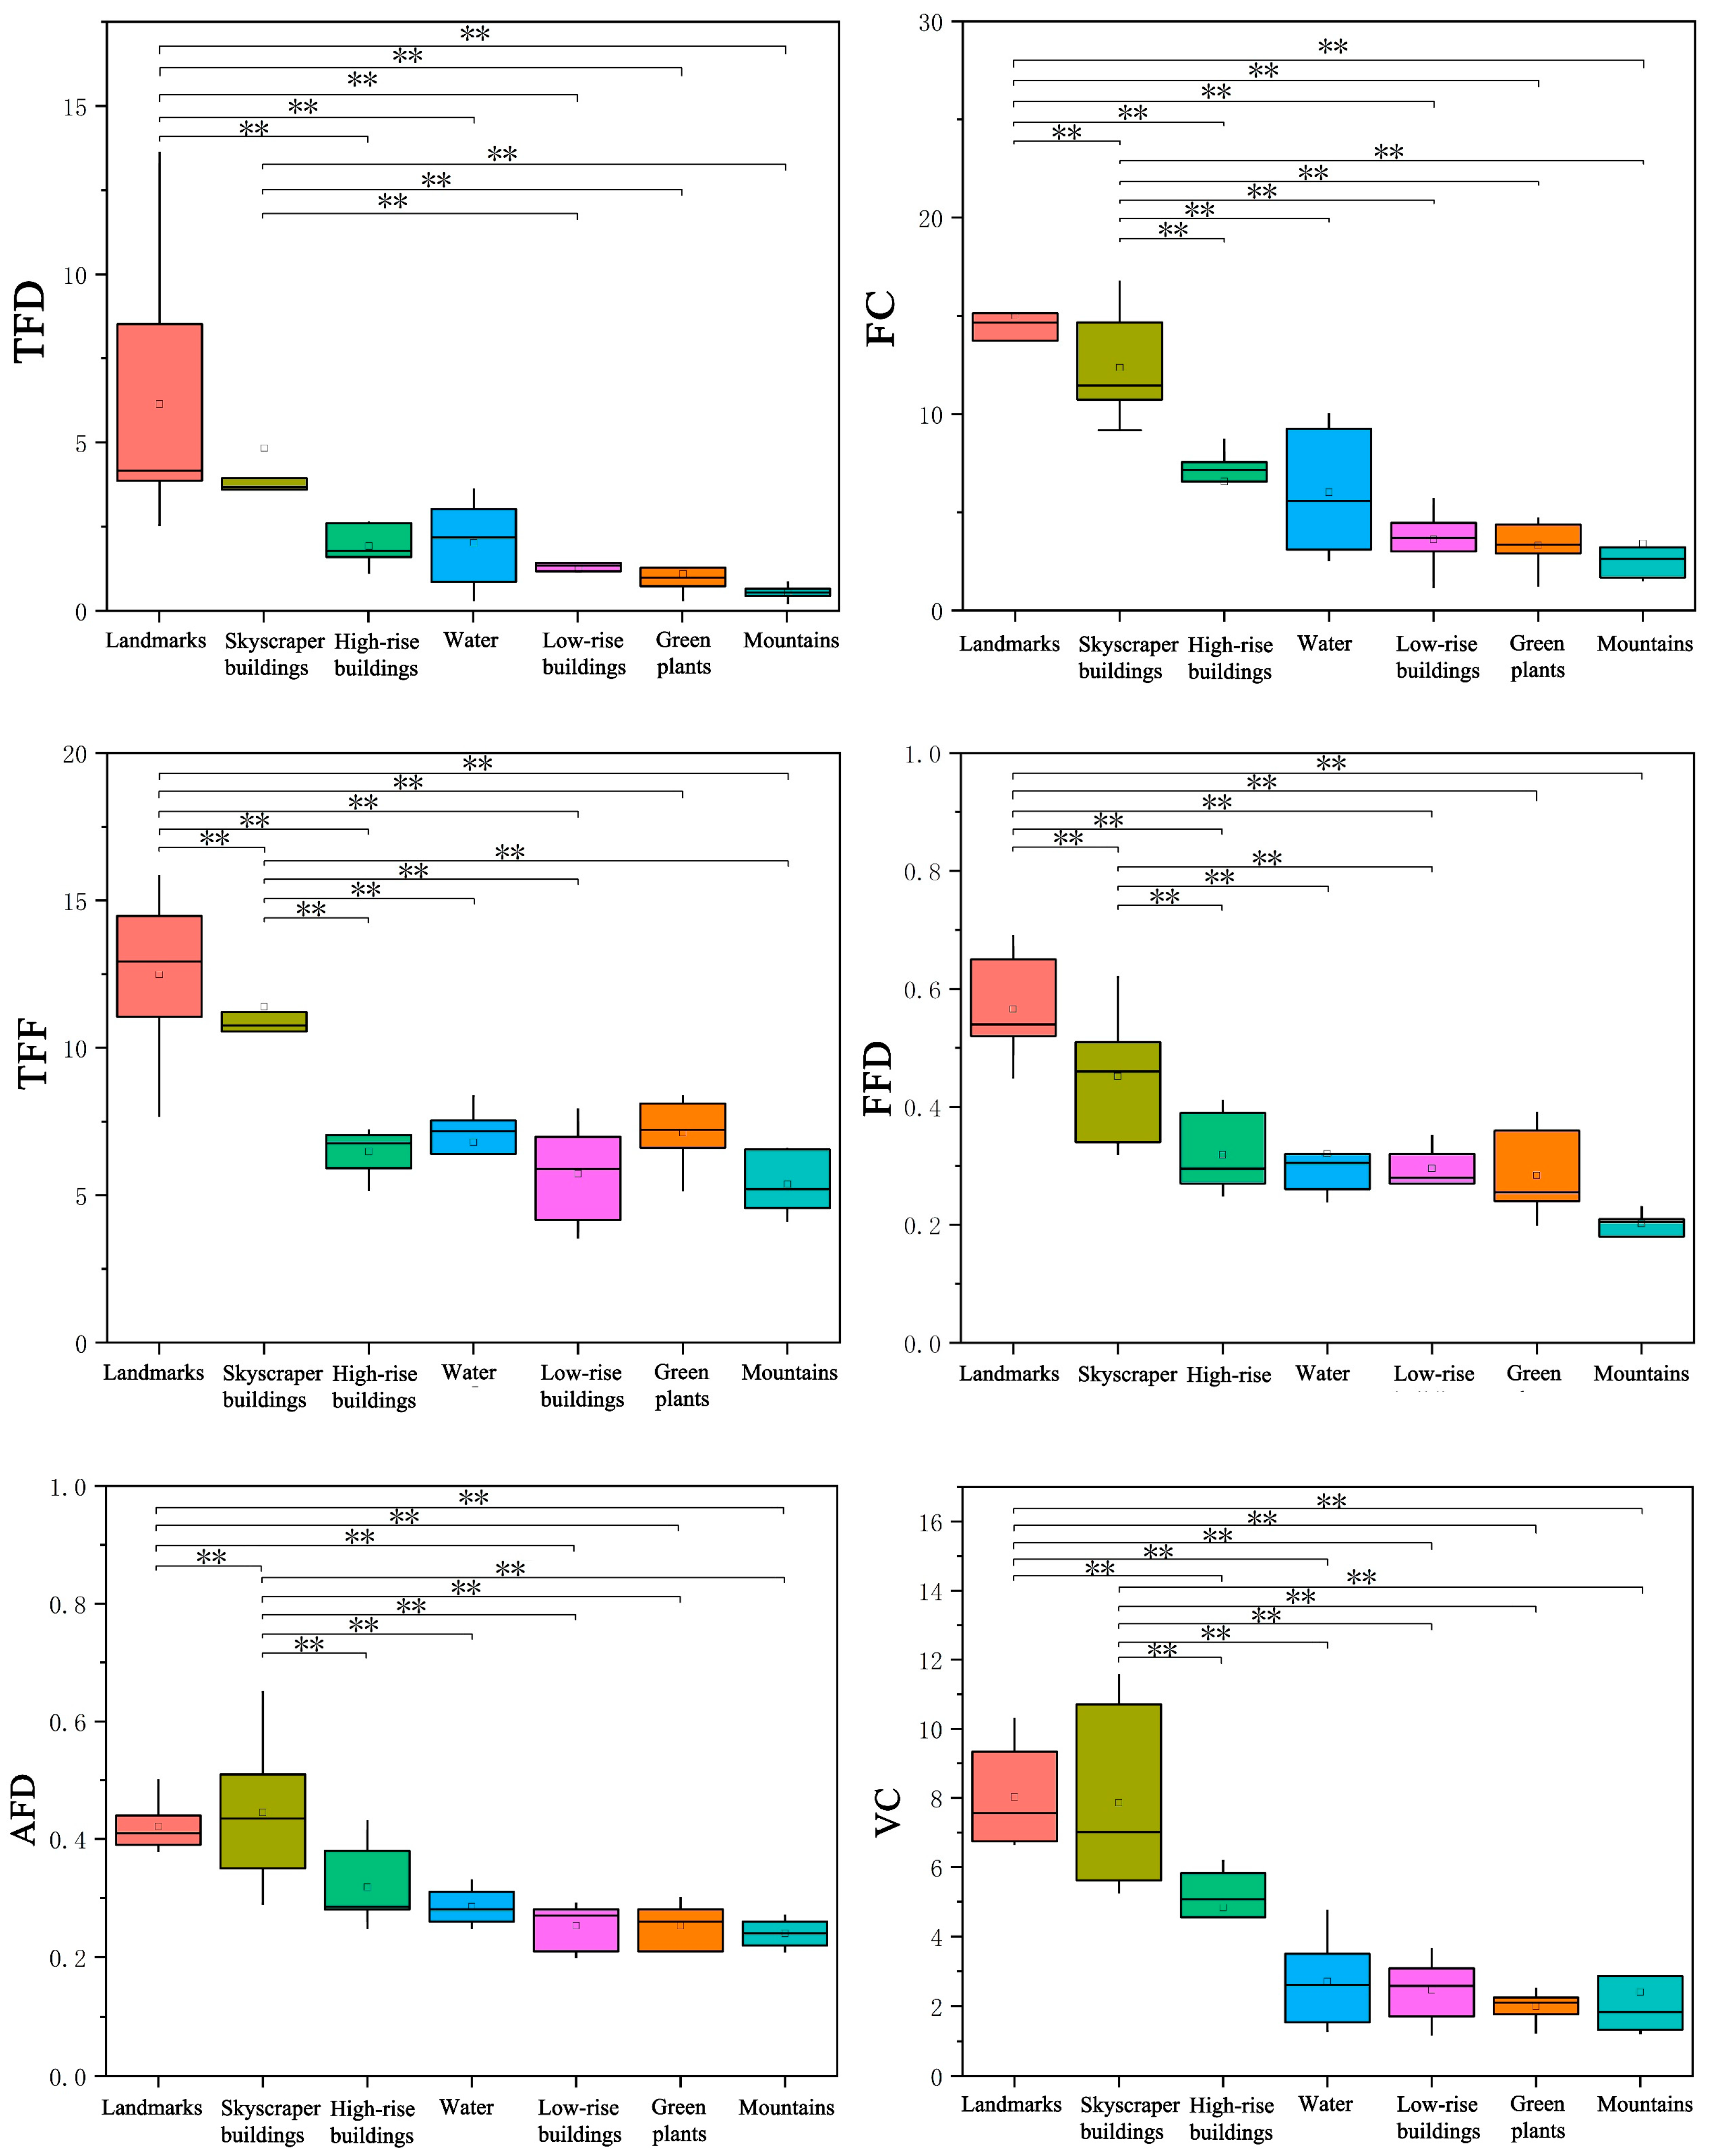
4.2.2. Eye Movement Indicators of Different Visual Elements
4.3. Questionnaire Data Results and Analysis
4.3.1. Questionnaire Validity Test
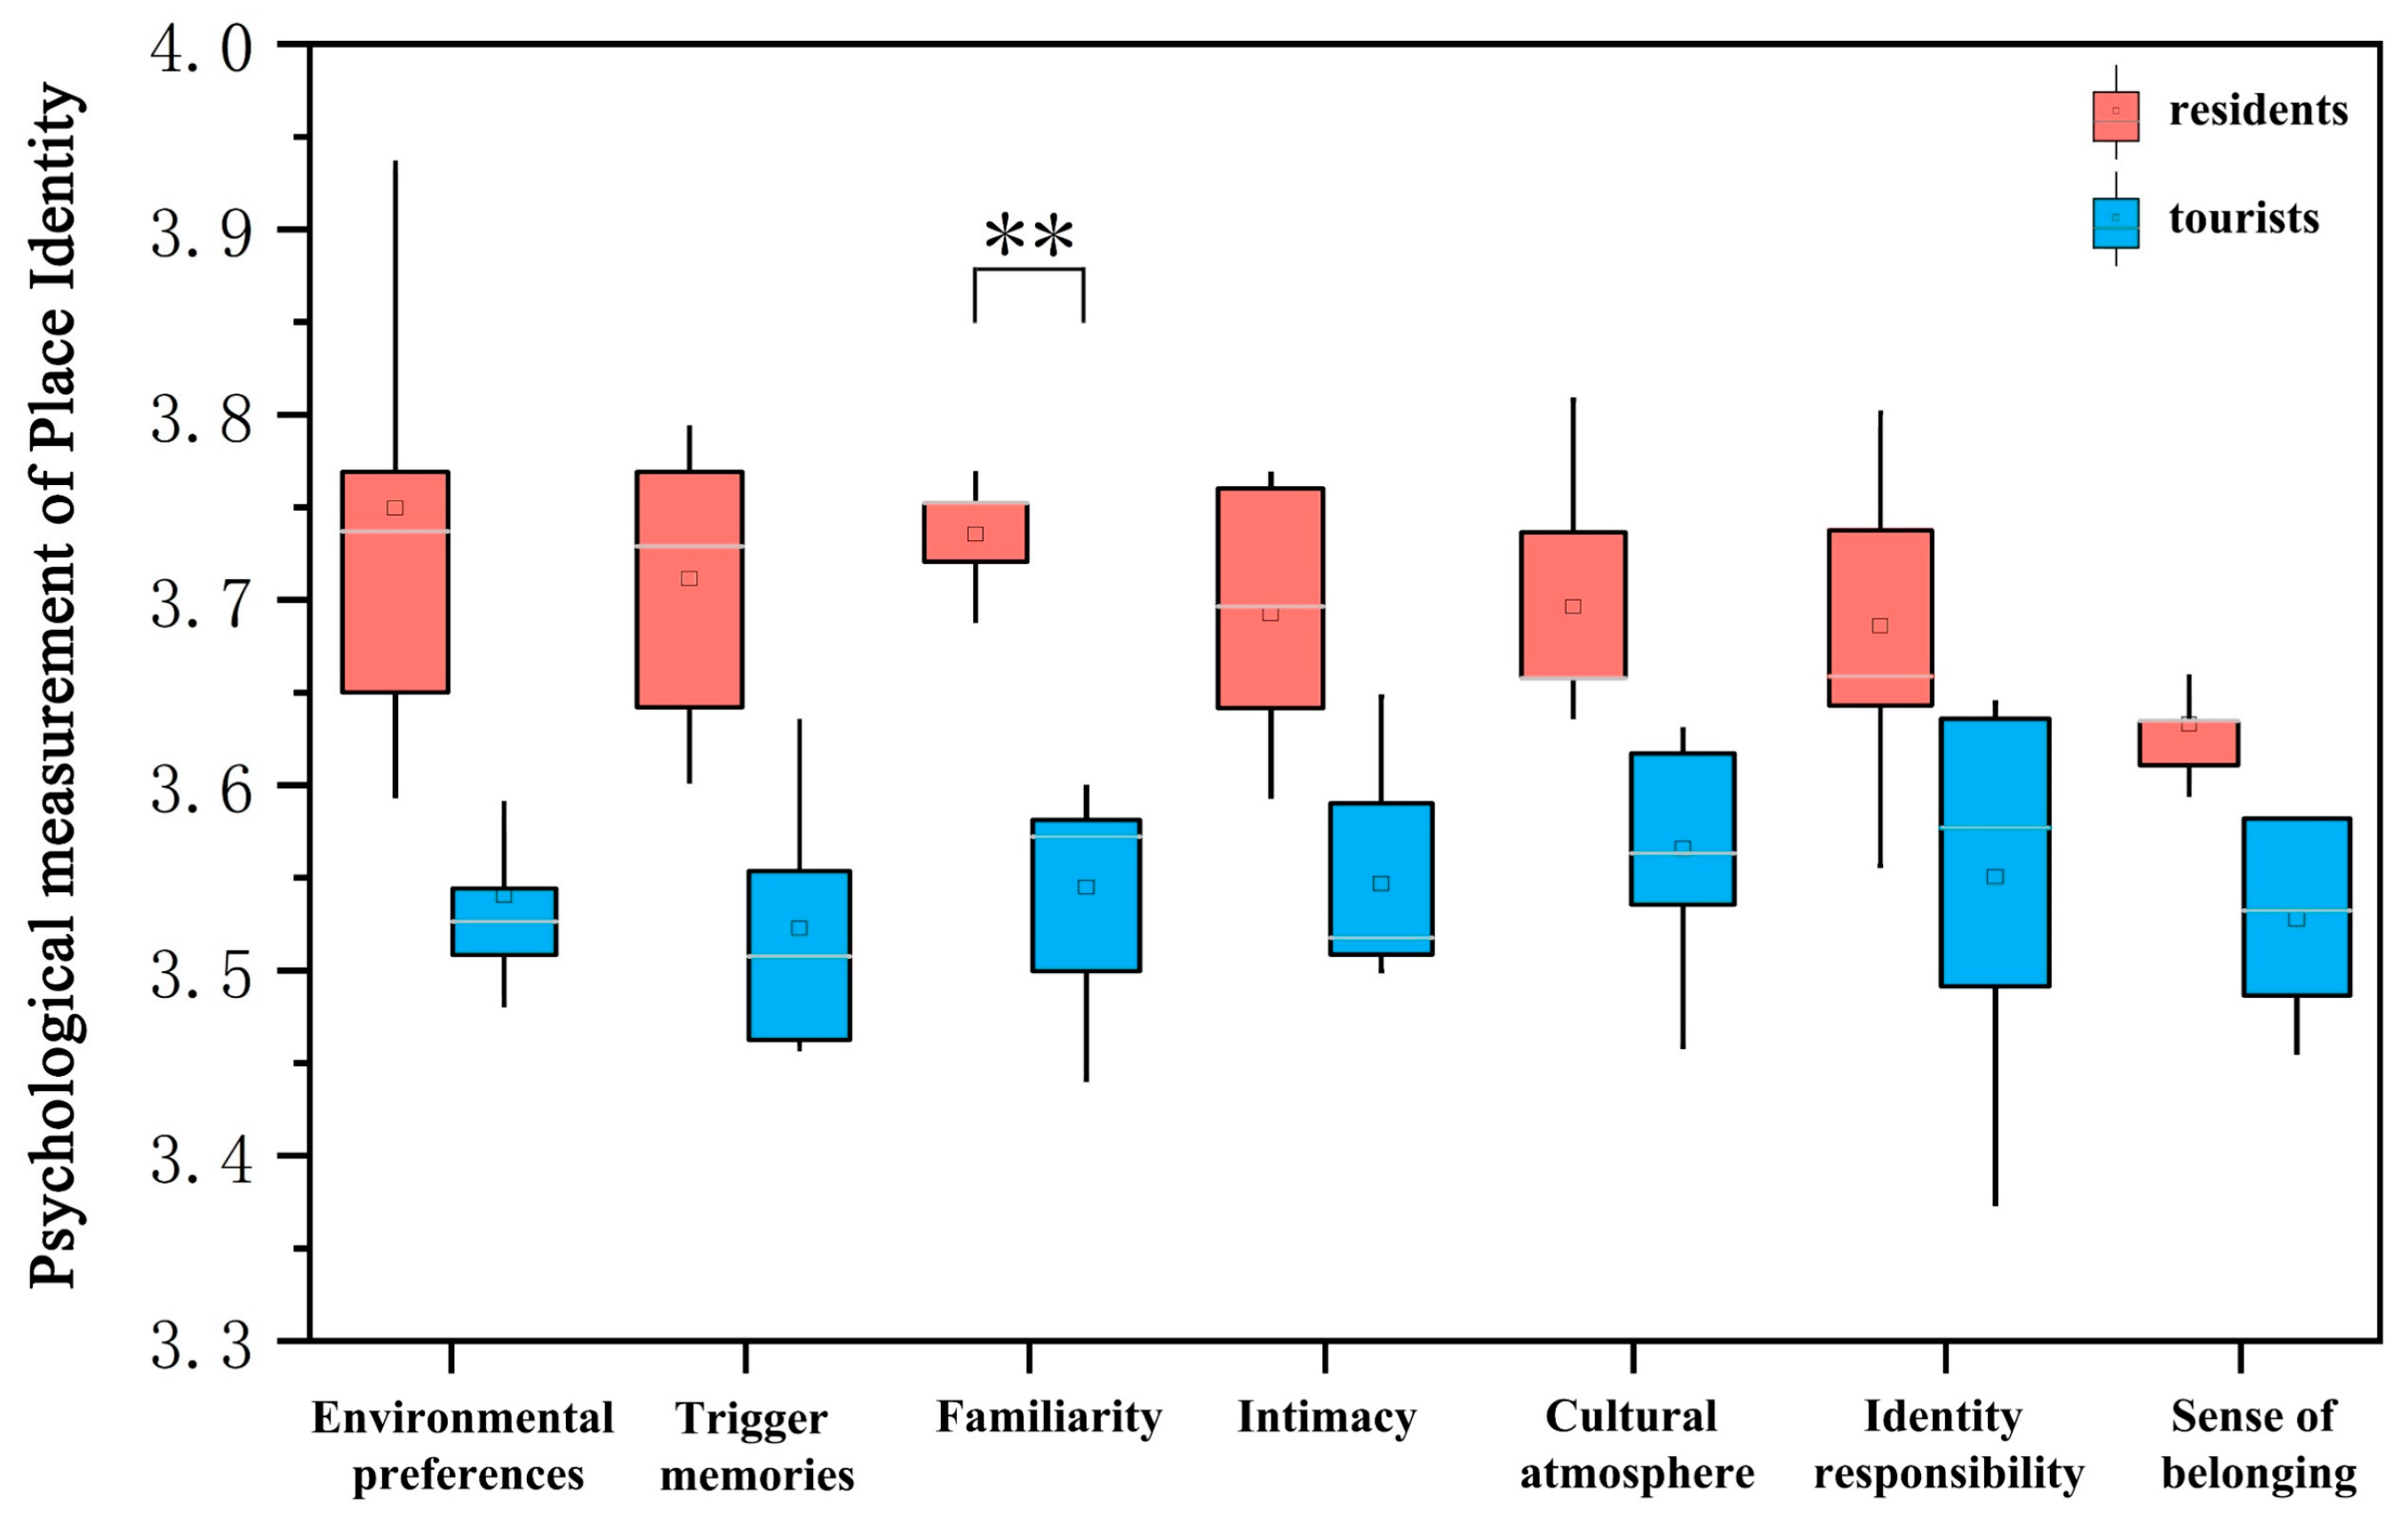
4.3.2. Psychological Measurement of Place Identity in Different Groups of Viewers
4.3.3. Psychological Correlation with Place Identity
- (1)
- There were 10 visual aesthetic evaluation indexes with a 0.05 level of significance for place identity psychology and six visual evaluation factors with a 0.01 level of significance for place identity psychology.
- (2)
- From the perspective of visual element categories, the aesthetic perception of green plant visual elements had the strongest psychological correlation with place identity (0.754); the intimacy correlation coefficient between the color vividness of green plants and the psychological dimension of place identity was the highest (0.834); and the number of evaluation indicators with a correlation between water visual elements and place identity psychology was the highest. There is a significant positive correlation between natural visual elements and place identity.
- (3)
- Regarding the evaluation factor categories, the visual aesthetic evaluation index of decorative sophistication and the psychological correlation coefficient of place identity exhibited a negative relationship. Therefore, the visual aesthetic evaluation of decorative sophistication had a negative correlation with place identity psychology. The correlation coefficients between the other significance evaluation factors and place identity psychology were positive; therefore, the seven types of visual aesthetic evaluation indexes (e.g., proportion coordination, form richness, neatness, and color vividness) had a positive correlation with place identity psychology.
- (4)
- Among the 16 aesthetic evaluation indexes of visual elements that correlated with the psychology of place identity, the correlation coefficients of the color vividness of green plants and the color vividness of water were >0.7, indicating that there was a strong positive correlation between these two items. The correlation coefficients between the remaining 14 visual element aesthetic evaluation indexes and place identity psychology were within 0.3–0.7, indicating that these 14 aesthetic evaluation indicators strongly correlated with the psychological notion of identity.
4.3.4. Multiple Linear Regression Results and Analysis
- (1)
- F = 14.251 and p-value = 0.009 < 0.05, which is less than 0.05. This indicates that the model is significant at the 0.05 level. It passes the F-test and has a linear correlation with the dependent variable. Hence, the model is validated.
- (2)
- The adjusted R2 considers the number of predictors used to forecast the target variable, helping to decide if adding new variables improves the model fit. Here, the adjusted R2 value was 0.726. This implies that the nine influencing factors could account for 72.6% of the variation in identity psychology. In other words, 72.6% of the attachment emotion resulted from these nine factors, suggesting that the model had a moderate fit.
- (3)
- The Durbin–Watson (D–W) value = 2.006; since this value is close to 2, it implies that there is no autocorrelation present. As a result, the data used in the model are independent.
- (1)
- Among the independent variables, the color brightness of green plants (p = 0.000 < 0.01, B = 1.021), the color vividness of mountains (p = 0.000 < 0.01, B = 0.799), the color vividness of water (p = 0.000 < 0.01, B = 0.617), the color vividness of landmarks (p = 0.000 < 0.01, B = 0.573), the color brightness of skyscraper buildings (p = 0.000 < 0.01, B = 0.515), the color brightness of high-rise buildings (p = 0.001 < 0.05, B = 0.316), the proportional coordination of mountains (p = 0.001 < 0.01, B = 0.223), and the morphological richness of green plants (p = 0.007 < 0.01, B = 0.094) were prominent. There was a significant positive correlation between the evaluation factors of these nine visual elements and identity psychology.
- (2)
- The correlation coefficient of the decorative delicacy evaluation is less than 0, but the p-value is more than 0.05, and the correlation coefficient is less than 0.3; therefore, although there is a negative correlation between decorative delicacy and the identity of place of each visual element, the influence is small. Overall, the multiple linear regression results are consistent with the correlation analysis, and Hypothesis 3 is verified.
5. Discussion
5.1. Visual Aesthetic Evaluation and Psychological Verification of Place Identity
5.2. Limitations and Future Work
6. Conclusions
Supplementary Materials
Author Contributions
Funding
Institutional Review Board Statement
Informed Consent Statement
Data Availability Statement
Conflicts of Interest
References
- UNESCO World Heritage Convention. 44 COM 7B.141—Decision. Available online: https://whc.unesco.org/en/decisions/7856/ (accessed on 21 January 2025).
- Macaomagazine. City of the Future. 6 April 2022. Available online: https://macaomagazine.net/city-of-the-future/ (accessed on 26 May 2024).
- Liu, M.; Nijhuis, S. Mapping landscape spaces: Methods for understanding spatial-visual characteristics in landscape design. Environ. Impact Assess. Rev. 2020, 82, 106376. [Google Scholar] [CrossRef]
- Hadavi, S. Direct and Indirect Effects of the Physical Aspects of the Environment on Mental Well-Being. Environ. Behav. 2017, 49, 1071–1104. [Google Scholar] [CrossRef]
- Liu, Q.; Zhu, Z.; Zeng, X.; Zhuo, Z.; Ye, B.; Fang, L.; Huang, Q.; Lai, P. The impact of landscape complexity on preference ratings and eye fixation of various urban green space settings. Urban For. Urban Green. 2021, 66, 127411. [Google Scholar] [CrossRef]
- Gholami, Y.; Taghvaei, S.H.; Norouzian-Maleki, S.; Mansouri Sepehr, R. Identifying the stimulus of visual perception based on Eye-tracking in Urban Parks: Case Study of Mellat Park in Tehran. J. For. Res. 2021, 26, 91–100. [Google Scholar] [CrossRef]
- Fu, H.; Wang, P.; Zhou, J.; Zhang, S.; Li, Y. Investigating Influence of Visual Elements of Arcade Buildings and Streetscapes on Place Identity Using Eye-Tracking and Semantic Differential Methods. Buildings 2023, 13, 1580. [Google Scholar] [CrossRef]
- Scott, N.; Zhang, R.; Le, D.; Moyle, B. A review of eye-tracking research in tourism. Curr. Issues Tour. 2017, 22, 1244–1261. [Google Scholar] [CrossRef]
- Amati, M.; Ghanbari Parmehr, E.; McCarthy, C.; Sita, J. How eye-catching are natural features when walking through a park? Eye-tracking responses to videos of walks. Urban For. Urban Green. 2018, 31, 67–78. [Google Scholar] [CrossRef]
- Li, J.; Zhang, Z.; Jing, F.; Gao, J.; Ma, J.; Shao, G.; Noel, S. An evaluation of urban green space in Shanghai, China, using eye tracking. Urban For. Urban Green. 2020, 56, 126903. [Google Scholar] [CrossRef]
- Zhou, S.; Gao, Y.; Zhang, Z.; Zhang, W.; Meng, H.; Zhang, T. Visual Behaviour and Cognitive Preferences of Users for Constituent Elements in Forest Landscape Spaces. Forests 2022, 13, 47. [Google Scholar] [CrossRef]
- Guo, S.; Sun, W.; Chen, W.; Zhang, J.; Liu, P. Impact of Artificial Elements on Mountain Landscape Perception: An Eye-Tracking Study. Land 2021, 10, 1102. [Google Scholar] [CrossRef]
- Zhang, L.-M.; Zhang, R.-X.; Jeng, T.-S.; Zeng, Z.-Y. Cityscape Protection Using VR and Eye Tracking Technology. J. Vis. Commun. Image Represent. 2019, 64, 102639. [Google Scholar] [CrossRef]
- Simpson, J.; Freeth, M.; Simpson, K.J.; Thwaites, K. Visual Engagement with Urban Street Edges: Insights Using Mobile Eye-Tracking. J. Urban. Int. Res. Placemaking Urban Sustain. 2019, 12, 259–278. [Google Scholar] [CrossRef]
- Justulin Zacarias, E.F.; Gasparetto Higuchi, M.I. Overview of studies on place identity. Novos Cad. Naea 2021, 24, 57–72. [Google Scholar]
- Brian, F. Blake Topophilia: A Study of Environmental Perception, Attitudes and Values. By Yi-Fu Tuan. J. Leis. Res. 1974, 6, 323–325. [Google Scholar] [CrossRef]
- Kyle, G.T.; Jun, J.; Absher, J.D. Repositioning Identity in Conceptualizations of Human–Place Bonding. Environ. Behav. 2014, 46, 1018–1043. [Google Scholar] [CrossRef]
- Tenzer, M.; Schofield, J. People and places: Towards an understanding and categorisation of reasons for place attachment—Case studies from the north of England. Landsc. Res. 2023, 49, 340–358. [Google Scholar] [CrossRef]
- Lin, Z.; Chen, Y.; Filieri, R. Resident-tourist value co-creation: The role of residents’ perceived tourism impacts and life satisfaction. Tour. Manag. 2017, 61, 436–442. [Google Scholar] [CrossRef]
- Zhao, X.; Lu, Y.; Lin, G. An integrated deep learning approach for assessing the visual qualities of built environments utilizing street view images. Eng. Appl. Artif. Intell. 2024, 130, 107805. [Google Scholar] [CrossRef]
- Jiang, B.; Xu, W.; Ji, W.; Kim, G.; Pryor, M.; Sullivan, W.C. Impacts of nature and built acoustic-visual environments on human’s multidimensional mood states: A cross-continent experiment. J. Environ. Psychol. 2021, 77, 101659. [Google Scholar] [CrossRef]
- Government of Macao Special Administrative Region Statistics and Census Service. Statistics—Statistics and Census Service. Available online: https://www.dsec.gov.mo/en-US/Statistic?id=101 (accessed on 17 February 2024).
- Zhang, H.; Lai, P.Y.; Jim, C.Y. Species diversity and spatial pattern of old and precious trees in Macau. Landsc. Urban Plan. 2017, 162, 56–67. [Google Scholar] [CrossRef]
- Zheng, J. The Cultural Construction and Conservation Dilemma of Architectural Cultural Heritage in the Later World Heritage Era of Macao World Architecture; The Cultural Affairs Bureau of the Macao Special Administrative Region Government: Macao, China, 2019; Volume 11, pp. 44–49. Available online: https://www.culturalheritage.mo/Survey/sgchm2017/cn/?AspxAutoDetectCookieSupport=1 (accessed on 13 December 2024).
- Announcement of the Ministry of Housing and Urban-Rural Development on the Issuance of the National Standard “Unified Standard for Civil Building Design”. Available online: https://www.mohurd.gov.cn/gongkai/zc/wjk/art/2024/art_17339_240715.html (accessed on 9 January 2024).
- Gao, Y.; Sun, X.M.; Zhang, T.; Zhan, H. Analysis on the characteristics of eye movement and the evaluation of psychological perception for forest waterscape space. IOP Conf. Ser. Earth Environ. Sci. 2021, 626, 012007. [Google Scholar] [CrossRef]
- Van Loo, E.J.; Caputo, V.; Nayga, R.M.; Seo, H.-S.; Zhang, B.; Verbeke, W. Sustainability labels on coffee: Consumer preferences, willingness-to-pay and visual attention to attributes. Ecol. Econ. 2015, 118, 215–225. [Google Scholar] [CrossRef]
- Li, N.; Zhang, S.; Xia, L.; Wu, Y. Investigating the Visual Behavior Characteristics of Architectural Heritage Using Eye-Tracking. Buildings 2022, 12, 1058. [Google Scholar] [CrossRef]
- Boley, B.B.; Strzelecka, M.; Yeager, E.P.; Ribeiro, M.A.; Aleshinloye, K.D.; Woosnam, K.M.; Mimbs, B.P. Measuring place attachment with the Abbreviated Place Attachment Scale (APAS). J. Environ. Psychol. 2021, 74, 101577. [Google Scholar] [CrossRef]
- Li, Z.; Sun, X.; Zhao, S.; Zuo, H. Integrating eye-movement analysis and the semantic differential method to analyze the visual effect of a traditional commercial block in Hefei, China. Front. Archit. Res. 2021, 10, 317–331. [Google Scholar] [CrossRef]
- Landon, A.C.; Woosnam, K.M.; Kyle, G.T.; Keith, S.J. Psychological Needs Satisfaction and Attachment to Natural Landscapes. Environ. Behav. 2021, 53, 661–683. [Google Scholar] [CrossRef]
- Huang, J.; Liang, J.; Yang, M.; Li, Y. Visual Preference Analysis and Planning Responses Based on Street View Images: A Case Study of Gulangyu Island, China. Land 2022, 12, 129. [Google Scholar] [CrossRef]
- Deng, L.; Li, X.; Luo, H.; Fu, E.-K.; Ma, J.; Sun, L.-X.; Huang, Z.; Cai, S.-Z.; Jia, Y. Empirical study of landscape types, landscape elements and landscape components of the urban park promoting physiological and psychological restoration. Urban For. Urban Green. 2020, 48, 126488. [Google Scholar] [CrossRef]
- Wang, P.; Song, W.; Zhou, J.; Tan, Y.; Wang, H. AI-Based Environmental Color System in Achieving Sustainable Urban Development. Systems 2023, 11, 135. [Google Scholar] [CrossRef]
- Liu, W.; Hu, Z.; Fei, Y.; Chen, J.; Yu, C. Eye Tracking and Semantic Evaluation for Ceramic Teapot Product Modeling. Appl. Sci. 2025, 15, 46. [Google Scholar] [CrossRef]
- Wang, P.; Yang, W.; Wang, D.; He, Y. Insights into Public Visual Behaviors through Eye-Tracking Tests: A Study Based on National Park System Pilot Area Landscapes. Land 2021, 10, 497. [Google Scholar] [CrossRef]


| Theme and Quantity | No. | Sight Direction | Viewing Objects | The Main Visual Elements of the Environment |
|---|---|---|---|---|
| A. Landscapes of architectural heritage and sites in historic districts | A-01 | From the Fortress to the Ruins of St. Paul’s | Architectural heritages | Landmarks, low-rise buildings, high-rise buildings, skyscraper buildings, green plants, water, mountains, roads, etc. |
| A-02 | From the Fortress to White Pigeon Nest Park | Urban greenings | Landmarks, low-rise buildings, high-rise buildings, skyscraper buildings, green plants, water, mountains, etc. | |
| A-03 | From Guia Fort and Lighthouse to Tap Seac Square | Architectural heritages | Landmarks, low-rise buildings, high-rise buildings, skyscraper buildings, green plants, water, mountains, roads, etc. | |
| B. Landscapes of the inner harbor, outer harbor, and water systems | B-01 | From Bishop’s Hill Observation Deck to the Inner Harbor Waterway | The inner harbor | Landmarks, low-rise buildings, high-rise buildings, skyscraper buildings, green plants, water, mountains, etc. |
| B-02 | From Bishop’s Hill Church to Sai Van Lake | Sai Van Lake | Landmarks, low-rise buildings, high-rise buildings, skyscraper buildings, green plants, water, mountains, roads, bridges, etc. | |
| B-03 | From Guia Fort and Lighthouse to the Outer Harbor | The outer harbor | Landmarks, high-rise buildings, skyscraper buildings, green plants, water, mountains, roads, bridges, etc. | |
| C. Landscapes of the historic district style and urban skyline | C-01 | From Guiyang Mountain to Nam Van Lake | The city district and skyline | Landmarks, low-rise buildings, high-rise buildings, skyscraper buildings, green plants, water, mountains, roads, etc. |
| C-02 | From Fortress to Inner Harbor City | The cityscape of the port area | Landmarks, low-rise buildings, high-rise buildings, skyscraper buildings, green plants, water, etc. | |
| C-03 | From Fortress to Guia Fortress | The landscapes between urban highlands | Landmarks, low-rise buildings, high-rise buildings, skyscraper buildings, green plants, etc. | |
| D. Landscapes of high-point landmark heritage in the historic district | D-01 | From the Nam Van Lake to the direction of the Church of Our Lady of Penha | The Church of Our Lady of Penha | Landmarks, low-rise buildings, high-rise buildings, skyscraper buildings, green plants, mountains, water, etc. |
| D-02 | From the Sai Van Lake to the direction of the Church of Our Lady of Penha | The Church of Our Lady of Penha | Landmark buildings, low-rise buildings, high-rise buildings, skyscraper buildings, green plants, mountains, water, etc. | |
| D-03 | From Lotus Square to the direction of the Guia Lighthouse | Guia Fort and Lighthouse | Landmark buildings, low-rise buildings, high-rise buildings, roads, green plants, mountains, etc. |
| Metrics | Indicator | Abbreviation | Basic Significance |
|---|---|---|---|
| Fixation metrics | Total fixation duration/(s) | TFD | The longer the TFD, the more attention participants paid to the area and the more difficulty they had in processing relevant information. |
| Fixation count/(no. of visits) | FC | Fixation count is the total number of gaze points produced by the subject’s eyes during a specific experimental task or observation. This can reflect the degree of attention to different areas or stimuli and the subject’s processing of information. | |
| Time to first fixation (s) | TFF | It takes time for the eyes to move to an AOI. If the TFF was short, it was easier to notice an element. TFF was used to measure visual saliency. | |
| First fixation duration/(s) | FFD | FFD for the AOI. As the FFD lengthens, respondents either have greater difficulty in recognizing the AOI or perceive it as more appealing. | |
| Average fixation duration (s) | AFD | Mean gaze duration is the average of the subjects’ gaze duration for each gaze point in the eye movement experiment. | |
| Visit count/(no. of visits) | VC | The visit count of an AOI represents the number of times a respondent views that region. A higher count generally implies the AOI’s greater attractiveness to the respondent. |
| Evaluation Index | Specific Dimensions | Online Questionnaire Items |
|---|---|---|
| Visual aesthetics evaluation | Proportional harmonization | What do you think is the proportion and coordination of visual elements (the larger the number, the more coordinated)? |
| Morphological richness | What do you think is the morphological richness of visual elements (the larger the number, the richer)? | |
| Neatness and beauty | What do you think of the neatness and beauty of visual elements (the larger the number, the more beautiful)? | |
| Vividness of color | What do you think the color of the visual element is (the larger the number, the more vivid)? | |
| Variation difference | What do you think is the difference in changes in visual elements (the larger the number, the greater the difference)? | |
| Quantitative intensity | What do you think is the numerical density of visual elements (the larger the number, the denser)? | |
| Significance of features | What do you think is the prominent style of the visual elements (the larger the number, the more salient)? | |
| Decorative sophistication | What do you think of the decorative sophistication of visual elements (the larger the number, the more refined)? | |
| Place identity evaluation | Trigger memories | I have a lot of fond memories of this place |
| Sense of belonging | I feel this place is a part of me | |
| Familiarity | I feel very familiar with this place | |
| Intimacy | I feel intimate with this place | |
| Environmental preferences | This place is very special to me | |
| Cultural identity | I have a strong cultural identity with this place | |
| Identity responsibility | Living here says a lot about who I am |
| NO. | A-01 | A-02 | A-03 | |||||||||
| Resident eye-tracking experiment heat map |  |  | 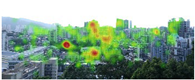 | |||||||||
| Tourist eye-tracking experiment heat map |  | 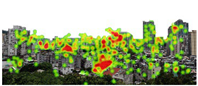 | 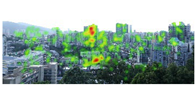 | |||||||||
| Hot spots corresponding to visual features | landmarks | ● | mountains | ● | landmarks | ● | mountains | ● | landmarks | ● | mountains | ◎ |
| low-rise buildings | ● | water | × | low-rise buildings | ● | water | × | low-rise buildings | ◎ | water | ○ | |
| high-rise buildings | ● | green plants | ○ | high-rise buildings | ● | green plants | ◎ | high-rise buildings | ◎ | green plants | ◎ | |
| skyscraper buildings | ● | roads | ○ | skyscraper buildings | ● | roads | × | skyscraper buildings | ● | roads | ◎ | |
| NO. | B-01 | B-02 | B-03 | |||||||||
| Resident eye-tracking experiment heat map | 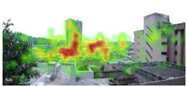 | 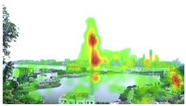 | 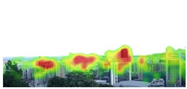 | |||||||||
| Tourist eye-tracking experiment heat map | 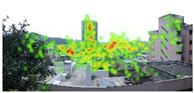 | 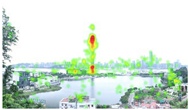 | 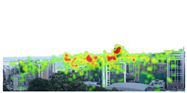 | |||||||||
| Hot spots corresponding to visual features | landmarks | × | mountains | ◎ | landmarks | ● | mountains | ○ | landmarks | ● | mountains | ○ |
| low-rise buildings | ◎ | water | ◎ | low-rise buildings | ● | water | ◎ | low-rise buildings | ○ | water | ● | |
| high-rise buildings | ● | green plants | ◎ | high-rise buildings | ◎ | green plants | ◎ | high-rise buildings | ● | green plants | ◎ | |
| skyscraper buildings | ● | roads | × | skyscraper buildings | ● | roads | ○ | skyscraper buildings | ● | roads | ● | |
| NO. | C-01 | C-02 | C-03 | |||||||||
| Resident eye-tracking experiment heat map | 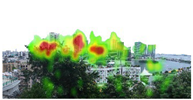 |  |  | |||||||||
| Tourist eye-tracking experiment heat map | 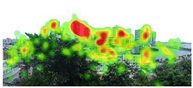 | 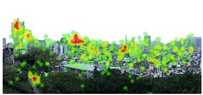 | 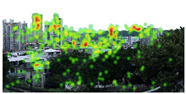 | |||||||||
| Hot spots corresponding to visual features | landmarks | ● | mountains | ○ | landmarks | ● | mountains | ○ | landmarks | ● | mountains | ○ |
| low-rise buildings | ◎ | water | ◎ | low-rise buildings | ● | water | ○ | low-rise buildings | ● | water | × | |
| high-rise buildings | ● | green plants | ◎ | high-rise buildings | ◎ | green plants | ○ | high-rise buildings | ◎ | green plants | ◎ | |
| skyscraper buildings | ● | roads | ○ | skyscraper buildings | ● | roads | ○ | skyscraper buildings | ● | roads | ○ | |
| NO. | D-01 | D-02 | D-03 | |||||||||
| Resident eye-tracking experiment heat map | 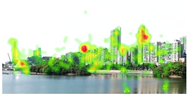 | 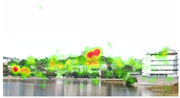 | 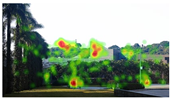 | |||||||||
| Tourist eye-tracking experiment heat map | 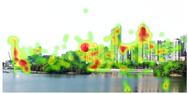 | 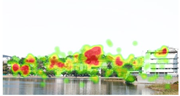 | 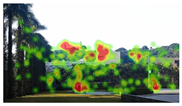 | |||||||||
| Hot spots corresponding to visual features | landmarks | ● | mountains | ● | landmarks | ● | mountains | ● | landmarks | ● | mountains | ● |
| low-rise buildings | ● | water | ● | low-rise buildings | ● | water | ◎ | low-rise buildings | × | water | × | |
| high-rise buildings | ● | green plants | ◎ | high-rise buildings | ◎ | green plants | ● | high-rise buildings | ● | green plants | ● | |
| skyscraper buildings | ● | roads | × | skyscraper buildings | × | roads | × | skyscraper buildings | × | roads | ○ | |
| Landscape Visual Elements | Evaluation Factor | Trigger Memories | Sense of Belonging | Familiarity | Environmental Preferences | Cultural Atmosphere | Intimacy | Place Identity |
|---|---|---|---|---|---|---|---|---|
| landmarks | cleanliness | 0.464 | 0.622 * | 0.479 | 0.556 * | 0.464 | 0. 643 ** | 0.530 * |
| vividness of color | 0.698 ** | 0.667 ** | 0.589 ** | 0.603 ** | 0.620 ** | 0.644 ** | 0.698 ** | |
| low-rise buildings | proportional harmonization | 0.532 * | 0.428 | 0.539 * | 0.401 | 0.401 | 0.583 * | 0.420 |
| cleanliness | 0.572 * | 0.646 ** | 0.745 ** | 0.510 * | 0.552 * | 0.541 * | 0.521 * | |
| vividness of color | 0.487 | 0.452 | 0.344 | 0.490 | 0.534 * | 0.509 * | 0.561 * | |
| high-rise buildings | cleanliness | 0.707 ** | 0.580 * | 0.712 ** | 0.467 | 0.509 * | 0.672 ** | 0.534 * |
| vividness of color | 0.454 | 0.681 ** | 0.372 | 0.656 ** | 0.589 * | 0.733 ** | 0.645 ** | |
| skyscraper buildings | morphological richness | 0.377 | 0.482 | 0.551 * | 0.445 | 0.390 | 0.429 | 0.396 |
| cleanliness | 0.471 | 0.500 * | 0.462 | 0.343 | 0.528 * | 0.463 | 0.493 | |
| vividness of color | 0.548 * | 0.616 ** | 0.409 | 0.638 ** | 0.577 * | 0.730 ** | 0.648 ** | |
| quantitative intensity | 0.426 | 0.460 | 0.513 * | 0.460 | 0.431 | 0.505 * | 0.514 * | |
| water | proportional harmonization | 0.584 * | 0.633 ** | 0.637 ** | 0.581 * | 0.593 * | 0.580 * | 0.587 * |
| morphological richness | 0.550 * | 0.629 ** | 0.667 ** | 0.594 * | 0.479 | 0.706 ** | 0.510 * | |
| cleanliness | 0.411 | 0.382 | 0.611 ** | 0.505 * | 0.407 | 0.554 * | 0.504 * | |
| vividness of color | 0.569 | 0.770 ** | 0.700 ** | 0.737 ** | 0.665 ** | 0.837 ** | 0.706 ** | |
| mountains | proportional harmonization | 0.660 ** | 0.678 ** | 0.742 ** | 0.580 * | 0.574 * | 0.765 ** | 0.590 * |
| cleanliness | 0.262 | 0.441 | 0.439 | 0.359 | 0.290 | 0.594 * | 0.445 | |
| vividness of color | 0.540 * | 0.670 ** | 0.366 | 0.713 ** | 0.628 ** | 0.704 ** | 0.690 ** | |
| green plants | proportional harmonization | 0.313 | 0.423 | 0.249 | 0.376 | 0.334 | 0.533 * | 0.444 |
| morphological richness | 0.650 ** | 0.655 ** | 0.726 ** | 0.565 * | 0.516 * | 0.733 ** | 0.579 * | |
| cleanliness | 0.369 | 0.449 | 0.536 * | 0.383 | 0.371 | 0.568 * | 0.394 | |
| vividness of color | 0.666 ** | 0.779 ** | 0.513 * | 0.702 ** | 0.680 ** | 0.834 ** | 0.754 ** |
| Y | X | Non-Normalized | Standard Coefficient | t | p-Value | |||
|---|---|---|---|---|---|---|---|---|
| B | Standard Error | Beta | ||||||
| Place identity | (constant) | −3.10 | 0.159 | 20.401 | 0.009 | |||
| landmarks | vividness of color | X1 | 0.573 | 0.037 | 0.425 | 15.663 | 0.000 | |
| high-rise buildings | vividness of color | X2 | 0.316 | 0.025 | 0.271 | 12.608 | 0.000 | |
| skyscraper buildings | vividness of color | X3 | 0.515 | 0.040 | 0.391 | 12.750 | 0.000 | |
| water | proportional harmonization | X4 | 0.169 | 0.028 | 0.162 | 5.991 | 0.001 | |
| vividness of color | X5 | 0.617 | 0.036 | 0.470 | 17.340 | 0.000 | ||
| mountains | proportional harmonization | X6 | 0.223 | 0.029 | 0.245 | 7.806 | 0.000 | |
| vividness of color | X7 | 0.799 | 0.024 | 0.628 | 33.048 | 0.000 | ||
| green plants | morphological richness | X8 | 0.094 | 0.024 | 0.100 | 4.010 | 0.007 | |
| vividness of color | X9 | 1.021 | 0.028 | 0.978 | 37.009 | 0.000 | ||
Disclaimer/Publisher’s Note: The statements, opinions and data contained in all publications are solely those of the individual author(s) and contributor(s) and not of MDPI and/or the editor(s). MDPI and/or the editor(s) disclaim responsibility for any injury to people or property resulting from any ideas, methods, instructions or products referred to in the content. |
© 2025 by the authors. Licensee MDPI, Basel, Switzerland. This article is an open access article distributed under the terms and conditions of the Creative Commons Attribution (CC BY) license (https://creativecommons.org/licenses/by/4.0/).
Share and Cite
Wang, P.; Fu, H. The Influence of Different Visual Elements of High-Density Urban Observation Decks on the Visual Behavior and Place Identity of Tourists and Residents. Appl. Sci. 2025, 15, 3875. https://doi.org/10.3390/app15073875
Wang P, Fu H. The Influence of Different Visual Elements of High-Density Urban Observation Decks on the Visual Behavior and Place Identity of Tourists and Residents. Applied Sciences. 2025; 15(7):3875. https://doi.org/10.3390/app15073875
Chicago/Turabian StyleWang, Pohsun, and Hao Fu. 2025. "The Influence of Different Visual Elements of High-Density Urban Observation Decks on the Visual Behavior and Place Identity of Tourists and Residents" Applied Sciences 15, no. 7: 3875. https://doi.org/10.3390/app15073875
APA StyleWang, P., & Fu, H. (2025). The Influence of Different Visual Elements of High-Density Urban Observation Decks on the Visual Behavior and Place Identity of Tourists and Residents. Applied Sciences, 15(7), 3875. https://doi.org/10.3390/app15073875