


Experimental Investigation of the Normal Coefficient of Restitution in Rockfall Collisions: Influence and Interaction of Controlling Factors


Abstract
1. Introduction
2. Materials and Methods
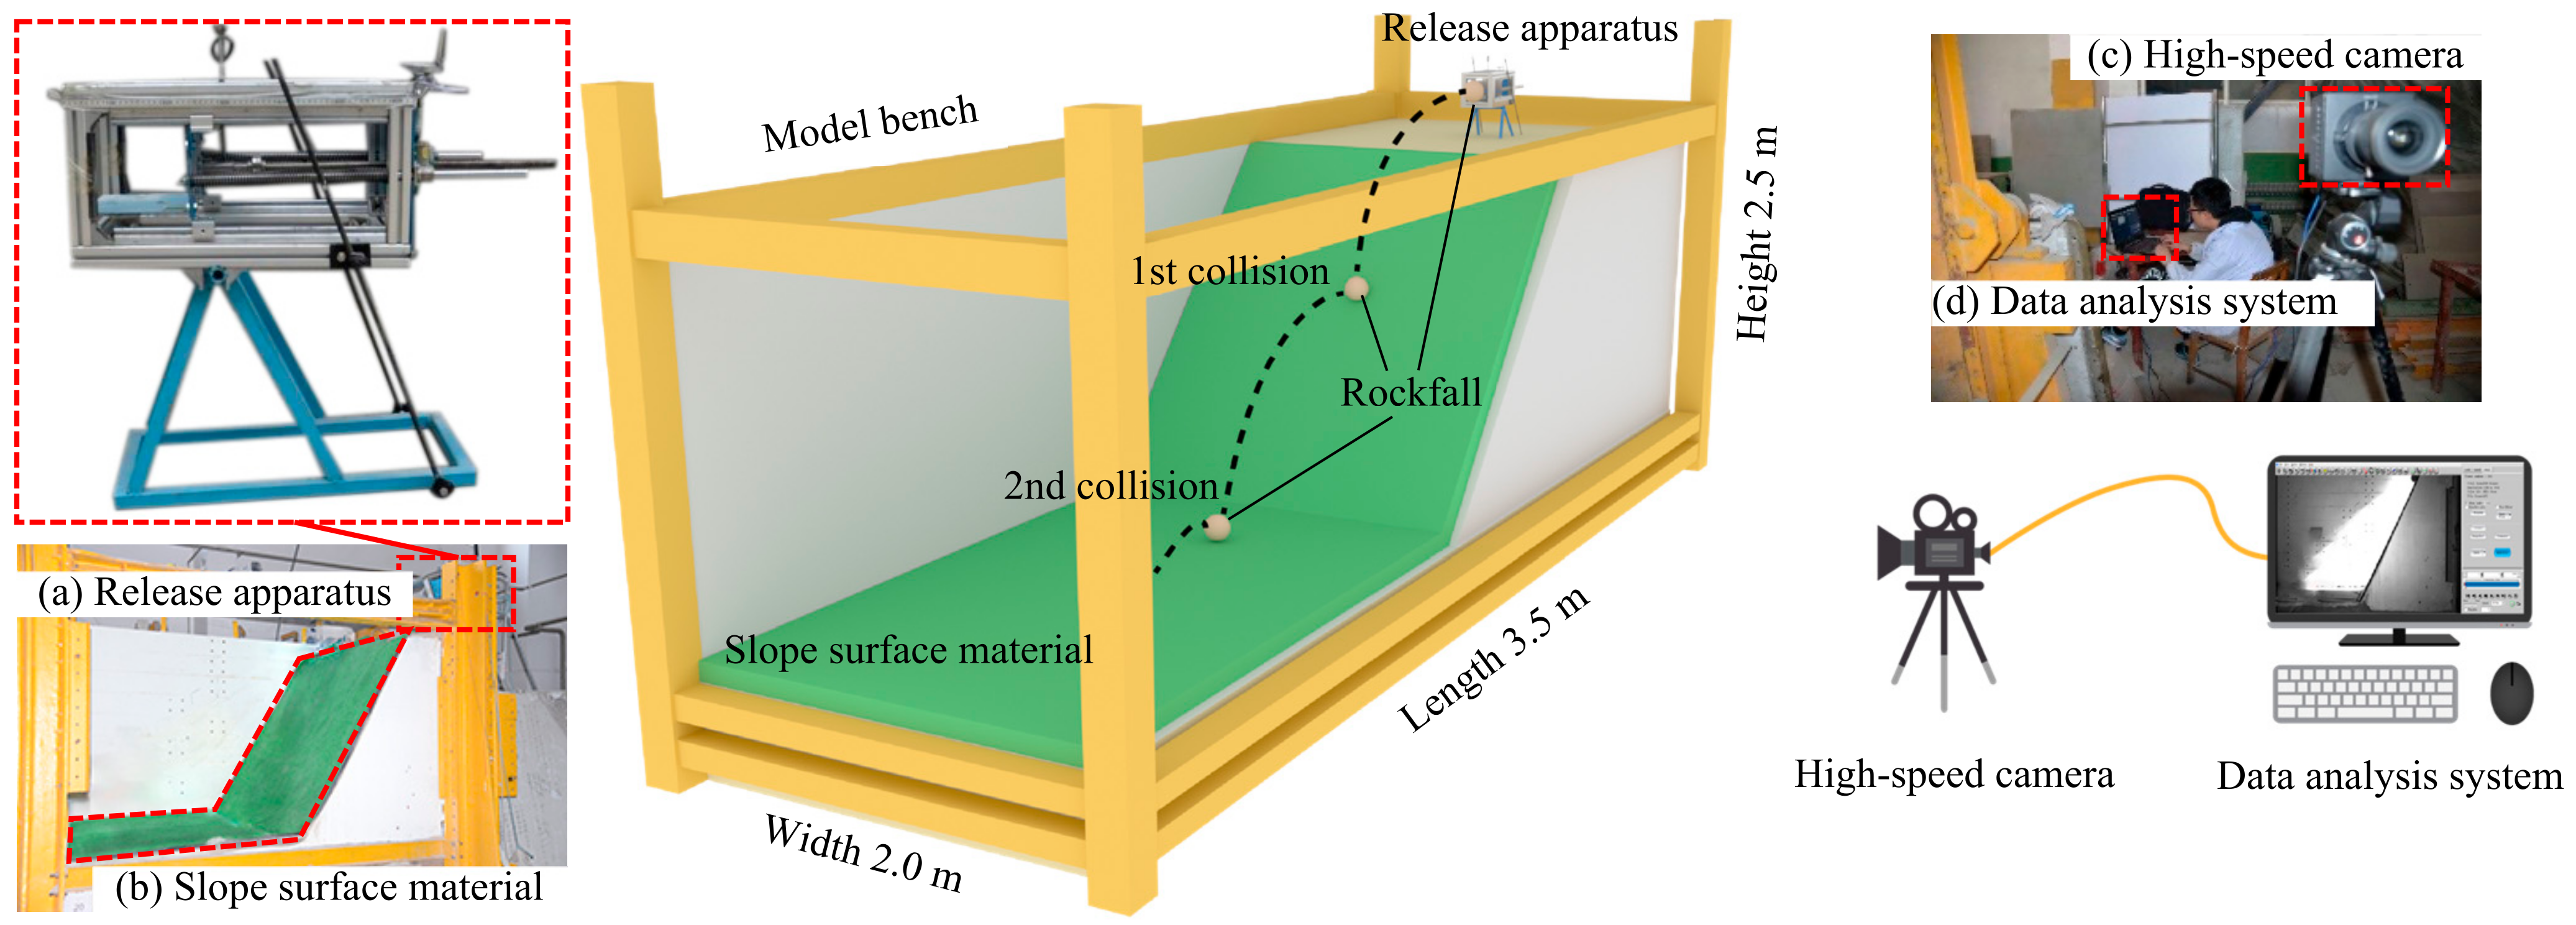
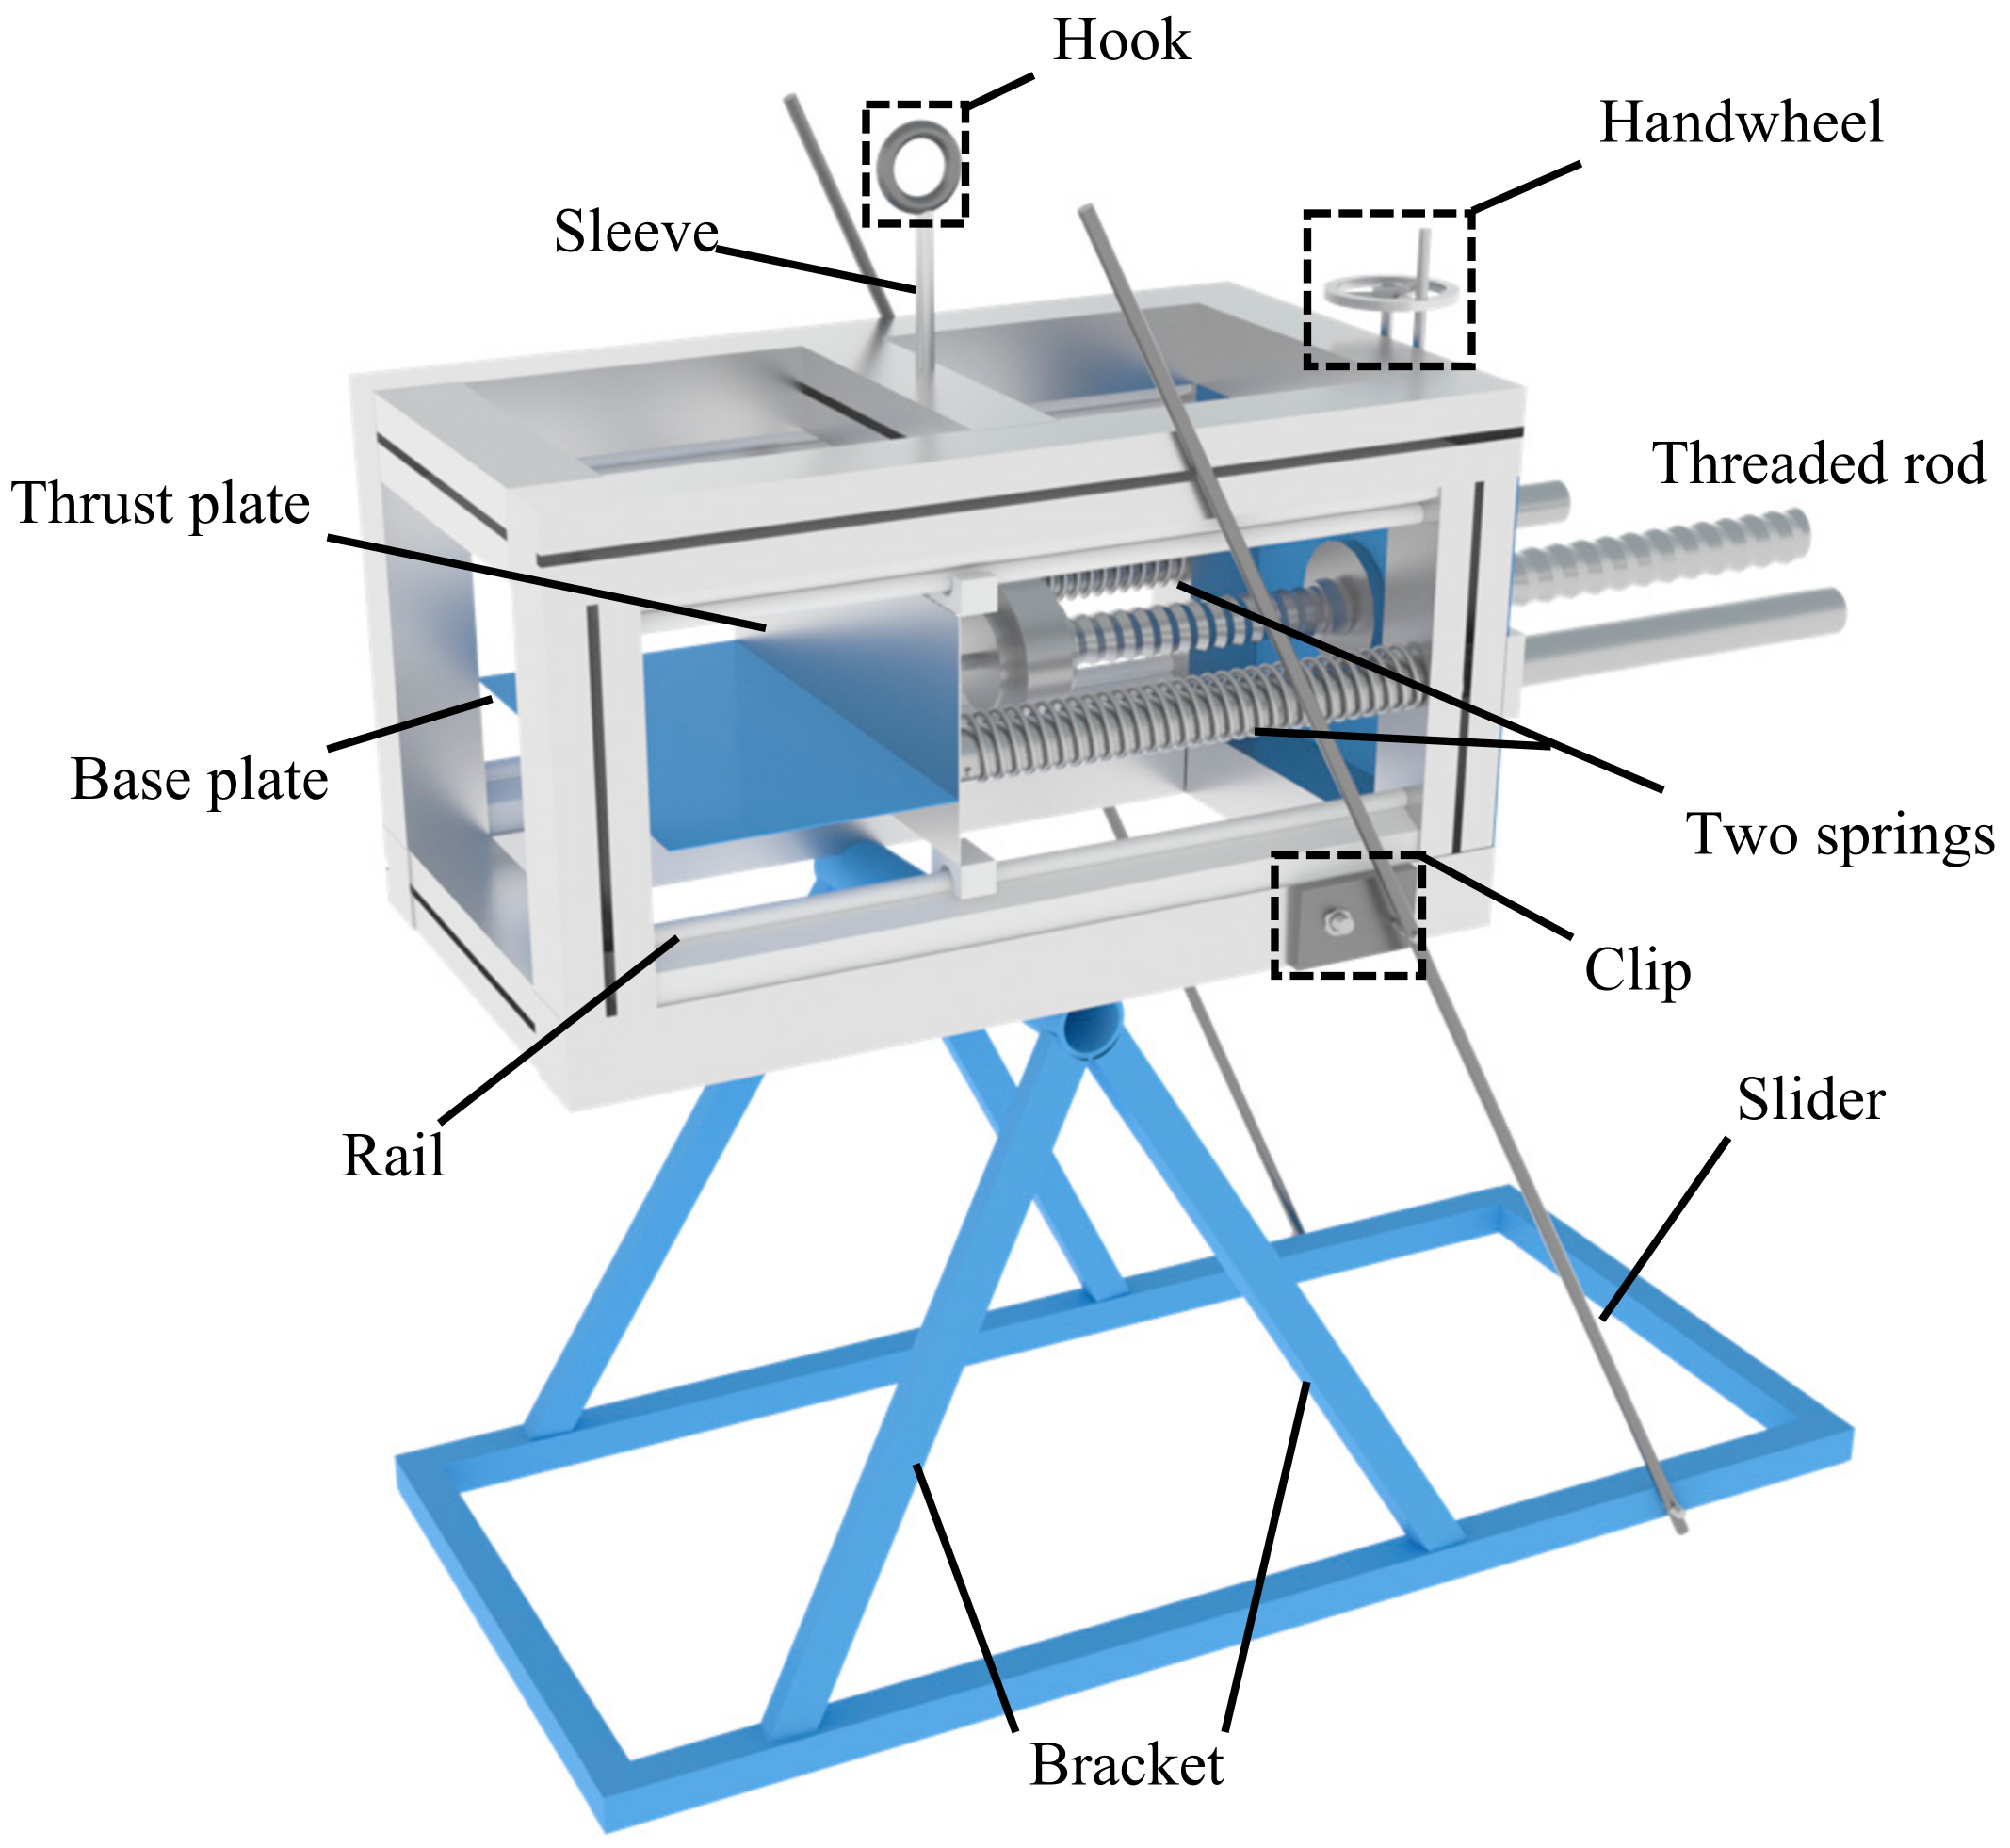
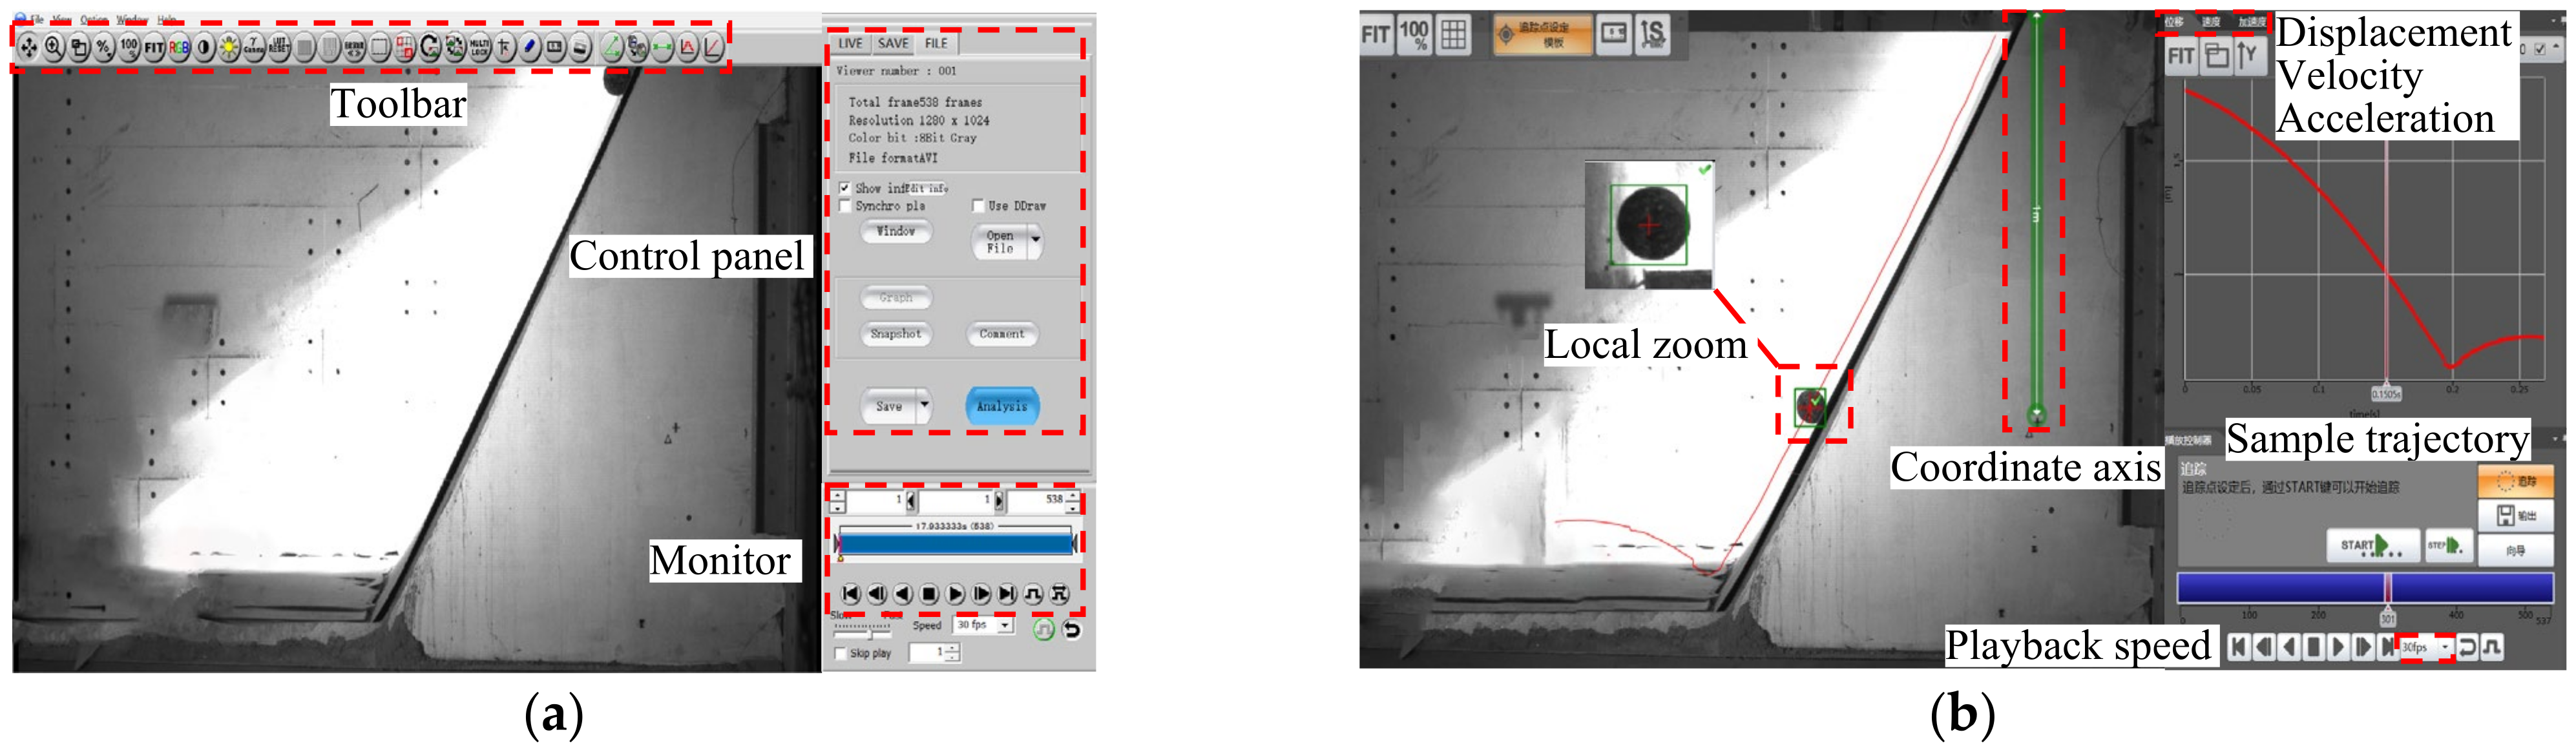
2.1. Experimental Apparatus
2.2. Selection of the Related Factors
- (1)
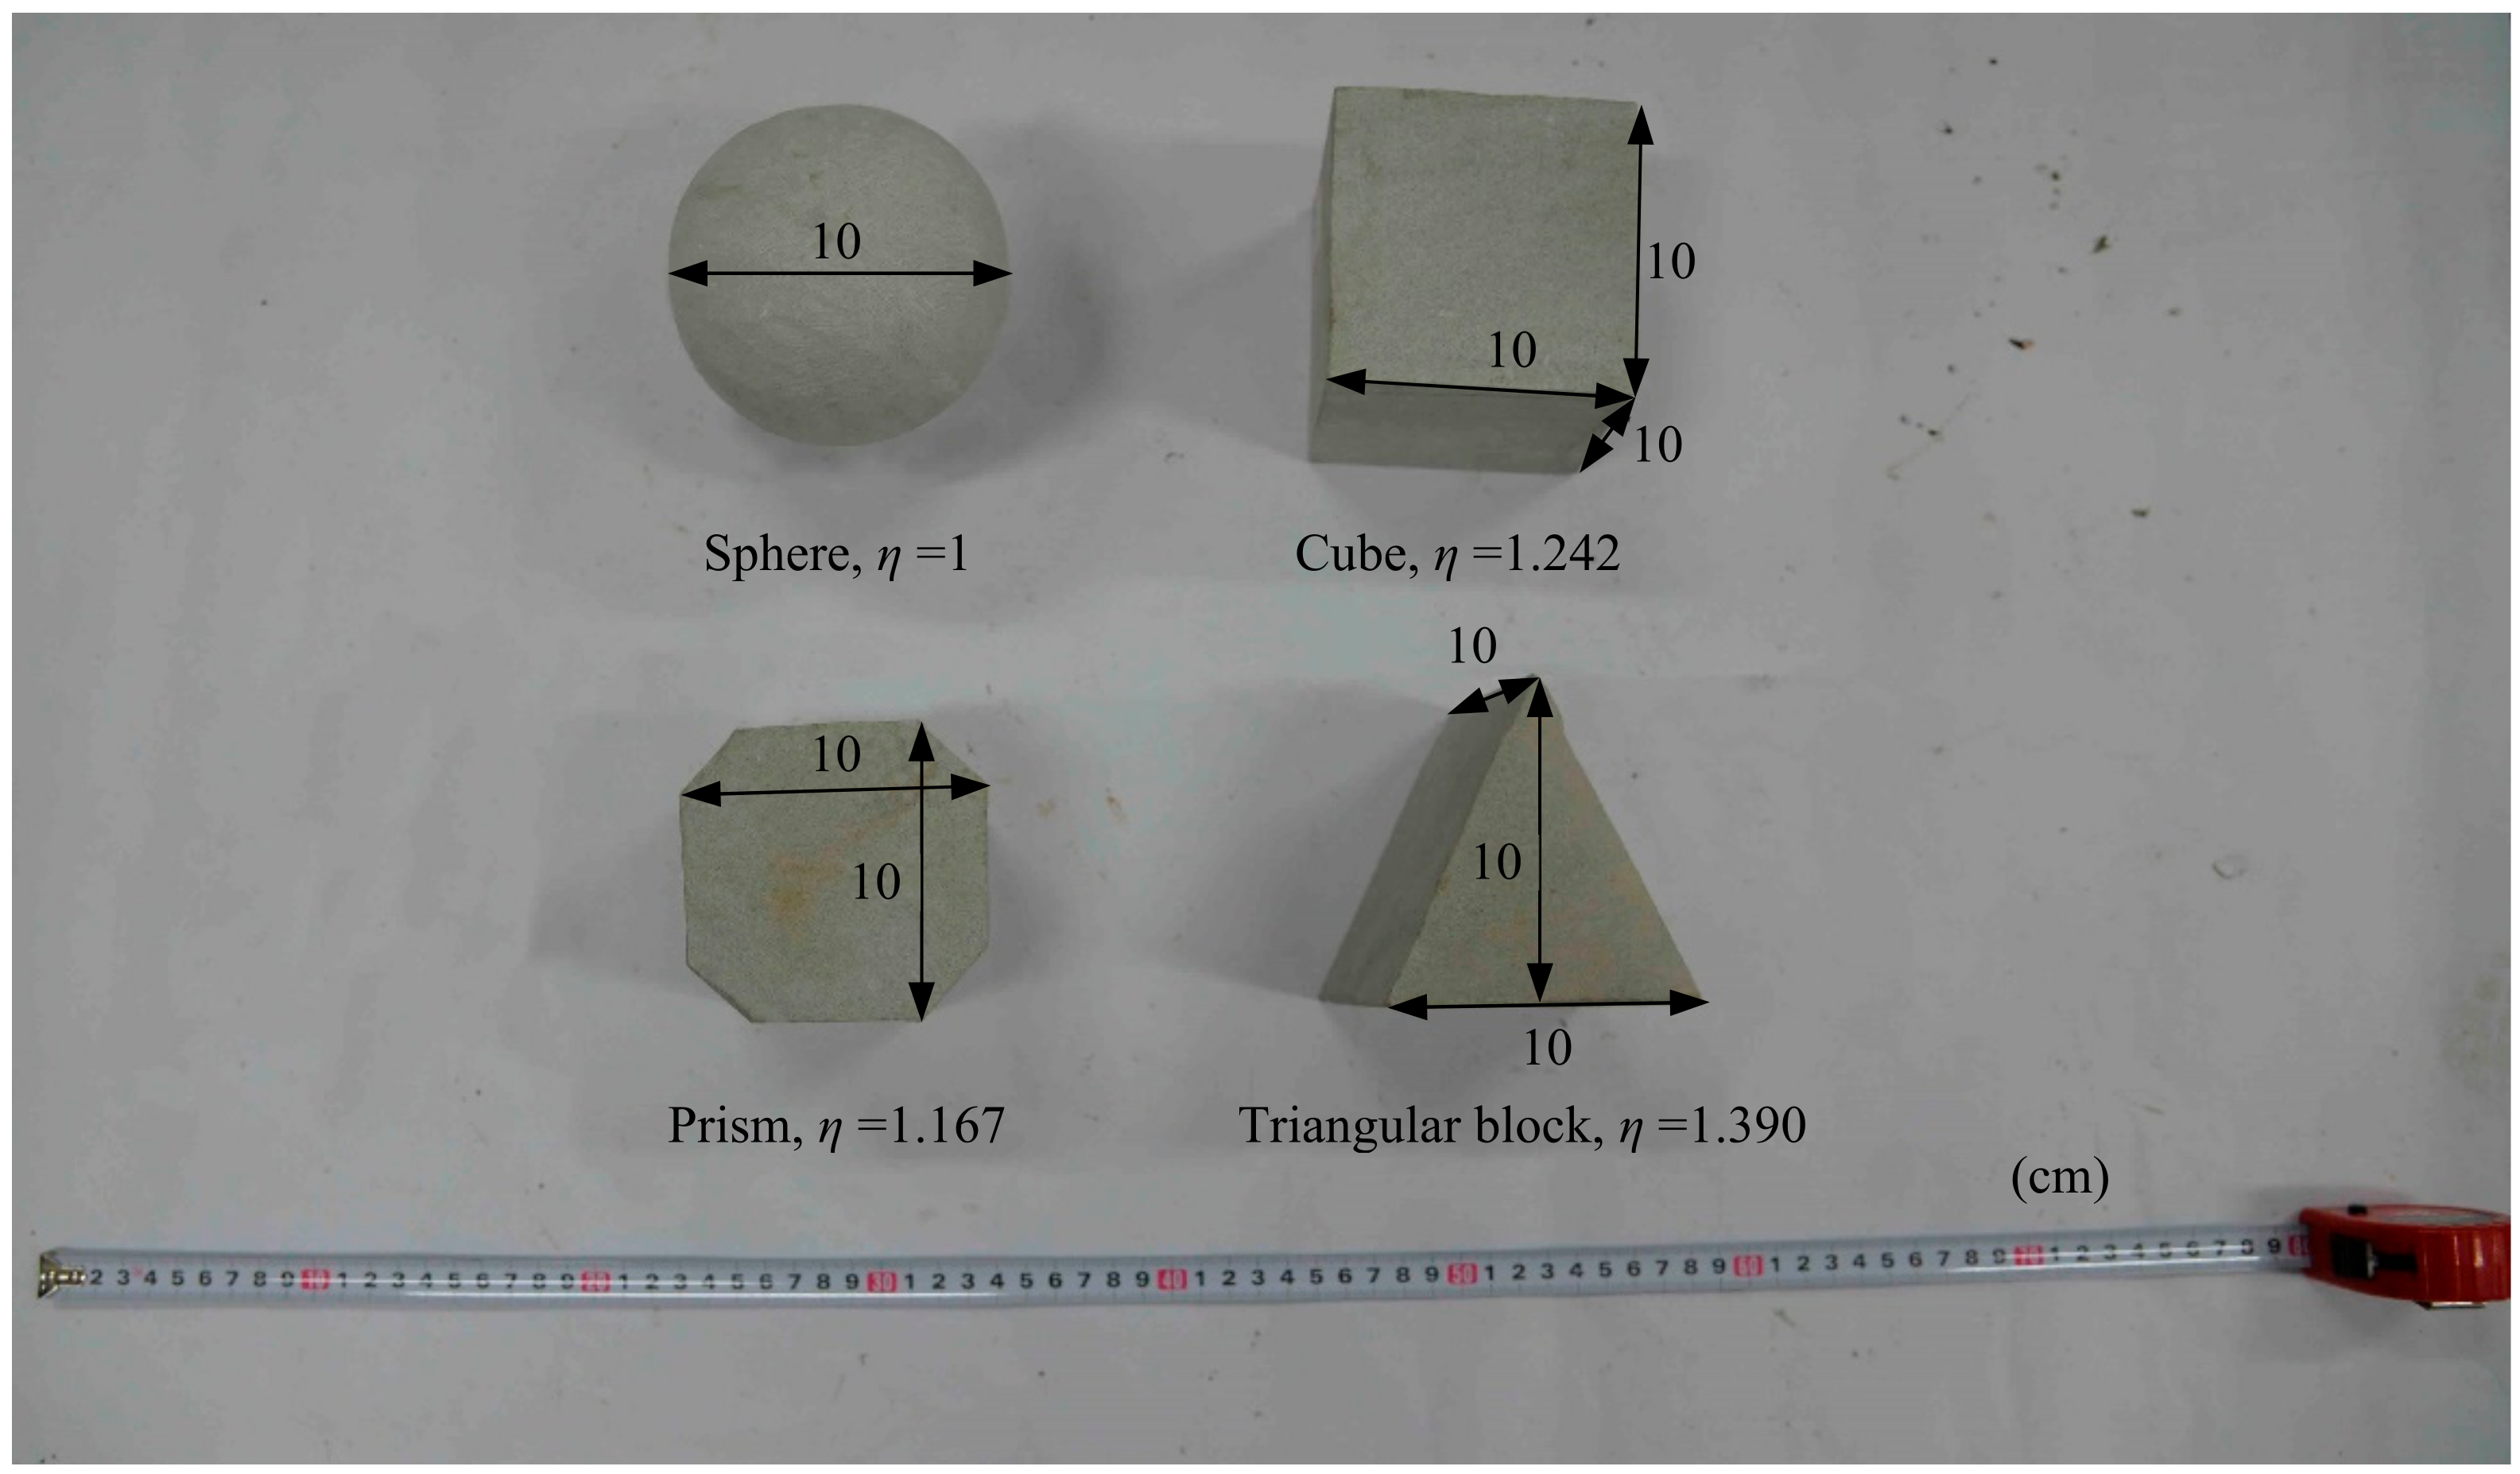
- Shape factor of falling rock
- (2)
- Slope surface material
- (3)
- Initial velocity
- (4)
- Slope angle
- (5)
- Falling rock type
- (6)
- Falling height
- (7)
- Falling rock mass
2.3. Testing Design
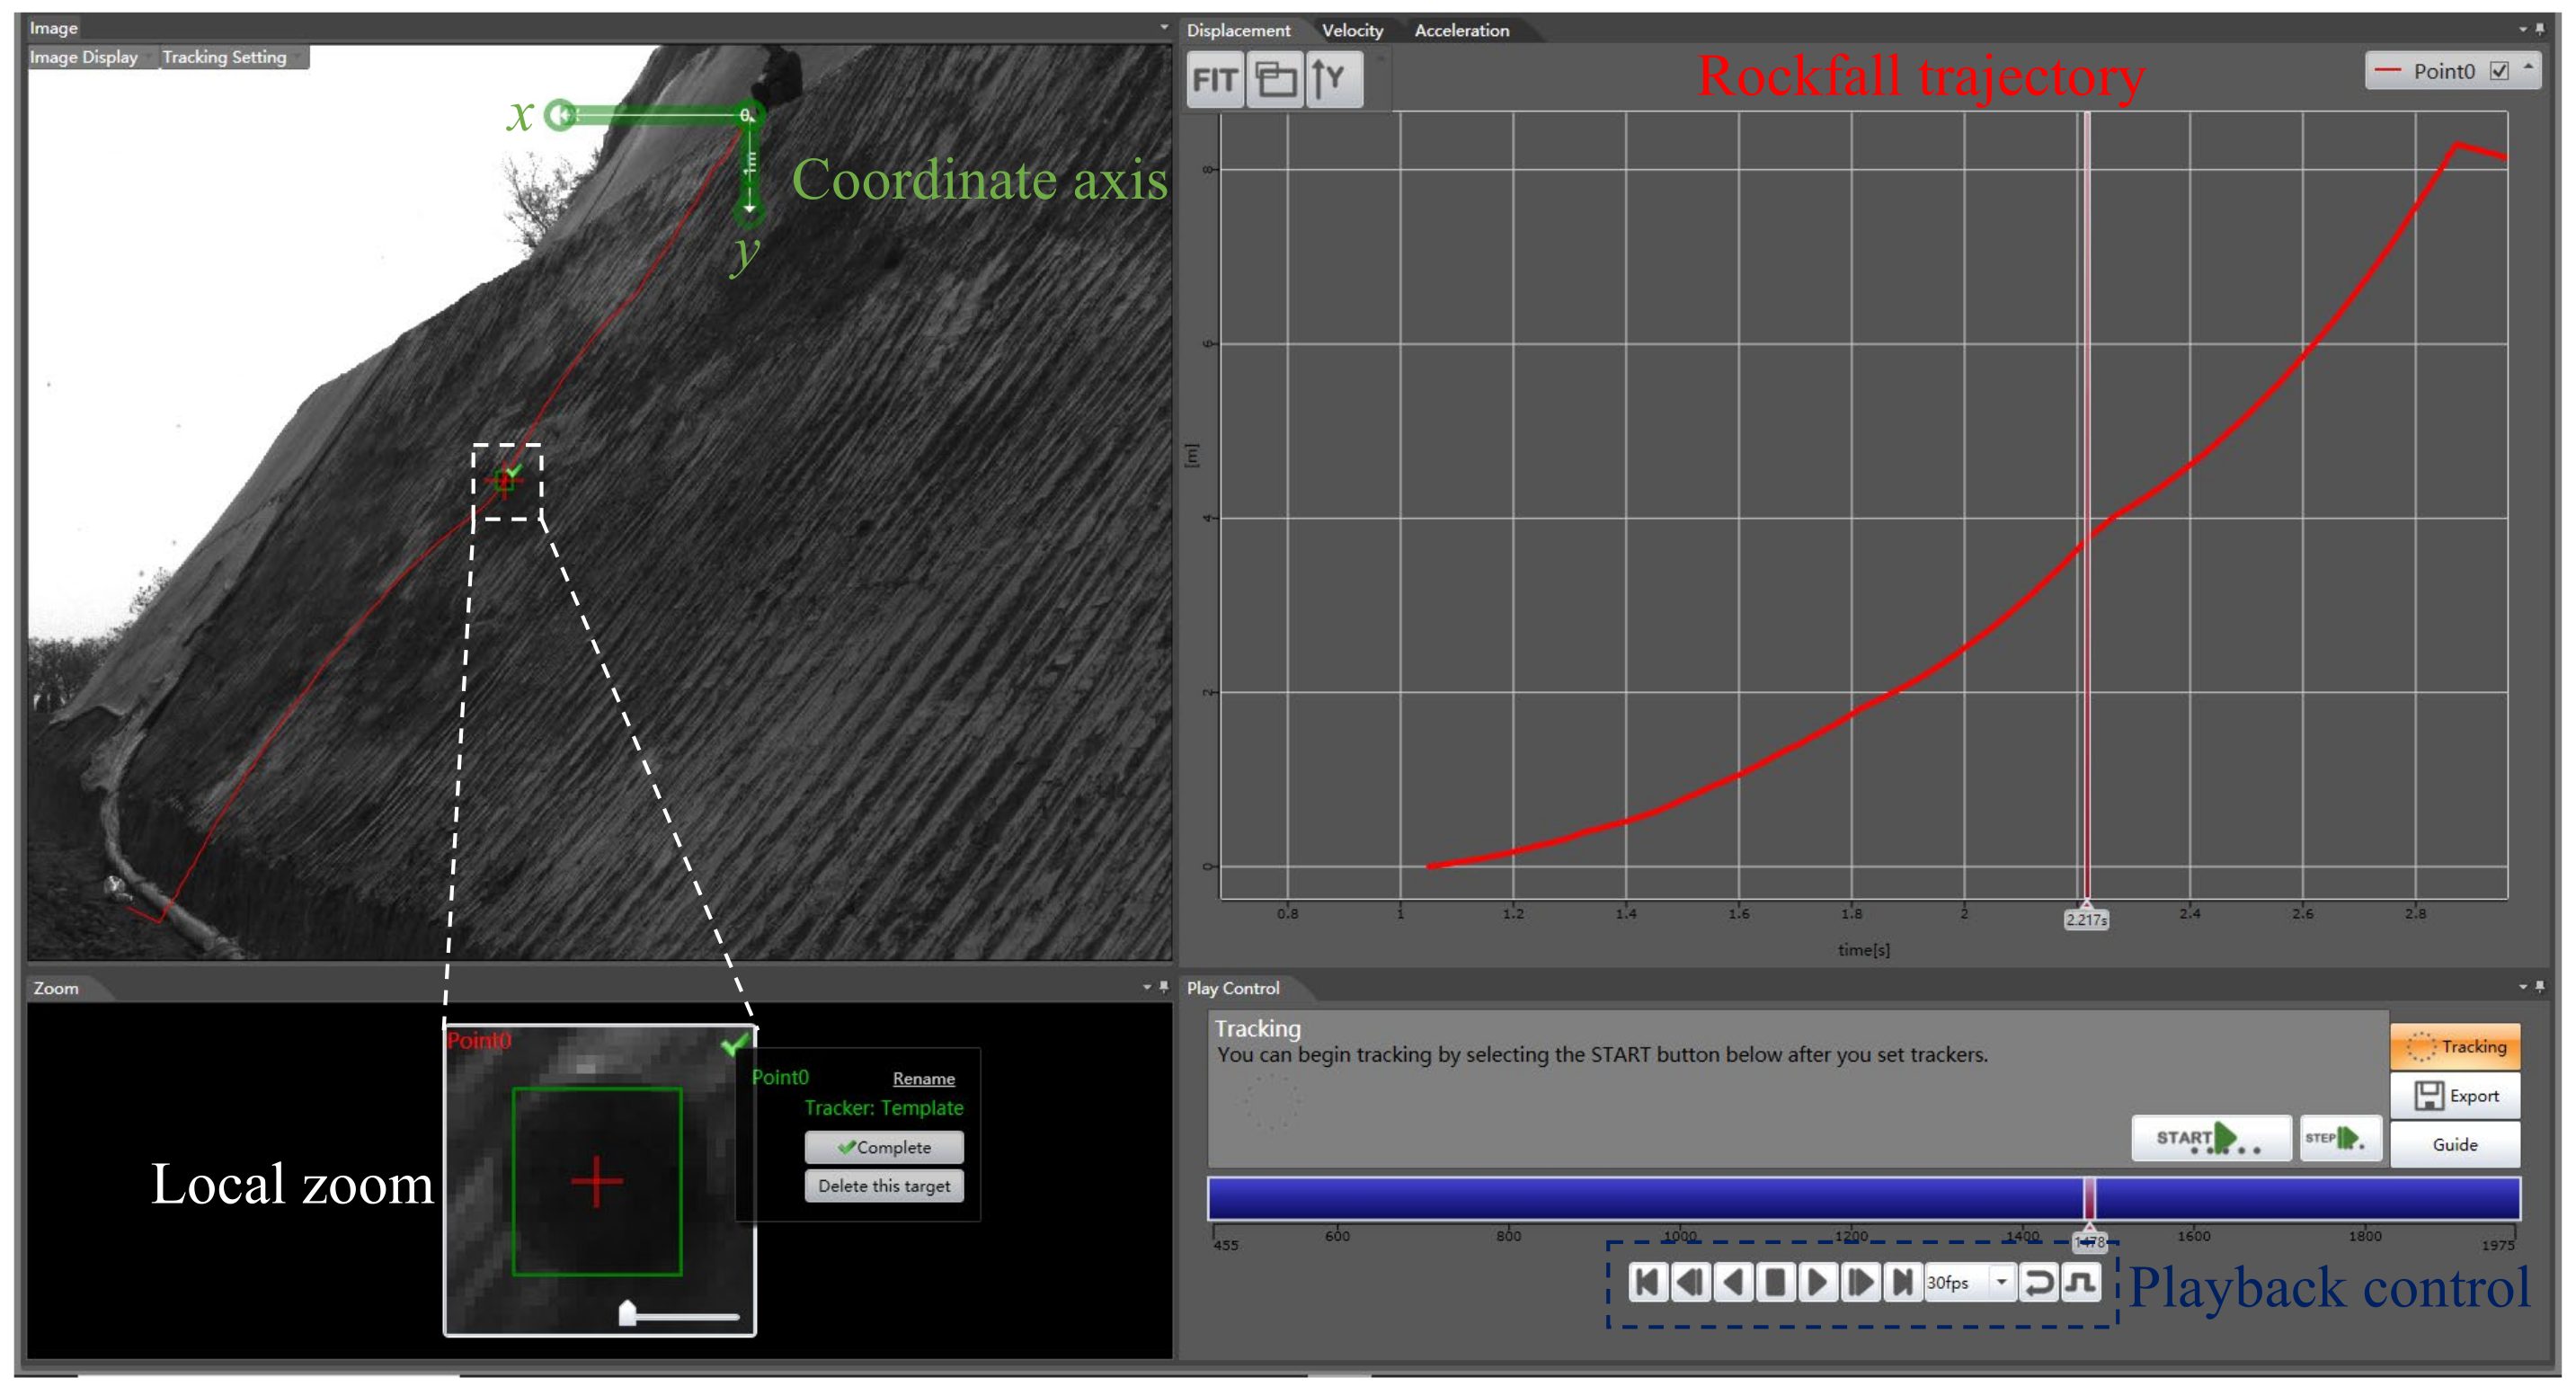
2.4. Image Analysis and Estimations
3. Results
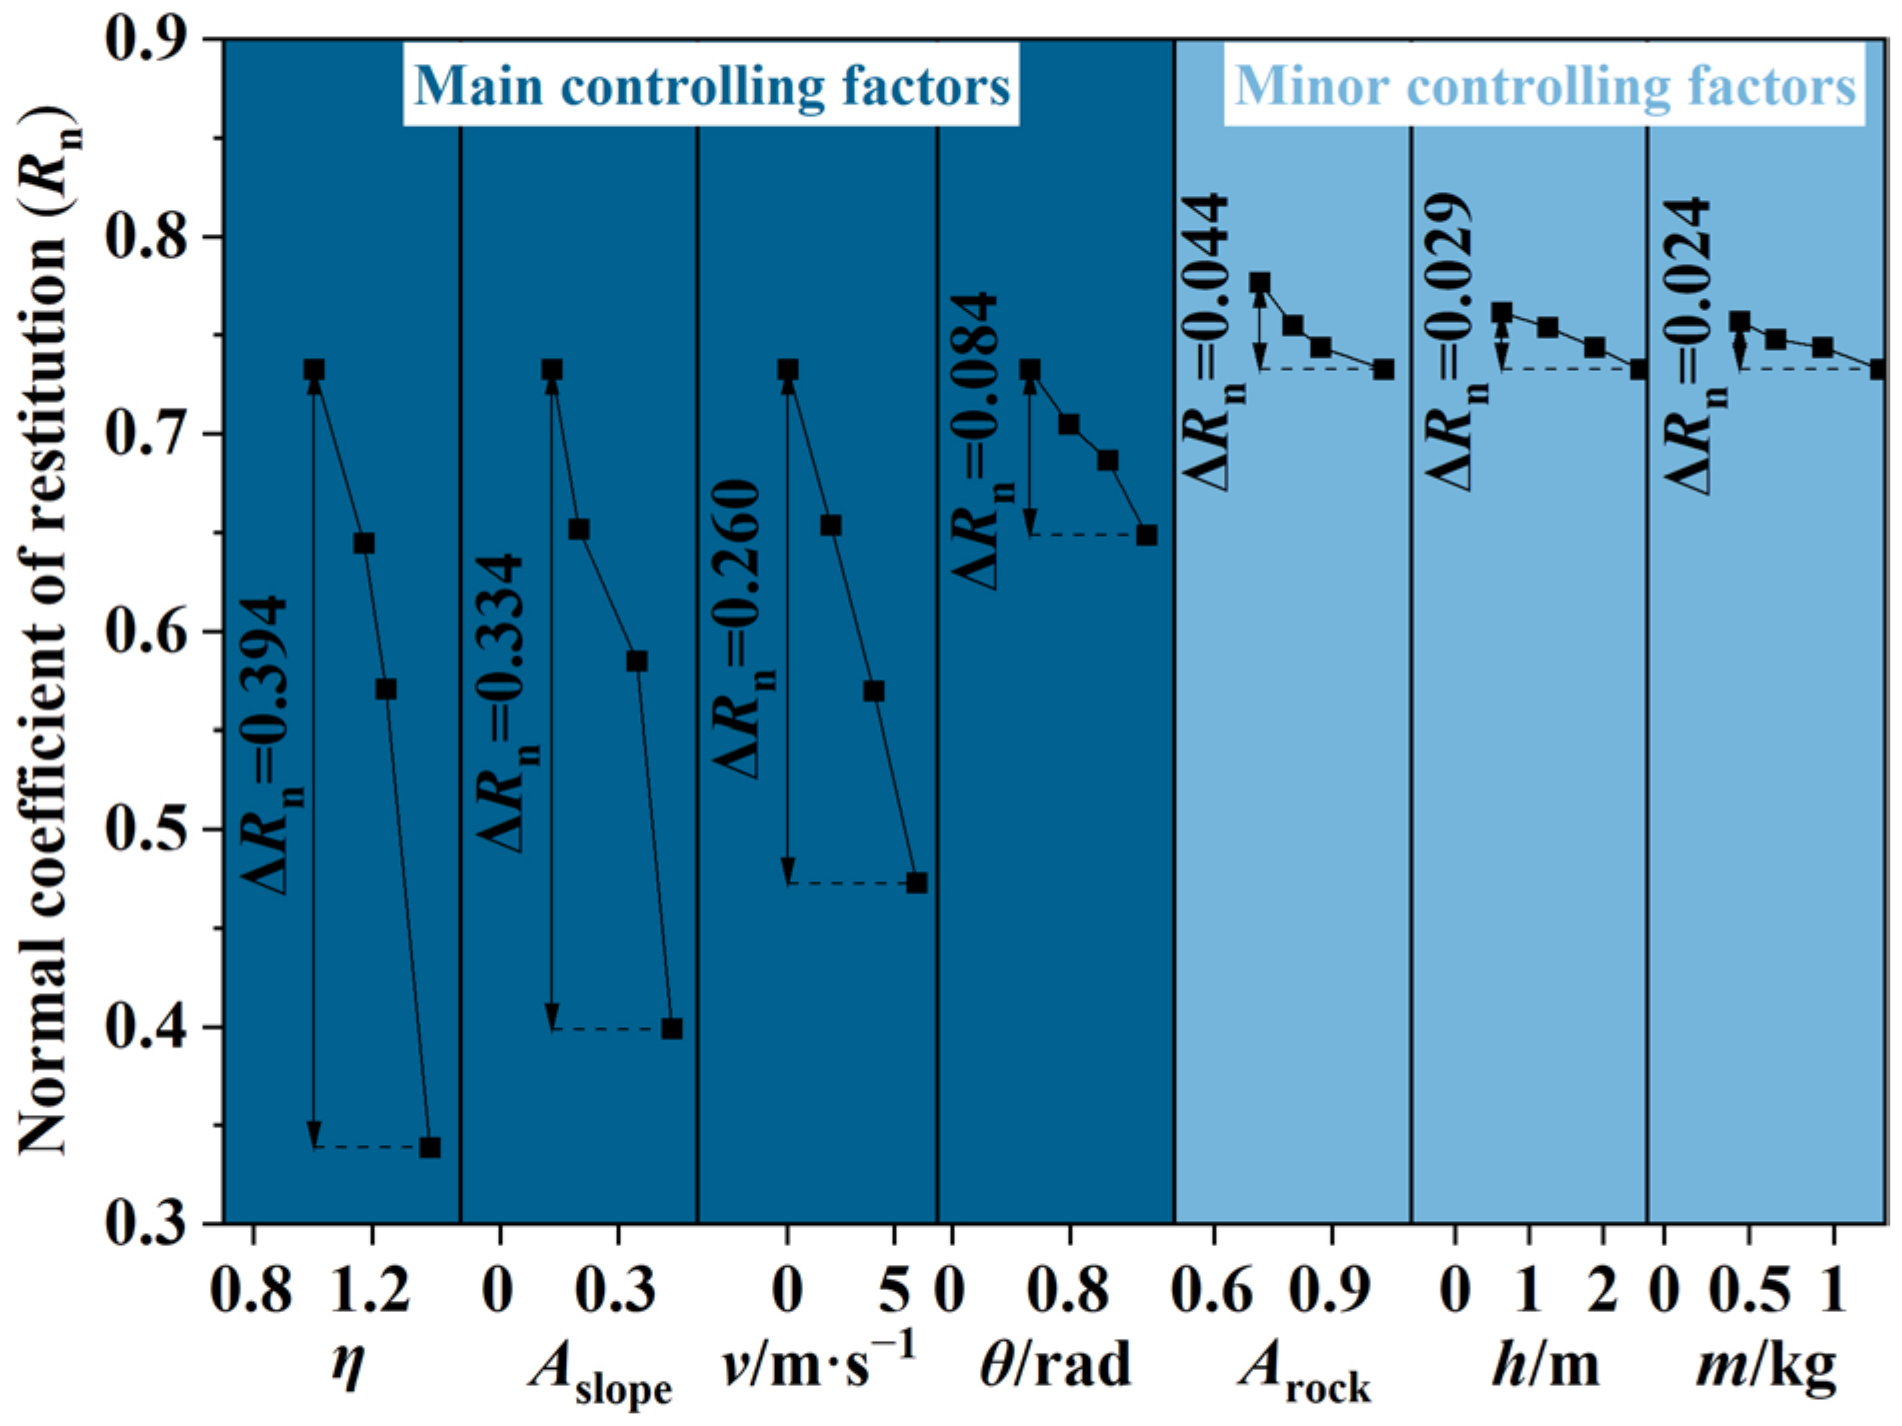
3.1. Determination of the Main Controlling Factors Influencing Rn
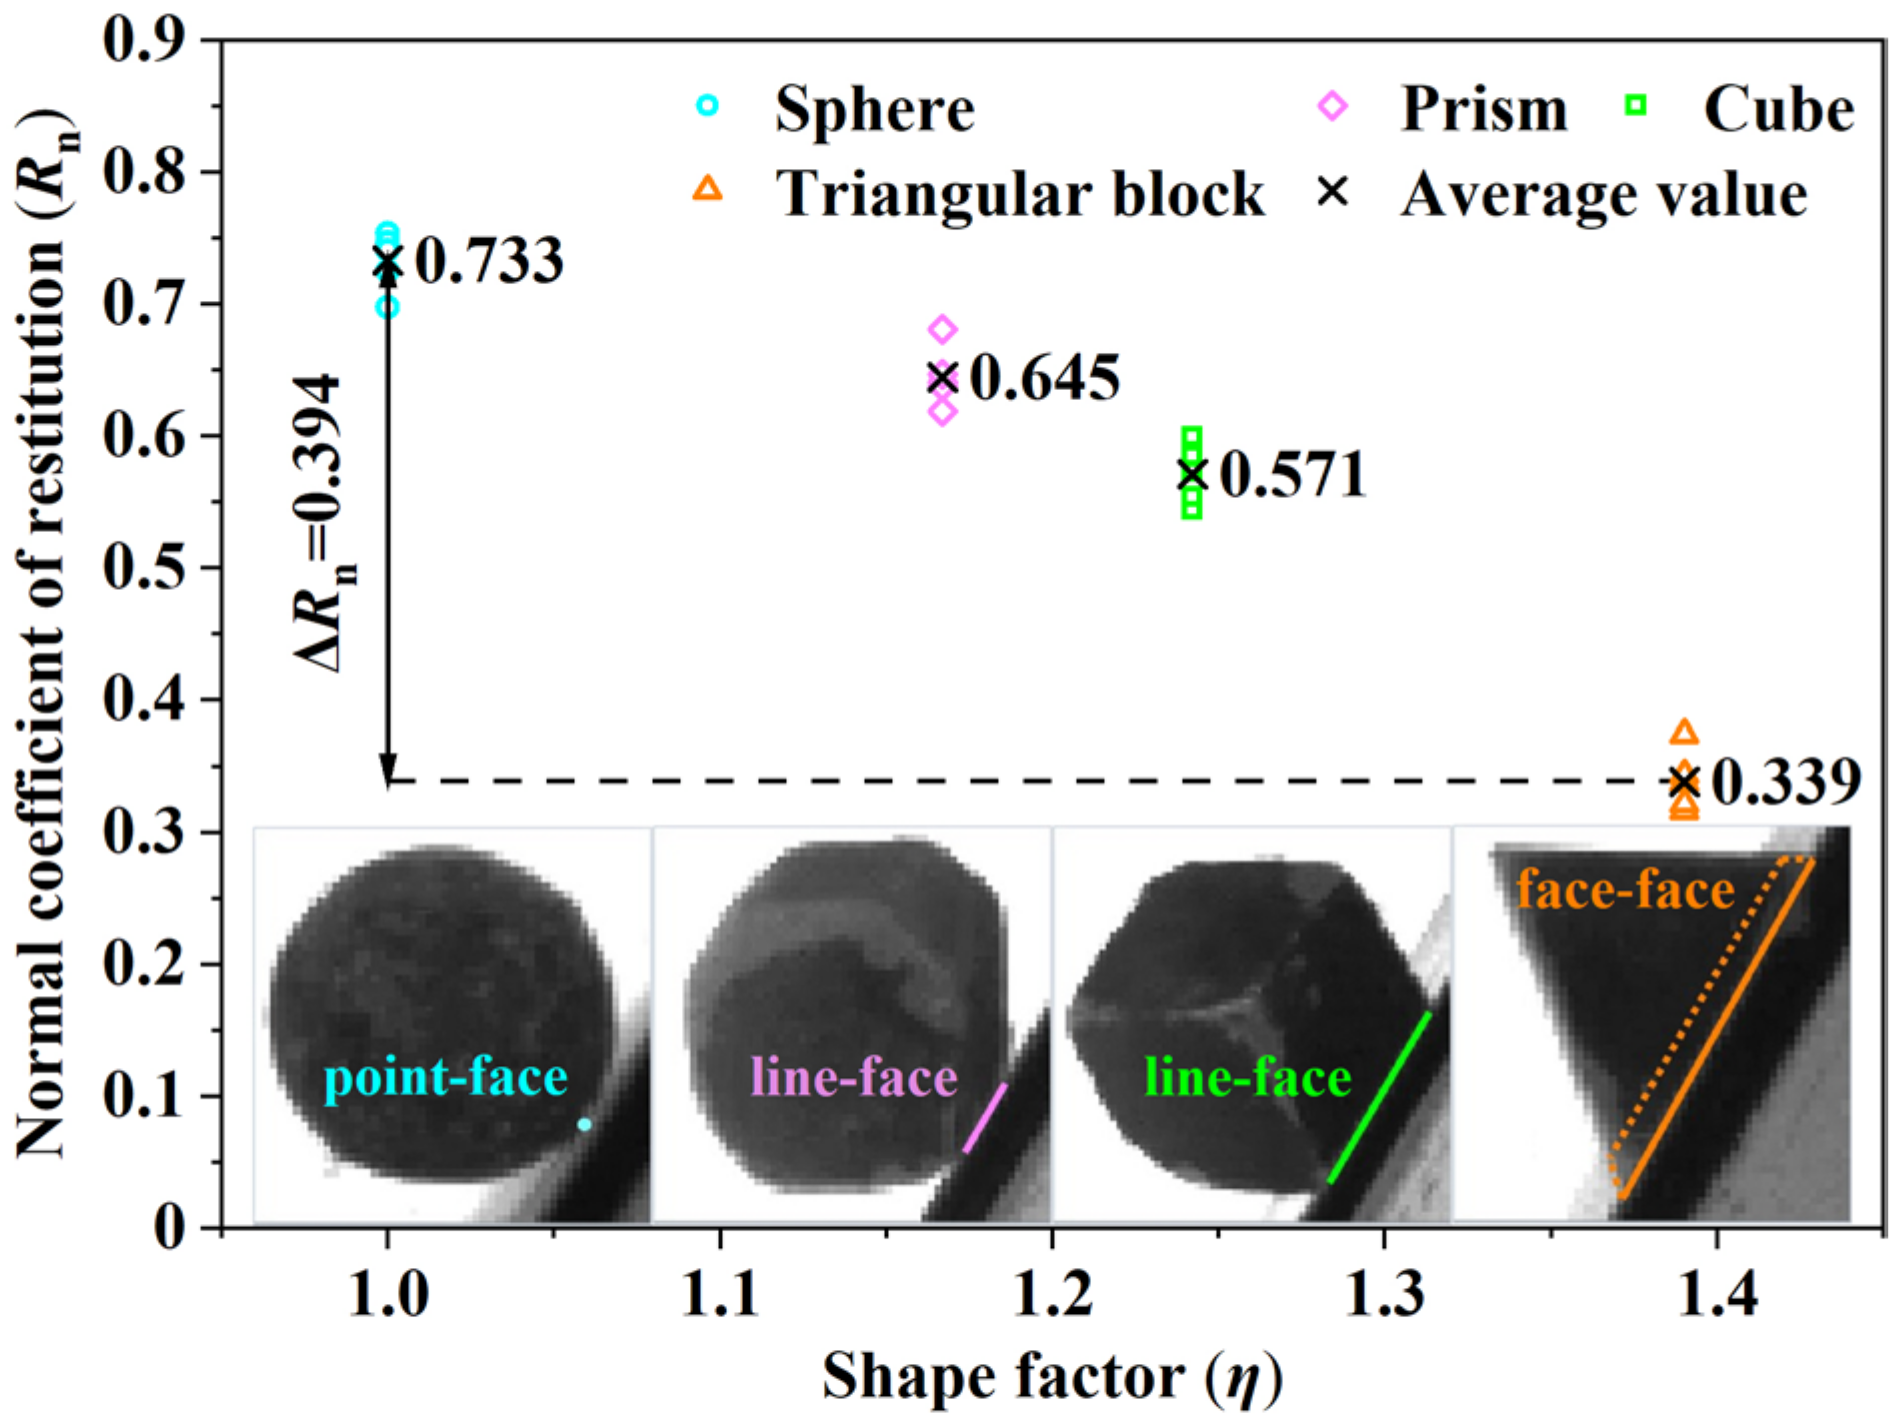
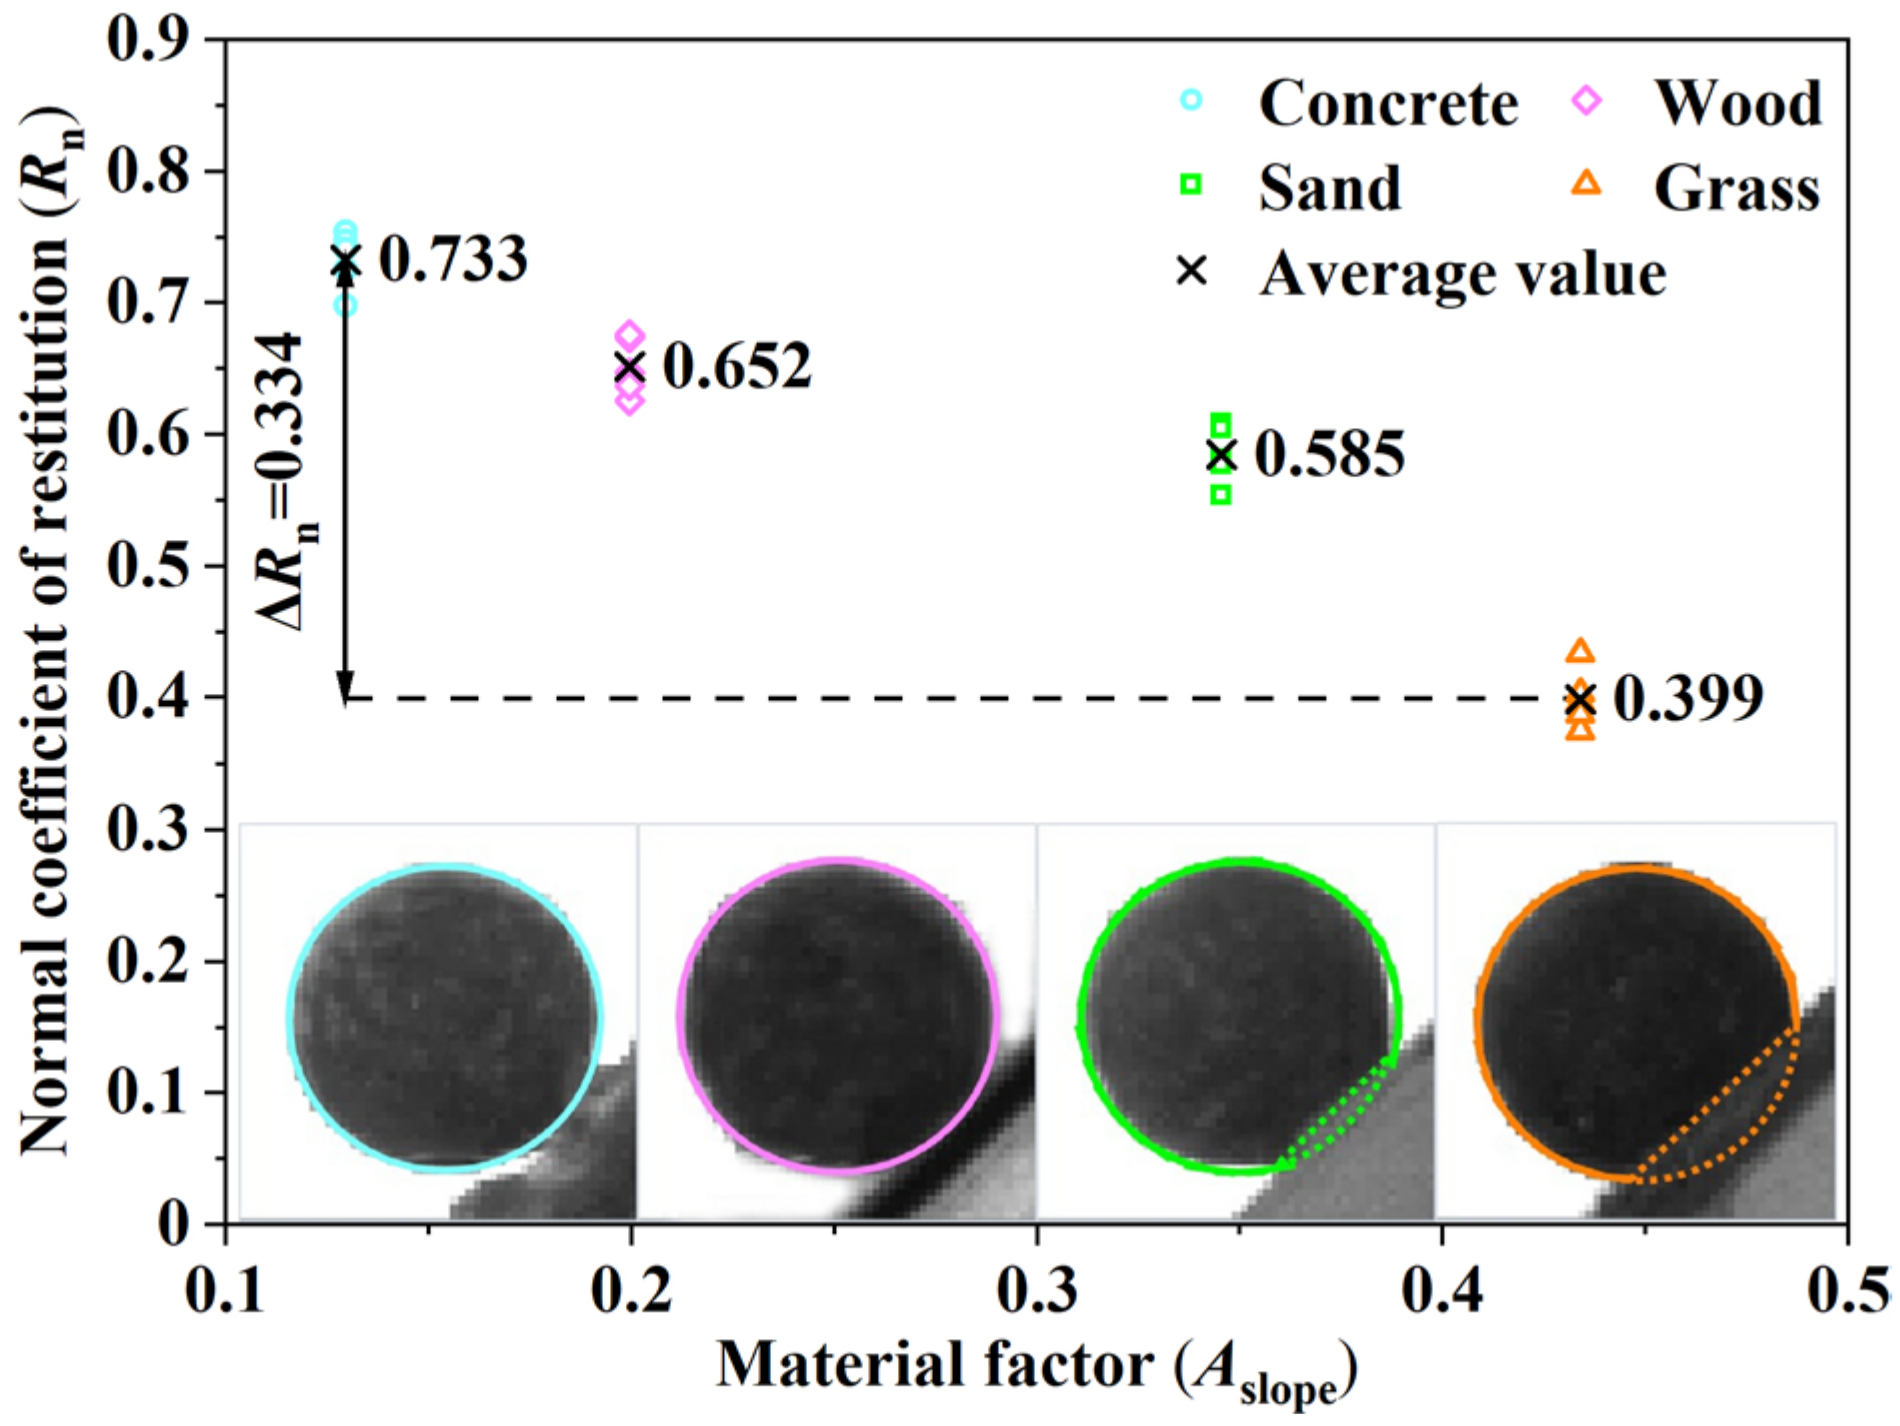
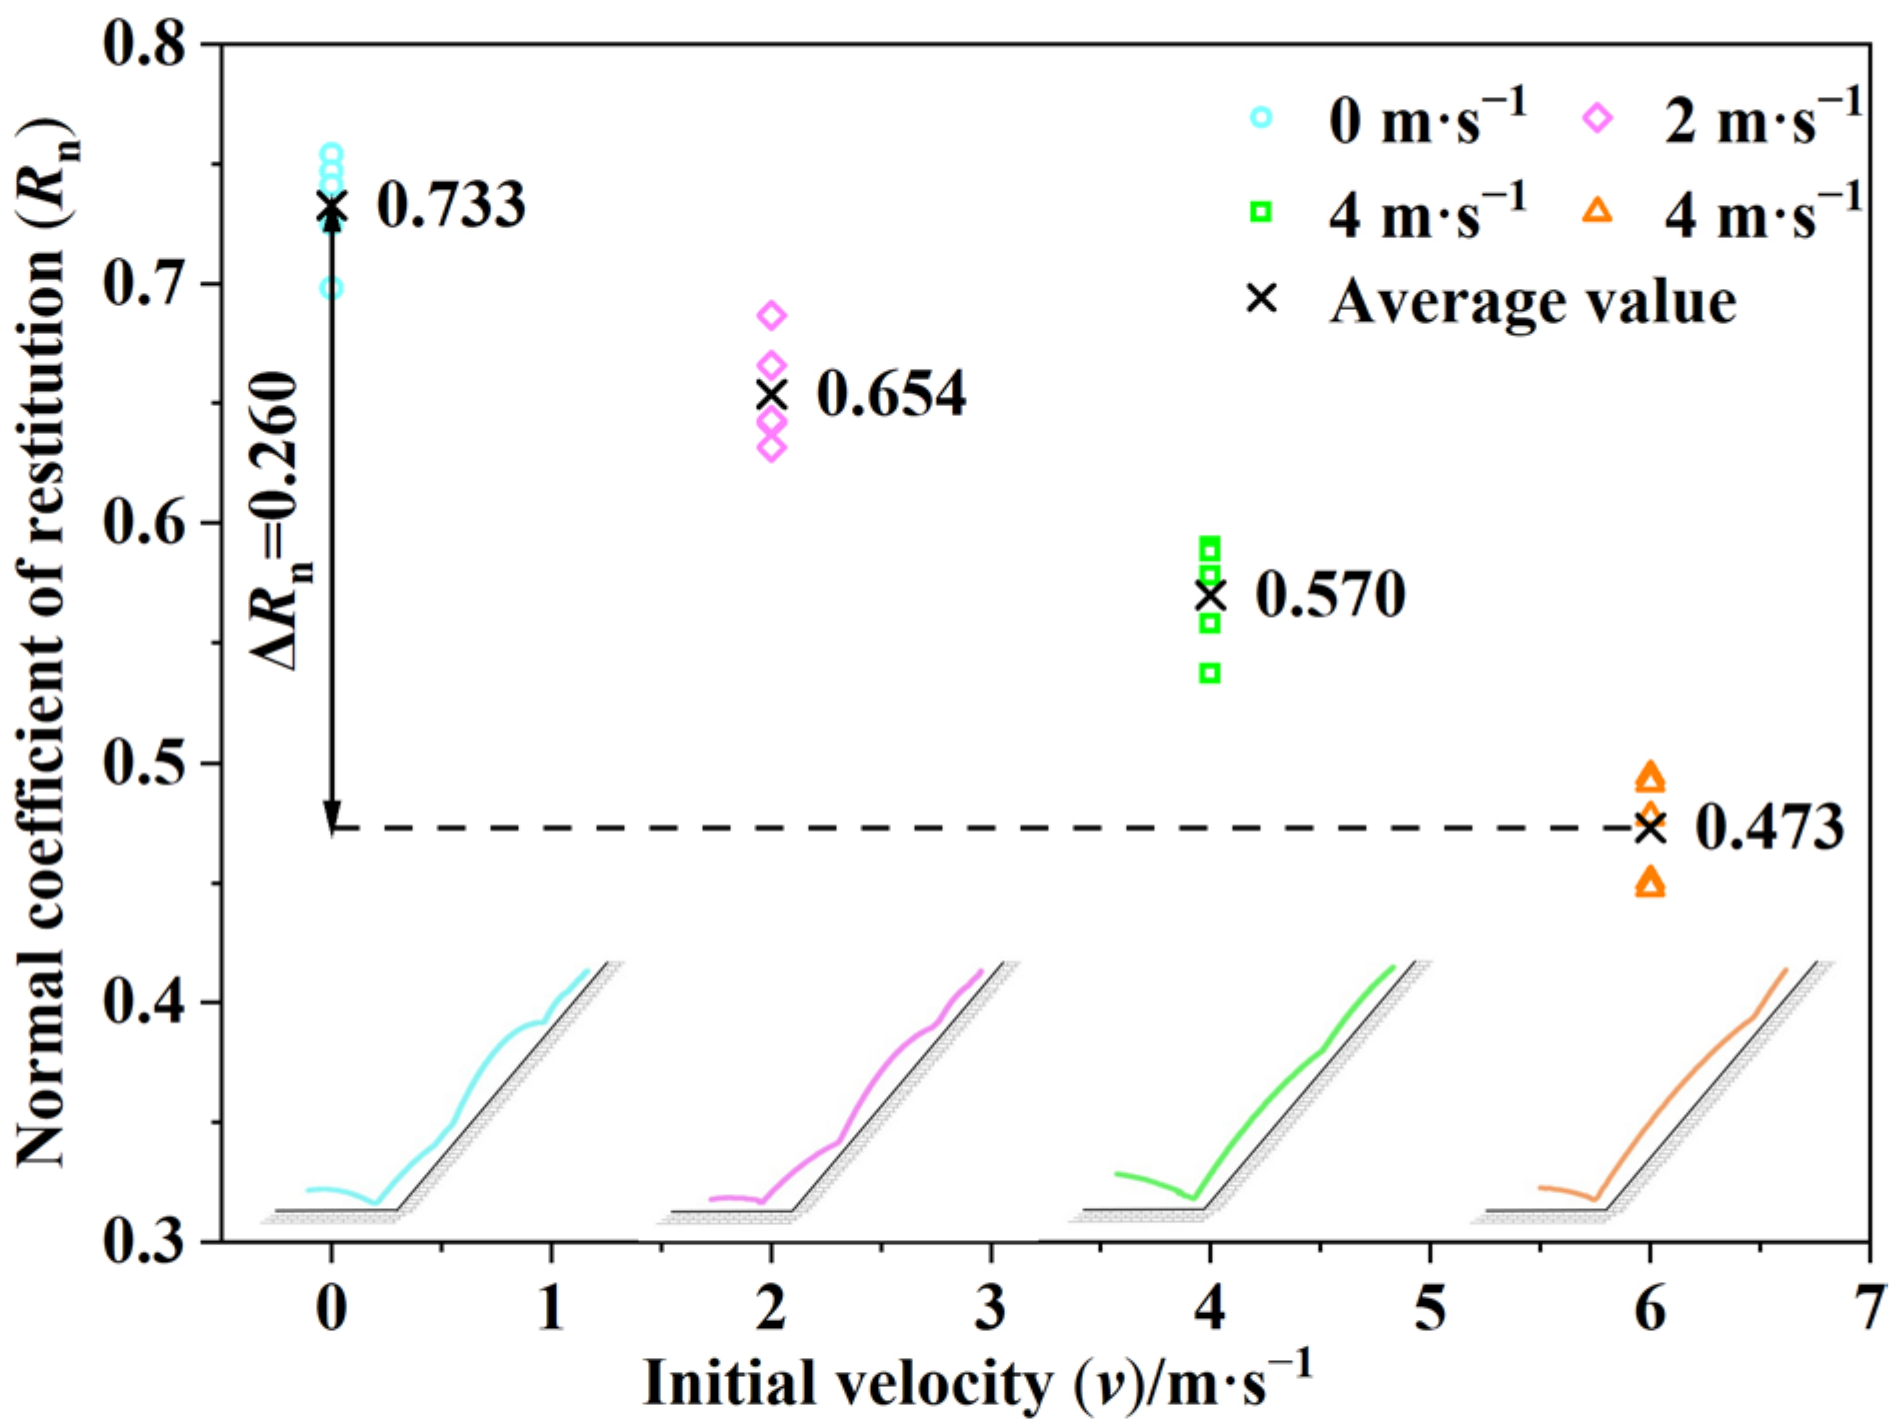
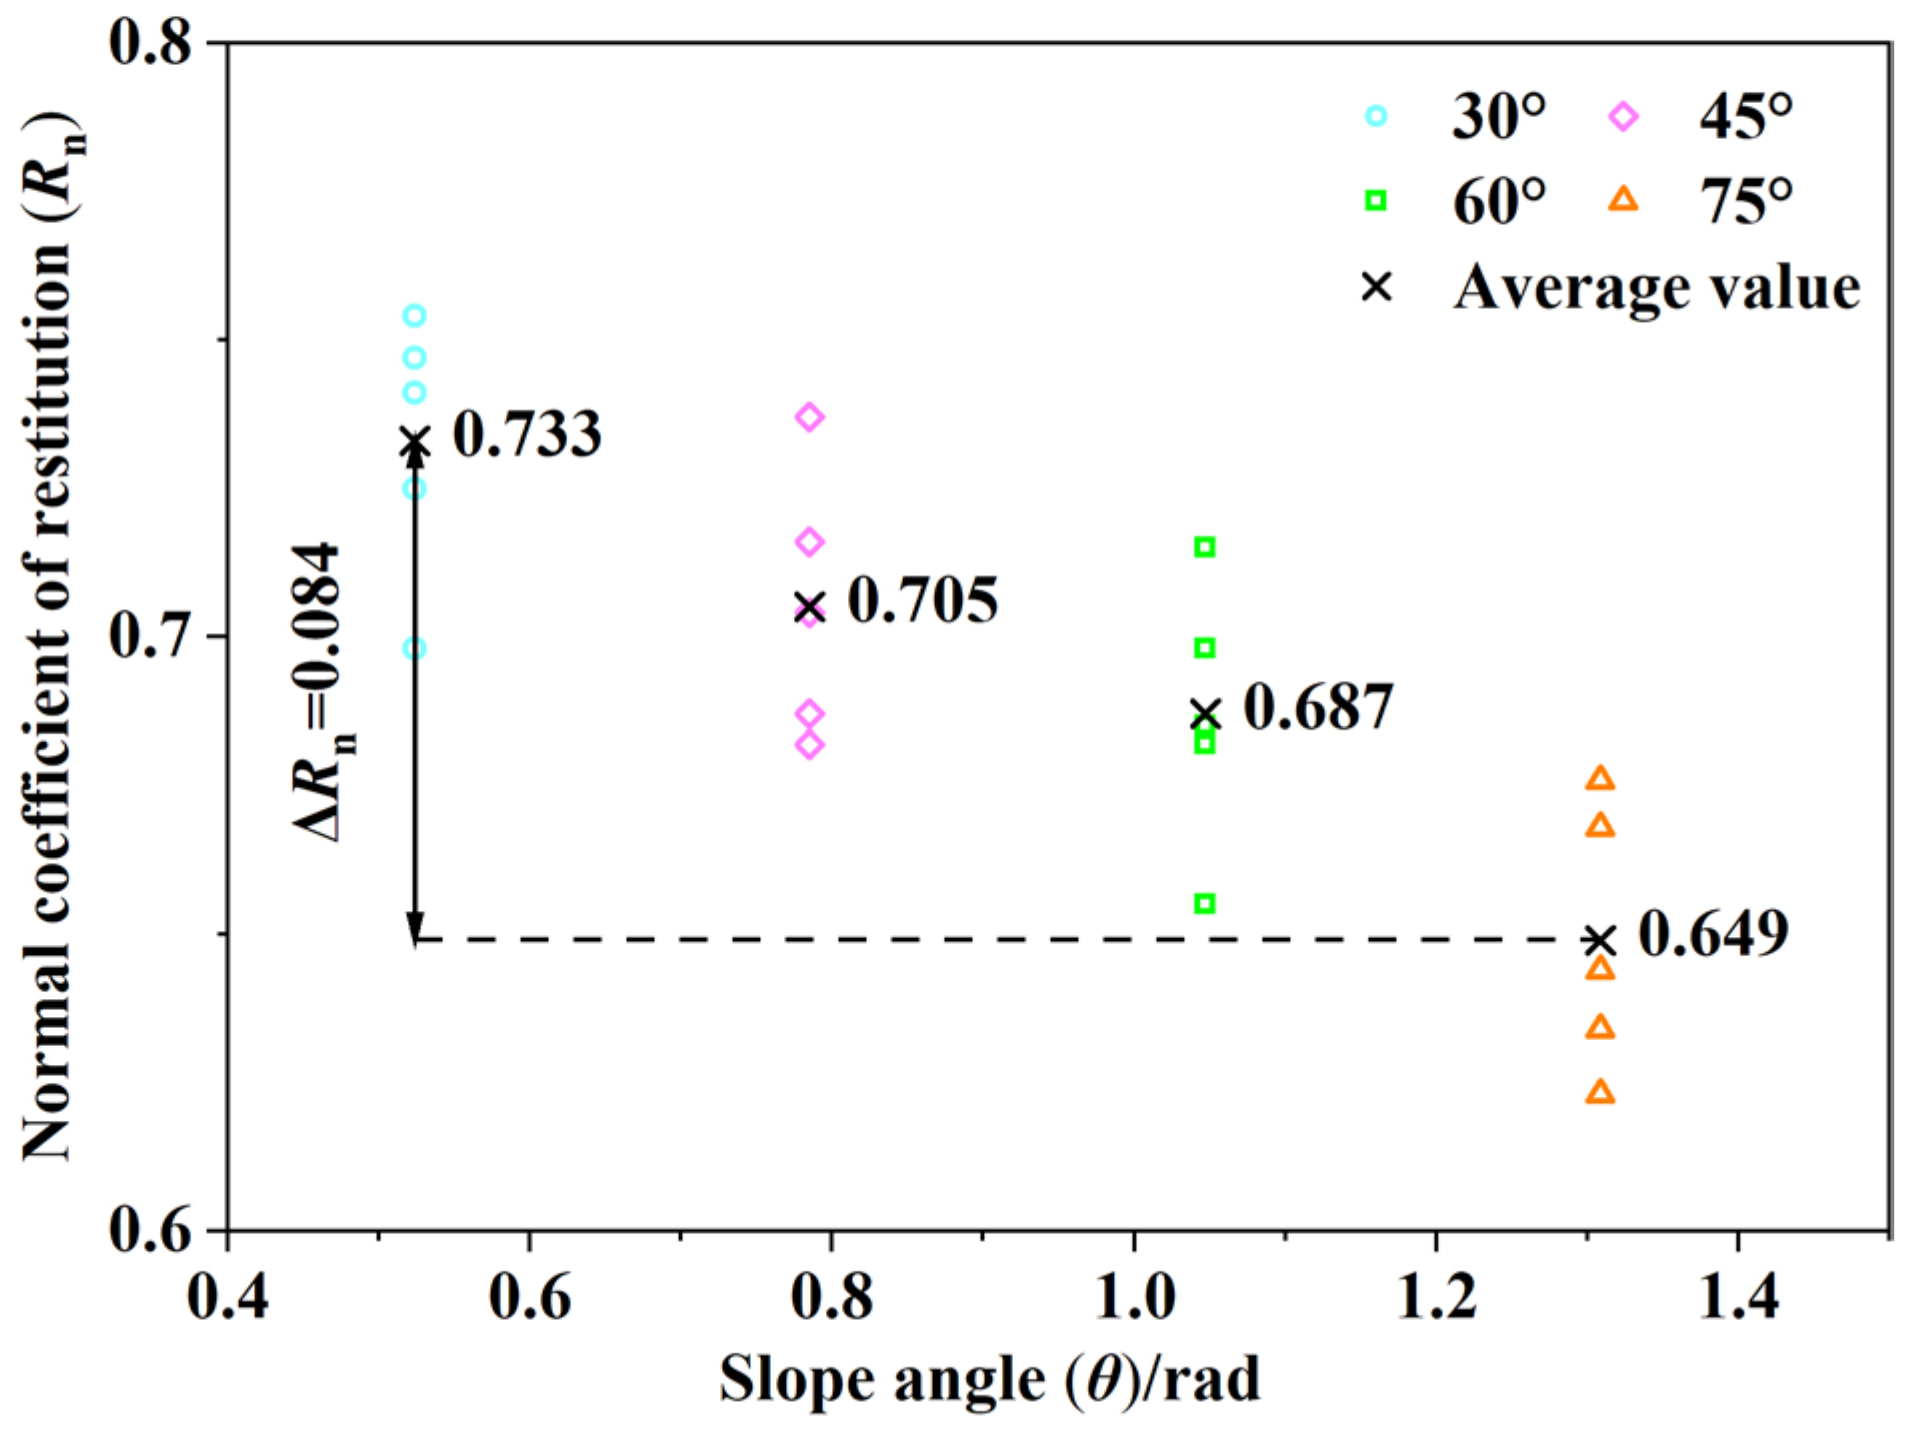
3.2. The Influence of Main Controlling Factors on Rn
3.3. Establishment of Rn Estimation Model
3.4. The Interactive Effects of Main Controlling Factors on Rn
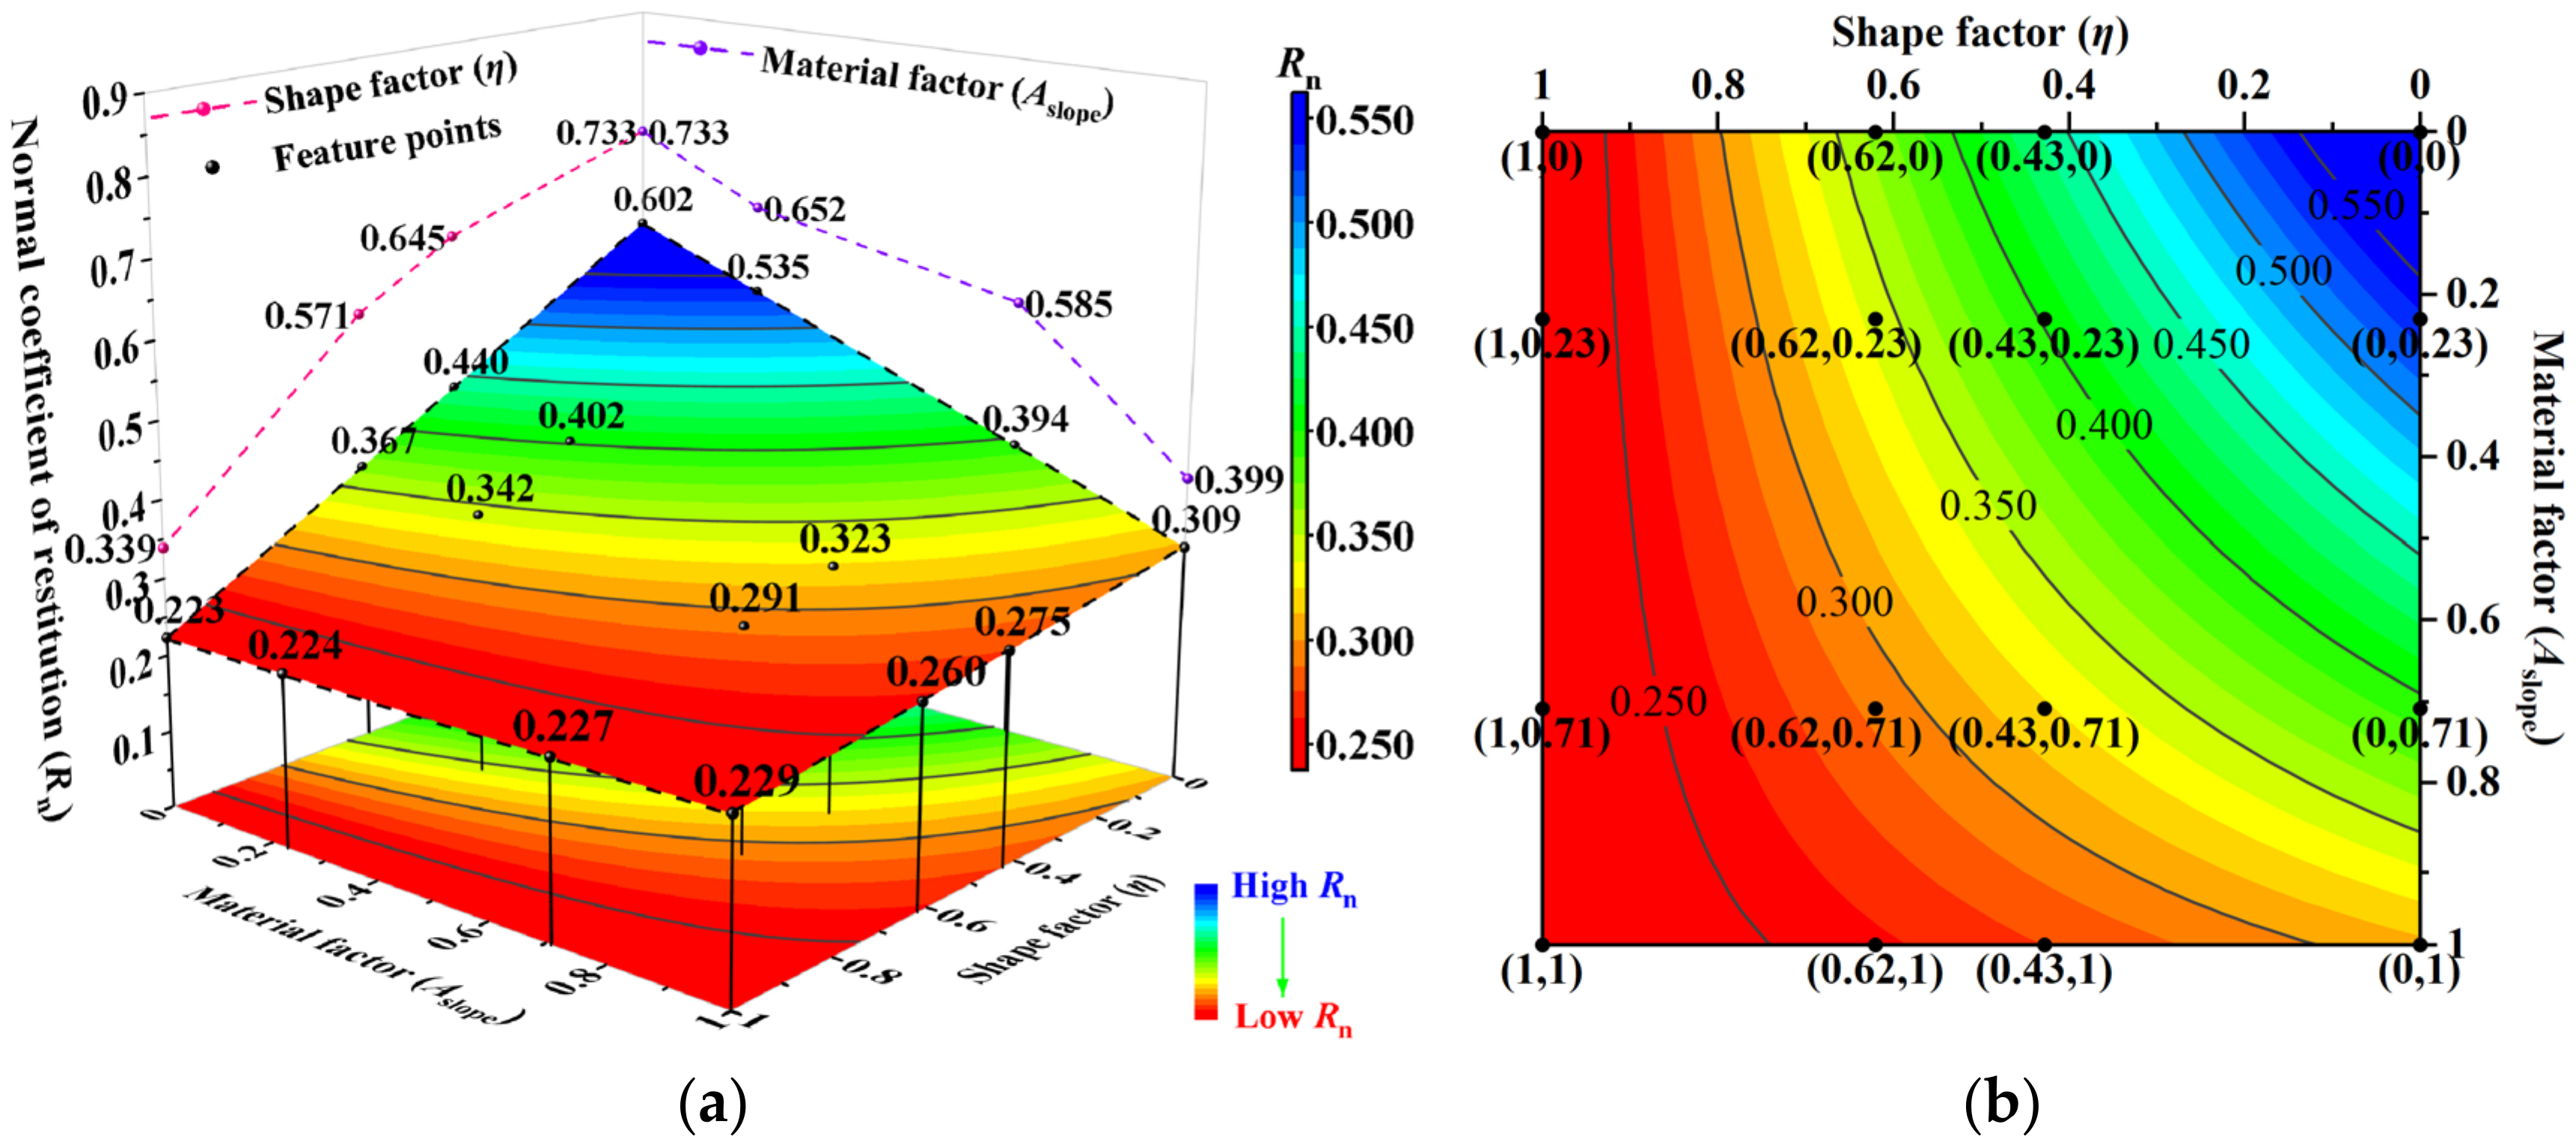
3.4.1. The Interaction of Falling Rock Shape and Slope Surface Material
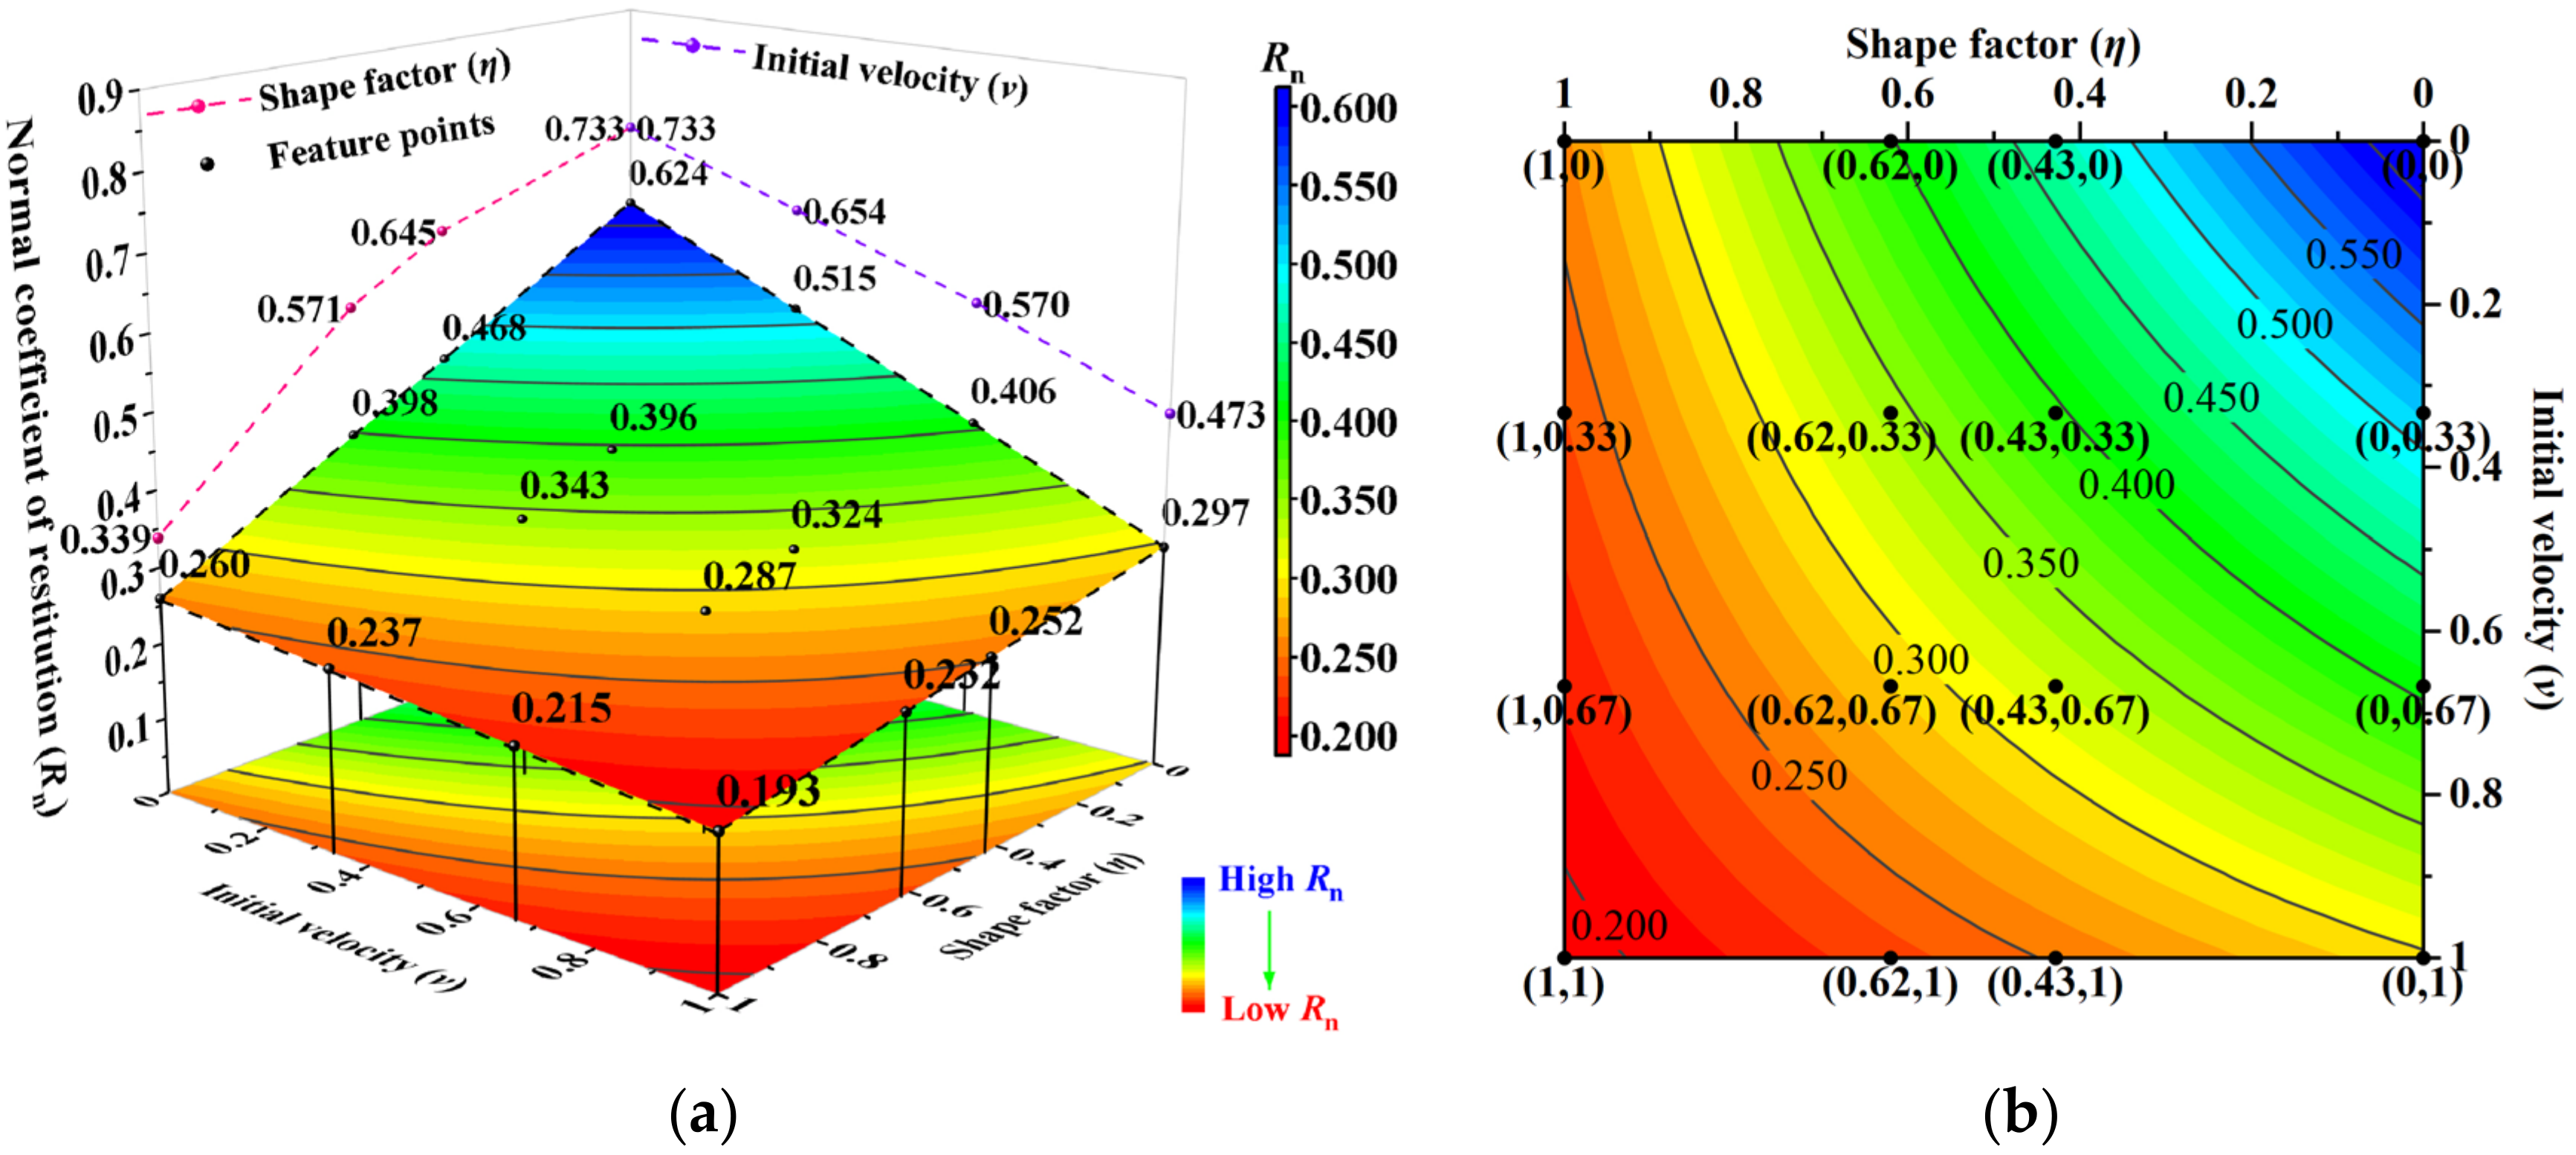
3.4.2. The Interaction of Falling Rock Shape and Initial Velocity
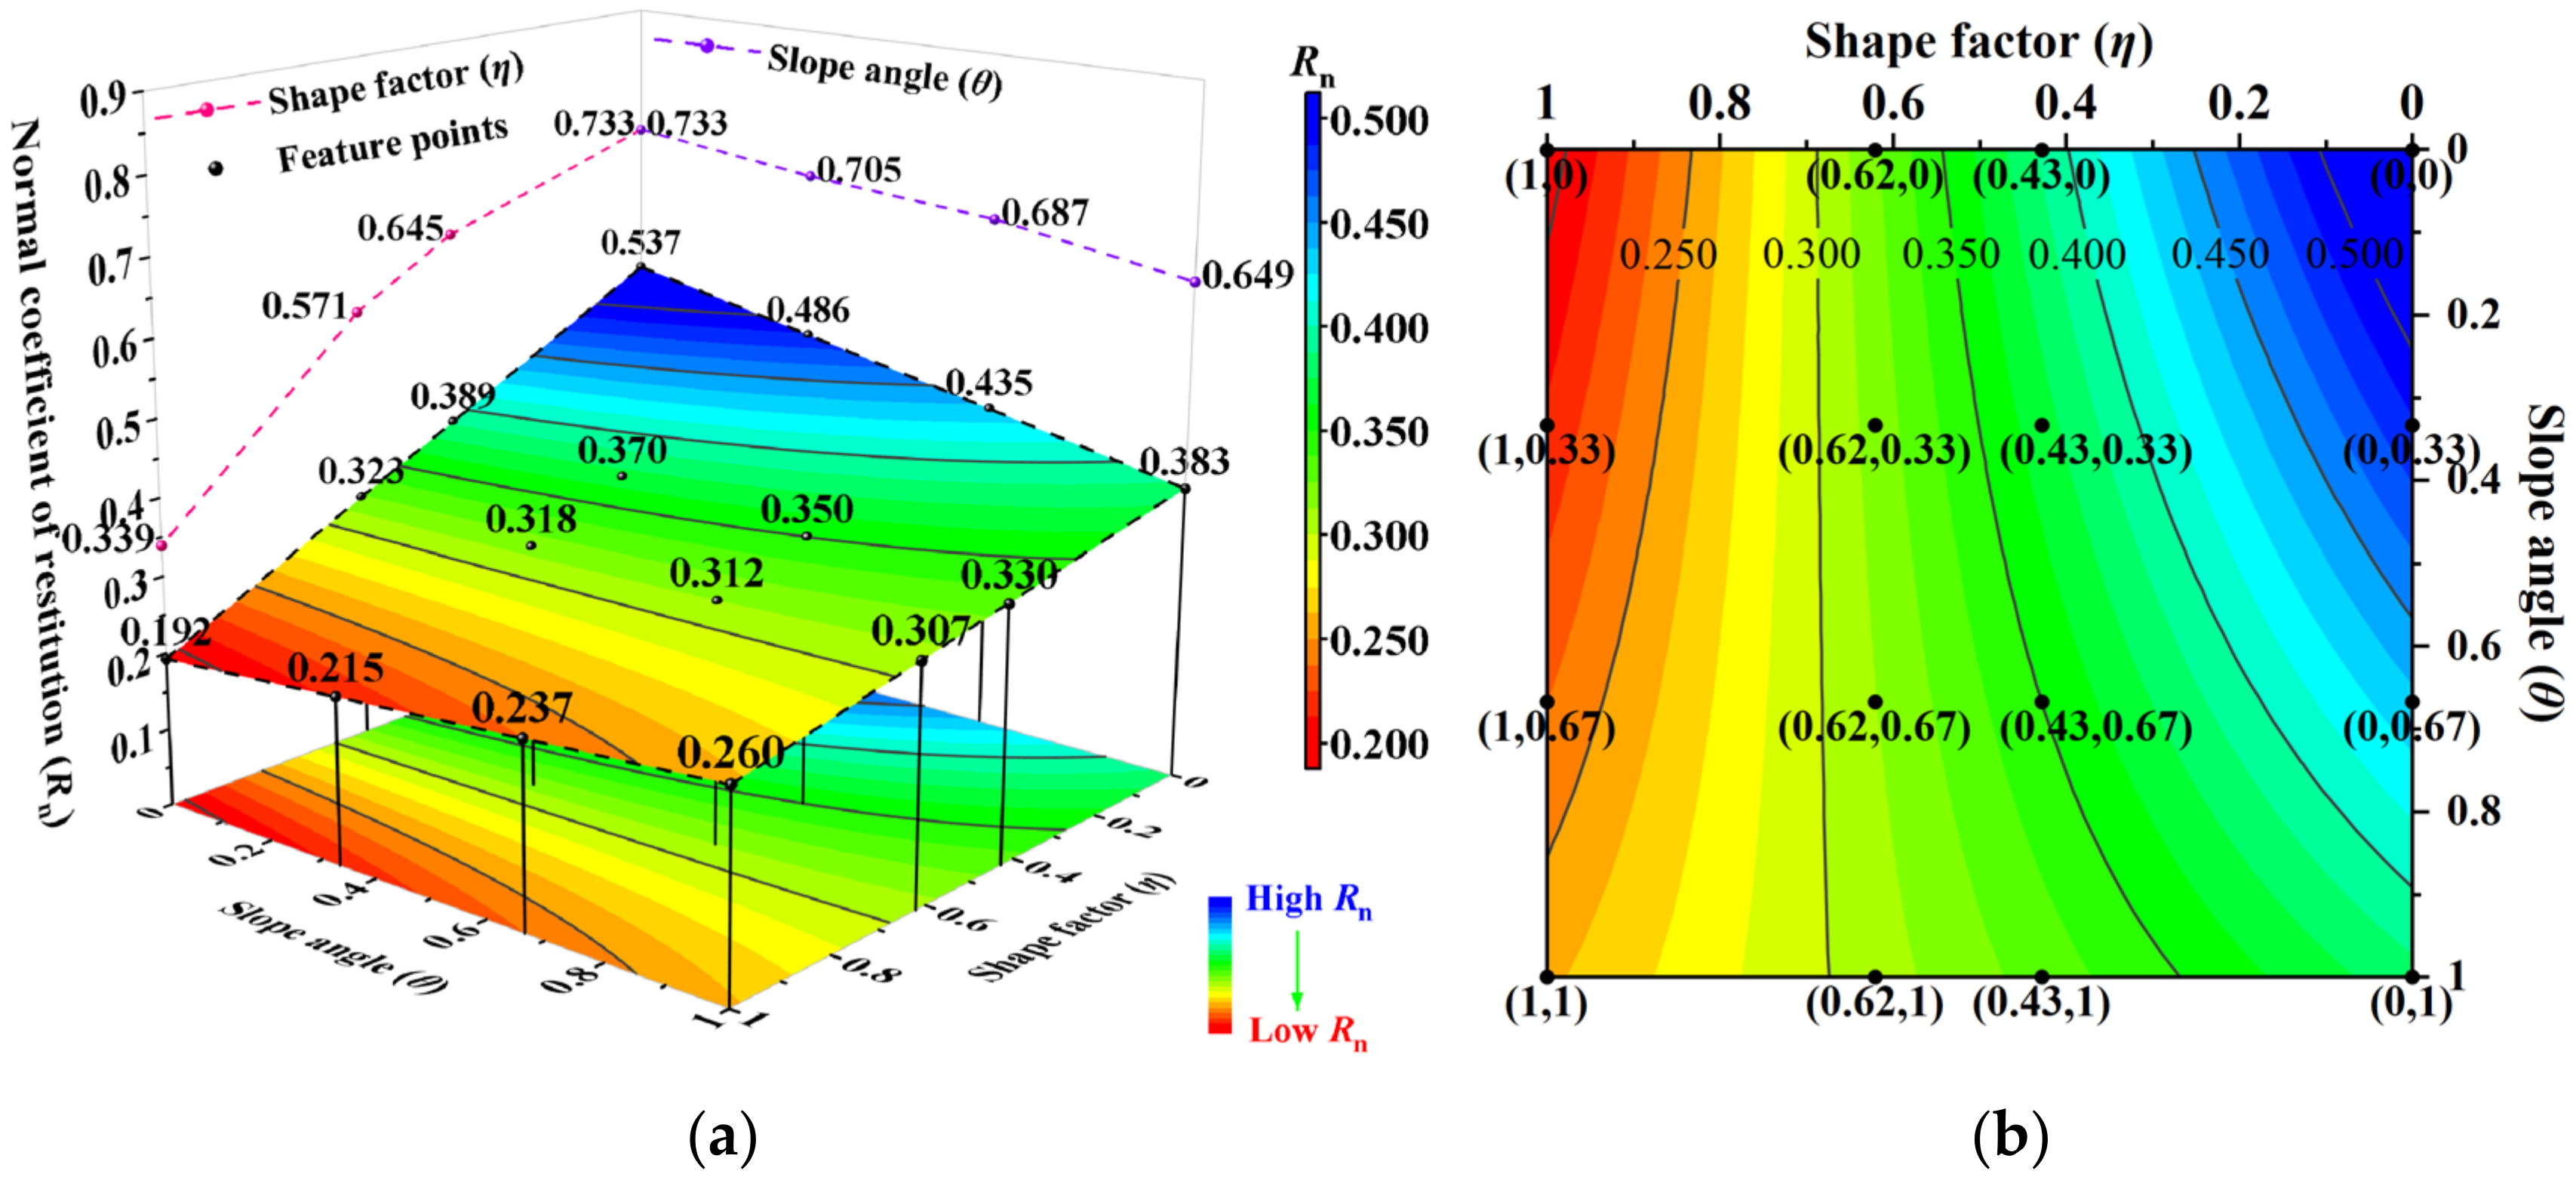
3.4.3. The Interaction of Falling Rock Shape and Slope Angle
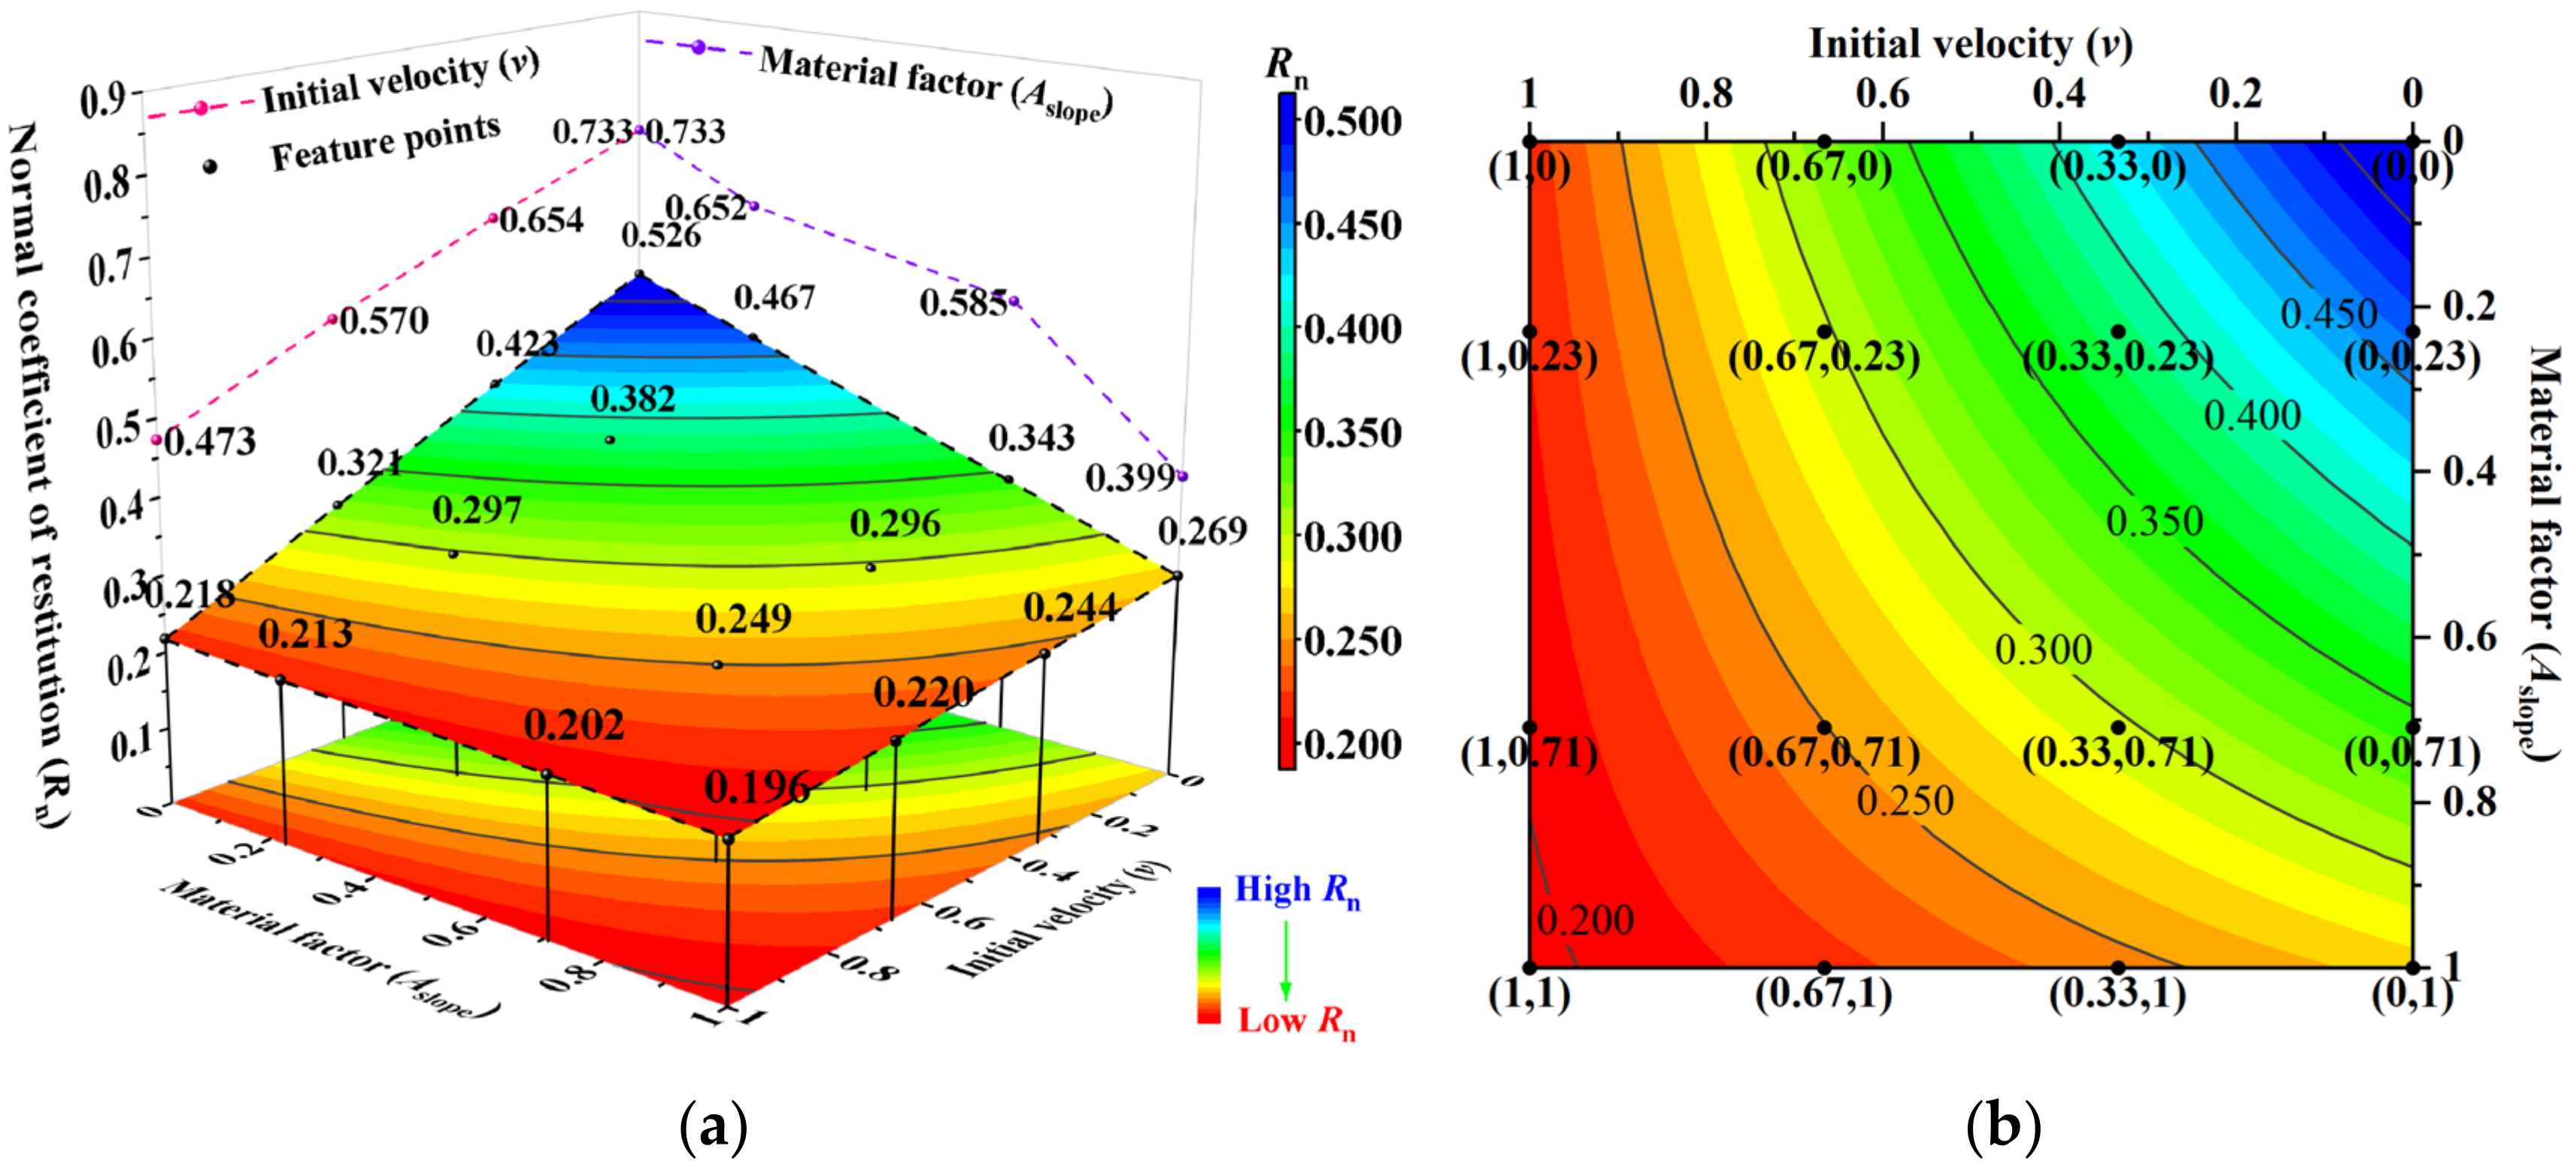
3.4.4. The Interaction of Slope Surface Material and Initial Velocity
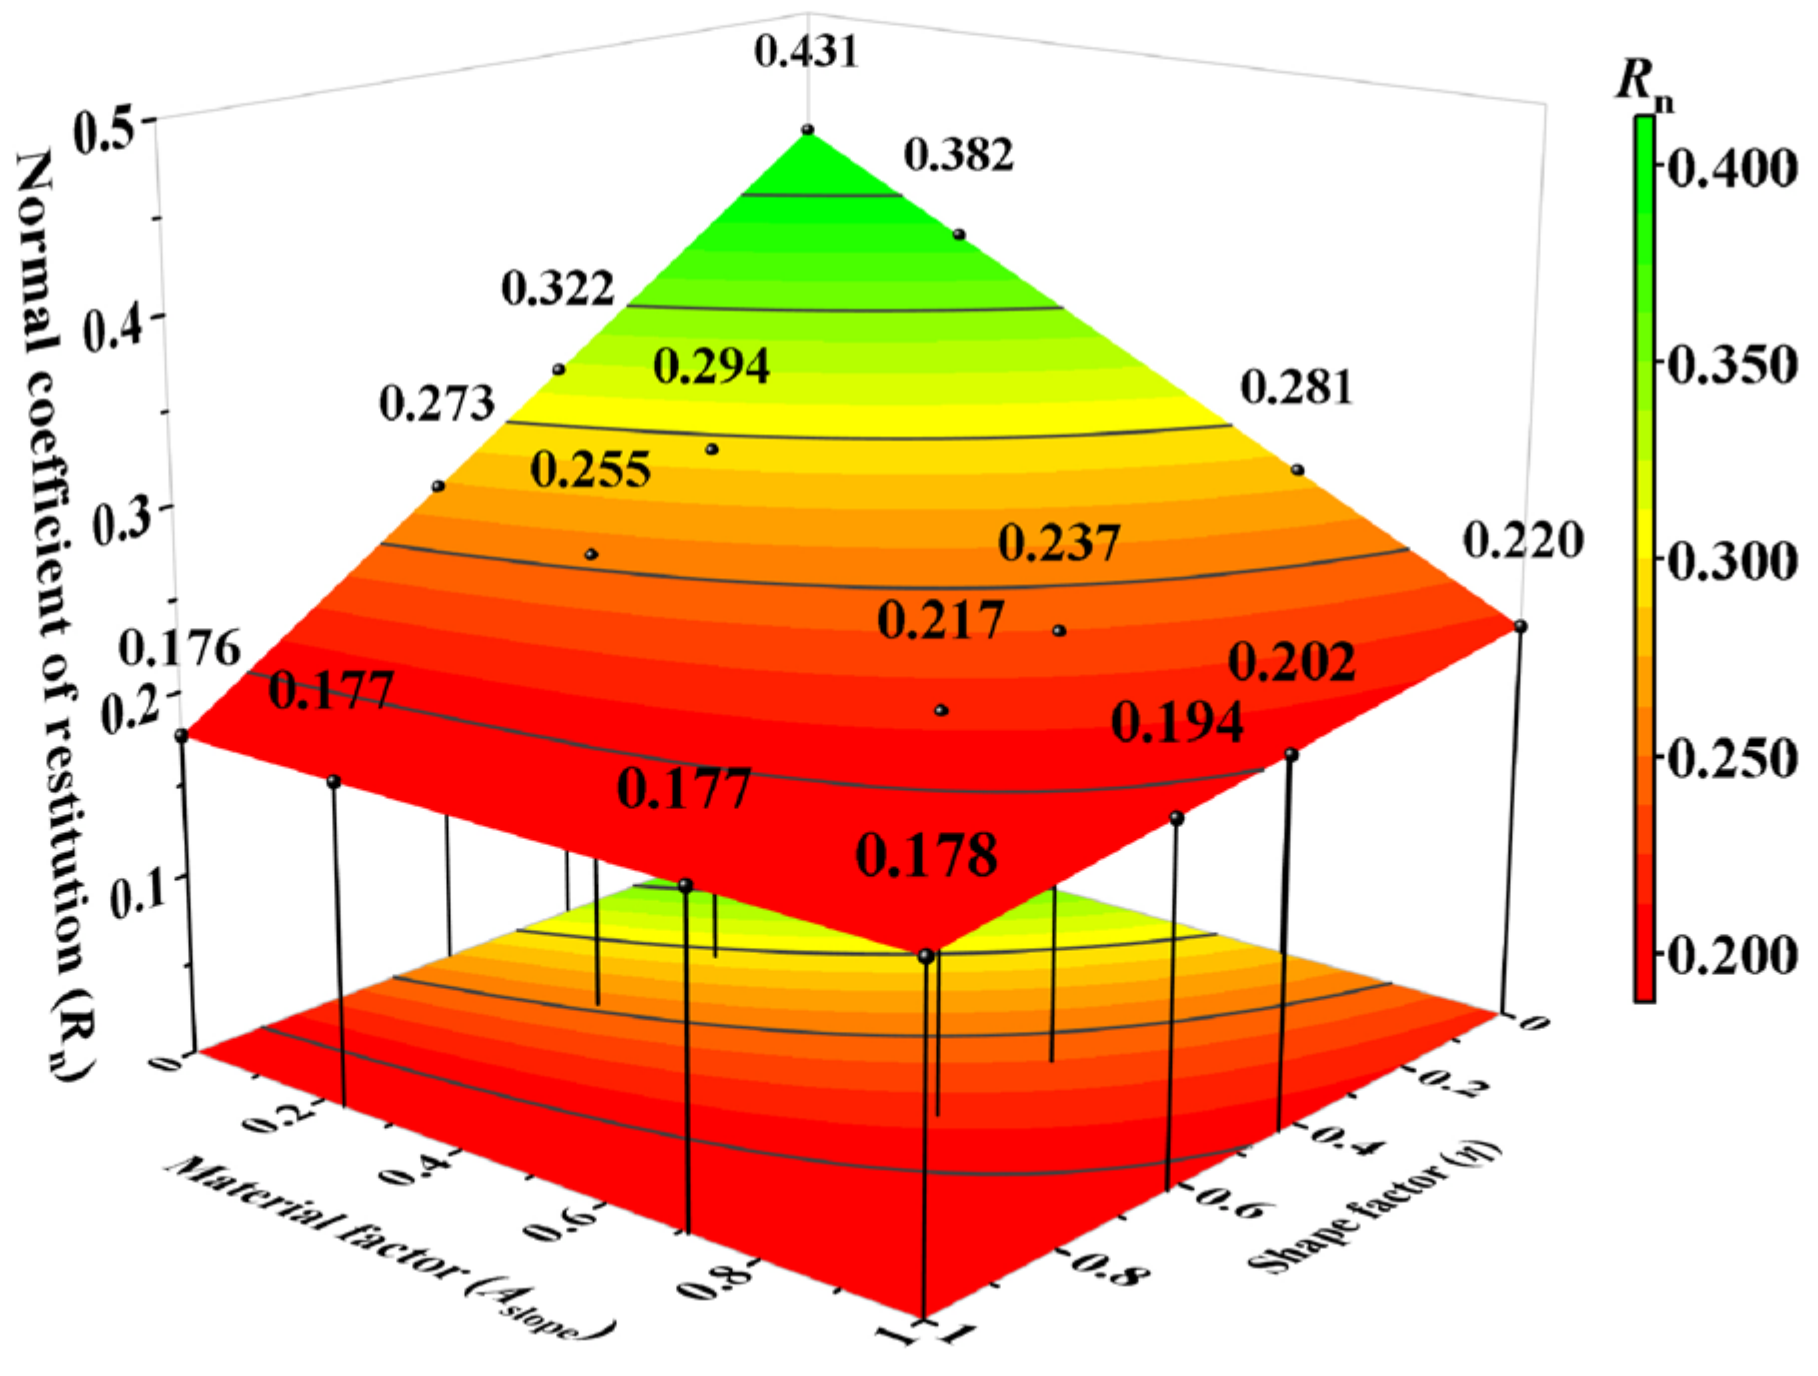
3.4.5. The Interaction of Falling Rock Shape, Slope Surface Material, and Initial Velocity
3.5. Verification of On-Site Falling Rock Tests
4. Discussion
5. Conclusions
- (1)
- The four main controlling factors—falling rock shape, slope surface material, initial velocity, and slope angle—exhibit decreasing effects on Rn. The analysis revealed a significant two-factor interaction: falling rock shape–slope surface material, falling rock shape–initial velocity, slope surface material–initial velocity, and falling rock shape–slope angle. Notably, a significant three-factor interaction was observed among falling rock shape, slope surface material, and initial velocity.
- (2)
- At high-level η, the falling rock shape interacts with other main controlling factors, the line/face–face collision energy consumption increases. This effect on Rn is weaker than that of low-level η interacting with slope surface material and initial velocity, but stronger than its interaction with slope angle. At high-level Aslope, the slope surface material interacts with falling rock shape and initial velocity is weakened due to a decrease in slope surface material strength and deformation recovery. The collision strength increases at high-level v, which reduces the effect of falling rock shape and slope surface material on Rn. The energy consumption discrepancy is mainly attributed to falling rock shape at high-level θ, while the effect of slope angle on Rn diminishes.
- (3)
- In three-factor interaction, the Rn sensitivity on Aslope becomes negligible as η and v increase. High-level η reduces the effect of slope surface material on Rn at high-level v.
- (4)
- The maximum error between the estimated Rn from the multi-factor interaction model and the field value is 0.014, corresponding to a 3.39% error. This indicates high accuracy compared to the results from the non-interaction model and other empirical formulas. The accuracy of Rn can be improved by up to 68.52% compared to the estimated results by the non-interaction model and other empirical formulas.
Author Contributions
Funding
Institutional Review Board Statement
Informed Consent Statement
Data Availability Statement
Acknowledgments
Conflicts of Interest
References
- Crosta, G.B.; Agliardi, F. Parametric Evaluation of 3D Dispersion of Rockfall Trajectories. Nat. Hazards Earth Syst. Sci. 2004, 4, 583–598. [Google Scholar] [CrossRef]
- Guzzetti, F.; Reichenbach, P.; Wieczorek, G.F. Rockfall Hazard and Risk Assessment in the Yosemite Valley, California, USA. Nat. Hazards Earth Syst. Sci. 2003, 3, 491–503. [Google Scholar] [CrossRef]
- Li, L.; Sun, S.; Li, S.; Zhang, Q.; Hu, C.; Shi, S. Coefficient of Restitution and Kinetic Energy Loss of Rockfall Impacts. KSCE J. Civ. Eng. 2016, 20, 2297–2307. [Google Scholar] [CrossRef]
- Chau, K.T.; Wong, R.H.C.; Wu, J.J. Coefficient of Restitution and Rotational Motions of Rockfall Impacts. Int. J. Rock Mech. Min. Sci. 2002, 39, 69–77. [Google Scholar] [CrossRef]
- Ye, S.; Gong, S. Research on Normal Restitution Coefficient of Rockfall Collision by Model Tests. China Railw. Sci. 2015, 36, 13–19. [Google Scholar] [CrossRef]
- Asteriou, P.; Saroglou, H.; Tsiambaos, G. Geotechnical and Kinematic Parameters Affecting the Coefficients of Restitution for Rock Fall Analysis. Int. J. Rock Mech. Min. Sci. 2012, 54, 103–113. [Google Scholar] [CrossRef]
- Wang, Y.; Jiang, W.; Cheng, S.; Song, P.; Mao, C. Effects of the Impact Angle on the Coefficient of Restitution in Rockfall Analysis Based on a Medium-Scale Laboratory Test. Nat. Hazards Earth Syst. Sci. 2018, 18, 3045–3061. [Google Scholar] [CrossRef]
- Johnson, K.L. Contact Mechanics; Cambridge University Press: Cambridge, UK, 1985; ISBN 978-0-521-34796-9. [Google Scholar]
- Thornton, C. Coefficient of Restitution for Collinear Collisions of Elastic-Perfectly Plastic Spheres. J. Appl. Mech. 1997, 64, 383–386. [Google Scholar] [CrossRef]
- He, S.; Wu, Y.; Li, X. Research on Restitution Coefficient of Rock Fall. Rock Soil Mech. 2009, 30, 623–627. [Google Scholar] [CrossRef]
- Yang, H.; Zhou, X. A New Approach to Calculate Trajectory of Rockfall. Rock Soil Mech. 2009, 30, 3411–3416. [Google Scholar] [CrossRef]
- Zhang, G.; Tang, H.; Xiang, X.; Murat, K.; Wu, J. Theoretical Study of Rockfall Impacts Based on Logistic Curves. Int. J. Rock Mech. Min. Sci. 2015, 78, 133–143. [Google Scholar] [CrossRef]
- Ye, Y.; Zeng, Y.; Thoeni, K.; Giacomini, A. An Experimental and Theoretical Study of the Normal Coefficient of Restitution for Marble Spheres. Rock. Mech. Rock. Eng. 2019, 52, 1705–1722. [Google Scholar] [CrossRef]
- Ye, Y.; Zeng, Y.; Chen, X.; Sun, H.; Ma, W.; Peng, Z. Development of a Viscoelastoplastic Contact Model for the Size- and Velocity-Dependent Normal Restitution Coefficient of a Rock Sphere upon Impact. Comput. Geotech. 2021, 132, 104014. [Google Scholar] [CrossRef]
- Peng, B. Rockfall Trajectory Analysis: Parameter Determination and Application. Master’s Thesis, University of Canterbury, Christchurch, New Zealand, 2000. [Google Scholar]
- Labiouse, V.; Heidenreich, B. Half-Scale Experimental Study of Rockfall Impacts on Sandy Slopes. Nat. Hazards Earth Syst. Sci. 2009, 9, 1981–1993. [Google Scholar] [CrossRef]
- Aryaei, A.; Hashemnia, K.; Jafarpur, K. Experimental and Numerical Study of Ball Size Effect on Restitution Coefficient in Low Velocity Impacts. Int. J. Impact Eng. 2010, 37, 1037–1044. [Google Scholar] [CrossRef]
- Asteriou, P.; Tsiambaos, G. Effect of Impact Velocity, Block Mass and Hardness on the Coefficients of Restitution for Rockfall Analysis. Int. J. Rock Mech. Min. Sci. 2018, 106, 41–50. [Google Scholar] [CrossRef]
- Ji, Z.; Chen, Z.; Niu, Q.; Wang, T.; Song, H.; Wang, T. Laboratory Study on the Influencing Factors and Their Control for the Coefficient of Restitution during Rockfall Impacts. Landslides 2019, 16, 1939–1963. [Google Scholar] [CrossRef]
- Liao, X.; Ouyang, Q.; Liu, H.; Sun, J.; Wang, X.; Li, L.; Yang, Z.; Chen, Z. Experimental Study on Rockfall Mechanism of Platy Rock on a Complex Slope. Appl. Sci. 2020, 10, 2849. [Google Scholar] [CrossRef]
- Tang, J.; Zhou, X.; Liang, K.; Lai, Y.; Zhou, G.; Tan, J. Experimental Study on the Coefficient of Restitution for the Rotational Sphere Rockfall. Environ. Earth. Sci. 2021, 80, 419. [Google Scholar] [CrossRef]
- Zhao, L.; Jin, C.; Huang, D.; Lv, G.; Liu, L.; Dai, Q.; Huang, G. Rockfall Analysis Considering Coefficients of Restitution Based on Three-Dimensional Sphere Discontinuous Deformation Analysis. Bull. Eng. Geol. Environ. 2024, 83, 460. [Google Scholar] [CrossRef]
- Zhang, Y.; Liu, Z.; Shi, C.; Shao, J. Three-Dimensional Reconstruction of Block Shape Irregularity and Its Effects on Block Impacts Using an Energy-Based Approach. Rock. Mech. Rock. Eng. 2018, 51, 1173–1191. [Google Scholar] [CrossRef]
- Giacomini, A.; Thoeni, K.; Lambert, C.; Booth, S.; Sloan, S.W. Experimental Study on Rockfall Drapery Systems for Open Pit Highwalls. Int. J. Rock Mech. Min. Sci. 2012, 56, 171–181. [Google Scholar] [CrossRef]
- Wyllie, D.C. Calibration of Rock Fall Modeling Parameters. Int. J. Rock Mech. Min. Sci. 2014, 67, 170–180. [Google Scholar] [CrossRef]
- Zhang, G.; Xiang, X.; Tang, H. Field Test and Numerical Calculation of Restitution Coefficient of Rockfall Collision. Chin. J. Rock Mech. Eng. 2011, 30, 1266–1273. [Google Scholar]
- Duan, S.; Sun, J. Exploration of Probability Distribution of Velocities and Trajectory of Rolling Stone Based on Stochastic Rolling Stone Collision. Geotech. Geol. Eng. 2020, 38, 3931–3940. [Google Scholar] [CrossRef]
- Ji, Z.; Chen, T.; Wu, F.; Li, Z.; Niu, Q.; Wang, K. Assessment and Prevention on the Potential Rockfall Hazard of High-Steep Rock Slope: A Case Study of Zhongyuntai Mountain in Lianyungang, China. Nat. Hazards 2023, 115, 2117–2139. [Google Scholar] [CrossRef]
- Labiouse, V.; Descoeudres, F. Possibilities and Difficulties in Predicting Rockfall Trajectories. In Proceedings of the Japan-Swiss Seminar on Impact load by rock falls and design of protection structures, Kanazawa, Japan, 4 October 1999; pp. 29–36. [Google Scholar]
- Volkwein, A.; Schellenberg, K.; Labiouse, V.; Agliardi, F.; Berger, F.; Bourrier, F.; Dorren, L.K.A.; Gerber, W.; Jaboyedoff, M. Rockfall Characterisation and Structural Protection—A Review. Nat. Hazards Earth Syst. Sci. 2011, 11, 2617–2651. [Google Scholar] [CrossRef]
- Hu, J.; Li, S.; Li, L.; Shi, S.; Zhou, Z.; Liu, H.; He, P. Field, Experimental, and Numerical Investigation of a Rockfall above a Tunnel Portal in Southwestern China. Bull. Eng. Geol. Environ. 2018, 77, 1365–1382. [Google Scholar] [CrossRef]
- Wei, L.; Chen, H.; Lee, C.; Huang, W.; Lin, M.; Chi, C.; Lin, H. The Mechanism of Rockfall Disaster: A Case Study from Badouzih, Keelung, in Northern Taiwan. Eng. Geol. 2014, 183, 116–126. [Google Scholar] [CrossRef]
- Huang, R.; Liu, W.; Zhou, J.; Pei, X. Experimental Field Study of Movement Charateristics of Rock Blocks Falling down a Slope. J. Earth Sci. 2010, 21, 330–339. [Google Scholar] [CrossRef]
- Zhu, C.; He, M.; Karakus, M.; Zhang, X.; Guo, Z. The Collision Experiment between Rolling Stones of Different Shapes and Protective Cushion in Open-Pit Mines. J. Mt. Sci. 2021, 18, 1391–1403. [Google Scholar] [CrossRef]
- Liu, G.; Zhong, Z.; Ma, K.; Bo, W.; Zhao, P.; Li, Y.; Zhang, Z.; Zhang, P. Field Experimental Verifications of 3D DDA and Its Applications to Kinematic Evolutions of Rockfalls. Int. J. Rock Mech. Min. Sci. 2024, 175, 105687. [Google Scholar] [CrossRef]
- Wang, R.; Huang, J.; Liu, Q.; Wu, S.; Wu, J.; Ren, X.; Li, Y. The Effect of Particle Size and Mass Ratio on the Mechanical Response of Al/PTFE/SiC Composite with a 23 Factorial Design. RSC Adv. 2022, 12, 2810–2819. [Google Scholar] [CrossRef] [PubMed]
- Li, N.; Liu, X.; Zhou, J.; Li, Y.; Zhao, M. Analysis of Influence of Environmental Conditions on Ganoderic Acid Content: In Ganoderma Lucidum Using Orthogonal Design. J. Microbiol. Biotechn. 2006, 16, 1940–1946. [Google Scholar]
- Li, H.; Zhang, G.; Li, X.; Zhang, H.; Zhang, Q.; Liu, W.; Mu, G. Calibration of the Discrete Element Method Parameters in Living Juvenile Manila Clam (Ruditapes philippinarum) and Seeding Verification. AgriEngineering 2021, 3, 894–906. [Google Scholar] [CrossRef]
- PFV—Photron. Available online: https://photron.com/pfv/ (accessed on 25 March 2025).


| Material | Type | E/MPa | SH | υ | A |
|---|---|---|---|---|---|
| Slope surface | Concrete | 50.0 | 17.2 | 0.17 | 0.1295 |
| Wood | 35.0 | 16.0 | 0.20 | 0.1996 | |
| Sand | 15.0 | 11.3 | 0.25 | 0.3454 | |
| Turf | 7.8 | 6.6 | 0.24 | 0.4340 | |
| Falling rock | Granite | 94.6 | 44.7 | 0.15 | 0.7149 |
| Marble | 62.4 | 38.2 | 0.17 | 0.7979 | |
| Limestone | 37.3 | 36.1 | 0.22 | 0.8695 | |
| Sandstone | 19.6 | 30.7 | 0.25 | 1.0279 |
| Type | Actual Levels * | |||
|---|---|---|---|---|
| Shape factor of falling rock (η) | 1 | 1.167 | 1.242 | 1.390 |
| Material factor (Aslope), slope surface | 0.1295 | 0.1996 | 0.3454 | 0.4340 |
| Initial velocity (v/m·s−1) | 0 | 2 | 4 | 6 |
| Slope angle (θ/rad) | 0.5236 | 0.7853 | 1.0472 | 1.3090 |
| Material factor (Arock), rock type | 0.7149 | 0.7979 | 0.8695 | 1.0279 |
| Falling height (h/m) | 0.625 | 1.25 | 1.875 | 2.5 |
| Falling rock mass (m/kg) | 0.44 | 0.65 | 0.93 | 1.27 |
| Test Number | η | Aslope | v/m·s−1 | θ/rad |
|---|---|---|---|---|
| 1 | 1 | 0.1295 | 0 | 0.5236 |
| 2 | 1 | 0.3454 | 2 | 1.3090 |
| 3 | 1 | 0.4340 | 4 | 0.7853 |
| 4 | 1 | 0.1996 | 6 | 1.0472 |
| 5 | 1.167 | 0.1996 | 0 | 0.7853 |
| 6 | 1.167 | 0.4340 | 2 | 1.0472 |
| 7 | 1.167 | 0.3454 | 4 | 0.5236 |
| 8 | 1.167 | 0.1295 | 6 | 1.3090 |
| 9 | 1.242 | 0.3454 | 0 | 1.0472 |
| 10 | 1.242 | 0.1295 | 2 | 0.7853 |
| 11 | 1.242 | 0.1996 | 4 | 1.3090 |
| 12 | 1.242 | 0.4340 | 6 | 0.5236 |
| 13 | 1.390 | 0.4340 | 0 | 1.3090 |
| 14 | 1.390 | 0.1996 | 2 | 0.5236 |
| 15 | 1.390 | 0.1295 | 4 | 1.0472 |
| 16 | 1.390 | 0.3454 | 6 | 0.7853 |
| Explanatory Variables | Estimating Coefficients | Standard Error | t Values | p Values (Pr > |t|) | Significance |
|---|---|---|---|---|---|
| Intercept | 0.7286 | 0.0099 | 73.352 | <2 × 10⁻¹⁶ | *** |
| Falling rock shape | −0.4630 | 0.0247 | −18.713 | <2 × 10⁻¹⁶ | *** |
| Slope surface material | −0.3962 | 0.0453 | −8.748 | 7.68 × 10⁻¹³ | *** |
| Initial velocity | −0.3723 | 0.0296 | −12.571 | <2 × 10⁻¹⁶ | *** |
| Slope angle | 0.0783 | 0.0257 | 3.045 | 0.00328 | ** |
| Falling rock shape–slope surface material | 0.4945 | 0.0701 | 7.050 | 1.01 × 10⁻⁹ | *** |
| Falling rock shape–initial velocity | 0.3987 | 0.0648 | 6.144 | 4.36 × 10⁻⁸ | *** |
| Falling rock shape–slope angle | −0.1824 | 0.0418 | −4.367 | 4.27 × 10⁻⁵ | *** |
| Slope surface material–initial velocity | 0.2705 | 0.0809 | 3.345 | 0.001326 | ** |
| Falling rock shape–slope surface material–initial velocity | −0.4841 | 0.1258 | −3.847 | 0.000261 | *** |
| R2 = 0.9736 | |||||
| Estimation Methods | Falling Rock Shape | The Error Compared with the Experiment/% | ||
|---|---|---|---|---|
| Sphere | Prism | |||
| on-site experiment | 0.459 | 0.413 | 0 | 0 |
| multi-factor interaction model | 0.474 | 0.399 | 3.27 | 3.39 |
| non-interaction model | 0.574 | 0.474 | 25.05 | 14.77 |
| Peng [13] | 0.275 | / | 40.09 | / |
| Giacomini [22] | / | 0.116 | / | 71.91 |
| Wyllie [23] | 0.387 | / | 15.68 | / |
Disclaimer/Publisher’s Note: The statements, opinions and data contained in all publications are solely those of the individual author(s) and contributor(s) and not of MDPI and/or the editor(s). MDPI and/or the editor(s) disclaim responsibility for any injury to people or property resulting from any ideas, methods, instructions or products referred to in the content. |
© 2025 by the authors. Licensee MDPI, Basel, Switzerland. This article is an open access article distributed under the terms and conditions of the Creative Commons Attribution (CC BY) license (https://creativecommons.org/licenses/by/4.0/).
Share and Cite
Bi, R.; Han, Z. Experimental Investigation of the Normal Coefficient of Restitution in Rockfall Collisions: Influence and Interaction of Controlling Factors. Appl. Sci. 2025, 15, 3874. https://doi.org/10.3390/app15073874
Bi R, Han Z. Experimental Investigation of the Normal Coefficient of Restitution in Rockfall Collisions: Influence and Interaction of Controlling Factors. Applied Sciences. 2025; 15(7):3874. https://doi.org/10.3390/app15073874
Chicago/Turabian StyleBi, Ran, and Zhao Han. 2025. "Experimental Investigation of the Normal Coefficient of Restitution in Rockfall Collisions: Influence and Interaction of Controlling Factors" Applied Sciences 15, no. 7: 3874. https://doi.org/10.3390/app15073874
APA StyleBi, R., & Han, Z. (2025). Experimental Investigation of the Normal Coefficient of Restitution in Rockfall Collisions: Influence and Interaction of Controlling Factors. Applied Sciences, 15(7), 3874. https://doi.org/10.3390/app15073874