

Key Factors in the Continuance of Self-Service Technology and Its Mobile App Adoption—A Case Study of Convenience Stores in Taiwan †


Abstract
1. Introduction
2. Literature Review
2.1. Self-Service Technology (SST)
2.2. Integrative Model of Offline-Online Channels
2.2.1. From Online to Offline Services
2.2.2. Effects of Offline Satisfaction on Online Behavioral Processes
2.3. The Attributes of Technological Factors
2.3.1. System Service Quality
2.3.2. Perceived Convenience
2.3.3. Perceived Ubiquity
2.4. Research Framework and Hypothesis Development
3. Methodology
3.1. Data Collection
3.2. Research Instrument
- Perceived convenience: four items based on Collie et al. [60].
- Perceived ubiquity: four items based on Mallat et al. [61].
- Satisfaction: three items adapted from Wang [14].
- Attitude: three items adapted from Davis et al. [62].
- Offline continuance intention: three items adapted from Bhattacherjee [11].
- Online adoption intention: three items adapted from Venkatesh et al. [63].
4. Results
4.1. Measurement Assessment
4.2. Results of Structural Model
5. Discussion
5.1. Key Findings and Some Unsupported Hypotheses
5.2. Theoretical and Practical Implications
5.3. Limitations and Recommendations for Future Research
6. Conclusions
Author Contributions
Funding
Institutional Review Board Statement
Informed Consent Statement
Data Availability Statement
Acknowledgments
Conflicts of Interest
References
- Dai, C.L.; Chen, C.Y.; Wang, Z.; Chang, C.L. Always open, seven-eleven: Education targeting healthier food choices in a high convenience store density area in Taipei. Int. J. Child Health Nutr. 2022, 11, 72–79. [Google Scholar] [CrossRef]
- Hsiao, C.H.; Chang, J.J.; Wu, P.C.; Tang, K.Y. Borrowing books from a convenience store? An innovative library service. Libr. Hi Tech 2020, 38, 537–553. [Google Scholar]
- Hsiao, C.H.; Tang, K.Y. The role of internet media effects in the sustainable development of animal conservation institutions during the post-pandemic era: Stimulus-organism-response paradigm. Sustain. Dev. 2024, 32, 3786–3808. [Google Scholar]
- Chang, C.L.; Lai, S.C.; Chen, C.Y. Domain adaptation for roasted coffee bean quality inspection. Int. J. Eng. Technol. Innov. 2024, 14, 321–334. [Google Scholar]
- Watanabe, Y.; Anang, Y.; Takahashi, M. Quality model and quality characteristics evaluation suitable for software 2.0. Int. J. Eng. Technol. Innov. 2024, 14, 309–320. [Google Scholar]
- Vyt, D.; Jara, M.; Mevel, O.; Morvan, T.; Morvan, N. The impact of convenience in a click and collect retail setting: A consumer-based approach. Int. J. Prod. Econ. 2000, 248, 108491. [Google Scholar]
- Ognjanović, I.; Šendelj, R.; Daković-Tadić, M.; Kožuh, I. A longitudinal study on the adoption of cloud computing in micro, small, and medium enterprises in Montenegro. Appl. Sci. 2024, 14, 6387. [Google Scholar] [CrossRef]
- Tang, K.Y.; Hsiao, C.H.; Chen, M.C. A research survey of electronic commerce innovation: Evidence from the literature. Adv. Technol. Innov. 2019, 4, 247–259. [Google Scholar]
- Ratchford, B.; Soysal, G.; Zentner, A.; Gauri, D.K. Online and offline retailing: What we know and directions for future research. J. Retail. 2022, 98, 152–177. [Google Scholar]
- Hsiao, C.H. Does offline drive online?: A study of interconnected effects of technology attributes in self-service systems. In Proceedings of the 2017 Portland International Conference on Management of Engineering and Technology, Portland, OR, USA, 9–13 July 2017. [Google Scholar]
- Bhattacherjee, A. Understanding information systems continuance: An expectation-confirmation model. MIS Q. 2001, 23, 351–370. [Google Scholar] [CrossRef]
- Meuter, M.L.; Ostrom, A.L.; Roundtree, R.I.; Bitner, M.J. Self-service technologies: Understanding customer satisfaction with technology-based service encounters. J. Mark. 2000, 64, 50–64. [Google Scholar]
- Scherer, A.; Wünderlich, N.; von Wangenheim, F. The value of self-service: Long-term effects of technology-based self-service usage on customer retention. MIS Q. 2015, 39, 177–200. [Google Scholar] [CrossRef]
- Wang, M.C.H. Determinants and consequences of consumer satisfaction with self-service technology in a retail setting. Manag. Serv. Qual. 2012, 22, 128–144. [Google Scholar]
- Moon, H.Y.; Lee, B.Y. Self-service technologies (SSTs) in airline services: Multimediating effects of flow experience and SST evaluation. Int. J. Contemp. Hosp. Manag. 2022, 34, 2176–2198. [Google Scholar]
- Dabholkar, P.A.; Spaid, B.I. Service failure and recovery in using technology-based self-service: Effects on user attributions and satisfaction. Serv. Ind. J. 2012, 32, 1415–1432. [Google Scholar]
- Castillo-Manzano, J.I.; López-Valpuesta, L. Check-in services and passenger behaviour: Self service technologies in airport systems. Comput. Hum. Behav. 2013, 29, 2431–2437. [Google Scholar] [CrossRef]
- Gibson, S.; Hsu, M.K.; Zhou, X. Convenience stores in the digital age: A focus on the customer experience and revisit intentions. J. Retail. Consum. Serv. 2022, 68, 103014. [Google Scholar]
- Lee, H.J.; Lyu, J. Personal values as determinants of intentions to use self-service technology in retailing. Comput. Hum. Behav. 2016, 60, 322–332. [Google Scholar]
- Lao, A.; Vlad, M.; Martin, A. Exploring how digital kiosk customer experience enhances shopping value, self-mental imagery and behavioral responses. Int. J. Retail. Distrib. Manag. 2021, 49, 817–845. [Google Scholar] [CrossRef]
- Barann, B.; Betzing, J.H.; Niemann, M.; Hoffmeister, B.; Becker, J. Exploring customers’ likeliness to use e-service touchpoints in brick and mortar retail. Electron. Mark. 2022, 32, 523–545. [Google Scholar]
- Kwon, W.S.; Lennon, S.J. What induces online loyalty? Online versus offline brand images. J. Bus. Res. 2009, 62, 557–564. [Google Scholar]
- Shen, C.W.; Chen, M.; Wang, C.C. Analyzing the trend of O2O commerce by bilingual text mining on social media. Comput. Hum. Behav. 2019, 101, 474–483. [Google Scholar]
- Kim, Y.; Wang, Q.; Roh, T. Do information and service quality affect perceived privacy protection, satisfaction, and loyalty? Evidence from a Chinese O2O-based mobile shopping application. Telemat. Inform. 2021, 56, 101483. [Google Scholar]
- Lu, Y.; Cao, Y.; Wang, B.; Yang, S. A study on factors that affect users’ behavioral intention to transfer usage from the offline to the online channel. Comput. Hum. Behav. 2011, 27, 355–364. [Google Scholar]
- Kapil, K. Understanding customer loyalty in the online-to-offline (O2O) model by measuring emotion and cognition in the Indian context. Acad. Mark. Stud. J. 2022, 26, 1–12. [Google Scholar]
- Ward, M.R. Will online shopping compete more with traditional retailing or catalog shopping? Netnomics 2001, 3, 103–117. [Google Scholar]
- Herhausen, D.; Binder, J.; Schoegel, M.; Herrmann, A. Integrating bricks with clicks: Retailer-level and channel-level outcomes of online–offline channel integration. J. Retail. 2015, 91, 309–325. [Google Scholar]
- Valdez Cervantes, A.; Franco, A. Retailing technology: Do consumers care? Span. J. Mark. 2020, 24, 355–375. [Google Scholar]
- Flavián, C.; Gurrea, R.; Orús, C. Combining channels to make smart purchases: The role of webrooming and showrooming. J. Retail. Consum. Serv. 2020, 52, 101923. [Google Scholar]
- Oliver, R.L. Whence consumer loyalty? J. Mark. 1999, 63, 33–44. [Google Scholar]
- Cheema, A.; Papatla, P. Relative importance of online versus offline information for Internet purchases: Product category and Internet experience effects. J. Bus. Res. 2010, 63, 979–985. [Google Scholar] [CrossRef]
- Piercy, N.; Archer-Brown, C. Online service failure and propensity to suspend offline consumption. Serv. Ind. J. 2014, 34, 659–676. [Google Scholar] [CrossRef]
- Hsiao, C.H.; Chang, J.J.; Tang, K.Y. Exploring the influential factors in continuance usage of mobile social Apps: Satisfaction, habit, and customer value perspectives. Telemat. Inform. 2016, 33, 342–355. [Google Scholar] [CrossRef]
- Brady, M.K.; Cronin, J.J., Jr. Some new thoughts on conceptualizing perceived service quality: A hierarchical approach. J. Mark. 2001, 65, 34–49. [Google Scholar] [CrossRef]
- Roggeveen, A.L.; Grewal, D.; Schweiger, E.B. The DAST framework for retail atmospherics: The impact of in-and out-of-store retail journey touchpoints on the customer experience. J. Retail. 2020, 96, 128–137. [Google Scholar] [CrossRef]
- Wolfinbarger, M.; Gilly, M.C. eTailQ: Dimensionalizing, measuring and predicting etail quality. J. Retail. 2003, 79, 183–198. [Google Scholar] [CrossRef]
- Wixom, B.H.; Todd, P.A. A theoretical integration of user satisfaction and technology acceptance. Inf. Syst. Res. 2005, 16, 85–102. [Google Scholar] [CrossRef]
- Collier, J.E.; Sherrell, D.L. Examining the influence of control and convenience in a self-service setting. J. Acad. Mark. Sci. 2010, 38, 490–509. [Google Scholar] [CrossRef]
- Armstrong, G.; Adam, S.; Denize, S.; Kotler, P. Principles of Marketing; Pearson: Richmond, Australia, 2014. [Google Scholar]
- Deci, E.L.; Ryan, R.M. The support of autonomy and the control of behavior. J. Personal. Soc. Psychol. 1987, 53, 1024–1037. [Google Scholar] [CrossRef]
- Oppewal, H.; Tojib, D.R.; Louvieris, P. Experimental analysis of consumer channel-mix use. J. Bus. Res. 2013, 66, 2226–2233. [Google Scholar] [CrossRef]
- Junglas, I.; Watson, R.T. The u-constructs: Four information drives. Commun. Assoc. Inf. Syst. 2006, 17, 569–592. [Google Scholar] [CrossRef]
- Johnson, V.L.; Kiser, A.; Washington, R.; Torres, R. Limitations to the rapid adoption of M-payment services: Understanding the impact of privacy risk on M-Payment services. Comput. Hum. Behav. 2018, 79, 111–122. [Google Scholar] [CrossRef]
- Kaatz, C. Retail in my pocket–replicating and extending the construct of service quality into the mobile commerce context. J. Retail. Consum. Serv. 2020, 53, 101983. [Google Scholar] [CrossRef]
- Flavián, C.; Gurrea, R.; Orús, C. Feeling confident and smart with webrooming: Understanding the consumer’s path to satisfaction. J. Interact. Mark. 2019, 47, 1–15. [Google Scholar] [CrossRef]
- Montoya-Weiss, M.M.; Voss, G.B.; Grewal, D. Determinants of online channel use and overall satisfaction with a relational, multichannel service provider. J. Acad. Mark. Sci. 2003, 31, 448–458. [Google Scholar] [CrossRef]
- Oliver, R.L. Measurement and evaluation of satisfaction processes in retail settings. J. Retail. 1981, 57, 25–48. [Google Scholar]
- Dabholkar, P.A.; Shepherd, C.D.; Thorpe, D.I. A comprehensive framework for service quality: An investigation of critical conceptual and measurement issues through a longitudinal study. J. Retail. 2000, 76, 139–173. [Google Scholar] [CrossRef]
- Orel, F.D.; Kara, A. Supermarket self-checkout service quality, customer satisfaction, and loyalty: Empirical evidence from an emerging market. J. Retail. Consum. Serv. 2014, 21, 118–129. [Google Scholar] [CrossRef]
- Prassida, G.F.; Hsu, P.Y.; Chang, Y.W. Understanding how O2O service synergies drive customer continuance intention: A study of OTAs and hotels. Asia Pac. J. Tour. Res. 2021, 26, 1139–1155. [Google Scholar] [CrossRef]
- Lien, C.H.; Cao, Y.; Zhou, X. Service quality, satisfaction, stickiness, and usage intentions: An exploratory evaluation in the context of WeChat services. Comput. Hum. Behav. 2017, 68, 403–410. [Google Scholar] [CrossRef]
- Downs, A. A theory of consumer efficiency. J. Retail. 1961, 37, 6–12. [Google Scholar]
- Balasubramanian, S. Mail versus mall: A strategic analysis of competition between direct marketers and conventional retailers. Mark. Sci. 1998, 17, 181–195. [Google Scholar]
- Chintagunta, P.K.; Chu, J.; Cebollada, J. Quantifying transaction costs in online/offline grocery channel choice. Mark. Sci. 2012, 31, 96–114. [Google Scholar]
- Shaw, N.; Eschenbrenner, B.; Brand, B.M. Towards a mobile app diffusion of Innovations model: A multinational study of mobile wallet adoption. J. Retail. Consum. Serv. 2022, 64, 102768. [Google Scholar] [CrossRef]
- Kusmiyati, L.; Priyono, A. The strategy for combining online and offline business model for MSMEs. Int. J. Res. Bus. Soc. Sci. 2021, 10, 406–419. [Google Scholar]
- Jiang, J.J.; Klein, G.; Carr, C.L. Measuring information system service quality: SERVQUAL from the other side. MIS Q. 2002, 26, 145–166. [Google Scholar]
- Negash, S.; Ryan, T.; Igbaria, M. Quality and effectiveness in web-based customer support systems. Inf. Manag. 2003, 40, 757–768. [Google Scholar] [CrossRef]
- Collier, J.E.; Moore, R.S.; Horky, A.; Moore, M.L. Why the little things matter: Exploring situational influences on customers’ self-service technology decisions. J. Bus. Res. 2015, 68, 703–710. [Google Scholar]
- Mallat, N.; Rossi, M.; Tuunainen, V.K.; Öörni, A. The impact of use context on mobile services acceptance: The case of mobile ticketing. Inf. Manag. 2009, 46, 190–195. [Google Scholar]
- Davis, F.D.; Bagozzi, R.P.; Warshaw, P.R. Extrinsic and intrinsic motivation to use computers in the workplace. J. Appl. Soc. Psychol. 1992, 22, 1111–1132. [Google Scholar] [CrossRef]
- Venkatesh, V.; Morris, M.G.; Davis, G.B.; Davis, F.D. User acceptance of information technology: Toward a unified view. MIS Q. 2003, 27, 425–478. [Google Scholar]
- Anderson, J.C.; Gerbing, D.W. Structural equation modeling in practice: A review and recommended two-step approach. Psychol. Bull. 1988, 103, 411–423. [Google Scholar] [CrossRef]
- Nunnally, J.C.; Bernstein, I.H. Psychometric Theory; McGraw-Hill: New York, NY, USA, 1994. [Google Scholar]
- Fornell, C.; Larcker, D.F. Evaluating structural equation models with unobservable variables and measurement error. J. Mark. Res. 1981, 18, 39–50. [Google Scholar]
- Hair, J.F.J.; Black, W.C.; Babin, B.J.; Anderson, R.E. Multivariate Data Analysis, 8th ed.; Cengage Learning: Andover, MA, USA, 2019. [Google Scholar]
- Henseler, J. Why generalized structured component analysis is not universally preferable to structural equation modeling. J. Acad. Mark. Sci. 2012, 40, 402–413. [Google Scholar]
- Awang, Z. SEM Made Simple: A Gentle Approach to Learning Structural Equation Modelling; MPWS Rich Publication: Bangi, Malaysia, 2015. [Google Scholar]
- Podsakoff, P.M.; MacKenzie, S.B.; Lee, J.Y.; Podsakoff, N.P. Common method biases in behavioral research: A critical review of the literature and recommended remedies. J. Appl. Psychol. 2003, 88, 879–903. [Google Scholar]
- Kock, N.; Lynn, G. Lateral collinearity and misleading results in variance-based SEM: An illustration and recommendations. J. Assoc. Inf. Syst. 2012, 13, 546–580. [Google Scholar]
- Hair, J.F.; Risher, J.J.; Sarstedt, M.; Ringle, C.M. When to use and how to report the results of PLS-SEM. Eur. Bus. Rev. 2019, 31, 2–24. [Google Scholar]


| Characteristics | Number | Percentage (%) |
|---|---|---|
| Gender | ||
| Male | 201 | 55.8 |
| Female | 159 | 44.2 |
| Age | ||
| Under 19 | 54 | 15.0 |
| 20–25 | 289 | 80.3 |
| 26–30 | 11 | 3.1 |
| Over 31 | 6 | 1.7 |
| How often to 7–11? | ||
| 1–2 days | 199 | 55.3 |
| 3–4 days | 92 | 25.6 |
| 5–6 days | 37 | 10.3 |
| Over 7 days | 32 | 8.9 |
| Number of times to use ibon (per week) | ||
| Less than once | 109 | 30.3 |
| 1 | 185 | 51.4 |
| 2 | 30 | 8.3 |
| More than 3 times | 36 | 10.0 |
| Construct | Loading |
|---|---|
| Physical System Service Quality (PSQ) | |
| Adapted from Jiang et al. [55]; Negash et al. [56]; α = 0.95; CR = 0.95; AVE = 0.79. | |
| PSQ1. The ibon kiosk interface enables me to quickly operate various functions. | 0.83 |
| PSQ2. The ibon kiosk and its various services fully meet my needs. | 0.87 |
| PSQ3. The ibon kiosk provides me with a variety of alternatives for solving my problems. | 0.95 |
| PSQ4. The ibon kiosk has a user-friendly interface. | 0.91 |
| PSQ5. The ibon kiosk provides prompt service to users. | 0.89 |
| Perceived Convenience (PC) | |
| Adapted from Collie et al. [60]; α = 0.93; CR = 0.93; AVE = 0.76. | |
| PC1. Having an ibon kiosk in a convenience store that enables me to easily initiate a transaction is important to me. | 0.91 |
| PC2. A convenient location makes me feel more comfortable using ibon kiosk services. | 0.93 |
| PC3. The location of the convenience store affects my decision to use its ibon kiosk. | 0.75 |
| PC4. Using an ibon kiosk makes my service transaction less time-consuming. | 0.89 |
| Virtual System Service Quality (VSQ) | |
| Adapted from Jiang et al. [58]; Negash et al. [59]; α = 0.95; CR = 0.94; AVE = 0.75. | |
| VSQ1. The ibon kiosk interface enables me to quickly operate various functions. | 0.88 |
| VSQ2. The ibon kiosk and its various services fully meet my needs. | 0.92 |
| VSQ3. The ibon kiosk provides me with a variety of alternatives for solving my problems. | 0.92 |
| VSQ4. The ibon kiosk has a user-friendly interface. | 0.90 |
| VSQ5. The ibon kiosk provides prompt service to users. | 0.68 |
| Physical System Service Quality (PSQ) | |
| Adapted from Jiang et al. [58]; Negash et al. [59]; α = 0.95; CR = 0.95; AVE = 0.79. | |
| PSQ1. The ibon kiosk interface enables me to quickly operate various functions. | 0.83 |
| PSQ2. The ibon kiosk and its various services fully meet my needs. | 0.87 |
| PSQ3. The ibon kiosk provides me with a variety of alternatives for solving my problems. | 0.95 |
| PSQ4. The ibon kiosk has a user-friendly interface. | 0.91 |
| PSQ5. The ibon kiosk provides prompt service to users. | 0.89 |
| Perceived Convenience (PC) | |
| Adapted from Collie et al. [60]; α = 0.93; CR = 0.93; AVE = 0.76. | |
| PC1. Having an ibon kiosk in a convenience store that enables me to easily initiate a transaction is important to me. | 0.91 |
| PC2. A convenient location makes me feel more comfortable using ibon kiosk services. | 0.93 |
| PC3. The location of the convenience store affects my decision to use its ibon kiosk. | 0.75 |
| PC4. Using an ibon kiosk makes my service transaction less time-consuming. | 0.89 |
| Virtual System Service Quality (VSQ) | |
| Adapted from Jiang et al. [58]; Negash et al. [59]; α = 0.95; CR = 0.94; AVE = 0.75. | |
| VSQ1. The ibon kiosk interface enables me to quickly operate various functions. | 0.88 |
| VSQ2. The ibon kiosk and its various services fully meet my needs. | 0.92 |
| VSQ3. The ibon kiosk provides me with a variety of alternatives for solving my problems. | 0.92 |
| VSQ4. The ibon kiosk has a user-friendly interface. | 0.90 |
| VSQ5. The ibon kiosk provides prompt service to users. | 0.68 |
| Perceived Ubiquity (PU) | |
| Adapted from Mallat et al. [61]; α = 0.93; CR = 0.93; AVE = 0.78. | |
| PU1. Using ibon app services on my mobile phone reduces queuing time. | 0.85 |
| PU2. Using ibon app services on my mobile phone is independent of time. | 0.91 |
| PU3. Using ibon app services on my mobile phone is independent of place. | 0.91 |
| PU4. Using ibon app services on my mobile phone is convenient because I usually have my phone with me. | 0.85 |
| Satisfaction (SA) | |
| Adapted from Wang [14]; α = 0.95; CR = 0.94; AVE = 0.75. | |
| SA1. I am satisfied with the ibon kiosk installed at my convenience store. | 0.87 |
| SA2. The ibon kiosk installed by the firm exceeded my expectations. | 0.70 |
| SA3. My experience of using ibon kiosk has been satisfactory. | 0.83 |
| Attitude (AT) | |
| Adapted from Davis et al. [62]; α = 0.93; CR = 0.94; AVE = 0.85. | |
| AT1. I think that using the ibon app is a good idea. | 0.92 |
| AT2. I think using the ibon app is beneficial to me. | 0.94 |
| AT3. I have a positive perception of using the ibon app. | 0.90 |
| Continuance Intention (CI) | |
| Adapted from Bhattacherjee [11]; α = 0.95; CR = 0.95; AVE = 0.86. | |
| CI1. I intend to continue using ibon kiosk for service transactions in the future. | 0.93 |
| CI2. I will regularly use ibon kiosk for service transactions in the future. | 0.94 |
| CI3. I intend to use ibon kiosk in my daily life. | 0.91 |
| Adoption Intention (AI) | |
| Adapted from Venkatesh et al. [63]; α = 0.95; CR = 0.95; AVE = 0.87. | |
| AI1. I intend to use the ibon app in the future. | 0.92 |
| AI2. I intend to use the ibon app in my daily life. | 0.94 |
| AI3. I plan to use the ibon app frequently. | 0.94 |
| Means | S.D. | PSQ | PC | VSQ | PU | SA | AT | CI | AI | |
|---|---|---|---|---|---|---|---|---|---|---|
| PSQ | 5.23 | 1.29 | 0.79 | 0.53 | 0.38 | 0.32 | 0.50 | 0.35 | 0.55 | 0.25 |
| PC | 5.38 | 1.36 | 0.73 | 0.76 | 0.24 | 0.26 | 0.62 | 0.24 | 0.67 | 0.12 |
| VSQ | 4.83 | 1.26 | 0.62 | 0.49 | 0.75 | 0.53 | 0.24 | 0.58 | 0.26 | 0.34 |
| PU | 4.80 | 1.33 | 0.57 | 0.51 | 0.73 | 0.78 | 0.23 | 0.56 | 0.25 | 0.29 |
| SA | 5.09 | 1.21 | 0.71 | 0.79 | 0.49 | 0.48 | 0.75 | 0.22 | 0.67 | 0.15 |
| AT | 4.98 | 1.30 | 0.59 | 0.49 | 0.76 | 0.75 | 0.47 | 0.85 | 0.22 | 0.45 |
| CI | 5.35 | 1.42 | 0.74 | 0.82 | 0.51 | 0.50 | 0.82 | 0.47 | 0.86 | 0.13 |
| AI | 4.70 | 1.47 | 0.50 | 0.35 | 0.58 | 0.54 | 0.39 | 0.67 | 0.36 | 0.87 |
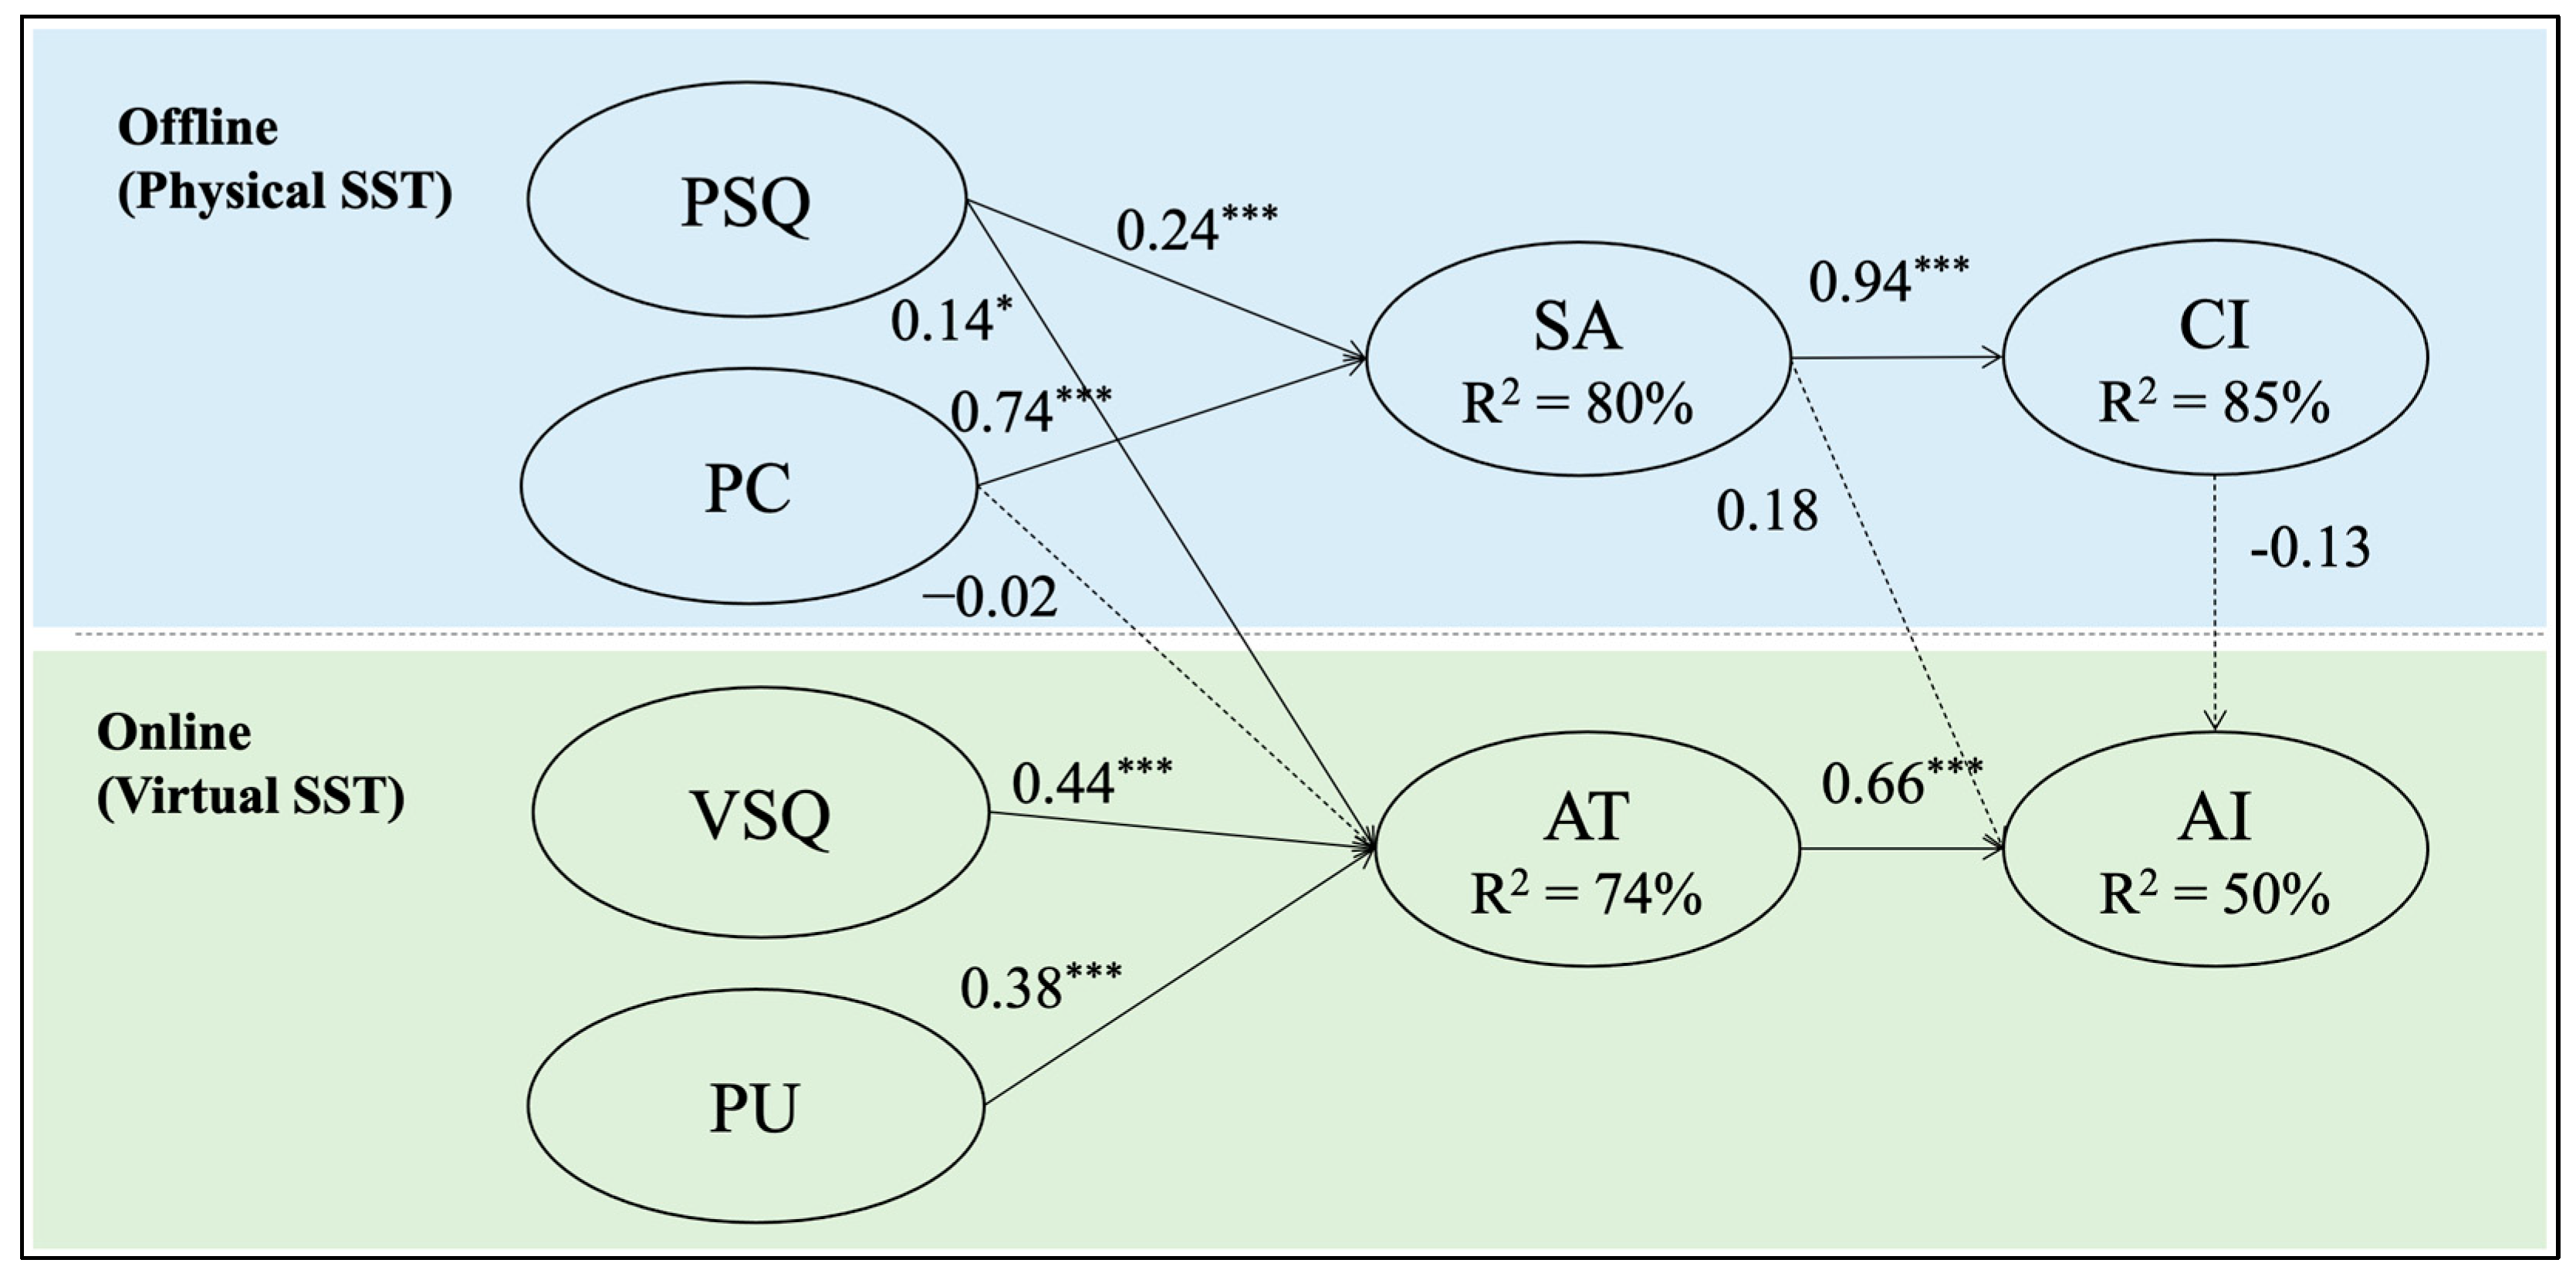
| Hypothesis | Path | β | t-Value | Result |
|---|---|---|---|---|
| H1 | CI → AI | −0.13 | −0.73 | not significant |
| H2a | SA → CI | 0.94 *** | 22.34 | supported |
| H2b | SA → AI | 0.18 | 1.00 | not significant |
| H3 | AT → AI | 0.66 *** | 12.29 | supported |
| H4a | PSQ → SA | 0.24 *** | 5.13 | supported |
| H4b | PSQ → AT | 0.14 * | 2.33 | supported |
| H5 | VSQ → AT | 0.44 *** | 7.47 | supported |
| H6a | PC → SA | 0.74 *** | 12.93 | supported |
| H6b | PC → AT | −0.02 | −1.13 | not significant |
| H7 | PU → AT | 0.38 *** | 6.62 | supported |
Disclaimer/Publisher’s Note: The statements, opinions and data contained in all publications are solely those of the individual author(s) and contributor(s) and not of MDPI and/or the editor(s). MDPI and/or the editor(s) disclaim responsibility for any injury to people or property resulting from any ideas, methods, instructions or products referred to in the content. |
© 2025 by the authors. Licensee MDPI, Basel, Switzerland. This article is an open access article distributed under the terms and conditions of the Creative Commons Attribution (CC BY) license (https://creativecommons.org/licenses/by/4.0/).
Share and Cite
Hsiao, C.-H.; Tang, K.-Y. Key Factors in the Continuance of Self-Service Technology and Its Mobile App Adoption—A Case Study of Convenience Stores in Taiwan. Appl. Sci. 2025, 15, 3804. https://doi.org/10.3390/app15073804
Hsiao C-H, Tang K-Y. Key Factors in the Continuance of Self-Service Technology and Its Mobile App Adoption—A Case Study of Convenience Stores in Taiwan. Applied Sciences. 2025; 15(7):3804. https://doi.org/10.3390/app15073804
Chicago/Turabian StyleHsiao, Chun-Hua, and Kai-Yu Tang. 2025. "Key Factors in the Continuance of Self-Service Technology and Its Mobile App Adoption—A Case Study of Convenience Stores in Taiwan" Applied Sciences 15, no. 7: 3804. https://doi.org/10.3390/app15073804
APA StyleHsiao, C.-H., & Tang, K.-Y. (2025). Key Factors in the Continuance of Self-Service Technology and Its Mobile App Adoption—A Case Study of Convenience Stores in Taiwan. Applied Sciences, 15(7), 3804. https://doi.org/10.3390/app15073804