Article

Comprehensive Analysis of Deposition Parameters and Energy-Dispersive X-Ray Spectroscopy Characterization in Cataphoretic Coating Processes

1
Faculty of Manufacturing Technologies with a Seat in Prešov, Technical University of Kosice, Štúrova St. 31, 080 01 Prešov, Slovakia
2
Faculty of Mechanical Engineering, University of West Bohemia Pilsen, Univerzitní 8, 306 14 Plzeň, Czech Republic
*
Author to whom correspondence should be addressed.
Appl. Sci. 2025, 15(7), 3760; https://doi.org/10.3390/app15073760
Submission received: 30 January 2025 / Revised: 27 February 2025 / Accepted: 27 March 2025 / Published: 29 March 2025
(This article belongs to the Special Issue Advanced Digital Design and Intelligent Manufacturing)

Abstract

:
This research examines the inter-relationship between the deposition time, degreasing temperature, and applied voltage in the cataphoretic painting process, focusing on their cumulative effects on the thickness of the formed layers. A series of experiments was conducted, systematically varying deposition time effects through voltage levels (200 V to 300 V) and degreasing temperatures (40 °C to 80 °C). The results demonstrate that the maximum layer thickness is achieved at longer cataphoretic times, with significant thickness increments observed at optimal voltage levels. Conversely, the study reveals that lower degreasing temperatures lead to increased layer thickness, while elevated temperatures tend to diminish it. Notably, the thickness variations are consistent across different voltage applications, with a discernible threshold at which the layer thickness stabilizes. Additionally, energy-dispersive X-ray spectroscopy (EDX) was utilized to characterize the elemental composition of the cataphoretic layer, providing deeper insights into the coating structure and its relationship to process parameters. This work provides valuable insights into the optimization of cataphoretic processes, offering a framework for enhancing the quality and uniformity of coatings in industrial applications. The findings underscore the importance of the precise control over process parameters to achieve the desired material characteristics, thereby advancing the field of surface engineering and coating technologies.

1. Introduction

Surface treatment is one of the critical aspects of the manufacturing process that fundamentally affects the quality, functionality, and durability of the final product. For this reason, it is essential that this phase is carried out with a high degree of precision and expertise. A thorough and high-quality surface treatment ensures the long-term durability of the material and its reliability in use. Surface treatments provide protection against mechanical damage, weathering, and increased adhesion to other materials. The detrimental impact of metal corrosion on the economy, the environment, and safety requires urgent preventive measures [1,2,3]. The use of organic coatings on metal surfaces has been shown to effectively retard the corrosion process, preventing the metal from encountering corrosive media. However, the effectiveness of these coatings is influenced by various parameters, including the intrinsic nature of the coatings themselves, the continuity of the coating phase, and the thickness of the coatings applied [4]. These parameters are not easily controlled by traditional methods, such as spraying the solution, dipping, or brushing. Consequently, the parameters in question could be controlled by the electrophoretic deposition (EPD) method, which has been used to prepare coatings of controllable thickness at the electrode by applying a DC electric field between the cathode and the anode. The EPD process can be divided into two distinct types, cathodic and anodic deposition, depending on the nature of the materials to be deposited [5]. For corrosion resistance purposes, cathodic deposition has advantages over anodic deposition. In anodic electrodeposition, the inevitable electrolysis of water in the anode, which produces hydrogen ions and oxygen, weakens the effectiveness of corrosion protection [6]. Recently, the use of nanoparticles as inorganic nanofillers in polymeric protective coatings has attracted special attention because of their unique barrier properties. The homogeneous dispersion of nanoparticles is a key factor in the preparation of polymer nanocomposites.
A study by Zivkovic [7] investigated the effect of cerium and zirconium nanoparticles on the corrosion resistance of cataphoretic epoxy coatings on AA 6060 alloy. The properties of the coatings were analyzed by various spectroscopic and microscopic techniques, while the corrosion stability was evaluated by electrochemical impedance spectroscopy in NaCl solution. The results confirmed the importance of cataphoretic electro spraying as an effective corrosion protection method [8]. Cataphoretic electrodeposition is a widespread technique used in many fields, especially in the automotive industry, to protect the body of automobiles [9]. Manufacturers of organic coatings for the automotive industry test new products and materials according to production parameters to verify their properties before mass production. The key is selecting the appropriate test to differentiate between similar coatings and provide results in a short time. Accelerated ageing tests are used to predict the durability of coatings to speed up development. To improve the adhesion and corrosion protection of cataphoretic coatings, metal substrates are commonly subjected to surface pretreatment.
Research by Zanello [10] has focused on the relationship between the electrochemical properties of metal substrates and the properties of electrophoretic clear coatings. The study investigated three types of substrates: active (bare steel), passive (nickel), and noble (gold). The aim was to determine whether the electrochemical behavior of the substrate influences coating properties, such as barrier properties, adhesion, and water absorption. The results showed that the properties of the coating are influenced by the type of substrate and its electrochemical behavior. Another study investigated the effect of graphene filler and thermochromic pigments on cataphoretic acrylic coatings. The combination was found to improve abrasion resistance and aesthetic stability after UV-B exposure but negatively affect corrosion protection. Research has revealed both positive and negative effects of this synergy [11]. The cataphoretic deposition of coatings allows even complex surfaces to be evenly covered due to electrostatic attraction. The process is highly efficient, with minimal material loss (below 10%), low environmental impact, and low emissions.
A study by Darowicki [12] presents a method for the on-line monitoring of the cataphoretic coating process using dynamic electrochemical impedance spectroscopy (DEIS). This technique overcomes the limitations of classical impedance spectroscopy for non-steady-state processes, allowing them to monitor impedance changes during deposition and to estimate the time to reach steady state after polarization switch-off. DEIS offers the potential to improve real-time process control and optimization. Sternadel’s [13] work describes those electrophoretic paints, also known as cataphoretic coatings, organic coatings that dissolve in water. These coatings have an electrical charge, which allows them to be applied to metal surfaces [14]. This process considers the opposite electrical charge of the metal sample, which affects the coating formulation [15,16]. Cataphoretic deposition represents a modern technology that produces durable and resistant surfaces. These corrosion-resistant surfaces not only meet customer expectations in terms of aesthetic appearance but also increase efficiency and meet environmental standards. These results are the result of a century of experience and research and the refinement of techniques that have also led to their theoretical evaluation. Cataphoretic deposition uses electrophoretic coatings or paints that are applied to surfaces. These coatings are of organic origin, dispersed in water, and carry an electrical charge. The process allows them to be deposited on metal surfaces with an opposite charge, thus providing effective and uniform coverage [17,18,19,20]. The preparation of the material surface prior to cataphoretic deposition is considered to be both a crucial and challenging phase of anticorrosion technology, involving processes such as degreasing and zinc phosphating [21]. Zinc, known for its cost-effectiveness, is an important element used in the production of anticorrosion coatings (Zn, Cu, Ni, Cr) [22], while the deposition of zinc coatings requires only minimal financial investment [23].
The optimization of the cataphoretic painting process is imperative for several fundamental reasons, which considerably enhance manufacturing efficiency and product quality. The uniformity thus achieved is of critical importance in meeting the stringent industrial engineering standards and customer requirements. Furthermore, the optimization of the process contributes to environmental sustainability by minimizing waste and energy use. A well-optimized process fosters innovation, strengthens competitive advantage, and enhances customer satisfaction through the reliable and timely delivery of high-quality products. The authors of this study acknowledge its significance in advancing the methodology for cataphoretic painting, leading to the formation of an anticorrosion layer.

2. Materials and Methods

2.1. Material Selection—VDA 239-100 CR4

The choice of material plays a pivotal role in investigations that necessitate exceptional surface integrity and meticulous specimen preparation, especially within the framework of complex experimental methodologies. For materials adhering to standards such as “VDA 239-100 CR4”, which prescribes the performance criteria for cold-rolled sheet steel commonly utilized in automotive applications, the uniformity of material properties is imperative to guarantee the precision and reproducibility of experimental findings.
The material selected for the designed experiment (DoE) is CR4 steel (Table 1), classified as a cold-rolled low-carbon steel in accordance with the VDA 239-100 standard [24]. This steel grade, conforming to the specifications of DIN EN 10130 [25], particularly grades DC05 and DC06, is characterized by high ductility, low strength, and an optimal strength-to-use ratio. These properties render it highly suitable for applications requiring intricate forming processes, such as those in the automotive and general industrial sectors. Furthermore, CR4 steel is ideal for producing body panels and components demanding high surface quality and precise dimensional accuracy.
Its surface properties and uniform composition make it particularly advantageous for the cataphoretic painting process, as it ensures consistent adhesion of the coating layer and uniform thickness distribution. The material’s attributes also make it an optimal candidate for use in the design of experiments (DoEs) [26], as its predictable behavior under controlled conditions allows for the reliable investigation of the effects of process parameters on coating quality. The specimen dimensions, as specified in the Chemcore compendium, were determined to be 105 mm × 190 mm with a thickness of 0.80 mm.

2.2. Experimental Conditions

2.2.1. Sample Preparation

The experiment includes 88 samples, with samples 83 and 84 having different preparation (no degreasing and activation/phosphating steps). Sample preparation was carried out in KTL s.r.o., Prešov, Slovakia with the participation of the managing director. The material was cleaned of impurities by degreasing with Pragolod 57 N prior to coating application, with temperature, concentration, and time influencing the efficiency of the process (Table 2).
After degreasing, the samples were rinsed with demineralized water. They were then subjected to an activation process on an automated line where the crystalline structure of the material was modified, improving the ability to bind phosphate layers. Phosphating was carried out in accordance with internal standards, with the samples being exposed to the phosphate solution for three and seven minutes. The phosphating was followed by further rinsing, and the samples were prepared for cataphoretic coating. Parameters such as temperature, voltage, and current were monitored throughout the process. The coating was applied in the range of 15–30 μm to achieve the desired corrosion protection. After rinsing, the specimens underwent the polymerization process in the oven, while the temperature and time were monitored.

2.2.2. The Process of Cataphoretic Coating

Cataphoretic coating is one of two methods of electrophoretic coating, the other being anaphoresis. The cataphoretic process uses cationic coatings, which are water soluble and based on epoxies or acrylic resins with very low organic solvent content (about 2%). These coatings contain paint particles in the form of polymer cations. During coating, the product is immersed in the coating solution and attached as a cathode. By means of a direct current between the cathode (the object to be painted) and the anode, an electric field is created, which causes the polycations to move towards the cathode. On its surface, these cations react with hydroxyl ions from water, causing their exclusion on the surface of the object in the form of a coating. As the thickness of the layer increases, the resistance of the coating increases, reducing the rate of further paint deposition, causing this process to take place mainly in areas of lesser layer thickness, i.e., hard-to-reach areas, such as corners, edges, or cavities. This mechanism ensures that the coating is uniform over the entire surface, even in areas that are harder to reach. Once the desired coating thickness is reached, the shedding stops. The thickness of the coating depends primarily on the tension being applied and is usually between 15 and 30 μm. Once the process is complete, the excess varnish is rinsed off, and the coating formed must be fired at temperatures between 155 and 180 °C, which leads to polymerization and guarantees the final properties [27]. The parameters influencing the coating thickness and uniformity are further analyzed in relation to the planned experiment, as referenced in Table 3, which presents the values of input variable factors.

2.3. Measurement Methods

The Elcometer 456 is a non-destructive device that can be utilized to measure dry film thickness on ferromagnetic and non-ferromagnetic materials with a high degree of accuracy. This instrument has been shown to provide rapid measurements within a range of ±1% of the target value. The Elcometer 456 complies with the relevant industry standards, but calibration prior to use is necessary to ensure optimal performance and accuracy. The T456CF1S flat ferromagnetic probe measures non-magnetic coatings on magnetic substrates in the range of 0–1500 µm with an accuracy of ±1–3% or ±2.5 µm. The instrument is used in quality control, surface treatment, and manufacturing. Elcometer Ltd. is a leading manufacturer of high-quality instruments for non-destructive testing, inspection, and measurement. The company is headquartered in Manchester, UK.
Three-dimensional printing technology was used to fabricate a device that ensured precise and quick measurements at consistent points on each sample (Figure 1B). Data were collected in four rows and eight columns, with each point measured five times for accuracy. A control measurement with a standard film thickness of 24.1 µm was conducted, resulting in 192 measurements per sample. The measurements followed the standard “Coating substances, determination of coating thickness STN EN 2808:2019” [28].

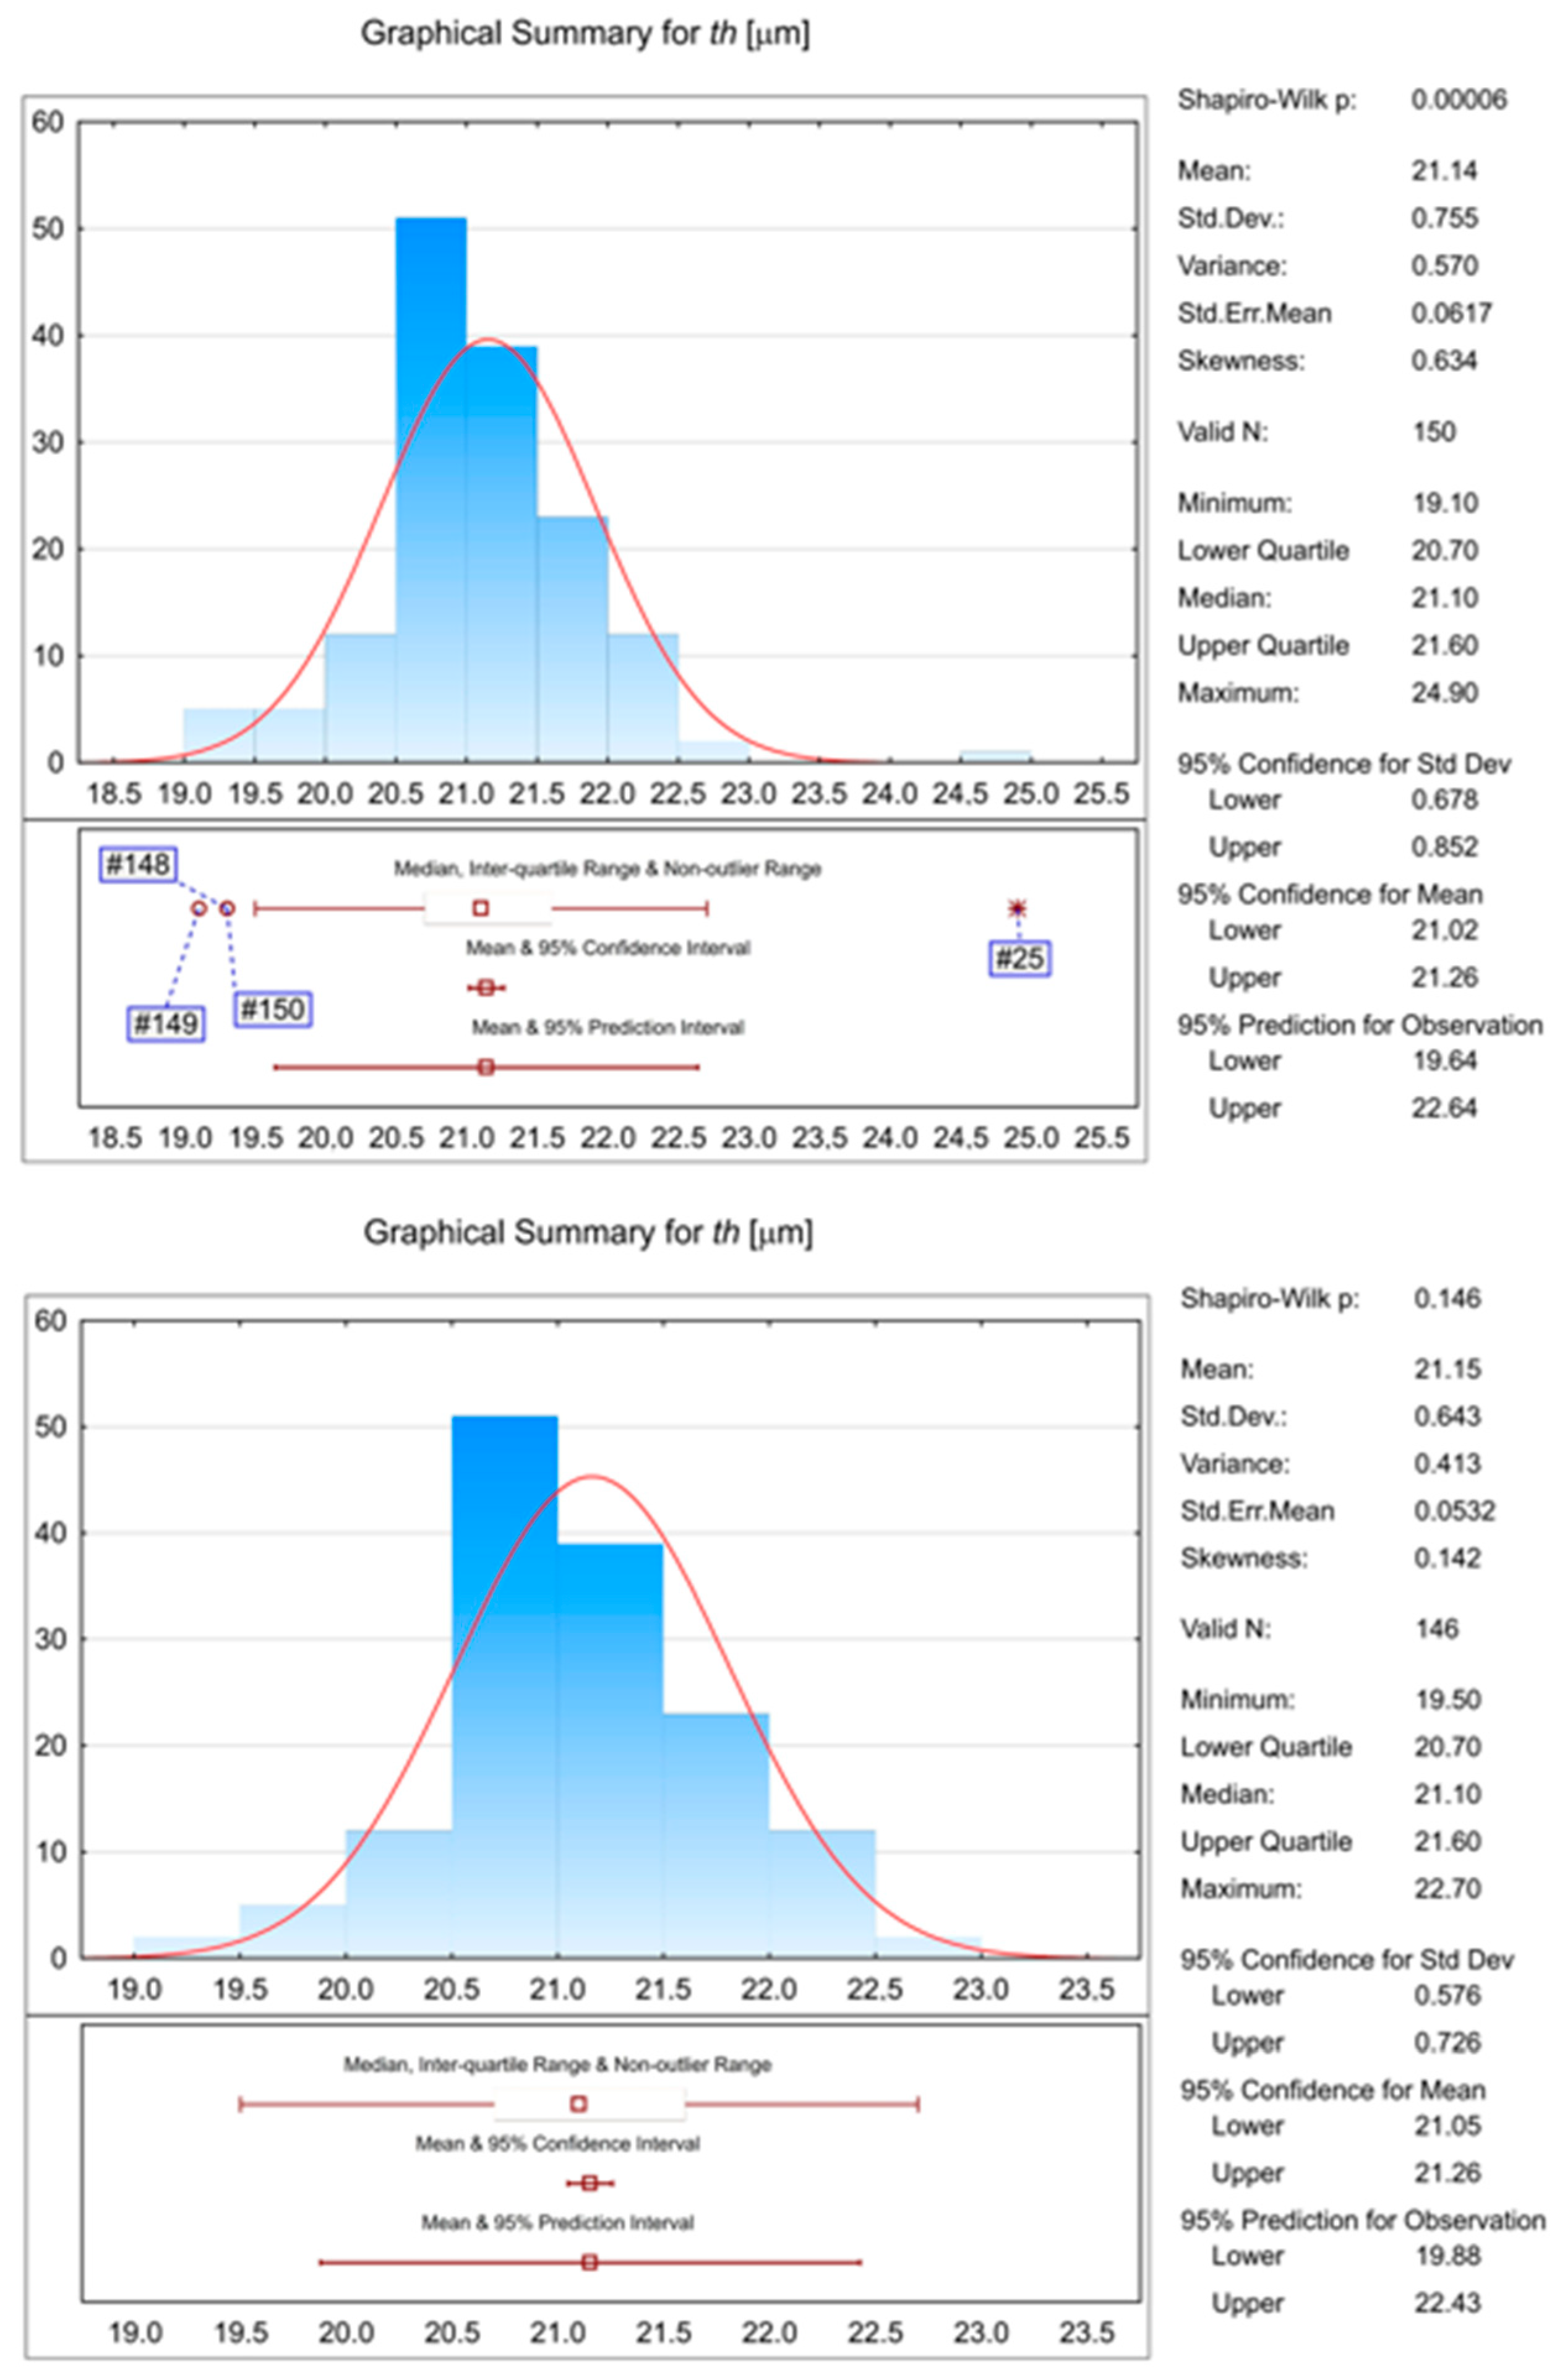
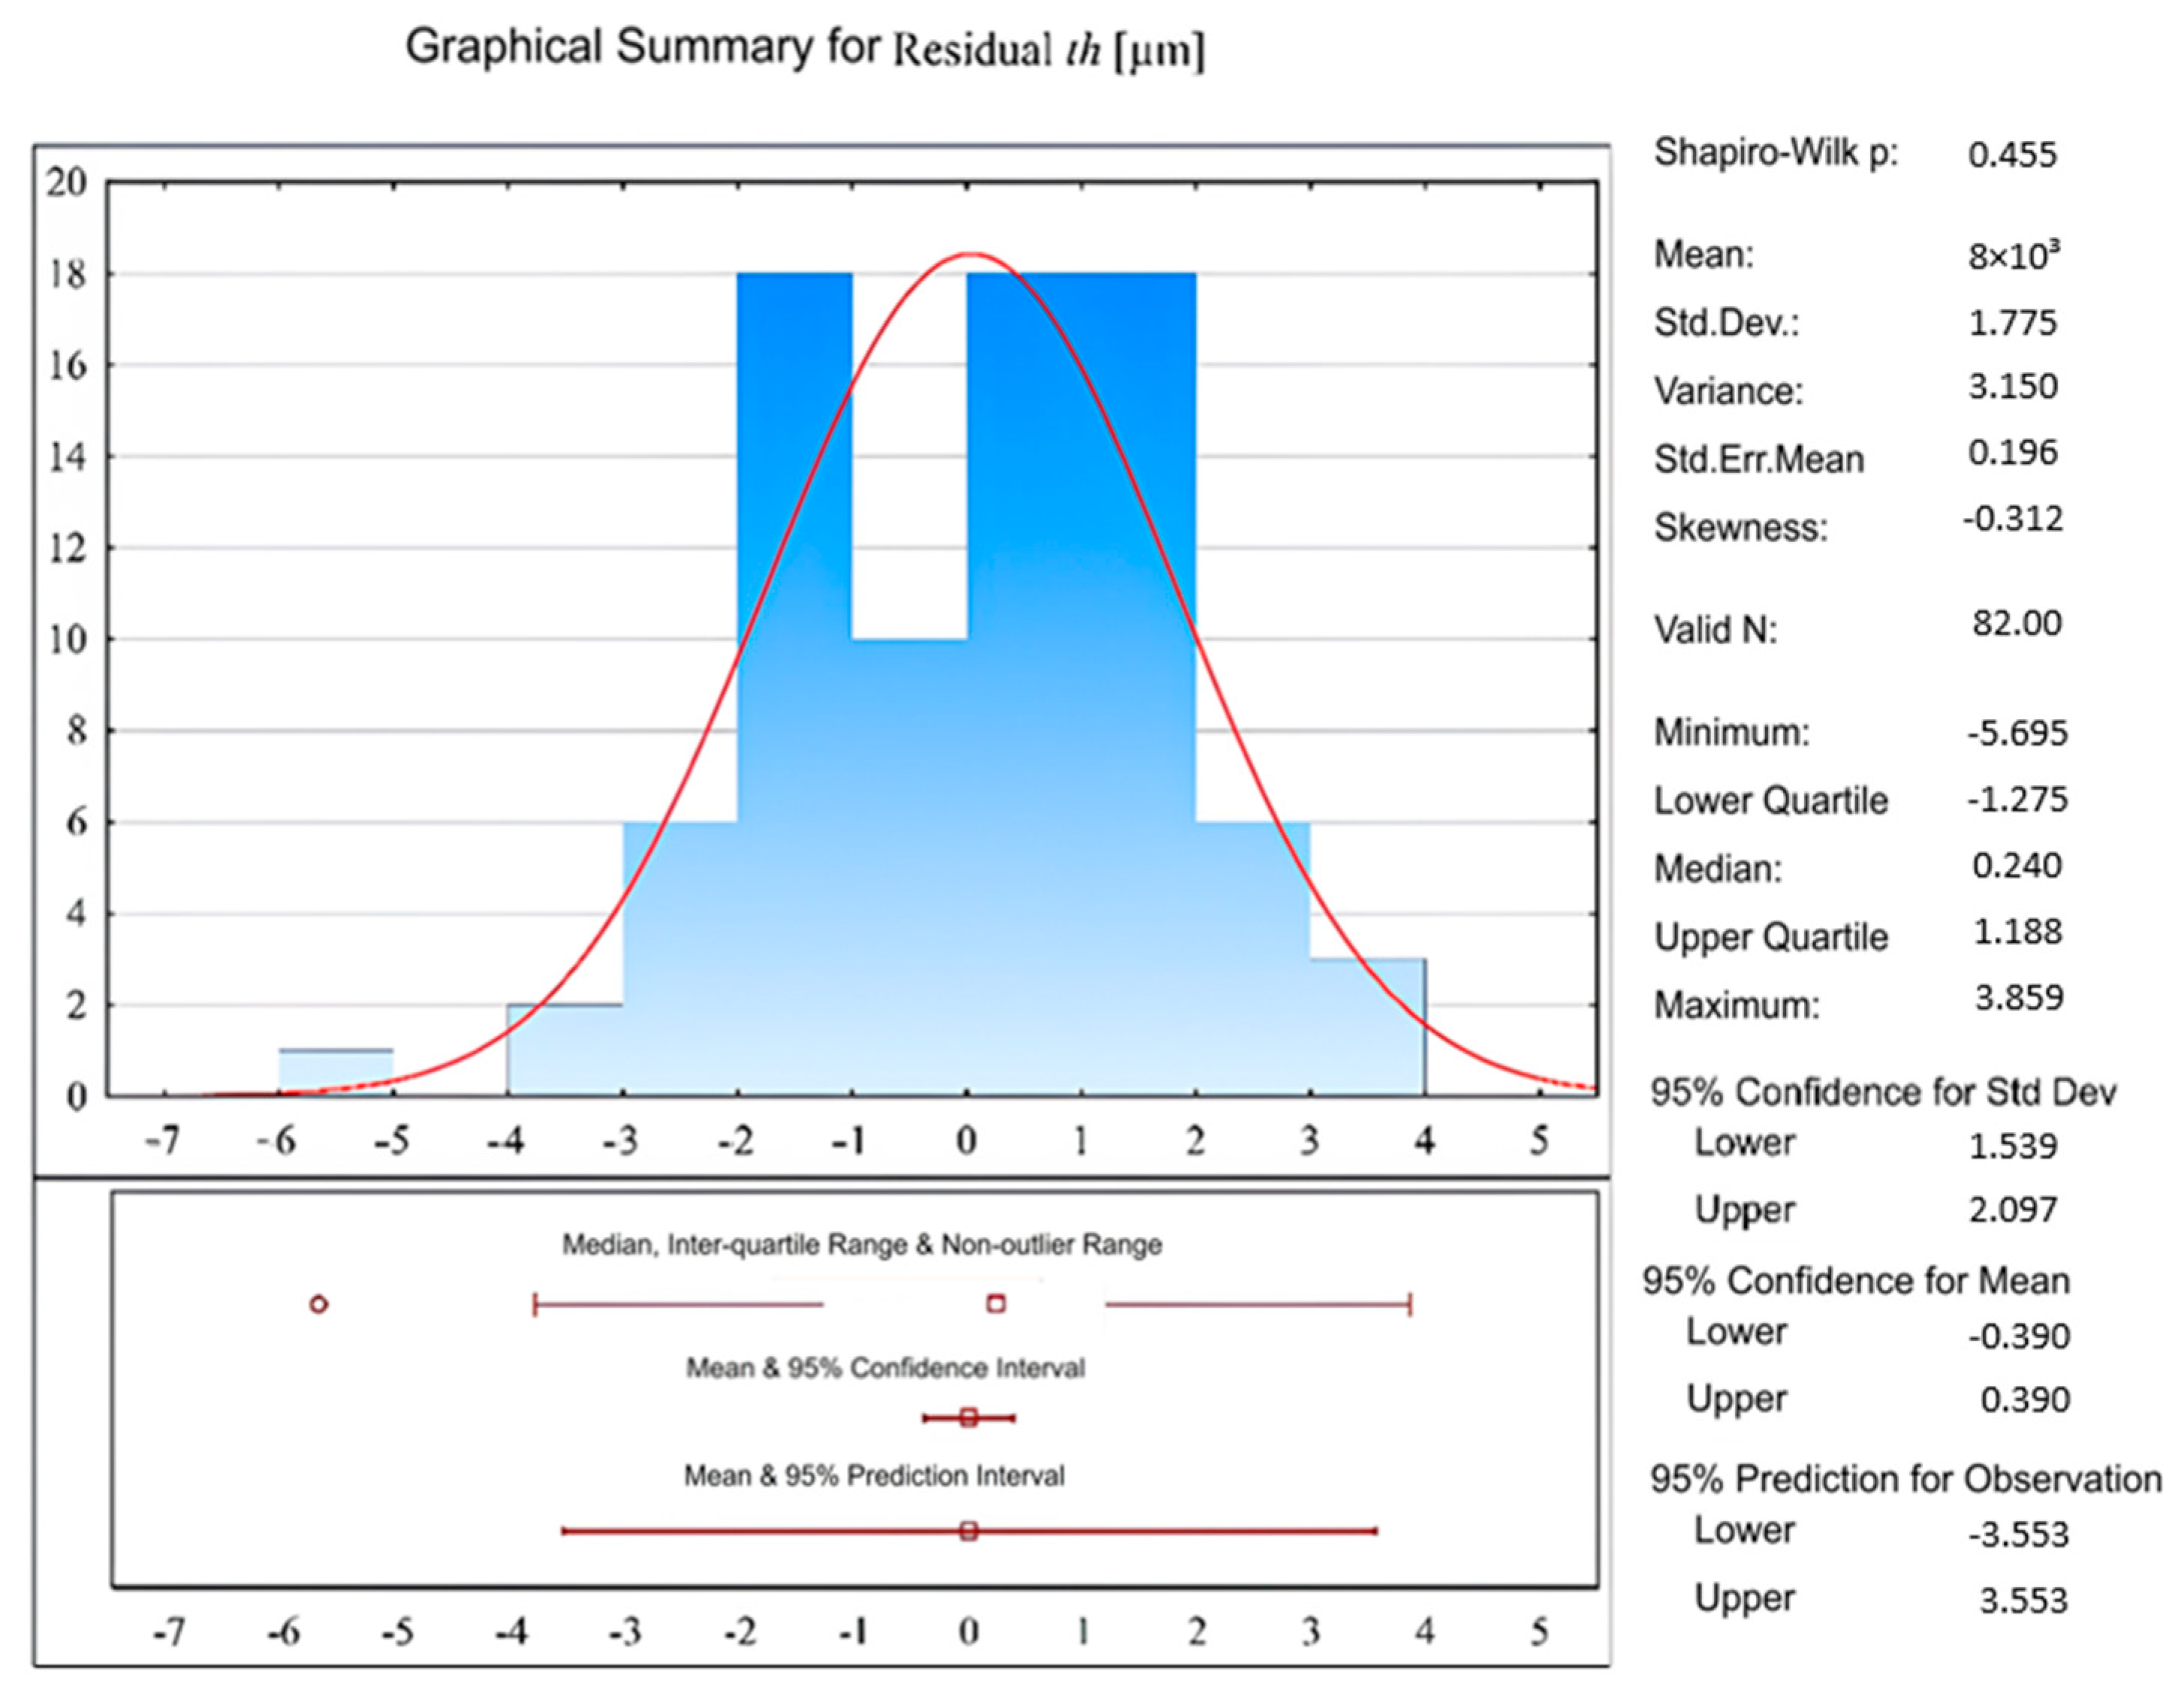
2.4. Analysis of Prediction Model

Outlier analysis was performed using Statistica 14 software to identify and exclude anomalous values from both data columns, focusing on measurements exhibiting significant deviation from the primary dataset (Figure 2). After data filtration, the mean thickness of the deposited layer was calculated using the Statistica 14 software, and the results were tabulated. This process was replicated for measurements obtained from the reference standard to ensure consistency.
The compiled data were further refined by calculating the layer thickness through control measurements conducted on the reference standard. A manufacturer-calibrated foil with a certified thickness of 24.1 μm served as the benchmark for these measurements. The control measurement value was subtracted from the foil’s thickness to determine the deviation, which was then incorporated into the filtered thickness data. This methodology enabled a precise and reliable determination of the average thickness of the deposited layer.
Table 4 presents the model suitability analysis and evaluates the influence of various factors on the thickness of the formed cataphoretic layer. The table further reveals that the proportion of variability in the measured thicknesses, represented by the coefficient of determination (R2), is approximately 75%. The adjusted coefficient of determination, shown in Table 3, quantifies the model’s adequacy in describing the relationship between the input, controlled, chemical, and physical factors and the system’s response (i.e., the thickness of the formed layer). This value indicates that 70.79% of the variability is accounted for by the model. Based on the experimentally derived thickness values of the cataphoretic layer, the average thickness (mean of response) is determined to be 17.71 μm.
As presented in Table 5, the variability attributable to random error is markedly smaller than the variability in the measurements accounted for by the model. The significance level (Prob > F), derived from the Fisher–Snedecor test, further substantiates the appropriateness of the model. With a chosen significance threshold of α = 0.05, the results demonstrate that the model is statistically significant, indicating its reliability in describing the observed phenomena.
Based on the lack-of-fit error presented in Table 6, it can be concluded that the significance level is 0.1312, which allows for the acceptance of the null hypothesis at the chosen significance threshold of α = 0.05. This suggests that the variance of residuals is less than or equal to the variance within groups, thereby confirming the suitability of the model. Following the assumptions outlined and validated in Table 5 and Table 6, the parameter estimates for the model are provided in Table 7. The significance of individual effects and their interactions is assessed at a significance level of α = 0.05. Table 5 illustrates the estimated effect sizes for each component of the model, which quantifies the influence of various factors on the thickness of the formed layer. Furthermore, the interaction between variables such as concentration, cathodic deposition time, degreasing temperature, and immersion time in the degreasing agent is shown to have a substantial impact on the outcome.
Based on the estimated parameters, it is possible to construct the equation in a coded scale:
y = 15.261 2.089 · x 1 + 0.904 · x 5 + 0.806 · x 6 0.582 · x 3 + 3.454 · x 2 0.517 · x 1 · x 5 0.680 · x 1 · x + 0.710 · x 3 · x 2 + 0.516 · x 1 · x 5 · x 3 0.478 · x 4 0.689 · x 1 · x 5 · x 6 · x 2 + 0.946 · x 1 · x 5 · x 3 · x 2
To establish the predictive relationship in the natural scale, it is important to note that the factors used during the analysis were encoded in the coded scale through design of experiments normalization:
x d ( i ) = x i x max + x min 2 x max x min 2
where xd(i) represents the coded variable according to the design of experiments, and x(i) denotes the original base variable, with i representing the set of integers corresponding to the number of base factors. xmax is the maximum value of the original variable x(i), and xmin is the minimum value of the original variable x(i). Using the coded equation and the statistical equation, it is possible to define the predictive equation in the natural scale that describes the investigated relationship representing the thickness of the formed layer th:
t h = 0.2348441563 · D E G R c o n + 0.34283975 · D E G R t i m 0.3041498125 · D E G R t e m p + 3.10826525 · K T L t i m + 0.11258322 · K T L U 0.01334178812 · D E G R c o n 2 + 0.00041859125 · D E G R c o n 0.0000029899375 · D E G R c o n 4 0.02196685 · D E G R c o n · D E G R t i m + 0.0062359375 · D E G R c o n · D E G R t e m p + 0.0484984375 · D E G R t i m · D E G R t e m p 0.07589475 · D E G R c o n · K T L t i m 0.00275624 · D E G R c o n · K T L U 0.10614625 · D E G R c o n · D E G R t i m · K T L U 0.0012471875 · D E G R c o n · D E G R t e m p · K T L t i m 0.0082796875 · D E G R t i m · D E G R t e m p · K T L t i m + 0.000551248 · D E G R c o n · K T L t i m · K T L U + 0.00241171 · D E G R t i m · K T L t i m · K T L U + 0.0002365625 · D E G R c o n · D E G R t i m · D E G R t e m p · K T L t i m 0.000068906 · D E G R c o n · D E G R t i m · K T L t i m · K T L U + 8.664520102
where DEGRcon—degreasing concentration, DEGRtim—degreasing time, DEGRtemp—degreasing temperature, KTLtim—time of cataphoresis, and KTLU—cataphoresis voltage.
To ensure the complexity of the conducted analysis and to confirm the accuracy and suitability of the chosen model, it is necessary to examine the residuals. The difference between the observed values and the predicted values calculated using the predictive model must be assessed. The achieved significance level of the Shapiro–Wilk test [29], illustrated in Figure 3, indicates a Gaussian distribution of the residuals, meaning that the value is greater than 0.05. Therefore, it can be concluded that the predictive model is statistically and numerically valid.

3. Results and Discussion

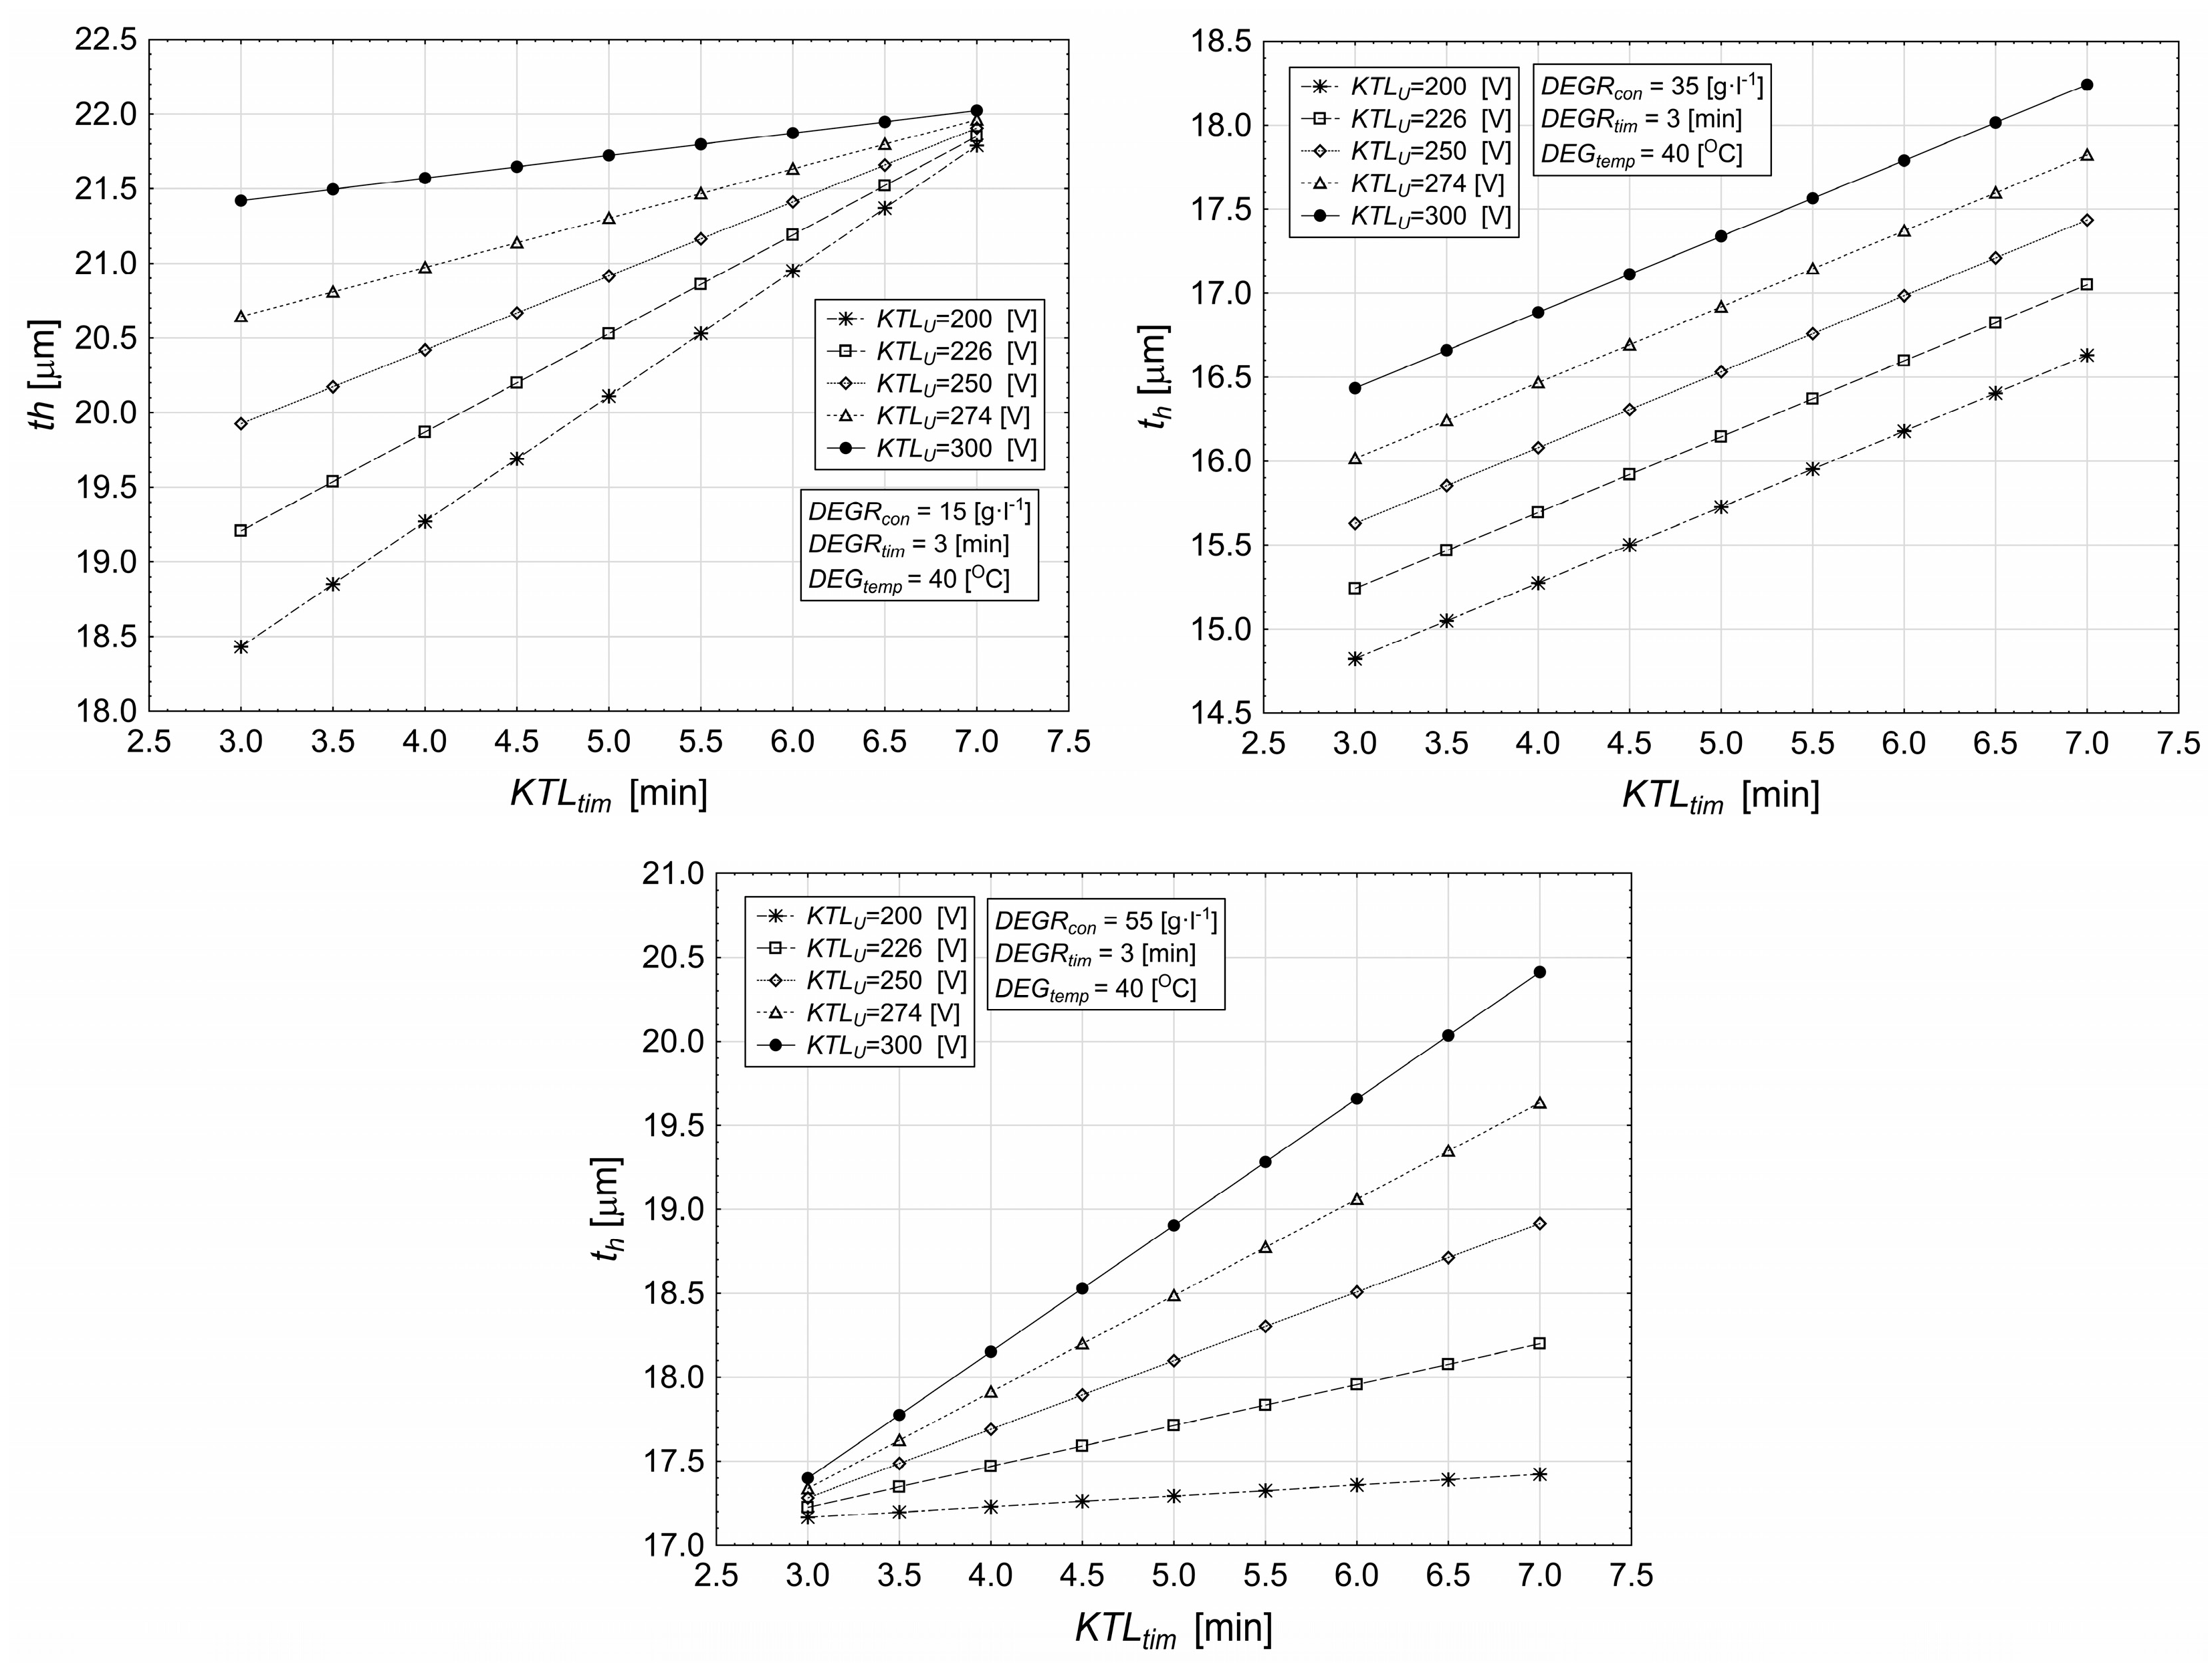
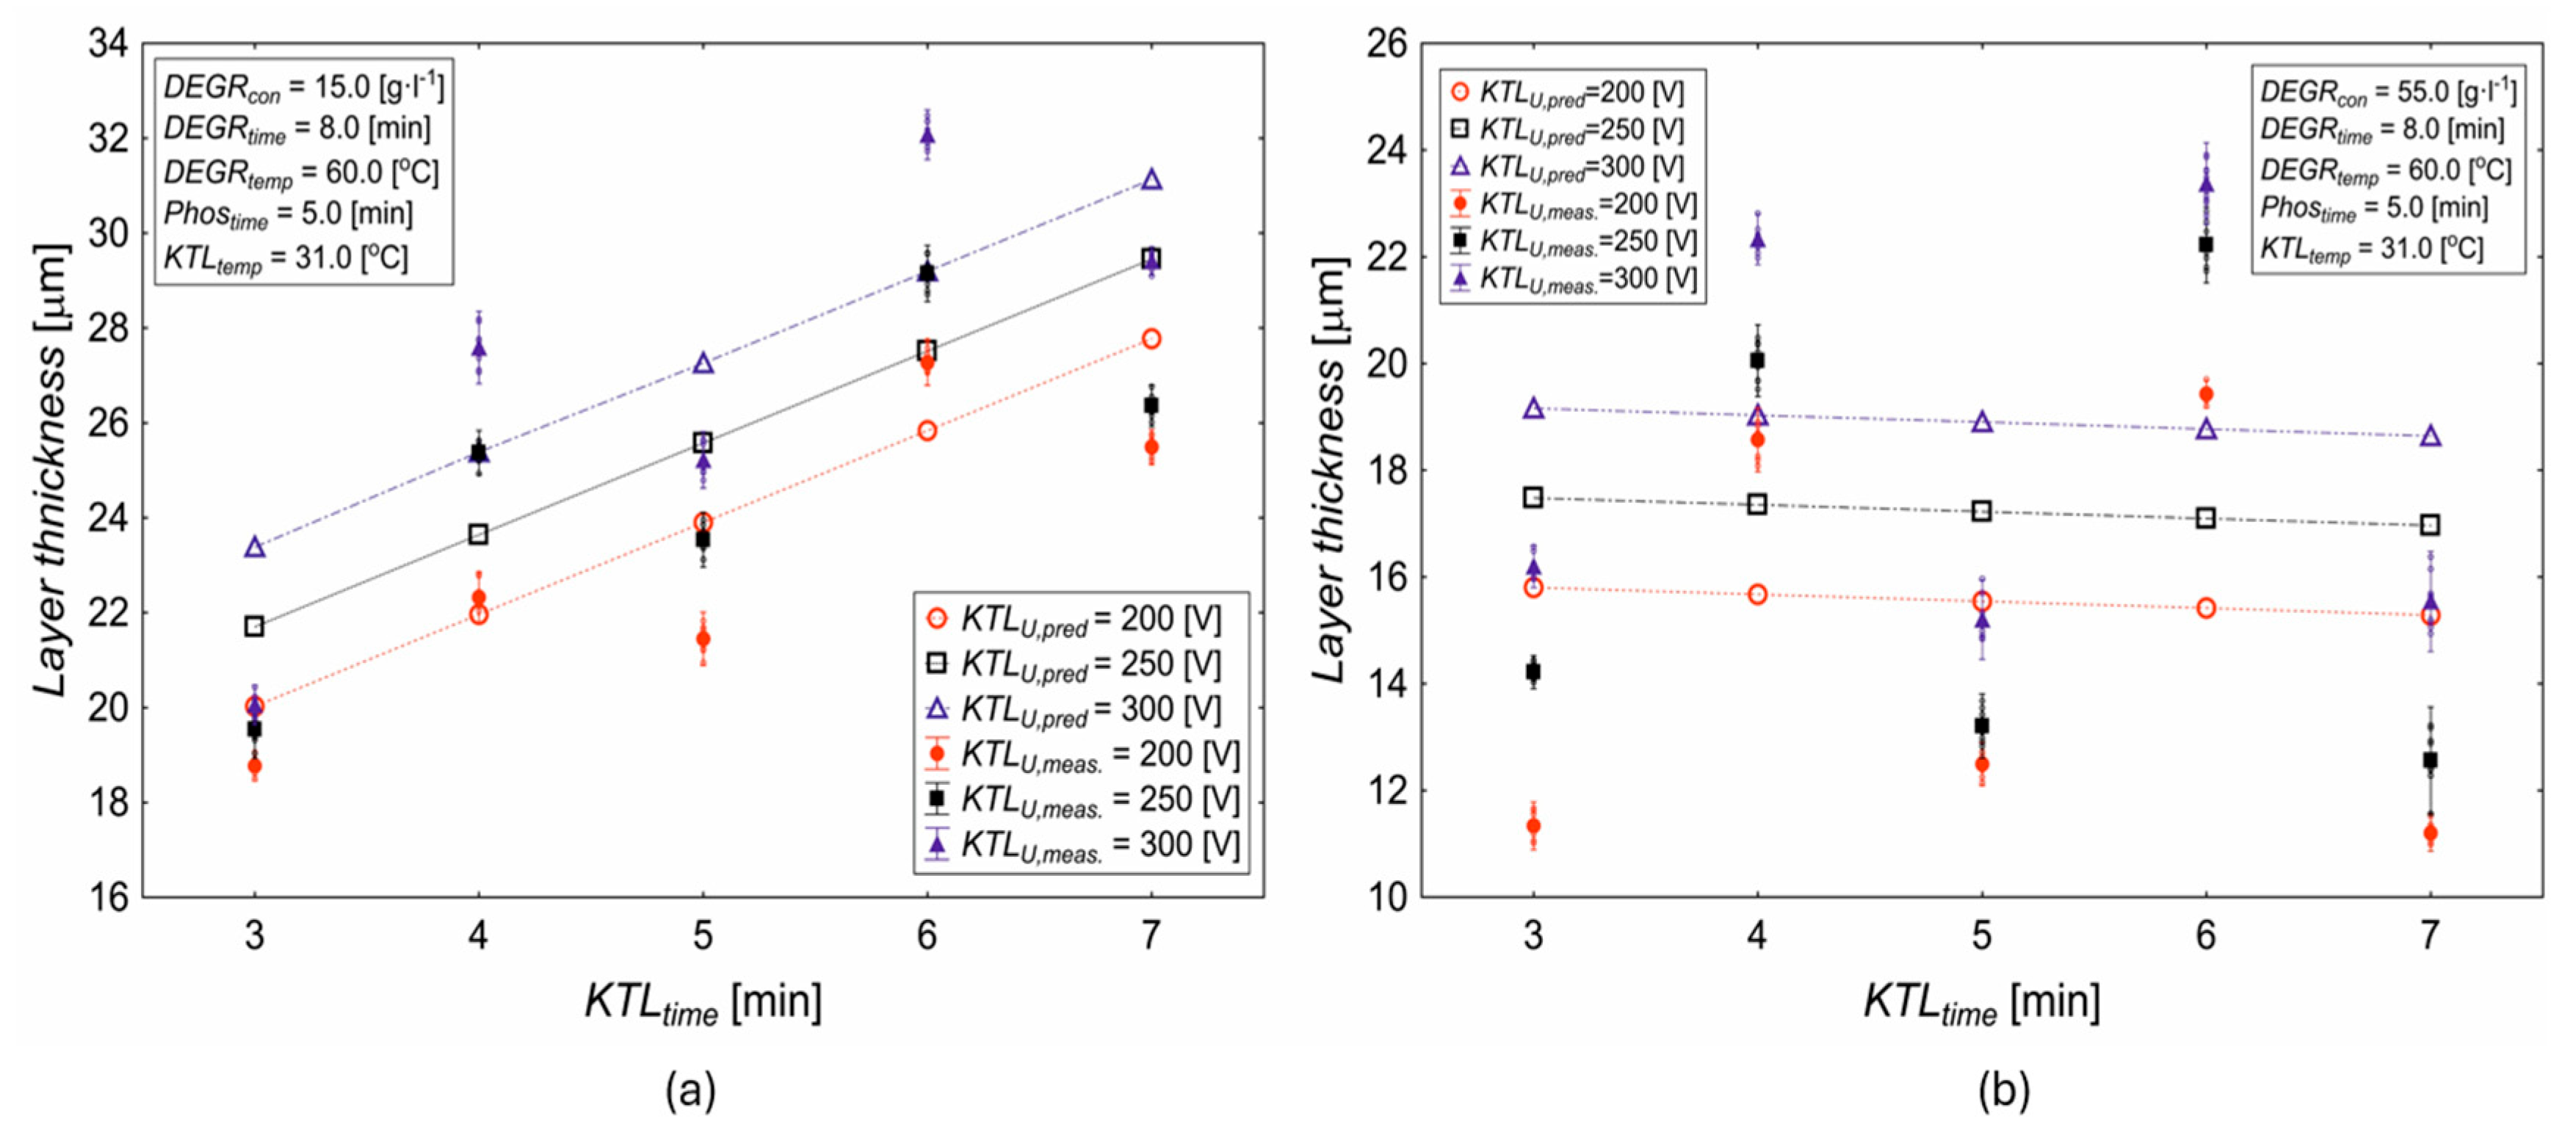
3.1. Influence of Deposition Time and Cataphoretic Voltage on Coating Characteristics

Figure 4 illustrates the significant impact of varying both the duration of deposition and the applied voltage on the thickness of the resultant layer. It has been identified that concentration is also a critical factor under these conditions. At a concentration of 15 g·L−1, the maximum achievable layer thickness is attained with a coating voltage of 300 V. Following a deposition period of 3 min, this maximum thickness measures 21.42 µm. As the deposition time is extended, the thickness further increases, reaching 22.02 µm after 7 min. The minimum recorded thickness of 18.43 µm occurs at a coating voltage of 200 V with a 3 min deposition time. With an increase in time, the thickness also rises, achieving 21.78 µm after 7 min. The disparity between the maximum and minimum thicknesses at 3 min of cathodic electrocoating is 2.99 µm, while this difference diminishes to 0.24 µm after 7 min. When the concentration is adjusted to 35 g·L−1, a relatively uniform thickness distribution is observed across the entire spectrum of tested voltages. In every instance, the thickness exhibits a proportional increase with time. Notably, at this concentration, the lowest thickness values are recorded at a coating voltage of 200 V, where the thickness measures 14.82 µm after 3 min and reaches 16.63 µm following an extended deposition time of 7 min.
The subsequent layer thickness values increase by approximately 0.42 µm as a result of changes in the specified coating voltage and duration. A maximum thickness of 16.43 µm is achieved at a coating voltage of 300 V after 3 min of deposition. As the deposition time increases to 7 min, the thickness reaches 18.24 µm. When the degreasing concentration is adjusted to 55 g·L−1, and the cathodic electrocoating (KTL) process lasts for 3 min, the layer thickness becomes more uniform, with a variance of 0.23 µm. The lowest thickness of 17.16 µm is produced at a coating voltage of 200 V, and by extending the deposition time to 7 min, the thickness increases to 17.42 µm.
The greatest thickness is observed at a voltage of 300 V, where after 3 min of deposition, the thickness reaches 17.39 µm, and with 7 min of deposition, it reaches a peak of 20.41 µm. The results also confirm the conclusion of Garcia et al. [30] and Kamas et al. [31].
Figure 5 illustrates that, by varying the deposition time in cathodic electrocoating and KTLU at the maximum experimental values, while simultaneously adjusting the concentration to 15 g·L−1, the minimum thickness is achieved at a coating voltage of 200 V, where after a deposition time of 3 min, the thickness reaches 21.03 µm. At this voltage, with increasing time, the thickness decreases, reaching 19.57 µm after 7 min. A similar reduction in thickness is observed at voltages of 226 V and 250 V. However, at 250 V, the decrease in thickness over the KTL deposition period is only 0.08 µm. In contrast, voltages of 275 V and 300 V result in an increase in thickness throughout the entire deposition time. The difference between the maximum and minimum thickness at a 3 min deposition is 0.24 µm. A voltage of 300 V ensures the greatest thickness, reaching 22.56 µm after 7 min of KTL deposition. When the concentration is changed to 35 g·L−1, the thickness levels increase uniformly with rising voltage.
The minimum thickness is observed at 200 V, where the thickness is 13.65 µm after 3 min and 15.46 µm after 7 min. The thickness increases by 0.42 µm as the voltage rises to the defined value. At a voltage of 300 V and a 3 min deposition time, the thickness reaches 15.27 µm, and with time, it continues to increase, reaching 17.07 µm after 7 min. When increasing the concentration of Pragolod 57 N to 55 g·L−1, the thickness grows consistently across the deposition time range. The minimum thickness of 12.23 µm is observed at 200 V after 3 min. The difference between the minimum and maximum layer thickness is 2.99 µm. The maximum thickness is reached at 300 V, where after 7 min, it measures 17.54 µm, representing the largest possible layer thickness within this interval. The difference between the maximum and minimum thickness at 7 min of deposition is 0.24 µm. The results also confirm the conclusion of Krenicky et al. [32] and Kania et al. [33].

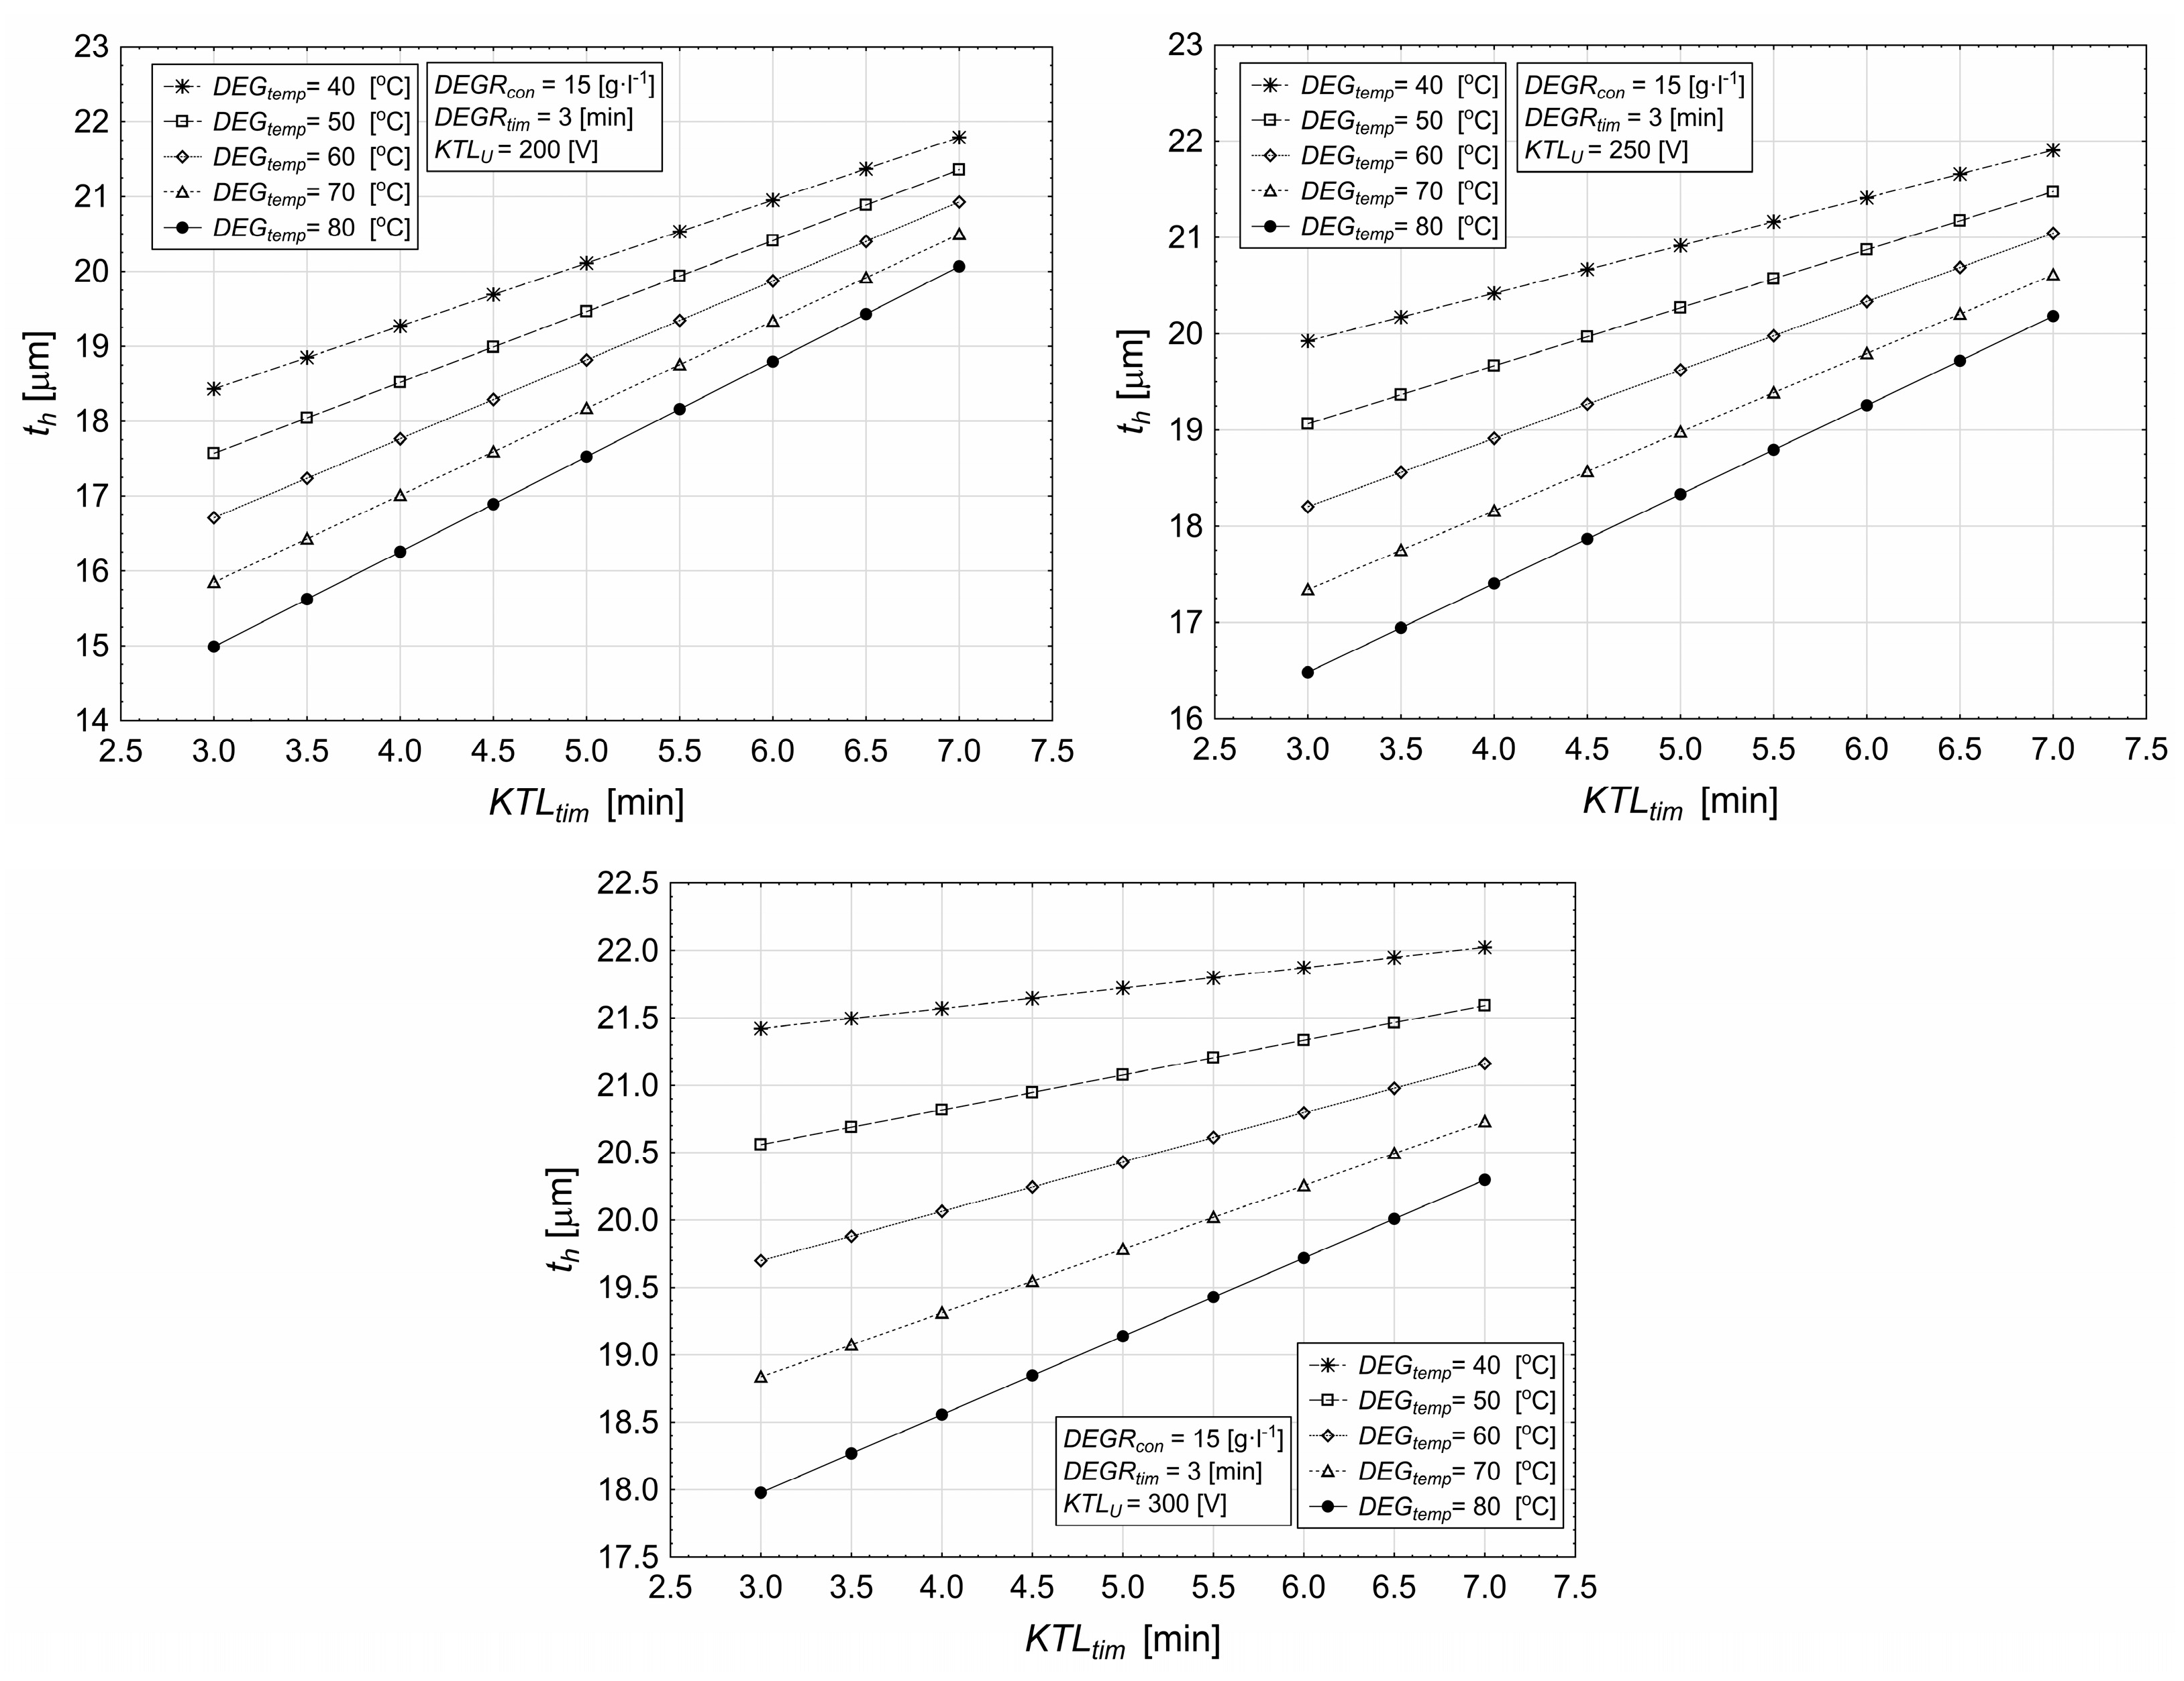
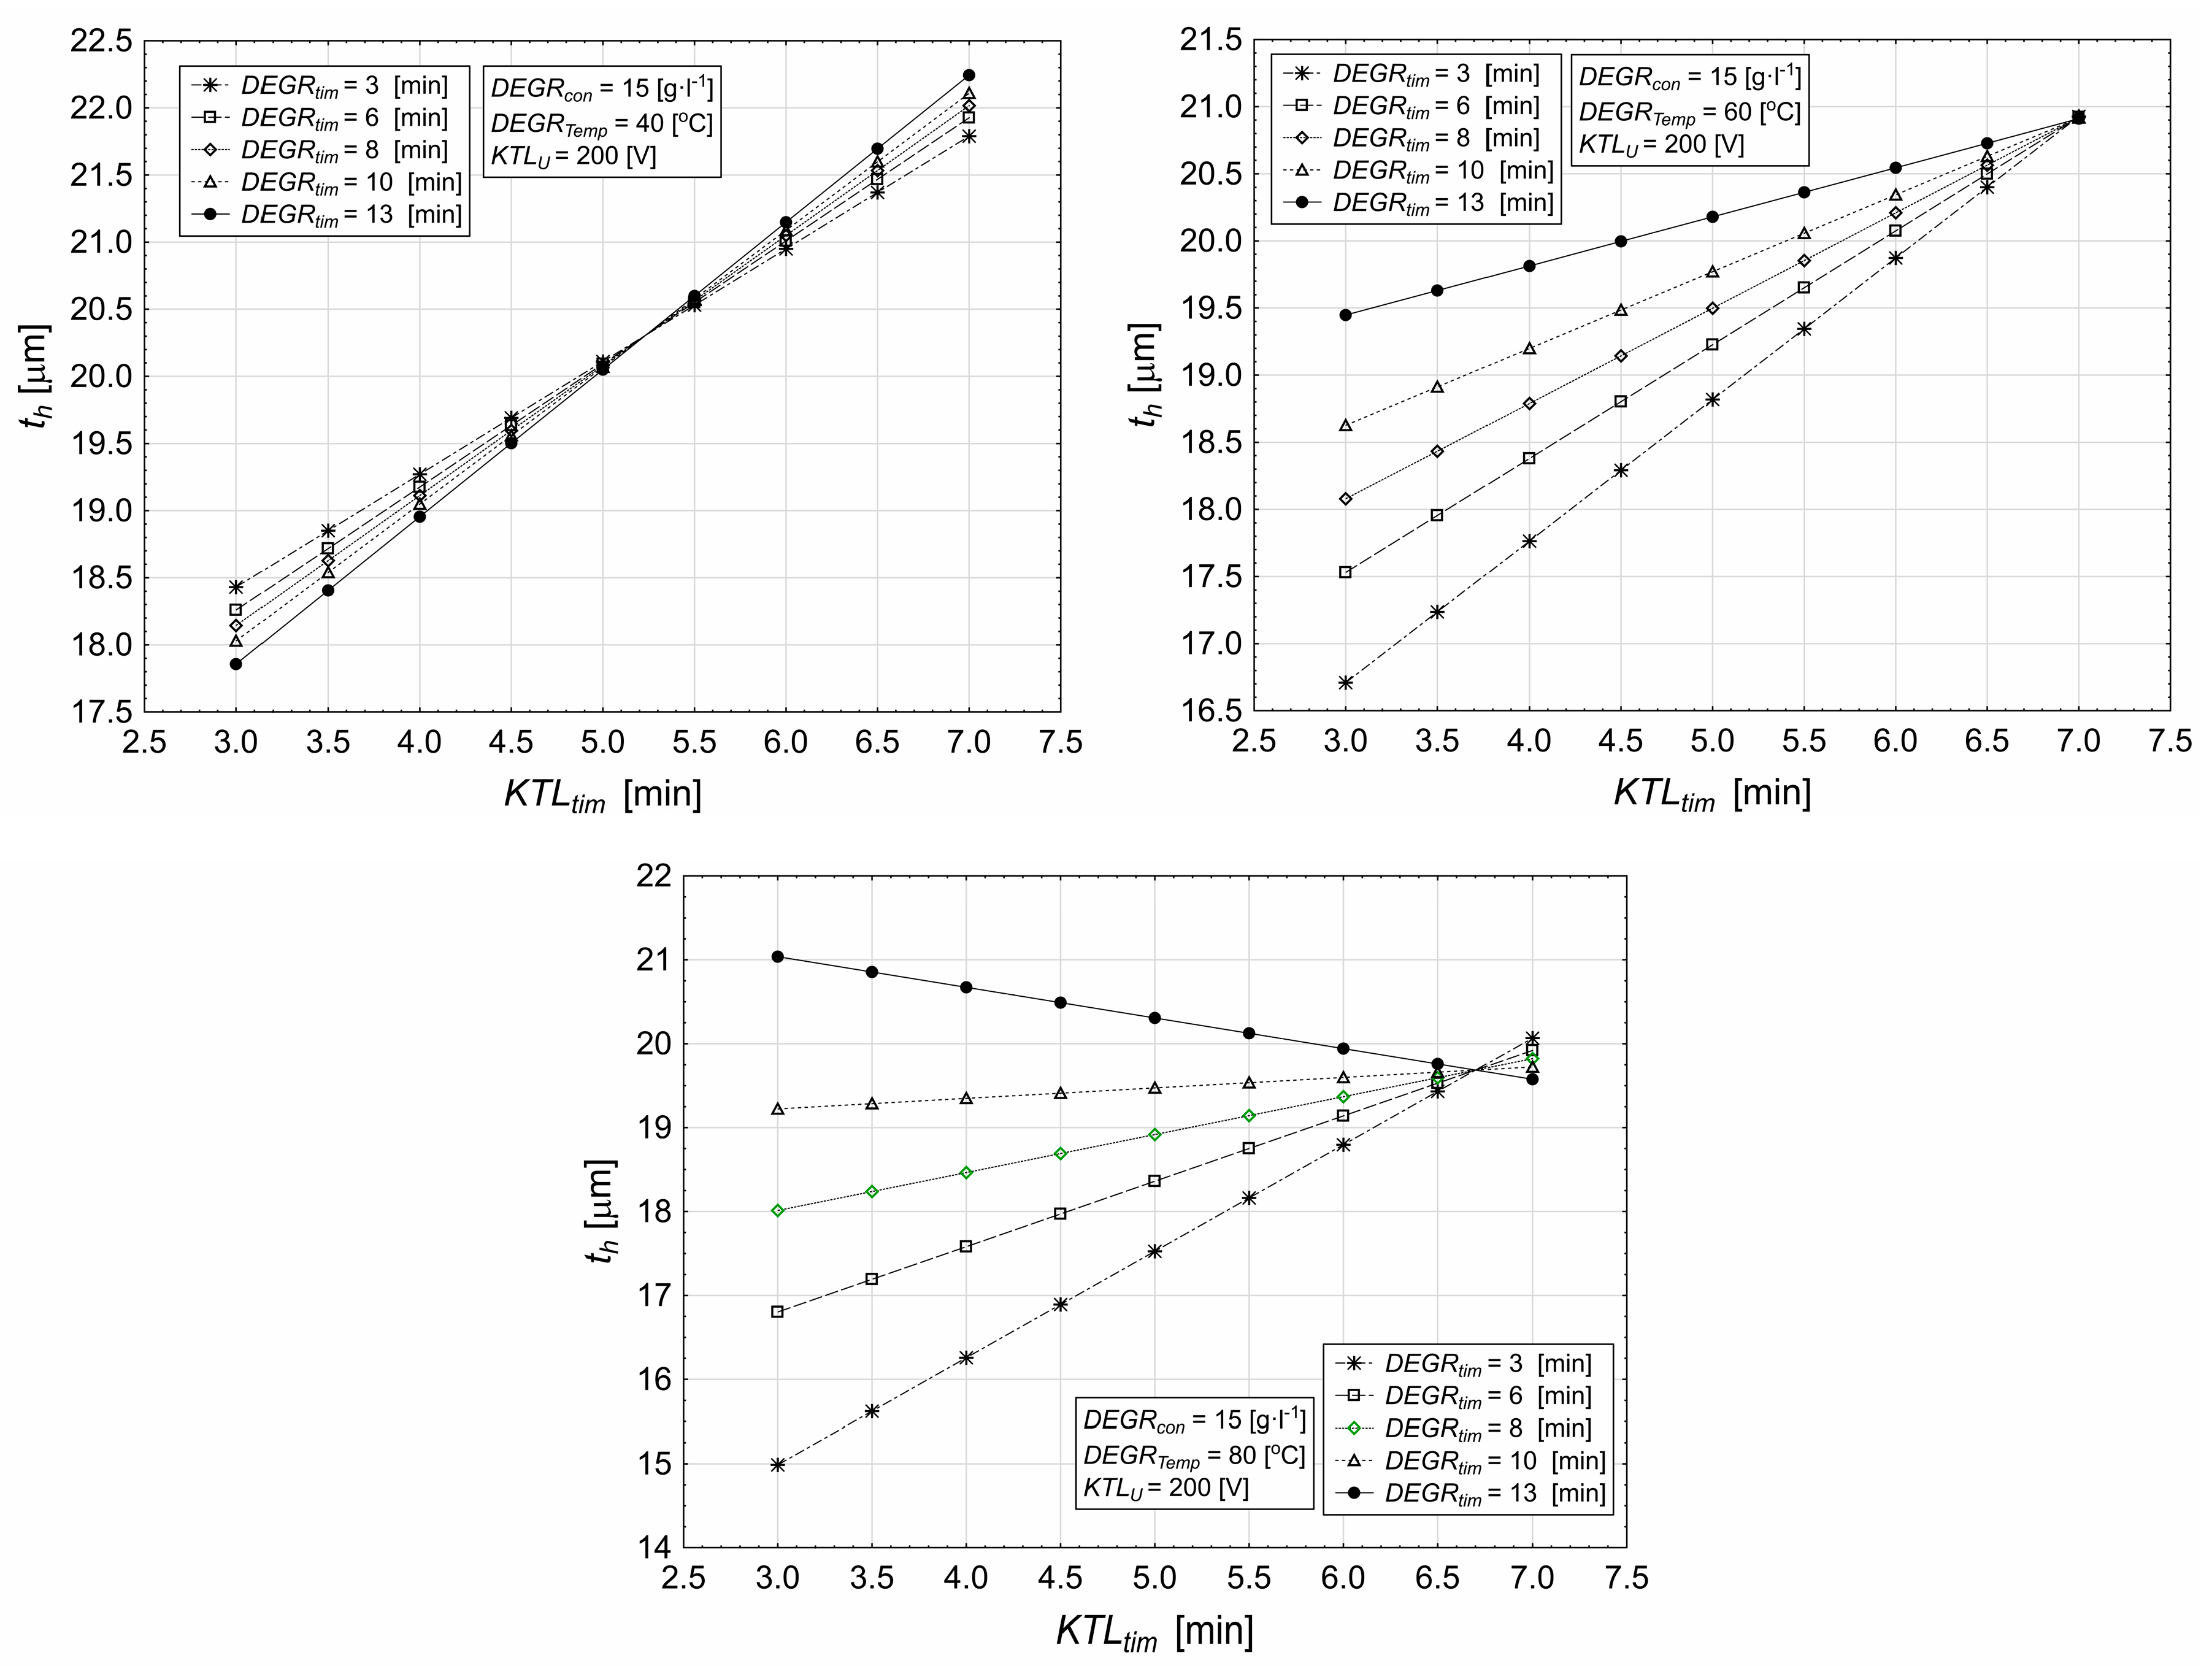
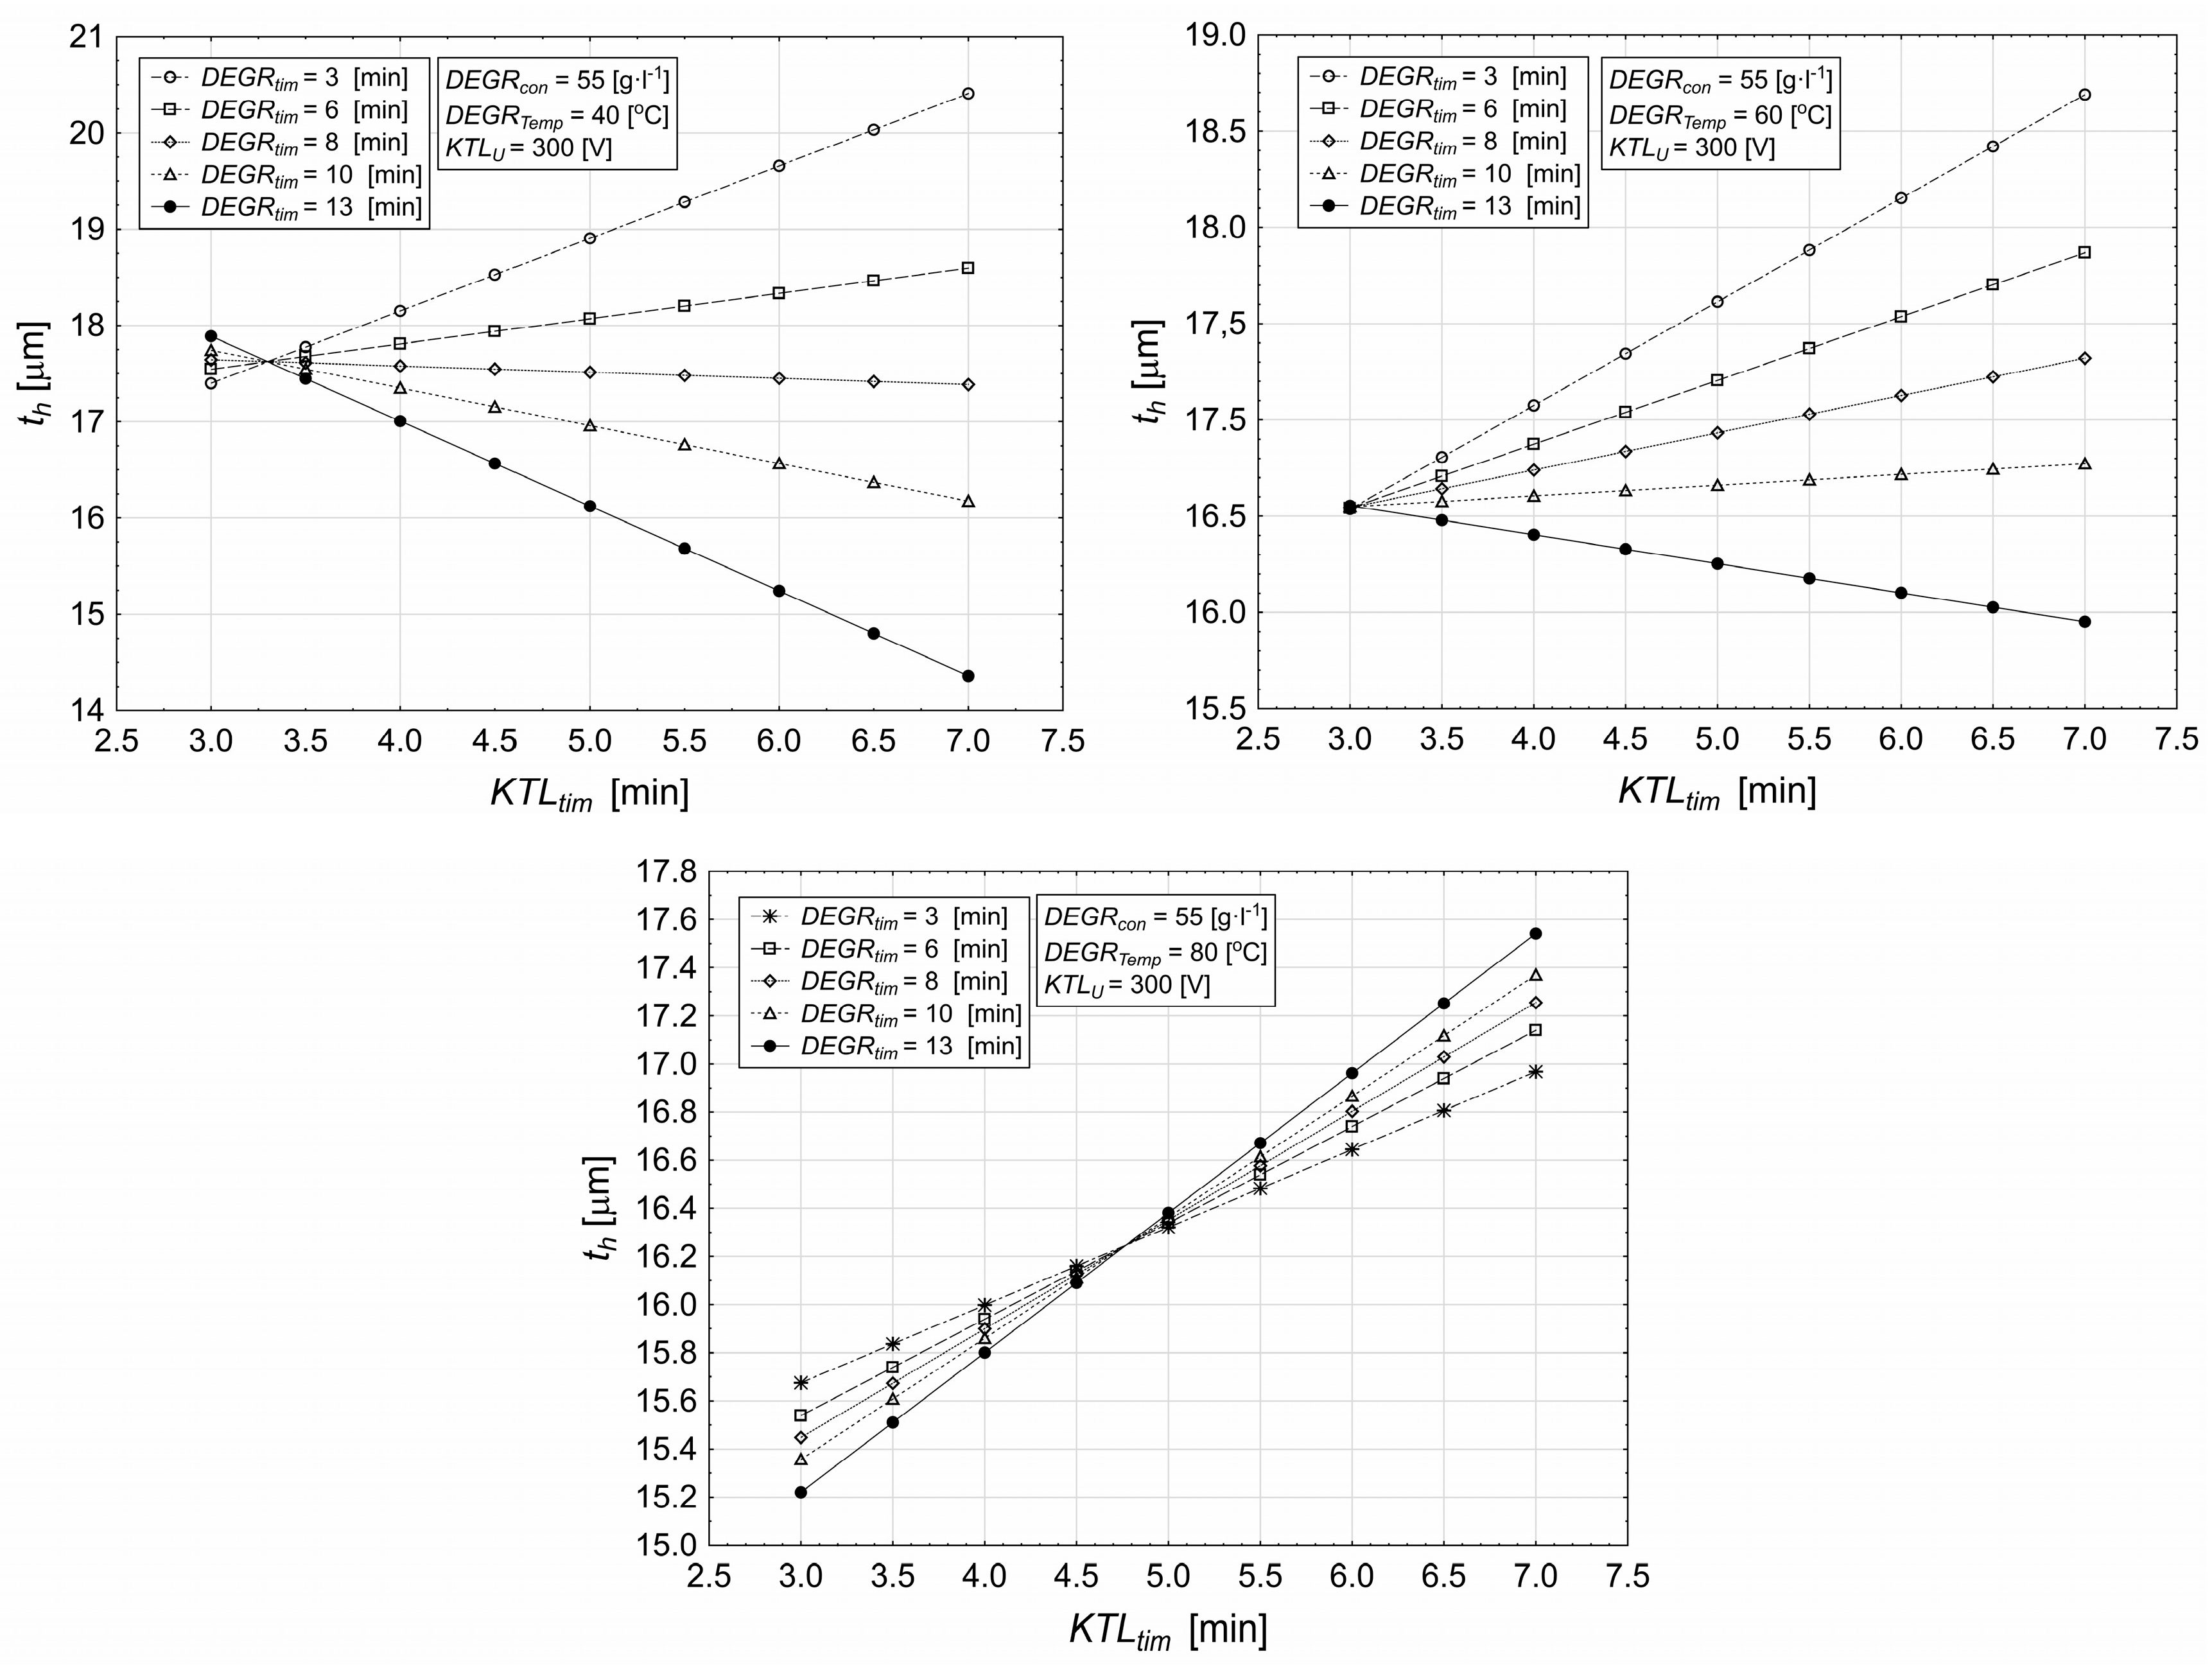
3.2. Influence of Deposition Time and Degreasing Temperature on Coating Characteristics

Figure 6 illustrates the effect of KTL deposition time and the degreasing solution temperature, along with voltage variation, on the resulting layer thickness. These factors consistently lead to an increase in layer thickness. As the degreasing temperature decreases, the rate of layer growth also diminishes. The difference between the maximum and minimum thickness remains constant across the three voltage changes. For a KTL time of 3 min, this difference is 3.45 µm, while for a 7 min deposition, it is 1.72 µm. The thickness variation with a gradual change in temperature over a 3 min KTL period is 0.87 µm, and for a 7 min deposition, it is 0.47 µm. At an applied voltage of 200 V, the minimum thickness of 14.98 µm after 3 min is achieved with a degreasing temperature of 80 °C. The maximum thickness of 18.43 µm occurs with minimal degreasing at 40 °C. At this lower temperature, the maximum layer thickness of 21.78 µm is reached after 7 min of deposition. When the voltage is increased to 250 V, the smallest thickness of 16.48 µm is again observed at a degreasing temperature of 80 °C. At this temperature, a minimum thickness of 20.18 µm is also reached when the deposition time is extended to 7 min. The maximum thickness is achieved at a degreasing temperature of 40 °C throughout the entire KTL deposition period. At 300 V, the highest thickness values are recorded, with the difference between 250 V at 80 °C and a deposition time of 3 min being 1.49 µm. However, for a 7 min KTL deposition, this difference is reduced to only 0.11 µm. The maximum thicknesses are achieved with degreasing at 40 °C, with a thickness of 21.42 µm after 3 min and 22.02 µm after 7 min.
Figure 7 illustrates the relationship between the KTL deposition time, degreasing temperature, and voltage variation and their combined effect on the resulting layer thickness. At a voltage of 200 V, the minimum thickness of 12.23 µm is observed at a degreasing temperature of 80 °C. At this temperature, the thickness increases over time, and around 4.8 min of KTL deposition, the layers intersect, resulting in maximum values of 17.30 µm after 7 min of deposition. The maximum thickness of 14.89 µm, recorded after 3 min of deposition, occurs at a degreasing temperature of 40 °C. When the thickness reaches approximately 14.57 µm, the graph intersects, indicating that this degreasing temperature reaches the minimum thickness values. After 7 min of deposition, the thickness measures 14.12 µm. Only at this temperature does the thickness decrease with increasing deposition time. When the voltage is raised to 250 V, the smallest thickness, 13.72 µm, is observed at a degreasing temperature of 80 °C. This temperature, along with increasing time, contributes to an increase in thickness, and at around 4.75 min, it intersects with other degreasing temperatures, reaching the maximum layer thickness. After 7 min, the thickness reaches 17.42 µm. A rising trend in layer formation is also observed at degreasing temperatures of 60 °C and 70°C. However, at a degreasing temperature of 50 °C, the layer thickness decreases as time increases. At 40 °C, a maximum thickness of 16.39 µm is achieved at 3 min of KTL deposition. At the point where the graphs intersect, the thickness is approximately 15.40 µm. The smallest thickness of 14.24 µm is recorded after 7 min of deposition. This behavior agreed with data observed by authors Hamera et al. [34], Wang et al. [35], and Swierczynski [36].
When the voltage is increased to 300 V, the minimum thickness, 15.22 µm, is reached after 3 min of deposition at a degreasing temperature of 80 °C. At degreasing temperatures of 70 °C and 80 °C, the thickness continues to increase with time. At 4.8 min, the graph intersects, and from that point onward, the degreasing temperature of 80 °C produces the maximum thickness, reaching 17.54 µm after 7 min of deposition. The maximum thickness after 3 min, 17.88 µm, is achieved at a degreasing temperature of 40 °C. When the thickness falls to around 16.27 µm, this temperature produces the minimum thickness as time increases. After 7 min of deposition, the layer thickness is 14.36 µm. The created layer thickness does not decrease with increasing time at degreasing temperatures of 40 °C, 50 °C, or 60 °C.

3.3. Influence of Cataphoretic Deposition and Degreasing Deposition on Coating Characteristics

Figure 8 depicts the impact of time factors, specifically KTL deposition time and degreasing deposition time, along with concurrent changes in degreasing temperature, on the resulting coating thickness. At a degreasing temperature of 40 °C, the thickness consistently increases across all displayed time intervals as the deposition time lengthens. The lowest recorded thickness of 17.85 µm occurred after 13 min of degreasing deposition and 3 min of KTL deposition. From this point, the thickness increased with time, and the graph intersected around 5.3 min. The maximum thickness values were achieved with a 13 min degreasing deposition time, reaching 22.24 µm after 7 min of KTL deposition. The highest thickness of 18.43 µm was measured after 3 min of KTL deposition and 3 min of degreasing. At approximately 20.35 µm, another intersection occurs, and from this point forward, the thickness reaches its minimum values. At 7 min of KTL deposition, the thickness reaches 21.78 µm with a degreasing time of 3 min. When the degreasing temperature is increased to 60 °C, a maximum thickness of 19.44 µm is observed after 3 min of KTL deposition, corresponding to 13 min of degreasing deposition. The minimum thickness at this point is 16.70 µm, which was observed after 3 min of degreasing.
Thickness increases across all defined degreasing times as deposition time progresses. At 7 min of KTL deposition, the thicknesses converge to a uniform value of approximately 20.91 µm, representing the maximum thickness achievable under these conditions. At a degreasing temperature of 80 °C, the minimum thickness of 14.98 µm occurs after 3 min of degreasing and 3 min of KTL deposition. Increasing thickness is observed for degreasing times of 3, 6, 8, and 10 min. The maximum thickness of 21.03 µm is reached after 13 min of degreasing and 3 min of KTL deposition. As time increases, this thickness begins to decrease, with an intersection occurring at approximately 19.63 µm. A degreasing time of 13 min with 7 min of KTL deposition results in a minimum thickness of 19.57 µm, while the maximum thickness of 20.06 µm for 7 min of KTL deposition is achieved with 3 min of degreasing.
Figure 9 illustrates the impact of deposition time during degreasing and cataphoretic coating at maximum experimental values, along with concurrent changes in degreasing temperature, on the resulting thickness. At a degreasing temperature of 40 °C, a thickness difference of 0.49 µm is observed after 3 min of coating. The maximum thickness of 17.88 µm is achieved with a 13 min deposition time. When the KTL deposition time reaches approximately 3.3 min, a cross-point occurs, where the thickness is about 17.62 µm. From this point, the maximum thickness is formed during a 3 min deposition. If the KTL process extends to 7 min, the thickness reaches 20.41 µm. The results also confirm the conclusions of Rossi et al. [37] and Calovi et al. [38].
The minimum thickness of 14.36 µm for the aforementioned KTL process is reached after 13 min of degreasing. The smallest thickness variation of 0.26 µm throughout the KTL process is observed with an 8 min degreasing deposition time. When the degreasing temperature is raised to 60 °C, a nearly uniform thickness of 16.54 µm is reached after 3 min of KTL deposition. Under these conditions, a reduction in thickness is only observed with a 13 min degreasing deposition time, where the minimum thickness of 15.95 µm is reached after 7 min of KTL deposition. The maximum thickness is produced during a 3 min degreasing deposition. At this degreasing time, the largest thickness increase of 2.15 µm is observed as the KTL deposition time increases, with the thickness reaching a maximum of 18.68 µm at 7 min of KTL deposition. When the degreasing temperature is increased to 80 °C, a graph is produced with a range of values of 0.45 µm at a minimum coating time of 3 min, with thickness values increasing as the deposition time increases. The smallest thickness of 15.22 µm is achieved after 13 min of deposition. The highest thickness values are observed with a 3 min KTL deposition time. After approximately 4.8 min of KTL deposition, a cross-point occurs on the graph, with a thickness of around 16.28 µm at this point. As the deposition time increases, the maximum thickness is achieved with a 13 min deposition duration. After reaching 7 min of KTL, the resulting layer exhibits a thickness of 17.54 µm. During this specified deposition time, the minimum thickness of 16.96 µm was obtained with a 3 min degreasing process. The results also confirm the conclusions of Su et al. [39], Li et al. [40], and Kania et al. [41].

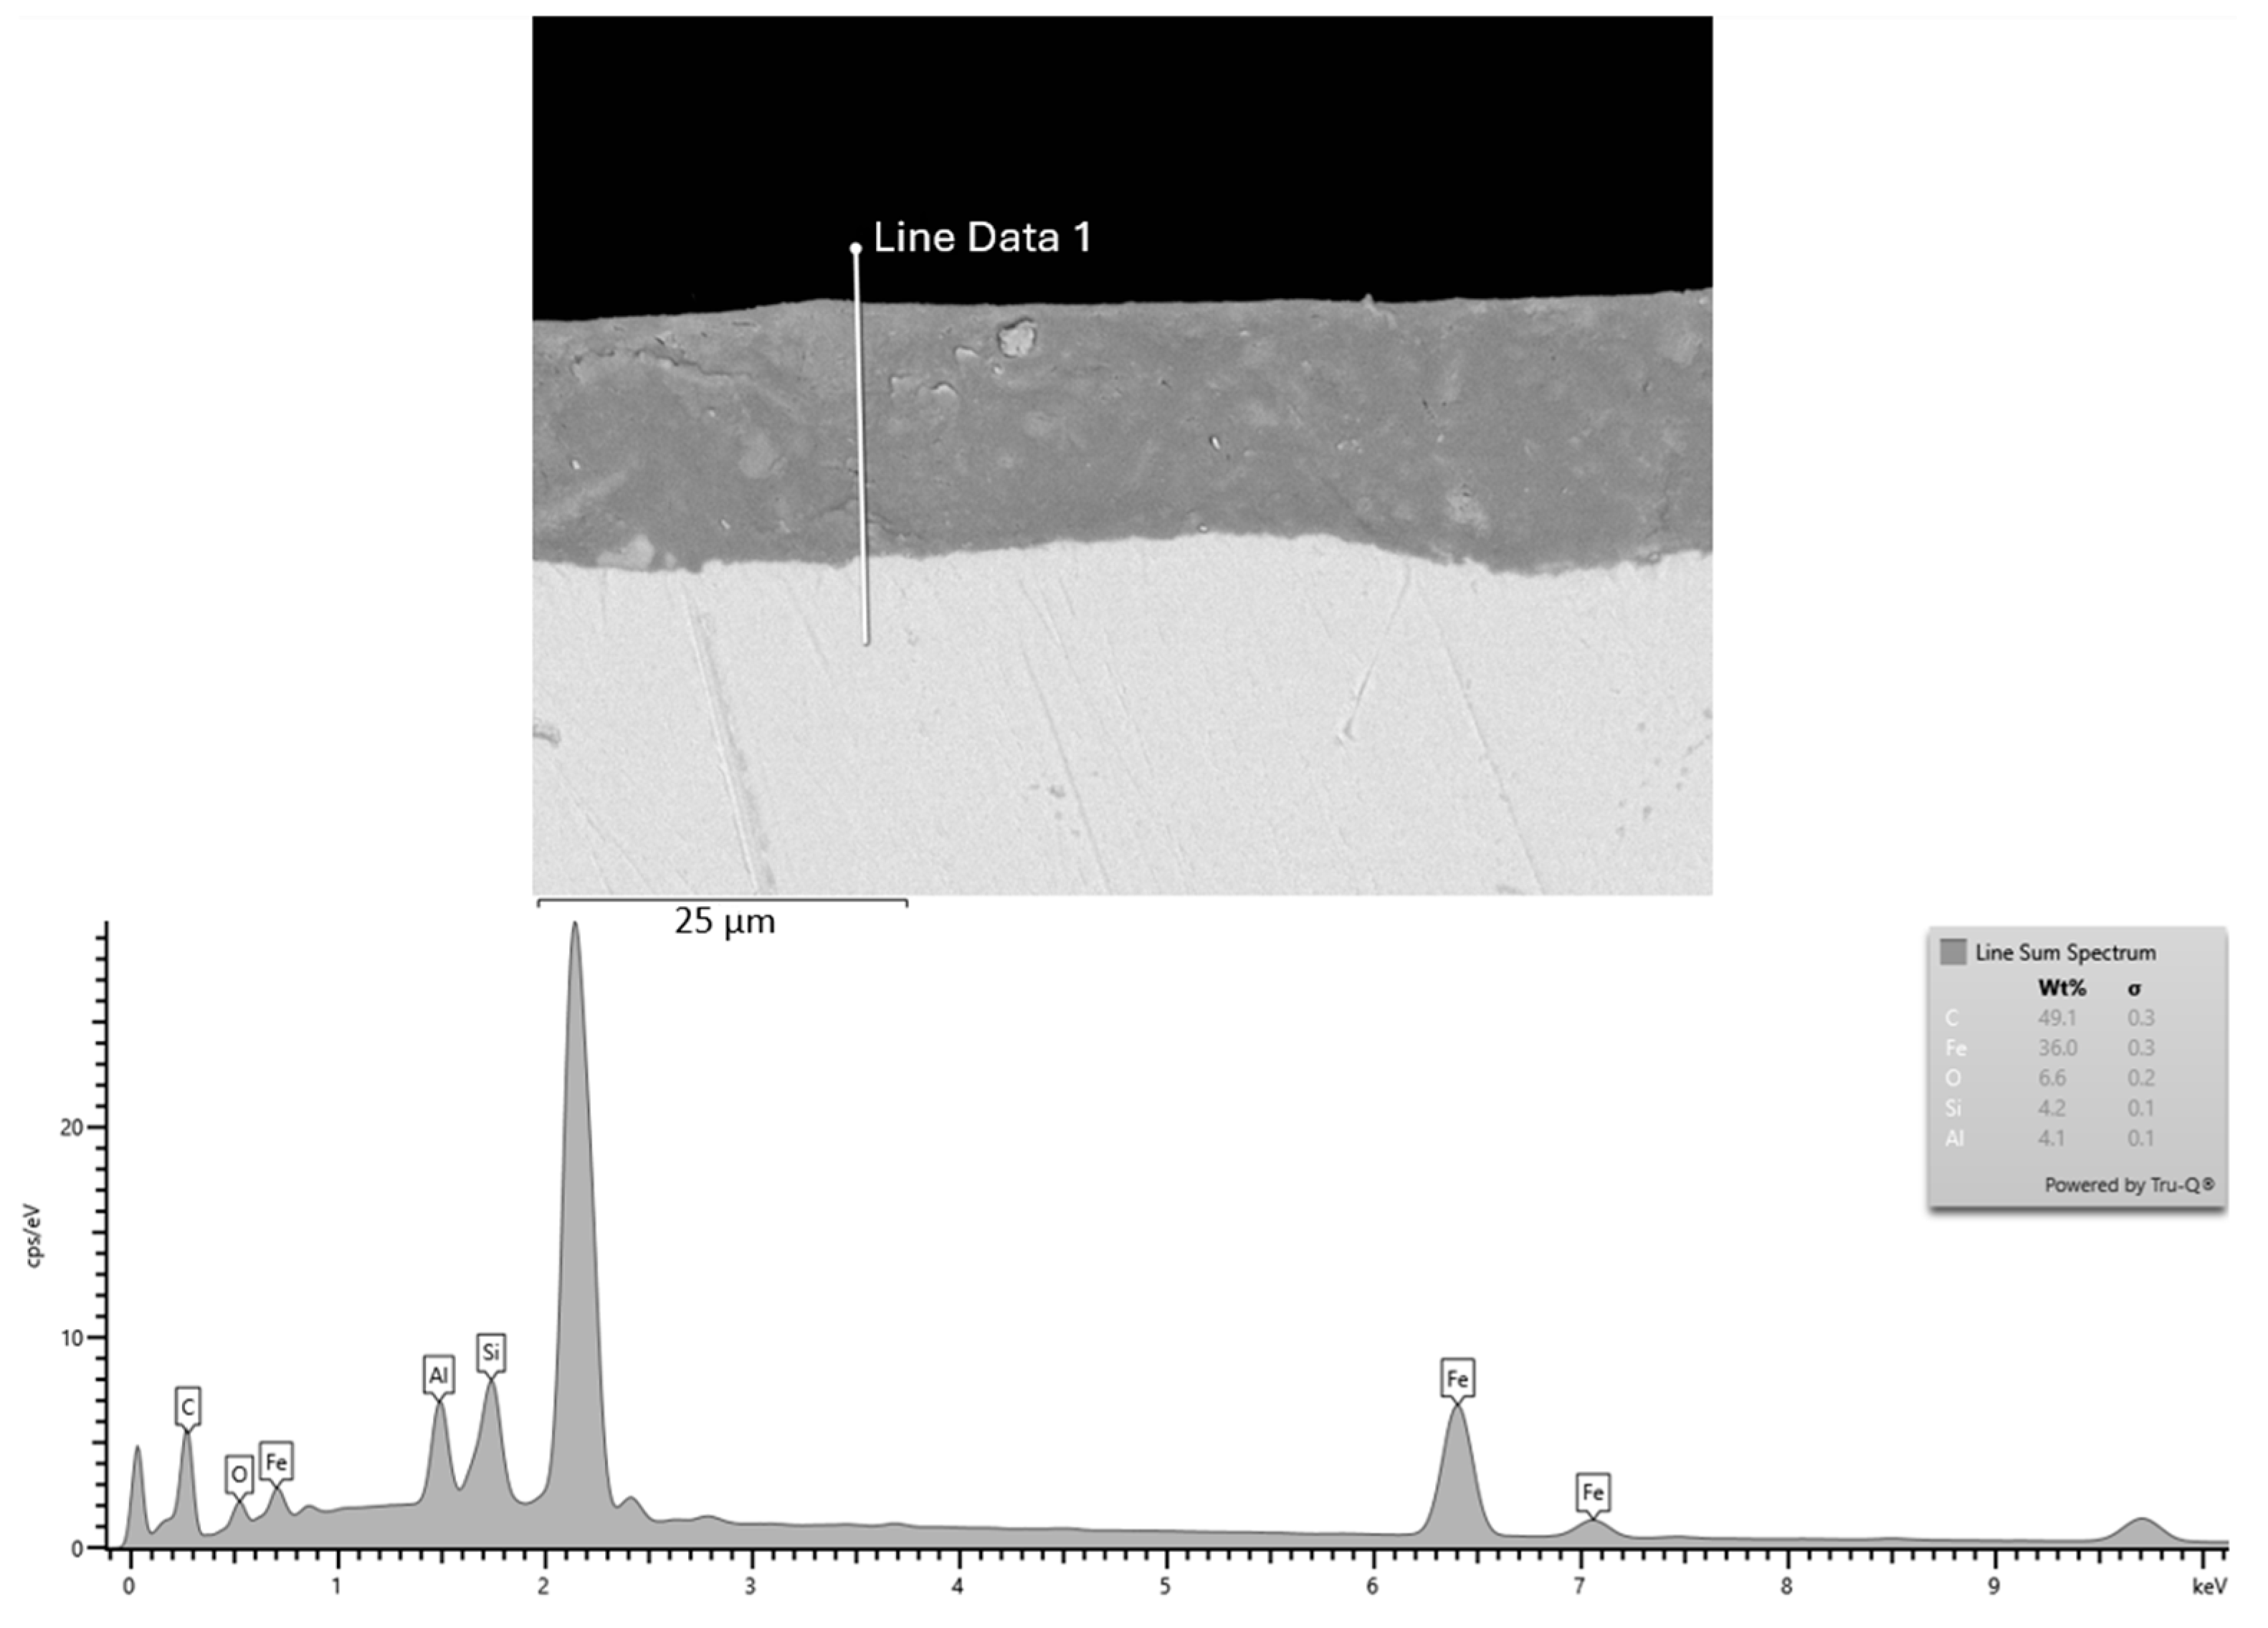
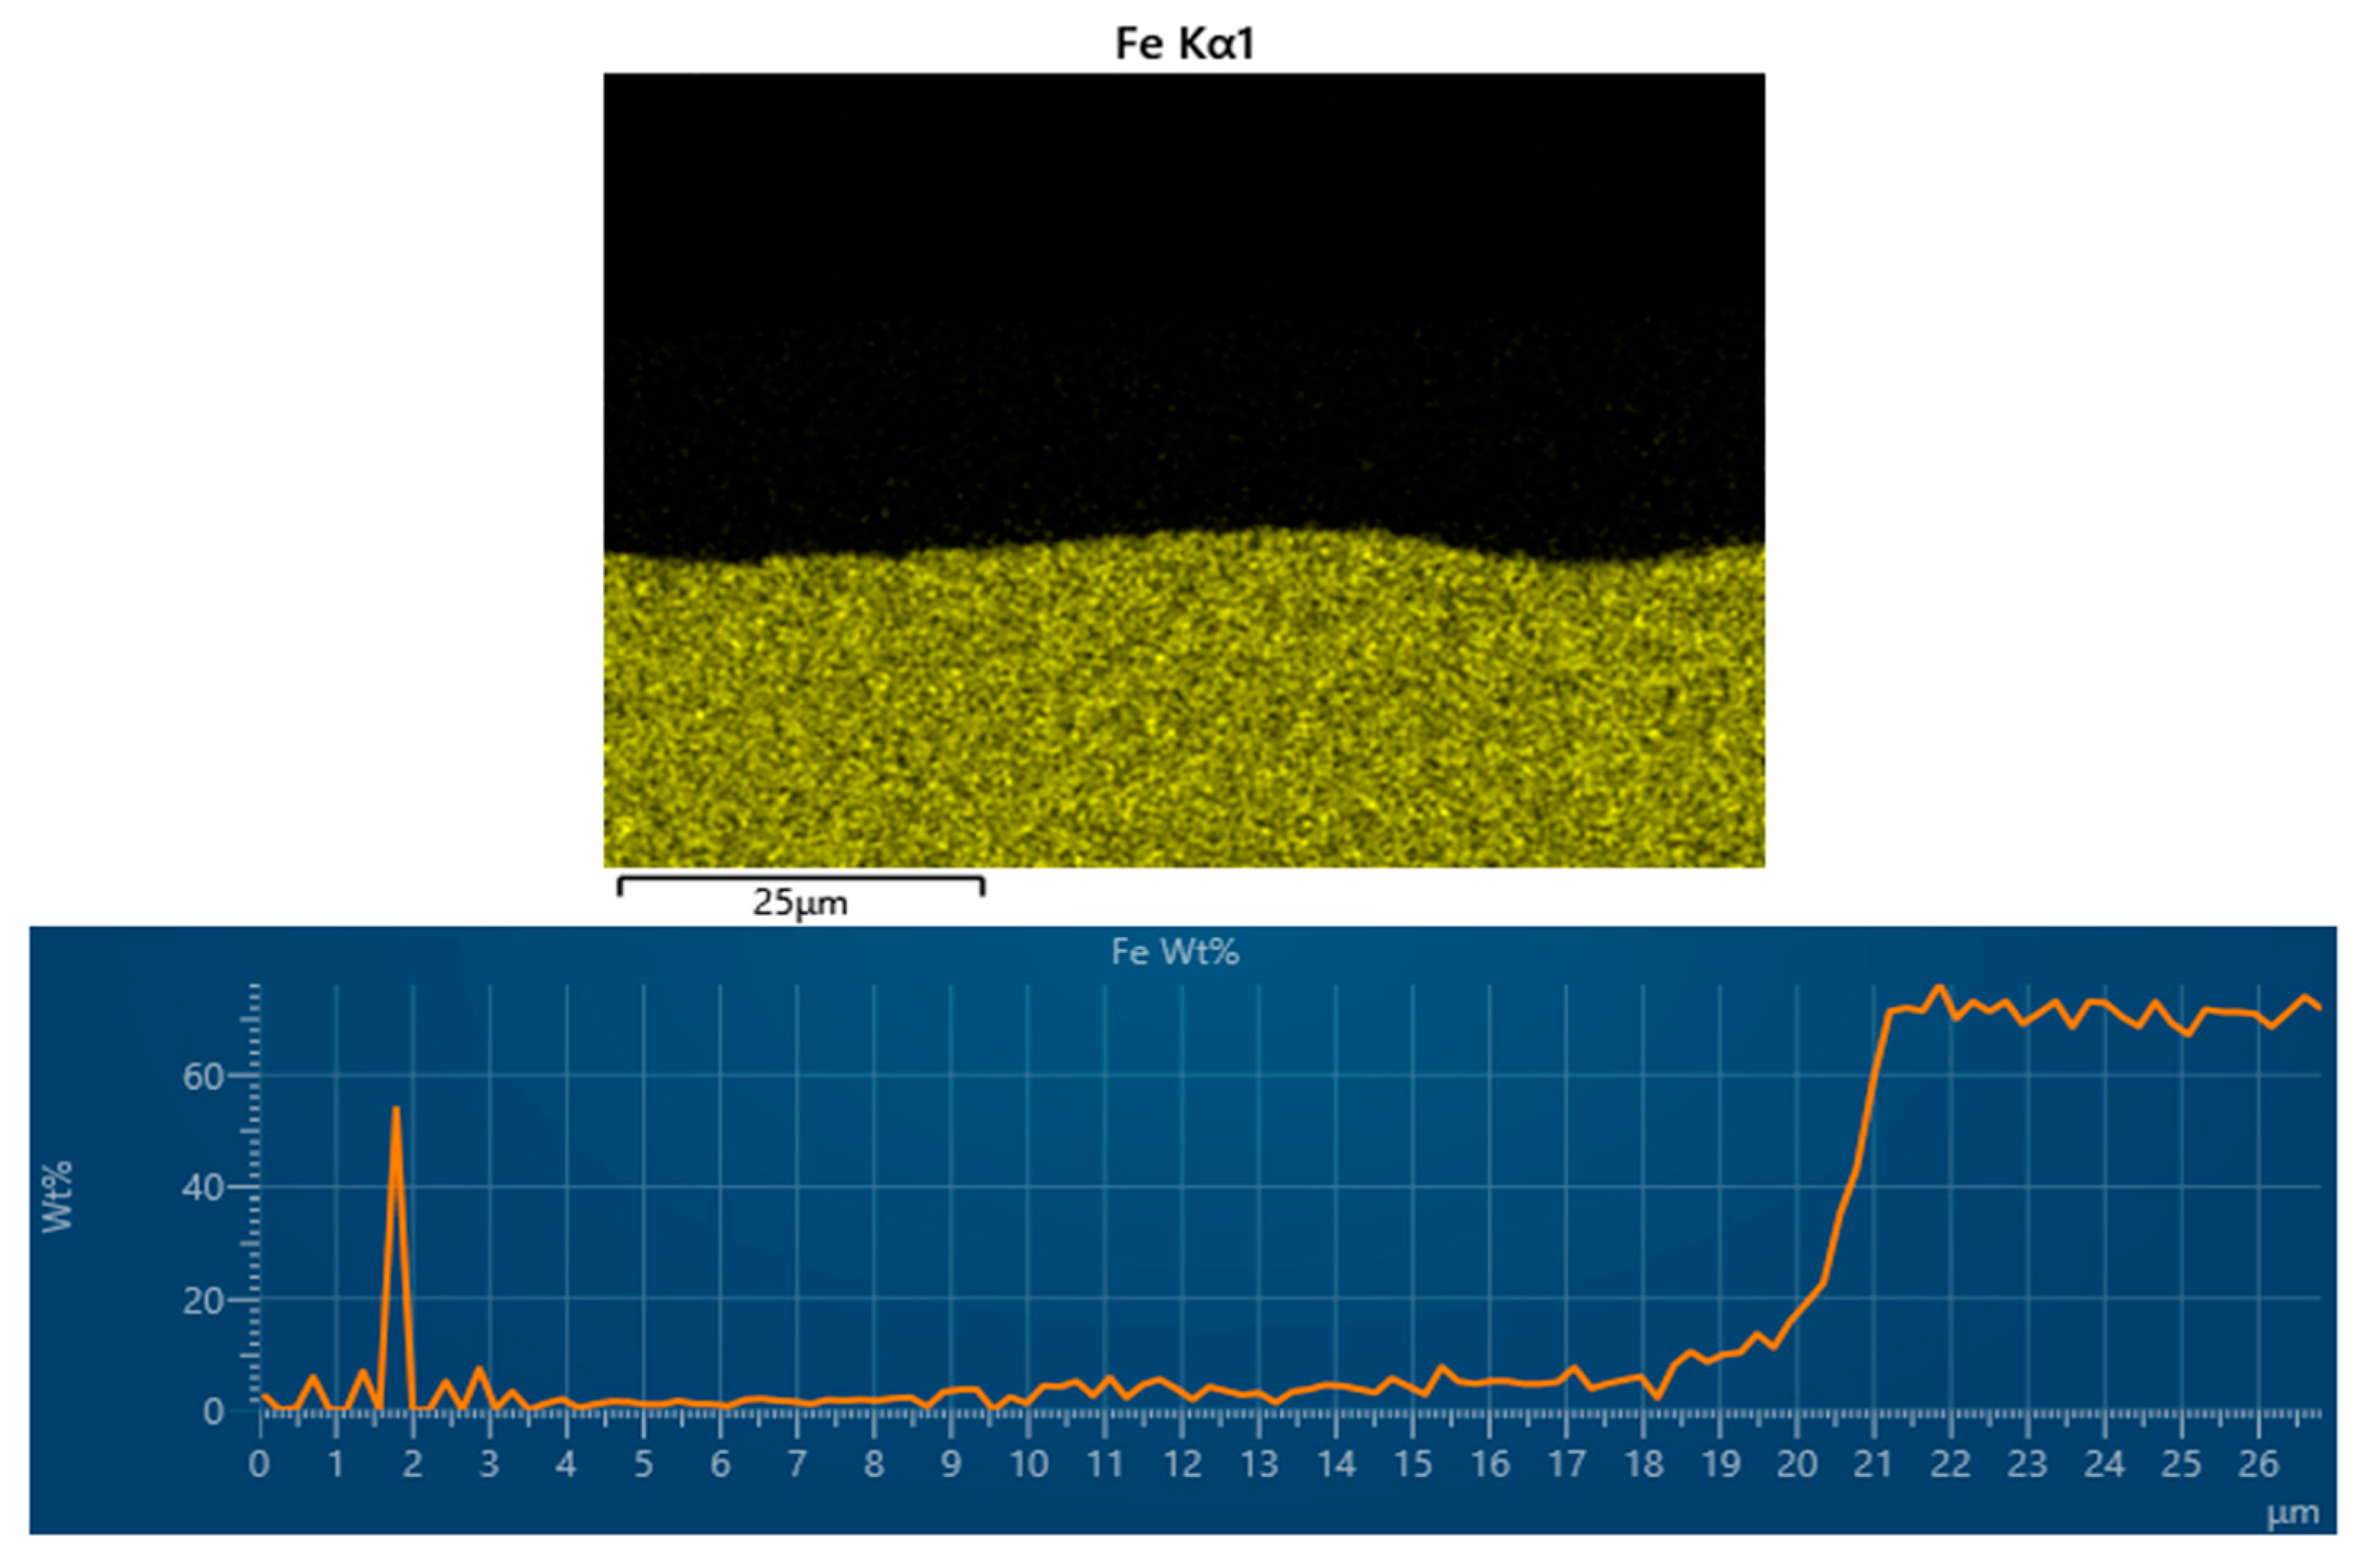
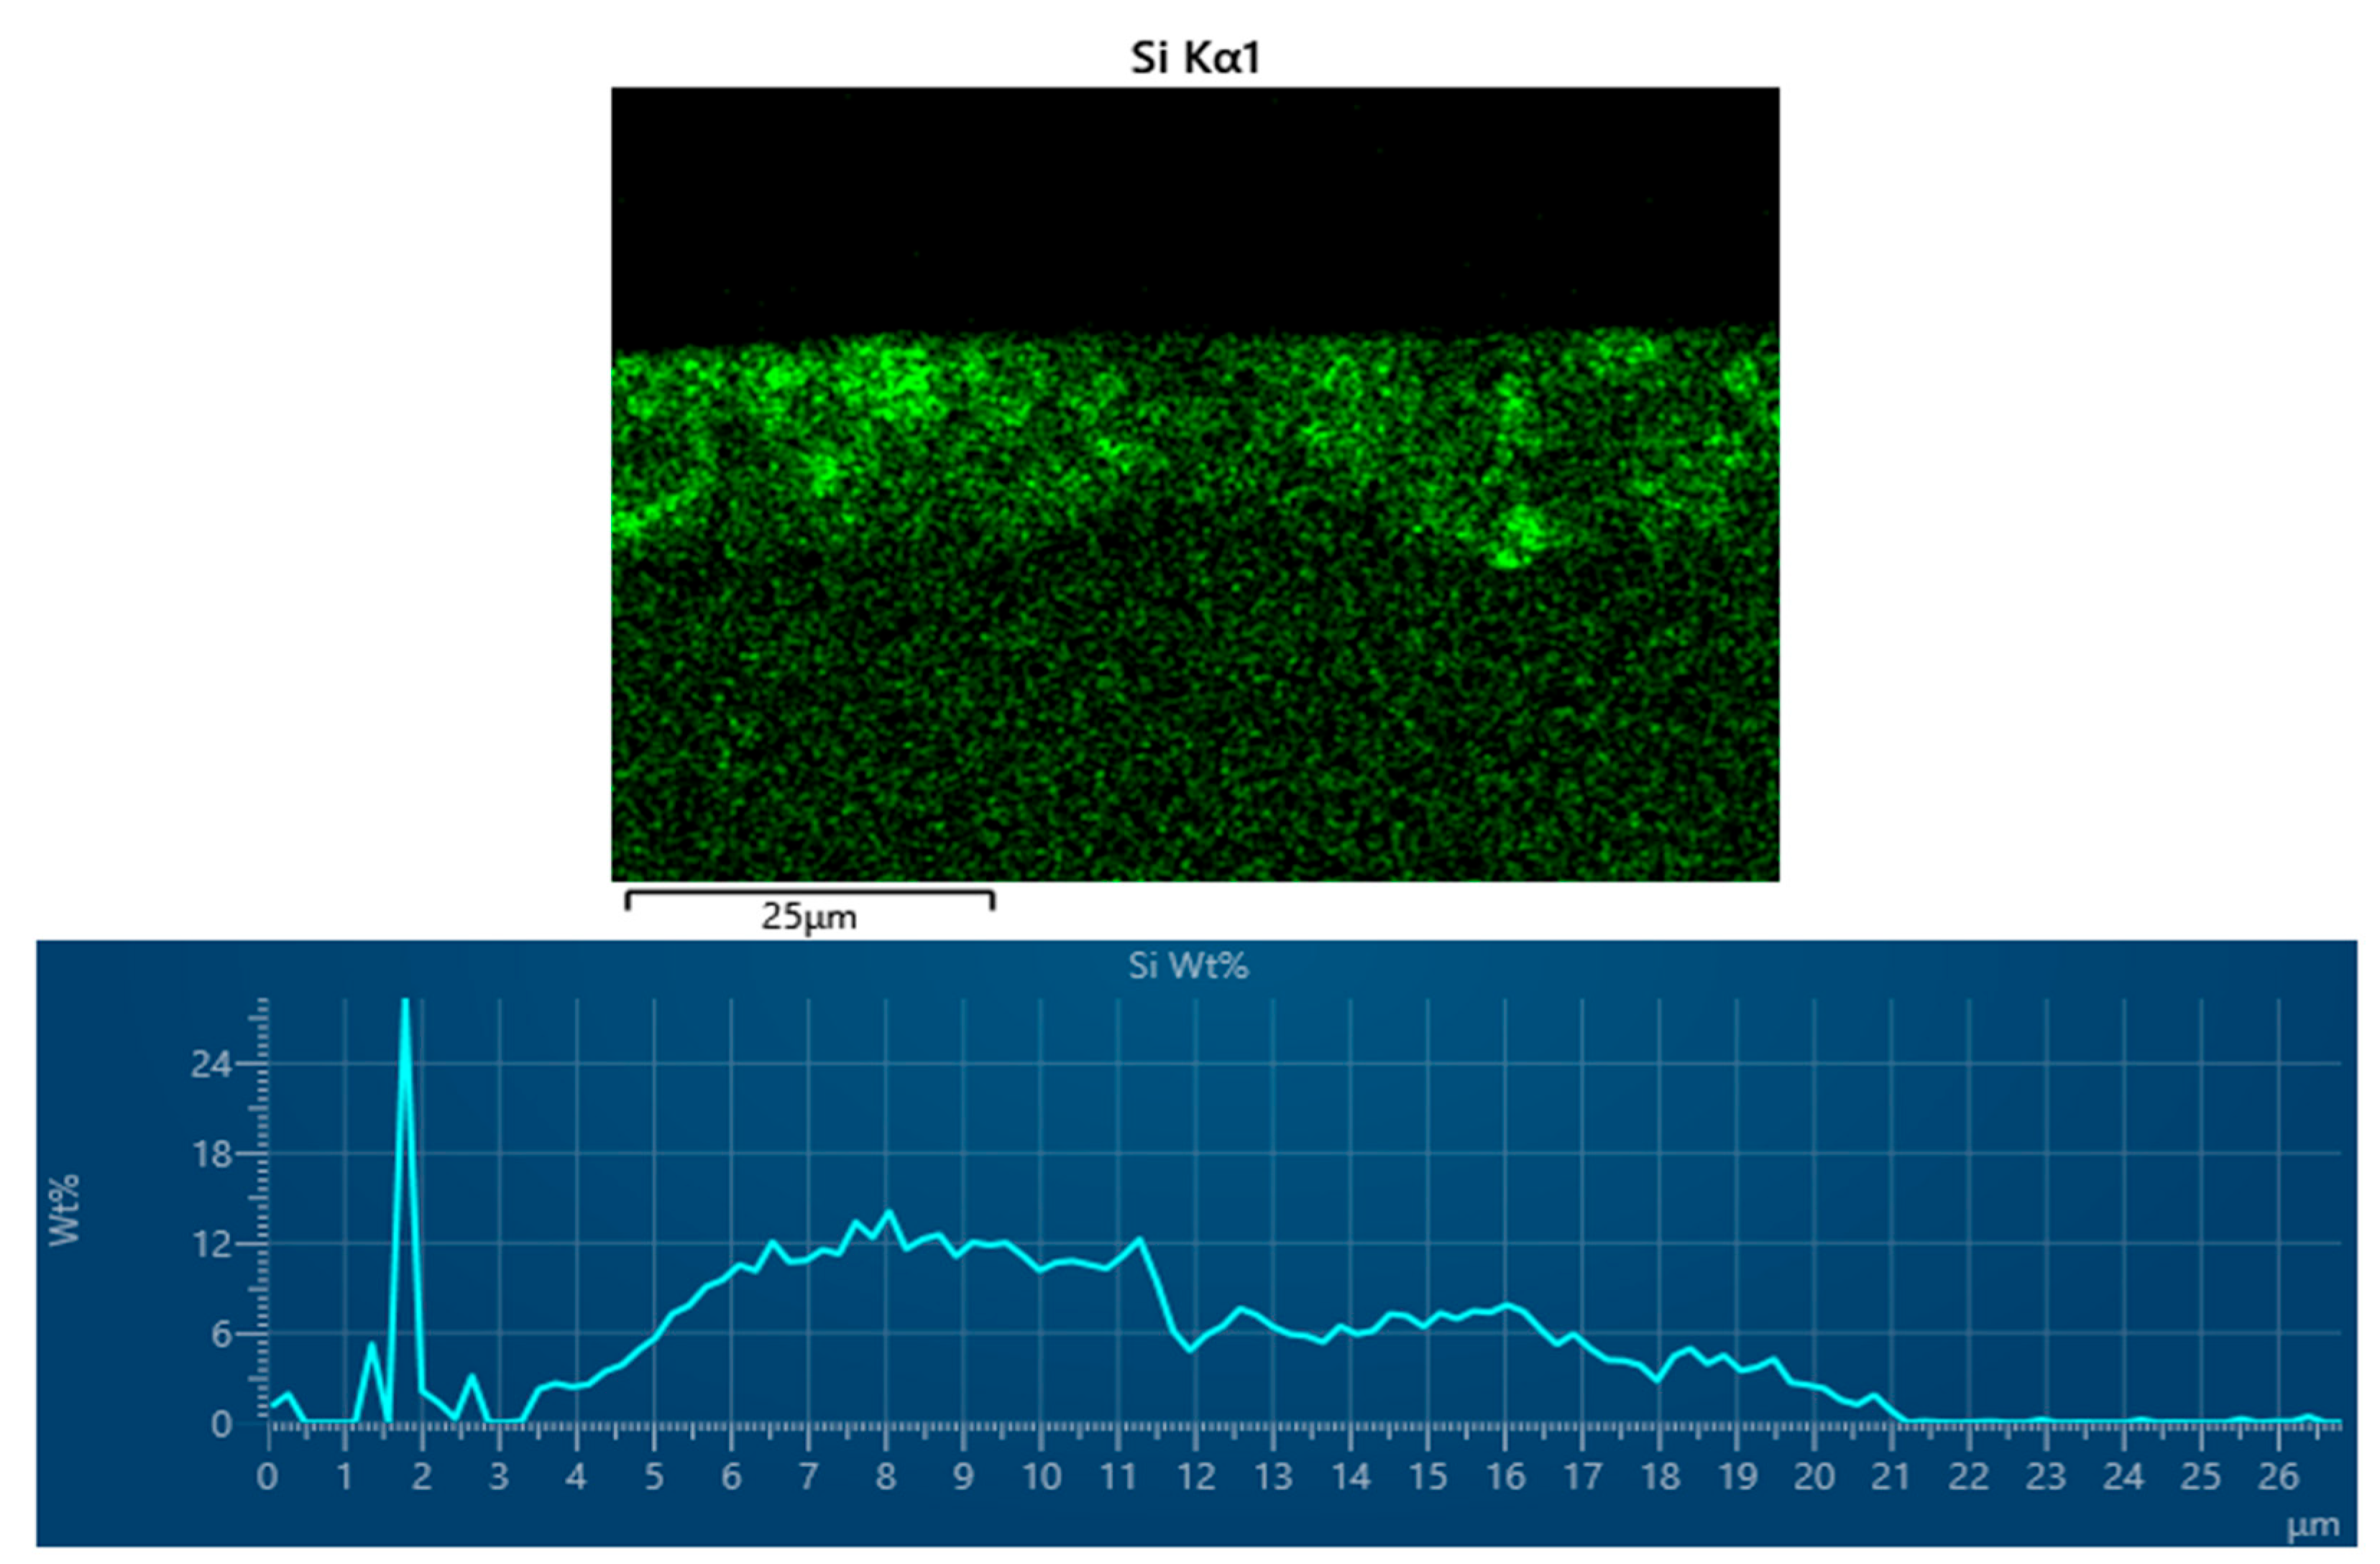
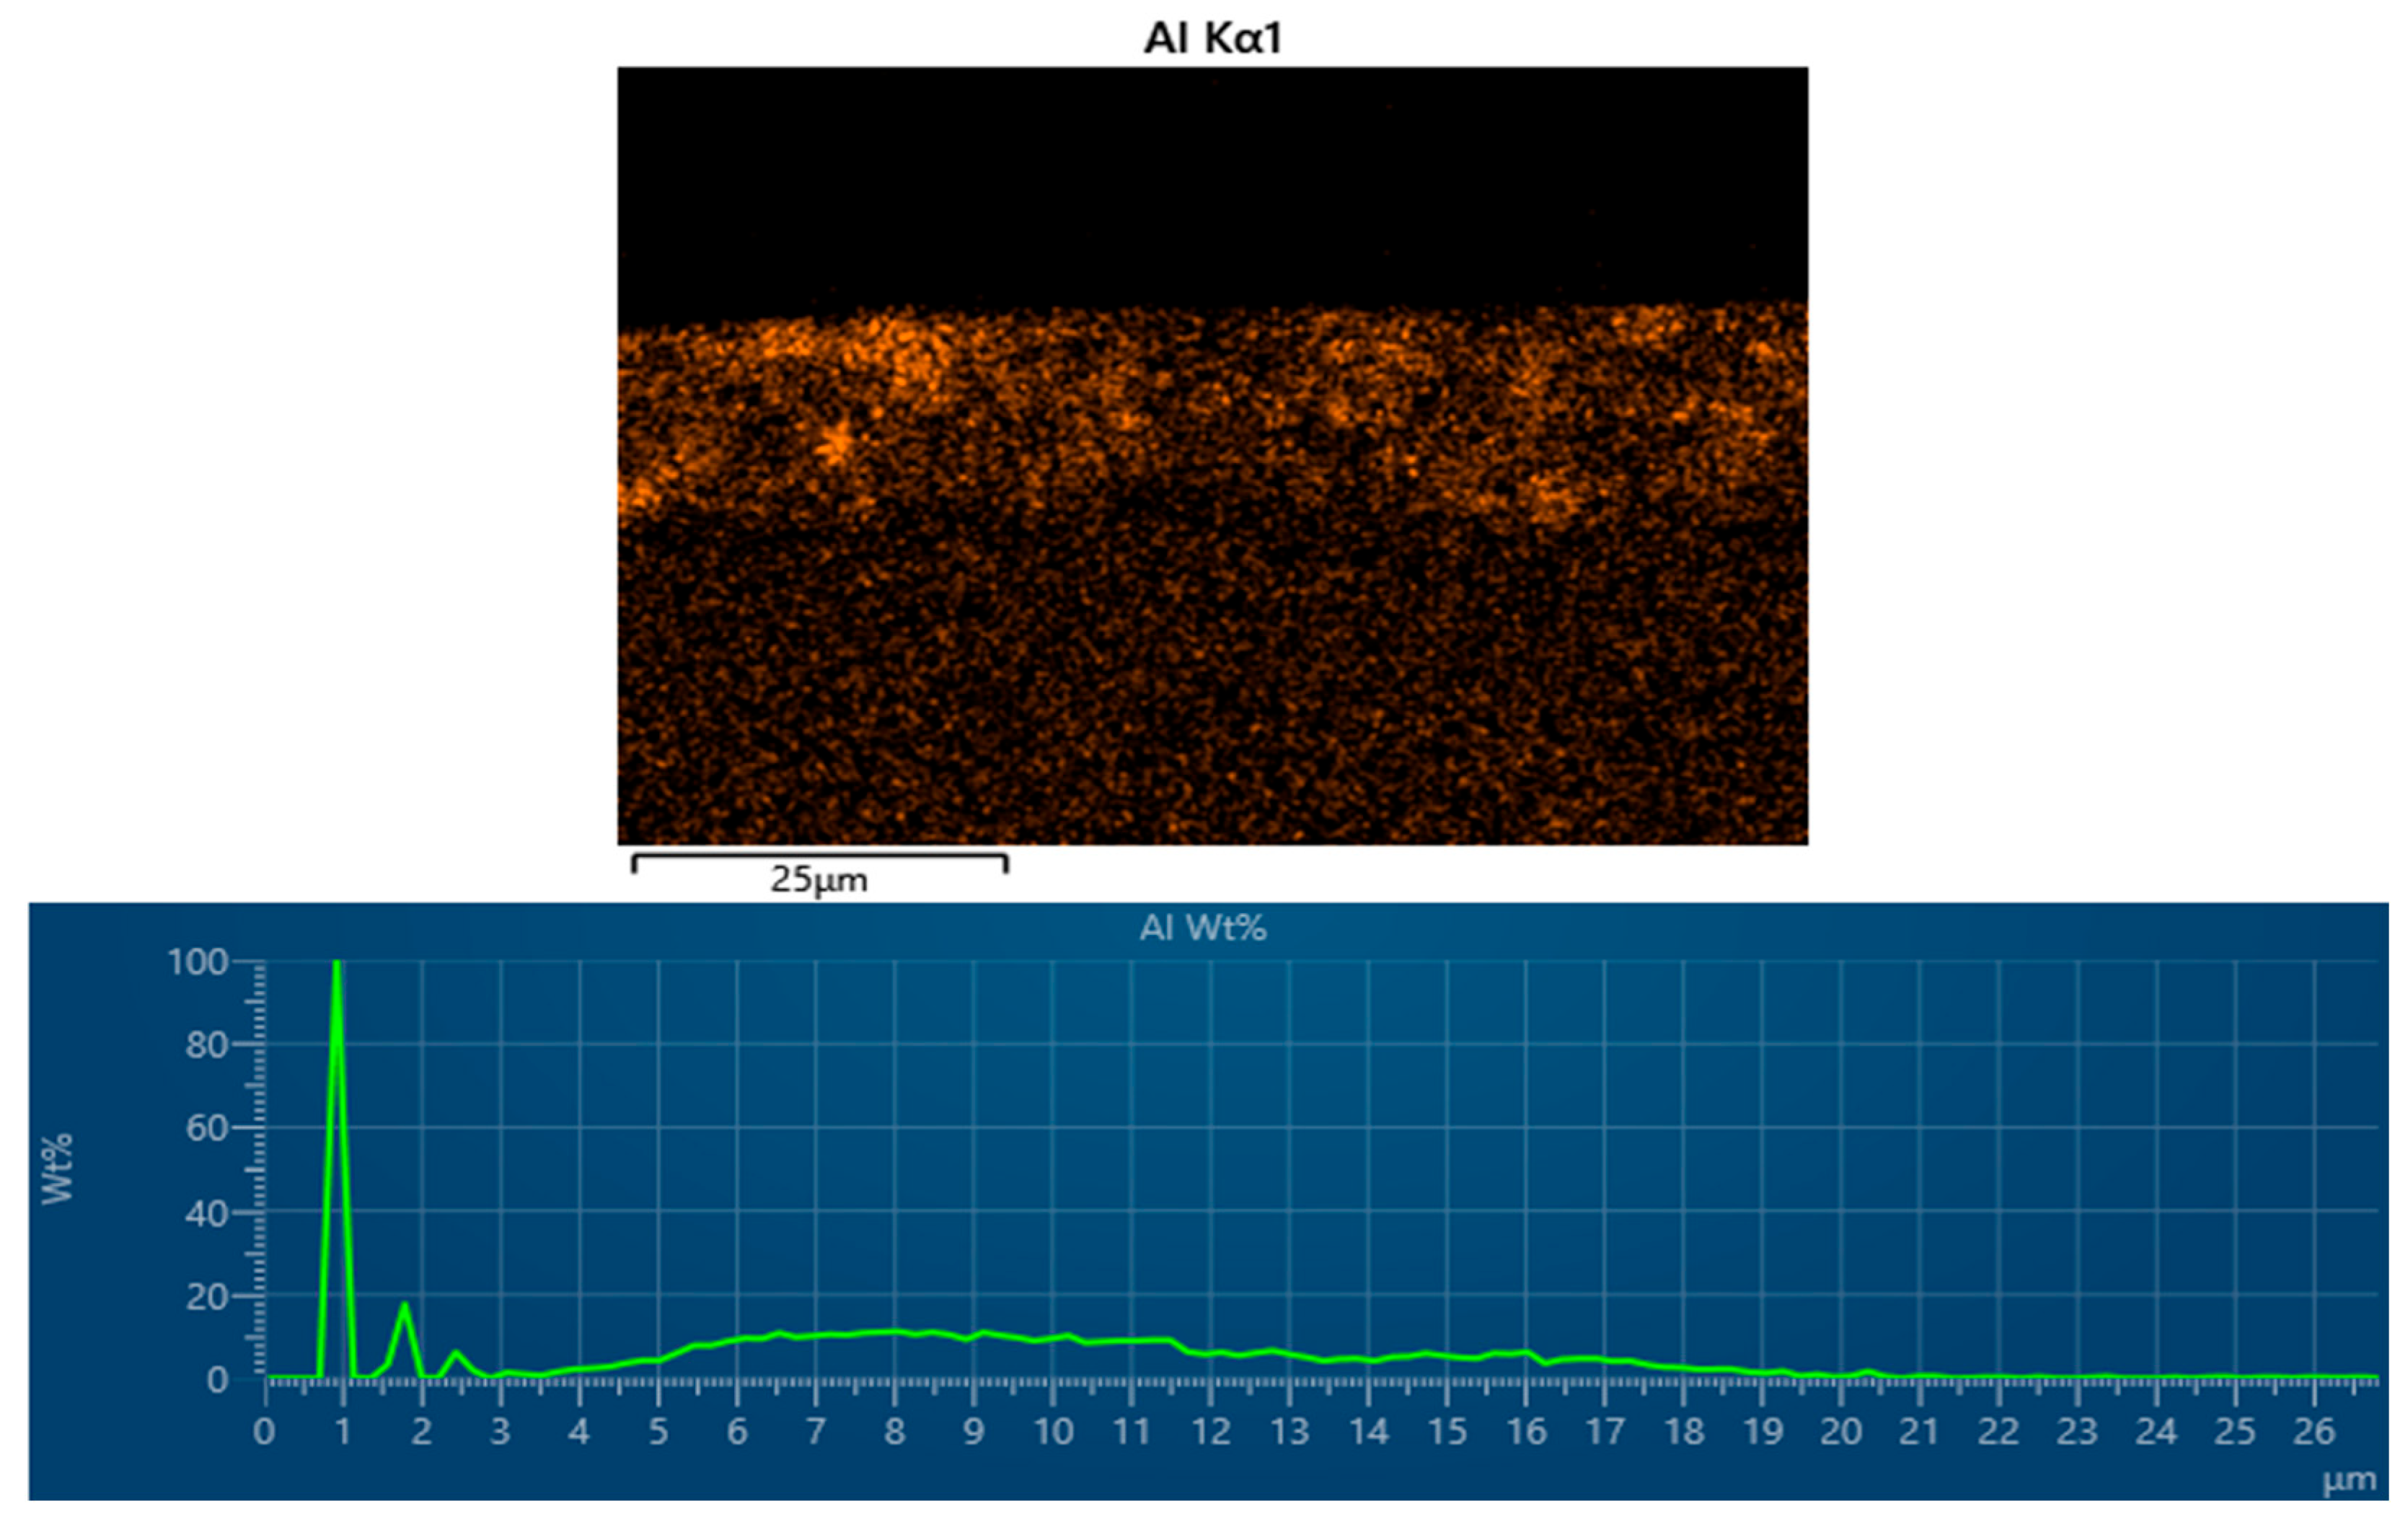
3.4. Energy-Dispersive X-Ray Spectroscopy (EDX) of Cataphoretic Layer

Energy-dispersive X-ray spectroscopy (EDX) is a very effective technique for analyzing elemental composition and assessing the quality of the interface between cataphoretic coatings and the substrate. When evaluating coating adhesion, EDX provides detailed information on the chemical composition of the coating and its interactions with the substrate. Since adhesion between coatings depends on their chemical and structural properties, EDX analysis allows the identification of whether there have been undesirable changes in composition that could affect the strength and stability of the bond. EDX also allows the detection of potential defects or inhomogeneities that may indicate adhesion problems, as well as assessing the uniformity of elemental distribution throughout the coating.
Figure 10 illustrates the results of energy-dispersive X-ray spectroscopy (EDX) conducted on a sample from a cataphoretic painting process, combining a scanning electron microscopy (SEM) image with the corresponding EDX spectrum. The SEM image presents a cross-sectional view of the sample, clearly showing two distinct regions: the upper layer, representing the cataphoretic paint coating, and the lower layer, corresponding to the metallic substrate. A vertical line, labeled “Line Data 1”, marks the analyzed region, crossing the interface between the paint layer and the substrate, enabling a detailed elemental composition analysis.
The EDX spectrum, displayed beneath the SEM image, provides information on the elemental composition along the analyzed path. The X-axis represents energy levels (keV), and the Y-axis shows counts per energy unit, with peaks indicating the presence of specific elements. The spectrum reveals that the upper layer is dominated by carbon, comprising approximately 49.1 wt.%, indicative of the organic nature of the cataphoretic paint. Iron peaks, accounting for 36 wt.%, highlight the metallic substrate, likely steel. Minor peaks for oxygen (~6.6 wt.%), silicon (~4.2 wt.%), and aluminum (~4.1 wt.%) suggest the presence of oxidized compounds, paint additives, or surface contaminants. Analysis demonstrates a clear boundary between the paint layer and the substrate, indicating the uniformity of the applied coating. The presence of oxygen at the interface points to surface oxidation, which may enhance adhesion between the organic paint and the metallic substrate.
The elemental map shown in Figure 11 for carbon (C) highlights its high concentration in the upper region, corresponding to the cataphoretic paint layer. The mapping shows a uniform distribution of carbon within the coating, with a clear demarcation at the interface between the coating and the substrate. The wt.% profile graph for carbon demonstrates consistent concentration in the coating layer, peaking above 80 wt.% near the surface. Beyond the coating–substrate interface (approximately 20–25 µm from the surface), the carbon concentration drops sharply, confirming its absence in the metallic substrate.
The elemental map shown in Figure 12 for iron (Fe) shows its dominance in the lower region, representing the substrate. The mapping indicates a uniform distribution within the substrate, while confirming the lack of significant iron content in the cataphoretic paint layer. The wt.% profile graph for iron exhibits a minimal presence in the coating layer, with concentrations increasing sharply at the interface. Beyond the boundary (approximately 20–25 µm from the surface), iron stabilizes at concentrations exceeding 60 wt.%, reflecting the composition of the metallic substrate.
The oxygen (O) elemental map (Figure 13) illustrates a prominent presence in the upper region, which aligns with the cataphoretic paint layer. The distribution of oxygen appears relatively consistent throughout the coating. The wt.% profile for oxygen indicates a peak near the surface, with a concentration reaching approximately 60 wt.%. Moving towards the coating–substrate interface (about 20–25 µm from the surface), the oxygen concentration drops significantly, signifying its near absence in the underlying metal substrate.
The elemental map for silicon (Si) shown in Figure 14 clearly shows its predominant presence in the upper region of the sample, which corresponds to the coating layer. The silicon is evenly distributed within this layer, suggesting a well-formed and uniform coating. The weight percentage (wt.%) profile graph further supports this observation, displaying a peak silicon concentration of around 24 wt.% at the surface. This concentration decreases gradually, as it moves toward the coating–substrate interface. After this point, the silicon concentration becomes negligible, confirming that silicon is absent in the metallic substrate beneath the coating.
The elemental map for aluminum (Al) shown in Figure 15 illustrates its predominant presence in the substrate region, situated beneath the coating layer. Within the coating, aluminum is almost absent, and a sharp increase in its concentration is observed at the coating–substrate interface. This trend is further validated by the wt.% profile graph, which shows negligible aluminum content in the upper coating layer, followed by a steep rise in concentration near the interface. The concentration of aluminum remains consistently high (around 90–100 wt.%) within the substrate, indicating that aluminum is primarily confined to the metallic substrate and does not diffuse into the coating layer.
In conclusion, the energy-dispersive X-ray spectroscopy (EDX) analysis offers comprehensive insights into the elemental composition and distribution across a sample subjected to a cataphoretic painting process. The combination of scanning electron microscopy (SEM) imaging and EDX spectral data reveals a clear delineation between the cataphoretic coating layer and the underlying metallic substrate, with a marked transition at the coating–substrate interface. Elemental mapping and corresponding wt.% profile graphs highlight several critical features; the cataphoretic coating is predominantly composed of carbon, confirming the organic nature of the paint, while iron is primarily concentrated in the metallic substrate, with minimal presence in the coating. Minor elements, such as oxygen, silicon, and aluminum, are distributed in both layers, with oxygen primarily localized at the coating–substrate interface, suggesting its role in surface oxidation, which may facilitate improved adhesion between the coating and substrate. Silicon is predominantly confined to the coating layer, exhibiting a uniform distribution, while aluminum shows a sharp increase in concentration near the interface, confirming its confinement to the substrate. Additionally, the EDX analysis shows that there is no significant diffusion of iron or aluminum into the coating layer, reinforcing the separation between the organic paint and the metallic substrate. The uniform distribution of silicon within the coating further highlights the consistent structure of the deposited layer. These observations substantiate the uniformity and integrity of the cataphoretic coating, and the EDX data effectively demonstrate the elemental distribution and the absence of significant diffusion between the paint and metallic substrate. This study highlights the utility of EDX in assessing coating quality and substrate interactions, providing a detailed understanding of the elemental dynamics within composite coating systems. This behavior agreed with data observed by authors Nam et al. [42], Lovejoy et al. [43], Qi et al. [44], Dalfonso et al. [45], Tromp [46], and Sanchez et al. [47].

3.5. Summary of Results

The conducted experiments underscore the critical influence of deposition time and degreasing temperature on the formation of the coating layer during cataphoretic painting (KTL). The results consistently demonstrate that, as the KTL time increases, the layer thickness rises, reaching peak values at longer deposition durations. Specifically, at a deposition time of 7 min, the maximum thickness is achieved, whereas shorter times, such as 3 min, result in thinner coatings. The impact of voltage is equally significant; at 300 V, the layer thickness increases more steeply, with minimal reduction over time, suggesting that higher voltages promote a greater accumulation of material, particularly in the early deposition stages.
The role of degreasing temperature in determining the final layer thickness is also evident. Lower degreasing temperatures, such as 40 °C, are associated with higher thicknesses, especially for shorter deposition times, whereas higher temperatures, such as 80 °C, yield reduced thicknesses under identical conditions. This trend suggests that lower temperatures enhance the coating formation process by altering surface properties or interface interactions. Furthermore, intermediate degreasing temperatures, such as 60 °C, provide an optimal balance between temperature and voltage conditions, leading to more consistent layer thicknesses across varying deposition times.
A comparison between experimental results and model predictions further validates these findings. The experimental measurements indicate a significant dependency of layer thickness on deposition time, applied voltage, solution concentration, and temperature. For instance, at 300 V and a deposition time of 7 min, the maximum thickness reaches 22.56 µm, while at 200 V under the same conditions, the thickness reduces to 18.43 µm. These results confirm that deposition time and voltage are the primary determinants of layer thickness.
The statistical model corroborates these experimental observations, explaining approximately 75% of the variability in layer thickness, with an adjusted coefficient of determination (R2) of 70.79%. The model was found to be statistically significant (p < 0.0001), highlighting its reliability in describing the relationship between key process parameters and the resulting layer characteristics. Notably, while solution concentration and degreasing temperature influence layer thickness, their effects are secondary compared to deposition time and voltage. This aligns with the model’s predictive accuracy, as evidenced by the minimal deviations between experimental data and model estimates.
The comparison of experimental and predicted layer thicknesses (Figure 16) shows systematic differences between model and real values. At a voltage of 200 V and a degreasing agent concentration of 15 g·L−1, the measured thickness at 3 and 5 min was lower than predicted, with differences ranging from 1.2558 µm to 2.4514 µm. At 4 min the measured value was slightly higher than predicted (0.3624 µm), while at 7 min, it was again lower (2.2809 µm). At 250 V, shorter times (3–5 min) showed that the measured thickness was always lower than predicted, with differences around 2 µm. At 6 min, there was an increase in measured thickness above the predicted value (+1.6378 µm), but at 7 min, the difference was the largest (−3.0906 µm), indicating a possible inaccuracy of the prediction model at longer times. At 300 V, the measured thickness was always lower than the predicted thickness at 3–5 min, with differences ranging from 2.0351 µm to 2.7950 µm. At 6 min, there was a significant increase in thickness above the predicted value (+2.8805 µm), but at 7 min, it was again lower than predicted (−1.7219 µm).
At 200 V and a degreaser concentration of 55 g·L−1 the measured thickness at 3 and 5 min was lower than predicted, with differences ranging from 3.052 µm to 4.467 µm. At 4 min, the measured value was higher than predicted (−2.899 µm), while at 7 min, it was again lower (4.083 µm). At 250 V, shorter times (3–5 min) showed that the measured thickness was always lower than predicted, with differences around 4 µm. At 6 min, there was an increase in measured thickness above the predicted value (+5.130 µm), but at 7 min, the difference was the largest (−4.402 µm), indicating a possible inaccuracy of the prediction model at longer times. At 300 V, the measured thickness was always lower than predicted at 3–5 min, with differences ranging from 2.962 µm to 3.699 µm. At 6 min, there was a significant increase in thickness above the predicted value (4.599 µm), but at 7 min, it was again lower than predicted (3.101 µm).
In summary, the experimental findings align closely with the theoretical predictions of the statistical model. The most influential factors in determining layer thickness are deposition time and applied voltage, with solution concentration and temperature playing supplementary roles. The consistency between experimental results and model predictions supports the model’s applicability in optimizing cataphoretic painting processes under varying operational conditions.

4. Conclusions

This study focused on the inter-relationship between deposition time, degreasing temperature, and applied voltage in the cataphoretic painting process, examining their cumulative effect on the thickness of the formed layers. The results showed that the optimal settings of these parameters can significantly affect the quality and uniformity of the coating, which is important for industrial surface treatment applications.
Key findings:
  • The layer thickness increases with KTL deposition time, with the maximum thickness achieved at 7 min, while shorter times (e.g., 3 min) result in thinner coatings.
  • The applied voltage significantly influences the layer thickness; at 300 V, the layer thickness increases more steeply, and the reduction over time is minimal, indicating a higher material accumulation in the early stages of deposition.
  • Lower degreasing temperatures (e.g., 40 °C) lead to higher layer thickness, while higher temperatures (e.g., 80 °C) result in a reduction in thickness.
  • The optimal combination of voltage and temperature (e.g., 60 °C) leads to more uniform layer thicknesses across different deposition times.
For future research, it would be beneficial to focus on the long-term stability and durability of cataphoretic coatings under real-world operational conditions, including corrosion resistance and mechanical property tests. This would provide a better understanding of the practical use and lifespan of coatings in industrial applications. A promising direction is also the expansion of the predictive model to include additional factors, such as electrolyte pH, solution conductivity, and surface roughness, which would increase the accuracy of layer thickness predictions and enable the better optimization of the cataphoretic painting process.
The research provided valuable insights into the impact of deposition time, voltage, and degreasing temperature on the thickness of the cataphoretic coating, but it has certain limitations. The study focused on specific values of voltage (200–300 V), deposition time (3–7 min), and degreasing temperature (40–80 °C), and expanding these parameters could offer a more comprehensive perspective. Additionally, the research mainly focused on layer thickness without a detailed analysis of factors such as electrolyte pH, solution conductivity, or surface pretreatment, whose investigation could provide a better understanding of the overall process.
The research was conducted in controlled laboratory conditions, which may limit the applicability of the results to real industrial environments. In actual operational conditions, factors such as electrolyte impurities or variations in surface pretreatment could influence the results. Additionally, while the statistical model explained about 75% of the layer thickness variability, there is room for improvement. Further refinement of factor interactions and testing additional variables could enhance the accuracy of layer thickness predictions. These limitations open opportunities for further research to expand findings and contribute to optimizing cataphoretic painting, particularly for industrial applications.

Author Contributions

P.F. and D.P. conceived and designed the experiments and wrote the paper; J.D., M.G. and P.M. analyzed and evaluated data, processed data, and performed the experiments and measurements. All authors have read and agreed to the published version of the manuscript.

Funding

This research received no external funding.

Institutional Review Board Statement

Not applicable.

Informed Consent Statement

Not applicable.

Data Availability Statement

The original contributions presented in the study are included in the article, further inquiries can be directed to the corresponding author.

Acknowledgments

This research has been designed in the framework of the projects VEGA no. 1/0488/23 and KEGA 009TUKE-4/2024, which were granted by the Ministry of Education, Science, Research and Sport of the Slovak Republic, and this publication is the result of the project “Development of excellent research capacities in the field of additive technologies for the Industry of the 21st century”, ITMS: 313011BWN5, supported by the Operational Program Integrated Infrastructure funded by the ERDF.

Conflicts of Interest

The authors declare no conflicts of interest. The founding sponsors had no role in the design of the study; in the collection, analyses, or interpretation of the data; in the writing of the manuscript; or in the decision to publish the results.

References

  1. Ouchi, T.; Sadoway, D.R. Positive current collector for Li∥Sb-Pb liquid metal battery. J. Power Sources 2017, 357, 158–163. [Google Scholar] [CrossRef]
  2. Kirchgeorg, T.; Weinberg, I.; Hoernig, M.; Baier, R.; Schmid, M.J.; Brockmeyer, B. Emissions from corrosion protection systems of offshore wind farms: Evaluation of the potential impact on the marine environment. Mar. Pollut. Bull. 2018, 136, 257–268. [Google Scholar] [CrossRef] [PubMed]
  3. Flores, J.F.; Neville, A.; Kapur, N.; Gnanavelu, A. Assessing the resistance of metal matrix composites and their microstructural integrity under erosion-corrosion. Wear 2011, 271, 1331–1340. [Google Scholar] [CrossRef]
  4. Babaei, N.; Yeganeh, H.; Gharibi, R. Anticorrosive and self-healing waterborne poly(urethane-triazole) coatings made through a combination of click polymerization and cathodic electrophoretic deposition. Eur. Polym. J. 2019, 112, 636–647. [Google Scholar] [CrossRef]
  5. Moradi, M.; Yeganeh, H.; Pazokifard, S. Synthesis and assessment of novel anticorrosive polyurethane coatings containing an amine-functionalized nanoclay additive prepared by the cathodic electrophoretic deposition method. RSC Adv. 2016, 6, 28089–28102. [Google Scholar] [CrossRef]
  6. Aghili, M.; Yazdi, M.K.; Ranjbar, Z.; Jafari, S.H. Anticorrosion performance of electro-deposited epoxy/amine functionalized graphene oxide nanocomposite coatings. Corros. Sci. 2021, 179, 109143. [Google Scholar] [CrossRef]
  7. Zivkovic, L.S.; Jegdic, B.V.; Andric, V.; Rhee, K.Y.; Bajat, J.B.; Miskovic-Stankovic, V.B. The effect of ceria and zirconia nanoparticles on the corrosion behaviour of cataphoretic epoxy coatings on AA6060 alloy. Prog. Org. Coat. 2019, 136, 105219. [Google Scholar] [CrossRef]
  8. Oliviera, M.G.; Romano, A.P.; Vandermiers, C.; Mathieu, X.; Poelman, M. Influence of the stress generated during an ageing cycle on the barrier properties of cataphoretic coatings. Prog. Org. Coat. 2008, 63, 323–329. [Google Scholar] [CrossRef]
  9. Garcia, S.J.; Rodriguez, M.T.; Izquierdo, R.; Suay, J. Evaluation of cure temperature effects in cataphoretic automotive primers by electrochemical techniques. Prog. Org. Coat. 2007, 60, 303–311. [Google Scholar] [CrossRef]
  10. Zanella, C.; Pedrotti, A.; Fedel, M.; Deflorian, F. Influence of the electrochemical behavior of metal substrates on the properties of cataphoretic clearcoat. Prog. Org. Coat. 2014, 77, 1987–1992. [Google Scholar] [CrossRef]
  11. Calovi, M.; Russo, F.; Rossi, S. Synergic behavior of graphene-based filler and thermochromic pigments in cataphoretic coatings. Prog. Org. Coat. 2021, 2021, 105978. [Google Scholar]
  12. Darowicki, K.; Slepski, P.; Szocinski, M. Novel application of dynamic electrochemical impedance monitoring to a cataphoretic coating process. Prog. Org. Coat. 2020, 149, 105906. [Google Scholar]
  13. Sternadelova, K.; Krupova, H.; Matysek, D.; Mohyla, P. Quality assessment of the vitreous enamel coating applied to the weld joint. MM Sci. J. 2023, 2023, 6333–6338. [Google Scholar]
  14. Brüggemann, M.; Rach, A. Electrocoat: Formulation and Technology; Vincentz Network: Hannover, Germany, 2020. [Google Scholar]
  15. Goldschmidt, A.; Streitberger, H.J. BASF Handbuch Lackiertechnik; Vincentz Network: Hannover, Germany, 2014. [Google Scholar]
  16. Brock, T.; Groteklaes, M.; Mischke, P. European Coatings Handbook, 2nd ed.; Vincentz Network: Hannover, Germany, 2010. [Google Scholar]
  17. Ovsik, M.; Manas, M.; Stanek, M.; Dockal, A.; Mizera, A.; Fluxa, P.; Bednarik, M.; Adamek, M. Nano-mechanical properties of surface layers of polyethylene modified by irradiation. Materials 2020, 13, 929. [Google Scholar] [CrossRef]
  18. Akafuah, N.K.; Poozesh, S.; Salaimeh, A.; Patrick, G.; Lawler, K.; Saito, K. Evolution of the automotive body coating process-A Review. Coatings 2016, 6, 24. [Google Scholar] [CrossRef]
  19. Skotnicki, W.; Jedrzejczyk, D. The comparative analysis of the coatings deposited on the automotive parts by the cataphoresis method. Materials 2021, 14, 6155. [Google Scholar] [CrossRef]
  20. Jaczewski, M. Industrial Paint Coatings for Metal Surfaces. In Tikkurila Protective Coating Guide, 2nd ed.; Tikkurila: Vantaa, Finland, 2008. [Google Scholar]
  21. Javidi, A.; Rieger, U.; Eichlseder, W. The effect of machining on the surface integrity and fatigue life. Int. J. Fatigue 2008, 30, 2050–2055. [Google Scholar] [CrossRef]
  22. Rivera, J.L.; Reyes-Carrillo, T. A framework for environmental and energy analysis of the automobile painting process. Procedia CIRP 2014, 15, 171–175. [Google Scholar]
  23. Goeke, S.; Biermann, D.; Stickel, D.; Stemmer, P.; Fischer, A.; Geenen, K.; Huth, S.; Theisen, W. Enhancing the surface integrity of tribologically stressed contacting surfaces by an adjusted surface topography. Procedia CIRP 2014, 13, 214–218. [Google Scholar]
  24. VDA 239-100; Spray and Micro-Dosage Application—Technical Cleanliness of Components in Contact with Fluids. Normservis, 2016. Available online: https://eshop.normservis.sk/norma/vda-239-100-1.5.2016.html (accessed on 15 January 2025).
  25. Marine Steels. DIN EN 10130 DC01 Steel—Cold Rolled Low Carbon Steel Plate. Available online: https://sk.marinesteels.com/stainless-steel/stainless-steel-plate/din-en-10130-dc01-steel.html (accessed on 18 January 2025).
  26. Dean, A.; Voss, D.; Dragulijc, D. Design and Analysis of Experiments; Springer International Publishing AG: Cham, Switzerland, 2017; ISBN 978-3-319-52250-0. [Google Scholar]
  27. KTL s.r.o. Princip Činnosti. KTL s.r.o. Available online: https://www.ktlpresov.sk/princip-cinnosti (accessed on 24 January 2025).
  28. ISO 16232:2018; Road Vehicles—Cleanliness of Components and Systems. International Organization for Standardization: London, UK, 2018. Available online: https://www.iso.org/standard/71583.html (accessed on 25 January 2025).
  29. Built In. Shapiro-Wilk Test: A Guide to Normality Testing. Available online: https://builtin.com/data-science/shapiro-wilk-test (accessed on 25 January 2025).
  30. Garcia, S.J.; Suay, J. Optimization of deposition voltage of cataphoretic automotive primers assessed by EIS and AC/DC/AC. Prog. Org. Coat. 2009, 66, 306–313. [Google Scholar]
  31. Kamas, T.; Tekkalmaz, M. Coupled field modeling of E/M impedance of piezoelectric wafer active sensor for cataphoretic coating thickness measurement. Smart Mater. Struct. 2017, 26, 045035. [Google Scholar]
  32. Krenicky, T.; Goncharov, O.Y.; Kuchar, J.; Sapegina, I.V.; Kudlacek, J.; Faizullin, R.R.; Korshunov, A.I.; Cerny, D. Chemical vapor deposition of tantalum carbide in the TaBr5-CCl4-Cd system. Coatings 2024, 14, 547. [Google Scholar] [CrossRef]
  33. Kania, H.; Saternus, M.; Kudlacek, J. Impact of Bi and Sn on microstructure and corrosion resistance of zinc coatings obtained in Zn-AlNi bath. Materials 2020, 13, 3788. [Google Scholar] [CrossRef] [PubMed]
  34. Hamera, P.; Bennison, A.D. TIB Clean A300—lowering the temperature of alkaline degreasing. Ochr. Przed Koroz. 2021, 64, 144–147. [Google Scholar]
  35. Wang, C.S.; Cai, N.; Zhang, D.V.; Zhang, J.X.; Chang, T.H.; Li, S.M.; Chao, Y.Q.; Hu, J.Q. Preparation of optimum degreasing-sintering process for metal-polymer blending low temperature 3D printing. Rapid Prototyp. J. 2019, 25, 515–529. [Google Scholar] [CrossRef]
  36. Swierczynski, T. Leraclen® ATR and Lerabilt® 268—low-temperature, alkaline products for degreasing prior to hot-dip galvanizing and electroplating. Ochr. Przed Koroz. 2022, 65, 324–326. [Google Scholar]
  37. Rossi, S.; Calovi, M.; Fedel, M. Corrosion protection of aluminum foams by cataphoretic deposition of organic coatings. Prog. Org. Coat. 2017, 109, 144–151. [Google Scholar]
  38. Calovi, M.; Dire, S.; Ceccato, R.; Deflorian, F.; Rossi, S. Corrosion protection properties of functionalised graphene-acrylate coatings produced via cataphoretic deposition. Prog. Org. Coat. 2019, 136, 105261. [Google Scholar]
  39. Su, Y.; Zhitomirsky, I. Cataphoretic assembly of cationic dyes and deposition of carbon nanotube and graphene films. J. Colloid Interf. Sci. 2013, 399, 46–53. [Google Scholar]
  40. Li, C.H.; He, Y.; Zhao, Y.; Li, Z.J.; Sun, D.; Li, H.J.; Chen, W.; Yan, J.; Wu, G.Y.; Yuan, X. Cataphoretic deposition of an epoxy coating with the incorporation of Ti3C2Tx@Mg-Al layered double hydroxide for long-term active corrosion protection effect. Prog. Org. Coat. 2023, 175, 107333. [Google Scholar] [CrossRef]
  41. Kania, H.; Saternus, M.; Kudlacek, J.; Svoboda, J. Microstructure Characterization and Corrosion Resistance of Zinc Coating Obtained in a Zn-AlNiBi Galvanizing Bath. Coatings 2020, 10, 758. [Google Scholar] [CrossRef]
  42. Nam, D.; Opanasyuk, A.S.; Koval, P.V.; Ponomarev, A.G.; Jeong, A.R.; Kim, G.Y.; Jo, W.; Cheong, H. Composition variations in Cu2ZnSnSe4 thin films analyzed by X-ray diffraction, energy dispersive X-ray spectroscopy, particle induced X-ray emission, photoluminescence, and Raman spectroscopy. Thin Solid Films 2014, 562, 109–113. [Google Scholar] [CrossRef]
  43. Lovejoy, T.C.; Ramasse, Q.M.; Falke, M.; Kaeppel, A.; Terborg, R.; Zan, R.; Dellby, N.; Krivanek, O.L. Single atom identification by energy dispersive x-ray spectroscopy. Appl. Phys. Lett. 2012, 100, 154101. [Google Scholar] [CrossRef]
  44. Qi, P.; Samadi, N.; Martinson, M.; Ponomarenko, O.; Bassey, B.; Gomez, A.; George, G.N.; Pickering, I.J.; Chapman, L.D. Wide field imaging energy dispersive X-ray absorption spectroscopy. Sci. Rep. 2019, 9, 17734. [Google Scholar]
  45. D’Alfonso, A.J.; Freitag, B.; Klenov, D.; Allen, L.J. Atomic-resolution chemical mapping using energy-dispersive x-ray spectroscopy. Phys. Rev. B 2010, 81, 100101. [Google Scholar] [CrossRef]
  46. Tromp, R.M. Energy-dispersive X-ray spectroscopy in a low energy electron microscope. Ultramicroscopy 2024, 259, 113935. [Google Scholar] [CrossRef]
  47. Sanchez, D.F.; Simionovici, A.S.; Lemelle, L.; Cuartero, V.; Mathon, O.; Pascarelli, S.; Bonnin, A.; Shapiro, R.; Konhauser, K.; Grolimund, D.; et al. 2D/3D Microanalysis by Energy Dispersive X-ray Absorption Spectroscopy Tomography. Sci. Rep. 2017, 7, 16453. [Google Scholar] [CrossRef]
Figure 1. Elcometer 456 (A) and 3D-printed device for precise and expeditious measurements of samples (B).
Applsci 15 03760 g001
Figure 2. Filtering of gross errors.
Applsci 15 03760 g002
Figure 3. Analysis of residual th.
Applsci 15 03760 g003
Figure 4. The influence of KTL deposition time and KLT voltage on the change of the formed layer at the minimum values of the design of experiments methodology.
Applsci 15 03760 g004
Figure 5. The influence of KTL deposition time and KLT voltage on the change of the formed layer at the maximum values of the design of experiments methodology.
Applsci 15 03760 g005
Figure 6. The effect of KTL deposition time and degreasing temperature on the change of the formed layer at the minimum values of the design of experiments methodology.
Applsci 15 03760 g006
Figure 7. The effect of KTL deposition time and degreasing temperature on the change of the formed layer at maximum values of the design of experiments methodology.
Applsci 15 03760 g007
Figure 8. The influence of the cataphoretic deposition time and the degreasing deposition time on the change of the created layer at the minimum values of the design of experiments methodology.
Applsci 15 03760 g008
Figure 9. The influence of cataphoretic deposition time and degreasing temperature on the change of the formed layer at maximum values of the design of experiments methodology.
Applsci 15 03760 g009
Figure 10. Energy-dispersive X-ray spectroscopy (EDX) of cataphoretic layer.
Applsci 15 03760 g010
Figure 11. EDX spectrum of carbon (C).
Applsci 15 03760 g011
Figure 12. EDX spectrum of iron (Fe).
Applsci 15 03760 g012
Figure 13. EDX spectrum of oxygen (O).
Applsci 15 03760 g013
Figure 14. EDX spectrum of silicon (Si).
Applsci 15 03760 g014
Figure 15. EDX spectrum of aluminum (Al).
Applsci 15 03760 g015
Figure 16. Comparison of measured and predicted coating thickness values depending on minimum (a) and maximum (b) degreasing concentration, KTL deposition time, and applied voltage.
Applsci 15 03760 g016
Table 1. Mechanical properties of VDA 239-100 CR4.
PropertyValue
Yield strength (Rp0,2)140–180 MPa
Tensile strength (Rm)270–330 MPa
Hardness by Brinell HBW267
Elongation (A80)≥39%
r-value (r90/20)≥1.9
r-value m/20≥1.6
n-value (n10–20/Ag)≥0.20
Table 2. Chemical composition of Pragolod 57 N.
Chemical ElementConcentration [%]
Sodium carbonate
(Na2CO3)
20–30
Sodium metasilicate
(Na2SiO3 × 5H2O)
20–30
Sodium hydroxide
(NaOH)
20–30
Fatty tallowamine (POE),
ethoxylate (5EO)
3–5
Table 3. Values of input variable factors.
Factor CodeVariableUnitLevel of Factors
−2.05464−101+2.05464
x1kODMg·L−11525354555
x2tODMmin3681013
x3TODM°C4050607080
x4tFOSFmin13579
x5tKTLmin34567
x6UKTLV200226250274300
x7tPOLYmin1317202327
x8TPOLY°C150176200224250
kODM—degreasing concentration, tODM—degreasing deposition time, TODM—degreasing temperature, tFOSF—phosphating deposition time, tKTL—cataphoresis deposition time, UKTL—cataphoresis voltage, tPOLY—polymerization time, TPOLY—polymerization temperature.
Table 4. Summary of the model’s suitability.
SourceValue
RSquare0.751148
RSquare Adj0.707869
Root Mean Square Error1.922936
Mean of Response17.71049
Observations (or Sum Wgts)82
Table 5. Analysis of variance (ANOVA).
SourceDFSum of SquaresMean SquareF RatioProb > F
Model12770.127864.177317.3561<0.0001
Error69255.14023.6977--
C. Total811025.268---
Table 6. Lack-of-fit error.
SourceDFSum of SquaresMean SquareF RatioProb > FMax RSq
Lack Of Fit30135.092674.503091.46290.13120.8829
Pure Error39120.047493.07814---
Total Error69255.14016----
Table 7. Model parameters.
TermEstimateStd Errort RatioProb > |t|Lower 95%Upper 95%
Intercept15.240630.48073431.7<0.000114.2815916.19966
x1−2.088620.225926−9.24<0.0001−2.53933−1.63791
x50.9038980.22592640.00020.4531881.354608
x60.8057410.2259263.570.00070.3550311.256451
x3−0.581840.225926−2.580.0122−1.03255−0.13113
x1·x13.4537010.6802725.08<0.00012.0965974.810806
x1·x5−0.516560.240367−2.150.0351−0.99608−0.03704
x1·x2−0.680310.240367−2.830.0061−1.15983−0.20079
x3·x20.710.2403672.950.00430.2304811.189519
x1·x5·x30.516250.2403672.150.03520.0367310.995769
x1·x1·x1·x1−0.478390.168911−2.830.0061−0.81536−0.14142
x1·x5·x6·x2−0.689060.240367−2.870.0055−1.16858−0.20954
x1·x5·x3·x20.946250.2403673.940.00020.4667311.425769
x1—degreasing concentration, x2—degreasing deposition time, x3—degreasing temperature, x5—cataphoresis deposition time, x6—cataphoresis voltage.
Disclaimer/Publisher’s Note: The statements, opinions and data contained in all publications are solely those of the individual author(s) and contributor(s) and not of MDPI and/or the editor(s). MDPI and/or the editor(s) disclaim responsibility for any injury to people or property resulting from any ideas, methods, instructions or products referred to in the content.

