
Impact of Crust Creation on Techno-Functional and Organoleptic Properties of Meat with Different Fat Contents

 , , , and
Abstract
1. Introduction
2. Materials and Methods
2.1. Material
2.2. Method
2.2.1. Experimental Design
2.2.2. Texture Measurement
2.2.3. Colour Measurement
2.2.4. Determination of Cooking Loss
2.2.5. Determination of pH
2.2.6. Determination of Water-Holding Capacity and Fattiness
2.2.7. Sensory Analysis
2.2.8. Statistical Analysis
3. Results
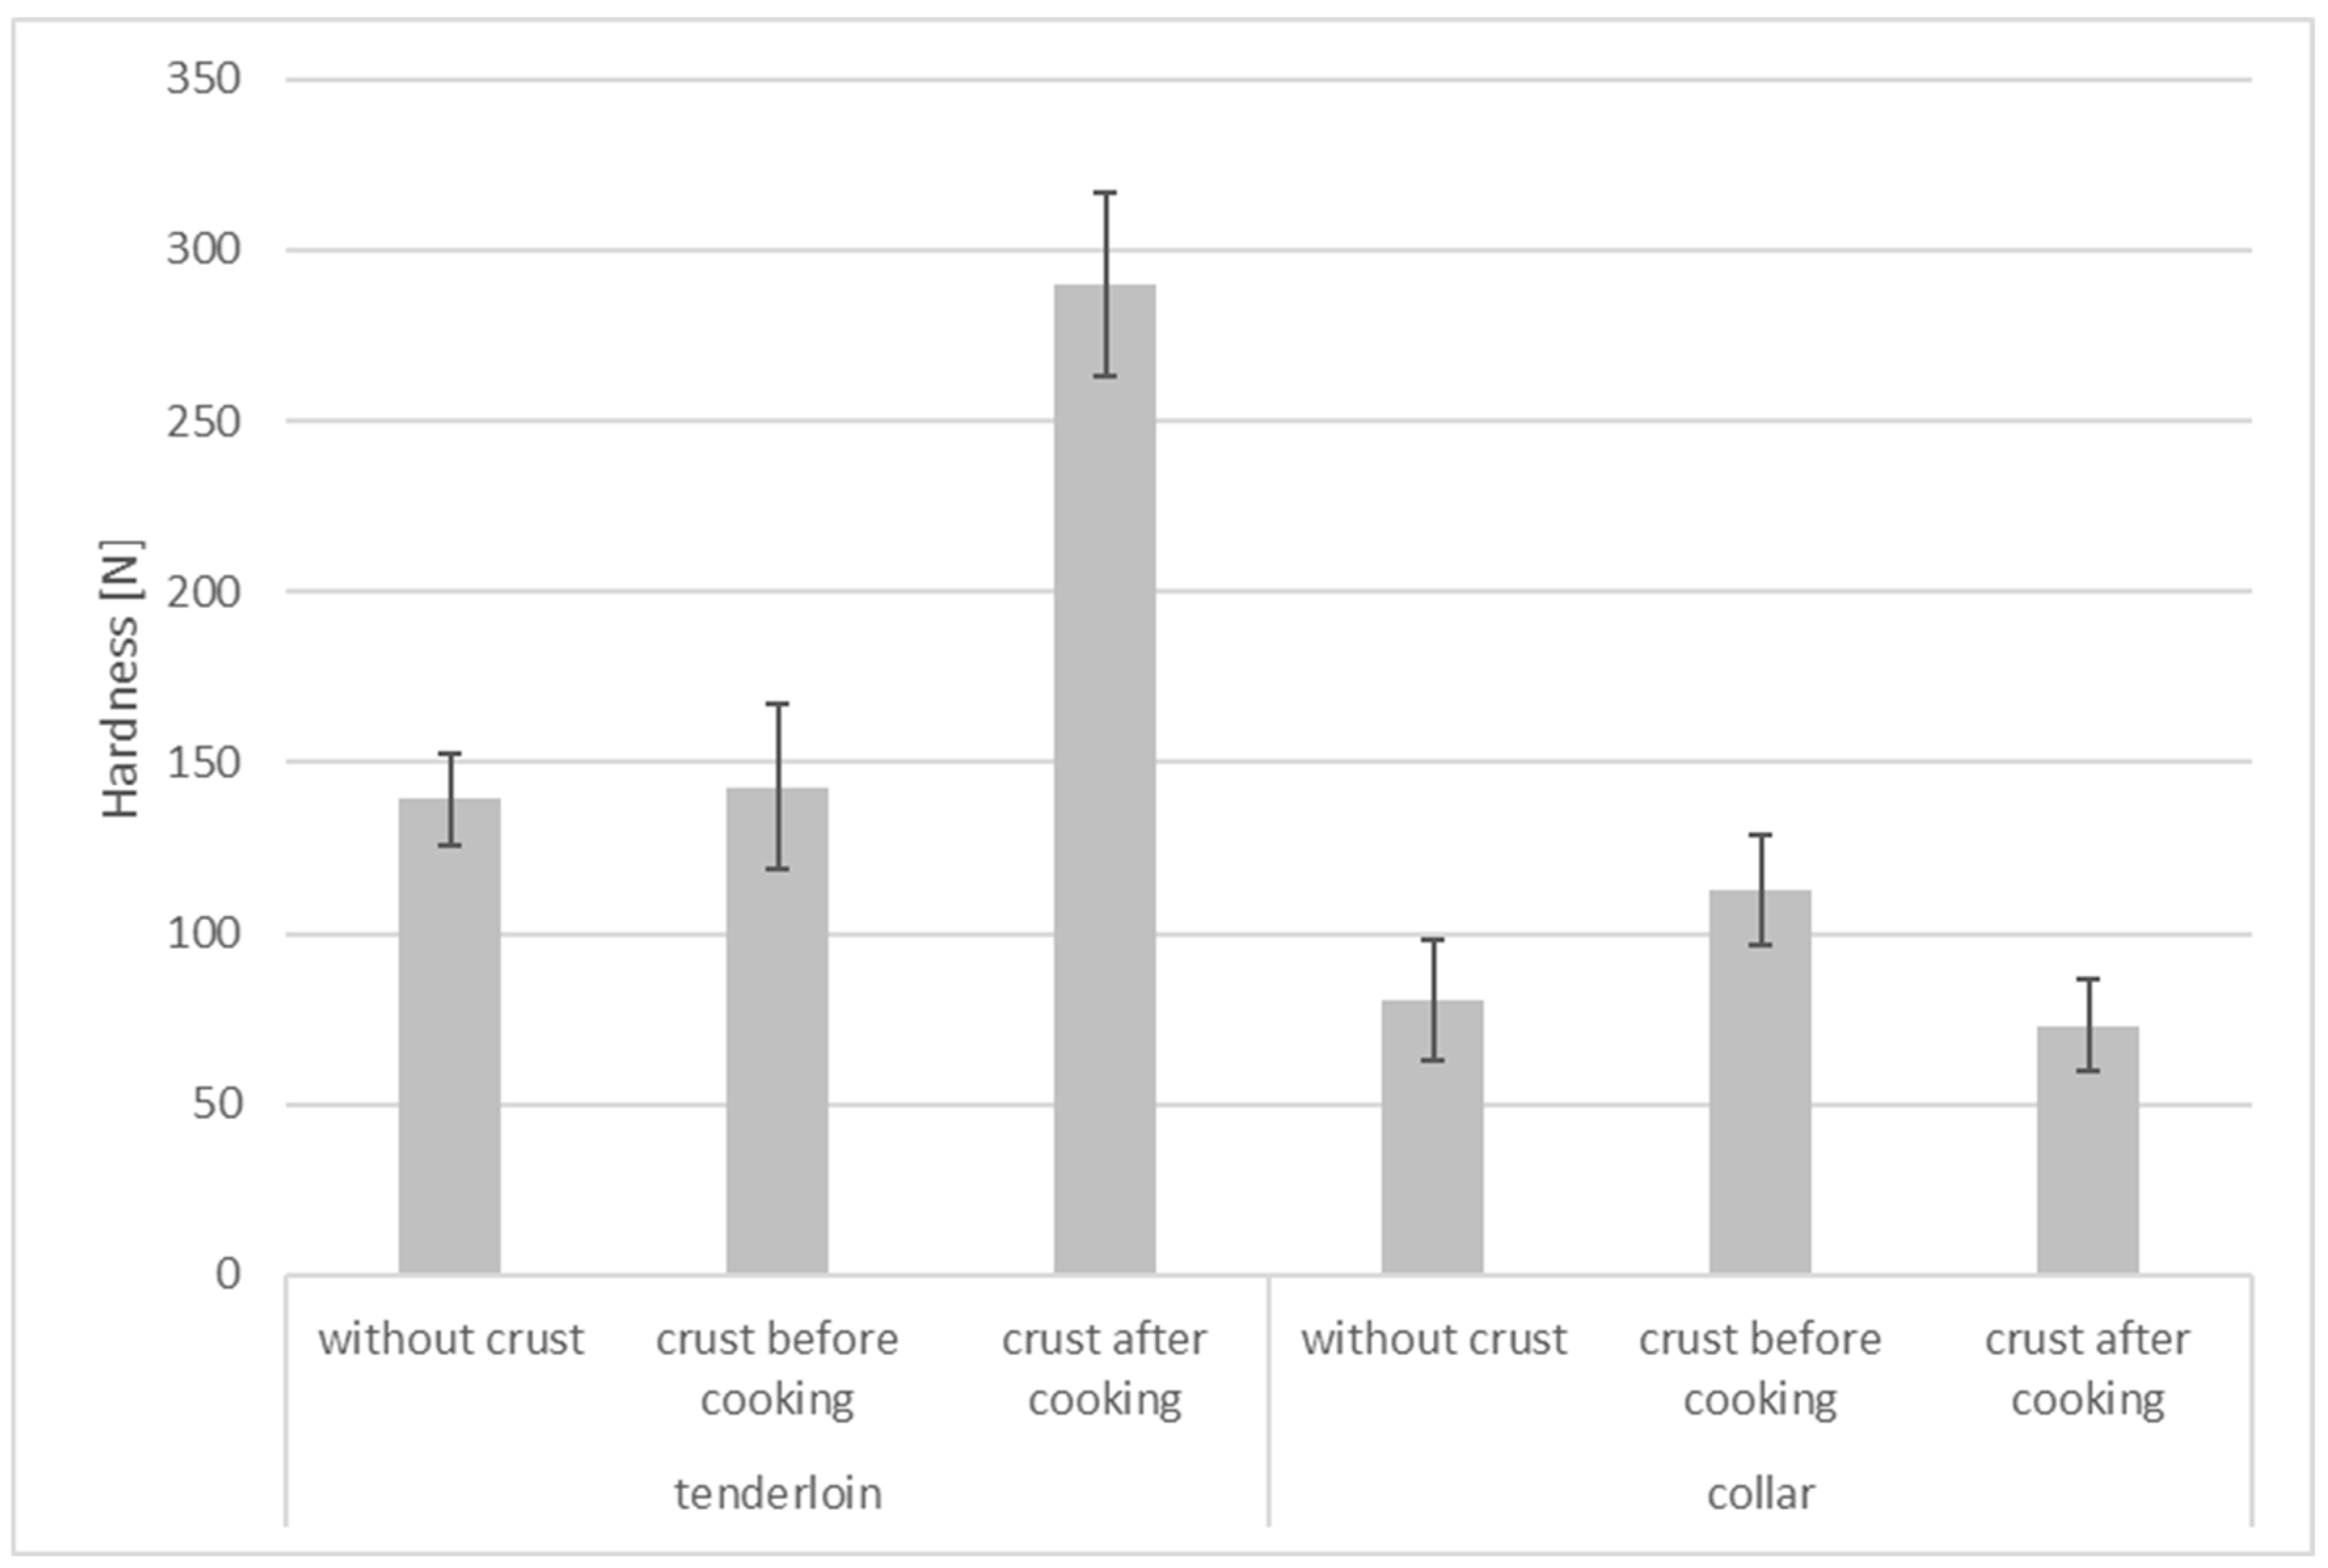
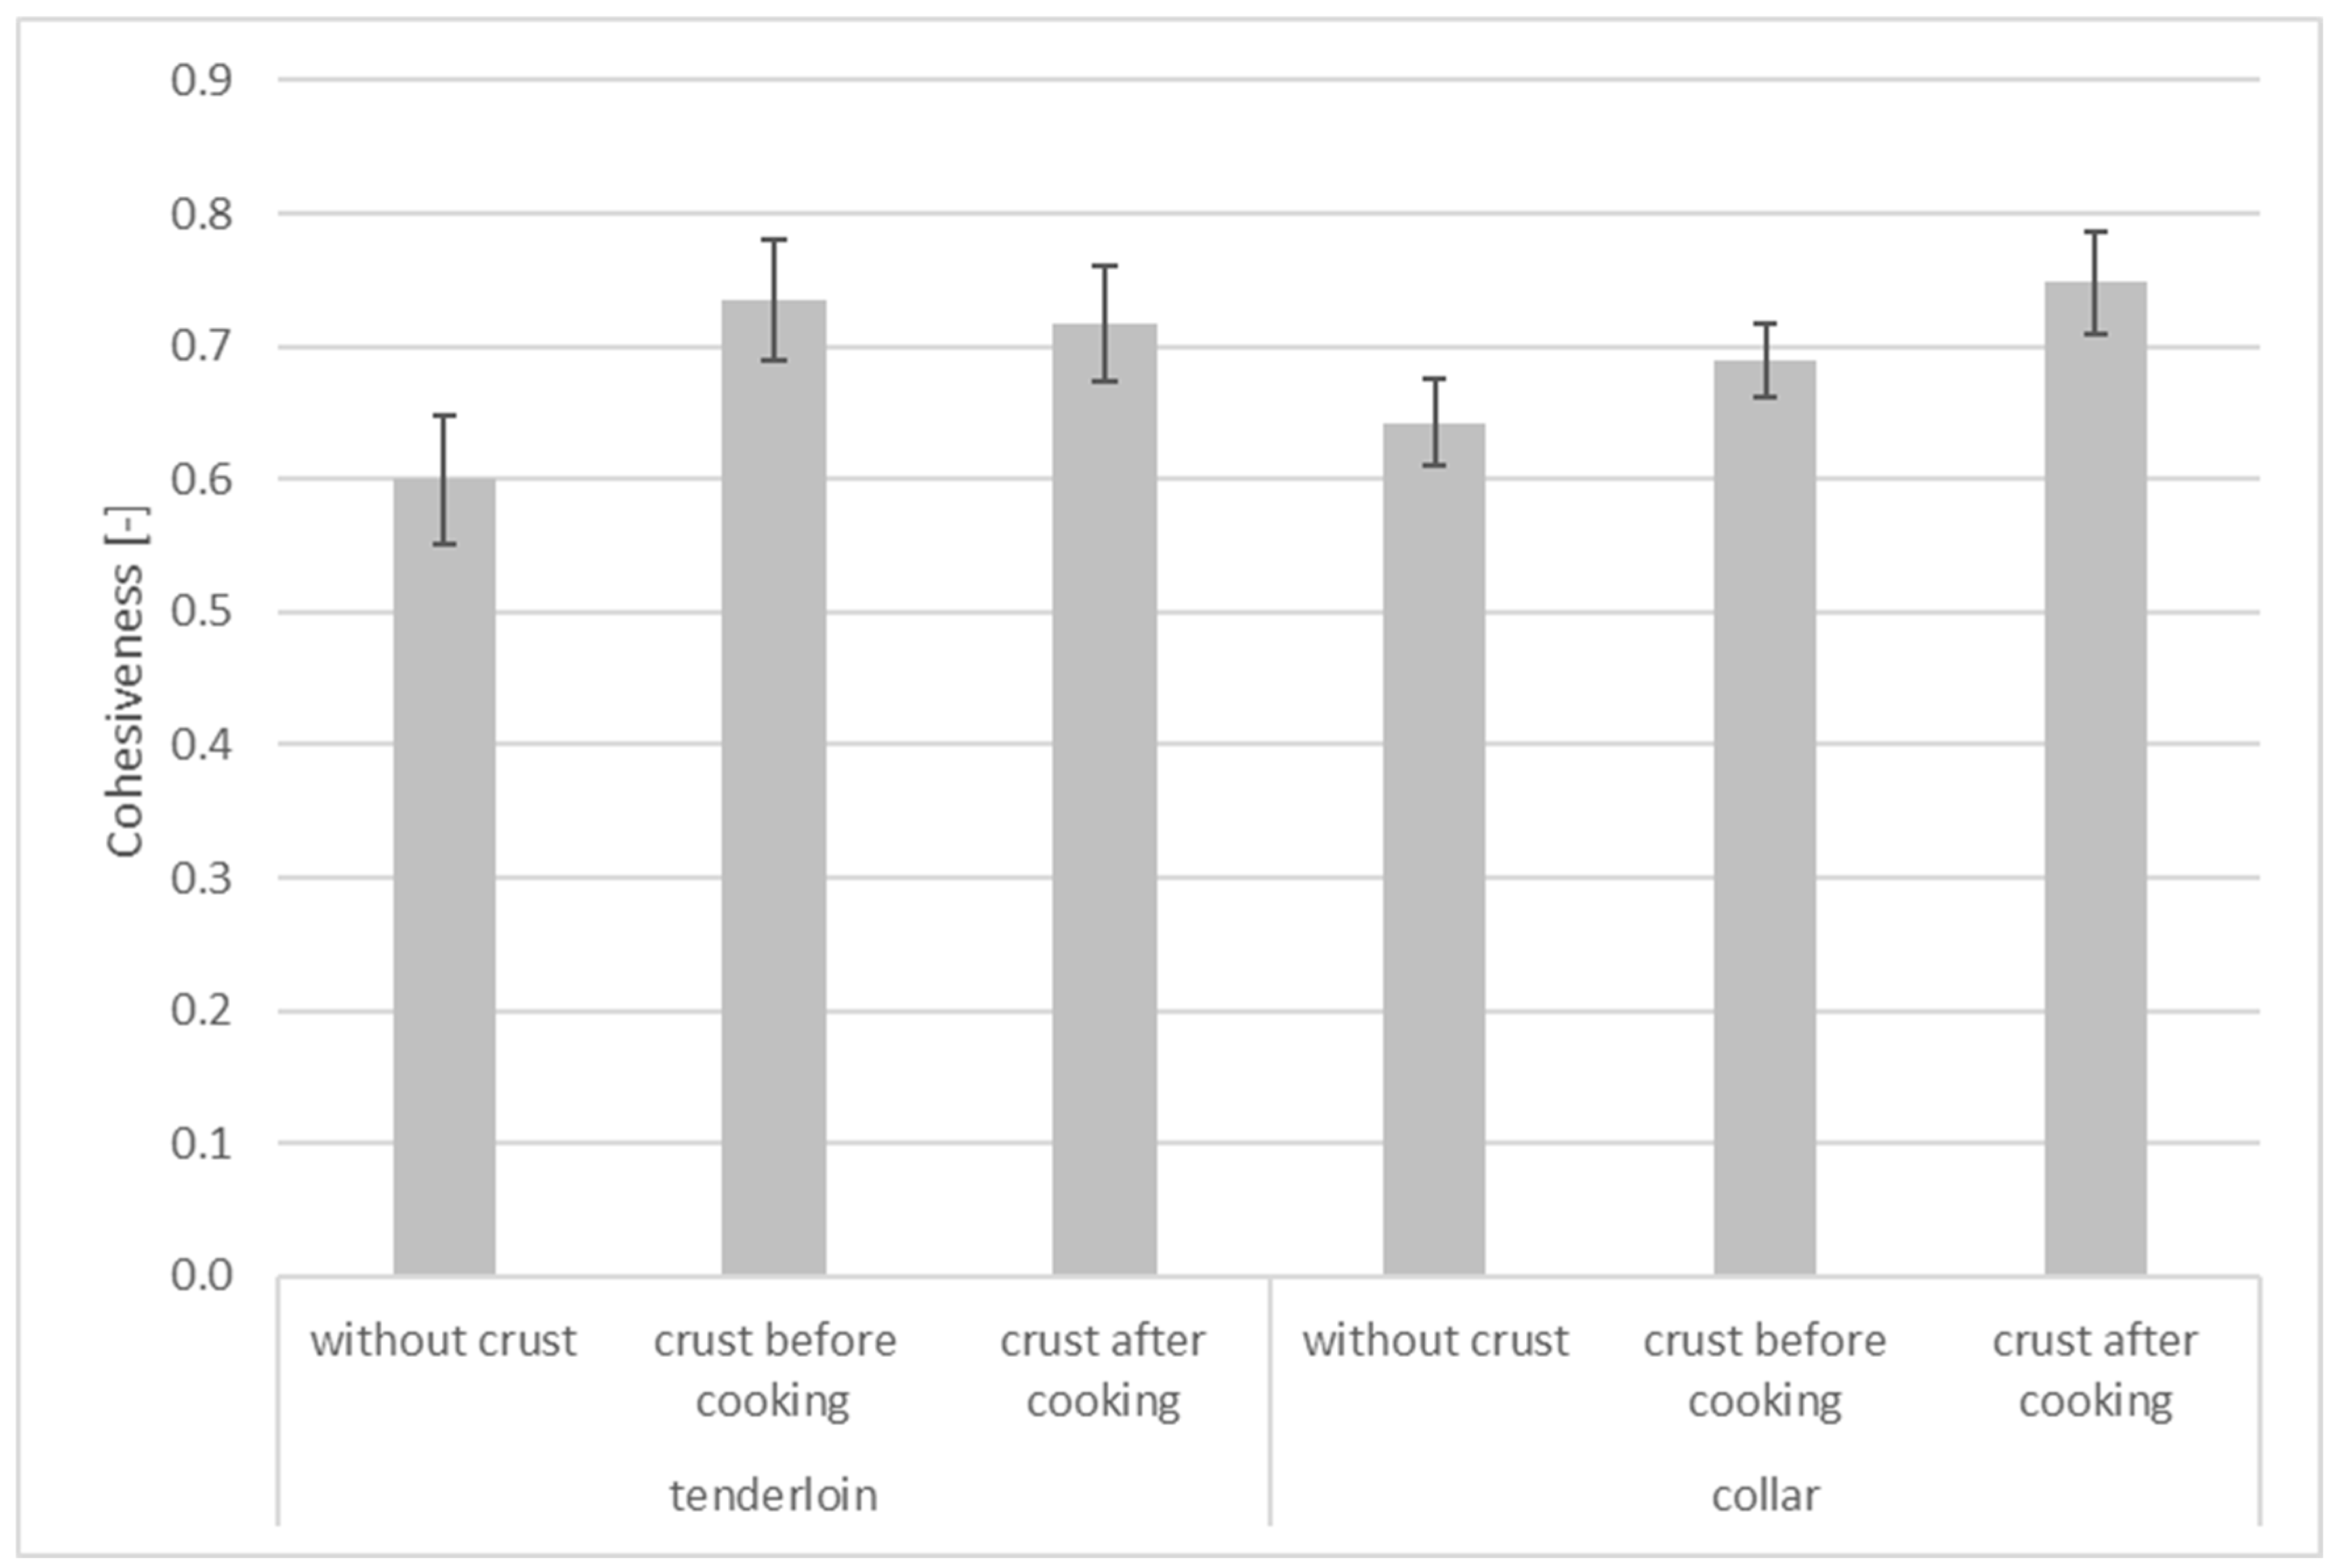
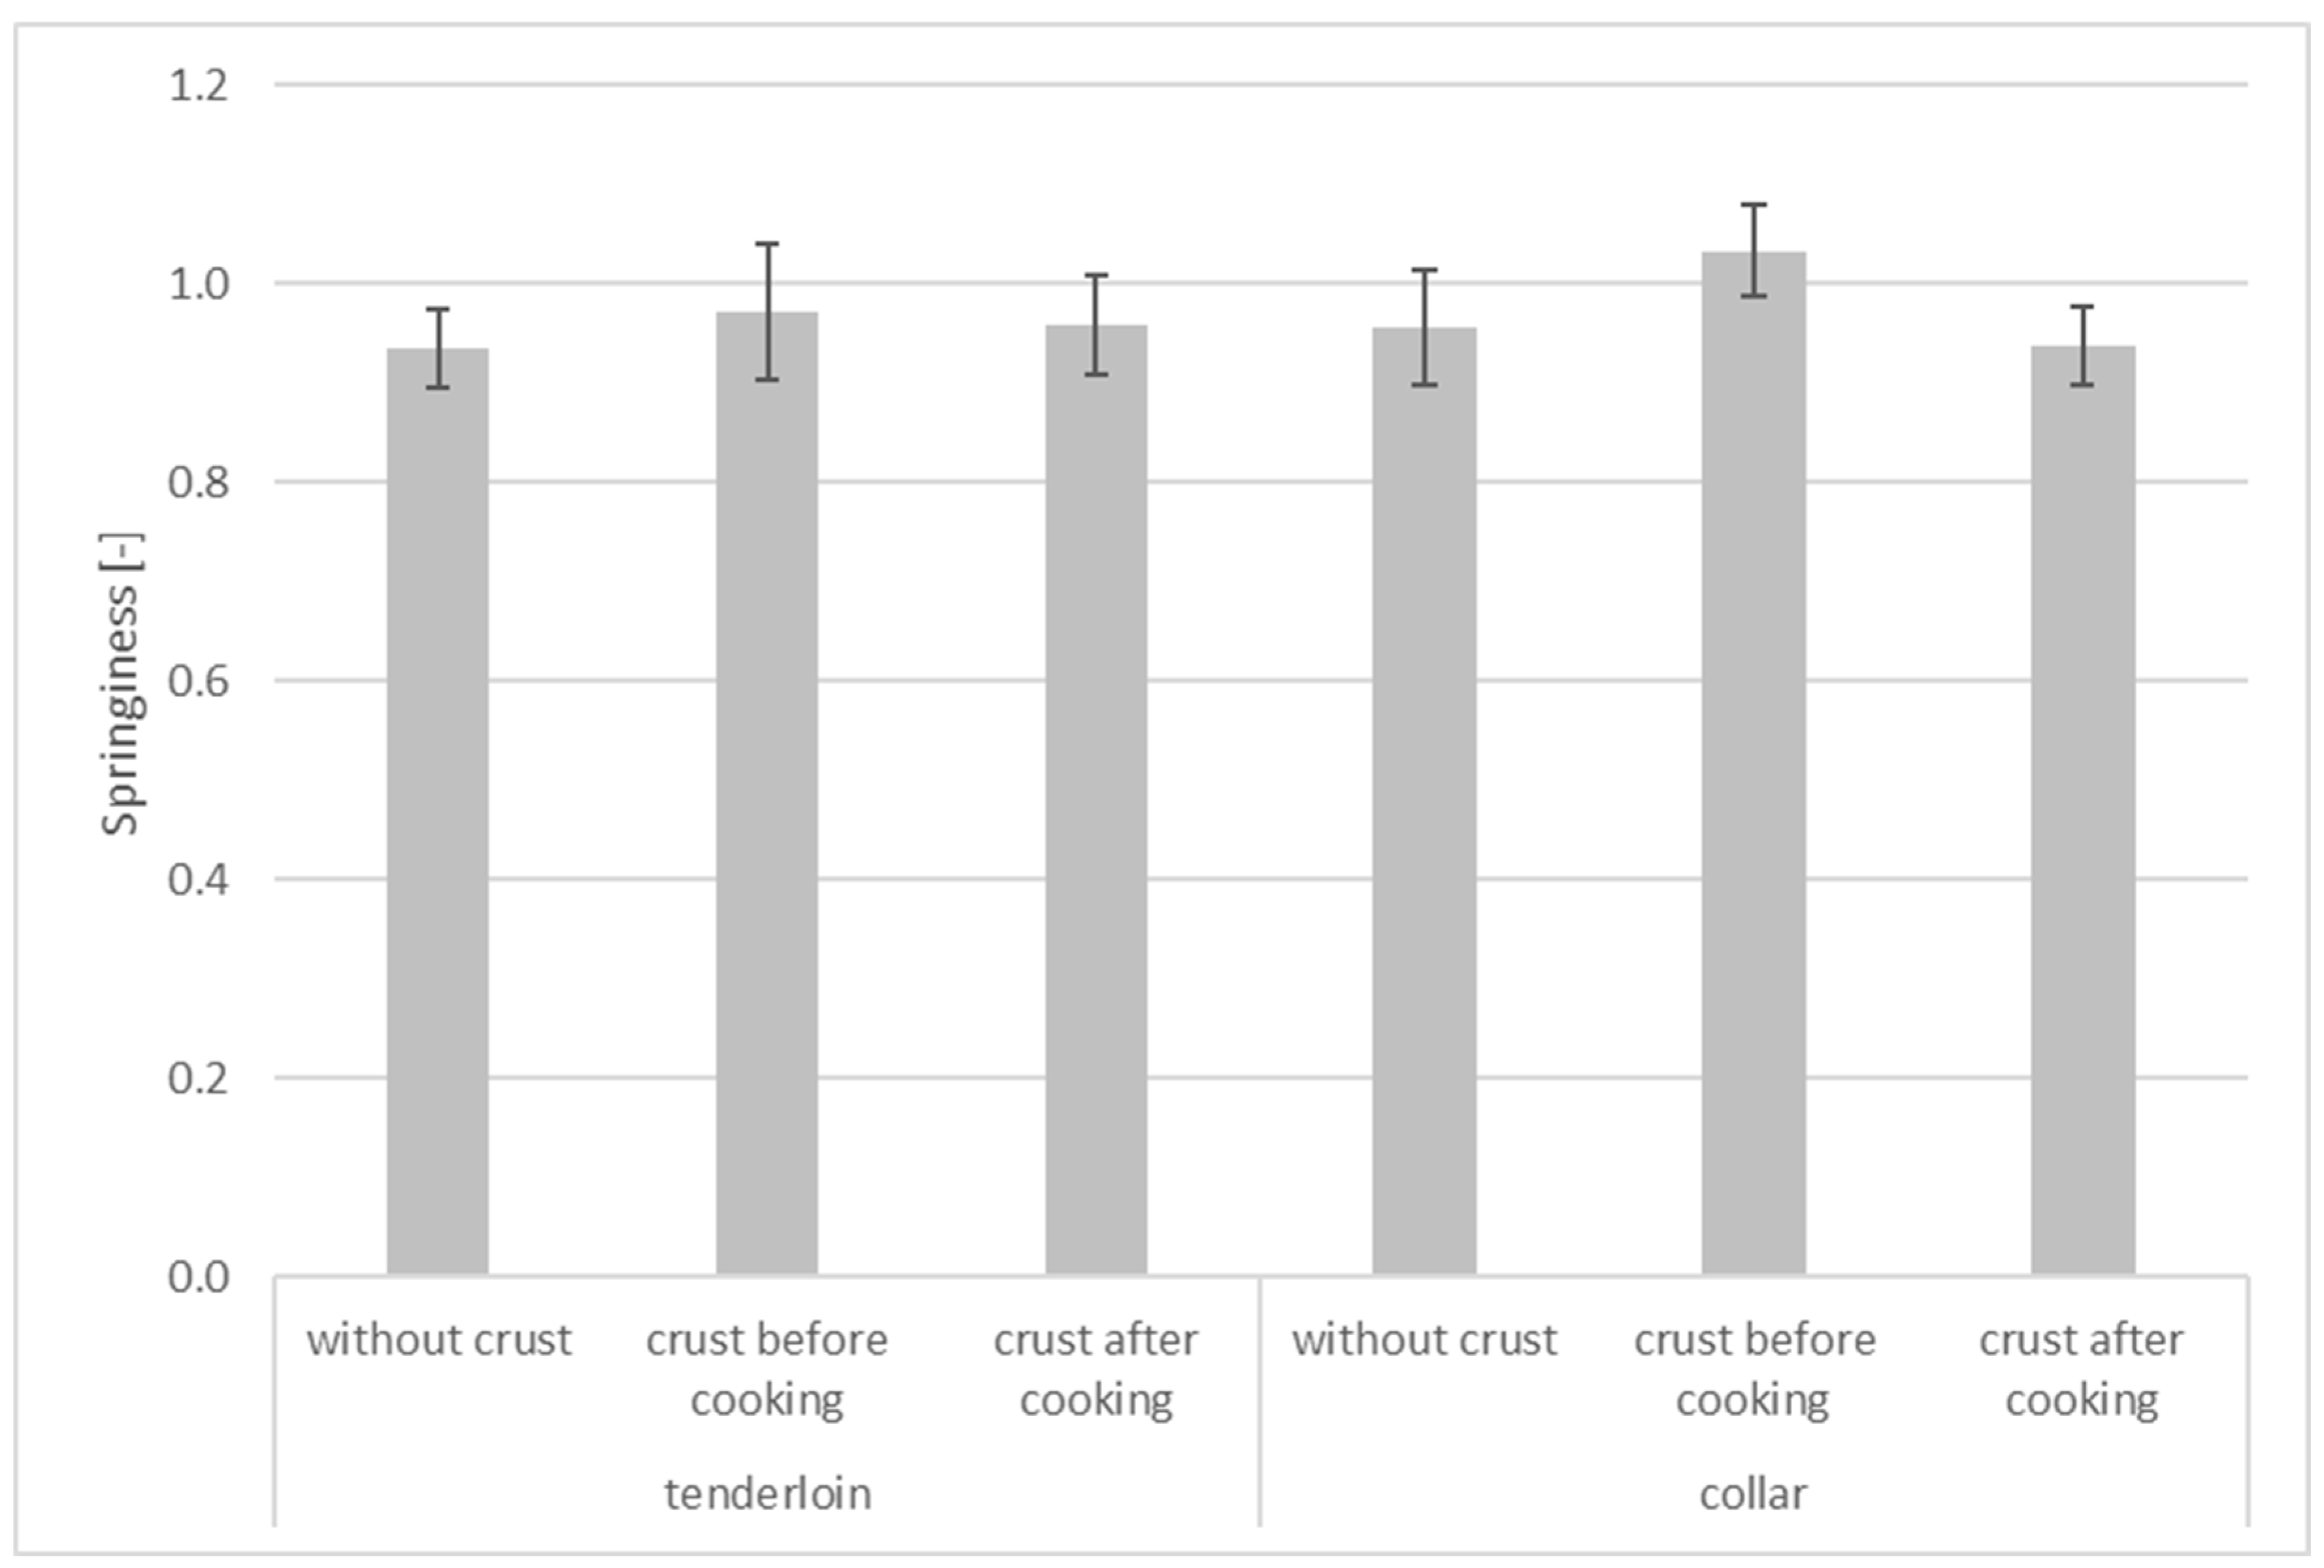
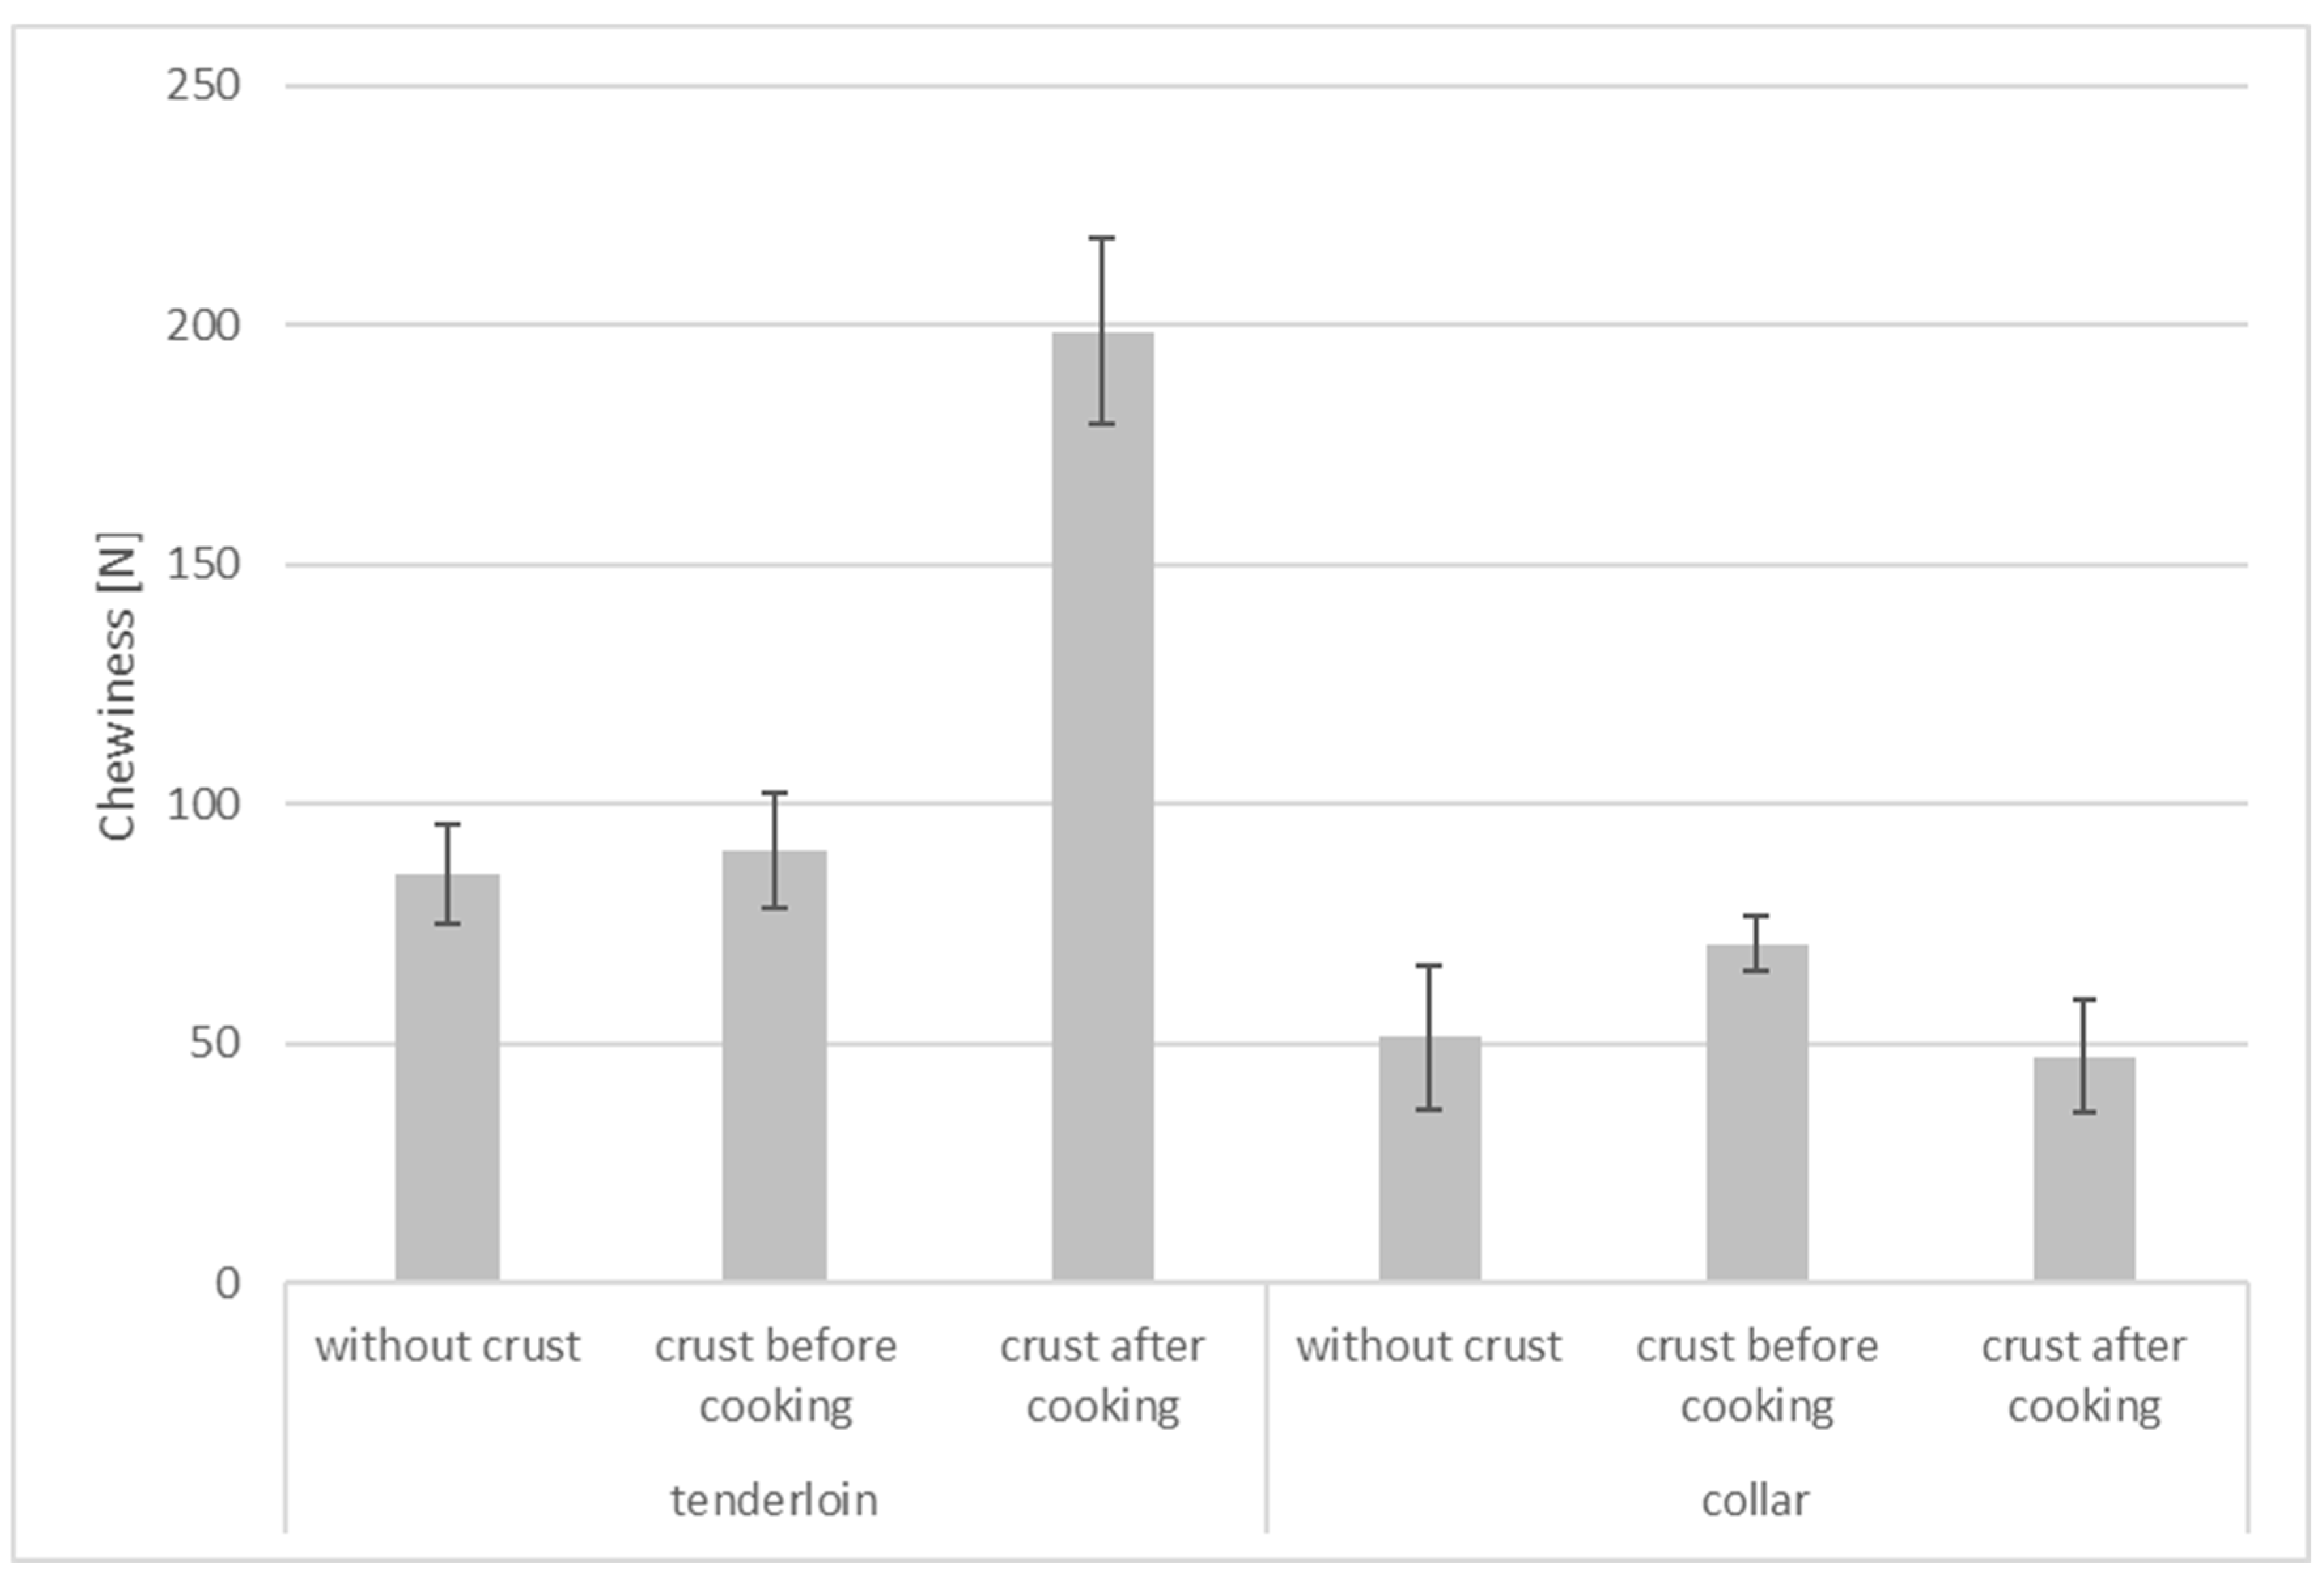
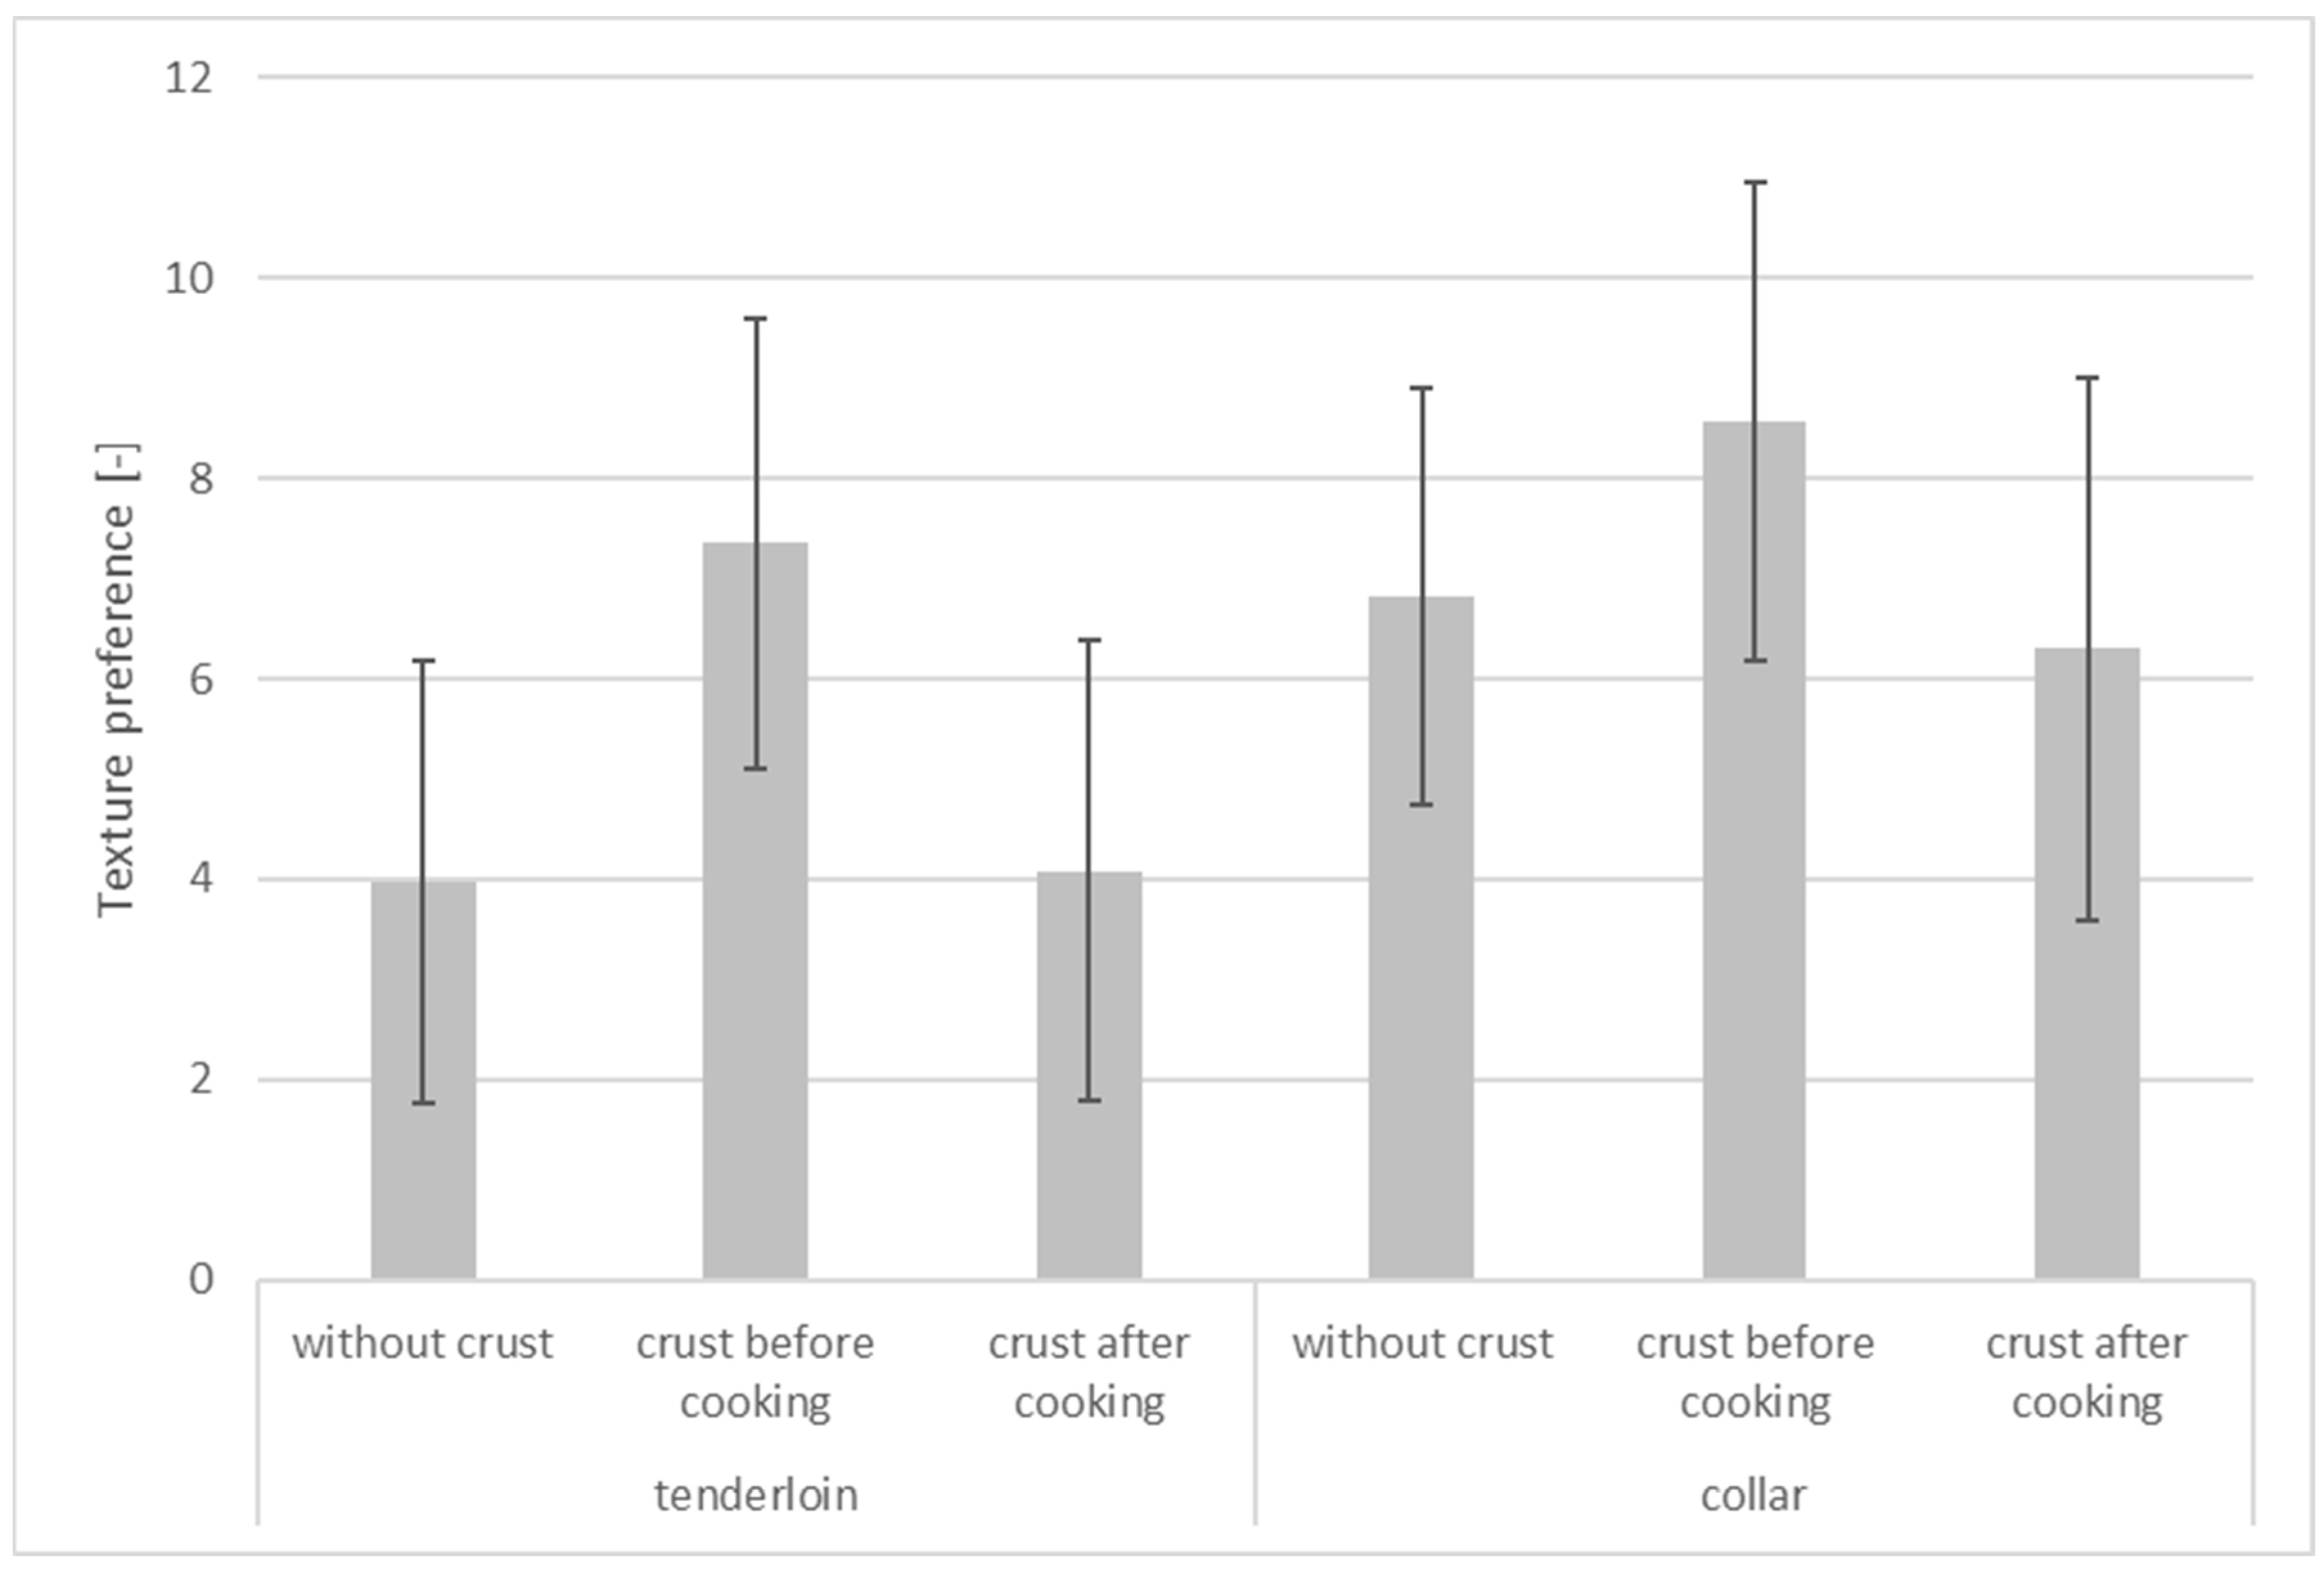
3.1. Texture
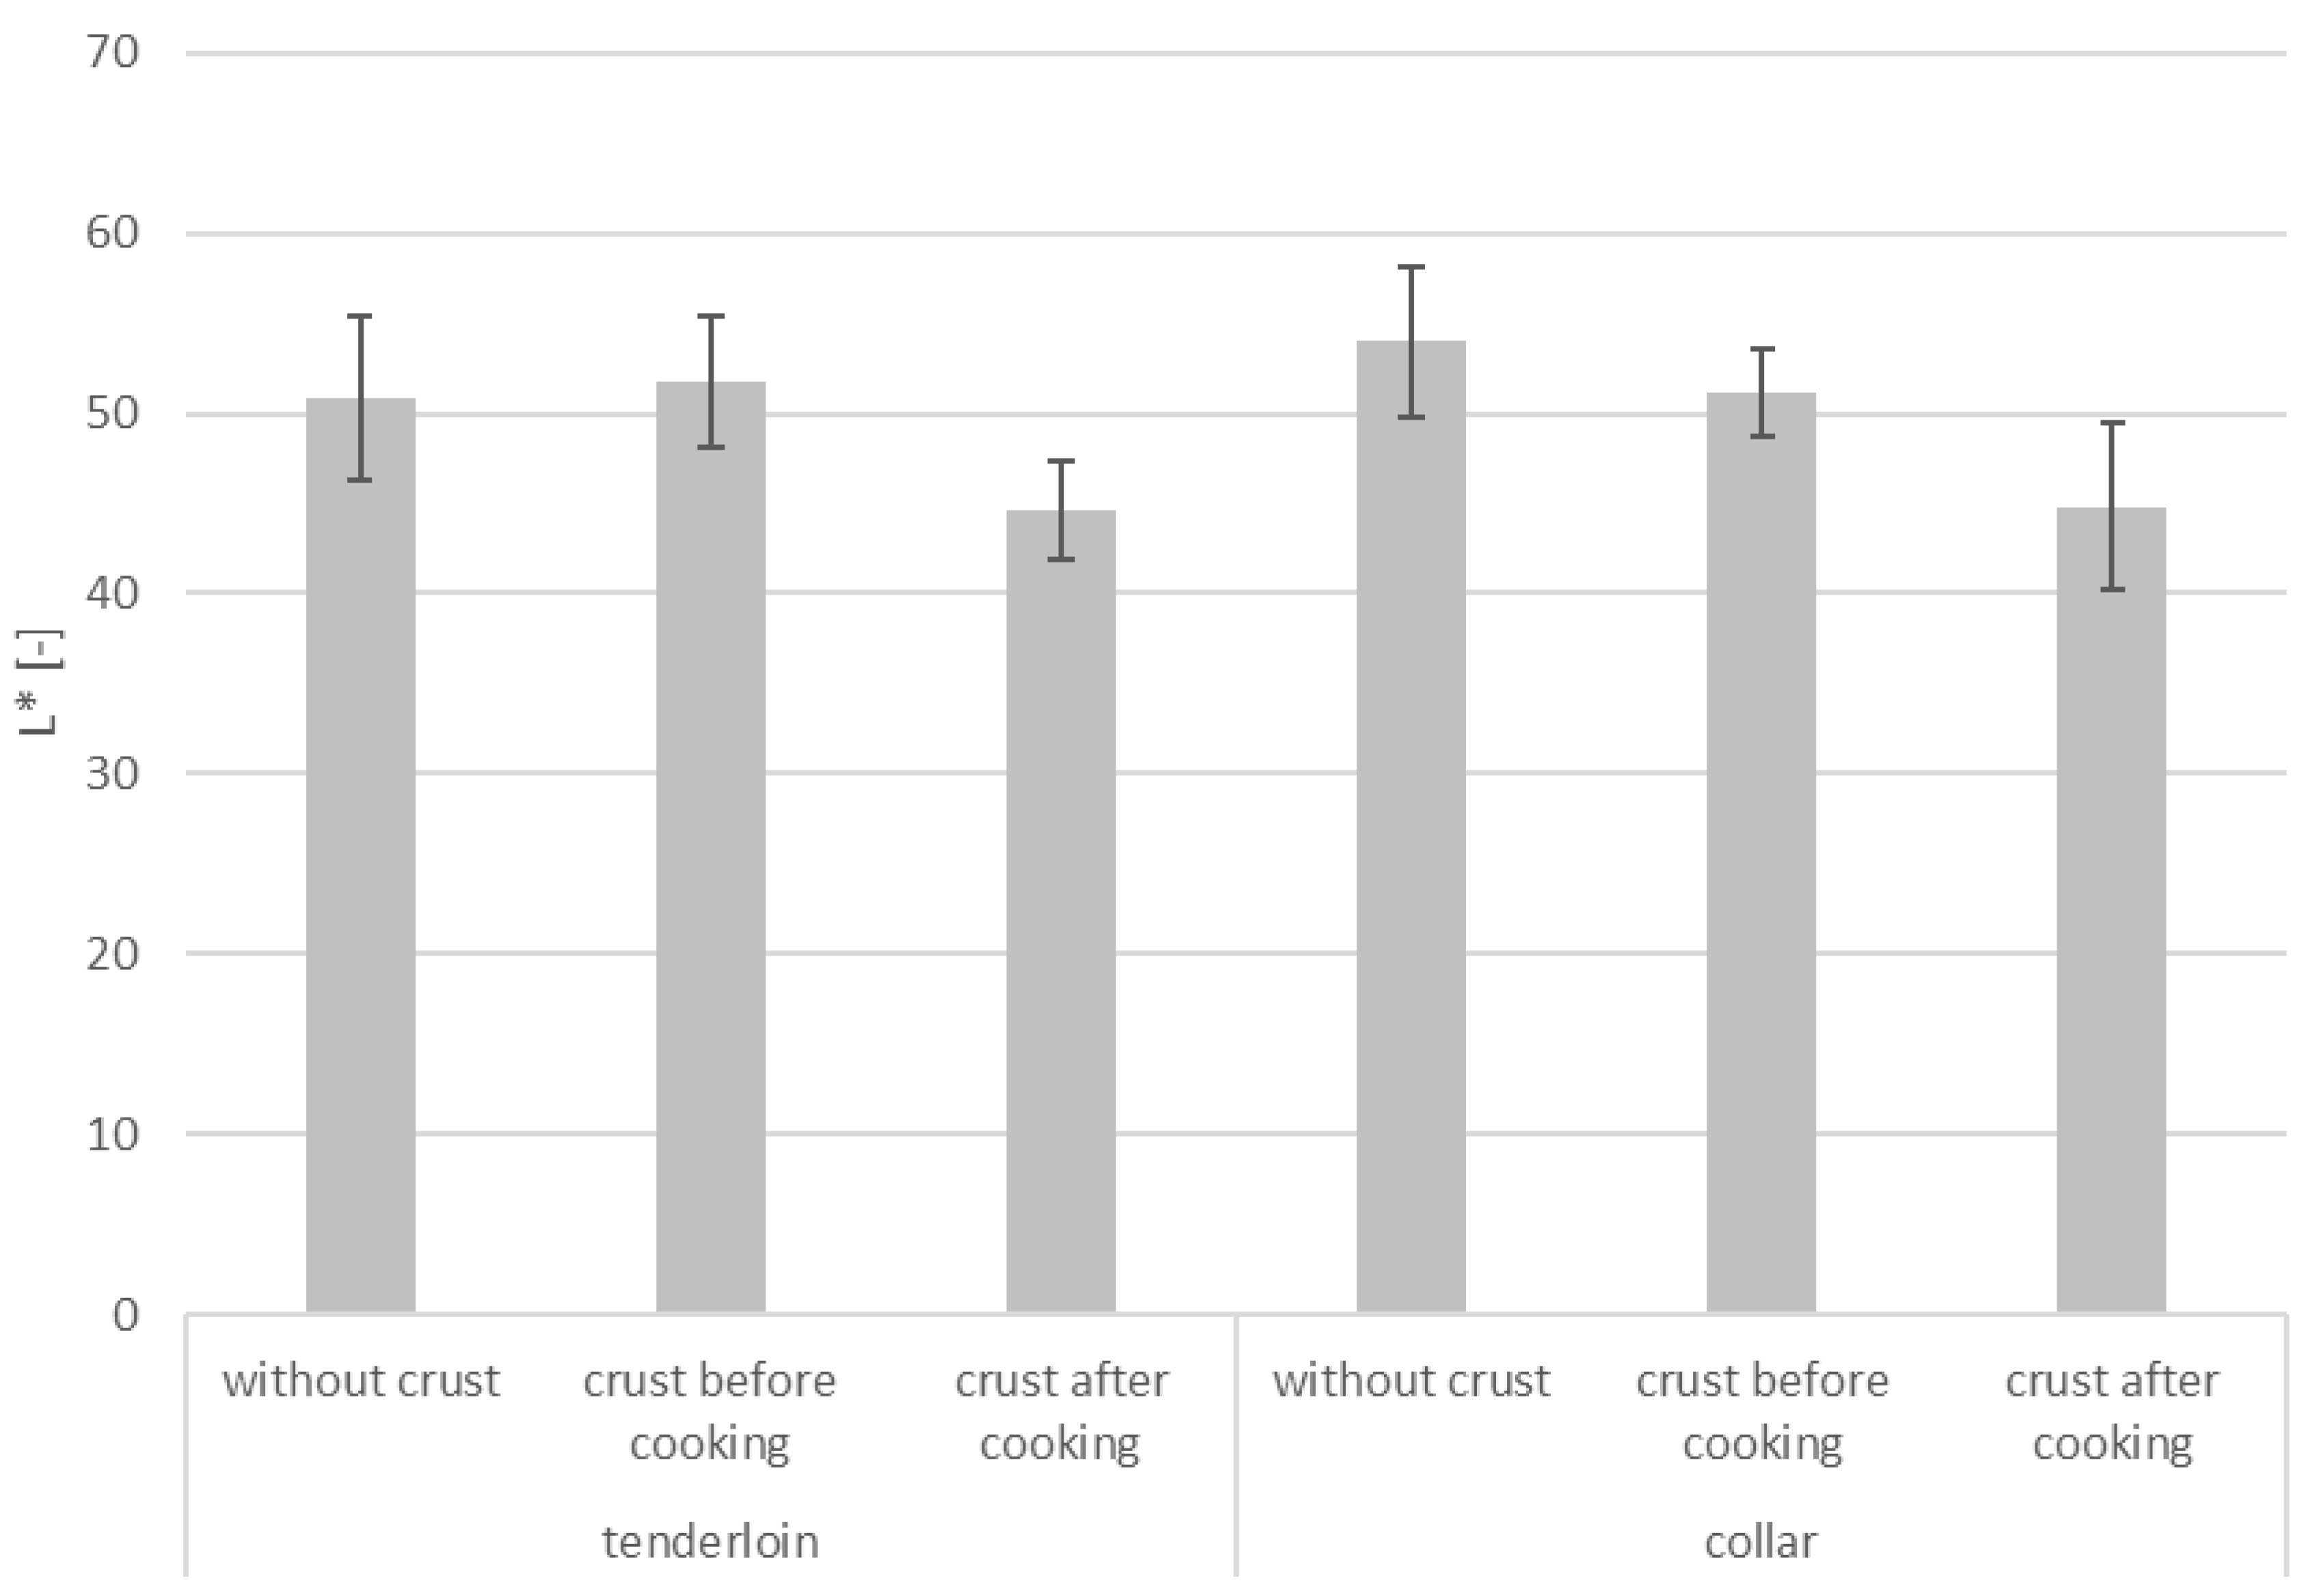
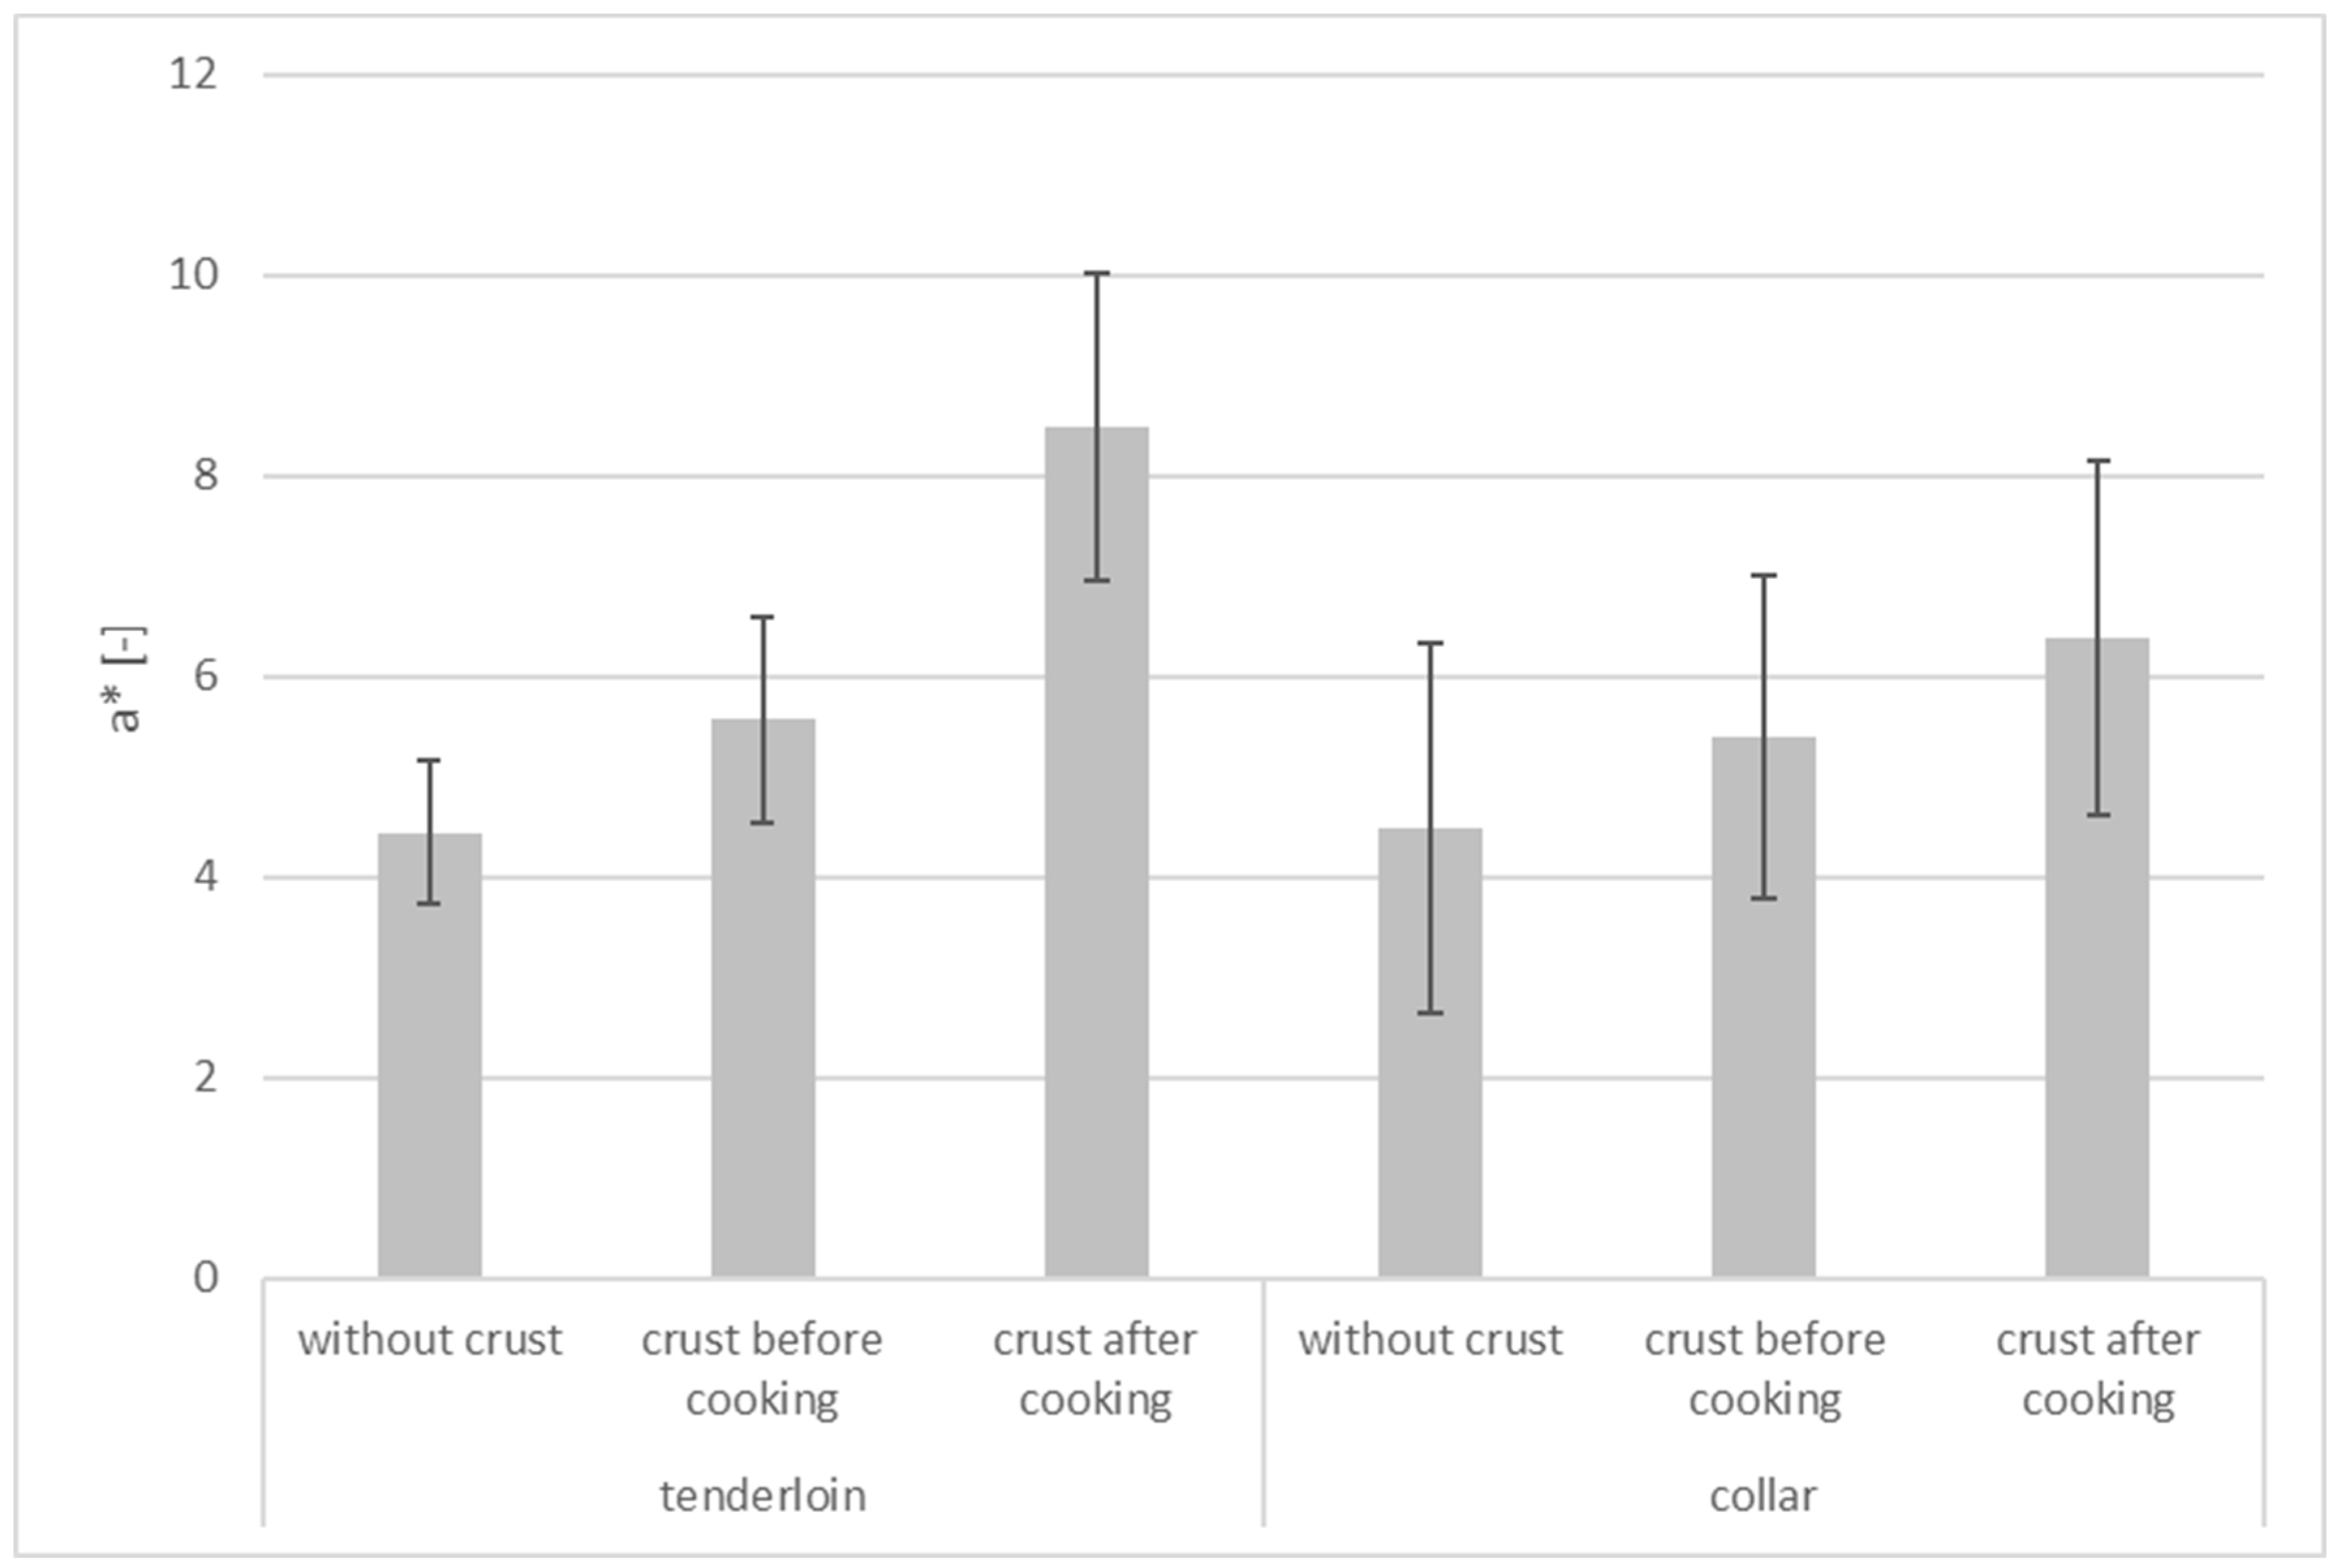
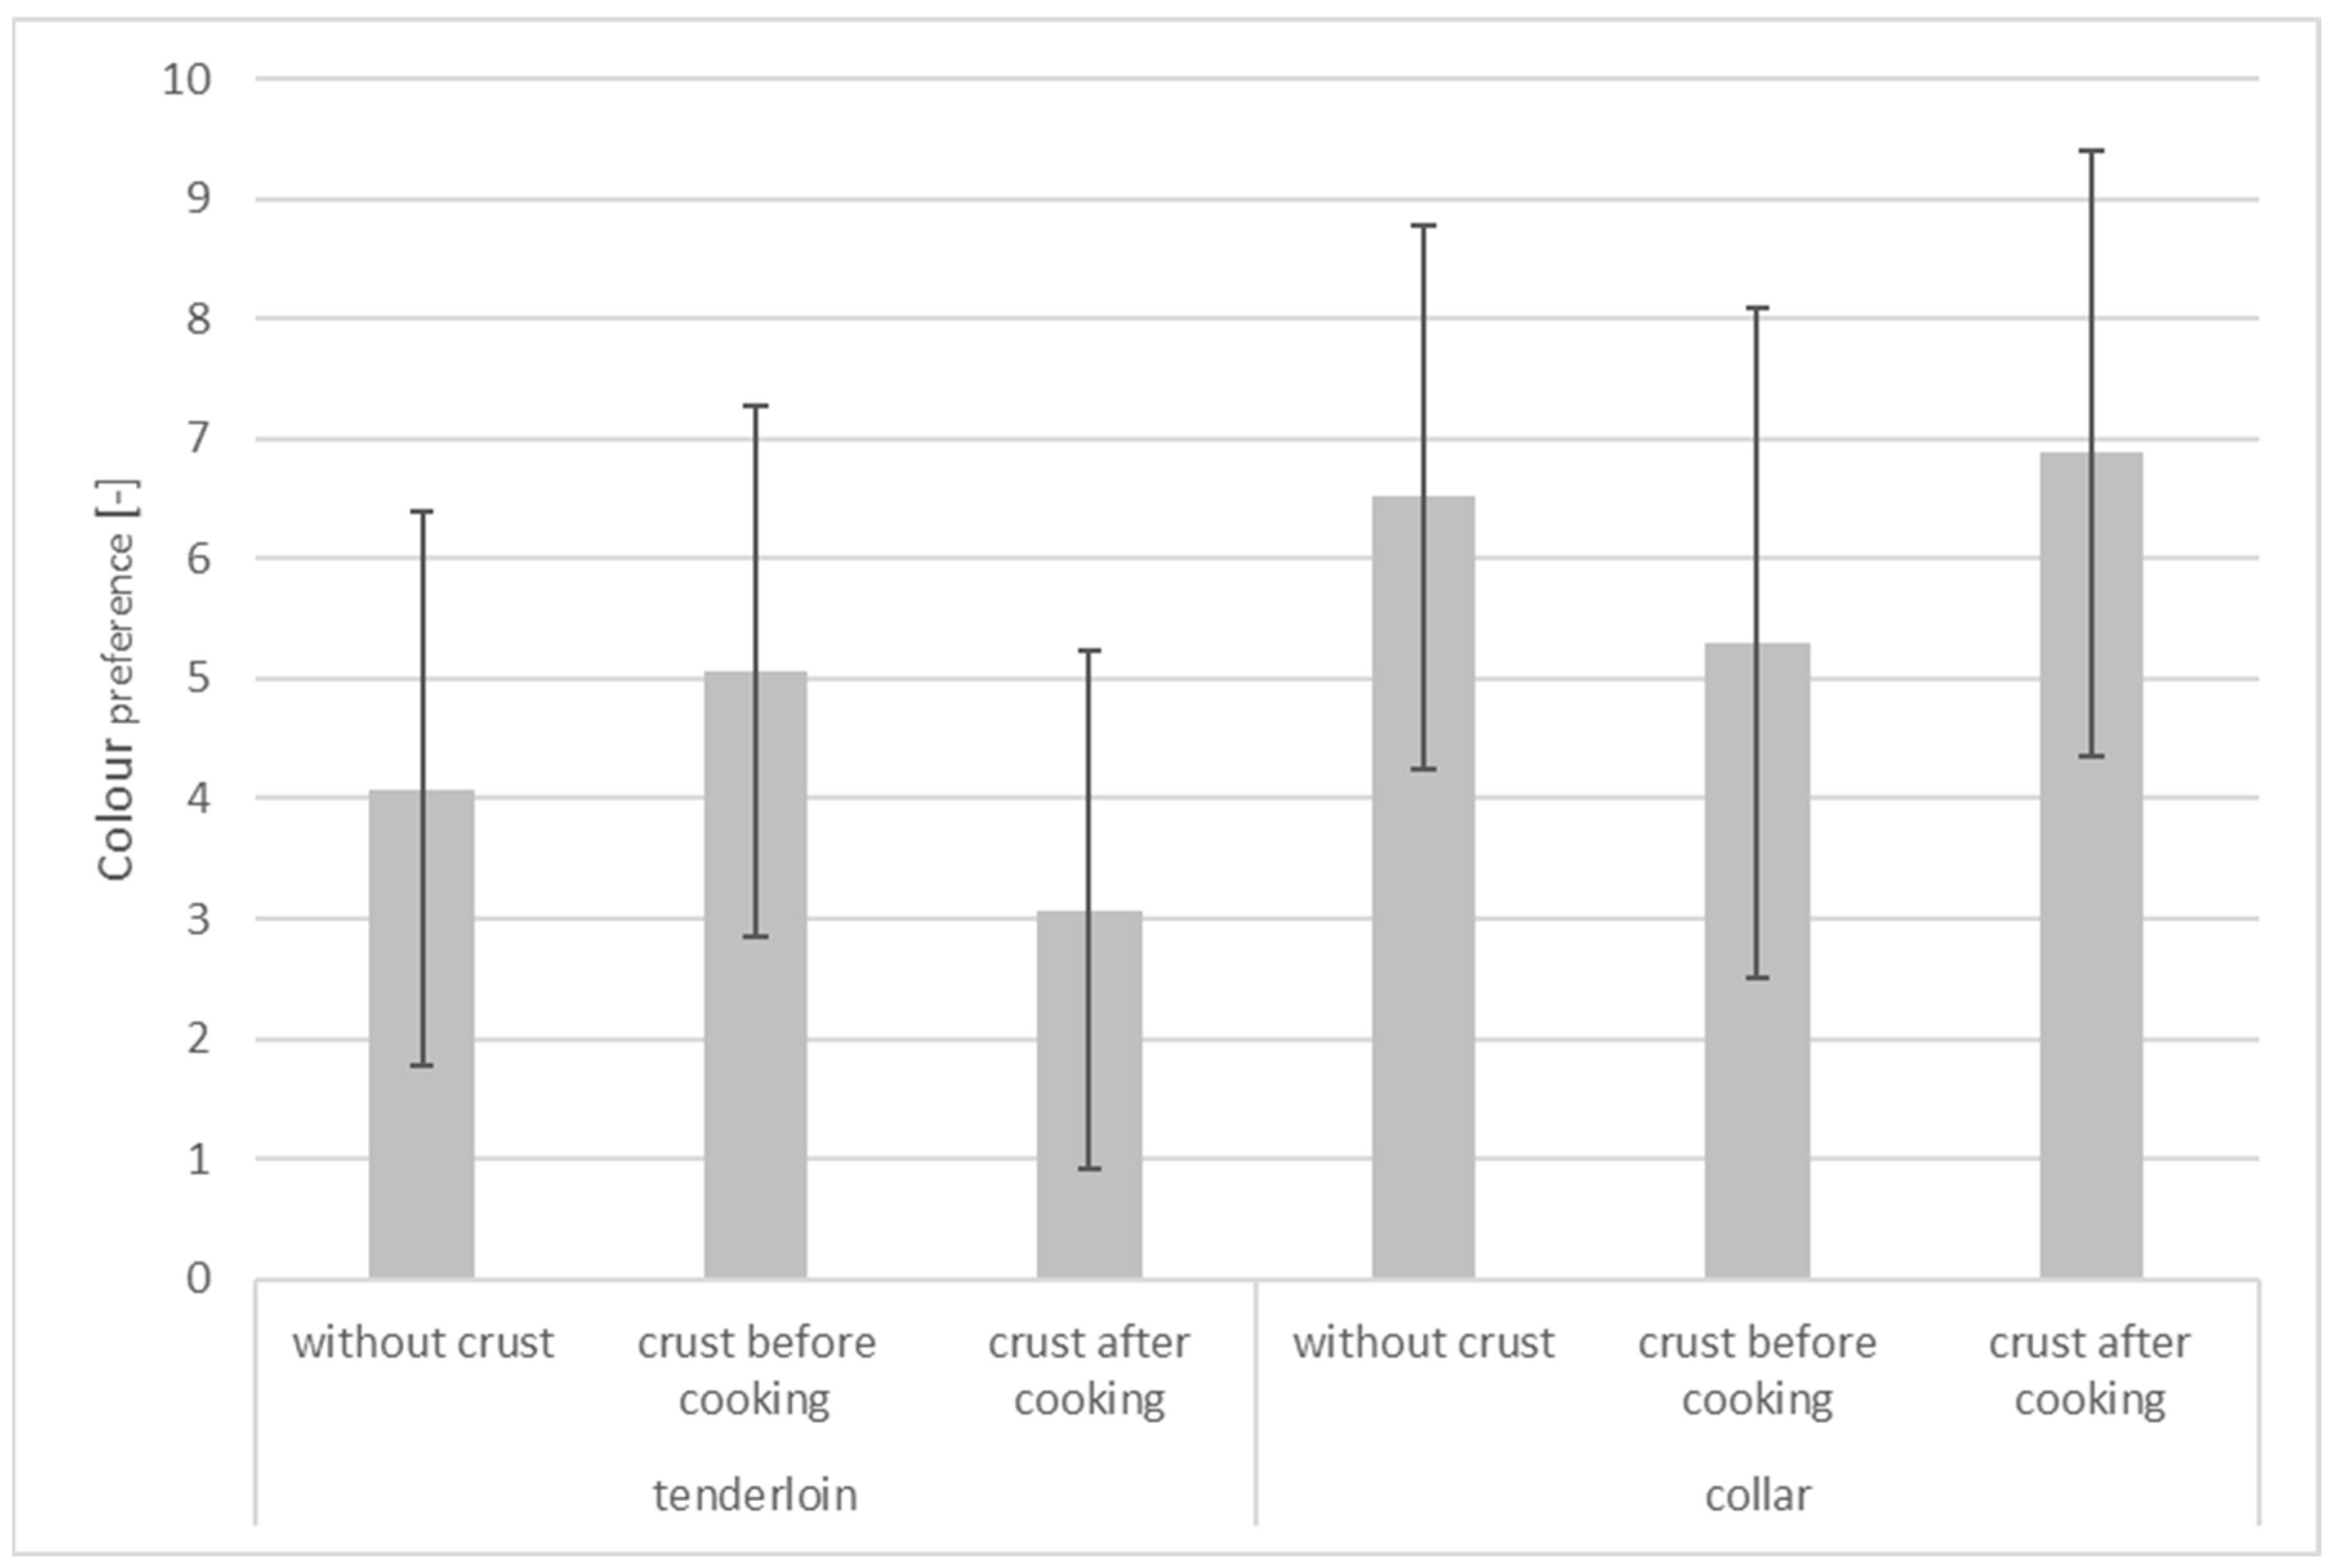
3.2. Colour
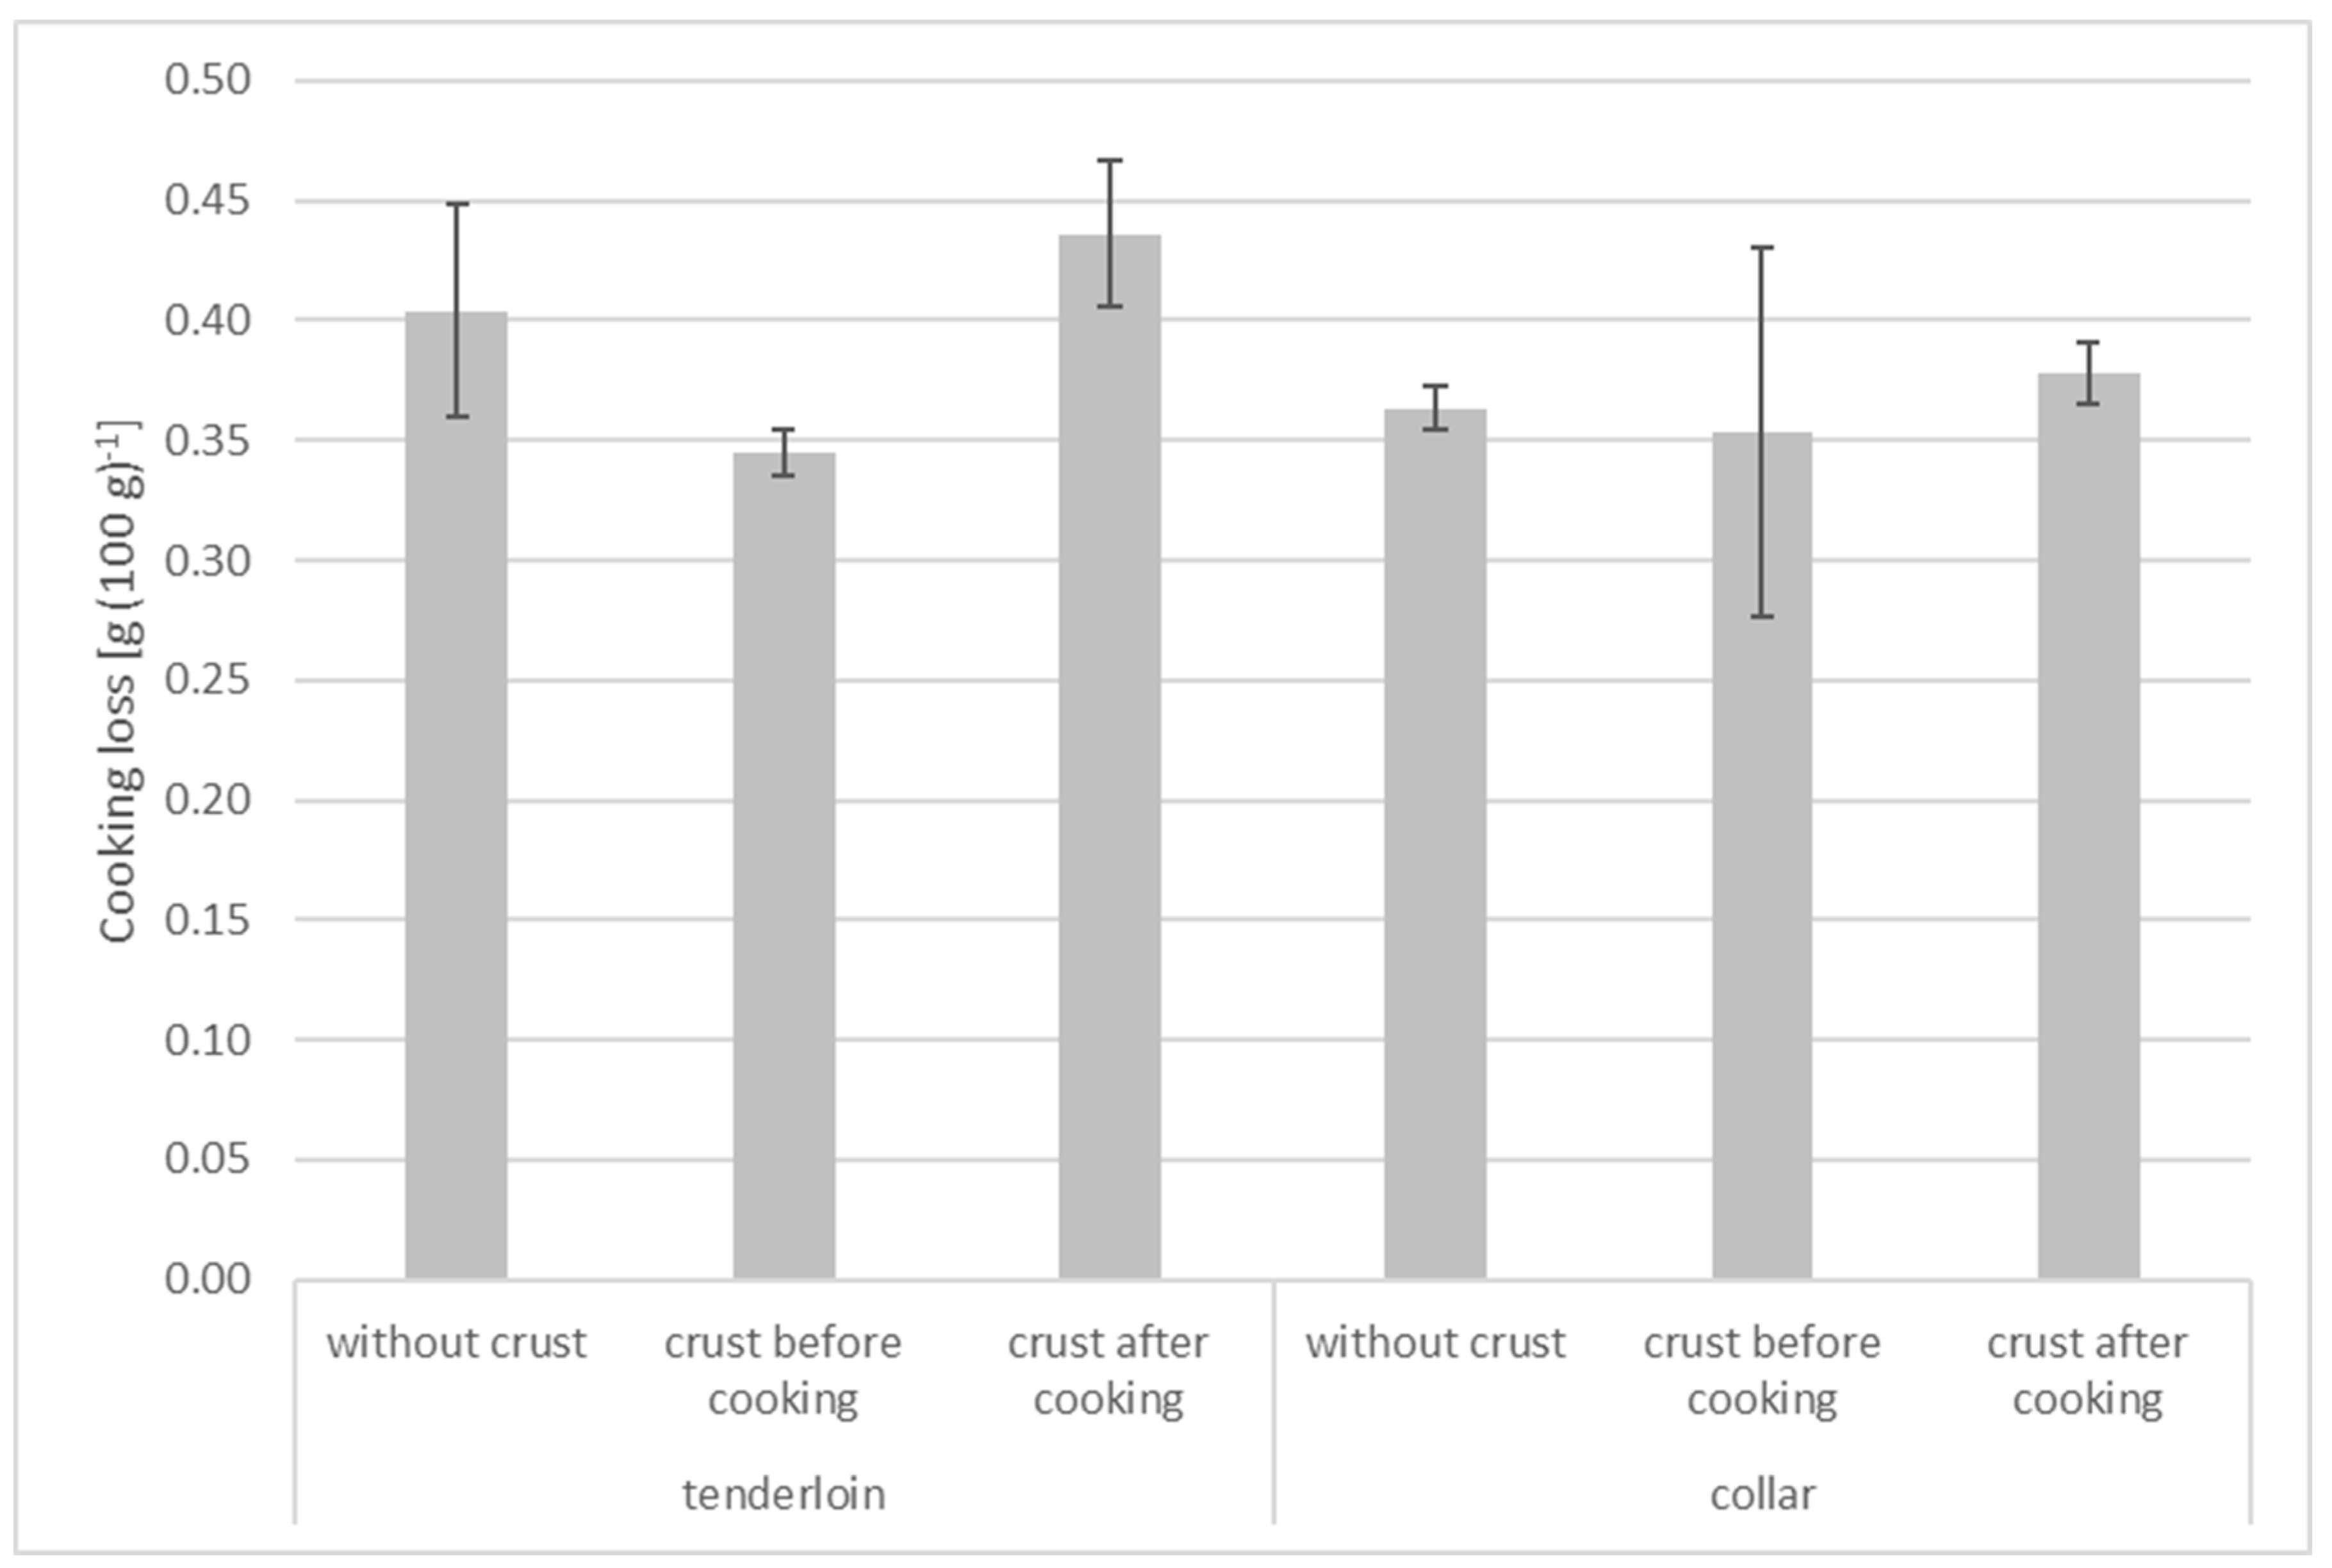
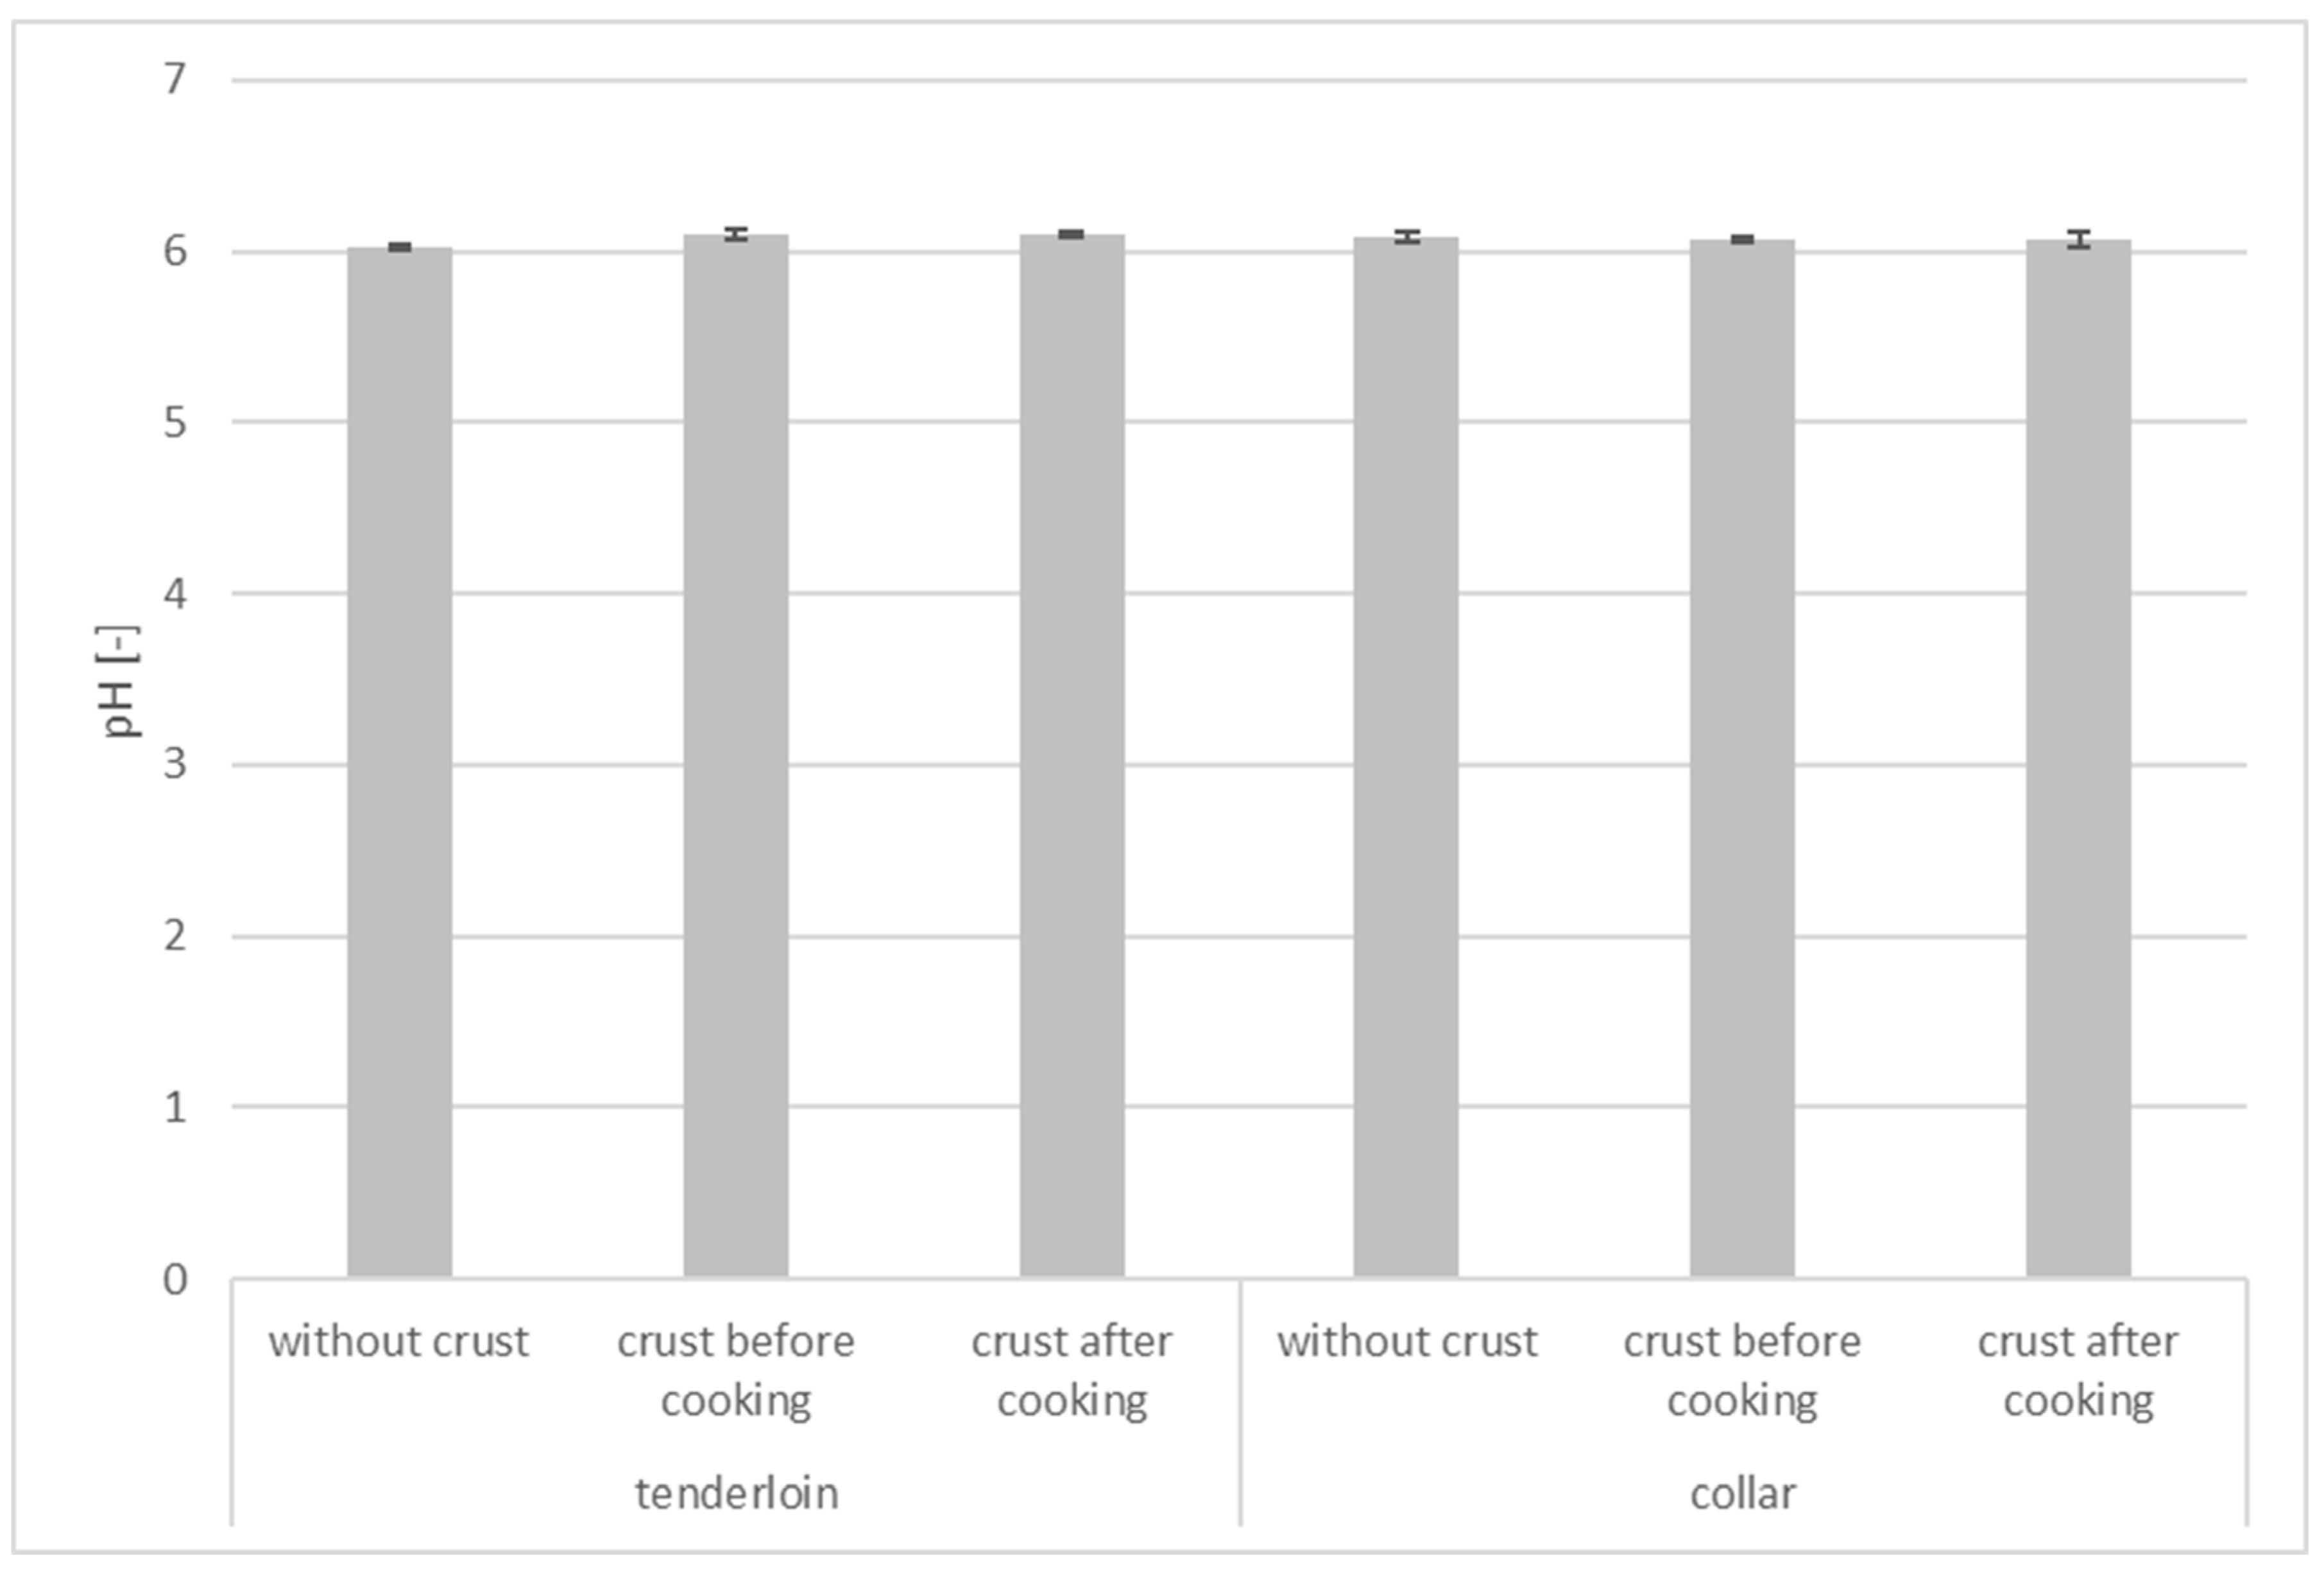
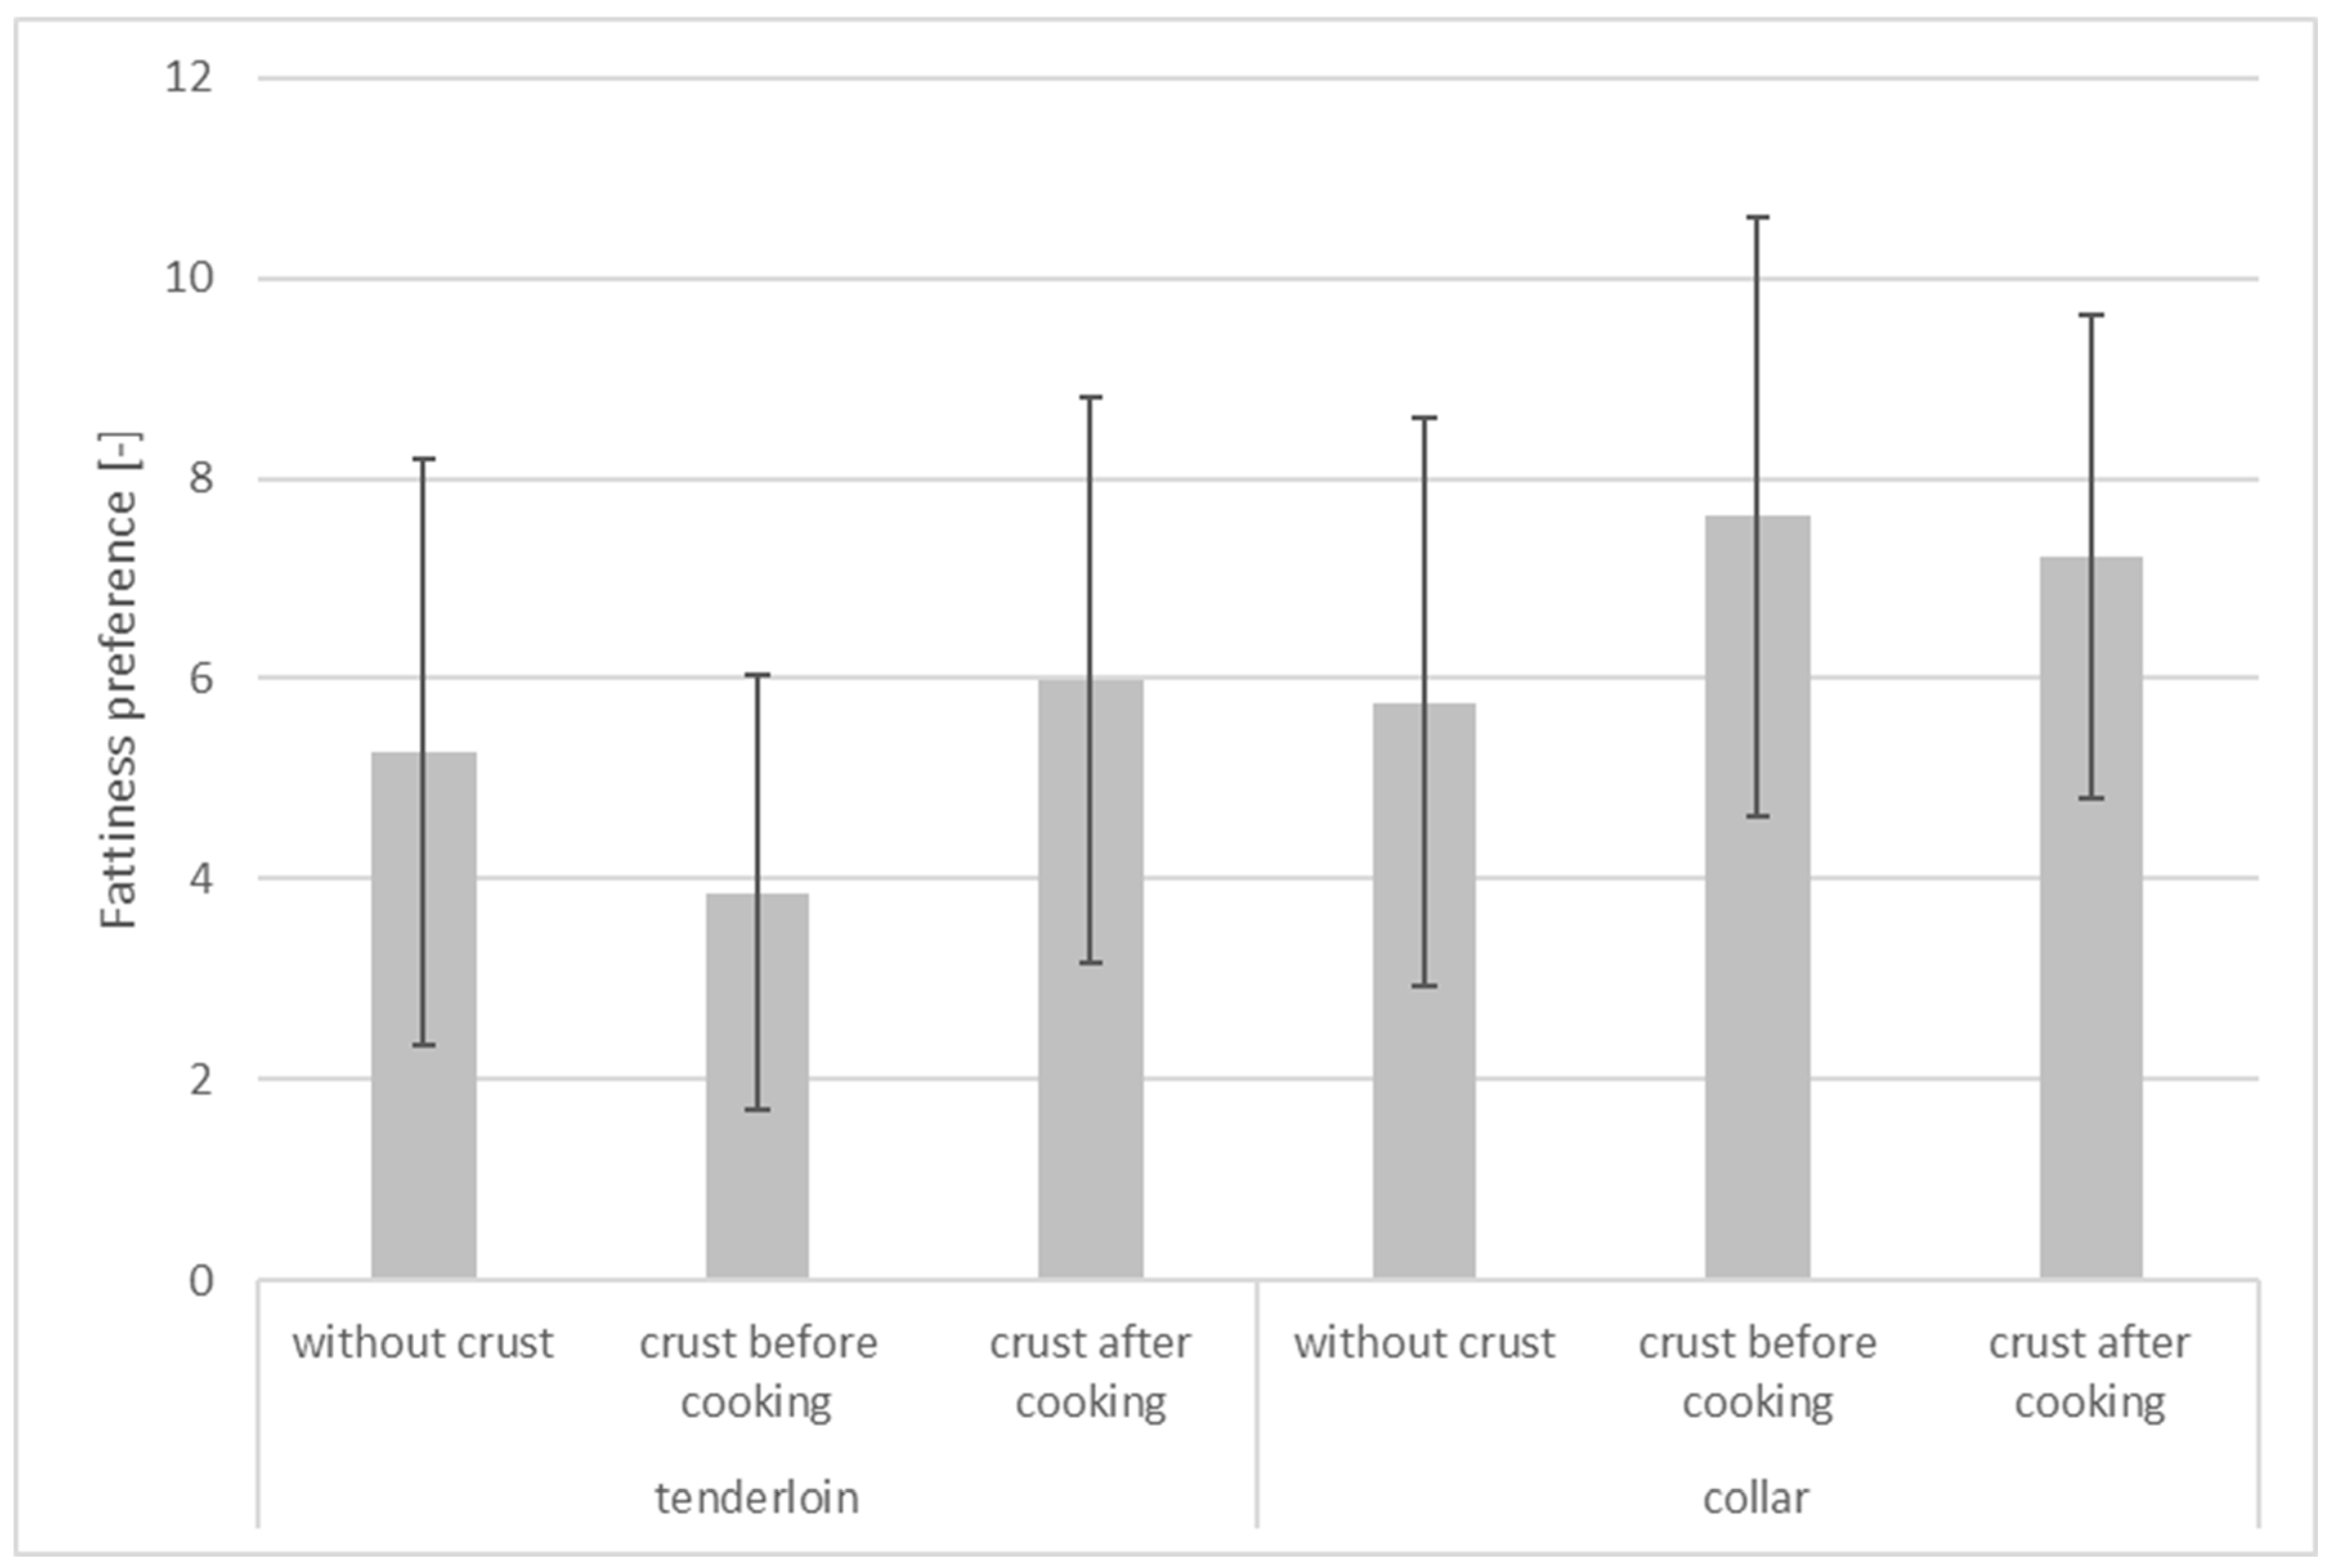
3.3. Cooking Loss, pH, WHC—Fattiness
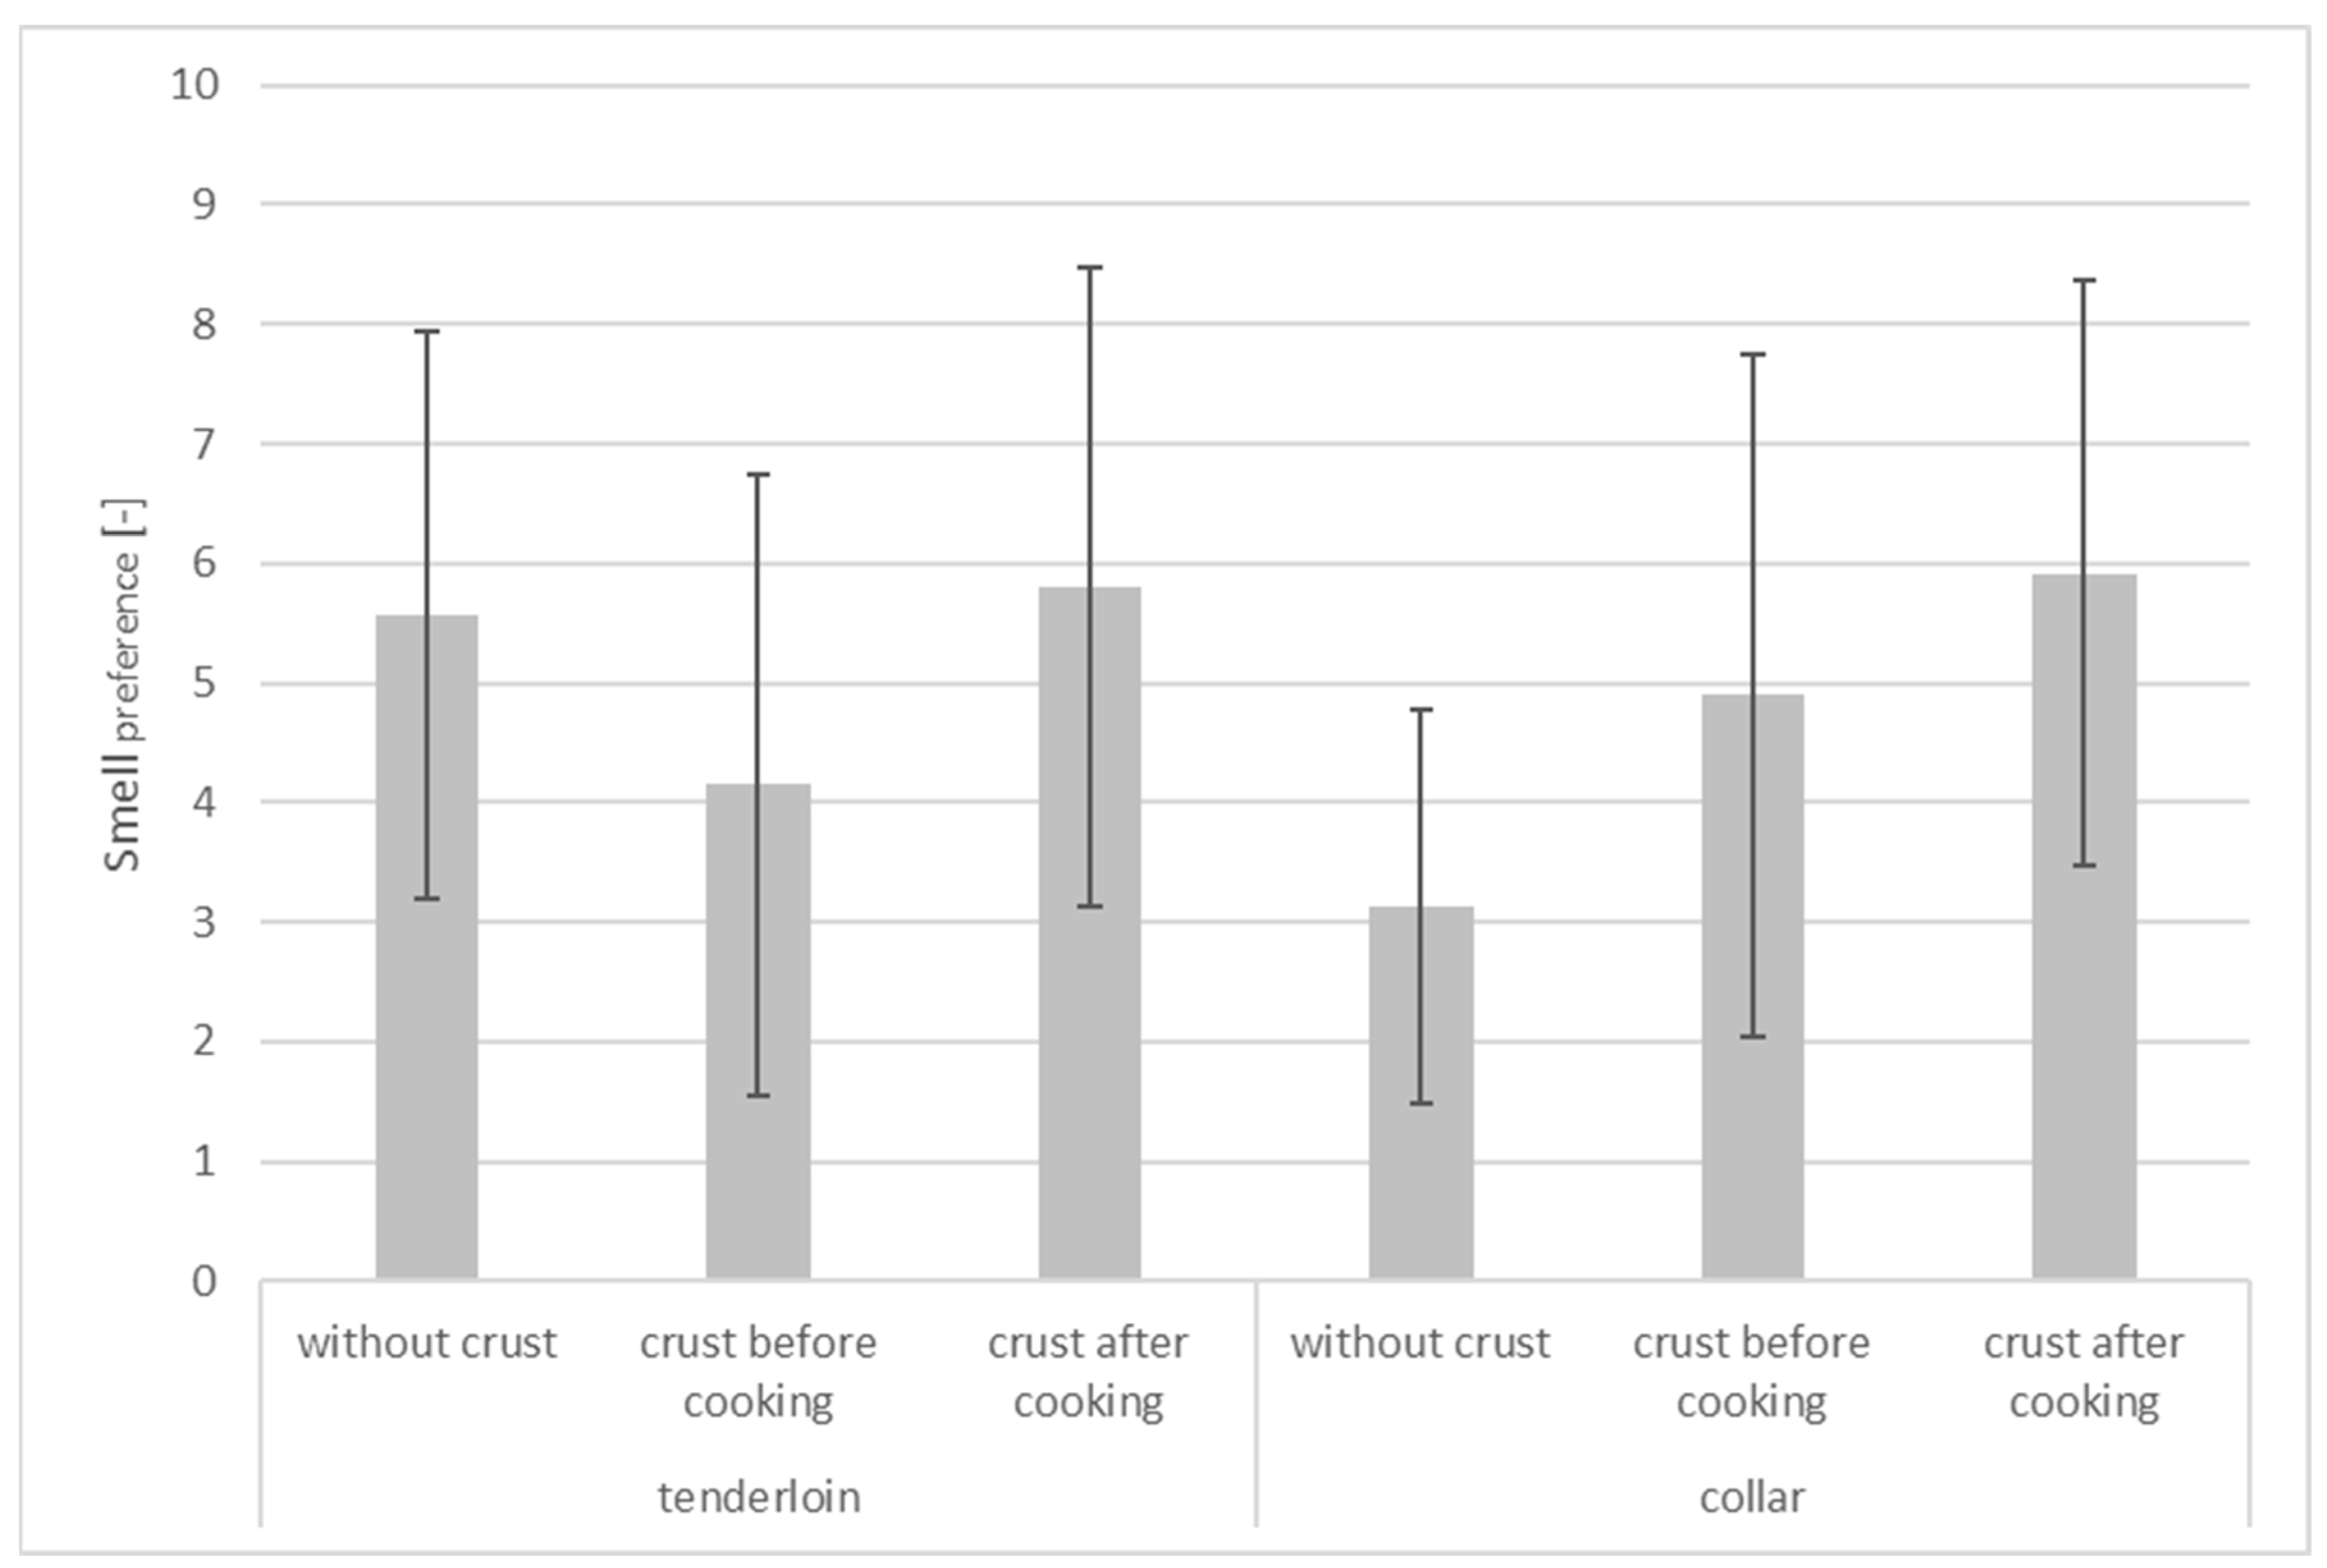
3.4. Sensory Attributes
4. Conclusions
Author Contributions
Funding
Institutional Review Board Statement
Informed Consent Statement
Data Availability Statement
Acknowledgments
Conflicts of Interest
References
- Leroy, F.; Cofnas, N. Should dietary guidelines recommend low red meat intake? Crit. Rev. Food Sci. Nutr. 2019, 60, 2763–2772. [Google Scholar] [PubMed]
- De Smet, S.; Vossen, E. Meat: The balance between nutrition and health. A review. Meat Sci. 2016, 120, 145–156. [Google Scholar] [CrossRef] [PubMed]
- Liu, J.; Chriki, S.; Kombolo, M.; Santinello, M.; Pflanzer, S.B.; Hocquette, É.; Ellies-Oury, M.-P.; Hocquette, J.F. Consumer perception of the challenges facing livestock production and meat consumption. Meat Sci. 2023, 200, 109144. [Google Scholar] [PubMed]
- Bekhit, A.A.; Hopkins, D.L.; Geesink, G.; Bekhit, A.A.; Franks, P. Exogenous proteases for meat tenderization. Crit. Rev. Food Sci. Nutr. 2014, 54, 1012–1031. [Google Scholar] [PubMed]
- Zhu, X.; Kaur, L.; Staincliffe, M.; Boland, M. Actinidin pretreatment and sous vide cooking of beef brisket: Effects on meat microstructure, texture and in vitro protein digestibility. Meat Sci. 2018, 145, 256–265. [Google Scholar]
- Munoz, A.M. Sensory evaluation in quality control: An overview, new developments and future opportunities. Food Qual. Prefer. 2002, 13, 329–339. [Google Scholar]
- Kilic, S.; Oz, E.; Turhan, S.; Amarowickz, R.; Toldra, F.; Brennan, C.; Oz, F. The effect of sealing process on the textural and sensory properties and protein profile of cooked meat. Int. J. Food Sci. Technol. 2023, 58, 4800–4811. [Google Scholar]
- Barber, N.; Broz, C. The meat searing process: Is sealing in juices fact or fiction? J. Culin. Sci. Technol. 2011, 9, 99–105. [Google Scholar]
- Asido, E.; Zeigerman, H.; Verman, M.; Argov-Argaman, N.; Kanner, J.; Tirosh, O. Meat crust as a novel food ingredient to regulate lipid peroxidation and oxidative stress. Curr. Res. Food Sci. 2024, 8, 100652. [Google Scholar]
- Kondjoyan, A.; Chevolleau, S.; Portanguen, S.; Molina, J.; Ikonic, P.; Clerjon, S.; Debrauwer, L. Relation between crust development and heterocyclic aromatic amine formation when air-roasting a meat cylinder. Food Chem. 2016, 213, 641–646. [Google Scholar]
- Wang, B.; Li, H.; Huang, Z.; Kong, B.; Liu, Q.; Wang, H.; Xu, M.; Xia, X. Dynamic changes in the qualities and heterocyclic aromatic amines of roasted pork induced by frying temperature and time. Meat Sci. 2021, 176, 108457. [Google Scholar] [CrossRef] [PubMed]
- Okpala, C.O.R.; Juchniewicz, S.; Leicht, K.; Skendrović, H.; Korzeniowska, M.; Guiné, R.P. Quality attributes of different marinated oven-grilled pork neck meat. Int. J. Food Prop. 2023, 26, 453–470. [Google Scholar] [CrossRef]
- Beard, J.; Callvert, I.E. The James Beard Cookbook, 3rd ed.; Da Capo Press: Emeryville, CA, USA, 2001. [Google Scholar]
- Yoo, J.H.; Kim, J.W.; Yong, H.I.; Baek, K.H.; Lee, H.J.; Jo, C. Effects of searing cooking on sensory and physicochemical properties of beef steak. Food Sci. Anim. Resour. 2020, 40, 44–54. [Google Scholar] [CrossRef] [PubMed]
- McGee, H. On Food and Cooking: The Science and Lore of the Kitchen; Scribner: New York, NY, USA, 2007. [Google Scholar]
- Barbut, S. Frying—Effect of coating on crust microstructure, color, and texture of lean meat portions. Meat Sci. 2013, 93, 269–274. [Google Scholar] [CrossRef] [PubMed]
- Ateba, P.; Mittal, G.S. Dynamics of crust formation and kinetics of quality changes during frying of meatballs. J. Food Sci. 1994, 59, 1275–1278. [Google Scholar] [CrossRef]
- De Huidobro, F.R.; Miguel, E.; Blázquez, B.; Onega, E.A. comparison between two methods (Warner–Bratzler and texture profile analysis) for testing either raw meat or cooked meat. Meat Sci. 2005, 69, 527–536. [Google Scholar] [CrossRef]
- Nishinari, K.; Fang, Y.; Rosenthal, A. Human oral processing and texture profile analysis parameters: Bridging the gap between the sensory evaluation and the instrumental measurements. J. Texture Stud. 2019, 50, 369–380. [Google Scholar] [CrossRef]
- Csurka, T.; Varga-Tóth, A.; Kühn, D.; Hitka, G.; Badak-Kerti, K.; Alpár, B.; Surányi, J.; Friedrich, L.F.; Pásztor-Huszár, K. Comparison of techno-functional and sensory properties of sponge cakes made with egg powder and different quality of powdered blood products for substituting egg allergen and developing functional food. Front. Nutr. 2022, 9, 979594. [Google Scholar] [CrossRef]
- Horváth-Mezőfi, Z.; Baranyai, L.; Nguyen, L.L.P.; Dam, M.S.; Ha, N.T.T.; Göb, M.; Sasvár, Z.; Csurka, T.; Zsom, T.; Hitka, G. Evaluation of Color and Pigment Changes in Tomato after 1-Methylcyclopropene (1-MCP) Treatment. Sensors 2024, 24, 2426. [Google Scholar] [CrossRef]
- Anese, M.; Sovrano, S.; Bortolomeazzi, R. Effect of radiofrequency heating on acrylamide formation in bakery products. Eur. Food Res. Technol. 2008, 226, 1197–1203. [Google Scholar] [CrossRef]
- Covington, A.K.; Bates, R.G.; Durst, R.A. Definition of pH scales, standard reference values, measurement of pH and related terminology (Recommendations 1984). Pure Appl. Chem. 1985, 57, 531–542. [Google Scholar]
- Grau, R.; Hamm, G. A Simple Method for Determining Water Binding in Muscle. Die Naturwissenschaften 1953, 40, 29–30. (In German) [Google Scholar]
- Csurka, T.; Pasztor-Huszar, K.; Friedrich, L.F. Comparison of products made from meat batter with various types and quantities of blood products. J. Food Nutr. Res. 2022, 61, 389–401. [Google Scholar]
- Huberty, C.J.; Olejnik, S. Applied MANOVA and Discriminant Analysis; John Wiley & Sons: Hoboken, NJ, USA, 2006; Available online: https://books.google.hu/books?id=Cy_IoTEKkngC&lpg=PR7&ots=jwr0i7vQPs&dq=Applied%20MANOVA%20and%20discriminant%20analysis%20&lr&hl=pg=PR7#v=onepage&q=Applied%20MANOVA%20and%20discriminant%20analysis&f=false (accessed on 23 September 2024)ISBN 978-0-471-46815-8.
- Shapiro, S.S.; Wilk, M.B. An Analysis of Variance Test for Normality (Complete Samples). Biometrika 1965, 52, 591–611. [Google Scholar] [CrossRef]
- Levene, H. Contributions to probability and statistics. In Essays in Honor of Harold Hotelling; Stanford University Press: Stanford, CA, USA, 1960; pp. 278–292. [Google Scholar]
- Box, G.E.P. A general distribution theory for a class of likelihood criteria. Biometrika 1949, 36, 317–346. [Google Scholar] [CrossRef]
- Yao, Y.; Huang, M.; Wang, X.; Yu, J.; Cui, H.; Hayat, K.; Zhang, X.; Ho, C.T. Differentiated texture and lipid-lowering effect of cooked pork belly by different cooking regimes: Insights from myofibrillar protein aggregation and dissociation, micromorphology. Food Biosci. 2024, 61, 104860. [Google Scholar] [CrossRef]
- Djekic, I.; Ilic, J.; Lorenzo, J.M.; Tomasevic, I. How do culinary methods affect quality and oral processing characteristics of pork ham? J. Texture Stud. 2021, 52, 36–44. [Google Scholar] [CrossRef]
- Becker, A.; Boulaaba, A.; Pingen, S.; Krischek, C.; Klein, G. Low temperature cooking of pork meat—Physicochemical and sensory aspects. Meat Sci. 2016, 118, 82–88. [Google Scholar] [CrossRef]
- Huff-Lonergan, E.; Lonergan, S.M. Mechanisms of water-holding capacity of meat: The role of postmortem biochemical and structural changes. Meat Sci. 2005, 71, 194–204. [Google Scholar]
- Ángel-Rendón, S.V.; Filomena-Ambrosio, A.; Hernández-Carrión, M.; Llorca, E.; Hernando, I.; Quiles, A.; Sotelo-Díaz, I. Pork meat prepared by different cooking methods. A microstructural, sensorial and physicochemical approach. Meat Sci. 2020, 163, 108089. [Google Scholar] [CrossRef]
- Luyten, H.; Plijter, J.J.; Van Vliet, T. Crispy/crunchy crusts of cellular solid foods: A literature review with discussion. J. Texture Stud. 2004, 35, 445–492. [Google Scholar] [CrossRef]
- Szczesniak, A.S. Texture is a sensory property. Food Qual. Prefer. 2002, 13, 215–225. [Google Scholar] [CrossRef]
- Roudaut, G.; Dacremont, C.; Pàmies, B.V.; Colas, B.; Le Meste, M. Crispness: A critical review on sensory and material science approaches. Trends Food Sci. Technol. 2002, 13, 217–227. [Google Scholar] [CrossRef]
- Berry, B.W.; Leddy, K.F. Effects of fat level and cooking method on sensory and textural properties of ground beef patties. J. Food Sci. 1984, 49, 870–875. [Google Scholar] [CrossRef]
- Aaslyng, M.D.; Oksama, M.; Olsen, E.V.; Bejerholm, C.; Baltzer, M.; Andersen, G.; Bredie, W.L.; Byrne, D.V.; Gabrielsen, G. The impact of sensory quality of pork on consumer preference. Meat Sci. 2007, 76, 61–73. [Google Scholar] [CrossRef] [PubMed]


| Study | Material | Methods | Findings |
|---|---|---|---|
| Kilic et al., 2023 [7] | Beef muscles (M. Longissimus thoracis et lumborum) were purchased from Erzurum Meat Combine. M. Longissimus thoracis et lumborum muscles obtained from three different male cattle of the same race, gender, and age at 24 h after slaughter. | Sealing on a griddle pan until 250 °C meat surface temperature, then until 20, 30, or 40 °C internal temperatures. (Control was not sealed.) After the sealing process, the samples were baked in an oven at 180 °C until 71 °C internal temperature. | The high cooking loss and greater rate of protein denaturation observed in the sealed samples suggested that sealing may not be a way to make the meat juicier. Moderate sealing reduced the hardness of the meat. The sensory evaluation showed that the general acceptability of the longer sealed samples was higher because of the appearance change caused by the Maillard reaction. |
| Barber and Broz, 2011 [8] | Four cuts of rib eye beef steaks from the rib primal taken from the same primal with a nearly identical ratio of fat to lean. | Heat treatment at 205 °C in electric oven for 10 min. The searing pan was heated for 5 min at the burner’s highest setting, then meat slices were heat treated on the pan for 10 s per side. | Searing improved the flavour and caused browning through the Maillard reaction. But flavorful juices were not preserved, the cooking loss increased. |
| Asido et al., 2024 [9] | Ground turkey and entrecote from commercial stores and kept at −80 °C until use. | Heat treatment on an electric stove to 180 °C. The cuts were placed on the pan without oil and fried for 3 min exactly per side or were microwave treated at 800 W for 1 min. Internal temperature reached 70 °C. | The crust, as a semi-natural antioxidant, reduced lipid peroxidation and possibly extended shelf life. |
| Kondjoyan et al., 2016 [10] | Longissimus thoracis muscles (ribeye or loin eye) taken from carcasses of 18-month-old heifers immediately after slaughter aged for 12 days under vacuum-packing and stored at −20 °C. | Heat treatment with 160, 190, 225, or 260 °C air temperature during 20, 30, 60, and 90 min cooking times. | Less heterocyclic aromatic amines form in coloured crusts developing on the surface of meat pieces than in meat slices. |
| Wang et al., 2021 [11] | Pork legs with moderate fat from 10 pig carcasses (100–120 kg live weight, about ten months of age and 24 h post-mortem). | Frying at 150, 175, 200, 225, and 250 °C during 0.5, 1.0, 1.5, 2.0, and 2.5 min. | L* decreased, a*, b*, and amount of heterocyclic aromatic amine content increased with increased frying temperature and time. |
| Okpala et al., 2023 [12] | Pork neck (collar). | Marination then oven-grilling at 180 °C during 5 min. Internal temperature reached 75 °C. | Marination after heat treatment had an effect on chemical components, pH, colour, and texture. |
| Slaughtering | with full bleeding slaughtering technology |
| Cooling | 1 day to below 8 °C core temperature |
| Cutting, deboning, vacuum-packaging, and cooling | 1 day, technologies below 12 °C, cooling below 4 °C core temperature |
| Resting before baking | until 20 °C surface temperature and 14 °C core temperature |
| Crust forming before cooking | in non-stick pan on sunflower oil, which had a temperature of 230 °C at the start of crusting:
|
| Cooking | in tray covered with aluminum foil, in the oven with air-mix mode at 200 °C for 40 min |
| Crust forming after cooking | in non-stick pan on sunflower oil, which had a temperature of 230 °C at the start of crusting:
|
| Dependent Variants | Factor | MANOVA Result | |
|---|---|---|---|
| Wilks’ Lambda | p Value | ||
| Texture attributes | Meat type | 0.322 | <0.001 |
| Treatment | 0.386 | <0.001 | |
| Interaction | 0.367 | <0.001 | |
| Colour parameters | Meat type | 0.617 | <0.001 |
| Treatment | 0.277 | <0.001 | |
| Interaction | 0.499 | <0.001 | |
| Cooking loss, pH, WHC—fattiness | Meat type | 0.549 | 0.004 |
| Treatment | 0.196 | <0.001 | |
| Interaction | 0.442 | 0.005 | |
| Sensory properties | Meat type | 0.617 | <0.001 |
| Treatment | 0.671 | <0.001 | |
| Interaction | 0.608 | <0.001 | |
| Sensory Attribute | Meat Part | Treatment | Mean | Std. Deviation |
|---|---|---|---|---|
| Smell preference [-] | tenderloin | without crust | 5.57 | 2.37 |
| crust before cooking | 4.15 | 2.60 | ||
| crust after cooking | 5.80 | 2.67 | ||
| collar | without crust | 3.13 | 1.65 | |
| crust before cooking | 4.90 | 2.86 | ||
| crust after cooking | 5.92 | 2.45 | ||
| Colour preference [-] | tenderloin | without crust | 4.08 | 2.31 |
| crust before cooking | 5.07 | 2.22 | ||
| crust after cooking | 3.07 | 2.16 | ||
| collar | without crust | 6.52 | 2.27 | |
| crust before cooking | 5.30 | 2.79 | ||
| crust after cooking | 6.88 | 2.53 | ||
| Texture preference [-] | tenderloin | without crust | 3.97 | 2.20 |
| crust before cooking | 7.35 | 2.25 | ||
| crust after cooking | 4.08 | 2.30 | ||
| collar | without crust | 6.82 | 2.08 | |
| crust before cooking | 8.57 | 2.40 | ||
| crust after cooking | 6.30 | 2.71 | ||
| Fattiness preference [-] | tenderloin | without crust | 5.27 | 2.93 |
| crust before cooking | 3.87 | 2.17 | ||
| crust after cooking | 5.98 | 2.83 | ||
| collar | without crust | 5.77 | 2.84 | |
| crust before cooking | 7.62 | 3.00 | ||
| crust after cooking | 7.22 | 2.42 | ||
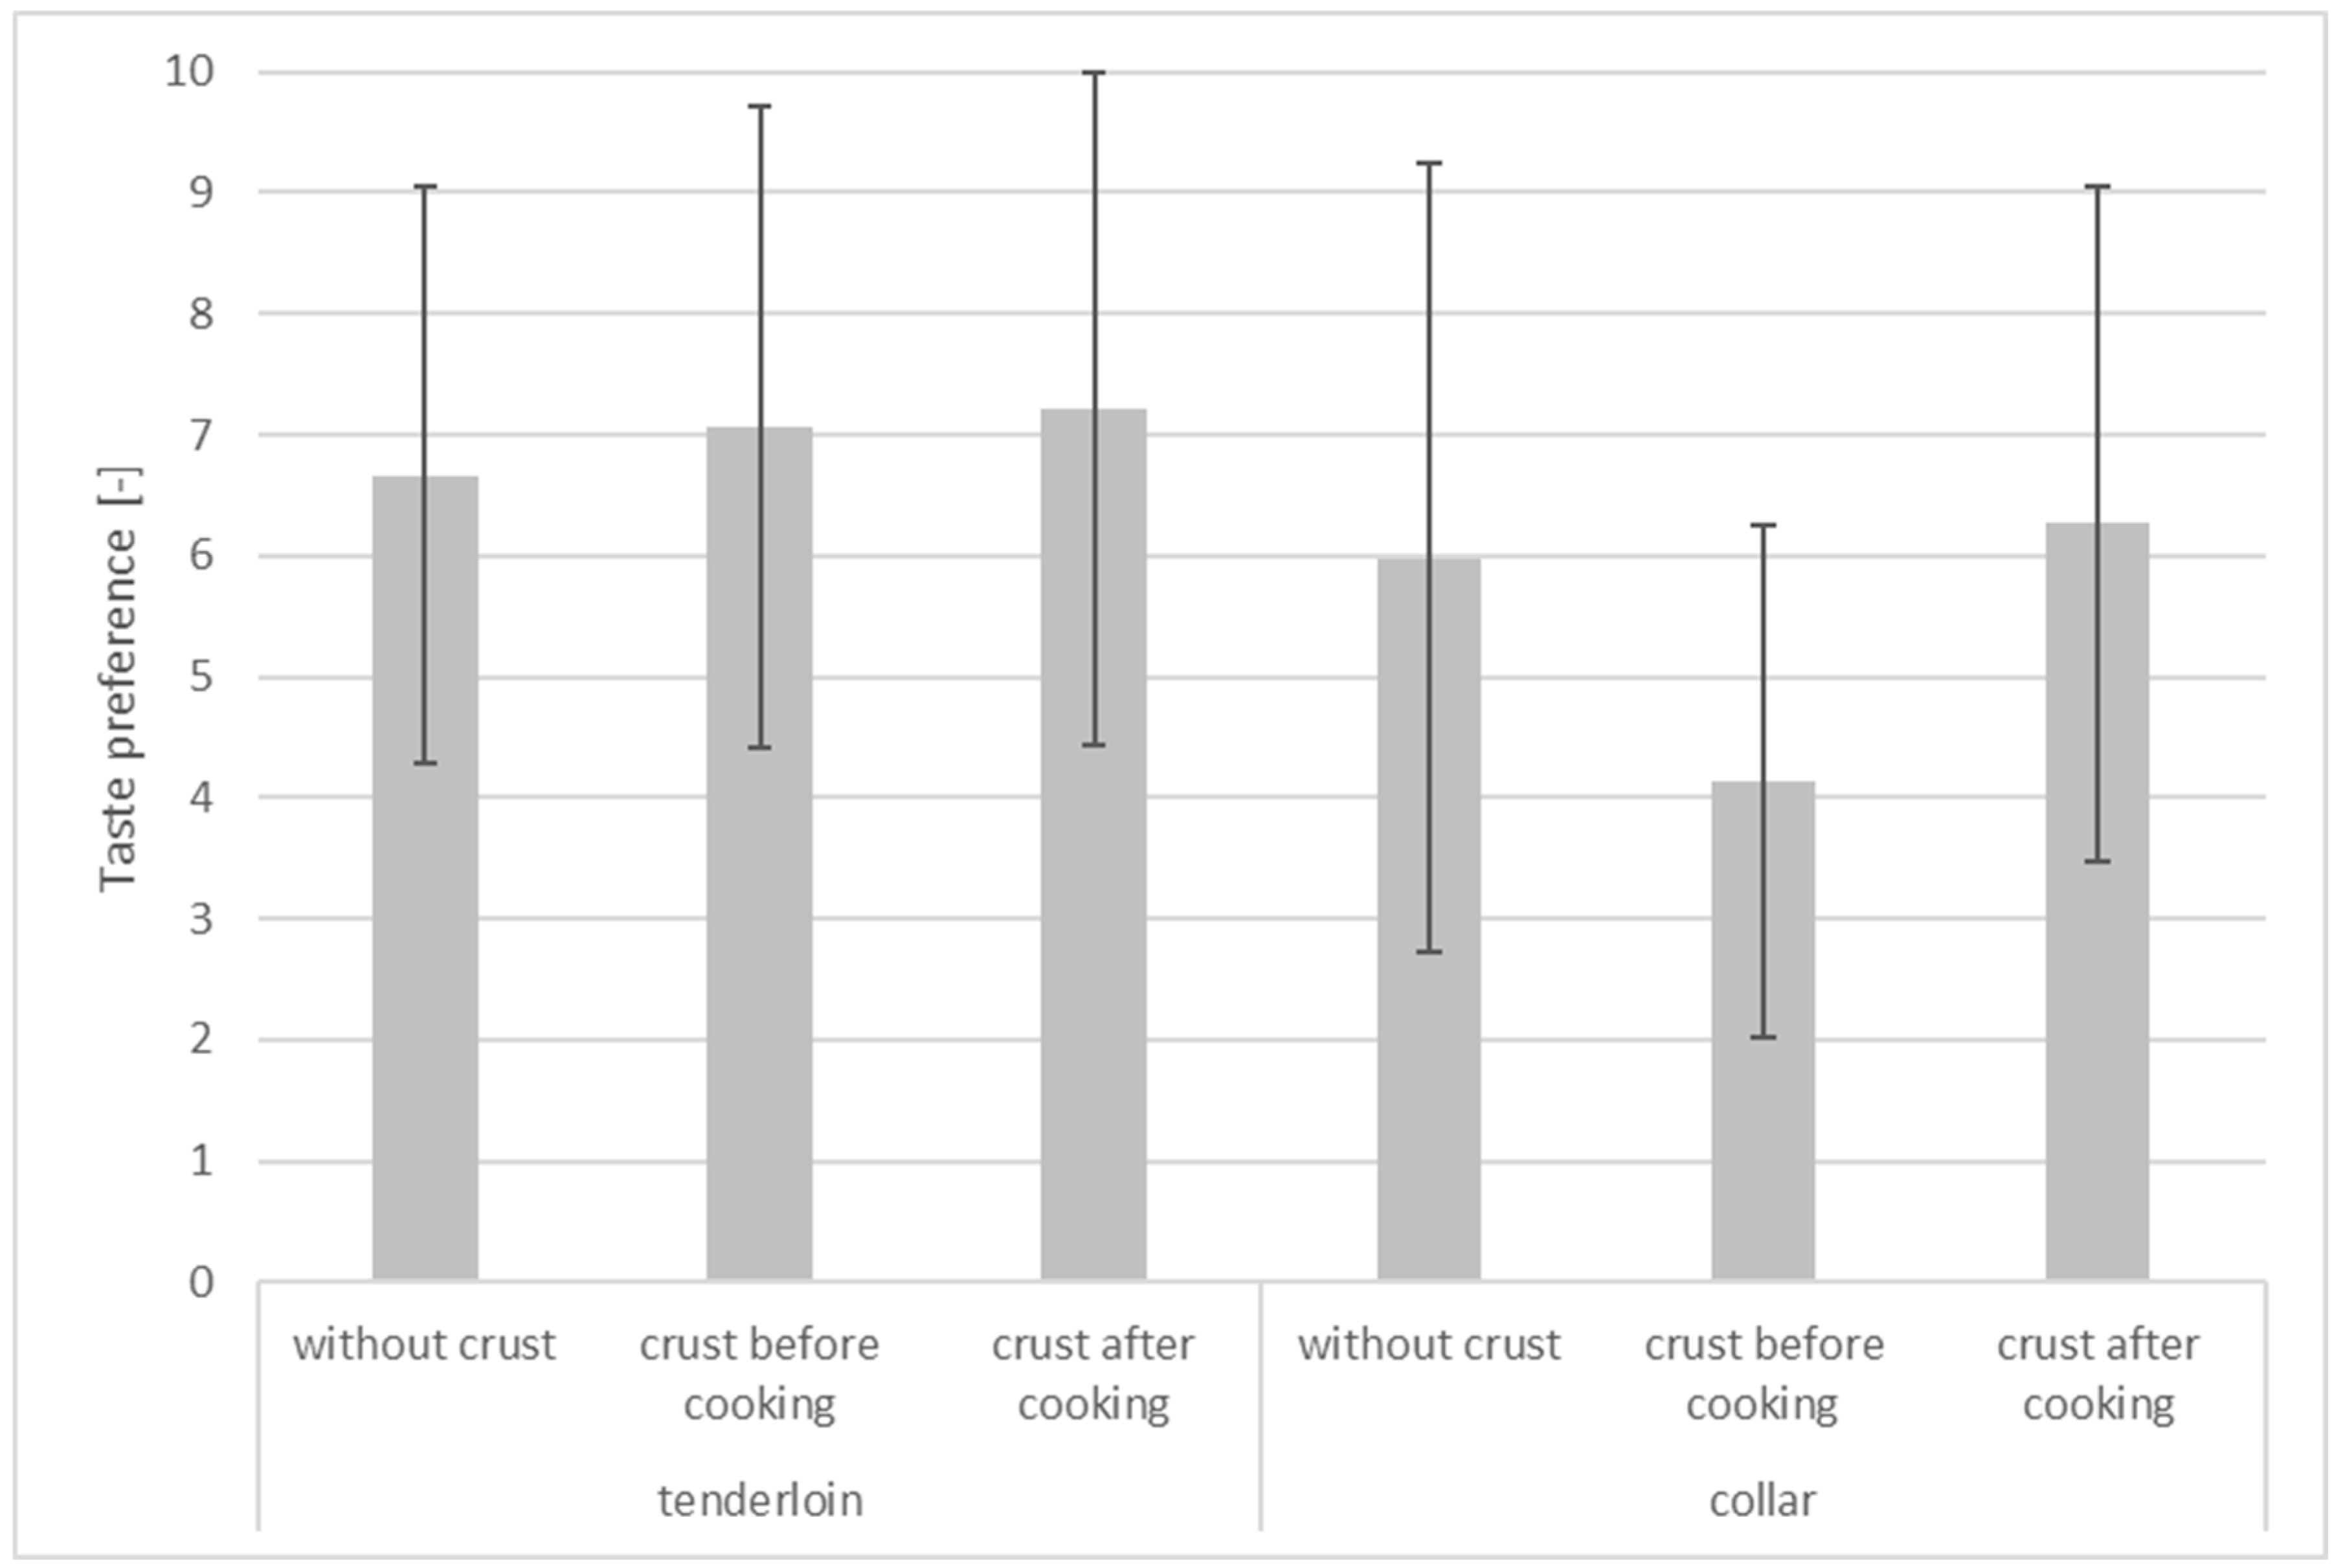
| Taste preference [-] | tenderloin | without crust | 6.67 | 2.38 |
| crust before cooking | 7.07 | 2.65 | ||
| crust after cooking | 7.22 | 2.78 | ||
| collar | without crust | 5.98 | 3.27 | |
| crust before cooking | 4.13 | 2.12 | ||
| crust after cooking | 6.27 | 2.79 | ||
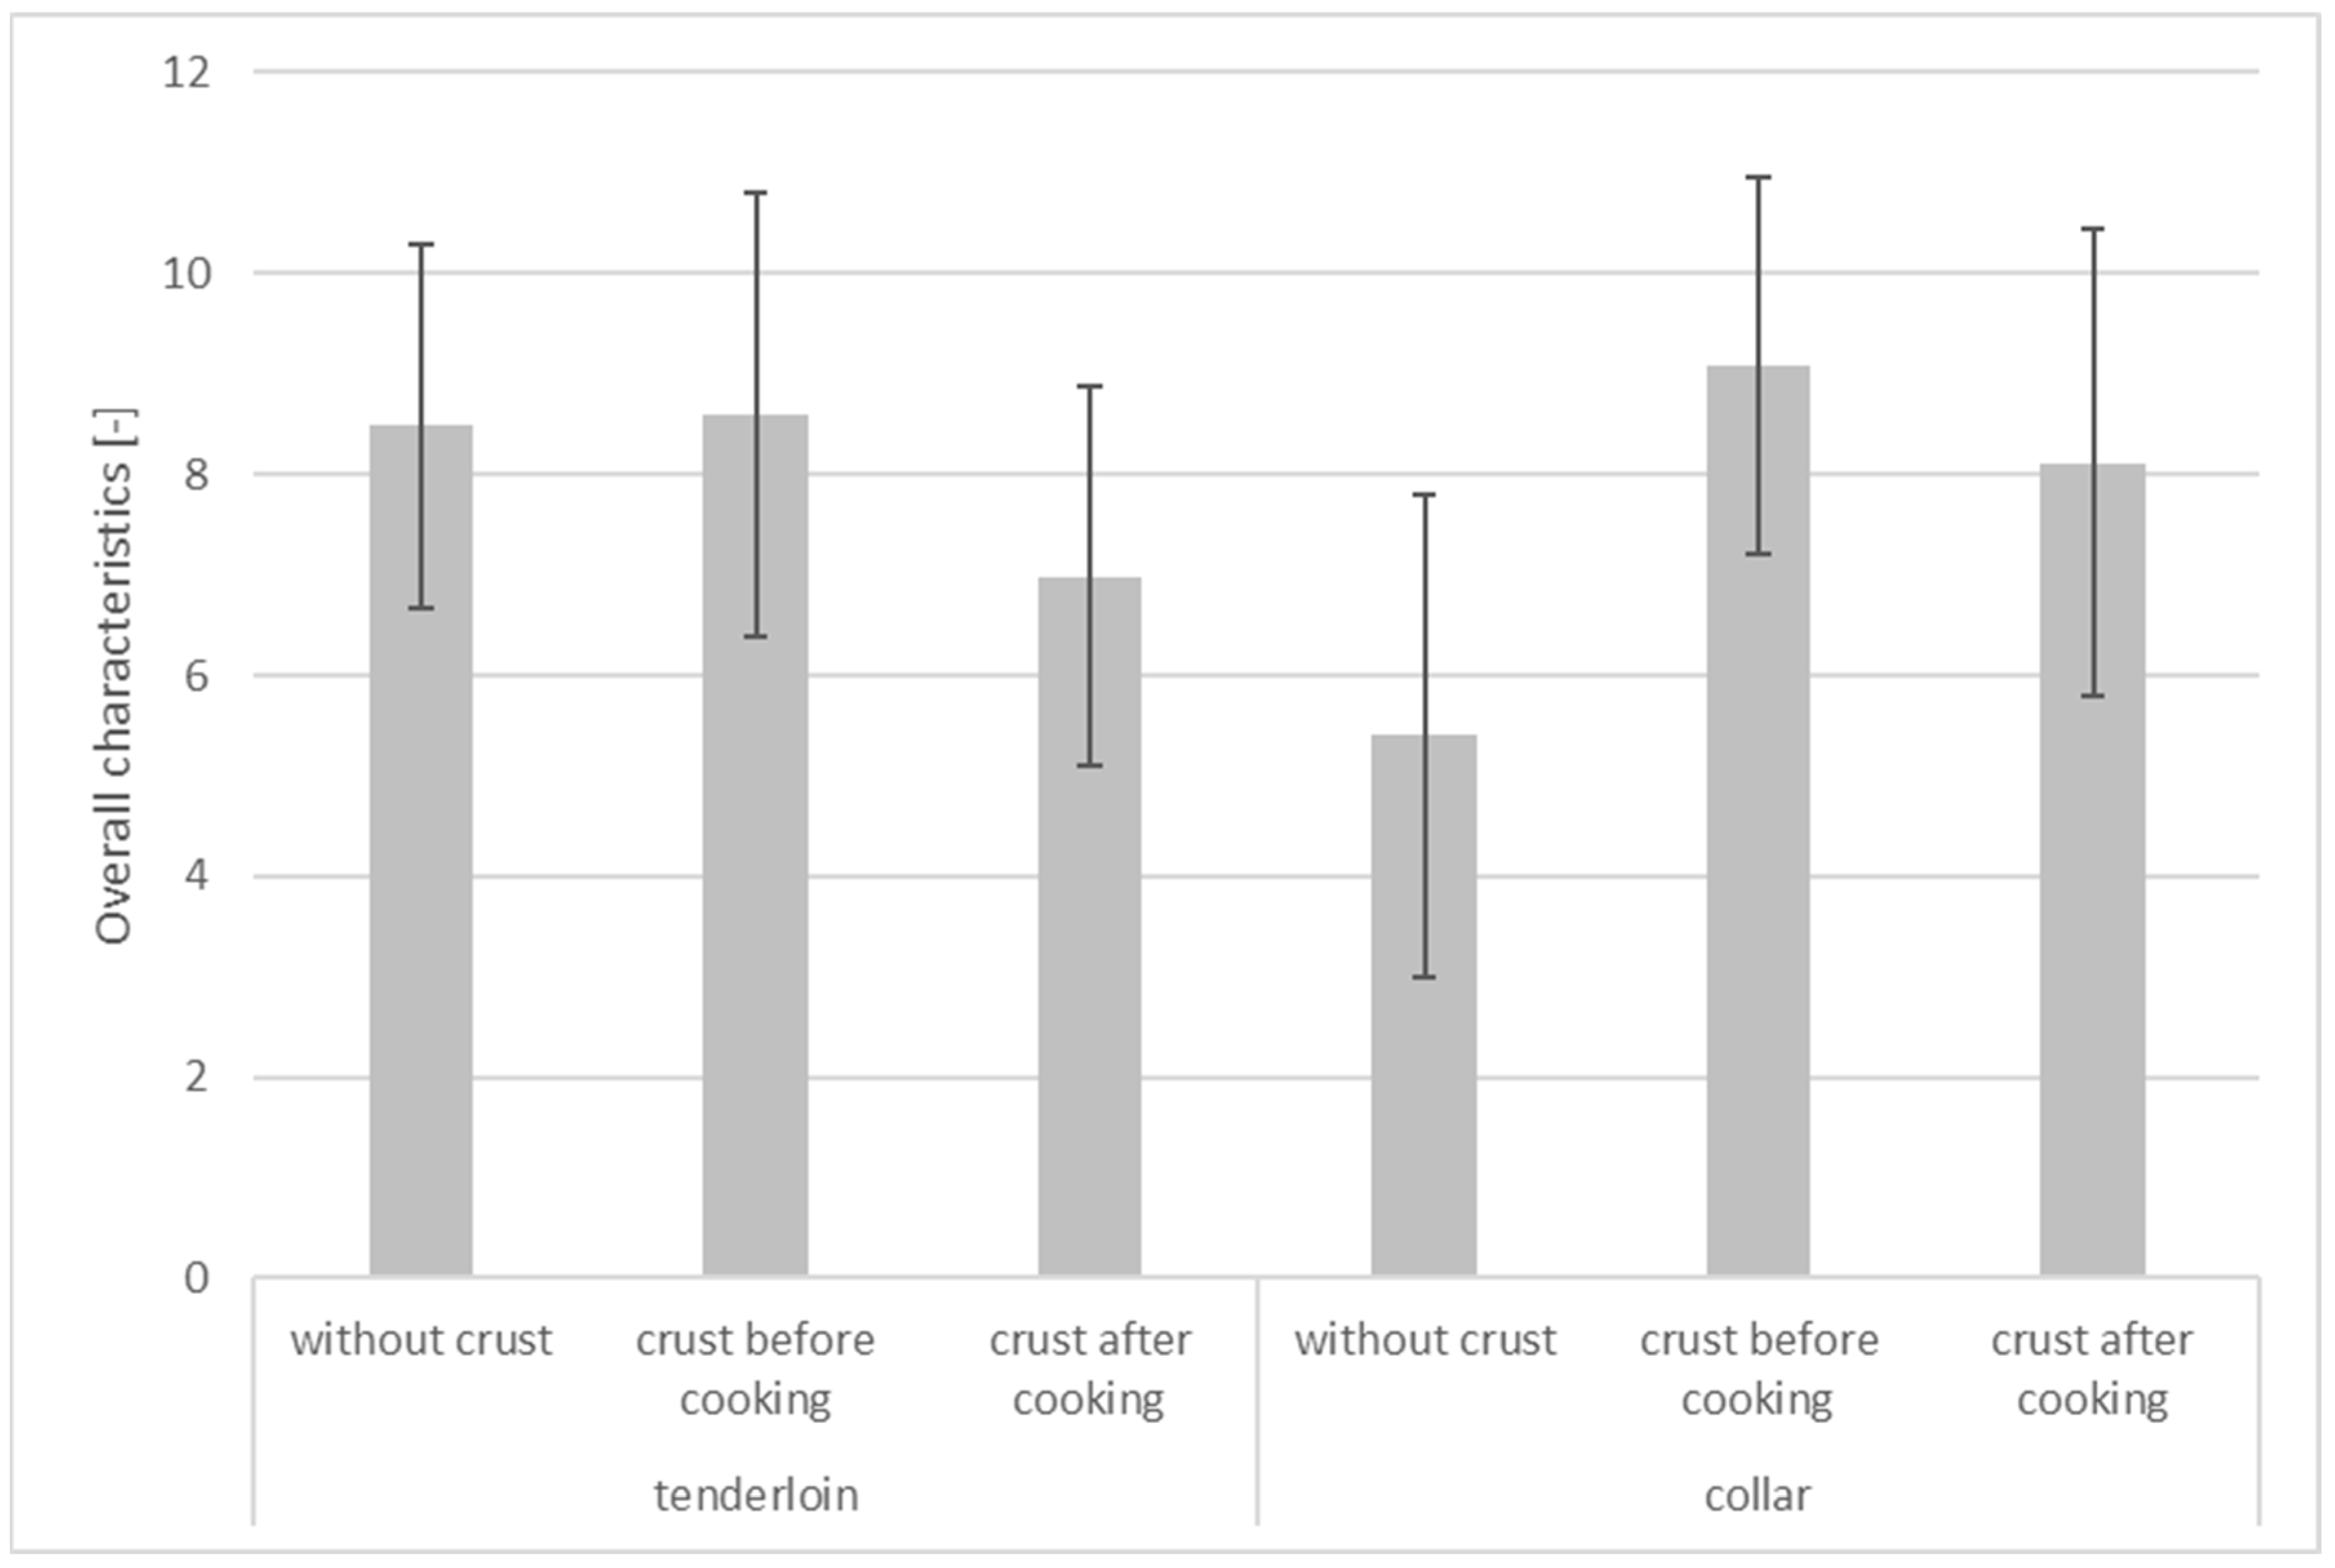
| Overall characteristics [-] | tenderloin | without crust | 8.48 | 1.81 |
| crust before cooking | 8.60 | 2.21 | ||
| crust after cooking | 6.98 | 1.89 | ||
| collar | without crust | 5.40 | 2.40 | |
| crust before cooking | 9.08 | 1.88 | ||
| crust after cooking | 8.12 | 2.33 |
Disclaimer/Publisher’s Note: The statements, opinions and data contained in all publications are solely those of the individual author(s) and contributor(s) and not of MDPI and/or the editor(s). MDPI and/or the editor(s) disclaim responsibility for any injury to people or property resulting from any ideas, methods, instructions or products referred to in the content. |
© 2025 by the authors. Licensee MDPI, Basel, Switzerland. This article is an open access article distributed under the terms and conditions of the Creative Commons Attribution (CC BY) license (https://creativecommons.org/licenses/by/4.0/).
Share and Cite
Csurka, T.; Hidas, K.I.; Boros, A.; Belák, B.B.; Hajnal, I.M.; Pásztor-Huszár, K.; Friedrich, L.F.; Hitka, G.; Varga-Tóth, A. Impact of Crust Creation on Techno-Functional and Organoleptic Properties of Meat with Different Fat Contents. Appl. Sci. 2025, 15, 3647. https://doi.org/10.3390/app15073647
Csurka T, Hidas KI, Boros A, Belák BB, Hajnal IM, Pásztor-Huszár K, Friedrich LF, Hitka G, Varga-Tóth A. Impact of Crust Creation on Techno-Functional and Organoleptic Properties of Meat with Different Fat Contents. Applied Sciences. 2025; 15(7):3647. https://doi.org/10.3390/app15073647
Chicago/Turabian StyleCsurka, Tamás, Karina Ilona Hidas, Anikó Boros, Bertold Botond Belák, István Márk Hajnal, Klára Pásztor-Huszár, László Ferenc Friedrich, Géza Hitka, and Adrienn Varga-Tóth. 2025. "Impact of Crust Creation on Techno-Functional and Organoleptic Properties of Meat with Different Fat Contents" Applied Sciences 15, no. 7: 3647. https://doi.org/10.3390/app15073647
APA StyleCsurka, T., Hidas, K. I., Boros, A., Belák, B. B., Hajnal, I. M., Pásztor-Huszár, K., Friedrich, L. F., Hitka, G., & Varga-Tóth, A. (2025). Impact of Crust Creation on Techno-Functional and Organoleptic Properties of Meat with Different Fat Contents. Applied Sciences, 15(7), 3647. https://doi.org/10.3390/app15073647