Article

Fundamental Properties of Steam-Cured Cementitious Composites Incorporating Fine Volcanic Glass Powder

1
Advanced Civil Engineering, National Institute of Technology, Kagoshima College, 1460-1 Shinko, Hayato-cho, Kirishima 899-5193, Japan
2
Department of Urban Environmental Design and Engineering, National Institute of Technology, Kagoshima College, 1460-1 Shinko, Hayato-cho, Kirishima 899-5193, Japan
3
Technical Department, Nippon Hume Corporation, 5-33-11 Shimbashi, Minato-ku 105-0004, Japan
*
Author to whom correspondence should be addressed.
Appl. Sci. 2025, 15(7), 3644; https://doi.org/10.3390/app15073644
Submission received: 4 February 2025 / Revised: 27 February 2025 / Accepted: 25 March 2025 / Published: 26 March 2025

Abstract

:

Featured Application

Utilizing locally available Shirasu volcanic deposits, which have inexhaustible reserves, instead of silica fume provides a new additive option for enhancing the strength of concrete products, significantly contributing to sustainable construction practices.

Abstract

This study explores the use of volcanic glass powder (VG) derived from Shirasu volcanic deposits as a substitute for silica fume (SF) in producing high-strength precast concrete piles with a compressive strength of 123 MPa. Initially, mortar specimens with varying VG replacement ratios and curing temperatures were prepared to assess their compressive strength. After identifying the optimal mix ratios and curing conditions for high-strength mortars, concrete specimens incorporating VG were produced. Subsequent testing revealed that a VG replacement ratio of 20% by cement volume and a curing temperature of 70 °C were optimal for achieving the target compressive strength. Although the Young’s modulus of VG-incorporated concrete was slightly lower than that of pure cement and SF concrete, its performance remained satisfactory. These findings suggest that VG is a viable alternative to SF in high-strength concrete applications, providing a sustainable method to enhance concrete properties using locally available volcanic deposits.

1. Introduction

High-strength precast concrete piles, with a design base strength of 80 MPa or greater, are widely used as foundations in civil engineering and construction projects across Japan. Figure 1 illustrates demand trends for different types of precast concrete piles [1]. The proportion of high-strength concrete piles has been increasing annually, with particularly strong demand for piles designed for base strengths of 105 and 123 MPa. This trend corresponds with advancements in high-bearing-capacity embedded pile construction technologies. Precast concrete piles are typically cured through steam curing or autoclaving, both of which are heat-assisted methods. These processes accelerate cement hydration reactions [2,3,4,5], facilitating rapid strength development and enabling faster deployment.
High-strength concrete is typically produced by minimizing the water-to-cement ratio and increasing the cement content to achieve the desired strength levels. However, this approach often reduces workability, making concrete more difficult to handle in practical applications. To mitigate this issue, silica fume (SF) is commonly added to high-strength concrete mixes used in piles. SF consists of ultra-fine particles compared to ordinary Portland cement (OPC) and enhances workability due to its ball-bearing effect [6]. Additionally, its high silica content and large specific surface area promote a pozzolanic reaction, further improving long-term strength. As a result, SF is a key additive in the production of precast high-strength concrete piles.
Although SF is a byproduct of ferrosilicon and silicon metal production, Japan lacks manufacturing facilities for these materials. As a result, the country must import all required SF, leading to significant dependency issues related to supply, price, and quality. This reliance underscores the need for an alternative to SF. The research team has explored volcanic glass powder (VG) as a potential substitute. This high-purity volcanic glass material was recognized as a Japanese Industrial Standards (JIS) material in 2020. It is derived from natural pozzolanic volcanic deposits known as Shirasu in Japan [7,8,9], which are crushed, classified, and refined using a dry sorting air table to remove clay content that could hinder hydration [10,11]. The estimated Shirasu reserve is 750 m3 [11]. Additionally, VG has been identified as a precursor for alkali-activated materials (AAMs). Studies have shown that replacing 10–70% of fly ash with VG improves compressive strength [12]. Furthermore, in AAM formulations using ground blast furnace slag as a precursor, a 10% VG replacement enhanced both compressive strength and durability [13], while higher VG replacement rates effectively suppressed alkali–silica reaction expansion [14].
Carbon dioxide (CO2) emissions from cement production are a pressing global issue [15,16,17,18]. One effective strategy to reduce these emissions is replacing cement with supplementary cementitious materials, such as industrial waste or natural pozzolans, which have lower CO2 emissions during manufacturing [19,20,21]. VG, which does not require calcination in its production process, presents an environmentally advantageous alternative. The estimated CO2 emissions from VG production are 0.0888 kg-CO2/kg-VG [22], significantly lower than the 0.756 kg-CO2/kg-OPC emitted during ordinary Portland cement production [23]. Therefore, substituting OPC with VG can reduce the overall CO2 footprint of concrete production. VG has a specific surface area of 8 m2/g for Type I, 4 m2/g for Type II, and 1 m2/g for Type III. Although its SiO2 content does not reach the 85% found in SF, it remains above 70% and has a high glass content. When used as a pozzolanic material in concrete, VG has been reported to enhance workability and compressive strength while reducing the apparent chloride ion diffusion coefficient [24]. Previous research on mortar mixes incorporating VG with a specific surface area of ≥15 m2/g found that replacing up to 30% of the cement content (with a water-to-binder ratio (W/B) of 30%, cured in water) produced compressive strength levels comparable to those achieved with SF [25]. Additionally, steam curing of VG-mixed mortar was conducted with a 48 h pre-curing period and a maximum temperature of 90 °C for another 48 h. The optimal VG replacement rate for achieving maximum calcium silicate hydrate (C-S-H) density was determined to be 25%. Beyond a 30% replacement rate, C-S-H density declined significantly [26]. However, these experiments used a cement content of approximately 1000 kg/m3 and different curing methods from the steam curing techniques commonly employed for precast products.
Building on these findings, this study aims to develop high-strength precast concrete piles with a target compressive strength of 123 MPa at 7 d, incorporating VG to reduce cement consumption. High-strength concrete products are a major requirement for manufacturers worldwide. The research gap lies in demonstrating that pozzolanic materials derived from pyroclastic deposits, such as VG, can effectively replace SF, as well as in establishing viable mix ratios and curing conditions for their use in production.
The experimental approach involved adjusting the steam curing process by maintaining a consistent maximum temperature-holding time of 8 h while varying the maximum curing temperature. Initially, the fresh properties and compressive strength of each mortar mix were assessed. Concrete specimens were then cast using a mix that exhibited favorable properties, and their compressive strength and elastic modulus were evaluated. For comparison, specimens incorporating SF were also produced. This paper presents the experimental outcomes of utilizing VG.

2. Experiment Study

2.1. Materials Used

Table 1 summarizes the materials used in this study. OPC, VG, and SF were used as binders with Type I VG, selected for its large specific surface area and potential to enhance compressive strength. SF, a conventional high-strength admixture, was included for comparison.
Additionally, tap water was used for mixing, and a superplasticizer was added to ensure the workability of the fresh concrete. The fine and coarse aggregates were made from hard sandstone quarried in the same area, crushed, and adjusted for particle size. Aggregates used in high-strength concrete must possess sufficient strength. The crushing value of the coarse aggregate, which indicates its strength, was measured according to British Standard Methods (BS 812-110) and found to be of high quality at 9.1%.
Figure 2 presents the appearance and scanning electron microscopy (SEM) images of VG, SF, and OPC. While OPC and VG particles are angular, SF particles are spherical.
Table 2 presents the chemical compositions of the binders, determined using X-ray fluorescence (ZSX Primus II, Rigaku Corporation, Akishima, Japan). Notably, VG has a lower silicon content, but a higher aluminum content compared to SF.
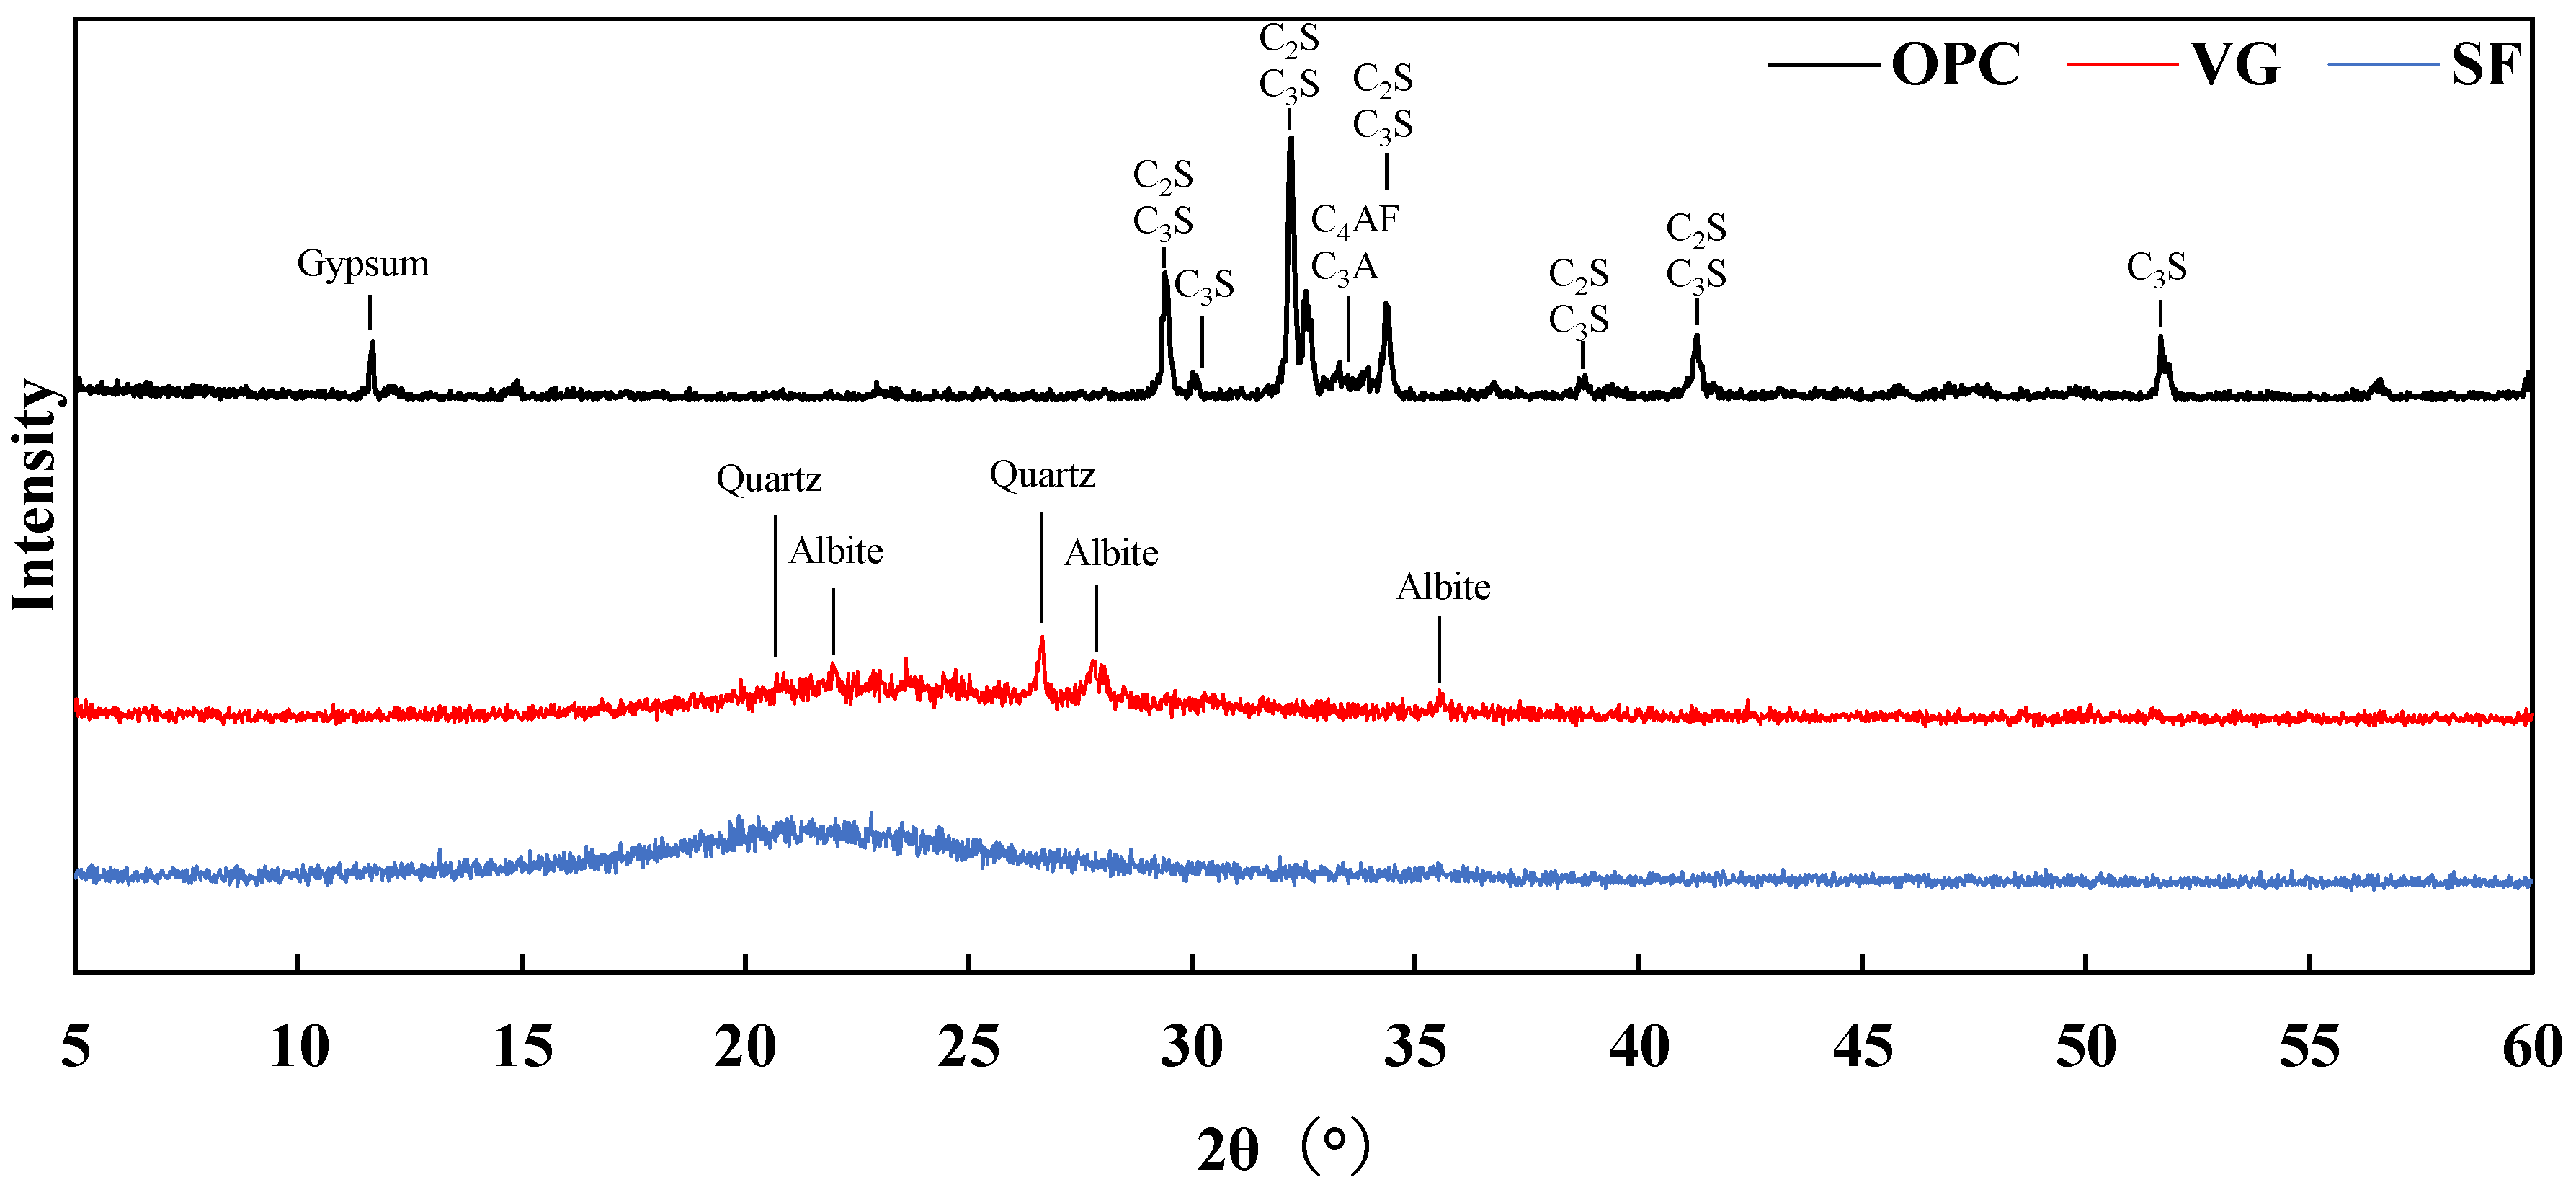
Figure 3 presents the X-ray diffractometry (XRD) patterns of the binders. The OPC exhibited peaks corresponding to tricalcium silicate (3CaO·SiO2, C3S), dicalcium silicate (2CaO·SiO2, C2S), calcium aluminate (3CaO·Al2O3, C3A), and tetracalcium aluminoferrite (4CaO·Al2O3·Fe2O3, C4AF), which are key components of clinker. In contrast, both VG and SF were predominantly amorphous; however, VG contained crystalline phases such as quartz and albite.
Figure 4 illustrates the particle size distributions of the binders. Particle sizes were measured using a laser diffraction/scattering particle size distribution analyzer (LMS-2000e, Seishin Enterprise Co., Ltd., Shibuya-ku, Japan). Ethanol (special grade) was used as the dispersion medium for OPC, ion-exchanged water for VG, and a 0.2% sodium hexametaphosphate solution for SF, with the latter also undergoing ultrasonic vibration treatment to enhance dispersion. The average particle size of VG was found to be 3.41 µm, compared to 1.53 µm for SF. Despite VG having a larger particle size than SF, it remains significantly finer than OPC, which has an average particle size of 26.13 µm. This suggests that VG may contribute a ball-bearing effect when incorporated as an admixture.

2.2. Preparation of Mortar and Concrete Specimens

Table 3 outlines the mix proportions used for specimen preparation. The control mix contained only OPC as a binder. To enable direct strength comparisons, portions of the OPC were replaced with VG or SF based on volume rather than mass. This volumetric substitution method was chosen because VG and SF have lower densities than OPC, meaning mass-based replacement would lead to an unintended increase in powder volume. Other researchers have also employed volumetric substitution to characterize admixtures. Papadakis et al. investigated the effects of silica fume replacement on compressive strength, pore size, and bound water [27]. Kim et al. analyzed the hydration properties of cement with a 50% fly ash replacement and the addition of nano-silica solution [28]. Ueno et al. examined the impact of volumetric substitution of fly ash, limestone powder, and blast furnace slag on concrete workability and bleeding, concluding that this approach is a valid method for evaluating material properties [29]. While volumetric substitution alters the weight ratio (W/B) slightly, it maintains a constant volume ratio. Although changes in W/B at a small unit water content may influence compressive strength, studies have shown that adjusting W/B from 15% to 16% had no significant impact on compressive strength or total pore volume [30]. The cement content in the OPC mix was set at 800 kg/m3, approximately 20% lower than in previous studies on high-strength cementitious materials [25,26,31].

2.2.1. Preparation of Mortar Specimens

Since the strength of concrete is primarily determined by the strength of the cement paste, mortar specimens were prepared using the mixes detailed in Table 3, excluding coarse aggregates. This approach was necessary because VG is currently produced in laboratory-scale facilities, limiting the available quantity. Therefore, small specimens were created to determine the optimal mix proportions and curing conditions.
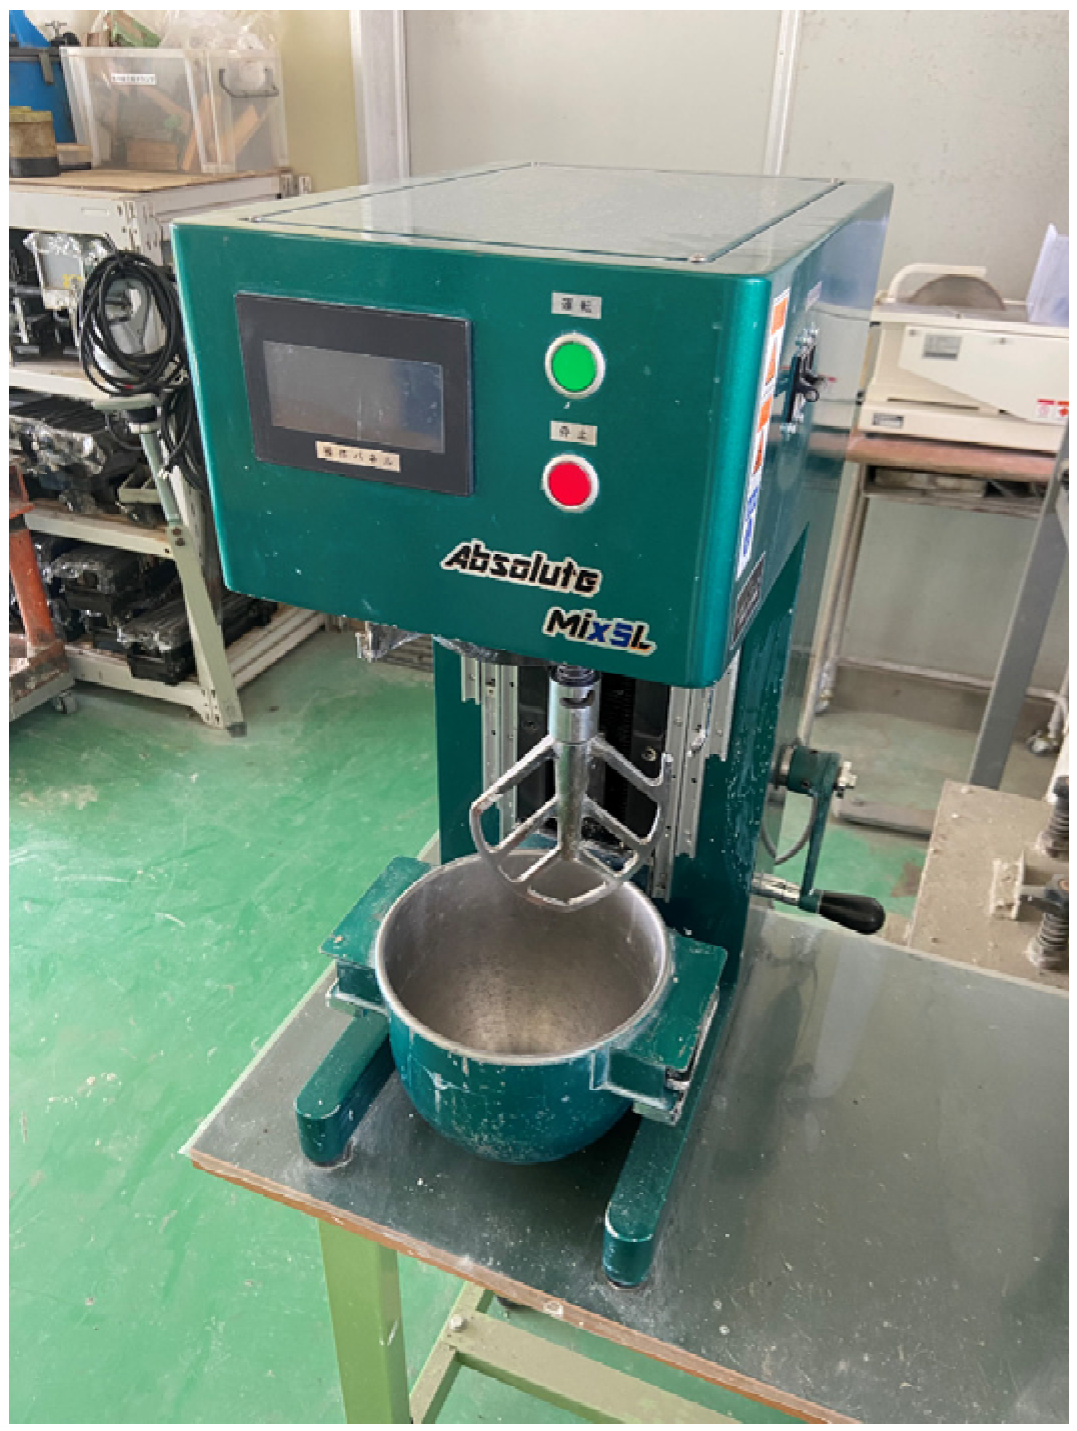
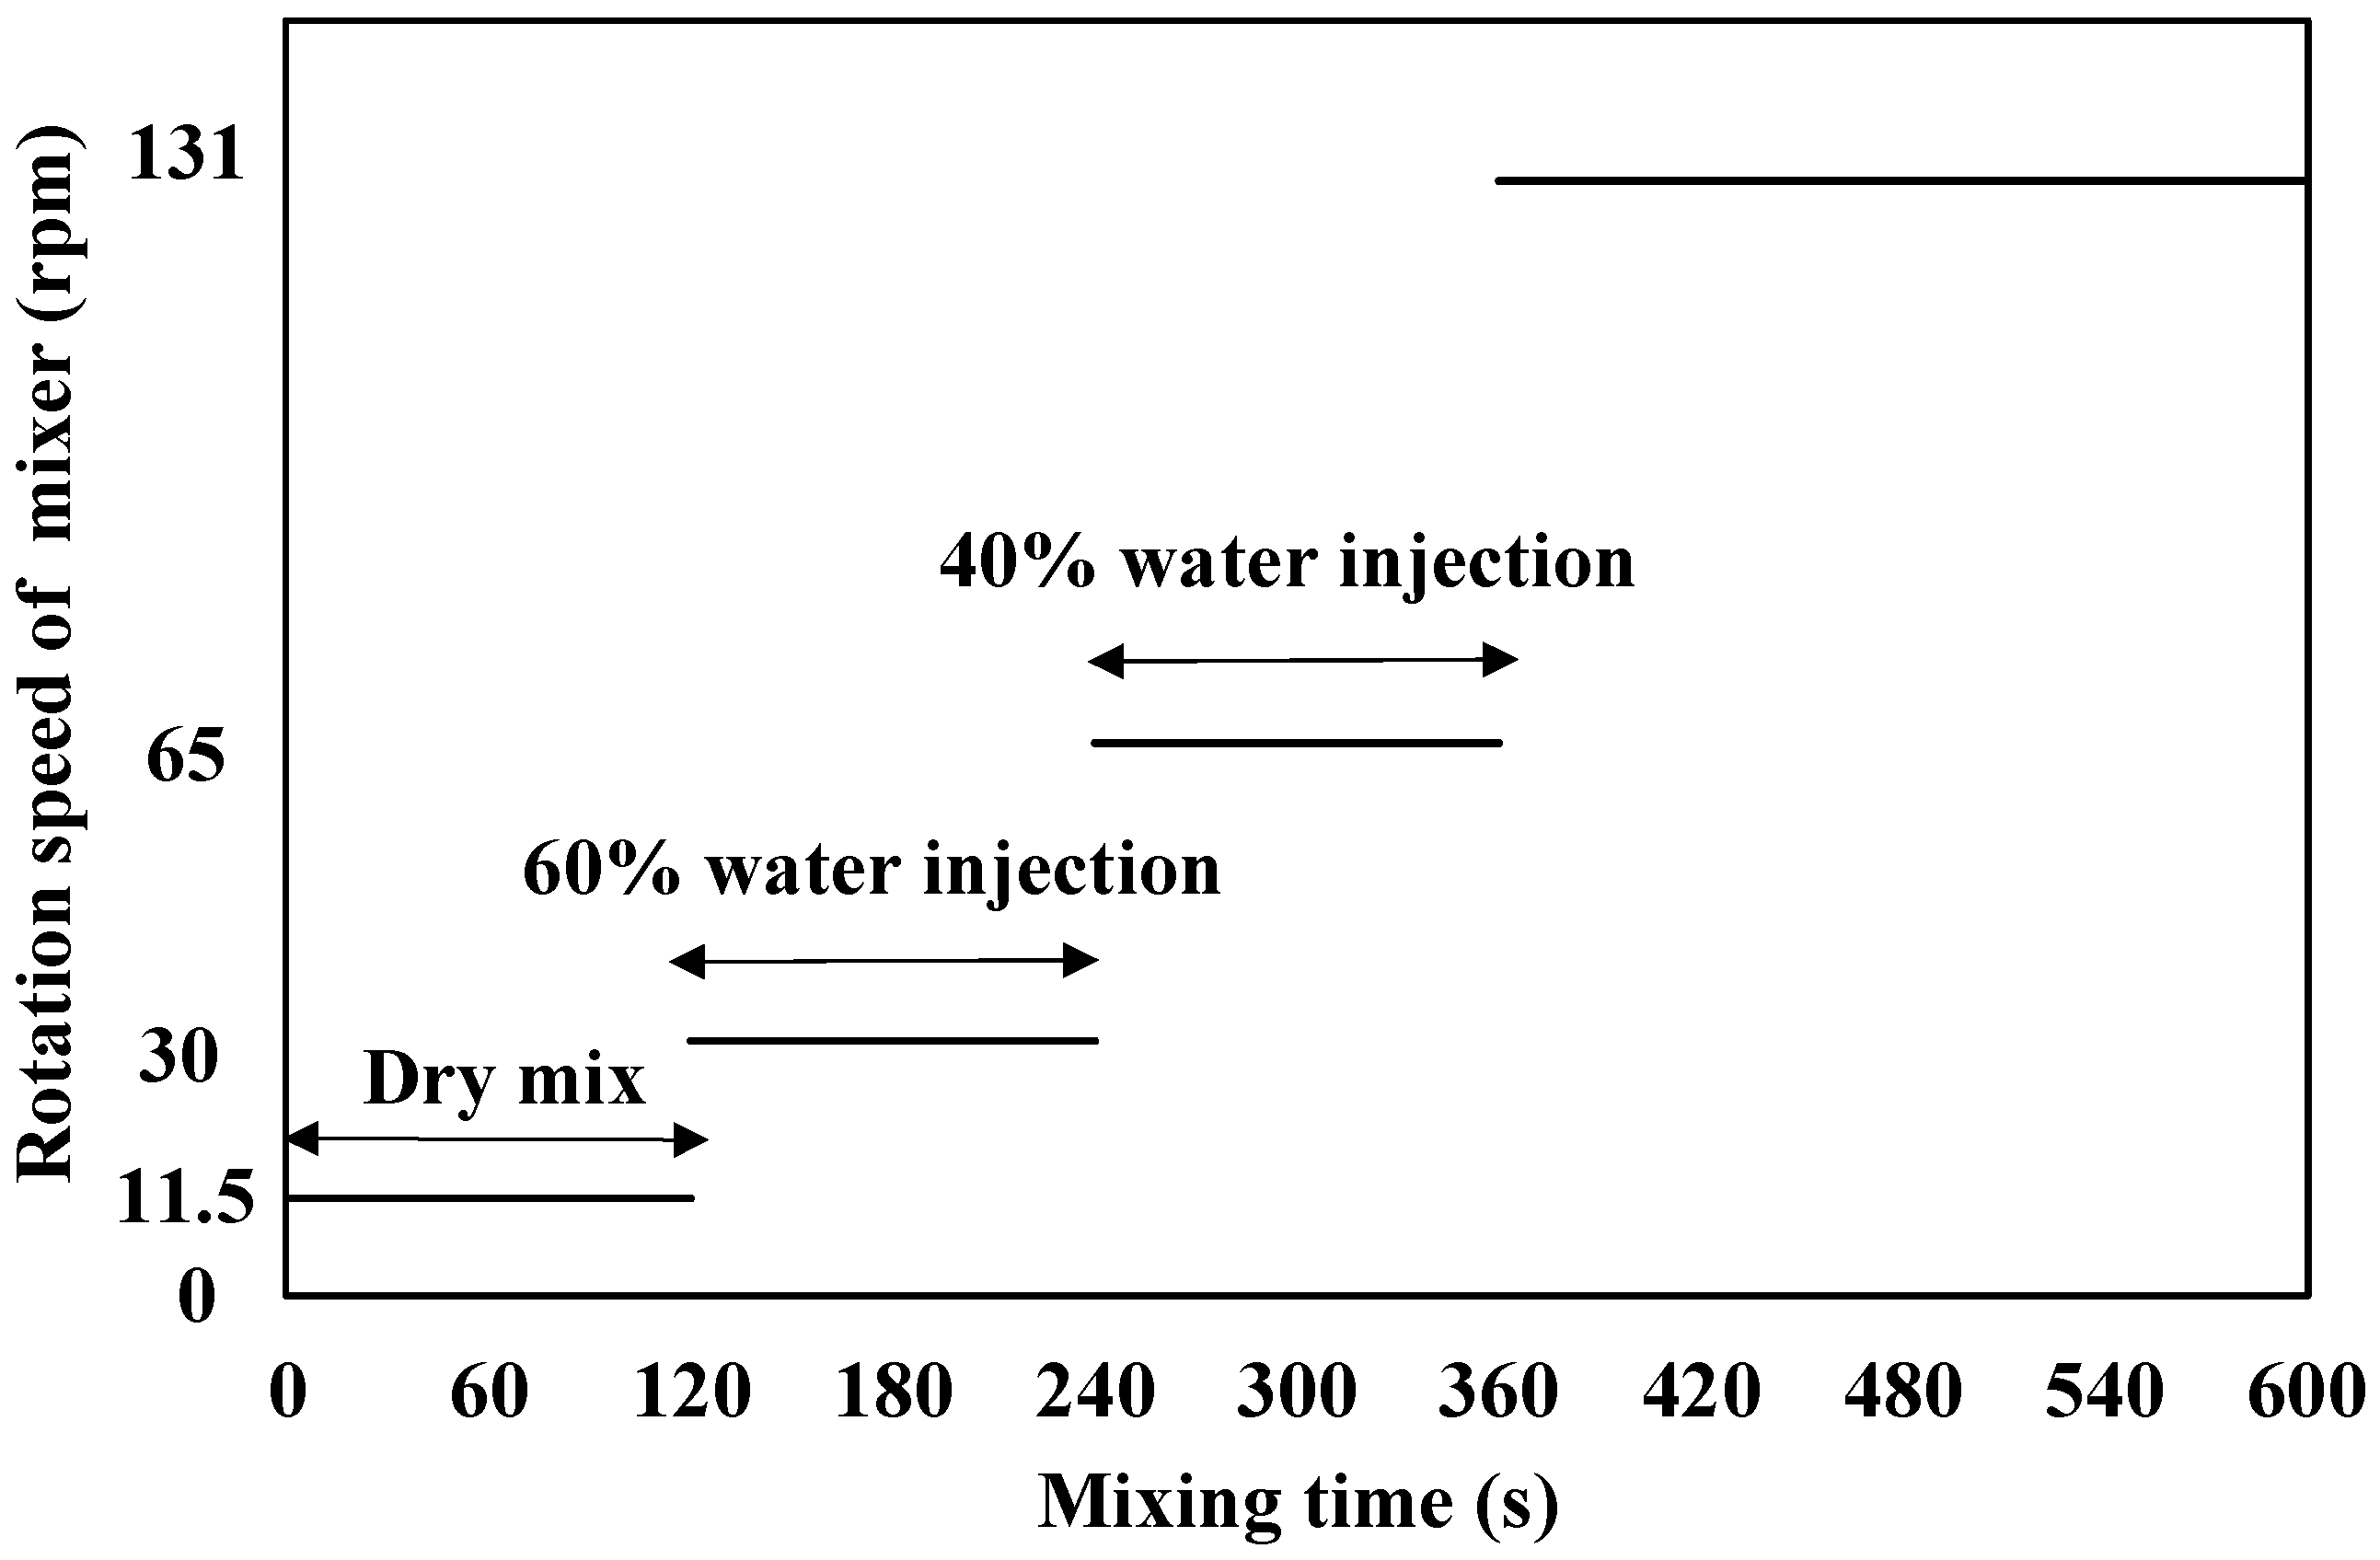
The mixing process followed the mortar preparation methods outlined in JIS R 5201, using a mortar mixer (KC-8-A, Kansai Shikenki Co., Ltd., Osaka, Japan) with a 5 L capacity, as shown in Figure 5. However, the mixing time was extended beyond the standard method to account for the reaction of the SP. As illustrated in Figure 6, the procedure began with dry mixing at 11.5 rpm for 120 s. Then, approximately 60% of the premixed water with SP was added and mixed at 30 rpm for 120 s, followed by the addition of the remaining water and mixing at 65 rpm for another 120 s. The final mixing phase occurred at 131 rpm for 240 s. Once mixed, the mortar was poured into cylindrical molds (50 mm in diameter and 100 mm in height) in three layers. Each layer was vibrated using a table vibrator for 60 s to ensure proper consolidation.

2.2.2. Preparation of Concrete Specimens

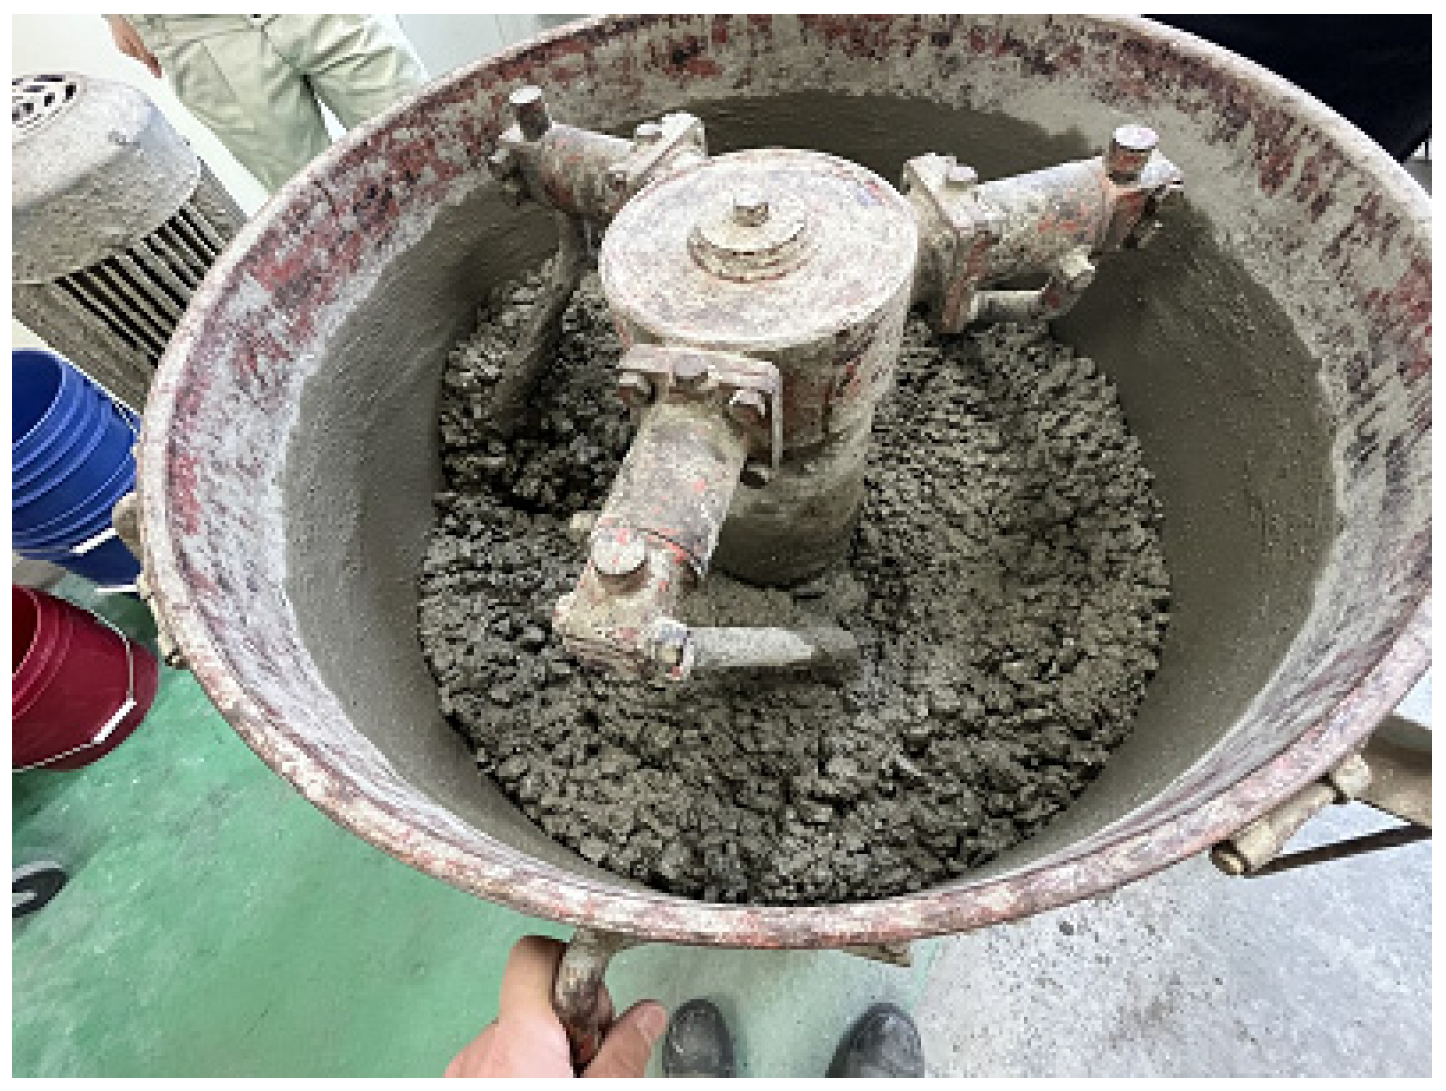
Concrete specimens were prepared using the mix described in Section 2.2.1, which demonstrated optimal mortar strength. The mixing process followed the guidelines outlined in Precast Concrete Products—General Rules of Materials and Product Methods (JIS A 5364) and was conducted using a concrete mixer (TM-55, Pacific Machinery & Engineering Co., Ltd., Narashino, Japan) with a 30 L capacity, as shown in Figure 7. The mixer operated at a fixed rotational speed of 76 rpm. Due to the fixed speed of the mixer, the mixing duration was extended to ensure thorough material integration. However, concerns may arise when replicating the mortar mixing conditions for concrete specimens, as the concrete mixer may not generate sufficient shear force during mixing. This could potentially result in a decrease in compressive strength.
Initially, dry mixing was carried out for 120 s. Approximately 60% of the premixed water with SP was then added, and mixing continued for another 120 s. After adding the remaining water, the mixture was blended for 360 s. Finally, the coarse aggregate was incorporated into the mortar and mixed for an additional 120 s. The prepared concrete was poured into cylindrical molds with a diameter of 100 mm and a height of 200 mm. It was placed in three layers, with each layer vibrated on a table vibrator for 60 s to ensure proper compaction.
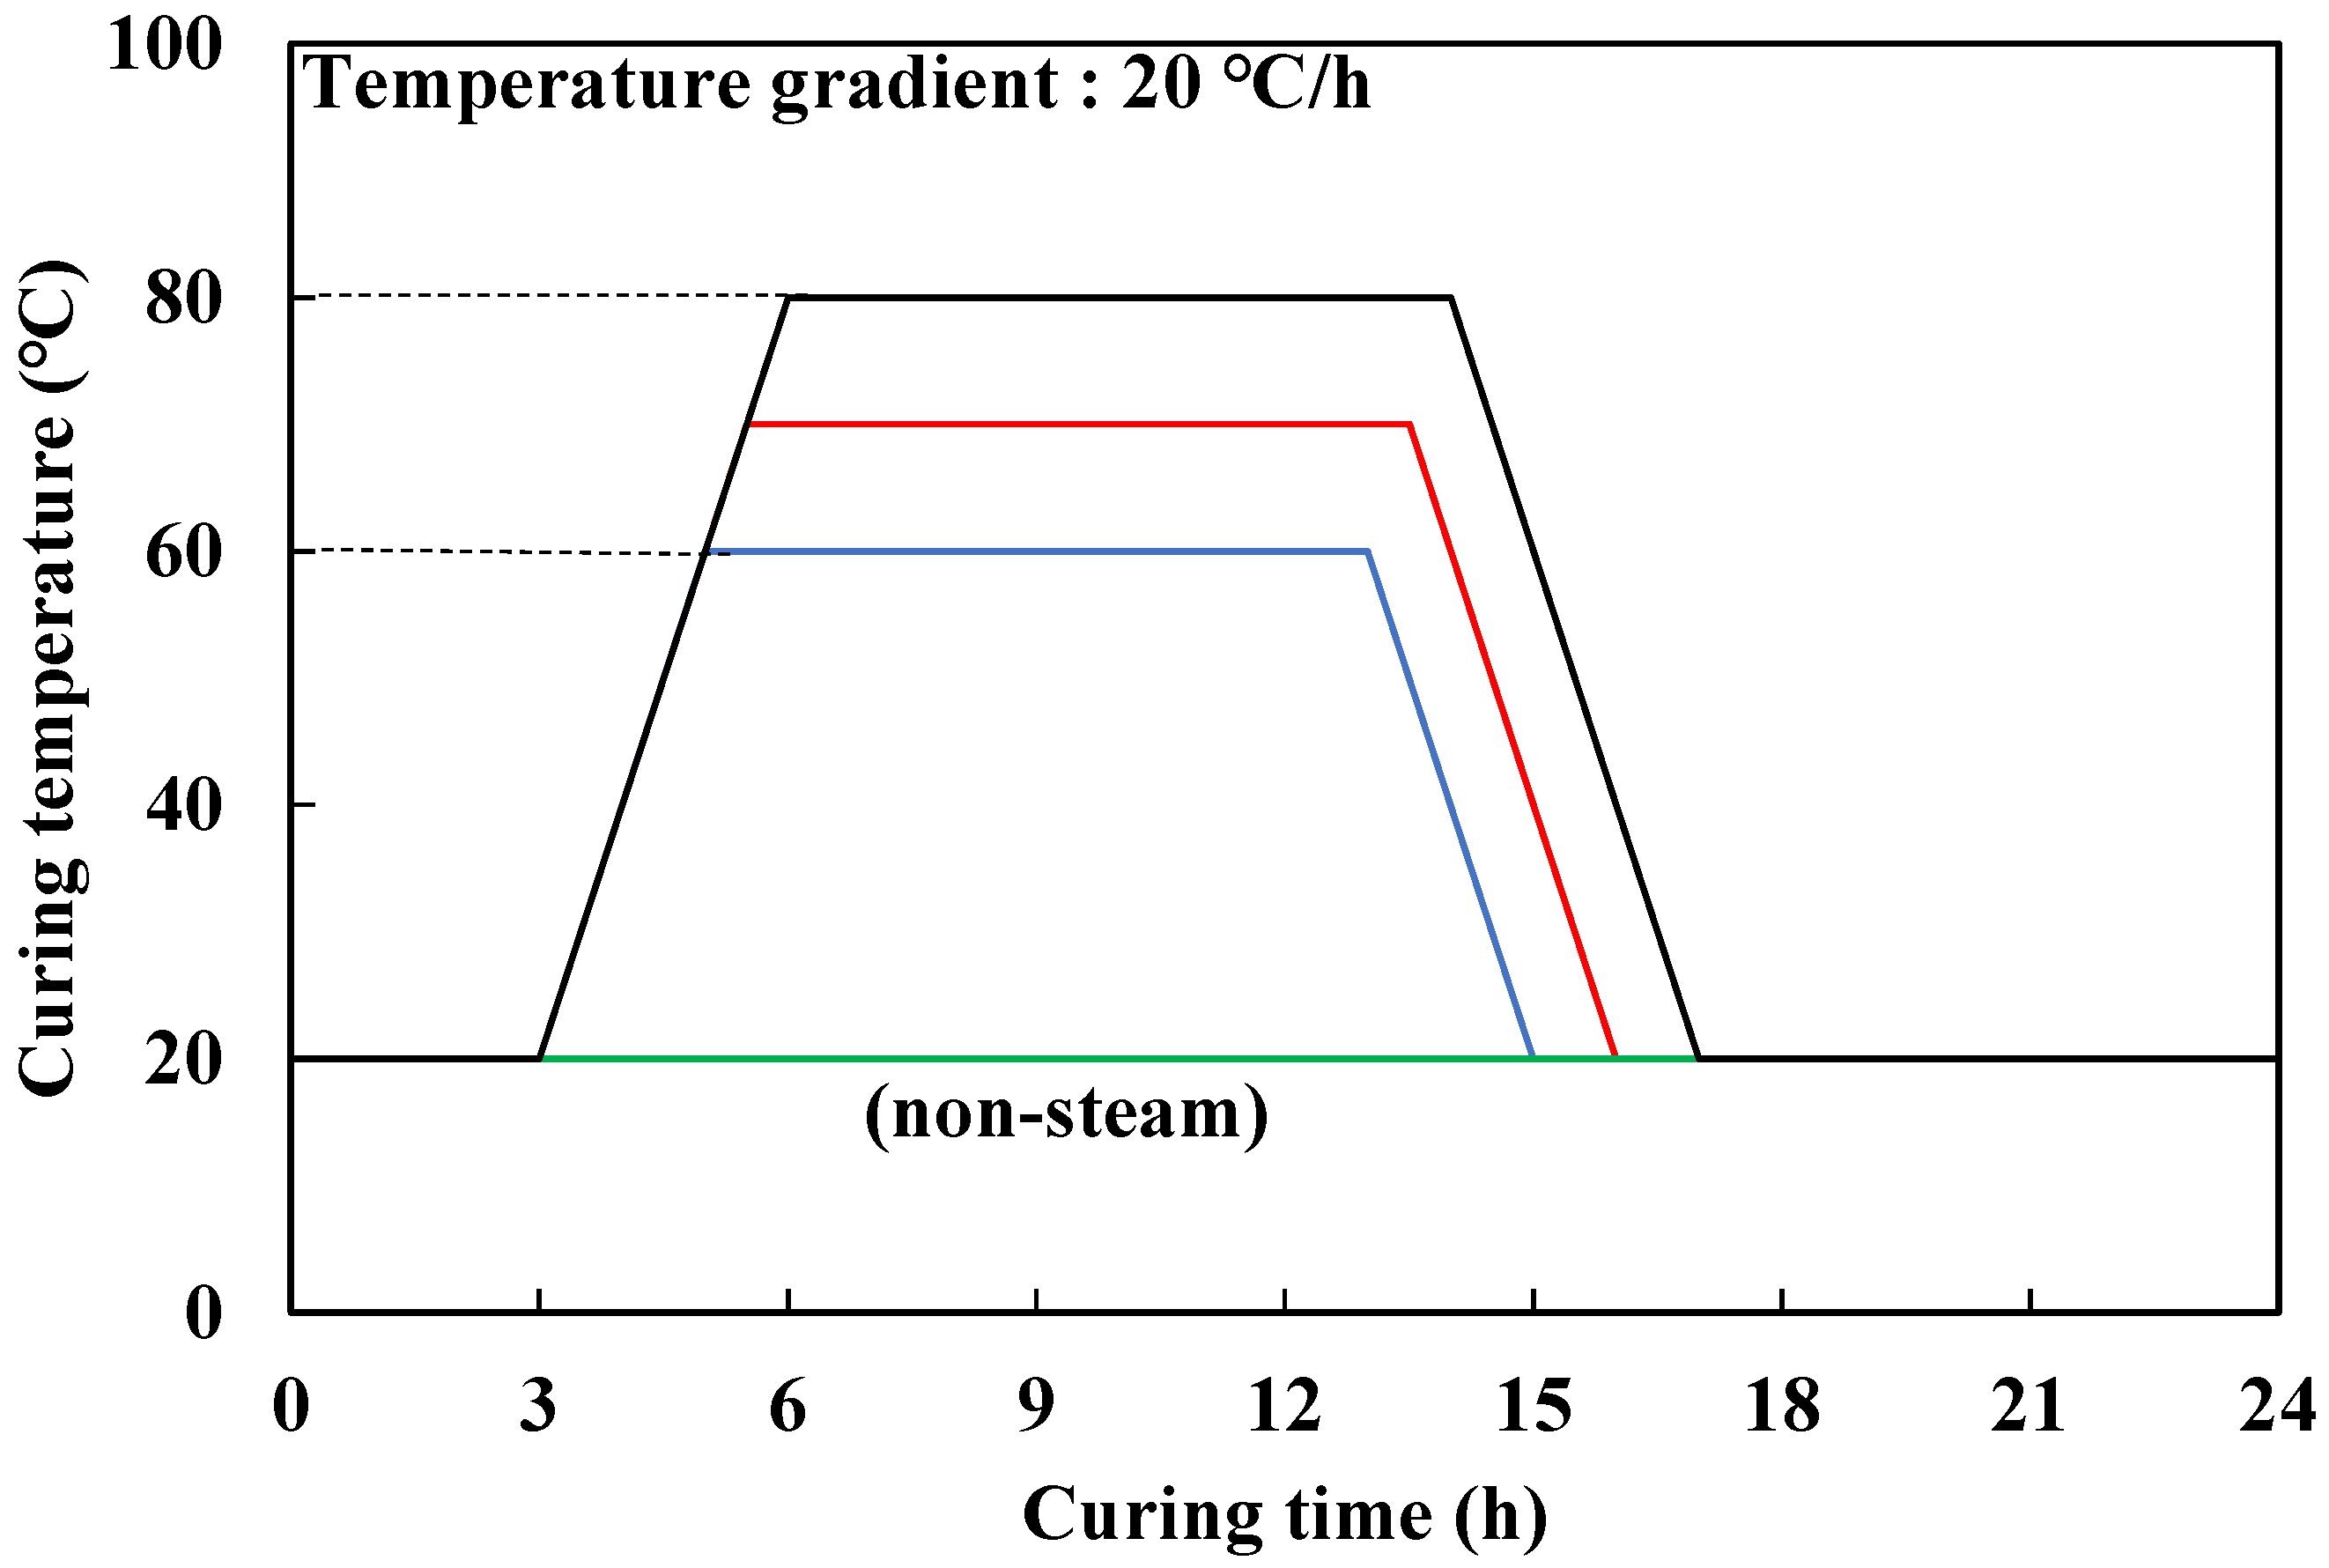
Both mortar and concrete specimens underwent steam curing in the steam chamber (HPAV-210-20, Isuzu Manufacturing Co., Ltd., Sanjo, Japan) shown in Figure 8. The steam-curing program is illustrated in Figure 9. The curing process included a pre-curing period of 3 h, followed by a maximum curing temperature range of 60–80 °C with 95% humidity and a holding time of 8 h to replicate conventional pile manufacturing conditions. After steam curing, the specimens were air-cured at 20 °C with 60% relative humidity until they reached the specified age.

2.3. Evaluation Methods

2.3.1. Mortar Flow Value

The flow value of the mortar was measured twice—immediately after mixing and again 30 min later—following the JIS R 5201 standard. This procedure evaluated changes in the mortar’s fluidity over time. The 30 min interval was chosen to simulate actual pile manufacturing conditions, accounting for the time required for processes such as pouring the mortar into the formwork and assembling the formwork with bolts.

2.3.2. Compressive Strength and Activity Index of Mortar Specimens

The compressive strengths of the mortar specimens were measured at 1 and 7 d of age in accordance with JIS A 1108, with three specimens tested per condition. The 1 d mark corresponded to the demolding period, while the 7 d mark aligned with the typical shipping age for steam-cured concretes. Additionally, an activity index was calculated based on the compressive strength data and specimen ages, following JIS A 6201. This index was then compared to that of OPC to evaluate the relative performance of the additives.

2.3.3. Compressive Strength and Young’s Modulus of Concrete Specimens

For the concrete specimens, compressive strength was evaluated at 1, 7, 28, and 56 d of age in accordance with JIS A 1106. The 28 d and 56 d measurements specifically assessed strength gains due to the pozzolanic activity of VG. Given the strong correlation between compressive strength and Young’s modulus, the modulus values of VG specimens were also measured at these ages using JIS A 1149. These results were then applied to a formula for Young’s modulus [32], derived from compressive strength and admixture type, to compare the differences in compressive strength and Young’s modulus between OPC and SF-incorporated specimens.

2.3.4. X-Ray Diffractometry of Cement Pastes

Qualification and semi-quantification of hydration products of the concrete specimens were assessed using XRD (Smart Lab, Rigaku Holdings Corporation, Akishima, Japan). For this, the hardened cement paste was crushed to a size of 150 µm or less, and 10 mass% Al2O3 was added as a standard substance to prepare the samples. The XRD parameters were as follows: Cu tube, 40 kV, 30 mA, 5–90°, 0.01°/step, 1.4°/min, and an incident slit of 1/6°.

2.3.5. Mercury Injection Test of Cement Pastes

The pore size distribution of the concrete specimens was measured using a mercury intrusion porosimeter (AutoPore IV 9520, Micromeritics Instrument Corporation, Norcross, GA, USA). The hardened cement paste, cured for 1 d, was cut into 5-mm squares, and the hydration reaction was stopped using acetone prior to the measurements.

2.3.6. Observation of Crystal Structure of Cement Pastes

The crystal structure of the cement pastes was observed using a scanning electron microscope (IT200, JEOL Ltd., Akishima, Japan), operating at 15.0 keV under a vacuum (<0.5 mPa). Paste specimens, after being steam-cured at 70 °C, were crushed and dried at 105 °C to stop the hydration reaction. They were then coated with a 10 nm layer of platinum to prevent the charging of the samples.

3. Experimental Results

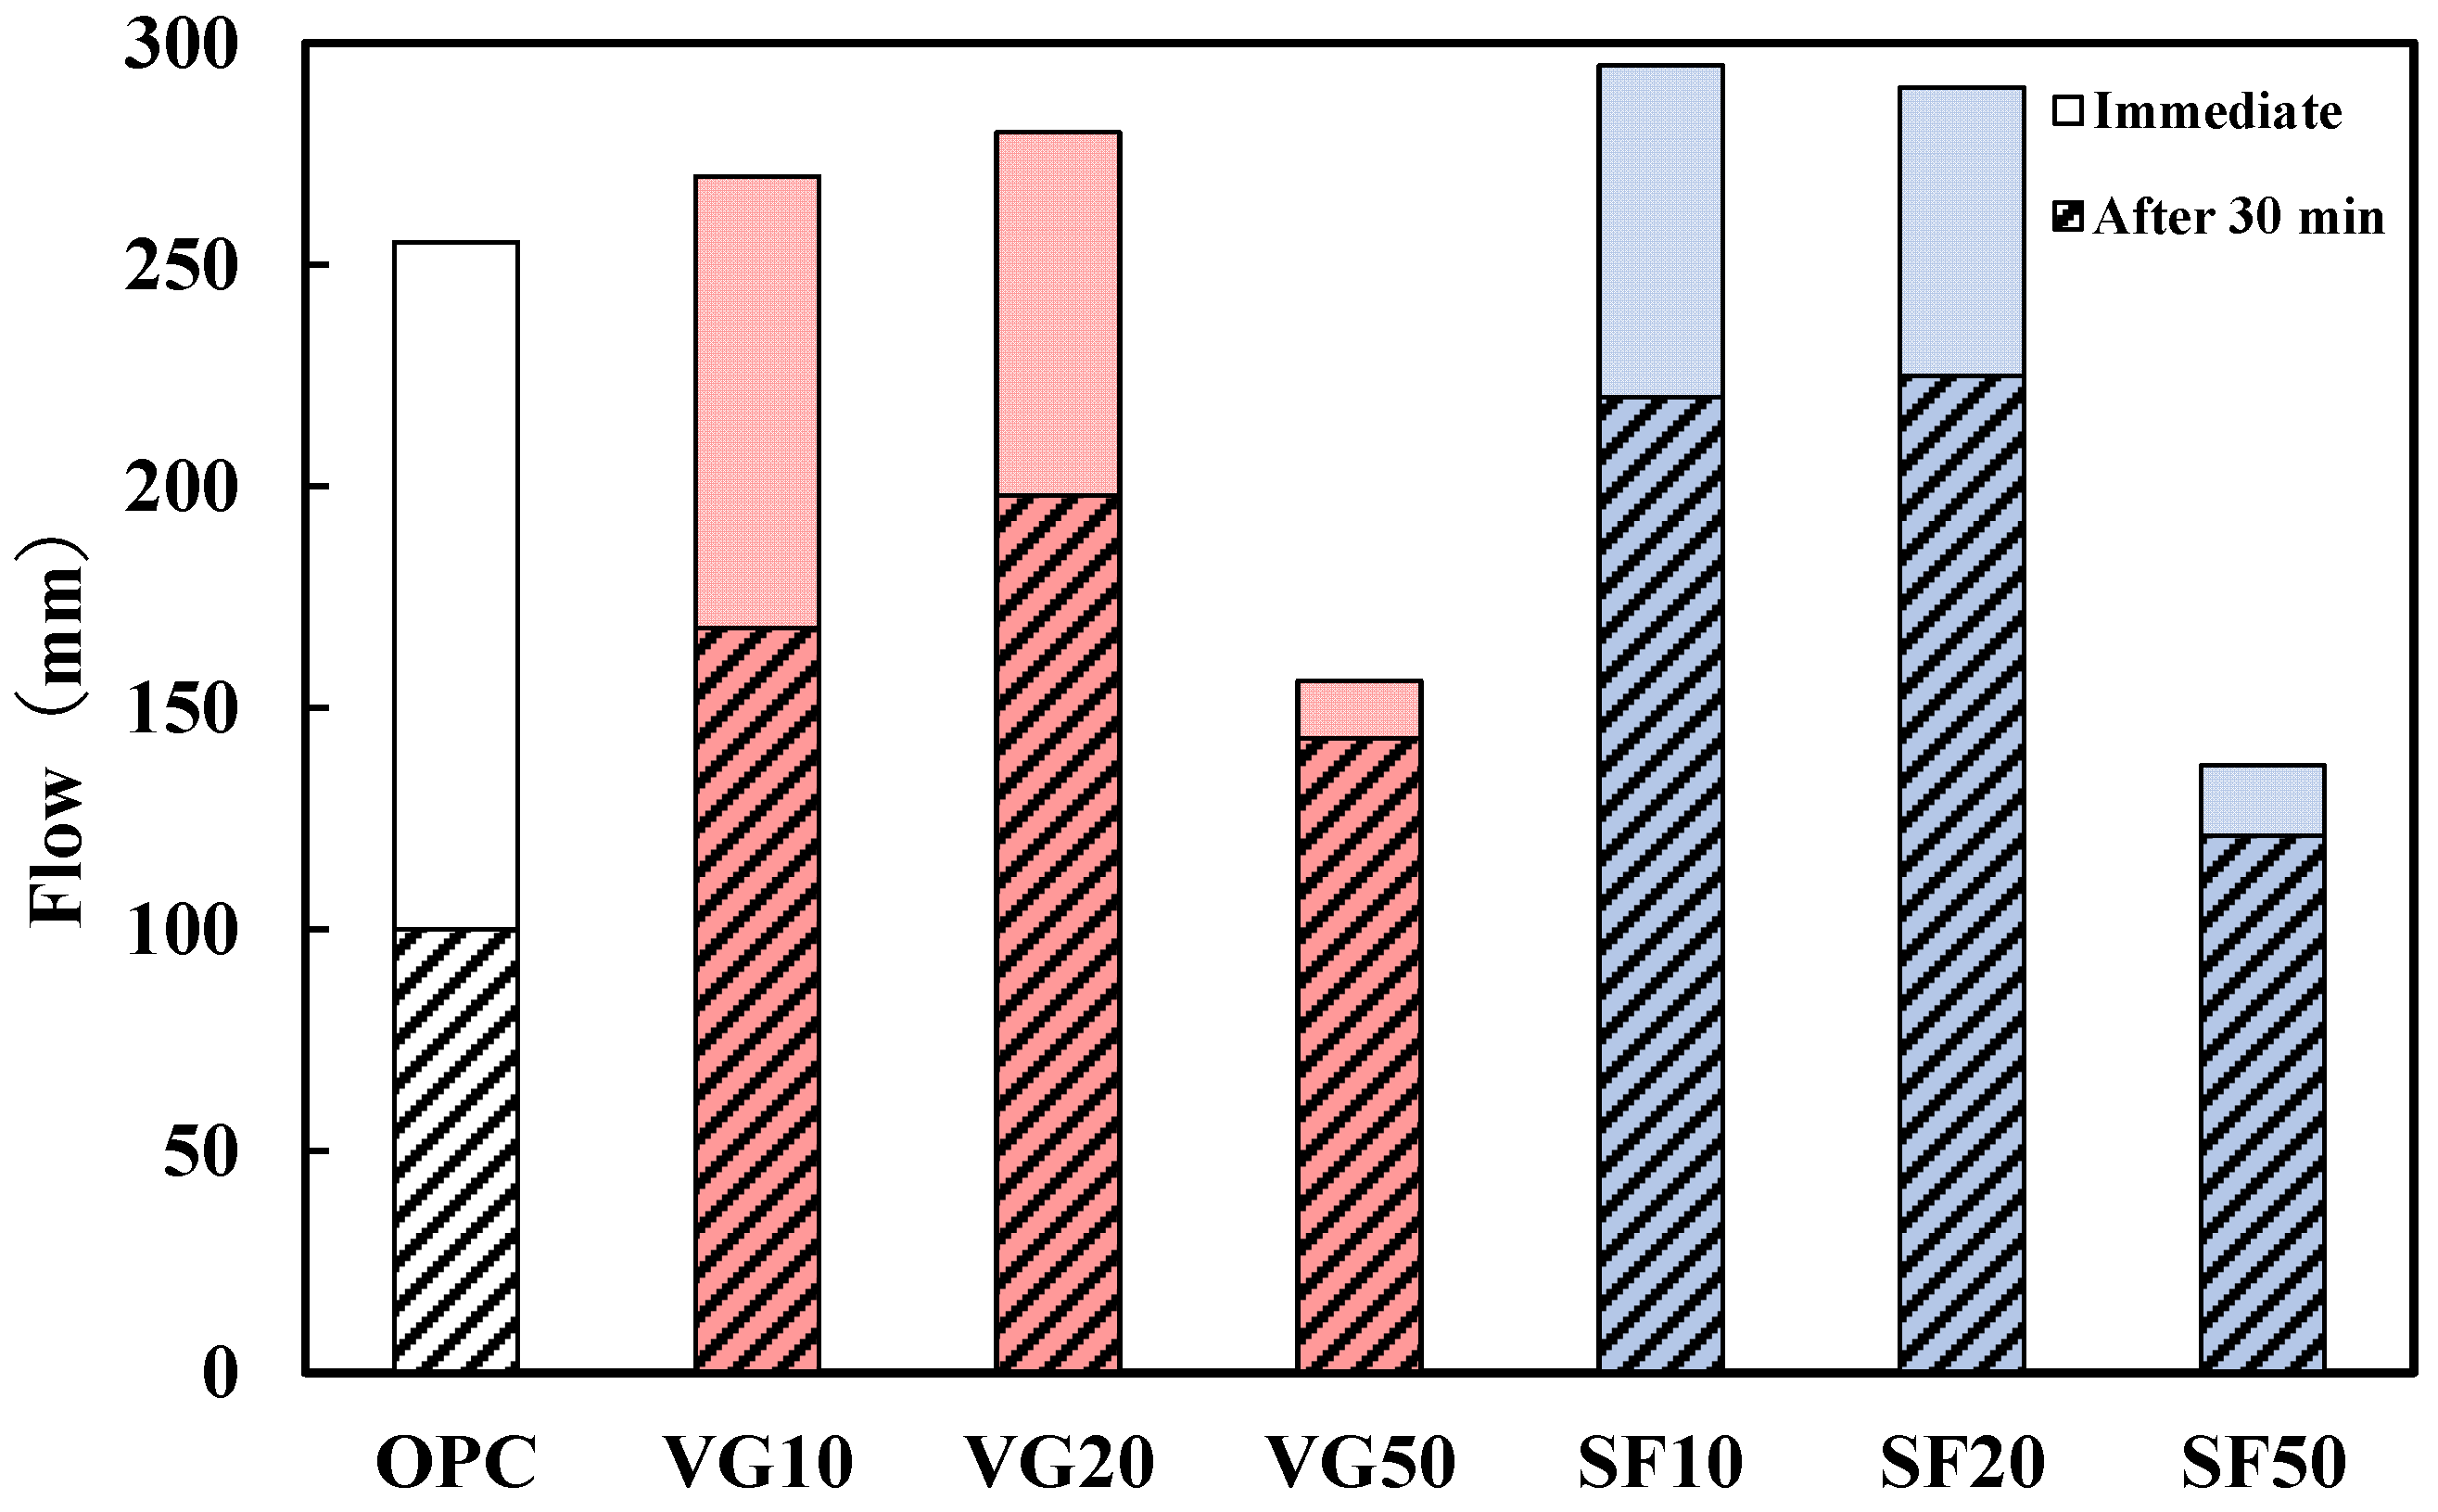
Figure 10 illustrates the changes in flow values for OPC and VG mixtures immediately after mixing and 30 min later. The initial flow values for VG10 and VG20 were slightly higher than those of OPC, likely due to the ball-bearing effect of VG. Additionally, the flow values for VG10 and VG20 exhibited a smaller decrease 30 min after mixing compared to OPC. This is attributed to the partial replacement of OPC with VG, which reduces the aluminate phase content in the mortar and consequently slows the initial hydration reaction compared to pure OPC.
In contrast, VG50 showed a significant reduction in its initial flow value. Fine particles, such as SF, with large specific surface areas, tend to agglomerate due to van der Waals forces. When a substantial amount of powder is mixed without sufficient shear force, these agglomerates reportedly absorb mixing water [33,34]. A similar phenomenon is believed to occur with VG.
Furthermore, the initial flow values of SF10 and SF20 were slightly higher than those of VG. This difference is attributed to particle shape: VG particles are angular [24], whereas SF particles are more spherical and lack edges [35,36]. The variation in particle shape influences flow values immediately after mixing. However, these differences are minimal, and VG can achieve flow performance comparable to that of SF.
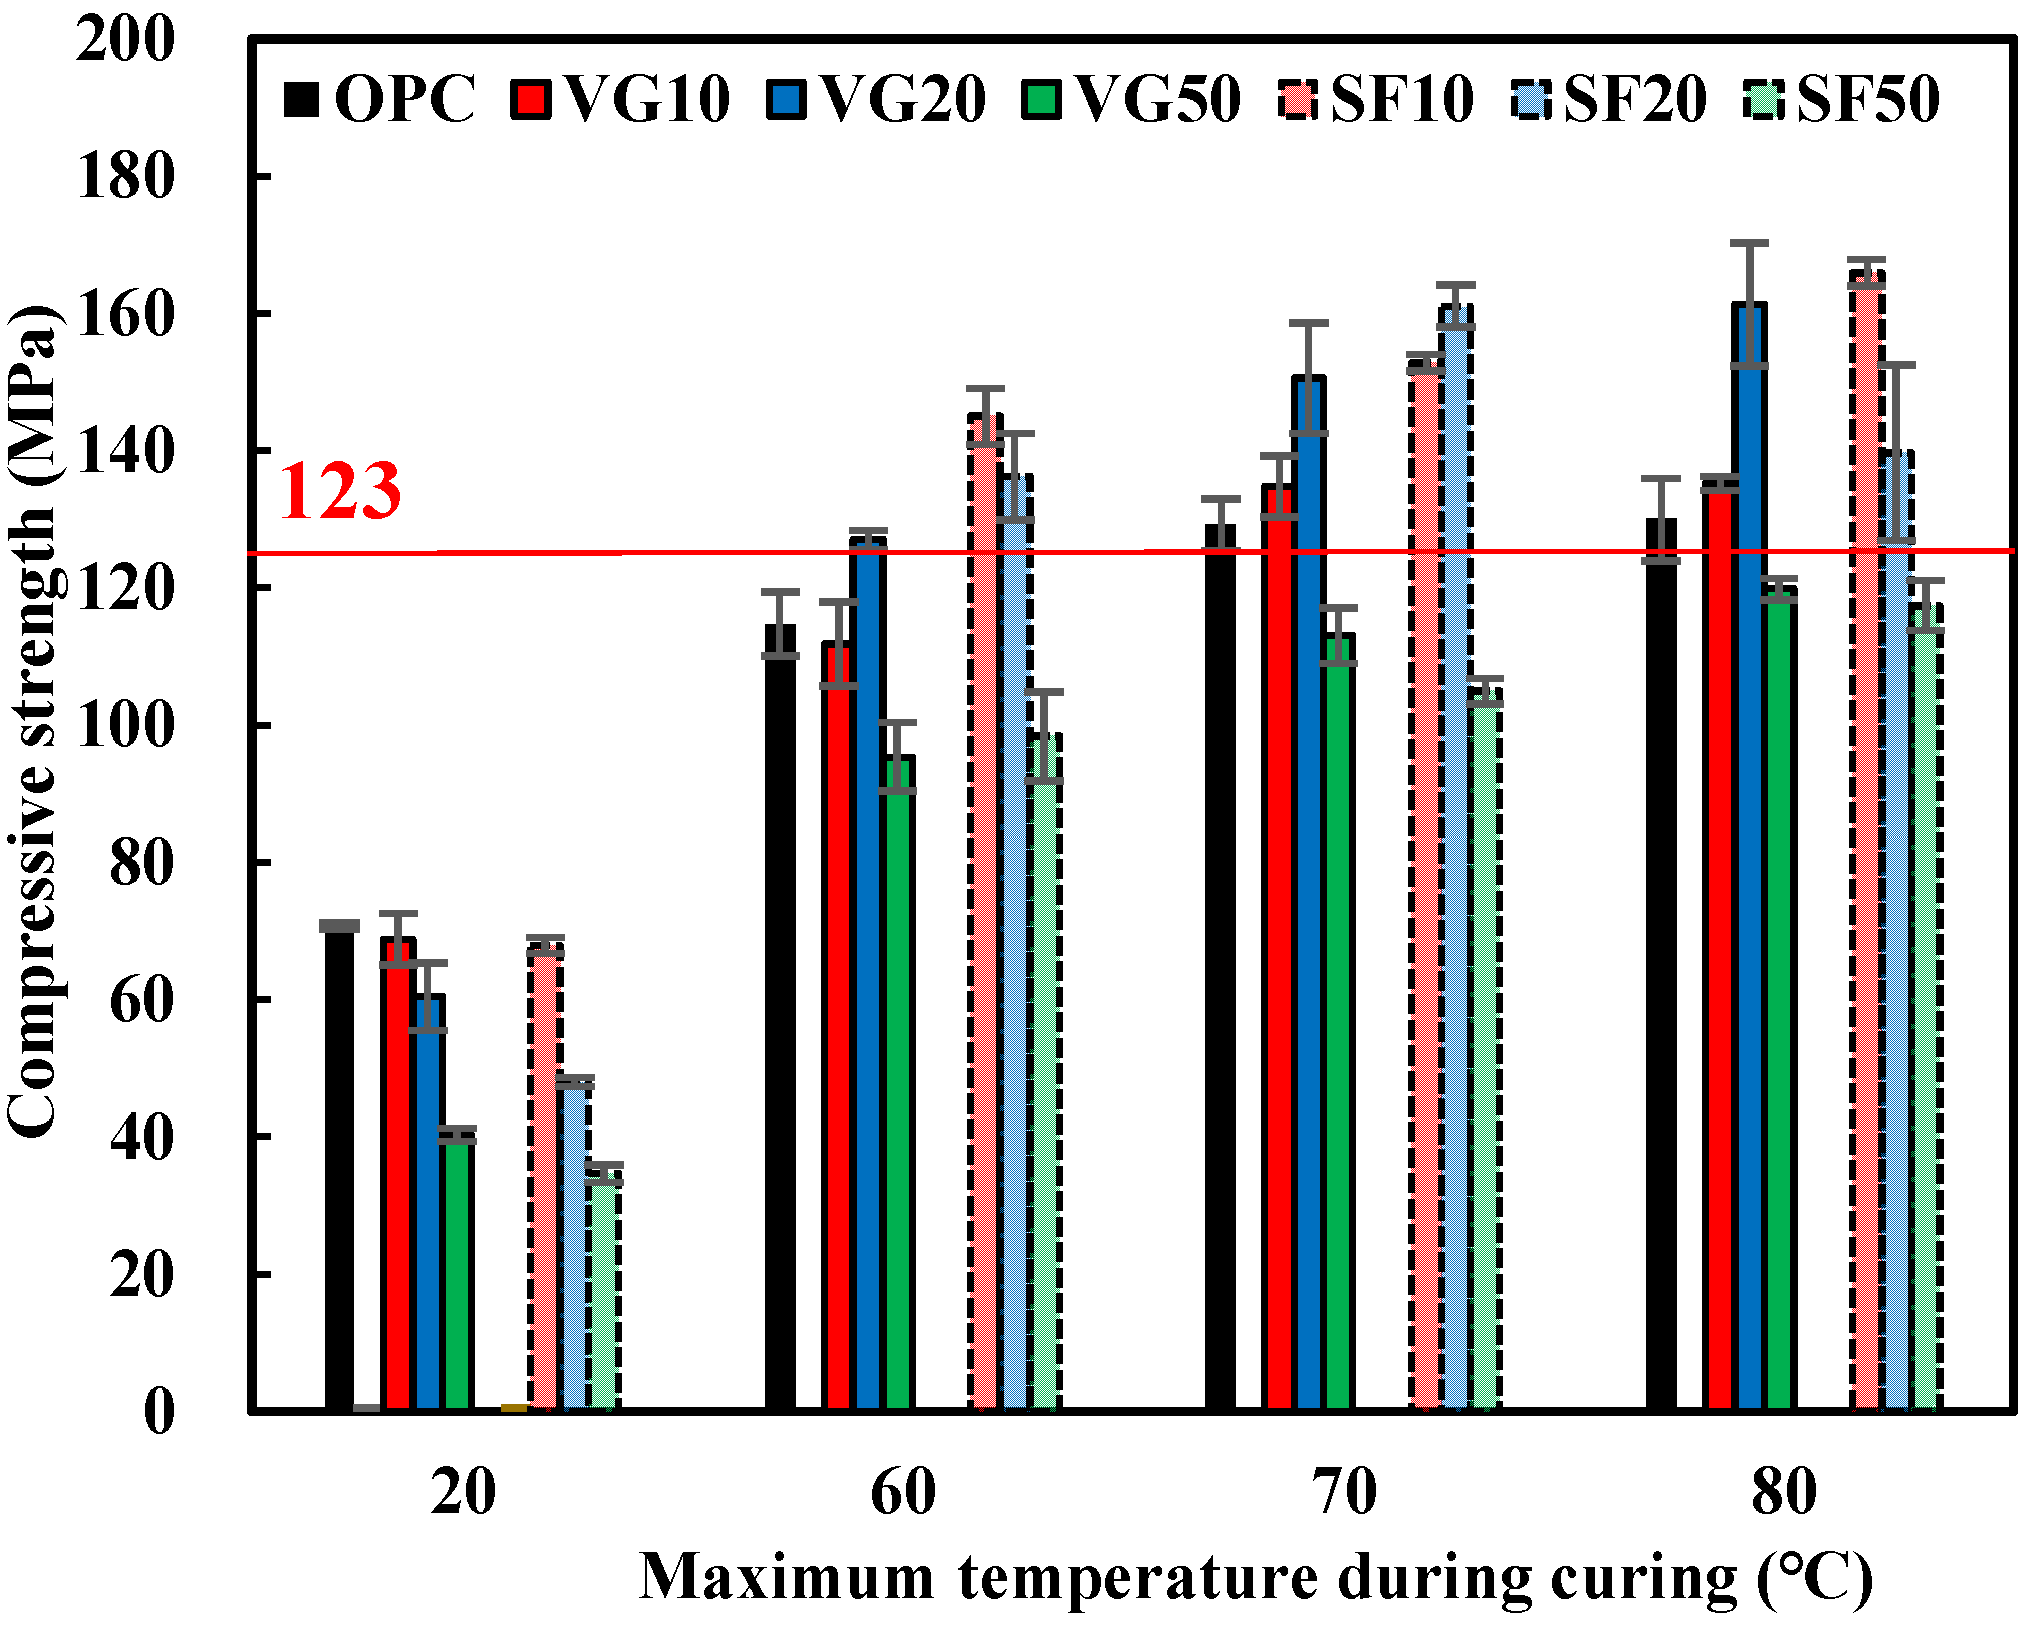
Figure 11 and Figure 12 illustrate the relationship between the admixture replacement ratio, curing temperature, and the compressive strength of mortar at 1 d (demolding age) and 7 d (shipping age). The compressive strength values represent the average of three specimens, with the standard deviation (SD) shown as error bars (average value ± SD). Steam curing significantly enhanced compressive strength at 1 d compared to curing at 20 °C without steam. For VG, the highest compressive strength was observed at a 20% replacement ratio, whereas for SF, the peak strength occurred at a 10% replacement ratio, both surpassing the strength of OPC. The differences in optimal replacement ratios between VG and SF are attributed to variations in glass content, Si component content, and specific surface area. Previous studies have reported that compressive strength variations in SF-containing specimens are closely linked to Si content [37], suggesting that Si content is a key factor for other admixtures as well. The Si contents of VG and SF were 73.7% and 95.4%, respectively, indicating a significant influence on the optimal replacement ratio.
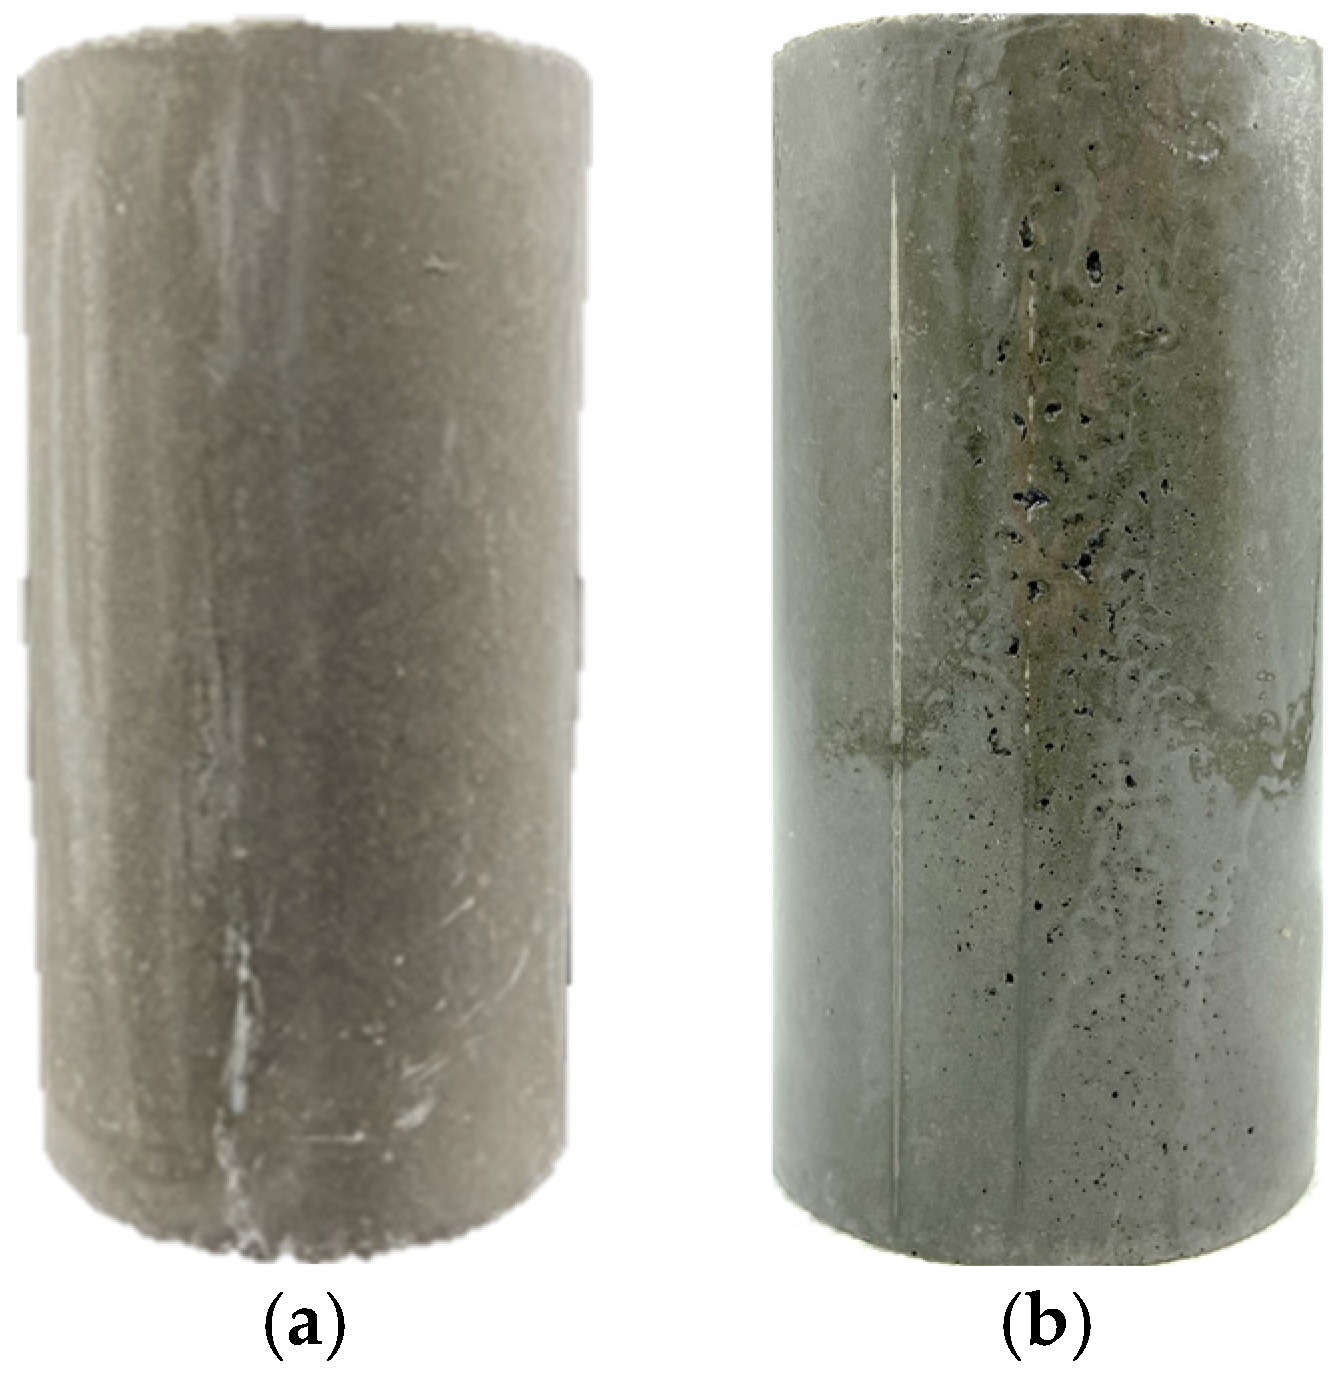
At 7 d of age, mortar with VG achieved a compressive strength of 123 MPa for VG10 and VG20 under curing conditions with a maximum temperature of 60 °C or higher. In contrast, for SF20, poor hardening was observed in some specimens. A decrease in compressive strength was noted at a maximum curing temperature of 80 °C. This reduction in strength is hypothesized to result from steam curing conditions, where air within the mortar can move easily—particularly in cases with high flow values—leading to bubble expansion and partial porosity on the mortar surface, which in turn reduces strength (Figure 13). This phenomenon did not occur in VG10, VG20, or SF10, likely due to their mortar flow values. As shown in Figure 10, the difference between the top of the bar graph and the shaded area represents flow loss, with SF20 exhibiting the smallest flow loss. In other words, SF20 had high fluidity, and its flow value remained highest until the steam-curing stage, suggesting that this phenomenon may have occurred due to excessive fluidity. A potential solution to this issue is adjusting the admixture content to lower the flow value or extending the pre-curing time [38]. Additionally, since the SP used in this study does not have an air-entraining effect, it is believed that the reduction in strength was solely due to entrapped air.
Thus, concrete specimens were prepared using the mortar mix. Among the VG20 mixes that achieved a mortar compressive strength of 123 MPa at maximum curing temperatures of 70 and 80 °C, the VG20 mix cured at 70 °C (VG20-70) was selected for further comparison. This selection aimed to reduce energy consumption during curing. Additionally, another set of VG20 concrete specimens was prepared at a maximum curing temperature of 20 °C (VG20-20). For further comparison, concrete cured at a maximum curing temperature of 70 °C was also prepared using the SF10 mix (SF10-70), as it exhibited the highest strength among the SF mixes.
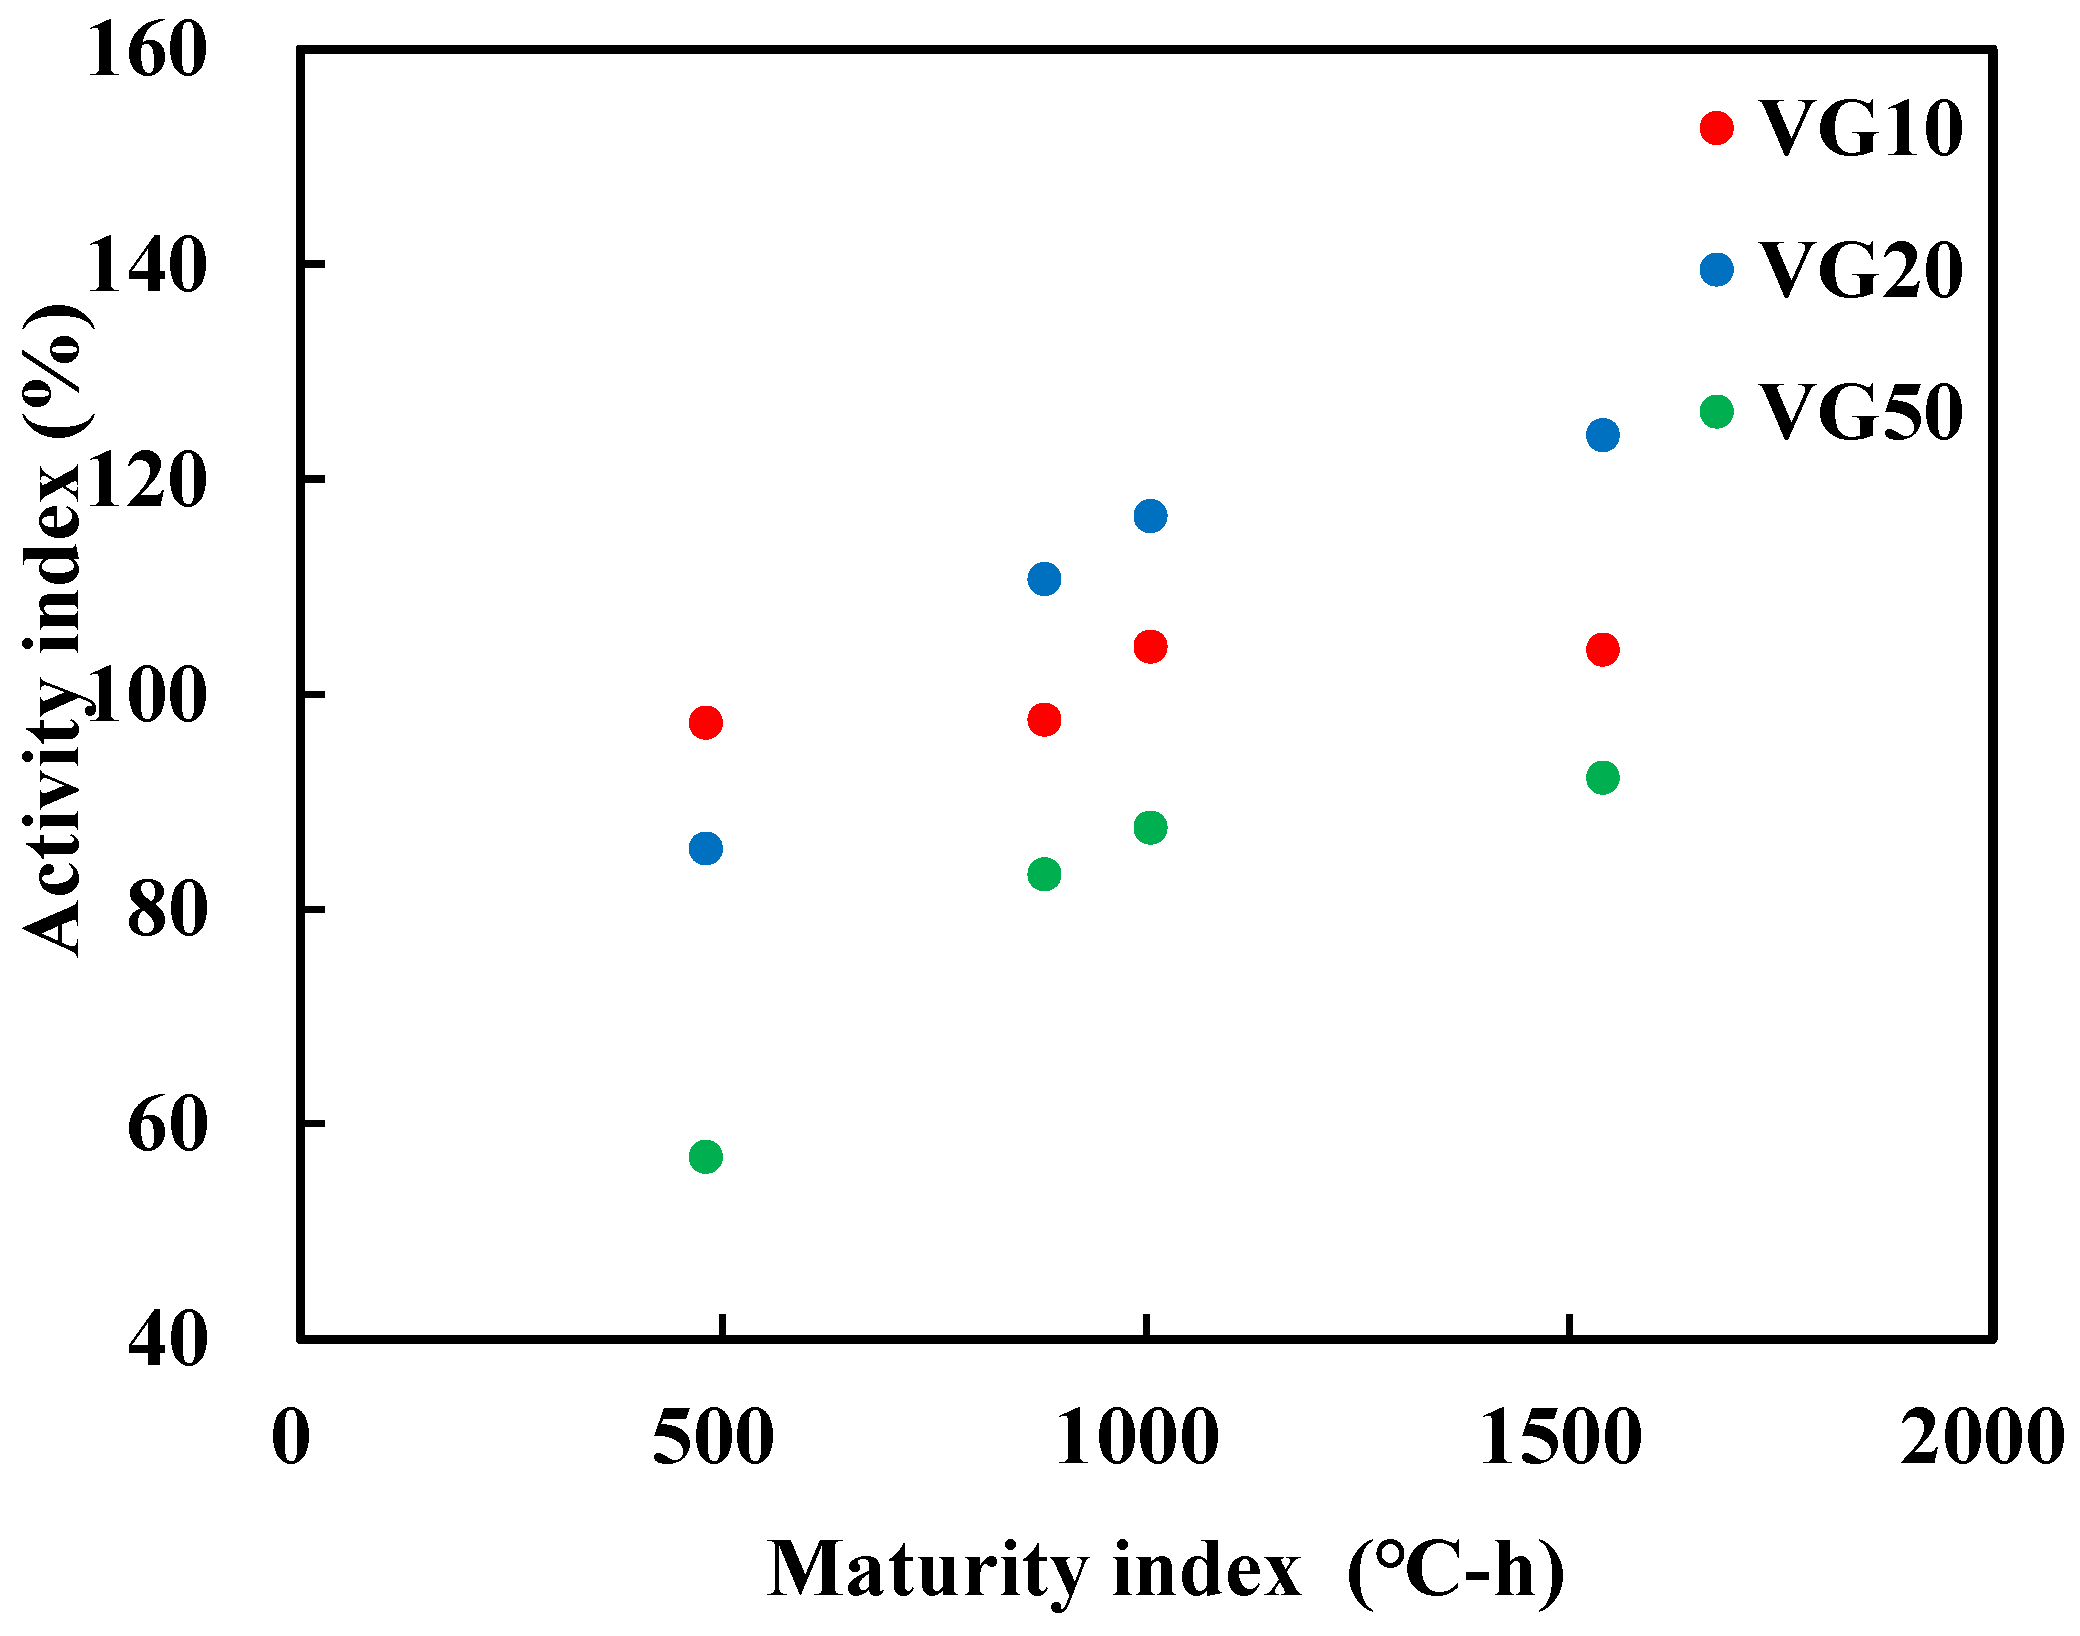
Figure 14 and Figure 15 illustrate the relationship between the activity index and the maturity index for mixtures containing VG and SF, respectively. The activity index represents the ratio of the compressive strength of the blended mortar with admixtures to that of OPC mortar, which is set as 100. This value is specified in the Test Method for Activity Index Using Mortar in JIS A 6207. An activity index greater than 100 indicates a high reactivity of the admixture. The maturity index accounts for the cumulative effect of temperature and time on concrete exposure. It was calculated based on the Standard Method for Estimating Concrete Strength Using the Maturity Method (ASTM C1074). Specifically, the reference temperature was set at 0 °C, and the maturity index was determined by calculating the area under the steam-curing program curve, as shown in Figure 9.
For concretes mixed with VG and SF (except for SF20), an increase in the maturity index correlated with a rise in the activity index. For VG, the activity index of VG10 was higher when cured at 20 °C, whereas VG20 exhibited a higher activity index than VG10 under steam curing. This phenomenon is attributed to VG’s high glass content and the cement’s high alkalinity. During mixing and heat curing, these conditions create a high-temperature environment that promotes the frequent dissolution of the glass content, resulting in the formation of robust hydration products.
Figure 16 illustrates the relationship between the rate of compressive strength increase and the maturity index from 1 to 7 d of age. The rate of increase in compressive strength is expressed as a percentage, calculated by dividing the compressive strength at 7 d by that at 1 d. It is generally understood that while steam curing enhances early compressive strength, the subsequent increase over time is lower compared to constant-temperature curing [39]. This study further highlights a distinct difference in the rate of compressive strength increase depending on whether steam curing was applied.
The results suggest that the rate of increase was higher when moisture was supplied after steam curing. However, since the specimens in this experiment underwent air curing, this effect was observed. Regardless of the maximum curing temperature, the rate of increase in compressive strength remained approximately 105% with steam curing, emphasizing the critical role of 1 d compressive strength in steam-cured concrete.
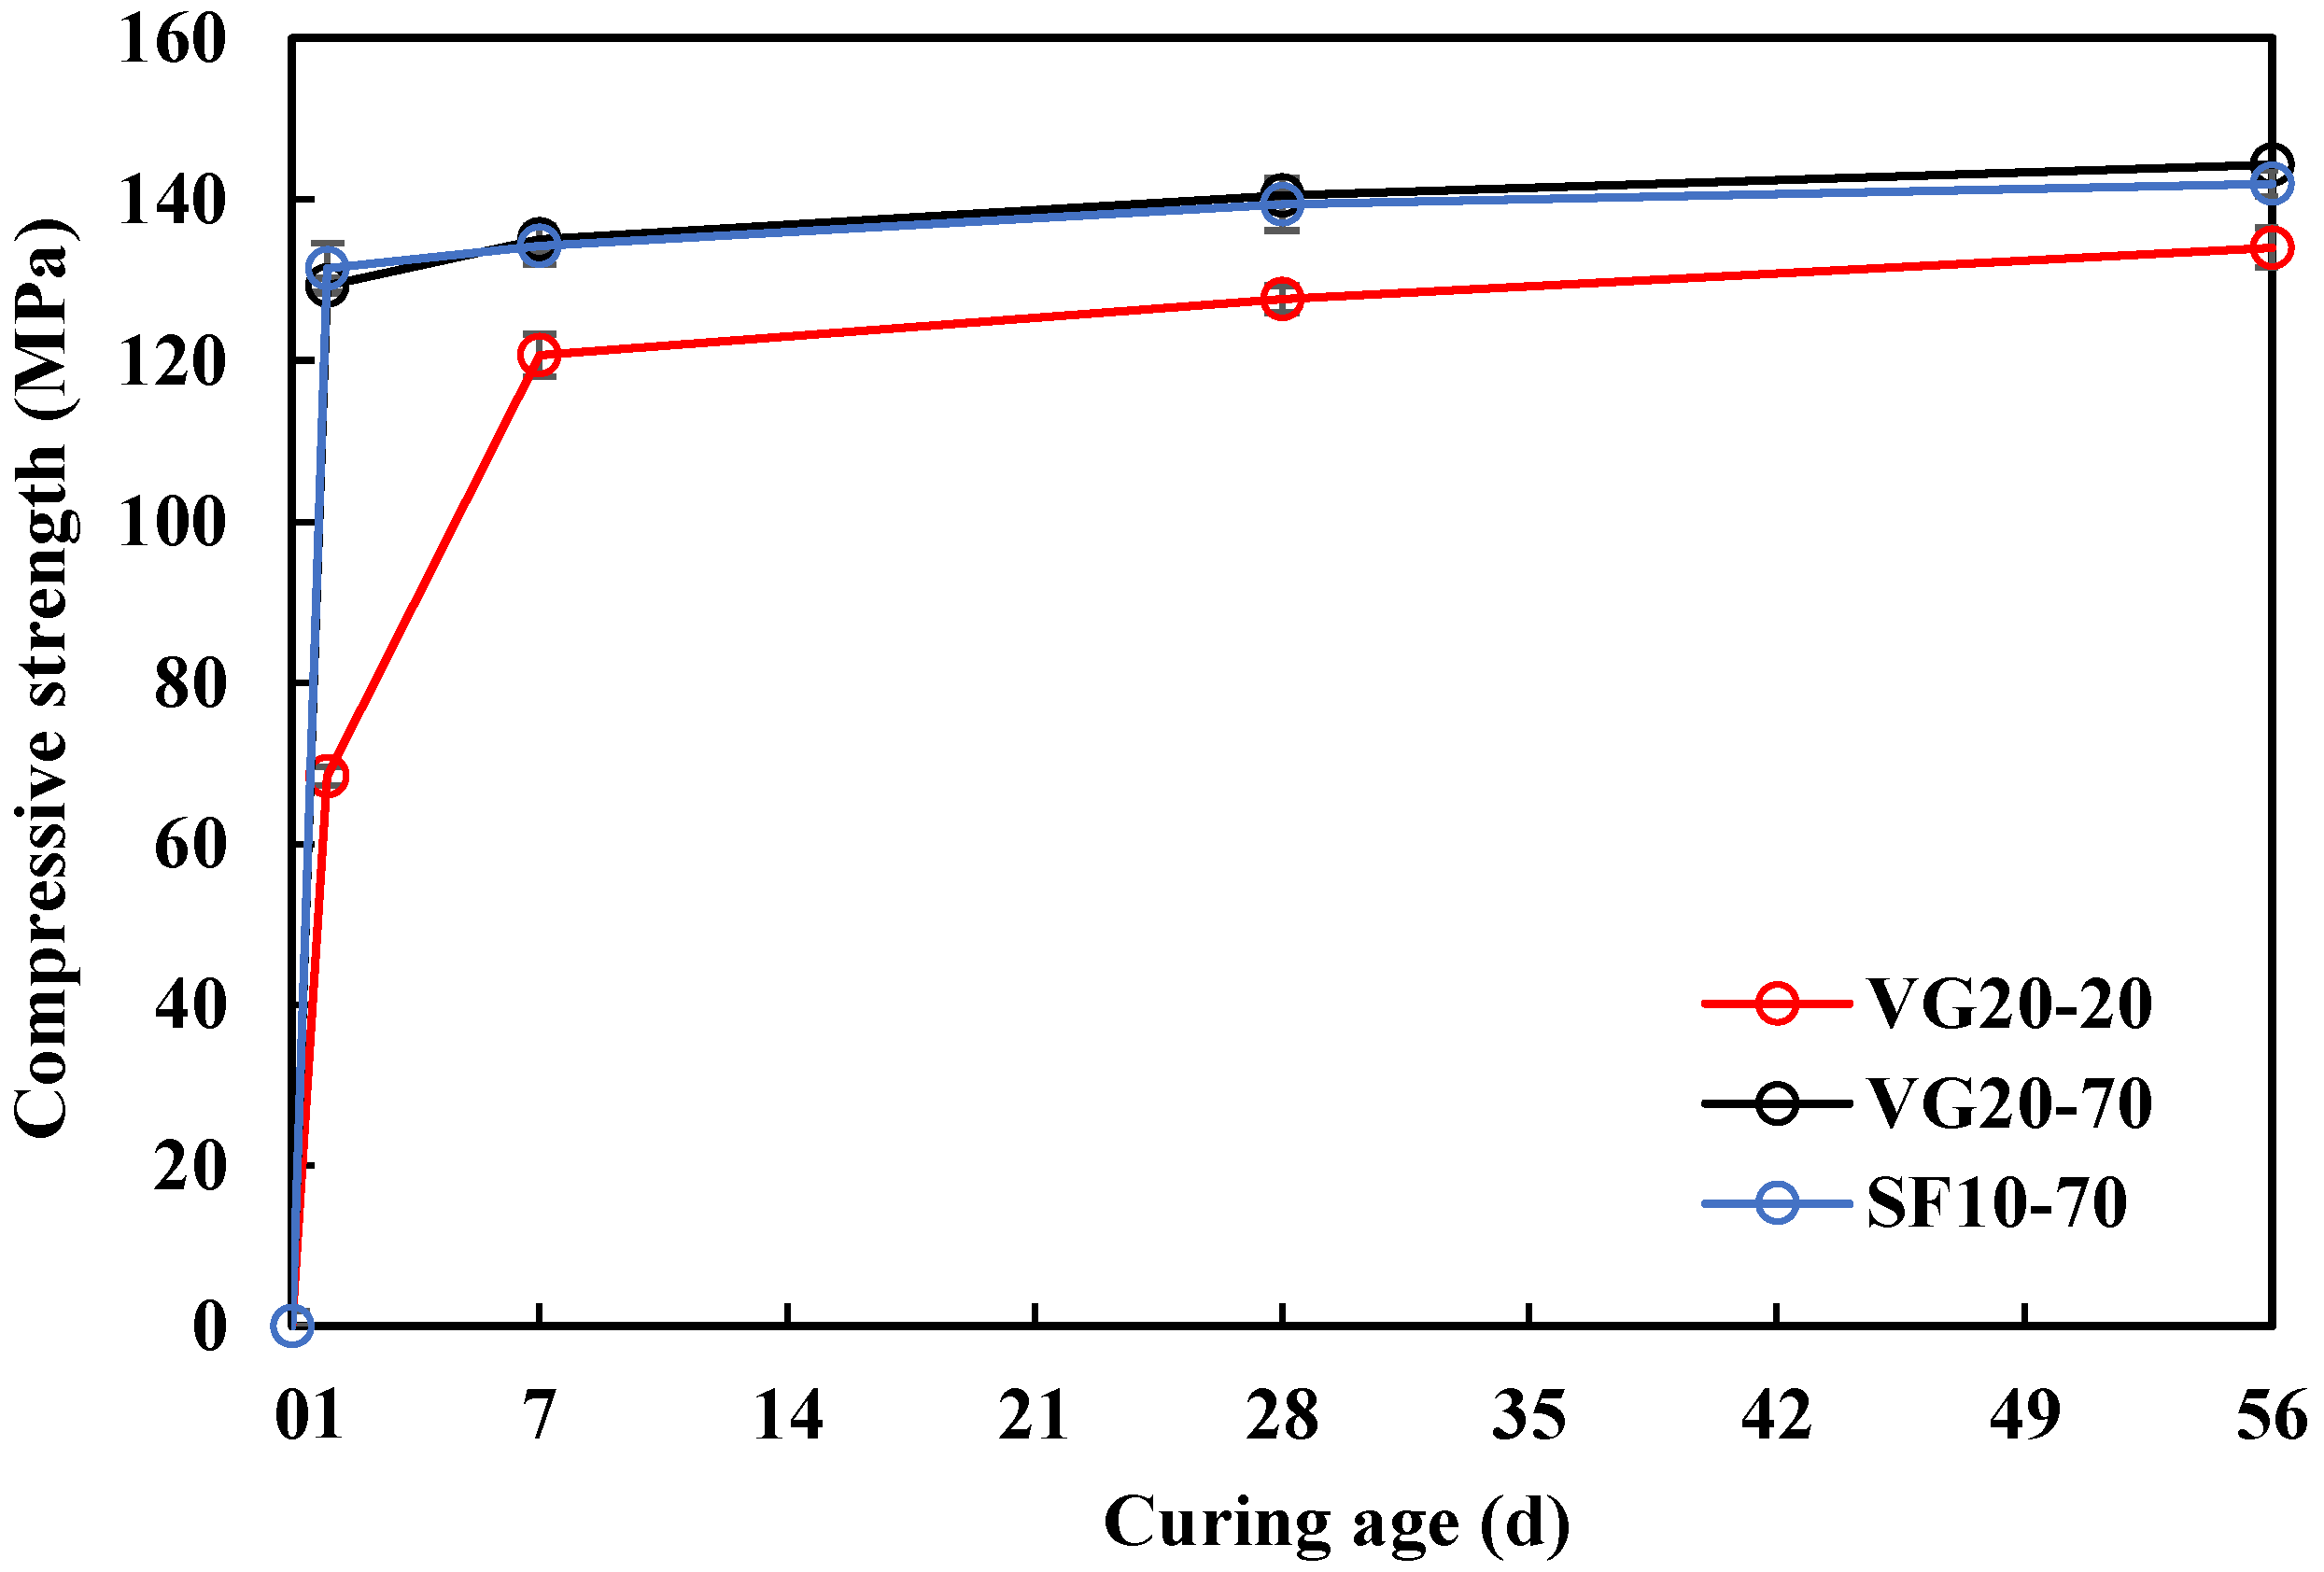
Figure 17 illustrates the relationship between the age of the concrete specimens and their compressive strength. The compressive strength values represent the average of three specimens, with standard deviation (SD) indicated by error bars (average value ± SD). The compressive strength of the concrete specimens was lower than that of the mortar specimens, recording 129 MPa at 1 d (a 14% decrease) and 135 MPa at 7 d (a 14.5% decrease). However, the target strength of 123 MPa was achieved by d 7. Additionally, up to 56 d of age, the compressive strength of VG20-70 remained at least equal to that of VG20-20 and continued to increase over time. Compared to SF10, the compressive strength of SF10 was initially higher at 1 d of age, but after 7 d, the strength gain trend shifted.
Previous studies have reported that steam curing of concrete without admixtures can lead to lower long-term strength compared to non-steam curing [40,41] and that high temperatures combined with prolonged curing times may further reduce long-term strength [42,43]. However, Si and Al components, which are abundant in pozzolanic materials such as fly ash, ground granulated blast furnace slag, and SF, react with Ca(OH)2 in pore water to form a pozzolanic reaction layer around the particles. This reaction mitigates the typical strength reduction associated with steam curing [44,45,46,47]. VG has also been reported to exhibit excellent pozzolanic reactivity [48], suggesting that it provides similar long-term strength benefits to conventional pozzolanic materials.
In this experiment, steam curing was conducted in a small curing tank. However, for large products such as precast concrete piles, steam curing is typically performed in a covered curing tank, which could measure, for example, 20 m × 3 m × 3 m. In addition, the product can be moved along with the formwork using a crane. Therefore, the 70 °C, 8-h curing conditions proposed in this study are fully applicable to actual manufacturing processes.
Moreover, incorporating VG as an admixture in precast concrete piles is expected to facilitate additional moisture absorption from groundwater in the soil, potentially contributing to a minor increase in compressive strength over time.
Figure 18 presents the estimated Young’s modulus curve [32], calculated using Equation (1) for the material and strength properties of OPC and VG concrete mixtures. Actual measurements for VG20 and SF10 are also plotted. OPC concrete specimens could not be produced due to the high cement content, which resulted in a highly viscous concrete mix that was challenging to handle with the available concrete mixer. Consequently, the density of OPC concrete was estimated as γ = 2.50 g/cm3.
E c = k 1 · k 2 · 3.35 × 10 4 · γ 2.4 2 · σ 60 1 3
In Equation (1), E c is the Young’s modulus (MPa), k 1 and k 2 are the coefficients for the coarse aggregate and admixture type, respectively, γ is the density of concrete (g/cm3), and σ is the compressive strength of concrete (MPa). In this experiment, the correction factor k 1 , determined by the type of coarse aggregate, was set at 1.0, and the measured density of the VG concrete was γ = 2.49 g/cm3. By substituting the measured values of compressive strength and Young’s modulus into Equation (1) and back-calculating the coefficient for the VG admixture type, we obtained k 2   = 0.88. Substituting this coefficient back into Equation (1) to fit the relationship curve between compressive strength and Young’s modulus, the estimated curve generally matched the measured values.
This coefficient for VG is smaller than that for SF ( k 2   = 0.95), indicating that for concrete of equivalent strength, the Young’s modulus of VG-mixed concrete is lower than that of SF-mixed concrete. Previous studies have suggested that VG results in a higher C-S-H density than SF [26]. Since C-S-H density is strongly correlated with strength development in concrete, this would typically imply an increase in Young’s modulus. However, the results of this experiment showed the opposite trend, suggesting that further research is needed to understand this behavior.
Nevertheless, at 7 d of age, the Young’s modulus for VG20-70 was measured at 42 GPa, demonstrating sufficiently high strength. The effect of VG on the mechanical properties of concrete has been clarified, supporting its potential application in a wide range of secondary products beyond precast high-strength concrete piles. Additionally, ultra-high-strength concrete incorporating metallic fibers, SF, volcanic deposits, and other materials has been extensively studied for further enhancement [49,50,51,52,53,54].
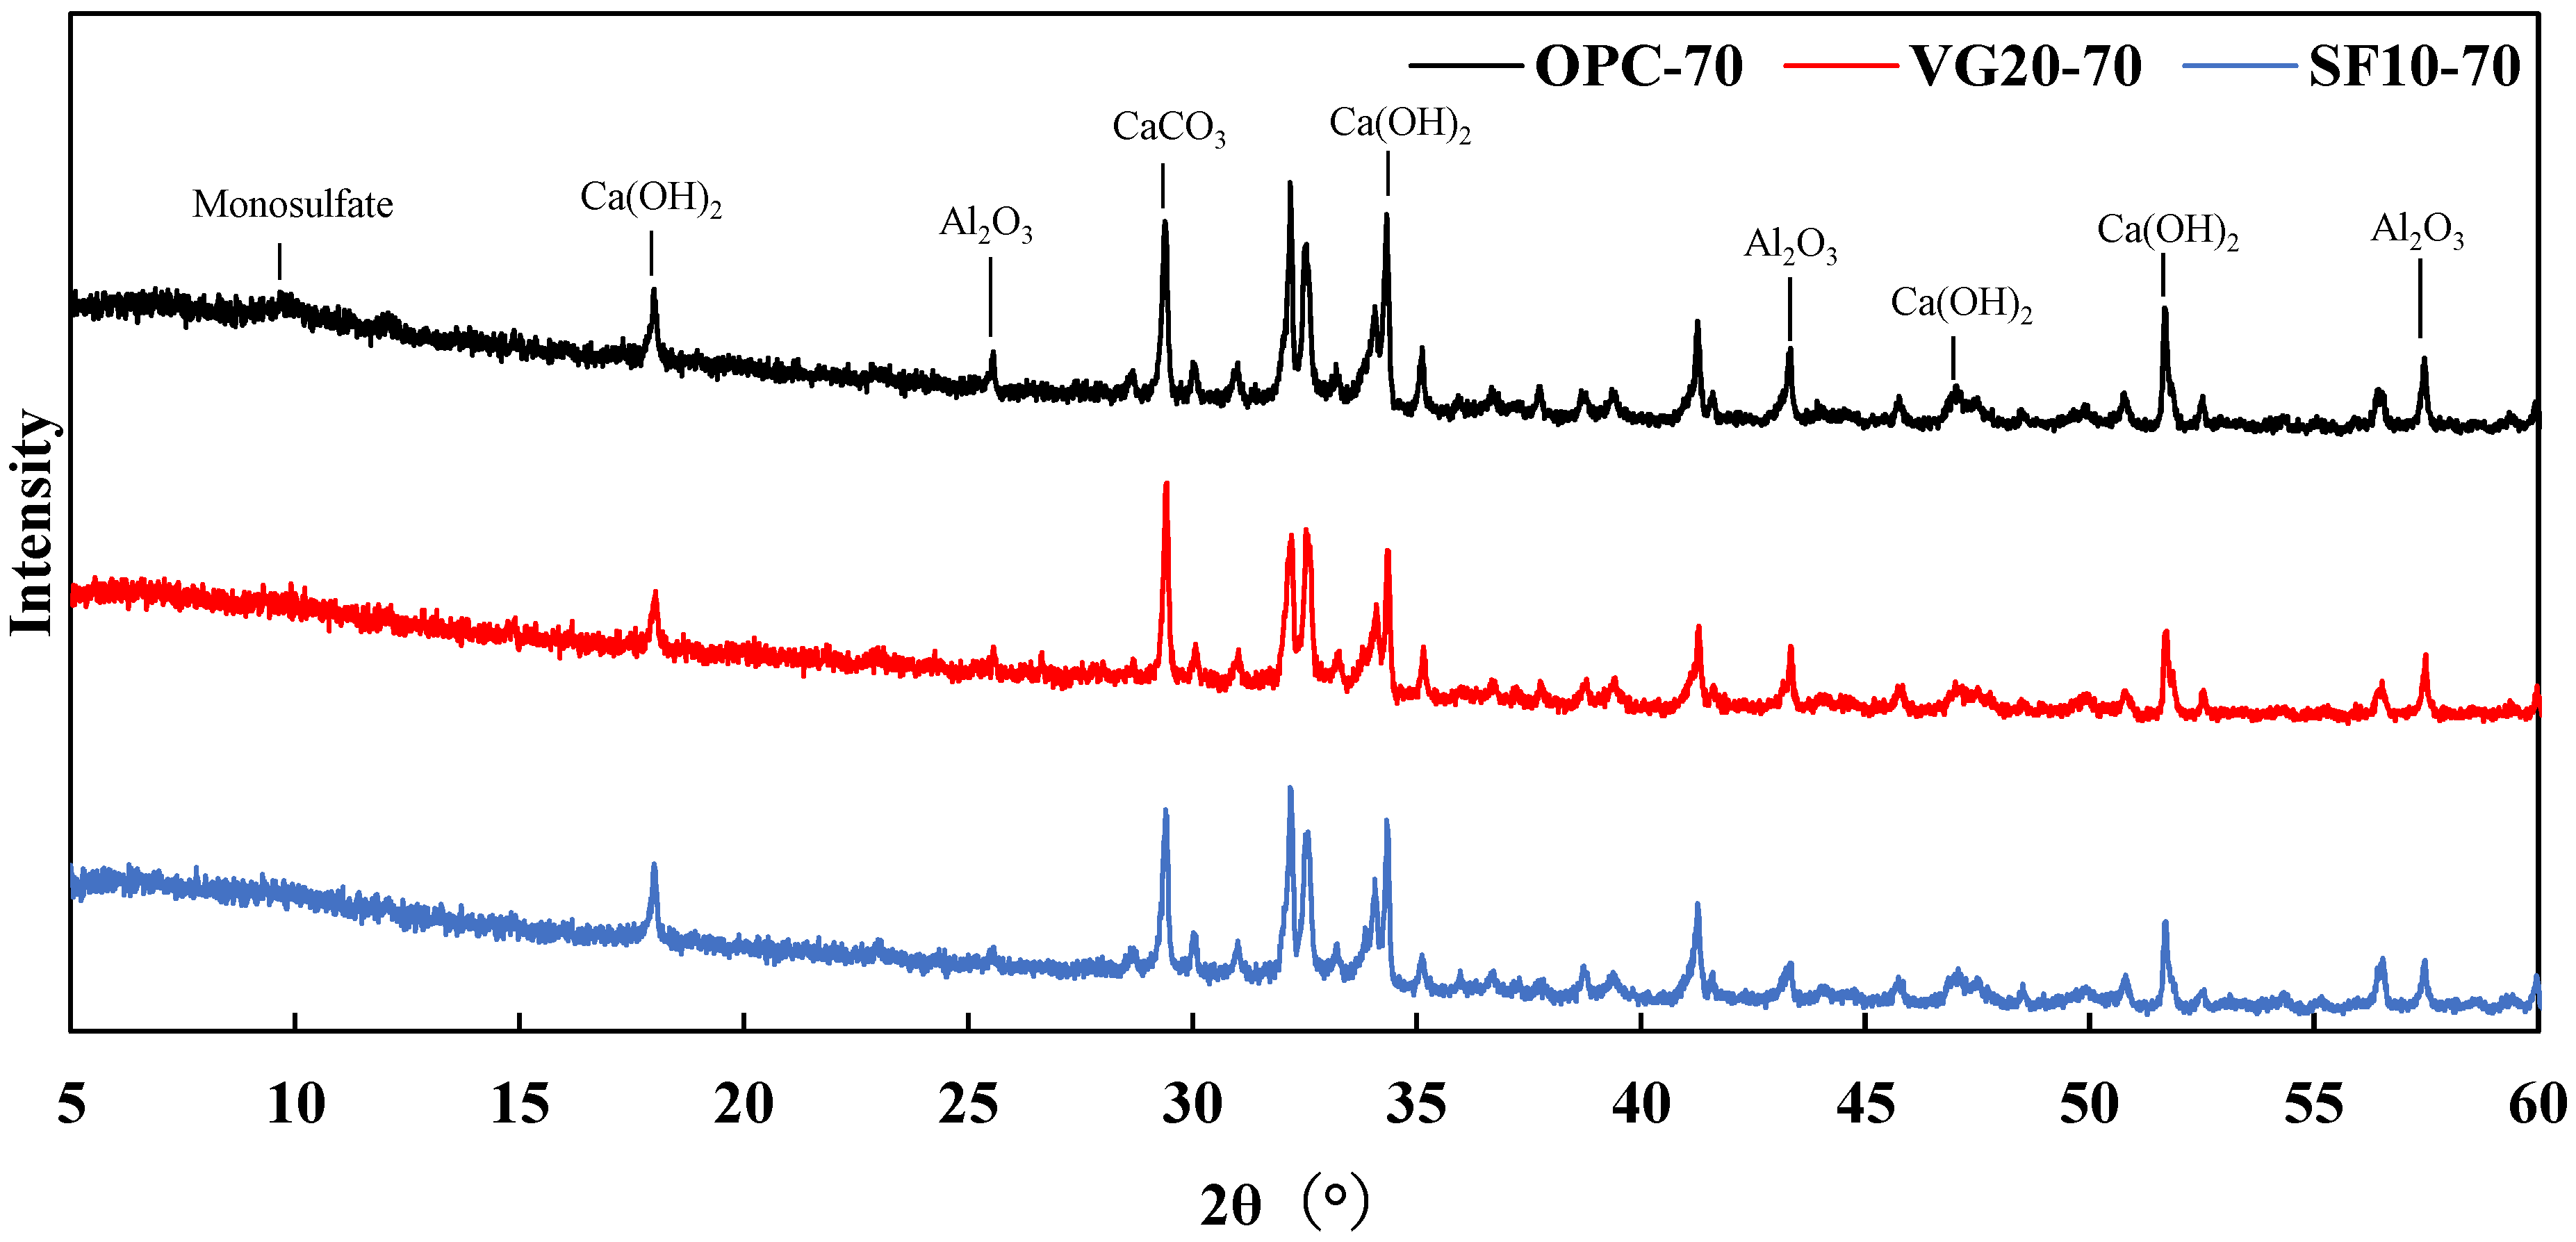
Figure 19 shows the XRD patterns of the concrete samples. No significant differences were observed in the diffraction patterns of VG20-70 and SF10-70 when compared to those of OPC-70. These results suggest that even when part of the OPC is replaced with VG, a hardened body similar to that of the OPC is produced. The intensity ratio was calculated by dividing the maximum diffraction integrated intensity (2θ = 47°) of Ca(OH)2 in these patterns by the maximum analytical integrated intensity (2θ = 43°) of the standard substance Al2O3 [55]. The intensity ratios were in close agreement: 1.46 for OPC, 1.68 for VG, and 1.78 for SF. The intensity ratios of VG and SF were slightly higher than those of OPC, indicating that the hydration reaction had progressed further.
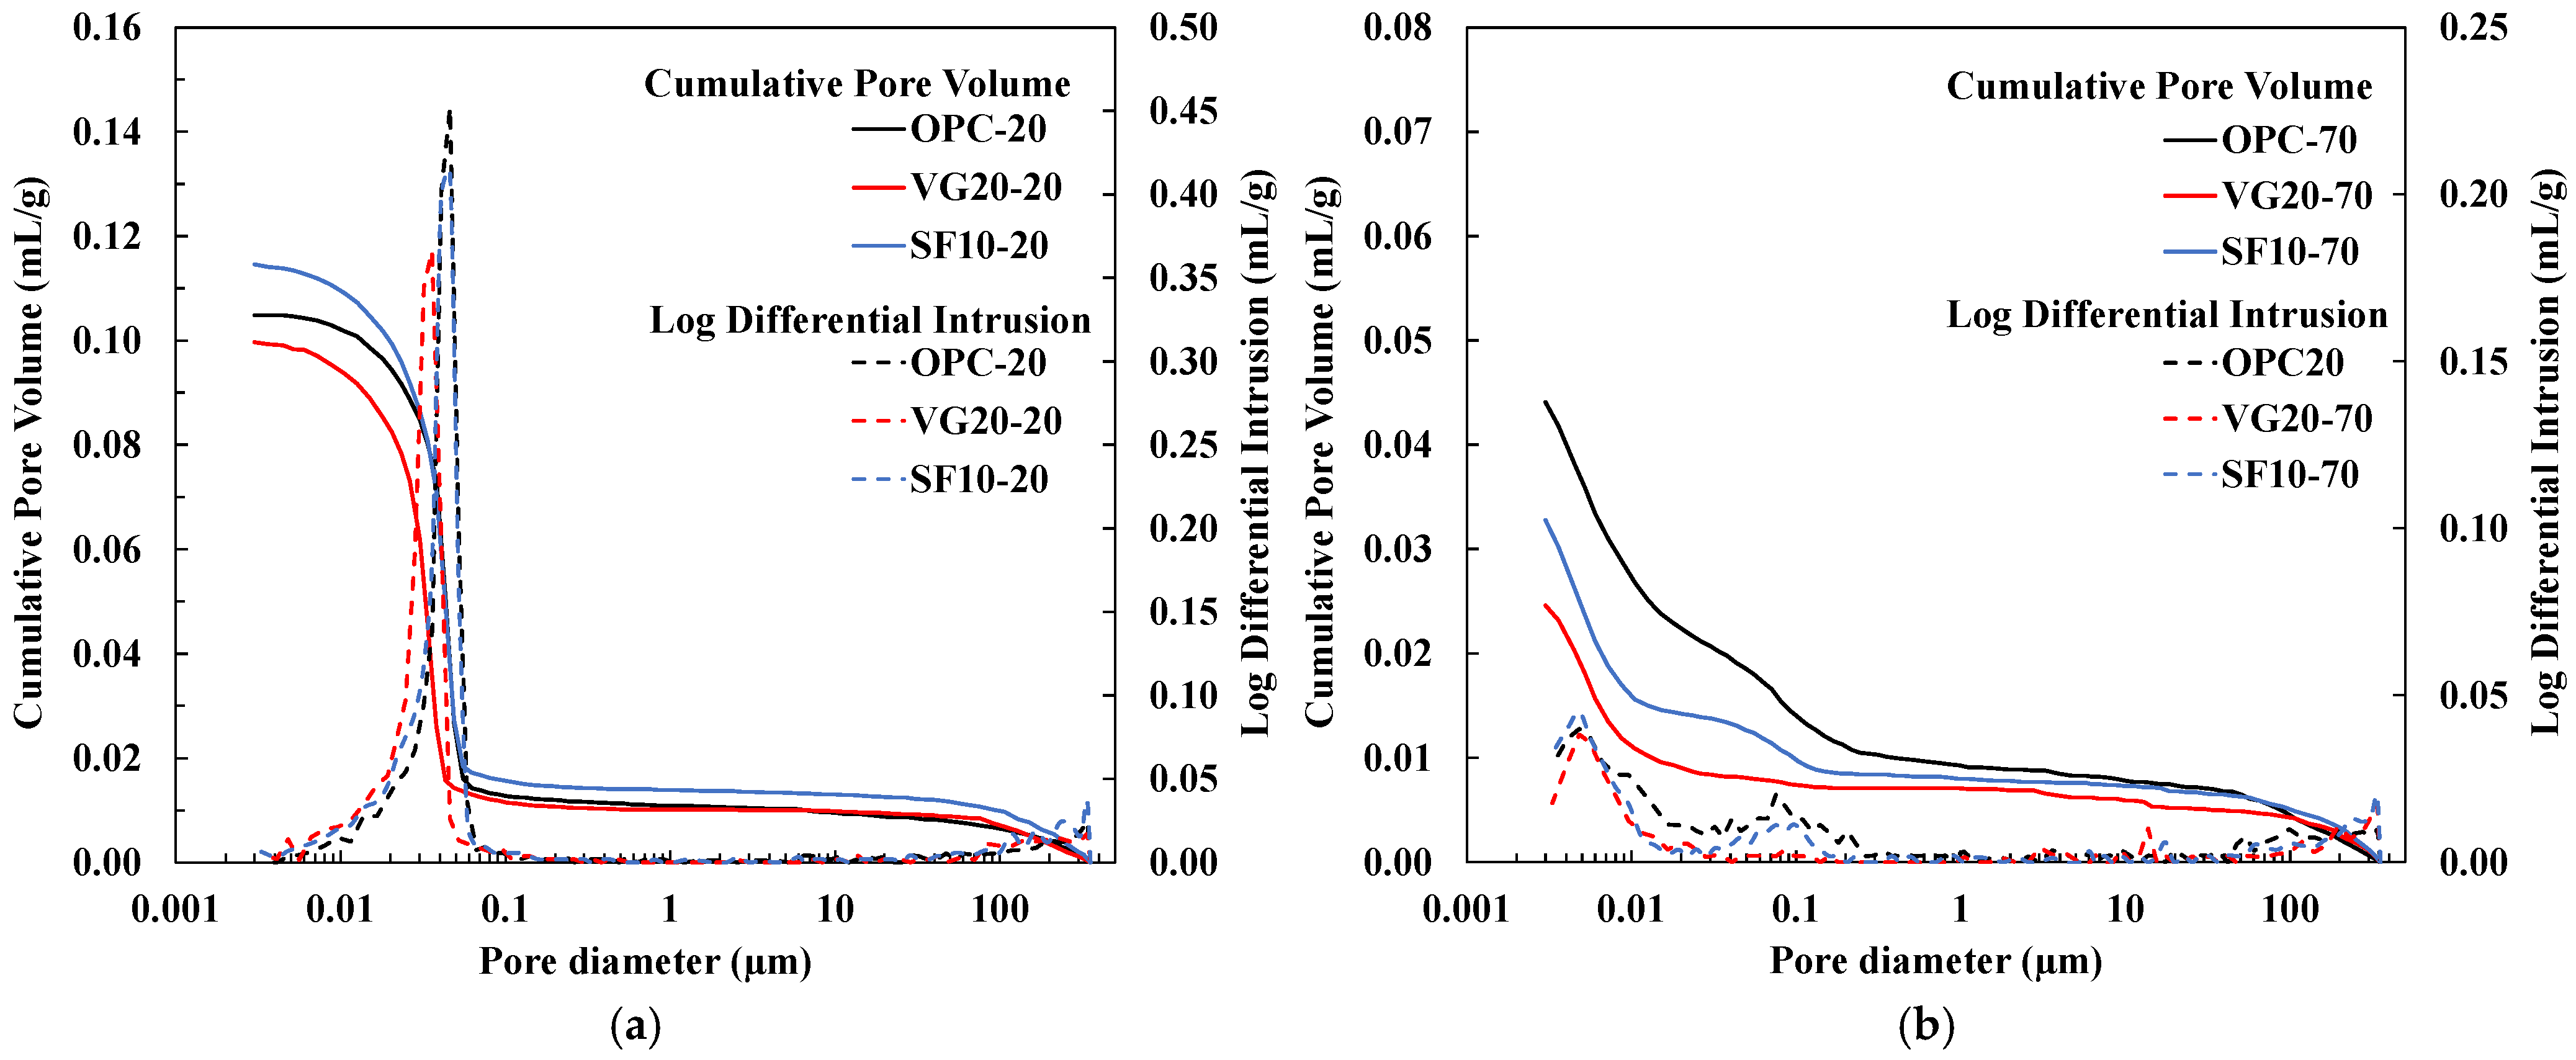
Figure 20 illustrates the cumulative and incremental pore-size distribution of the cement paste. OPC, VG20, and SF10, which were cured in water at 20 °C, all exhibited numerous pores between 10 and 60 nm. The cumulative values were also in the range of 0.10 to 0.11 mL/g, showing a similar pore distribution. Contrastingly, OPC, VG20, and SF10 cured by steam curing at 70 °C for 8 h had many pores between 3 and 14 nm, with cumulative values ranging from 0.025 to 0.044 mL/g, also exhibiting a similar pore distribution. These results show that steam curing at 70 °C significantly reduces the size of the pores in the structure compared to water curing, indicating that the structure becomes densified by promoting the hydration reaction. Because pore sizes of 0.5 µm or more are said to decrease the compressive strength of concrete [56], it is believed that pores large enough to decrease compressive strength will not form in the concrete prepared under the mix and curing conditions examined in this study. In addition, it has been reported that the total pore volume can be reduced if the curing method is appropriate [56]. By replacing part of the OPC with VG in this study, the total pore volume was slightly lower than in the case of OPC alone, suggesting that the curing method used was also effective.
Figure 21 presents the crystal structure of the hardened cement paste. Comparing OPC, VG20, and SF10, no clear difference in the crystal structure due to the difference in the admixture was found.
In this study, the effect of partially replacing OPC with VG was investigated, because SF is an imported product with a high cost. In Japan, if the quality of imported SF (specifically its particle size distribution) is suboptimal, additional adjustments are required before use. Therefore, we explored the complete replacement of SF with VG, which is both cost-effective and expected to offer high quality. Additionally, we plan to consider a partial replacement of OPC with both VG and SF in the future, because the particle size decreases in the order of OPC > VG > SF. This mixing approach is expected to result in a denser concrete structure.
The ultimate objective of this study is to utilize VG in high-strength precast concrete piles. To achieve this, it is essential to validate the actual production of centrifugally compacted piles and establish an optimal mix design. While concrete with a reduced water–cement ratio of 15% demonstrates high fluidity due to chemical and mineral admixtures, it may also generate a significant amount of sludge during centrifugal compaction [57]. Further research will be conducted to explore the practical application of VG in high-strength precast concrete piles.

4. Conclusions

This study aimed to develop high-strength precast concrete piles using VG as an alternative to SF. Both mortar and concrete specimens were subjected to steam curing, and their fundamental properties were analyzed. The key findings are summarized as follows:
  • VG, like SF, consists of fine particles that enhance mortar fluidity through a ball-bearing effect when mixed with raw materials.
  • The activity index of the VG concrete increased when it was steam-cured.
  • The compressive strength of VG-mixed concrete was maximized when 20% of the OPC was replaced with VG, achieving a target strength of 123 MPa. The optimal steam curing conditions were maintained at 70 °C for 8 h.
  • The Young’s modulus of VG-mixed concrete was slightly lower than that of concrete mixed with OPC alone or SF.
These results demonstrate that VG is a viable alternative to SF for high-strength precast concrete piles. Utilizing locally available volcanic ash provides a sustainable approach to enhancing concrete strength, contributing significantly to environmentally friendly construction practices.
For the broader adoption of VG, further investigation into its chemical properties is essential in addition to its mechanical characteristics. While this study discusses VG’s role in reducing the apparent chloride ion diffusion coefficient, previous research has shown that at a 20% substitution ratio, the neutralization rate coefficient is 23–38% higher than that of OPC. However, at a substitution ratio of 10% or lower, the neutralization rate remains comparable to that of OPC [24]. Additionally, the pozzolanic reaction of VG, which contains a substantial number of Si components, may help prevent delayed ettringite formation (DEF), a phenomenon reported in various countries. Future research will explore the DEF suppression effect of VG.

Author Contributions

Conceptualization, T.T. (Takato Tsuboguchi) and K.Y.; Investigation, T.T. (Takato Tsuboguchi) and K.Y.; Methodology, T.T. (Takato Tsuboguchi), K.Y., S.U. and T.T. (Takumi Taguchi); Visualization, T.T. (Takato Tsuboguchi); Writing—original draft, T.T. (Takato Tsuboguchi); Writing—review and editing, K.Y., S.U. and T.T. (Takumi Taguchi). All authors have read and agreed to the published version of the manuscript.

Funding

This research was funded by the Nippon Hume Corporation.

Institutional Review Board Statement

Not applicable.

Informed Consent Statement

Not applicable.

Data Availability Statement

The datasets generated and/or analyzed during the current study are available upon reasonable request from the corresponding authors.

Acknowledgments

The VG used in this study was provided by Principle Co., Ltd. This study used research equipment shared by the MEXT Project to promote the public utilization of advanced research infrastructure (which is a program for supporting the construction of core facilities), grant number JPMXS0440900024.

Conflicts of Interest

Author Sachio Ueyama and Takumi Taguchi are employed by the Nippon Hume Corporation. The funding company had no role in the content or conclusion of this paper. The remaining authors declare that the research was conducted in the absence of any commercial or financial relationships that could be construed as a potential conflict of interest.

Abbreviations

The following abbreviations are used in this manuscript:
AAMAlkali-activated materials
ASTMAmerican Society for Testing and Materials
BSBritish Standard Methods
C-S-HCalcium silicate hydrate
DEFDelayed ettringite formation
JISJapanese Industrial Standards
OPCOrdinary Portland cement
SEMScanning electron microscopy
SFSilica fume
VGVolcanic glass powder
XRDX-ray diffractometry

References

  1. Demand Trend Forecasting Committee of Concrete Pile and Pole Industrial Technology Association. Concrete Pile Demand Forecast Report, 2022, 16. Available online: https://www.c-pile.or.jp/library/58d8a24e6a12346753a62666/66137090a66e572383afd44f.pdf (accessed on 4 February 2025). (In Japanese).
  2. Yang, J.; Fan, J.; Kong, B.; Cai, C.S.; Chen, K. Theory and Application of New Automated Concrete Curing System. J. Build. Eng. 2018, 17, 125–134. [Google Scholar] [CrossRef]
  3. Liu, B.; Xie, Y.; Zhou, S.; Li, J. Some Factors Affecting Early Compressive Strength of Steam-Curing Concrete with Ultrafine Fly Ash. Cement Concr. Res. 2001, 31, 1455–1458. [Google Scholar] [CrossRef]
  4. Zhang, Z.; Wang, Q.; Chen, H. Properties of High-Volume Limestone Powder Concrete under Standard Curing and Steam-Curing Conditions. Powder Technol. 2016, 301, 16–25. [Google Scholar] [CrossRef]
  5. Gallucci, E.; Zhang, X.; Scrivener, K.L. Effect of Temperature on the Microstructure of Calcium Silicate Hydrate (CSH). Cem. Concr. Res. 2013, 53, 185–195. [Google Scholar] [CrossRef]
  6. Jinnai, H.; Saeki, T.; Nagataki, S. Silica fume. Concr. J. 2014, 52, 399–404. (In Japanese) [Google Scholar] [CrossRef]
  7. Snellings, R.; Mertens, G.; Elsen, J. Supplementary Cementitious Materials. Rev. Mineral. Geochem. 2012, 74, 211–278. [Google Scholar] [CrossRef]
  8. Becerra-Duitama, J.A.; Rojas-Avellaneda, D. Pozzolans: A review, Eng. Appl. Sci. Res. 2002, 49, 495–504. [Google Scholar] [CrossRef]
  9. Kupwade-Patil, K.; De Wolf, C.; Chin, S.; Ochsendorf, J.; Hajiah, A.E.; Al-Mumin, A.; Buyukozturk, O. Impact of Embodied Energy on Materials/Buildings with Partial Replacement of Ordinary Portland Cement (OPC) by Natural Pozzolanic Volcanic Ash. J. Clean. Prod. 2018, 177, 547–554. [Google Scholar] [CrossRef]
  10. Tomoyose, A.; Noguchi, T.; Sodeyama, K. Outline of “Development of Volcanic Glass Powder for Use in Concrete”. Nation. Rep. J. Struct. Concr. 2022, 185–186. Available online: https://www.jpci.or.jp/national_report/2022/pdf/49.pdf (accessed on 4 February 2025).
  11. Tomoyose, A.; Noguchi, T.; Sodeyama, K.; Higashi, K.; Kazuro, H. Origin and Manufacturing of Volcanic Glass Powder. Concr. Eng. 2020, 58, 805–813. (In Japanese) [Google Scholar] [CrossRef]
  12. Rashad, A.M.; ElNagar, A.M.; El-Nashar, M.H.; Ezzat, M. The Use of Egyptian Volcanic Glass Powder as a Potential Source for Improving the Properties of Alkali-activated Fly Ash Cement. Sustain. Chem. Pharm. 2024, 39, 101597. [Google Scholar] [CrossRef]
  13. Rashad, A.M.; Abdu, M.F.A.; Ezzat, M. Egyptian Volcanic Glass Powder as a Modifier Agent for Alkali-activated Slag Cement. Constr. Build. Mater. 2023, 408, 133662. [Google Scholar] [CrossRef]
  14. Wang, W.; Noguchi, T.; Tomoyose, A.; Zhang, Y.; Maruyama, I. Influence of Volcanic Glass Powder on Alkali-silica Reaction Expansion in Alkali-activated Slag Mortars. Cem. Concr. Compos. 2024, 152, 105665. [Google Scholar] [CrossRef]
  15. Ige, O.E.; Olanrewaju, O.A.; Duffy, K.J.; Obiora, C. A Review of the Effectiveness of Life Cycle Assessment for Gauging Environmental Impacts from Cement Production. J. Clean. Prod. 2021, 324, 129213. [Google Scholar] [CrossRef]
  16. Yoro, K.O.; Daramola, M.O. CO2 Emission Sources, Greenhouse Gases, and the Global Warming Effect. In Advances in Carbon Capture; Elsevier: Amsterdam, The Netherlands, 2020; pp. 3–28. [Google Scholar] [CrossRef]
  17. Kamath, M.; Prashant, S.; Ralegaonkar, R. Microstructure Properties of Popular Alkali-activated Pastes Cured in Ambient Temperature. Buildings 2023, 13, 858. [Google Scholar] [CrossRef]
  18. Kaptan, K.; Cunha, S.; Aguiar, J. A Review: Construction and Demolition Waste as a Novel Source for CO2 Reduction in Portland Cement Production for Concrete. Sustainability 2024, 16, 585. [Google Scholar] [CrossRef]
  19. Elemam, W.E.; Tahwia, A.M.; Abdellatief, M.; Youssf, O.; Kandil, M.A. Durability, Microstructure, and Optimization of High-strength Geopolymer Concrete Incorporating Construction and Demolition Waste. Sustainability 2023, 15, 15832. [Google Scholar] [CrossRef]
  20. Elemam, W.E.; Agwa, I.S.; Tahwia, A.M. Reusing Ceramic Waste as a Fine Aggregate and Supplemental Cementitious Material in the Manufacture of Sustainable Concrete. Buildings 2023, 13, 2726. [Google Scholar] [CrossRef]
  21. Mousavinezhad, S.; Garcia, J.M.; Toledo, W.K.; Newtson, C.M. A Locally Available Natural Pozzolan as a Supplementary Cementitious Material in Portland Cement Concrete. Buildings 2023, 13, 2364. [Google Scholar] [CrossRef]
  22. Tomoyose, A.; Noguchi, T.; Sodeyama, K.; Higashi, K. Research on the Environmental Impact Reduction Effects of Using Volcanic Glass Powder. Proc. Japan Concr. Inst. 2020, 42, 1. Available online: https://data.jci-net.or.jp/data_pdf/42/042-01-1022.pdf (accessed on 4 February 2025). (In Japanese).
  23. The Japan Cement Association. Summary of Life Cycle Inventory Analysis Data for Cement. 2024, 5. Available online: https://www.jcassoc.or.jp/cement/4pdf/jg1i_01.pdf (accessed on 20 February 2025). (In Japanese).
  24. Sodeyama, K.; Tomoyose, A.; Noguchi, T.; Kusumoto, K. Investigations on the Resistance of Concrete with Volcanic Glass Powder to Penetration of Corrosion Factors of Reinforcing Steel Bars. Proc. Jpn. Concr. Inst. 2019, 41, 167–172. Available online: https://data.jci-net.or.jp/data_pdf/41/041-01-1023.pdf (accessed on 4 February 2025). (In Japanese).
  25. Tomoyose, A.; Noguchi, T.; Sodeyama, K.; Higashi, K. Effect of BET Surface Area and Replacement Ratio of Volcanic Glass Powder on Compressive Strength. Cem. Sci. Concr. Technol. 2019, 73, 465–470. (In Japanese) [Google Scholar] [CrossRef]
  26. Tojo, M.; Sato, M.; Koizumi, K.; Umemura, Y. The Effect of C-S-H and Pore Structure on Compressive Strength of Cement Hardened with Volcanic Glass Powder. Cem. Sci. Concr. Technol. 2022, 76, 427–435. (In Japanese) [Google Scholar] [CrossRef]
  27. Papadakis, V.G. Experimental investigation and theoretical modeling of silica fume activity in concrete. Cem. Concr. Res. 1999, 29, 79–86. [Google Scholar] [CrossRef]
  28. Kim, B.-J.; Lee, G.-W.; Choi, Y.-C. Hydration and Mechanical Properties of High-Volume Fly Ash Concrete with Nano-Silica and Silica Fume. Materials 2022, 15, 6599. [Google Scholar] [CrossRef]
  29. Ueno, A.; Kokubu, K.; Uji, K. A Fundamental Study of Evaluation of Effects of Mineral Powders on Fluidity and Bleeding of Concrete. Jpn. J. JSCE 2003, 725, 213–225. [Google Scholar] [CrossRef]
  30. Miura, N.; Sogo, S. Research on Performance Evaluation Method of Concrete Densify. Proc. Japan Concr. Inst. 2002, 24, 1107–1112. Available online: https://data.jci-net.or.jp/data_pdf/24/024-01-1177.pdf (accessed on 20 February 2025). (In Japanese).
  31. Sato, M.; Umemura, M.; Koizumi, K. Hydration of Hardened Ultra-High Strength Cement Using Silica Fume and Water Reducing Agent. Cem. Sci. Concr. Technol. 2010, 64, 442–449. (In Japanese) [Google Scholar] [CrossRef]
  32. Noguchi, T.; Tomosawa, F. Relationship between Compressive Strength and Modulus of Elasticity of High Strength Concrete. J. Struct. Constr. Eng. 1995, 60, 474. (In Japanese) [Google Scholar] [CrossRef]
  33. Nagataki, S.; Otsuki, N.; Hisada, M.; Mizuno, K. A Study on the Characterization of Silica Fume and the Evaluation of Properties of Concrete Containing Silica Fume. J. Jpn. Soc. Civ. Eng. 1995, 28, 87–98. (In Japanese) [Google Scholar] [CrossRef]
  34. Matsufuji, Y. Effective Use of Resources and Concrete/Concrete with Silica Fume. Concr. J. 1996, 34, 70–75. (In Japanese) [Google Scholar] [CrossRef]
  35. Mitsui, K.; Yonezawa, T.; Nakashima, M.; Sugimoto, M. Study on Relationship Between Physicochemical Properties of Silica Fume and Properties of High-Strength Concrete. Proc. Jpn. Concr. Inst. 1993, 15, 63–68. Available online: https://data.jci-net.or.jp/data_pdf/15/015-01-1008.pdf (accessed on 4 February 2025). (In Japanese).
  36. Cai, X.; He, Z.; Tang, S.; Chen, X. Abrasion Erosion Characteristics of Concrete Made with Moderate Heat Portland Cement, Fly Ash, and Silica Fume Using Sandblasting Test. Construct. Build. Mater. 2016, 127, 804–814. [Google Scholar] [CrossRef]
  37. Yonezawa, T.; Yanagibashi, K.; Ikeo, Y.; Asakura, E. Dispersion of Silica Fume in High Strength Concrete. Proc. Jpn. Concr. Inst. 1993, 15, 69–74. Available online: https://data.jci-net.or.jp/data_pdf/15/015-01-1009.pdf (accessed on 4 February 2025). (In Japanese).
  38. Ichimiya, K.; Yamasaki, T. Relationship Between Surface Bubble Properties of High Flow Concrete and Steam Curing Methods and Material Permeability. Proc. Japan Concr. Inst. 2010, 32, 1205–1210. Available online: https://data.jci-net.or.jp/data_pdf/32/032-01-1193.pdf (accessed on 4 February 2025). (In Japanese).
  39. Takahashi, H.; Mori, H.; Komatsu, A. Accelerated Hardening of Concrete by Steam Curing. Rep. Obayashi Corp. Tech. Res. Inst. 1969, 3, 127–137. Available online: https://www.obayashi.co.jp/technology/shoho/003/1969_003_20.pdf (accessed on 4 February 2025). (In Japanese).
  40. Yan, X.; Jiang, L.; Guo, M.; Chen, Y.; Song, Z.; Bian, R. Evaluation of Sulfate Resistance of Slag Contained Concrete under Steam Curing. Constr. Build. Mater. 2019, 195, 231–237. [Google Scholar] [CrossRef]
  41. Mo, Z.; Gao, X.; Su, A. Mechanical Performances and Microstructures of Metakaolin Contained UHPC Matrix under Steam Curing Conditions. Constr. Build. Mater. 2021, 268, 121112. [Google Scholar] [CrossRef]
  42. Liu, B.; Shi, J.; Zhou, F.; Shen, S.; Ding, Y.; Qin, J. Effects of Steam Curing Regimes on the Capillary Water Absorption of Concrete: Prediction Using Multivariable Regression Models. Constr. Build. Mater. 2020, 256, 119426. [Google Scholar] [CrossRef]
  43. Türkel, S.; Alabas, V. The Effect of Excessive Steam Curing on Portland Composite Cement Concrete. Cem. Concr. Res. 2005, 35, 405–411. [Google Scholar] [CrossRef]
  44. Erdoğdu, Ş.; Kurbetci, Ş. Influence of Cement Composition on the Early Age Flexural Strength of Heat-Treated Mortar Prisms. Cem. Concr. Compos. 2005, 27, 818–822. [Google Scholar] [CrossRef]
  45. Ma, W.; Sample, D.; Martin, R.; Brown, P.W. Calorimetric Study of Cement Blends Containing Fly Ash, Silica Fume, and Slag at Elevated Temperatures. Cem. Concr. Aggr. 1994, 16, 93–99. [Google Scholar] [CrossRef]
  46. Chen, L.; Zheng, K.; Xia, T.; Long, G. Mechanical Property, Sorptivity and Microstructure of Steam-Cured Concrete Incorporated with the Combination of Metakaolin-Limestone. Case Stud. Constr. Mater. 2019, 11, e00267. [Google Scholar] [CrossRef]
  47. Ho, D.; Chua, C.; Tam, C. Steam-Cured Concrete Incorporating Mineral Admixtures. Cem. Concr. Res. 2023, 33, 595–601. [Google Scholar] [CrossRef]
  48. Ren, Y.; Maruyama, I.; Tomoyose, A.; Kurihara, R. Effect of Temperature on the Hydration of Ordinary Portland Cement and the Pozzolanic Reaction of Volcanic Glass Powder. Cem. Sci. Concr. Technol. 2021, 75, 166–173. [Google Scholar] [CrossRef]
  49. Wu, Z.; Shi, C.; Khayat, K.H. Influence of Silica Fume Content on Microstructure Development and Bond to Steel Fiber in Ultra-High Strength Cement-Based Materials (UHSC). Cem. Concr. Compos. 2016, 71, 97–109. [Google Scholar] [CrossRef]
  50. Wang, X.H.; Jacobsen, S.; Lee, S.F.; He, J.Y.; Zhang, Z.L. Effect of Silica Fume, Steel Fiber and ITZ on the Strength and Fracture Behavior of Mortar. Mater. Struct. 2009, 43, 125–139. [Google Scholar] [CrossRef]
  51. Chan, Y.W.; Chu, S.H. Effect of Silica Fume on Steel Fiber Bond Characteristics in Reactive Powder Concrete. Cem. Concr. Res. 2004, 34, 1167–1172. [Google Scholar] [CrossRef]
  52. Chalah, L.; Talah, A.; Ghernouti, Y. Mechanical and Durability Properties of High-Performance Concrete Incorporating Fibers and Algerian Natural Pozzolans in Chloride Attack. Int. J. Eng. Technol. Innov. 2022, 12, 247–259. [Google Scholar] [CrossRef]
  53. Elshinawy, A.; Yousry Elshikh, M.M.; Kaloop, M.R.; El-Demerdash, W.R.; Elemam, W.E. An Experimental Investigation on Mechanical Characteristics of Steel-fiber-reinforced Volcanic Concrete. Nex. Mater. 2025, 6, 100308. [Google Scholar] [CrossRef]
  54. Mehedi, M.T.; Sobuz, M.H.R.; Hasan, N.M.S.; Jabin, J.A.; Nijum, N.J.; Miah, M.J. High-strength Fiber Reinforced Concrete Production with Incorporating Volcanic Pumice Powder and Steel Fiber: Sustainability, Strength and Machine Learning Technique. Asian J. Civ. Eng. 2024, 25, 6171–6187. [Google Scholar] [CrossRef]
  55. Nakai, I.; Izumi, F. Practical Application of Powder X-Ray Analysis, 3rd ed.; Asakura Publishing Co., Ltd.: Tokyo, Japan, 2021. (In Japanese) [Google Scholar]
  56. Shimoyama, Y. Present State of Agent and Materials for Preventing Sludge Discharge in Centrifugal Casting. Concr. J. 1996, 34, 16–22. (In Japanese) [Google Scholar] [CrossRef]
  57. Ba, M.; Qian, C.; Guo, X.; Han, X. Effects of steam curing on strength and porous structure of concrete with low water/binder ratio. Constr. Build. Mater. 2011, 25, 123–128. [Google Scholar] [CrossRef]
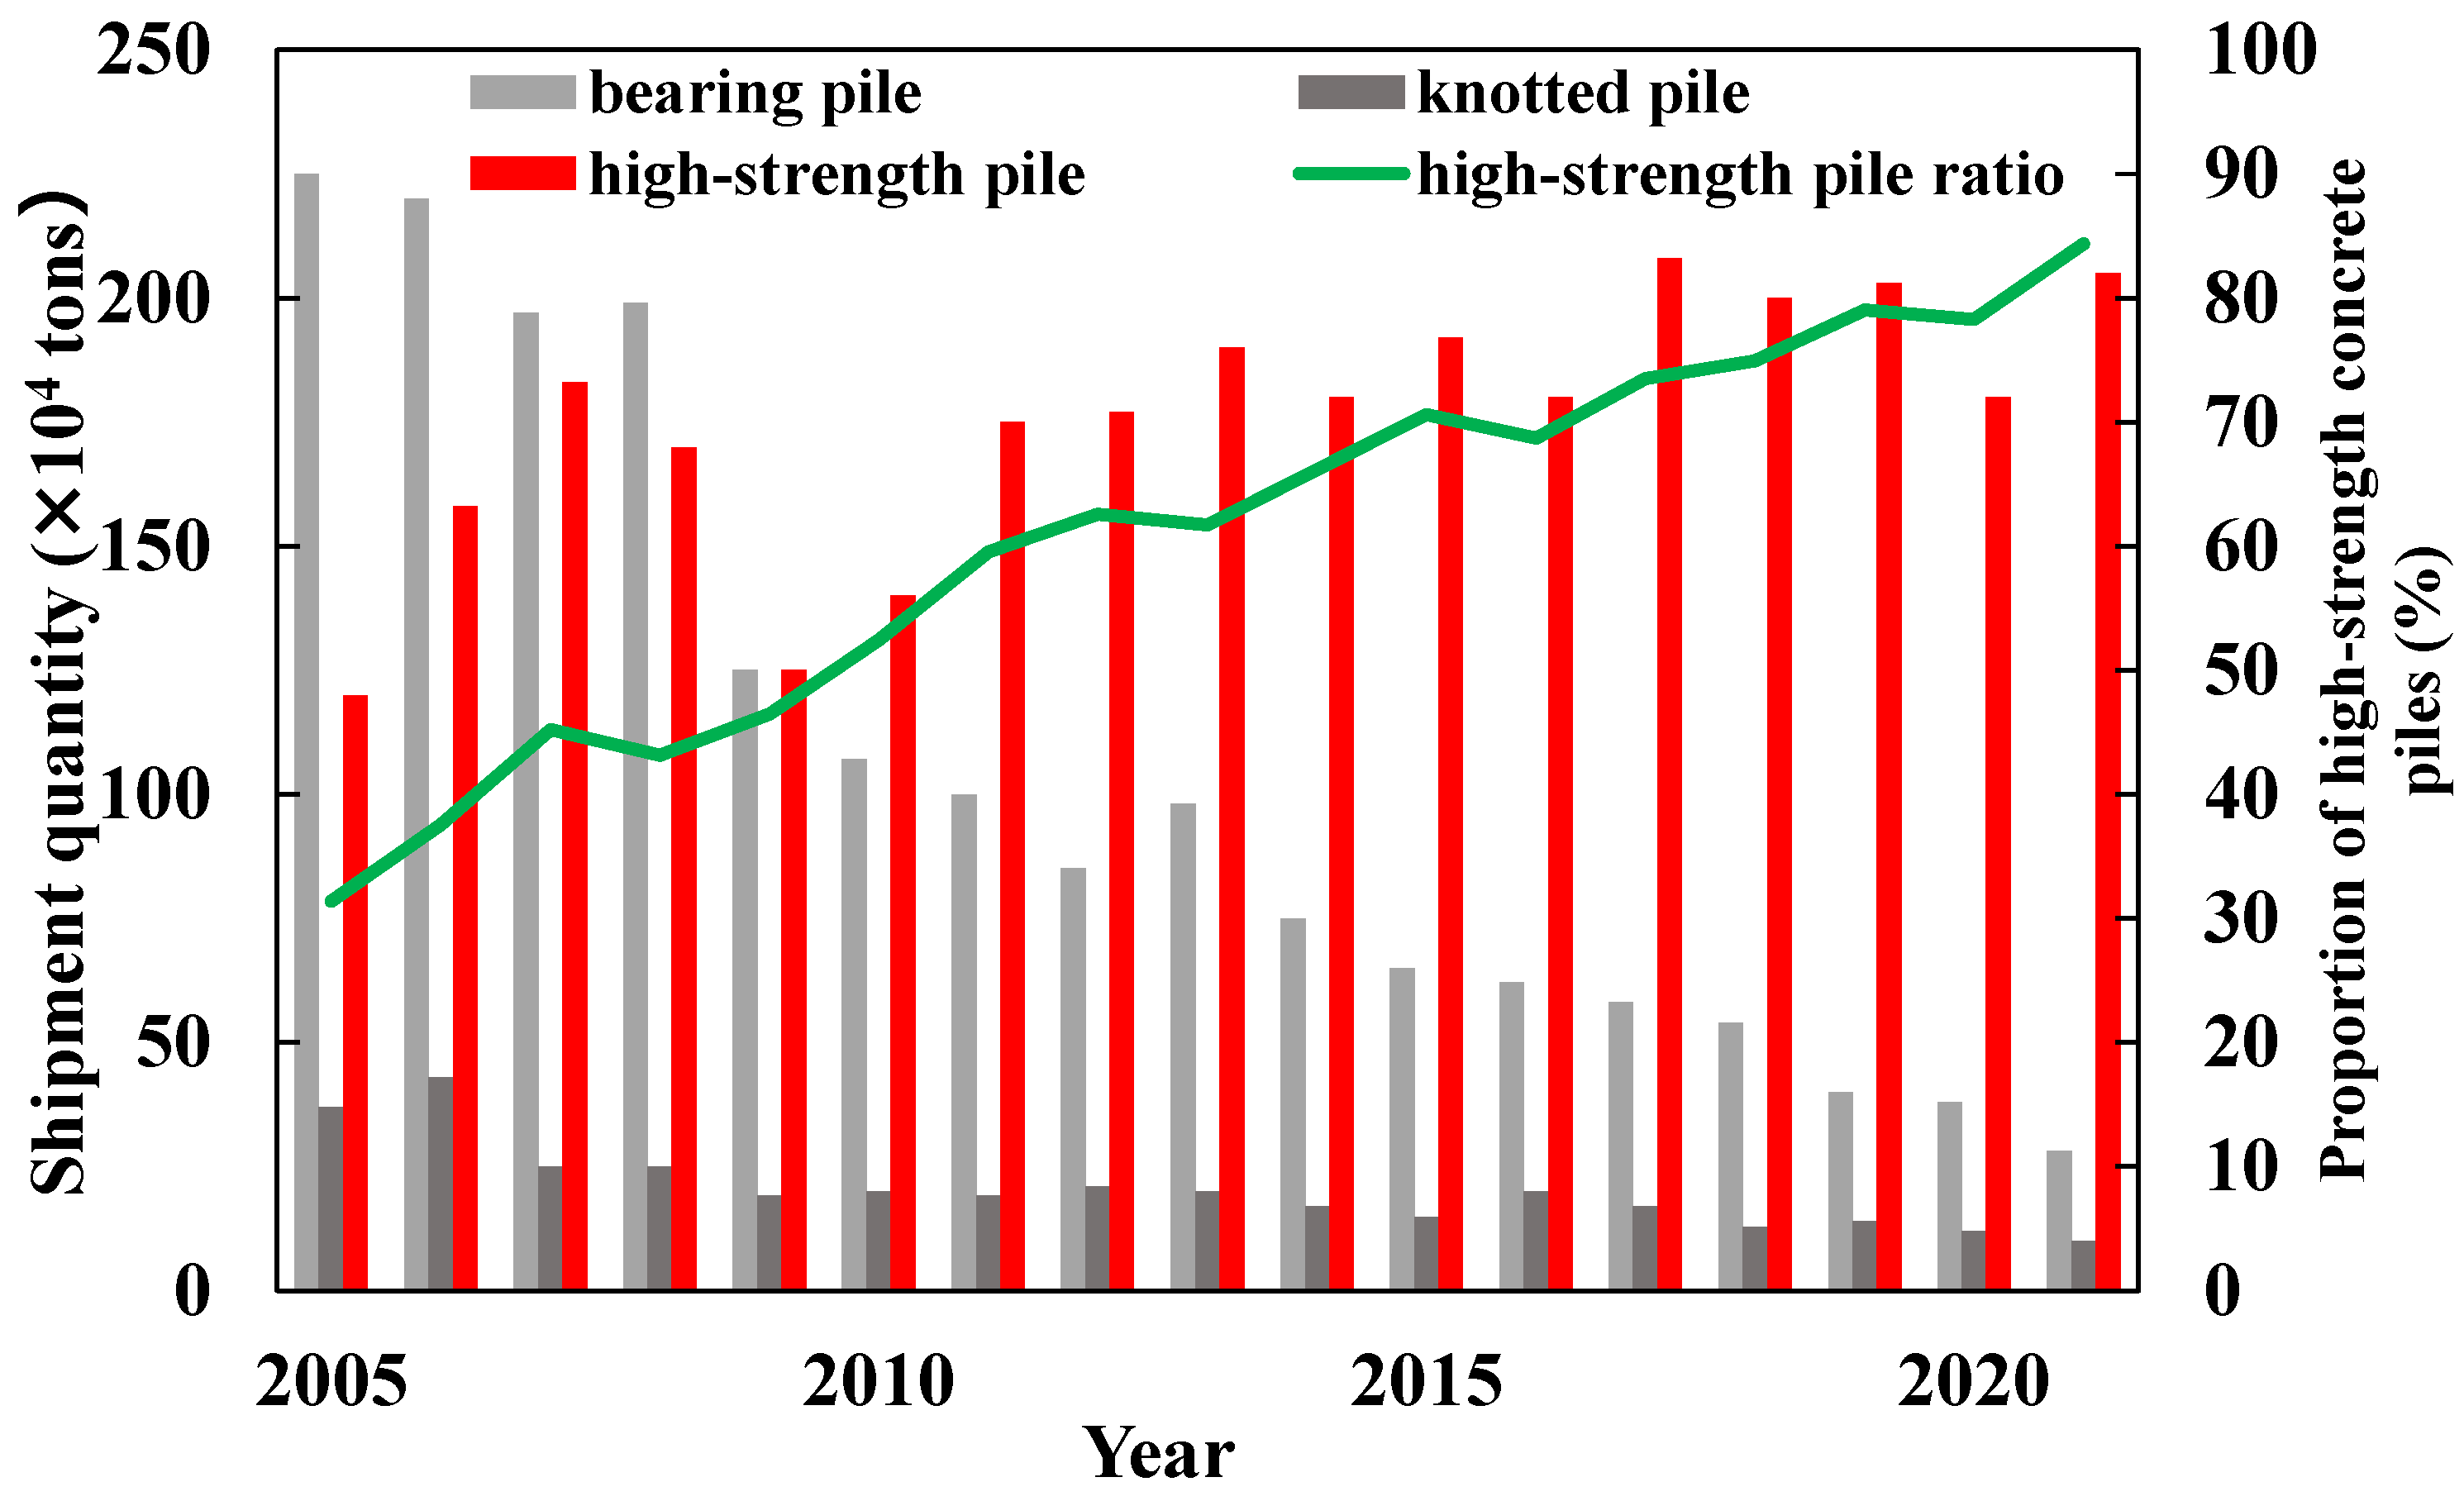
Figure 1. Demand trend based on the type of precast concrete piles [1].
Applsci 15 03644 g001
Figure 2. Appearance and SEM images of binders. (a) Appearance of OPC; (b) appearance of VG; (c) appearance of SF; (d) SEM image of OPC; (e) SEM image of VG; (f) SEM image of SF.
Applsci 15 03644 g002
Figure 3. XRD patterns of binders.
Applsci 15 03644 g003
Figure 4. Particle-size distributions of binders.
Applsci 15 03644 g004
Figure 5. Mortar mixer.
Applsci 15 03644 g005
Figure 6. Mixing condition for the mortar.
Applsci 15 03644 g006
Figure 7. Concrete mixer.
Applsci 15 03644 g007
Figure 8. Steam chamber.
Applsci 15 03644 g008
Figure 9. Steam curing programs.
Applsci 15 03644 g009
Figure 10. Change in the mortar flow values.
Applsci 15 03644 g010
Figure 11. Relationship between mortar compressive strength at different curing temperatures (curing age 1 d).
Applsci 15 03644 g011
Figure 12. Relationship between mortar compressive strength at different curing temperatures (curing age 7 d).
Applsci 15 03644 g012
Figure 13. Pores on the mortar specimens. (a) VG20, curing temperature of 80 °C; (b) SF20, curing temperature of 80 °C.
Applsci 15 03644 g013
Figure 14. Relation between the activity index and maturity index in VG.
Applsci 15 03644 g014
Figure 15. Relation between the activity index and maturity index in SF.
Applsci 15 03644 g015
Figure 16. Relationship between compressive strength increase rate and maturity index.
Applsci 15 03644 g016
Figure 17. Relation between curing age and compressive strength of VG20-70 concrete.
Applsci 15 03644 g017
Figure 18. Comparison of Young’s modulus of concrete.
Applsci 15 03644 g018
Figure 19. XRD patterns of cement pastes (1 d).
Applsci 15 03644 g019
Figure 20. Cumulative and incremental pore diameter distribution of cement pastes (1 d). (a) Water curing (20 °C); (b) steam curing (70 °C).
Applsci 15 03644 g020
Figure 21. SEM images of cement pastes (1 d). (a) OPC-70; (b) VG20-70; (c) SF10-70.
Applsci 15 03644 g021
Table 1. Properties of materials.
MaterialApplicable Standards, Physical Properties
(Manufacturing Company, Location)
Ordinary Portland cementJIS R 5210: 2019, density: 3.16 g/cm3, BET surface area: 0.326 m2/g
(Tokuyama Corporation, Shunan, Japan)
Fine volcanic glass powderJIS A 6209: 2020, Type I, density: 2.37 g/cm3, BET surface area: 9.5 m2/g
(Principle Co., Ltd., Kagoshima, Japan)
Silica fumeJIS A 6207: 2016, density: 2.26 g/cm3, BET surface area: 16.5 m2/g
(Egyptian Ferroalloys Co., Cairo, Egypt)
WaterTap water
SuperplasticizerJIS A 6204: 2011, Type I, Polycarboxylic acid-based, SF500U
(Flowric Co., Ltd., Toshima-ku, Japan)
Fine aggregateJIS A 5005: 2020, Crushed sand, density: 2.61 g/cm3, Fineness modulus: 3.02 (Nanshu saiseki Co., Ltd., Hioki, Japan),
Coarse aggregateJIS A 5005: 2020, Crushed stone, density: 2.66 g/cm3, Fineness modulus: 6.64, aggregate crushing value: 9.1% (BS812-110)
(Nanshu saiseki Co., Ltd., Hioki, Japan),
Table 2. Chemical composition of binders.
SiO2Al2O3CaOFe2O3Na2OK2OMgOOthers
OPC16.94.6170.03.000.260.471.383.38
VG73.713.81.942.373.513.950.320.41
SF95.40.320.521.950.440.590.450.18
SiO2: silicon dioxide, Al2O3: aluminum oxide, CaO: calcium oxide, Fe2O3: iron (III) oxide, Na2O: sodium oxide, K2O: potassium oxide, MgO: magnesium oxide.
Table 3. Mix proportions.
NameW/BUnit Content (kg/m3)
WBSGSP
OPCVGSF
OPC151208000070190012
VG1016720600
VG206401200
VG50184003000
SF1016720057
SF206400114
SF50184000286
W/B: water-to-binder ratio, W: water, B: binder, OPC: ordinary Portland cement, VG: fine volcanic glass powder, SF: silica fume, S: fine aggregate (sand), G: coarse aggregate (gravel), SP: superplasticizer.
Disclaimer/Publisher’s Note: The statements, opinions and data contained in all publications are solely those of the individual author(s) and contributor(s) and not of MDPI and/or the editor(s). MDPI and/or the editor(s) disclaim responsibility for any injury to people or property resulting from any ideas, methods, instructions or products referred to in the content.