


Unveiling Driving Risks and Geometric Parameter Relationships in Urban Underground Road Curves: A Real Vehicle Experiment


Abstract
Featured Application
Abstract
1. Introduction
- (1)
- The acceleration cumulative frequency distribution characteristics of curves on urban underground roads and the comfort and stability of driving on each curve were obtained based on the collected continuous vehicle operation data (lateral and longitudinal accelerations).
- (2)
- The driving behavior risk of curves on urban underground roads was analyzed based on the acceleration data and driver risk model, and the areas with the highest driving risk on these curves were identified. Meanwhile, the safety improvement methods on risk curves were discussed. The findings provide valuable insights for traffic management authorities to develop safety improvement measures, and they serve as a reference for accident prevention efforts.
- (3)
- The correlations and sensitivities between the lateral acceleration, entering curve deceleration, exiting curve acceleration, and curve geometry parameters were obtained separately based on the acceleration and curve geometry parameter data. The findings provide a reference for selecting geometric indicators for future construction of underground road curves.
2. Literature Review
3. Materials and Methods
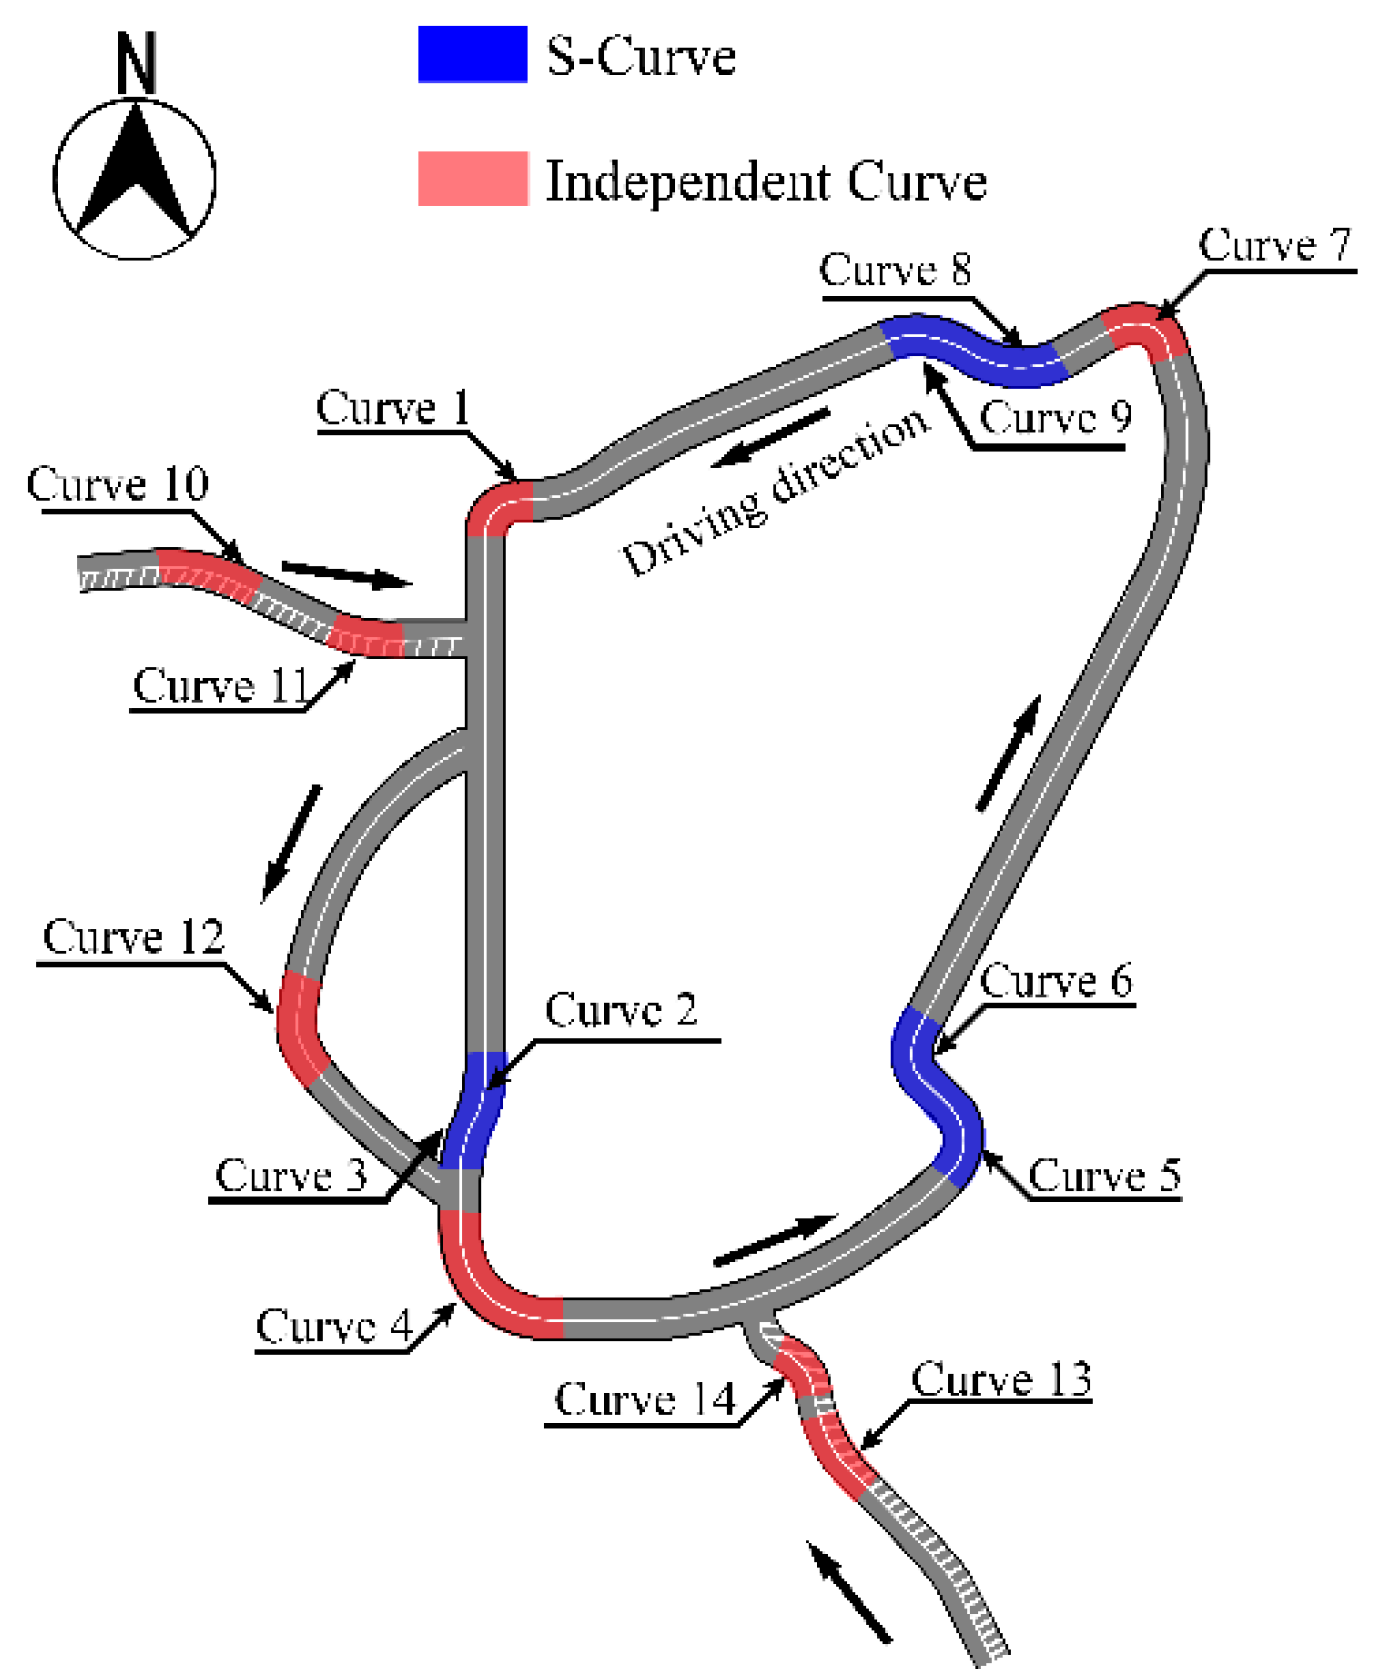
3.1. Research Object

| Curve Numbers | Radius (m) | Slope (%) | Angle (°) | (km·h−1) | Illuminance (Lux) | |
|---|---|---|---|---|---|---|
| Extreme small radius curves | Curve 1 | 35 | 5.90% | 90 | 20.52 | 127.3 |
| Curve 5 | 45 | 3.60% | 89 | 34.30 | 118.5 | |
| Curve 6 | 48 | 3.60% | 75 | 30.94 | 121.3 | |
| Curve 7 | 30 | 3.90% | 85 | 21.51 | 118.9 | |
| Curve 9 | 60 | 5.90% | 46 | 23.27 | 133.1 | |
| Curve 14 | 50 | 5.90% | 54 | 34.90 | 122.4 | |
| General small radius curves | Curve 4 | 85 | −3.00% | 82 | 38.53 | 125.9 |
| Curve 8 | 115 | −2.70% | 50 | 26.34 | 108.9 | |
| Curve 12 | 85 | −3.20% | 69 | 44.26 | 106.3 | |
| Curve 13 | 120 | 5.90% | 40 | 41.41 | 108.3 | |
| Ordinary radius curves | Curve 2 | 200 | 1.00% | 38 | 34.76 | 114.8 |
| Curve 3 | 200 | −0.90% | 38 | 35.24 | 113.6 | |
| Curve 10 | 175 | 4.20% | 35 | 39.25 | 115.4 | |
| Curve 11 | 200 | 2.85% | 24 | 42.63 | 112.2 |
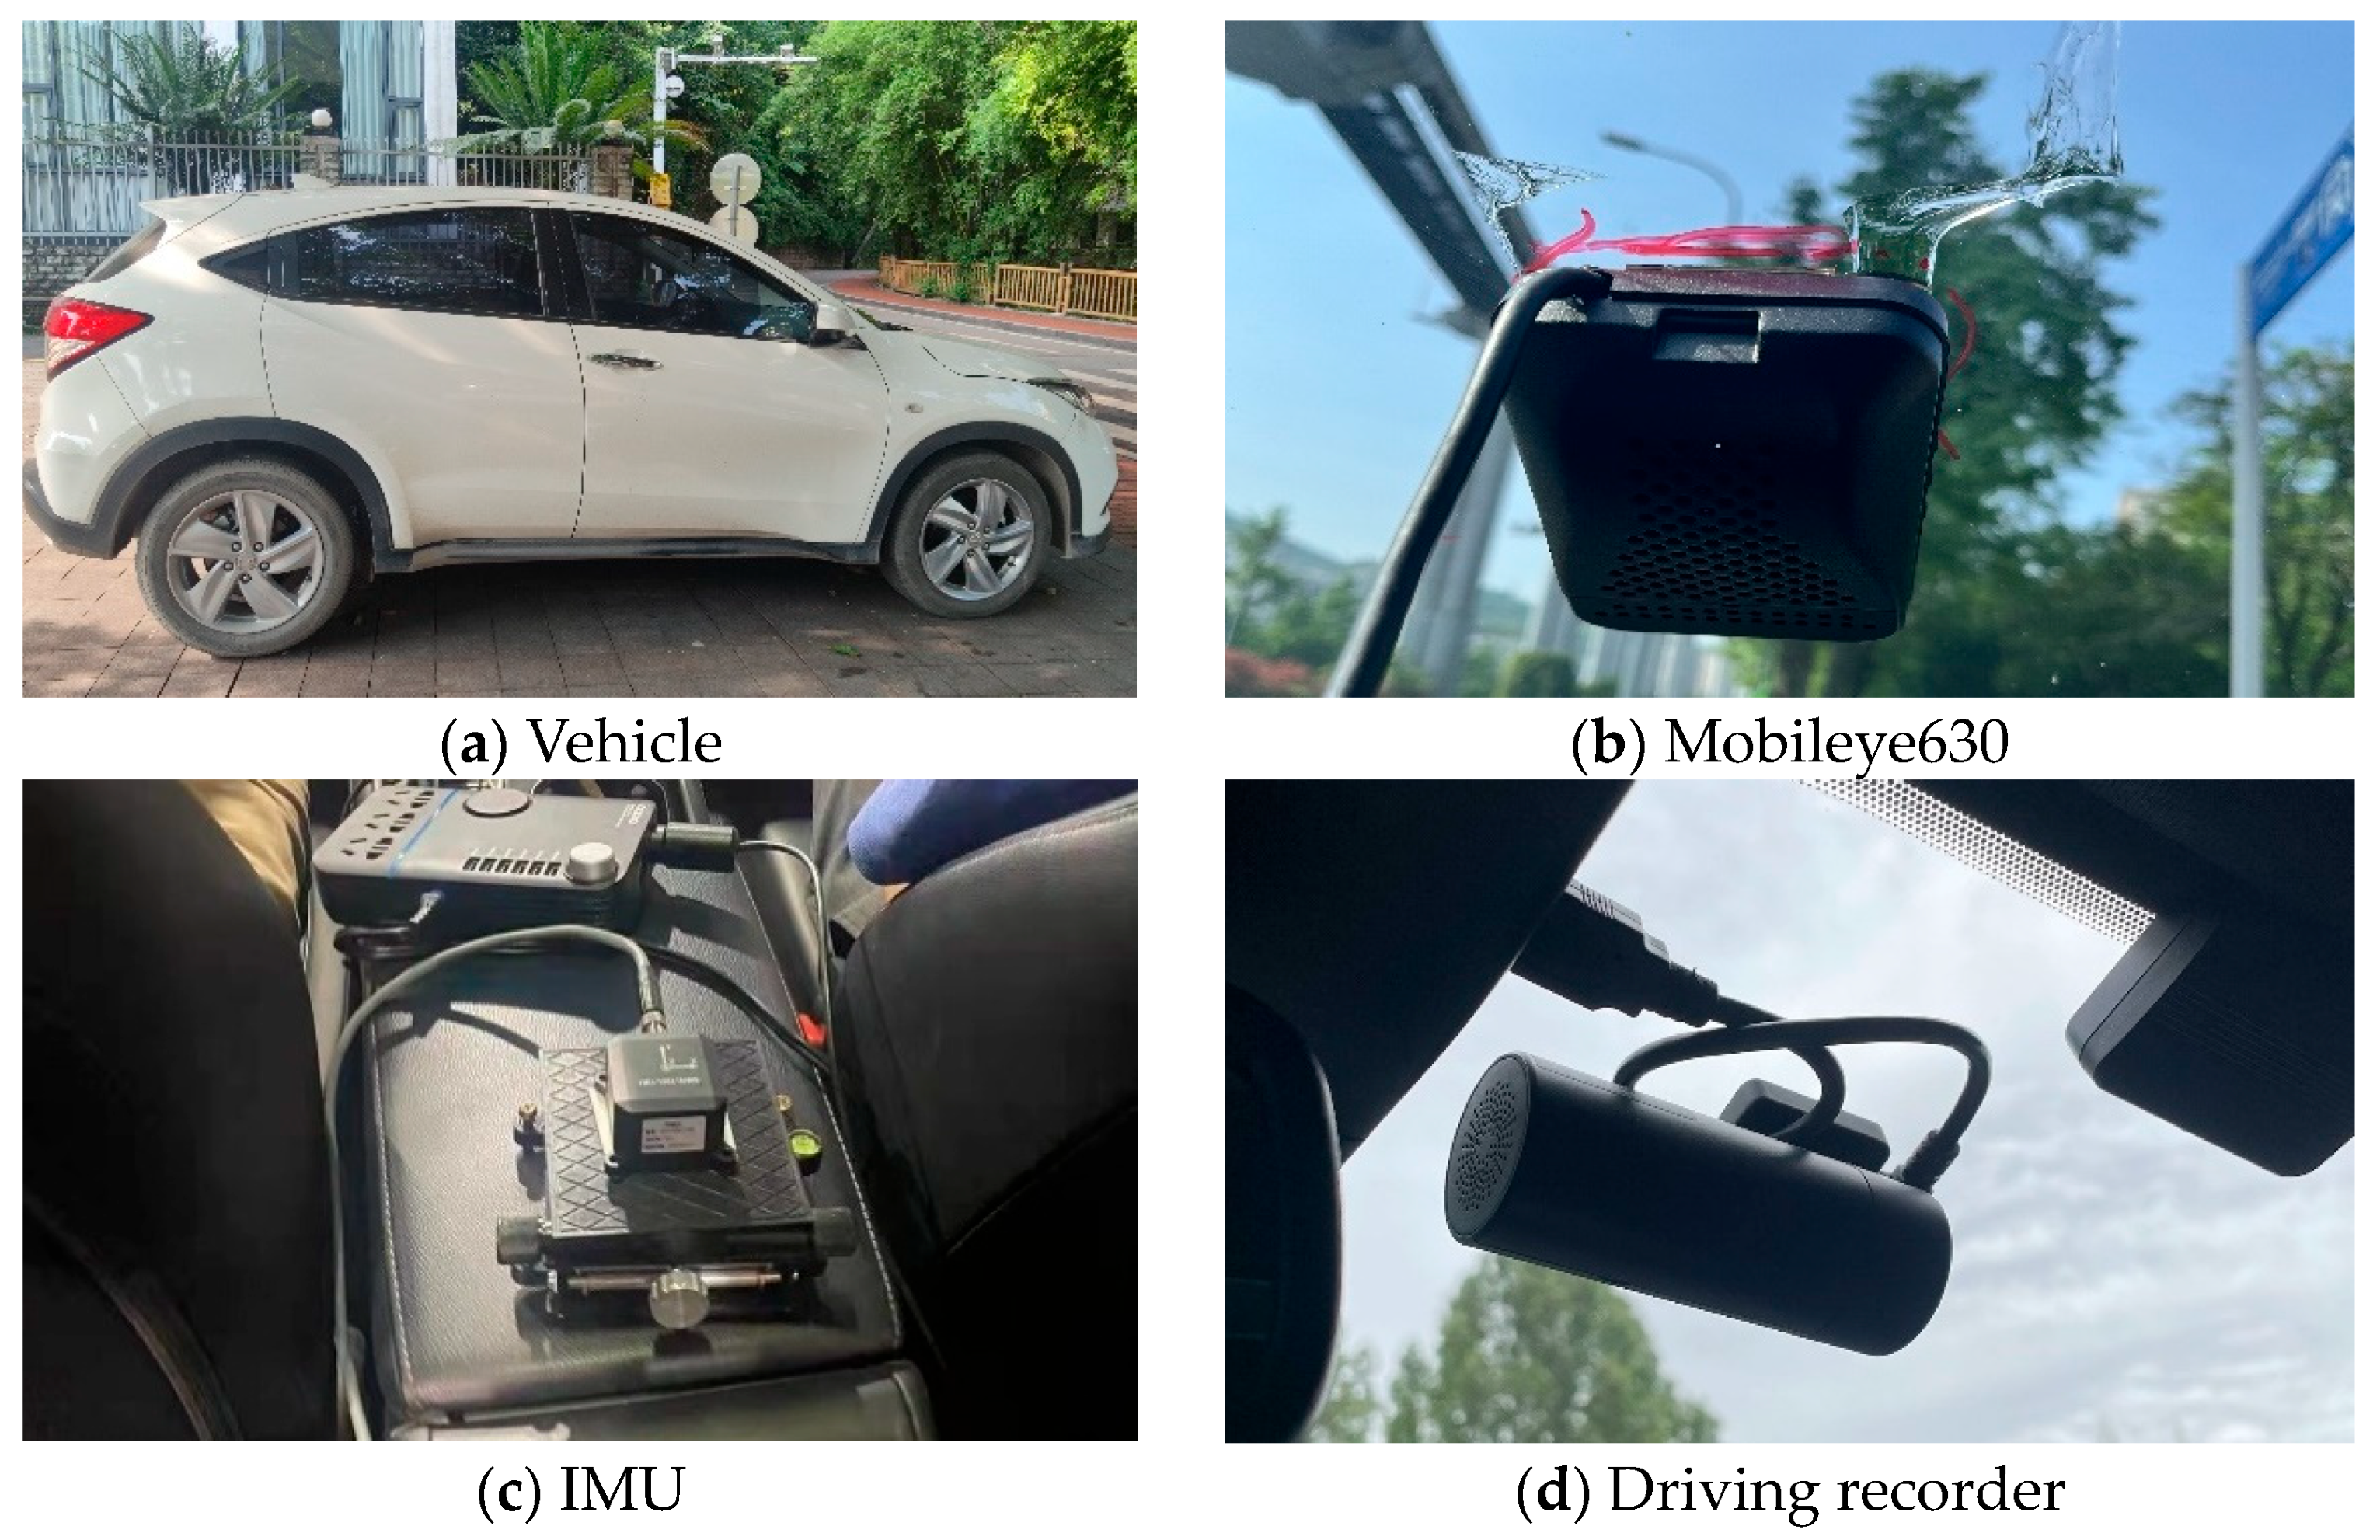
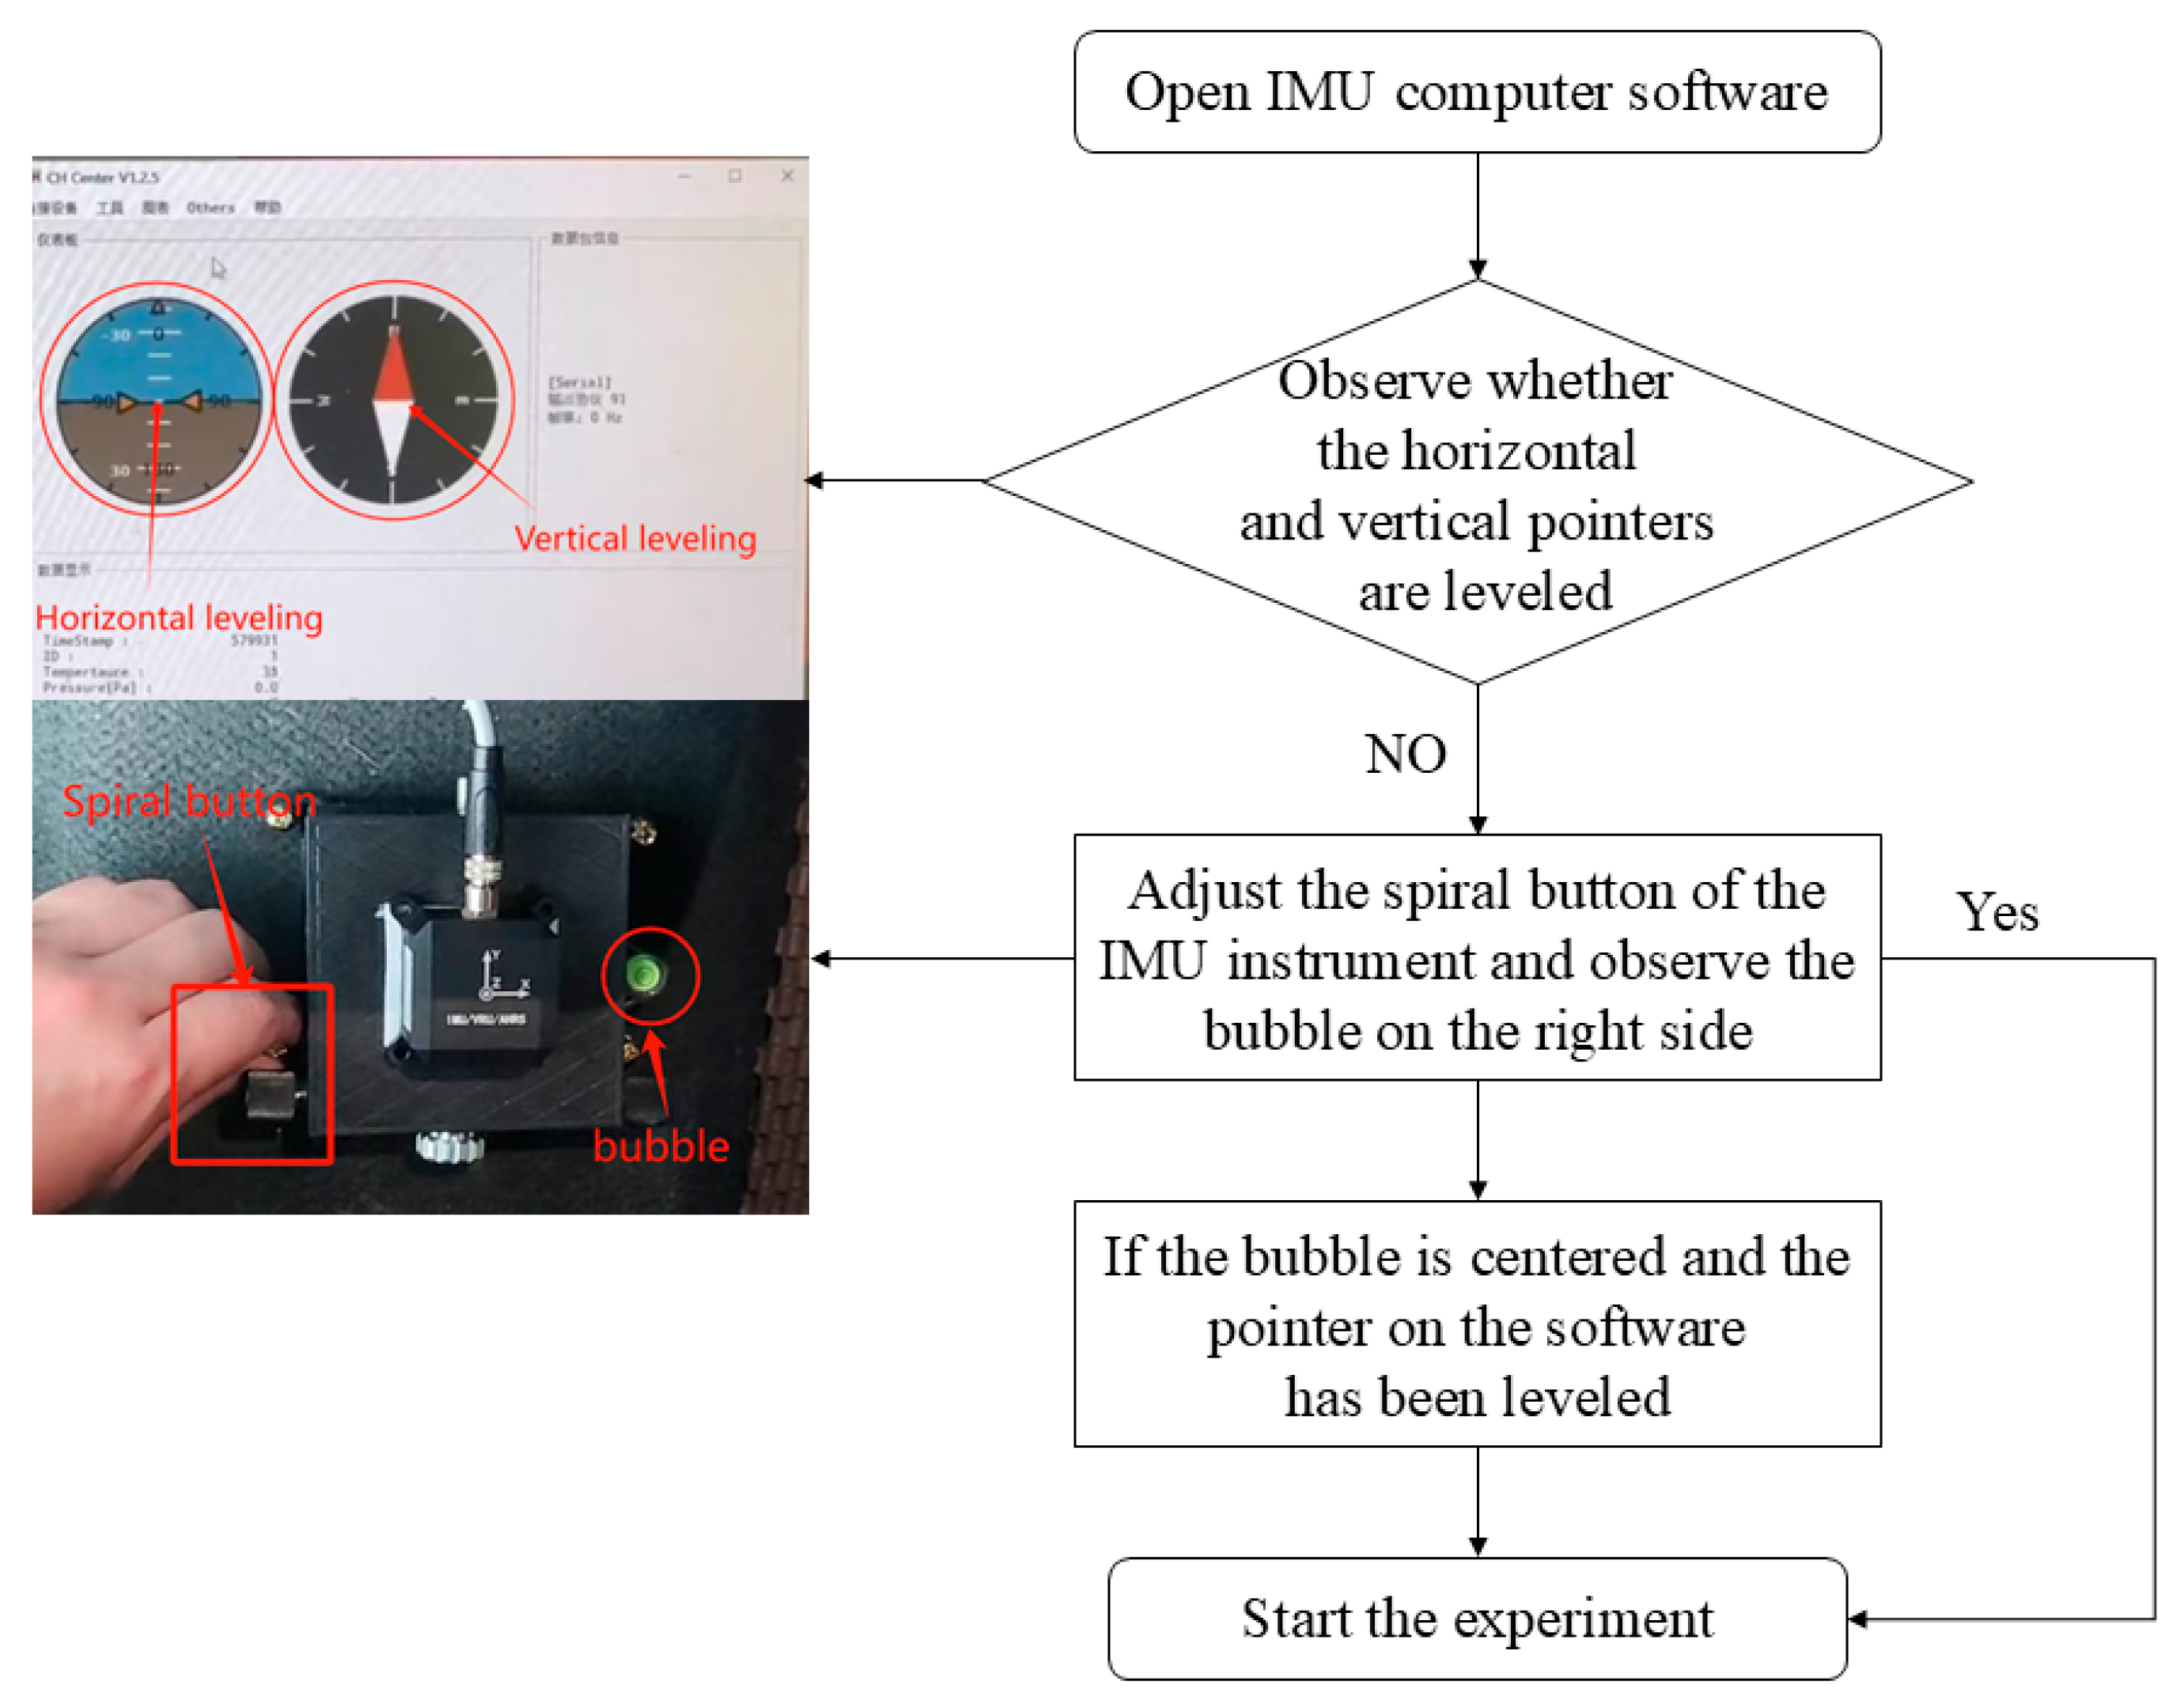
3.2. Test Vehicles and Instruments
3.3. Experimental Driver
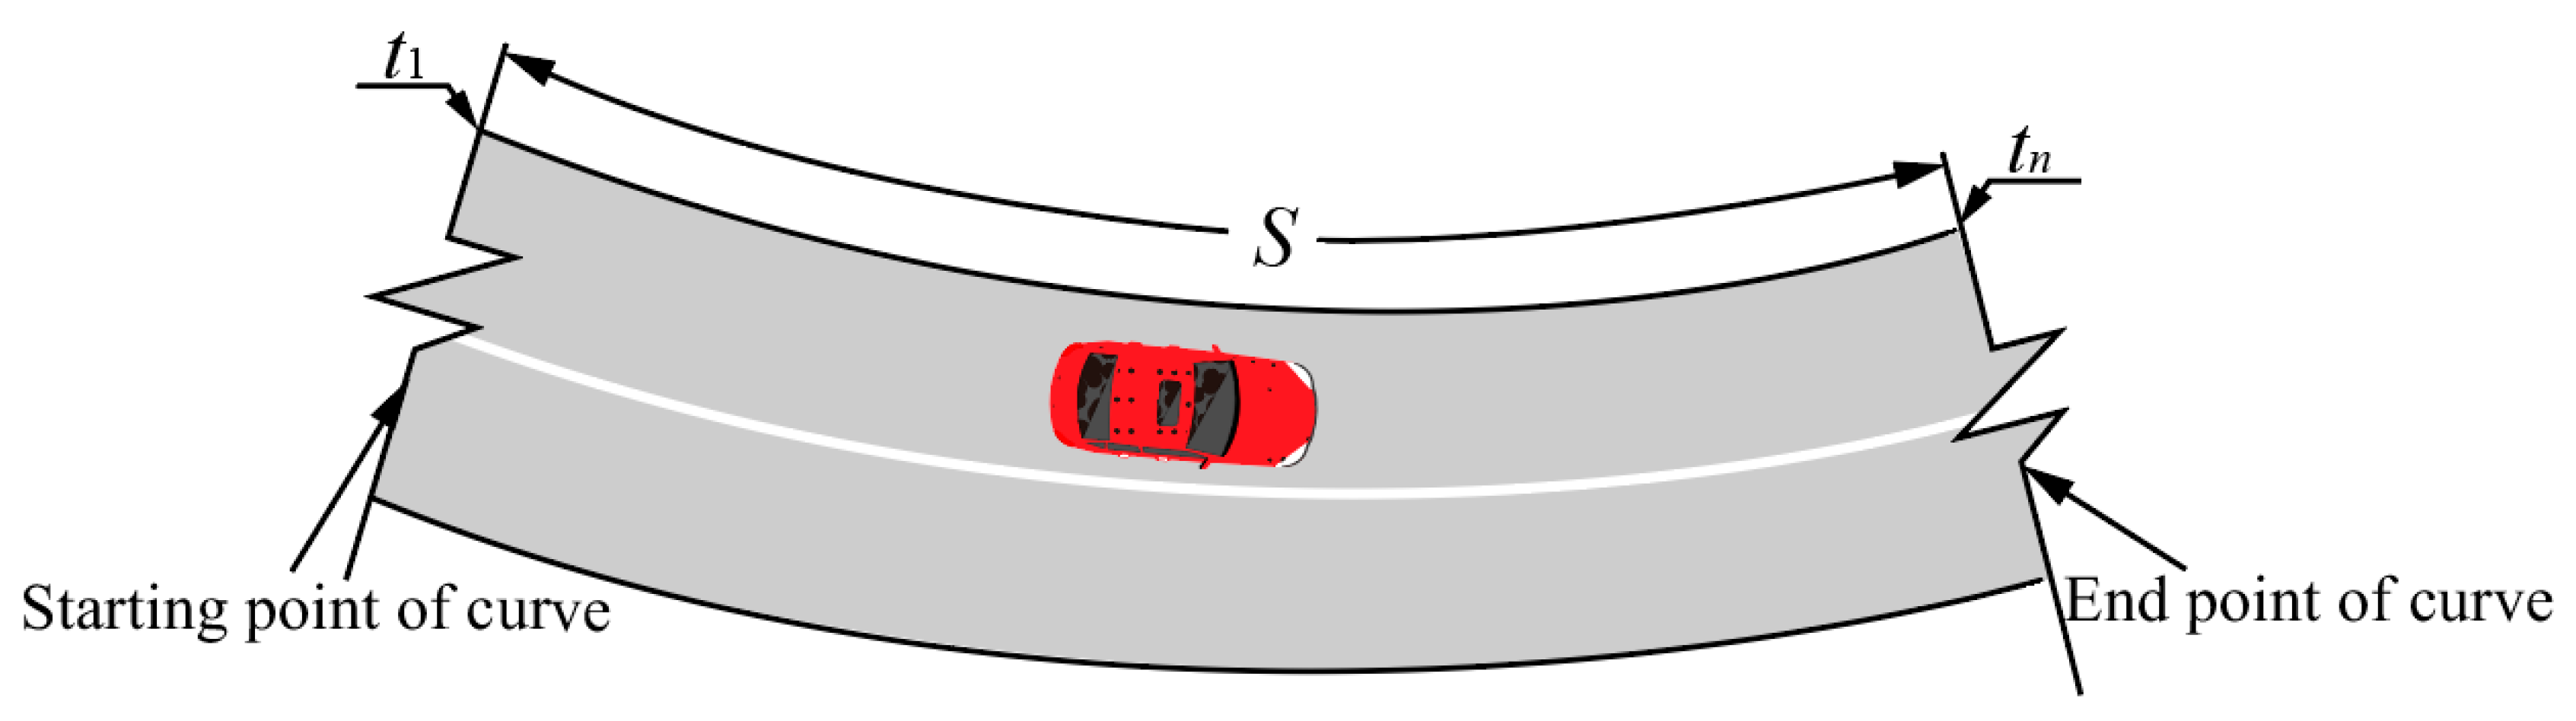
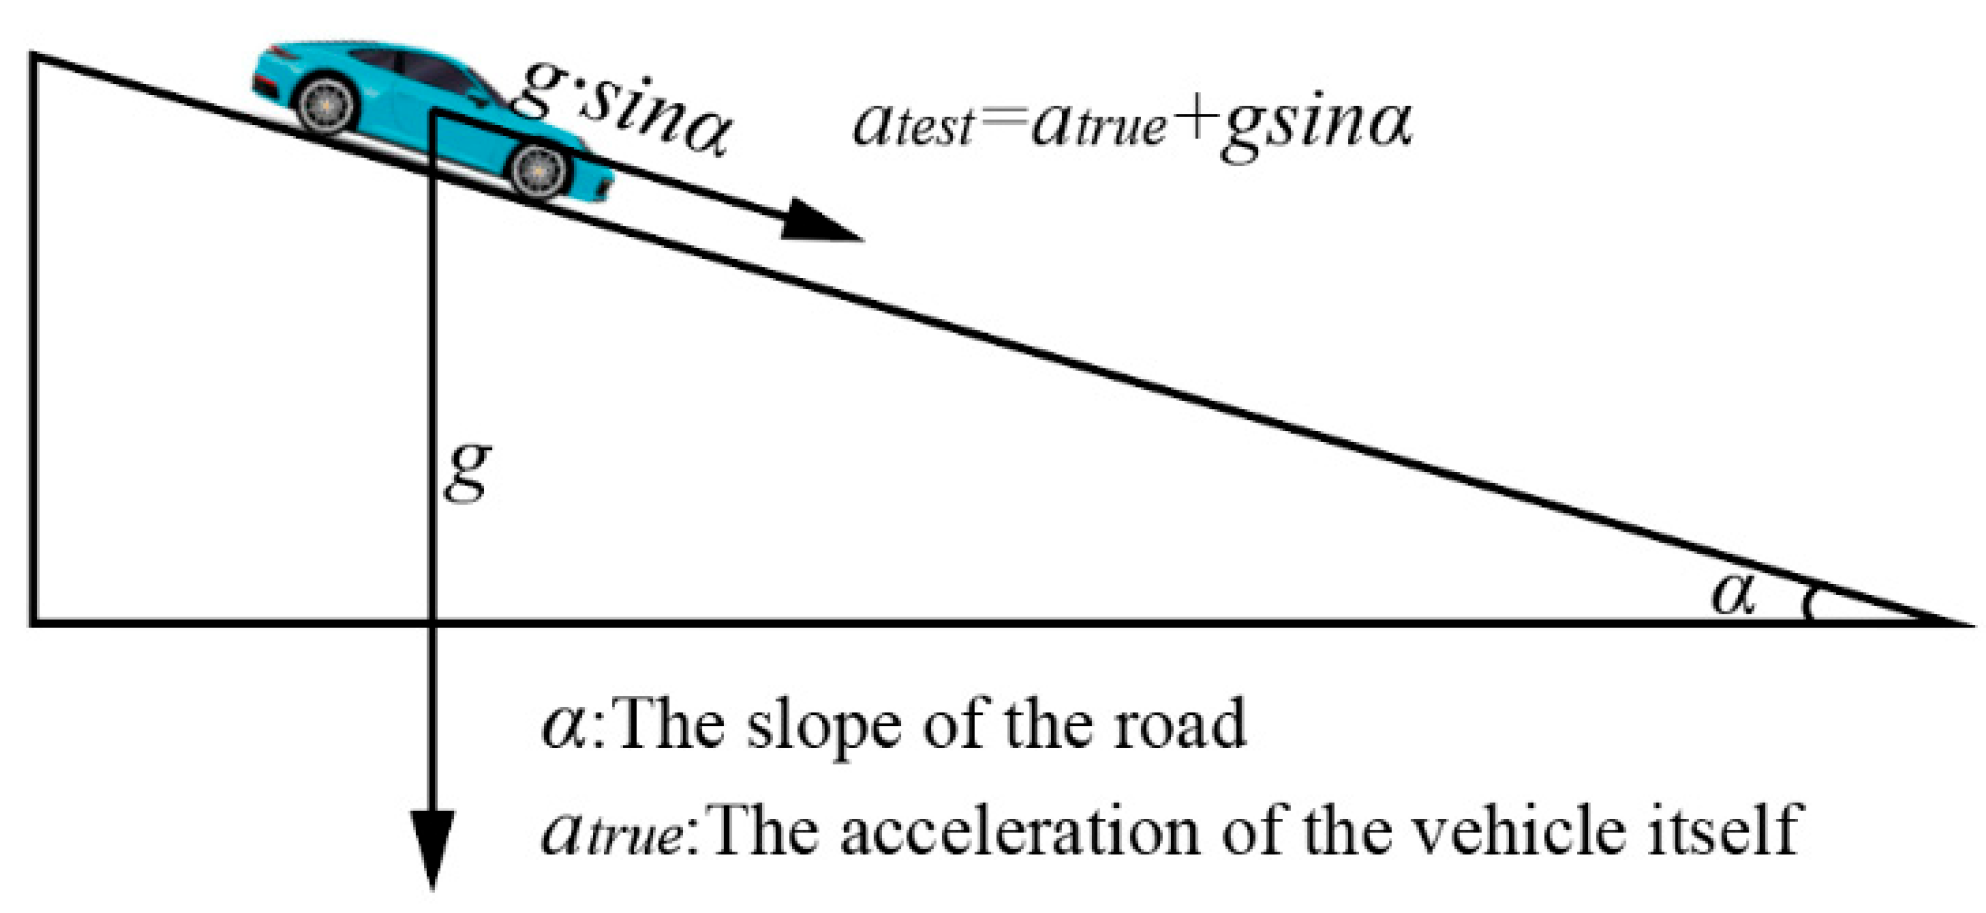
3.4. Interpretation and Collection of Data
4. Results
4.1. Significant Test for Acceleration Difference
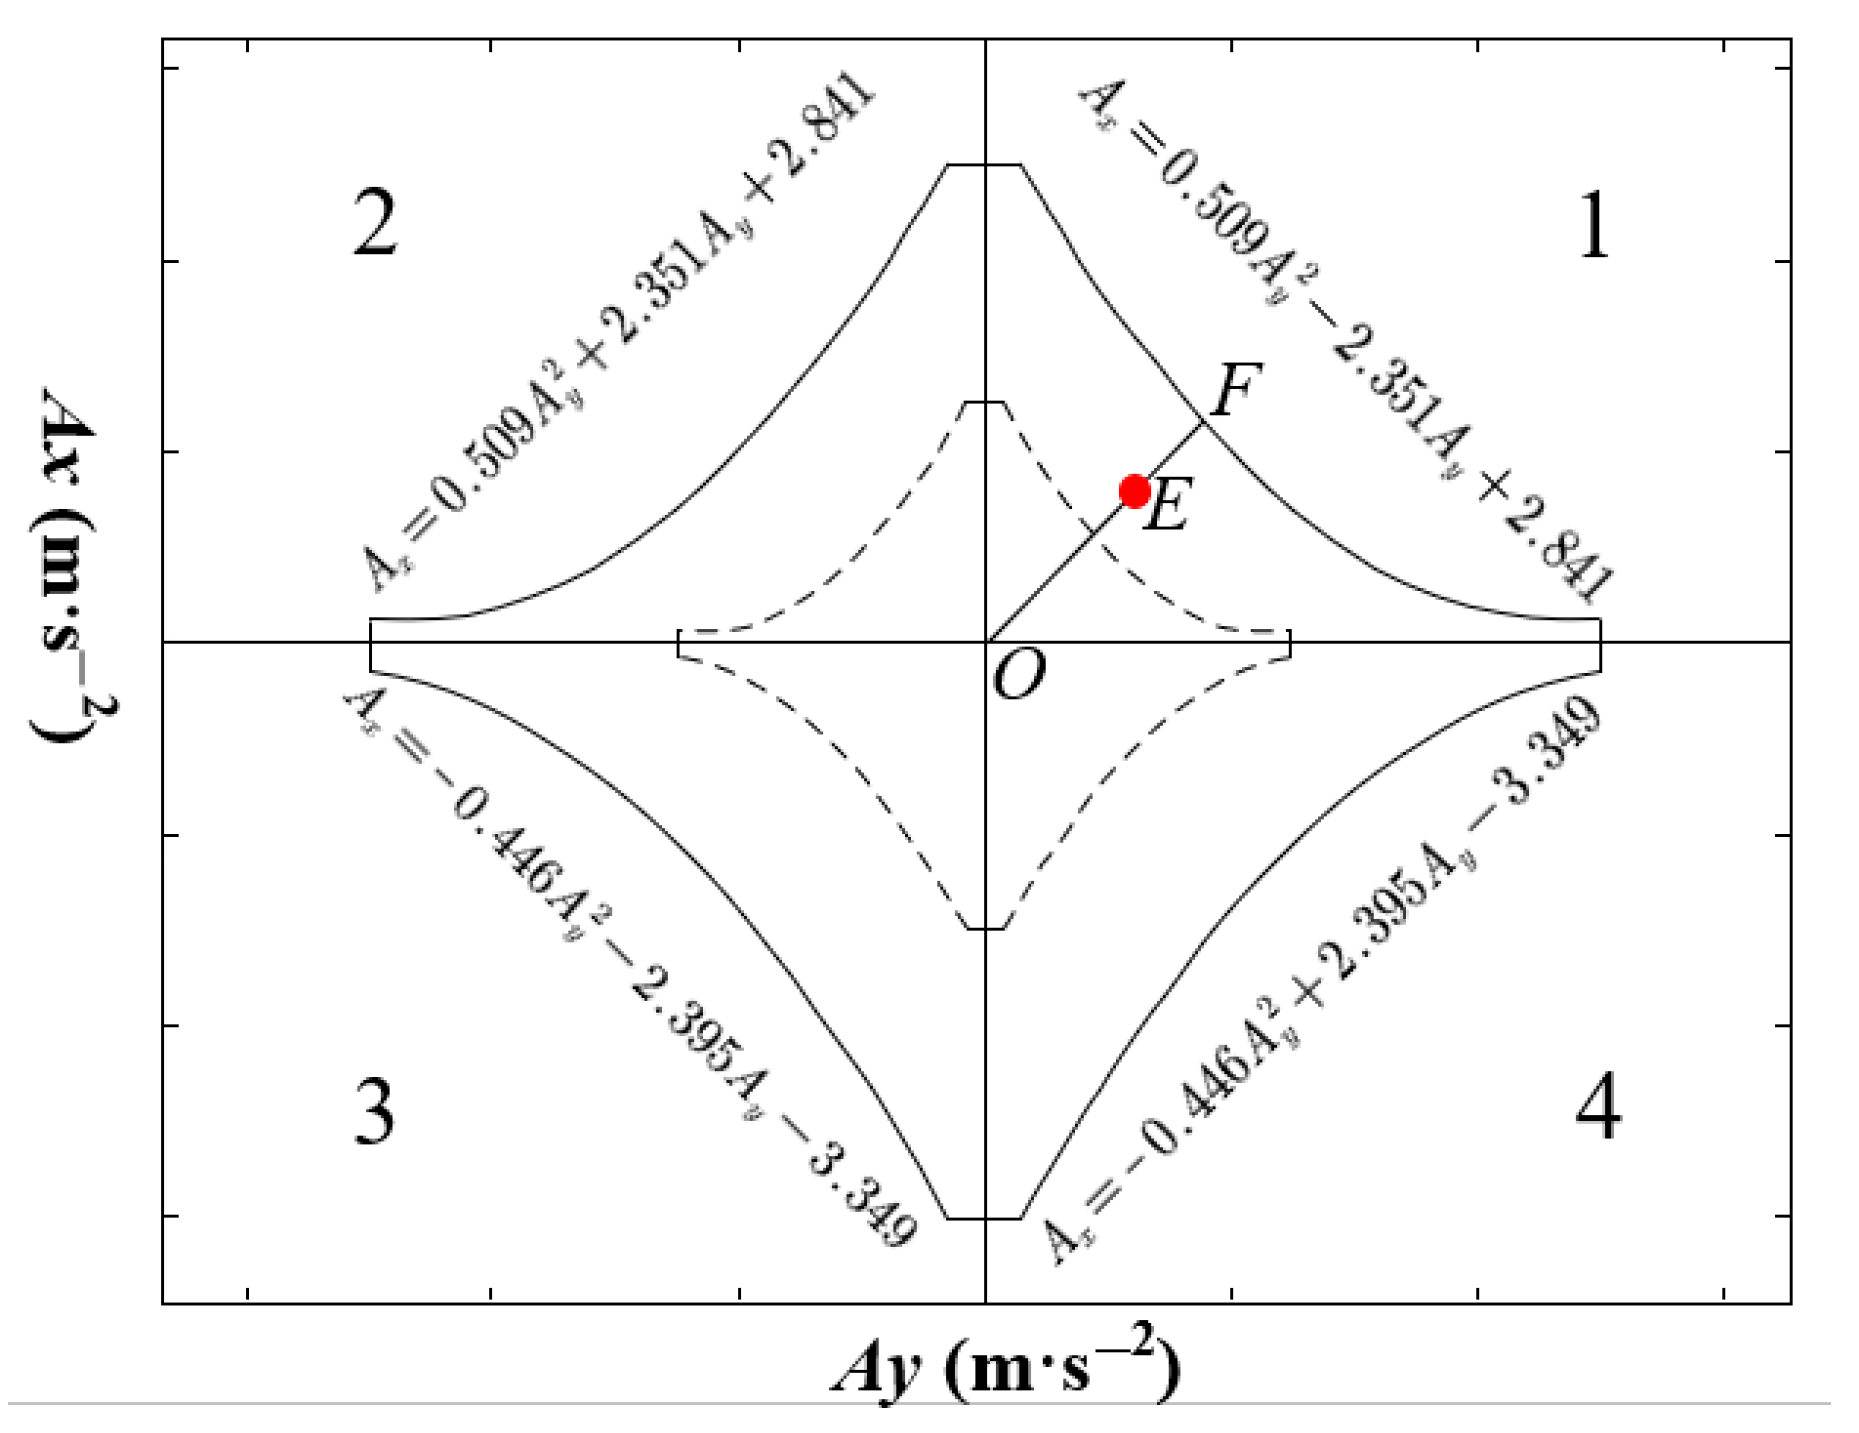
4.2. Driving Risk Model
4.2.1. Driving Risk Model and Its Distribution Characteristics
4.2.2. Significant Difference Test of Driving Risk Points
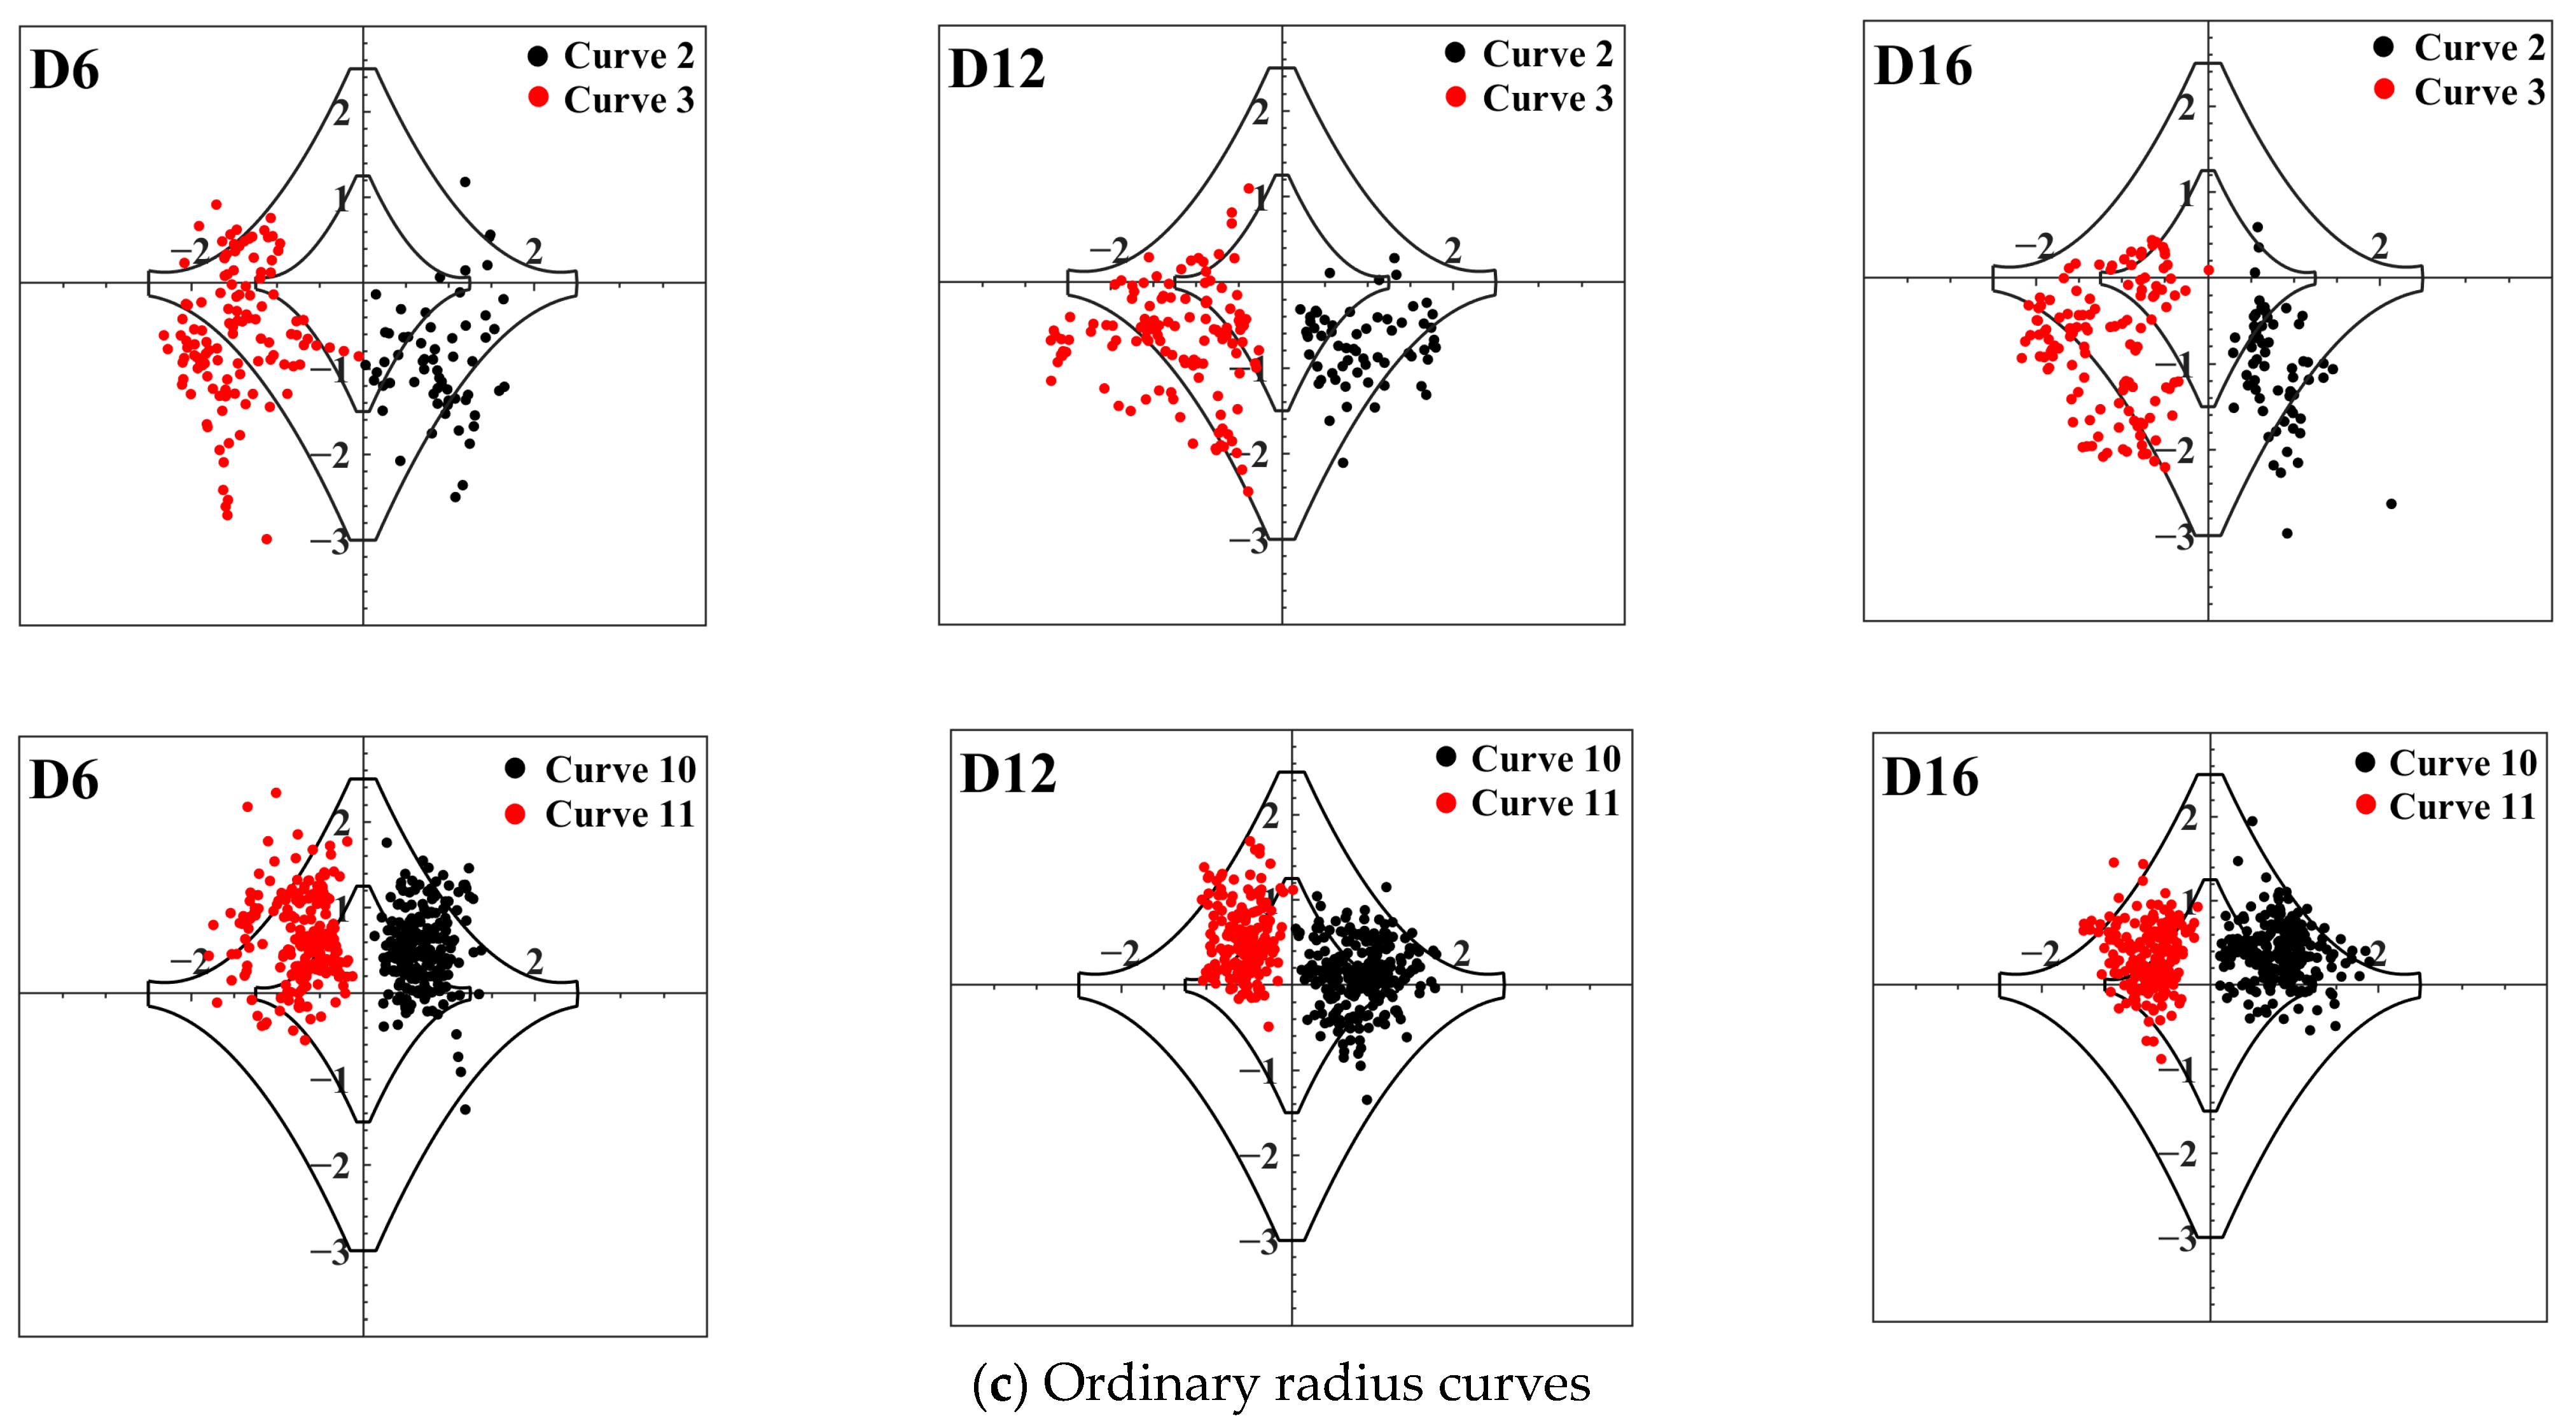
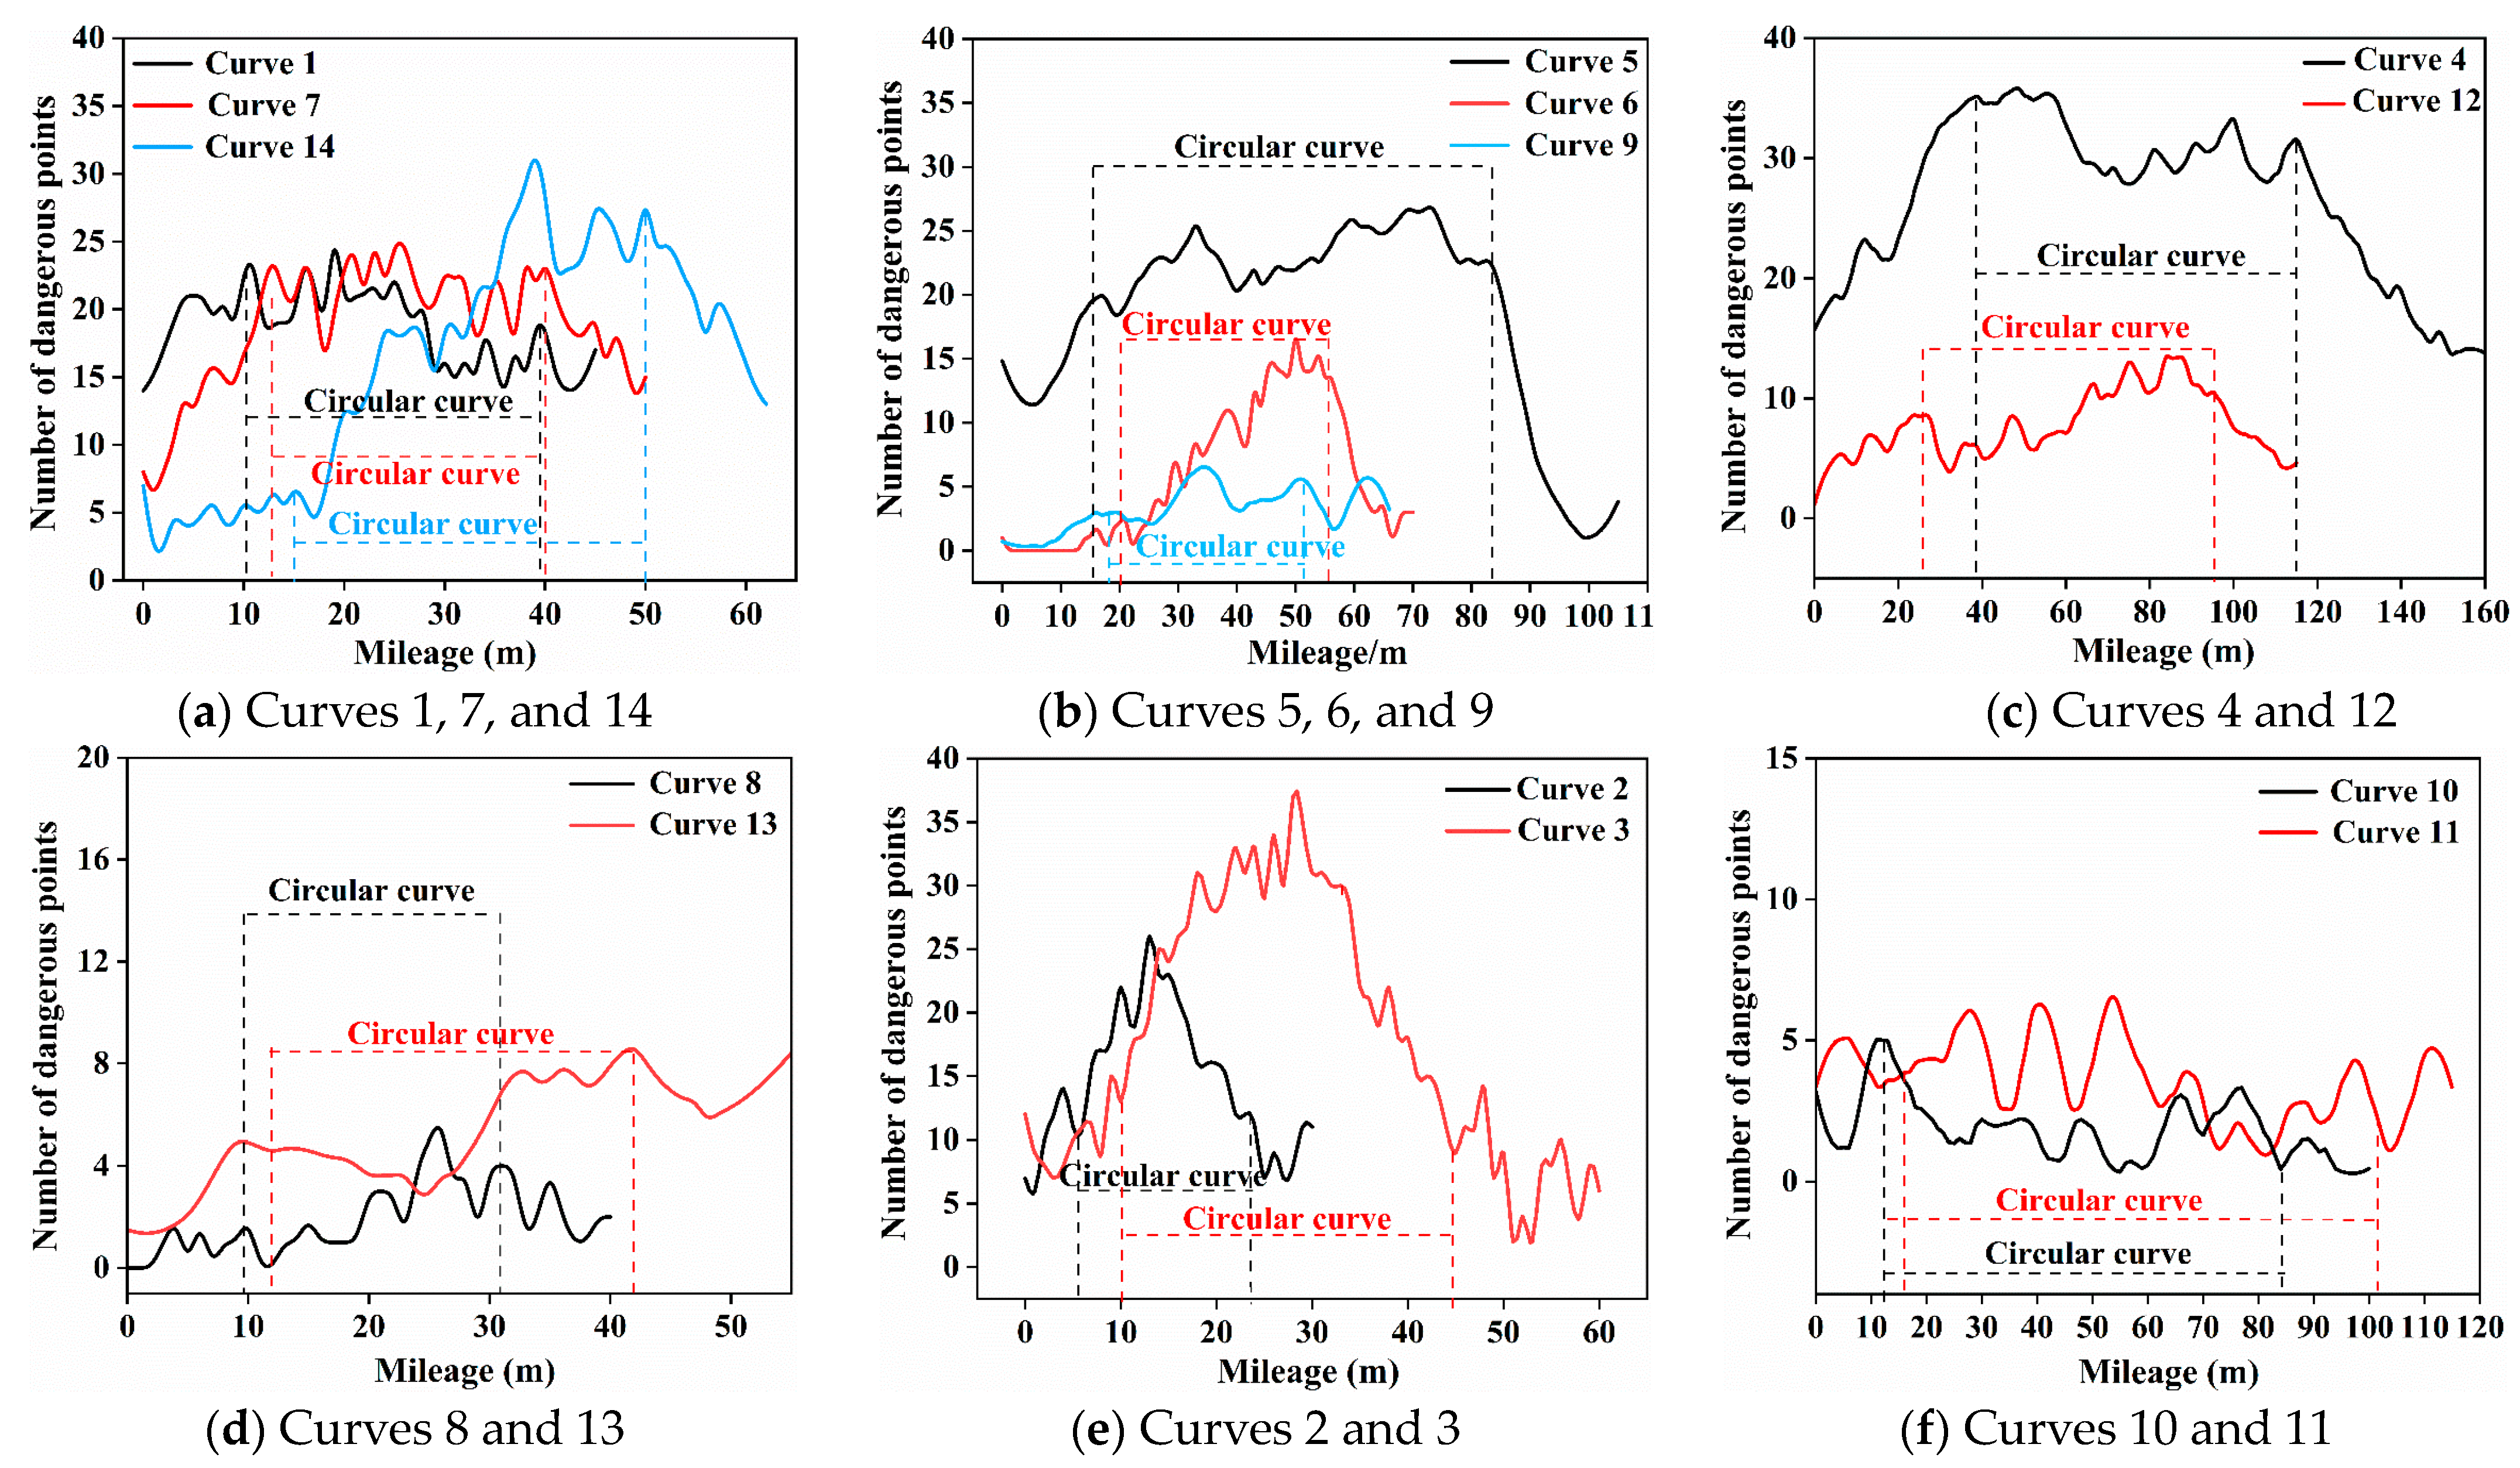
4.2.3. Curve Distribution Characteristics of Risky Driving Behavior
4.3. Sensitivity of Acceleration to Curve Parameters
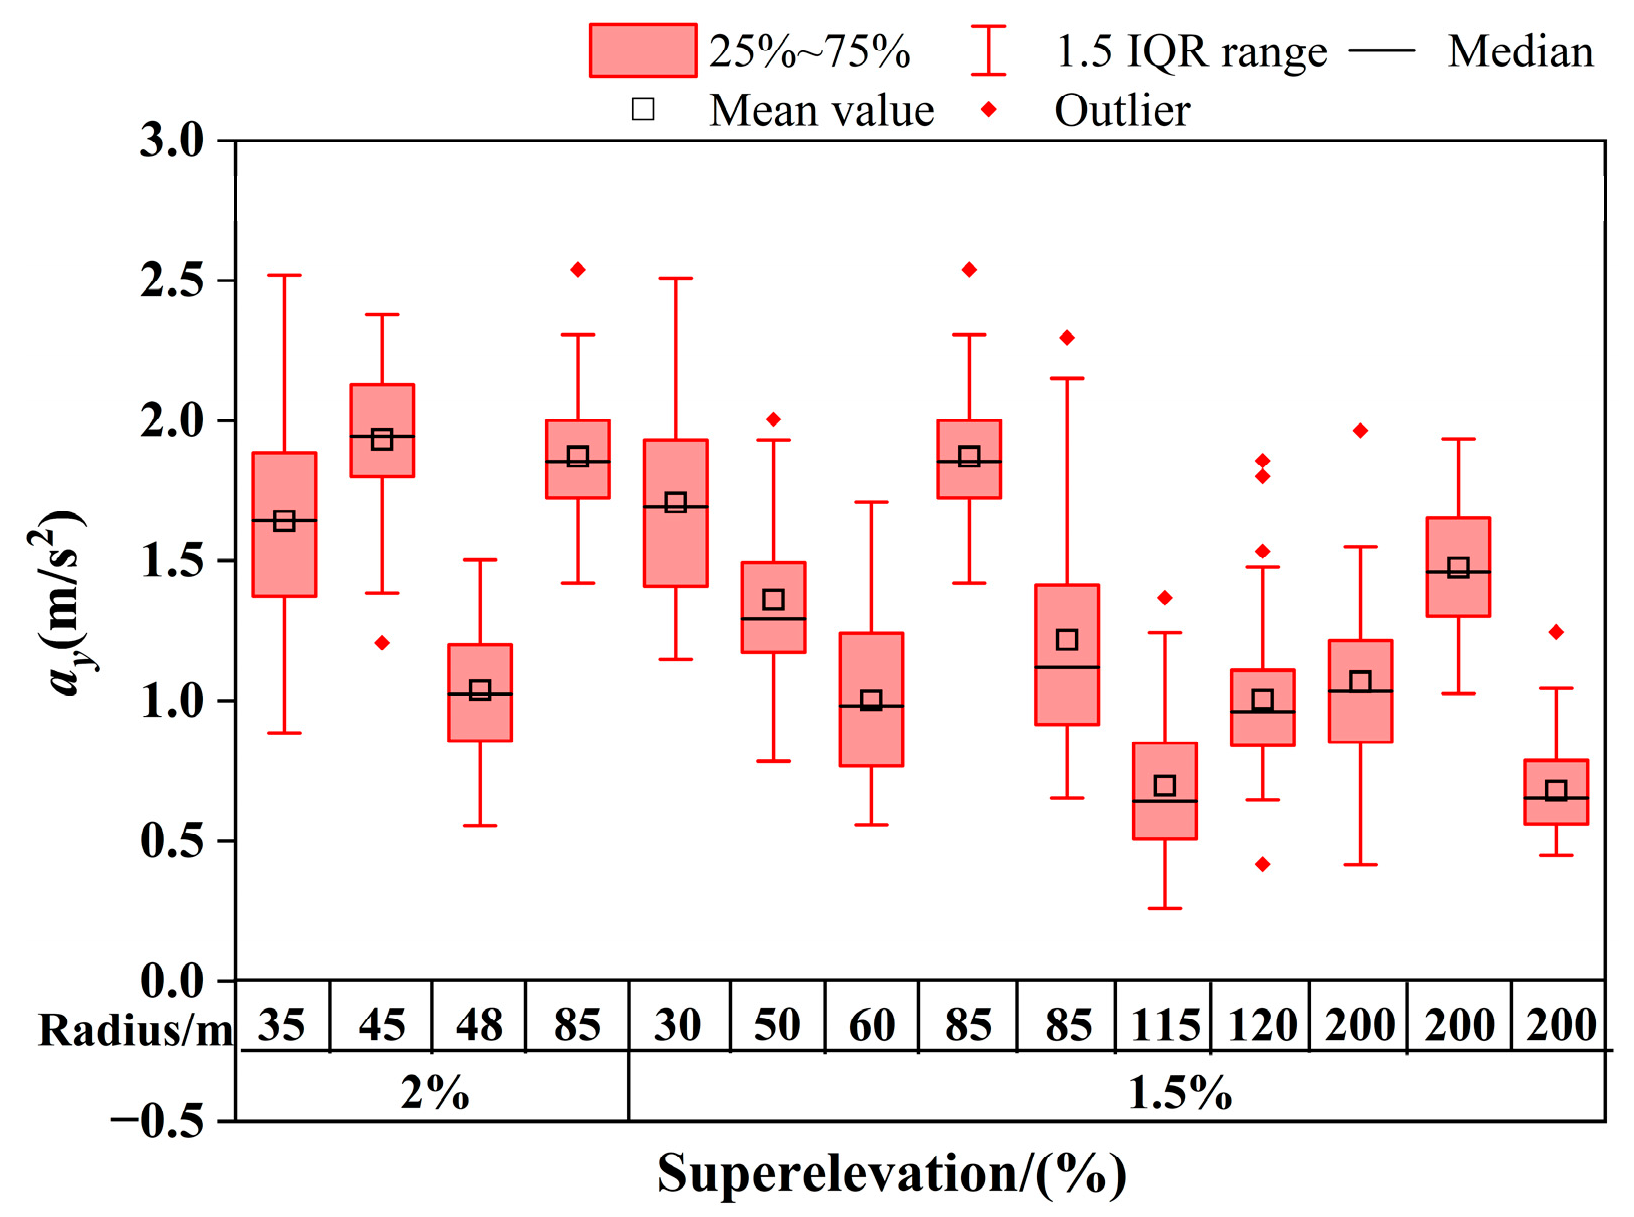
4.3.1. Influence of Curve Radius on Acceleration
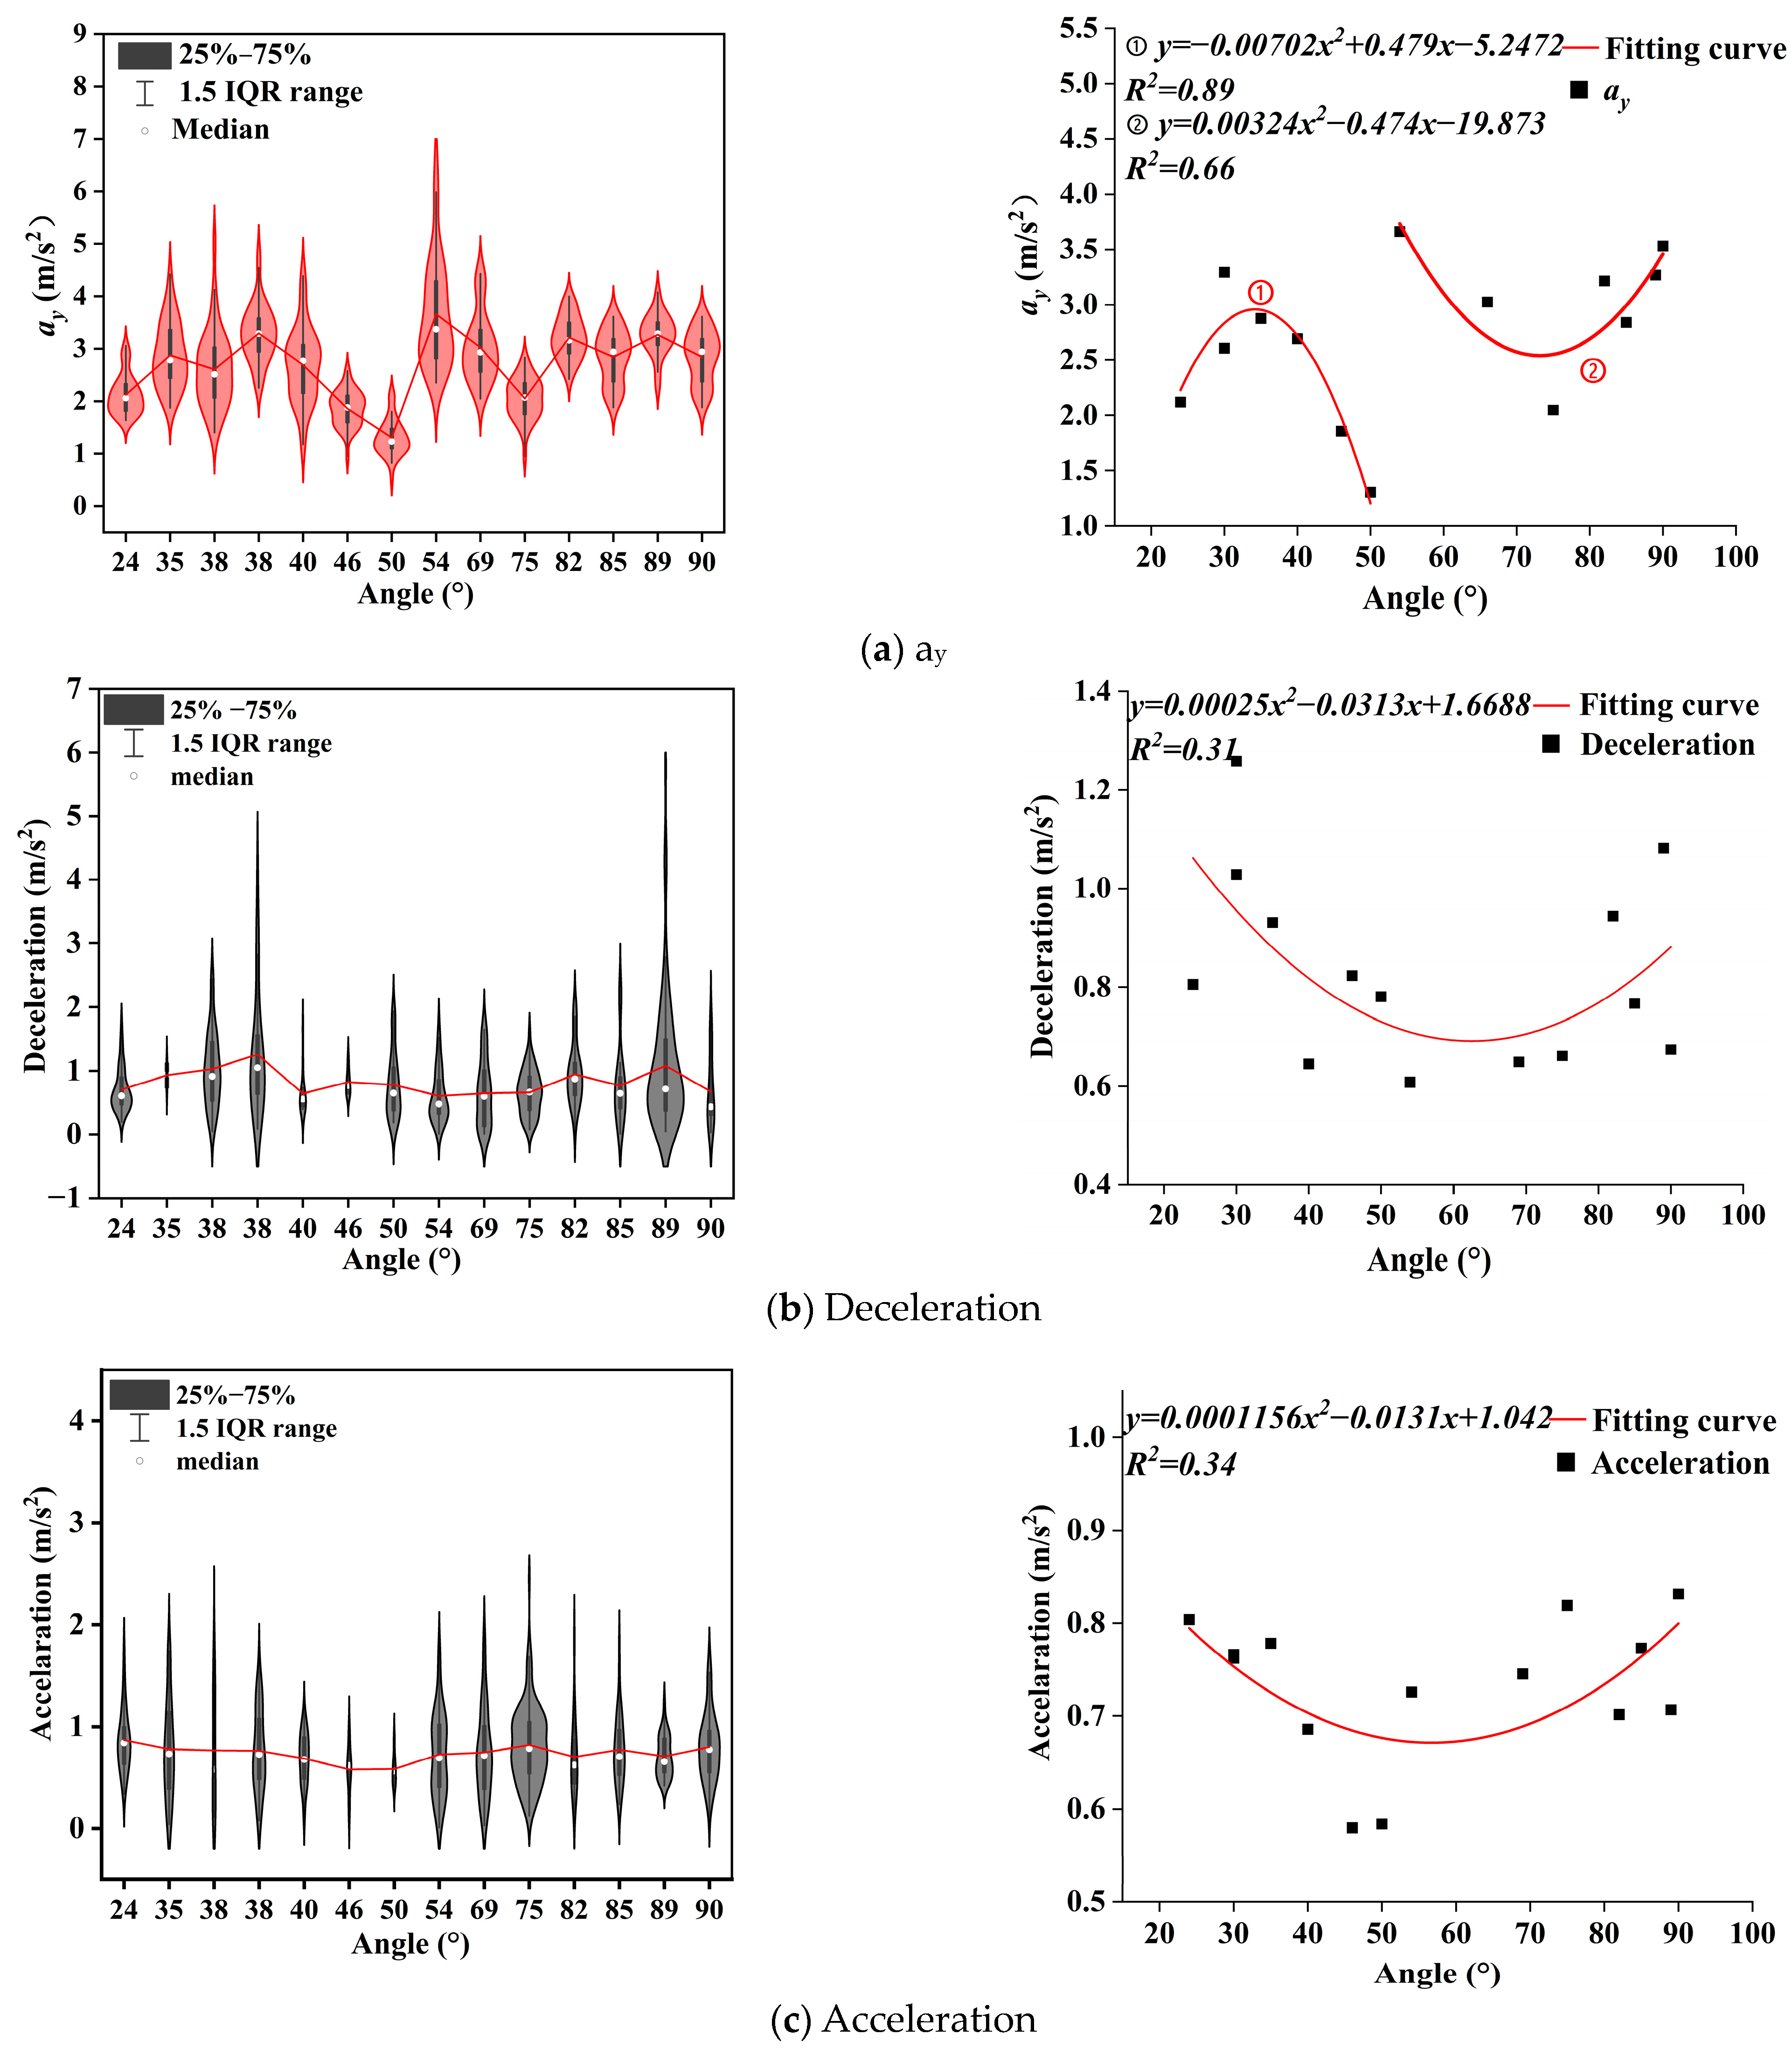
4.3.2. Influence of Curve Angle on Acceleration
5. Discussion
6. Conclusions
- (1)
- Significant differences exist in lateral acceleration and longitudinal acceleration under different radius ranges when driving at curves in urban underground roads. There is a significant difference in the lateral acceleration between the independent curves and the S-curves, and the longitudinal acceleration does not exist. There are significant differences between some groups in the entering curve deceleration and exiting curve acceleration for curves with different radius ranges and different angle ranges.
- (2)
- The number of driving risk points per unit length (m) under different curve types does not show significant differences. The number of driving risk points per unit length (m) of the extreme small radius curve and the general small radius curve is significantly larger than that of the ordinary radius curve.
- (3)
- The number of danger points at curves increases initially with mileage, then stabilizes with fluctuations for a distance, and finally decreases. The road sections with the highest level of danger points are mainly concentrated within the circular curve sections of the curves, especially in the latter half of the circular curve section in the direction of travel.
- (4)
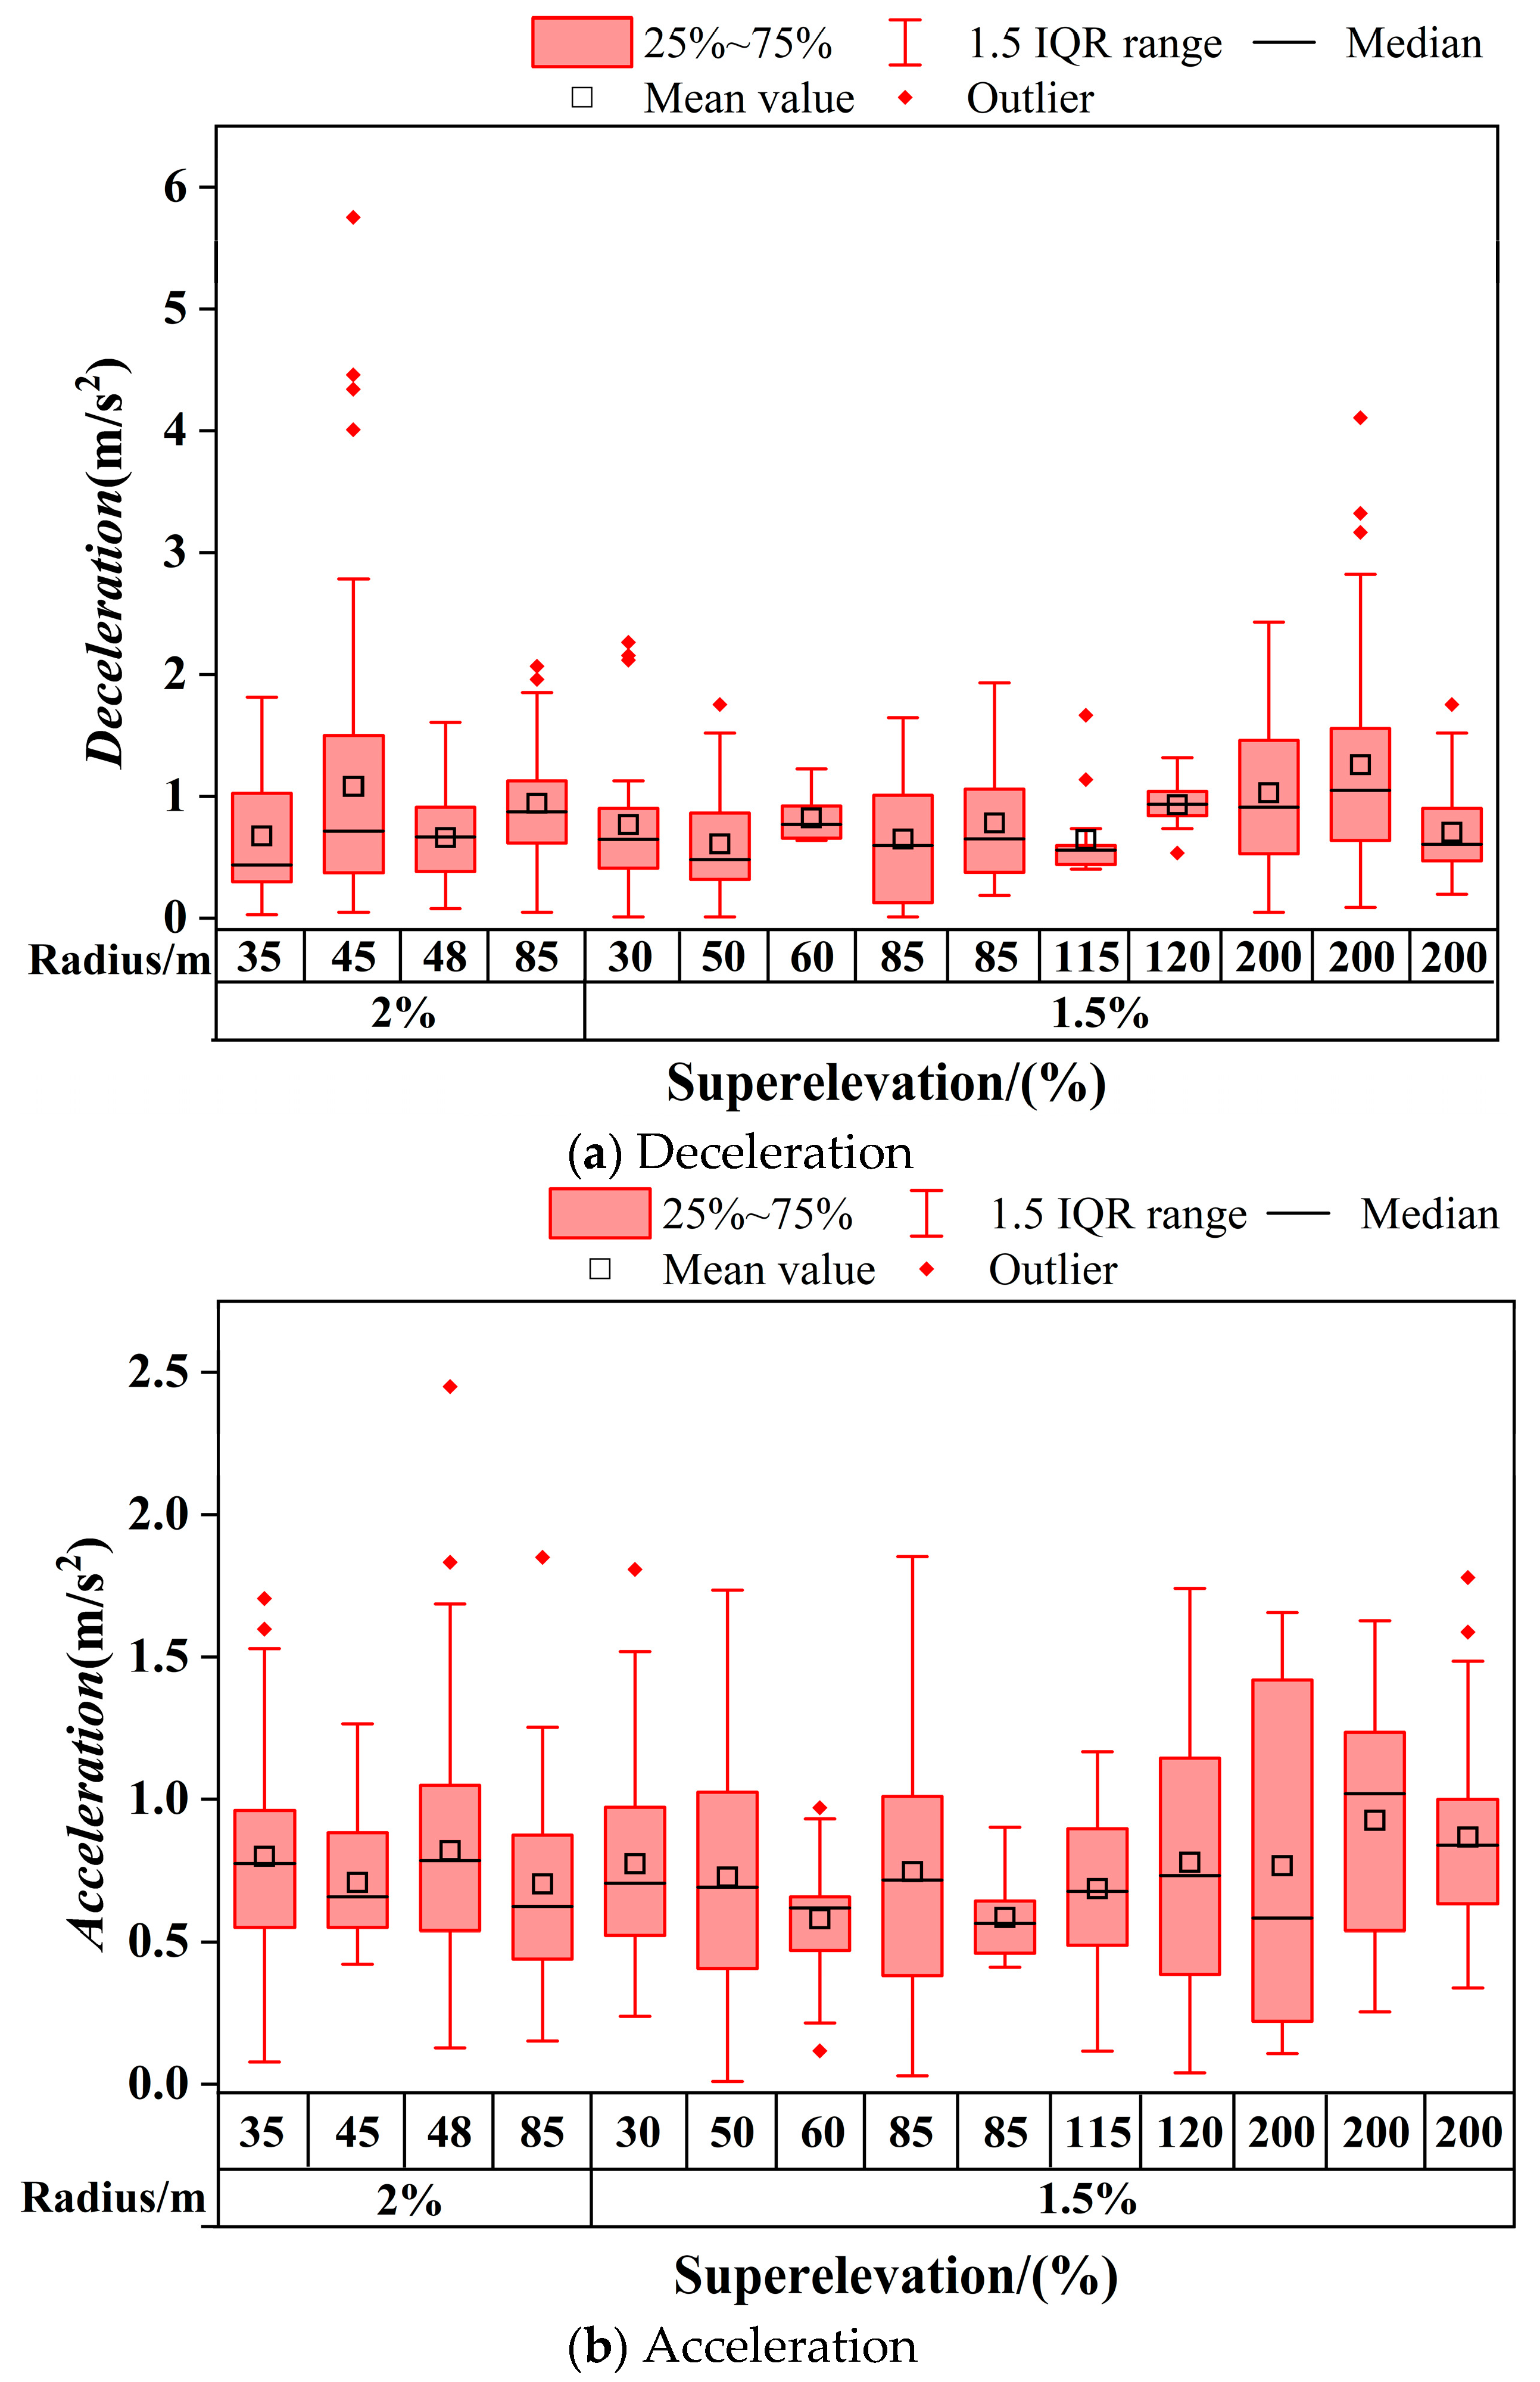
- The lateral acceleration of vehicles at curves in urban underground roads shows the following relationships with curve radius and angle: when the curve radius is less than 80 m, the lateral acceleration decreases initially with increasing radius and then increases; when the radius is greater than 80 m, it initially increases and then decreases. When the curve angle is less than 50°, the lateral acceleration increases initially with the angle and then decreases as the angle increases; when the angle is greater than 50°, it decreases initially and then increases. The entering curve deceleration and exiting curve acceleration of vehicles at curves in urban underground roads both show a trend of initially decreasing and then increasing with increasing curve radius and angle. Additionally, R > 60 m and α < 70° are the recommended value ranges for small radius curves.
Author Contributions
Funding
Institutional Review Board Statement
Informed Consent Statement
Data Availability Statement
Conflicts of Interest
References
- Chen, Z.L.; Chen, J.Y.; Liu, H.; Zhang, Z.F. Present status and development trends of underground space in Chinese cities: Evaluation and analysis. Tunn. Undergr. Space Technol. 2018, 71, 253–270. [Google Scholar]
- Xu, F.; Du, Z.; Chen, C. Distribution and development characteristics of urban road tunnels in China. Mod. Tunn. Technol. 2022, 59, 35–41. [Google Scholar]
- Hummer, J.E.; Rasdorf, W.; Findley, D.J.; Zegeer, C.V.; Sundstrom, C.A. Curve collisions: Road and collision charac-teristics and countermeasures. J. Transp. Saf. Secur. 2010, 2, 203–220. [Google Scholar]
- Chen, Y.; Shi, T.; Yu, S.; Shi, Q.; He, J.; Bian, Y. Setting the speed limit for highway horizontal curves: A revision of inferred design speed based on vehicle system dynamics. Saf. Sci. 2022, 151, 105729. [Google Scholar]
- Jurewicz, C.; Chau, T.; Mihailidis, P.; Bui, B. From research to practice-development of a rural mass curve treatment program. J. Australas. Coll. Road Saf. 2015, 26, 11–19. [Google Scholar]
- Cafiso, S.; D’Agostino, C.; Kiec, M. Investigating safety performance of the SAFESTAR system for route-based curve treatment. Reliab. Eng. Syst. Saf. 2019, 188, 125–132. [Google Scholar]
- Milleville-Pennel, I.; Jean-Michel, H.; Elise, J. The use of hazard road signs to improve the perception of severe bends. Accid. Anal. Prev. 2007, 39, 721–730. [Google Scholar] [CrossRef]
- Liu, J.; Ye, F.; Zhu, W.; Su, E.; Peng, W.; Han, X.; Wen, X. Evaluation of the impact of landscape zone on driver distraction and visual comfort in road tunnels. Tunn. Undergr. Space Technol. 2025, 156, 106248. [Google Scholar]
- Ministry of Housing and Urban-Rural Development of the People’s Republic of China. Code for Design of Urban Underground Road Engineering (CJJ 221-2015); China Architecture & Building Press: Beijing, China, 2015; ISBN 1511226448. [Google Scholar]
- Huang, Y.; Chen, F.; Song, M.; Pan, X.; You, K. Effect evaluation of traffic guidance in urban underground road diverging and merging areas: A simulator study. Accid. Anal. Prev. 2023, 186, 107036. [Google Scholar]
- He, S.; Du, Z.; Han, L.; Wang, S.; Chen, Y. Impact of urban tunnel sidewall effect on drivers: Examining visual charac-teristics and driving behavior across different lanes. Tunn. Undergr. Space Technol. 2024, 143, 105476. [Google Scholar] [CrossRef]
- Diao, Z. Research on Safety Optimization Design Technology of Tunnel Ramp. Master’s Thesis, Southeast University, Nanjing, China, 2019. [Google Scholar]
- Jiao, F.; Du, Z.; Wang, S.; Ni, Y.; He, R. Drivers’ saccade characteristics in curves of extra-long urban underwater tunnels. Transp. Res. Rec. 2020, 2674, 102–111. [Google Scholar]
- Fang, S.; Ma, J. Experimental analysis of driver visual characteristics in urban tunnels. Appl. Sci. 2021, 11, 4274. [Google Scholar] [CrossRef]
- Feng, Z.; Yang, M.; Zhang, W.; Du, Y.; Bai, H. Effect of longitudinal slope of urban underpass tunnels on drivers’ heart rate and speed: A study based on a real vehicle experiment. Tunn. Undergr. Space Technol. 2018, 81, 525–533. [Google Scholar]
- Liu, S.; Wang, J.; Fu, T. Effects of lane width, lane position and edge shoulder width on driving behavior in underground urban expressways: A driving simulator study. Int. J. Environ. Res. Public Health 2016, 13, 1010. [Google Scholar] [CrossRef]
- Ge, H.; Song, C.; Jing, D.; Li, W.; Shi, Z.; Guo, Z.; Zhang, F. Analysis of the effect of highway extra-long tunnel Accompanying vehicle lighting on driving behavior in horizontal curve—A driving simulation study. Tunn. Undergr. Space Technol. 2025, 157, 106286. [Google Scholar]
- Feng, S.; Gao, W.; Zhou, L.; Li, J.; Mao, W.; Liu, X. Experimental study on obstacle visibility and driving safety in lighting environment of road tunnel interior zone. Tunn. Undergr. Space Technol. 2024, 146, 105641. [Google Scholar]
- Fan, L.; Lu, L.; Deng, W.; Lu, J.J. Role of vehicle trajectory and lateral acceleration in designing horizontal curve radius of off-ramp: A driving simulator based study. Adv. Transp. Stud. 2015, 36, 119. [Google Scholar]
- Pothukuchi, S.; Pawar, D.S. Modeling Lateral Acceleration on Ramp Curves of Service Interchanges in India: An In-strumented-Vehicle Study. J. Transp. Eng. Part A Syst. 2021, 147, 04021089. [Google Scholar]
- Vaiana, R.; Iuele, T.; Astarita, V.; Caruso, M.V.; Tassitani, A.; Zaffino, C.; Giofrè, V.P. Driving behavior and traffic safety: An acceleration-based safety evaluation procedure for smartphones. Mod. Appl. Sci. 2014, 8, 88. [Google Scholar]
- Liu, J.; Khattak, A.J. Delivering improved alerts, warnings, and control assistance using basic safety messages transmitted between connected vehicles. Transp. Res. C Emerg. Technol. 2016, 68, 83–100. [Google Scholar]
- Ali, G.; McLaughlin, S.; Ahmadian, M. Quantifying the effect of roadway, driver, vehicle, and location characteristics on the frequency of longitudinal and lateral accelerations. Accid. Anal. Prev. 2021, 161, 106356. [Google Scholar] [PubMed]
- Eboli, L.; Mazzulla, G.; Pungillo, G. Combining speed and acceleration to define car users’safe or unsafe driving behaviour. Transp. Res. C Emerg. Technol. 2016, 68, 113–125. [Google Scholar]
- Gu, H. The Study of Highway Alignment Comfortableness Evaluation Method Based on the Lateral Acceleration Rate. Master’s Thesis, South China University of Technology, Guangzhou, China, 2010. [Google Scholar]
- Ding, R.; Liu, j.; Jiang, Y. Driving risks of interchange ramp based on vehicle acceleration data. J. Transp. Inf. Saf. 2021, 39, 17–25. [Google Scholar]
- Zheng, Z.; Zheng, L.; Xu, Y.; Rao, J.; Zhang, H.; Xu, J. Study on the operating characteristics of passenger cars on urban underground spiral ramps based on real vehicle data. Chin. J. Highw. Transp. 2024, 37, 273–288. [Google Scholar]
- Xu, Y.; Wang, Z.; Zheng, Z.; Rao, J.; Xu, J. Research on the Lateral Acceleration Characteristics of Vehicles in Urban Underground Road Curves. In Proceedings of the 24th COTA International Conference of Transportation Professionals, Shenzhen, China, 23–26 July 2024; pp. 2518–2528. [Google Scholar]
- Deng, Z.; Chu, D.; Wu, C.; He, Y.; Cui, J. Curve safe speed model considering driving style based on driver behaviour questionnaire. Transp. Res. F Traffic Psychol. Behav. 2019, 65, 536–547. [Google Scholar]
- Crisman, B.; Marchionna, A.; Perco, P.; Roberti, R. Operating speed prediction model for two-lane rural roads. In Proceedings of the 3rd International Symposium on Highway Geometric Design, Chicago, IL, USA, 29 June–2 July 2005. [Google Scholar]
- Zhu, L.; Lu, L.; Zhang, W.; Zhao, Y.; Song, M. Analysis of accident severity for curved roadways based on bayesian networks. Sustainability 2019, 11, 2223. [Google Scholar] [CrossRef]
- Khanjari, M.; Abdi Kordani, A.; Zarei, M. Simulation and modelling of safety of roadways in reverse horizontal curves (RHCs): With focus on lateral acceleration. Adv. Civ. Eng. 2022, 2022, 1952323. [Google Scholar]
- Eboli, L.; Guido, G.; Mazzulla, G.; Pungillo, G. Experimental relationships between operating speeds of successive road design elements in two-lane rural highways. Transport 2017, 32, 138–145. [Google Scholar]
- Dias, C.; Oguchi, T.; Wimalasena, K. Drivers’ speeding behavior on expressway curves: Exploring the effect of curve radius and desired speed. Transp. Res. Rec. 2018, 2672, 48–60. [Google Scholar]
- Semeida, A.M. Application of artificial neural networks for operating speed prediction at horizontal curves: A case study in Egypt. J. Mod. Transp. 2014, 22, 20–29. [Google Scholar]
- Bassan, S. Sight distance and horizontal curve aspects in the design of road tunnels vs. highways. Tunn. Undergr. Space Technol. 2015, 45, 214–226. [Google Scholar]
- Zheng, Z.; Du, Z.; Li, P. On the visual environment rhythmic design for the vehicle drivers to travel through the long highway tunnels. J. Saf. Environ. 2017, 17, 1800–1805. [Google Scholar]
- Zheng, Z.; Du, Z.; Yan, Q.; Xiang, Q.; Chen, G. The impact of rhythm-based visual reference system in long highway tunnels. Saf. Sci. 2017, 95, 75–82. [Google Scholar]
- Ministry of Transport of the People’s Republic of China. Specifications for Highway Safety Audit (JTG B05-2015); People’s Communications Press: Beijing, China, 2015. [Google Scholar]
- Choudhari, T.; Maji, A. Risk assessment of horizontal curves based on lateral acceleration index: A driving simulator-based study. Transp. Dev. Econ. 2021, 7, 2. [Google Scholar]
- Aguil-Éra, V.; Glaser, S. Data requirements for enhanced digital maps in an advanced curve-speed warning system. Transp. Res. Rec. 2004, 1886, 109–118. [Google Scholar]
- Othman, S.; Thomson, R.; Lannér, G. Safety analysis of horizontal curves using real traffic data. J. Transp. Eng. 2014, 140, 04014005. [Google Scholar]
- Kirytopoulos, K.; Kazaras, K.; Papapavlou, P.; Ntzeremes, P.; Tatsiopoulos, I. Exploring driving habits and safety critical behavioural intentions among road tunnel users: A questionnaire survey in Greece. Tunn. Undergr. Space Technol. 2017, 63, 244–251. [Google Scholar]
- Zhao, X.; Wu, Y.; Rong, J.; Ma, J. The effect of chevron alignment signs on driver performance on horizontal curves with different roadway geometries. Accid. Anal. Prev. 2015, 75, 226–235. [Google Scholar]
- Liu, H.; Zhang, Z.; Guo, D.; Peng, L.; Bao, Z.; Han, W. Research progress and prospect of application technology of thin-layer antiskid colored pavement at home and abroad. In Proceedings of the 2011 International Conference on Electric Technology and Civil Engineering (ICETCE), Lushan, China, 22–24 April 2011; pp. 2557–2560. [Google Scholar]
- Van Houten, R.; Van Huten, F. The effects of a specific prompting sign on speed reduction. Accid. Anal. Prev. 1987, 19, 115–117. [Google Scholar]
- Wu, Y.; Zhao, X.; Rong, J.; Ma, J. Influence analysis of chevron alignment signs on drivers’ speed choices at horizontal curves on highways. J. Southeast Univ. (Nat. Sci. Ed.) 2015, 31, 412–417. [Google Scholar]
- Du, Z.; Wang, S.; Yang, L.; Ni, Y.; Jiao, F. Experimental study on the efficacy of retroreflective rings in the curved freeways tunnels. Tunn. Undergr. Space Technol. 2021, 110, 103813. [Google Scholar] [CrossRef]
- Xu, J.; Yang, K.; Shao, Y.; Lu, G. An experimental study on lateral acceleration of cars indifferent environments in Sichuan, Southwest China. Discrete Dyn. Nat. Soc. 2015, 2015, 494130. [Google Scholar]
- Xu, J.; Yang, K.; Zhou, J.; Wang, X.; Shao, Y.M. Longitudinal acceleration of vehicles on complex mountain roads. Proc. Inst. Civ. Eng. Transp. 2019, 172, 249–263. [Google Scholar] [CrossRef]
- Gershon, P.; Ronen, A.; Oron-Gilad, T.; Shinar, D. The effects of an interactive cognitive task (ICT) in suppressing fatigue symptoms in driving. Transp. Res. Part F Traffic Psychol. Behav. 2009, 12, 21–28. [Google Scholar] [CrossRef]


| Type of Curve | n | Lateral Acceleration | Longitudinal Acceleration | ||
|---|---|---|---|---|---|
| Null Hypothesis | Prob | Null Hypothesis | Prob | ||
| Independent curve | 320 | Median: independent curve > S-curve | 0.02881 | Median: independent curve < S-curve | 0.21329 |
| S-curve | 240 | ||||
| Radius | n | Lateral Acceleration | Longitudinal Acceleration | ||
|---|---|---|---|---|---|
| Mean Rank | Parameter | Mean Rank | Parameter | ||
| Extreme small radius curve (R ≤ 85 m) | 240 | 346.84 | E-G: p < 0.0001 Sig = 1 E-O: p < 0.0001 Sig = 1 G-O: p < 0.00366 Sig = 1 | 231.72 | E-G: p = 0.02668 Sig = 1 E-O: p < 0.0001 Sig = 1 G-O: p < 0.0001 Sig = 1 |
| General small radius curve (85 m < R ≤ 150 m) | 160 | 259.99 | 274.92 | ||
| Ordinary radius curve (R > 150 m) | 160 | 201.49 | 359.26 | ||
| Type of Curve | Test Method | n | Number of Dangerous Points/m | ||
|---|---|---|---|---|---|
| Null Hypothesis | Prob | ||||
| Independent curve | Mann Whitney | 160 | Median: independent curve > S-curve | 0.96513 | |
| S-curve | 120 | ||||
| Radius | Kruskal Wallis | n | Mean rank | Parameter | |
| Extreme small radius curve (R ≤ 85 m) | 120 | 163.62 | E-G: p = 0.00194 Sig = 1 E-O: p = 0.00133 Sig = 1 G-O: p = 1 Sig = 0 | ||
| General small radius curve (85 m < R ≤ 150 m) | 80 | 123.76 | |||
| Ordinary radius curve (R > 150 m) | 80 | 122.57 | |||
| Curve Numbers | Curve Diagram | Curve Parameter | Notes |
|---|---|---|---|
| Curve 1 | 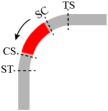 | R = 35 m α = 90° | SC: spiral to circle; CS: circle to spiral; TS: tangent to spiral; ST: spiral to tangent. The red area in the diagram indicates the hazardous driving section. The direction of the arrows in the diagram indicates the direction of traffic flow. |
| Curve 7 | 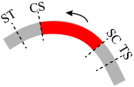 | R = 35 m α = 85° | |
| Curve 14 | 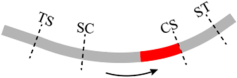 | R = 50 m α = 54° | |
| Curve 5 and Curve 6 | 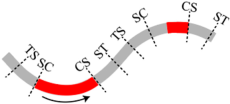 | Curve 5: R = 45 m α = 89° Curve 6: R = 45 m α = 75° | |
| Curve 4 | 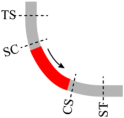 | R = 82 m α = 82° | |
| Curve 8 and Curve 9 | 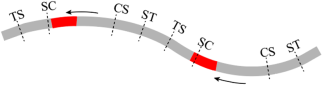 | Curve 8: R = 115 m α = 50° Curve 9: R = 60 m α = 46° | |
| Curve 12 | 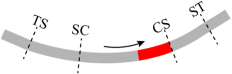 | R = 85 m α = 69° | |
| Curve 2 and Curve 3 | 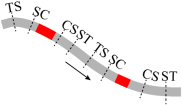 | Curve 2: R = 200 m α = 38° Curve 3: R = 200 m α = 38° | |
| Curve 10 | 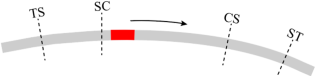 | R = 175 m α = 35° | |
| Curve 11 | 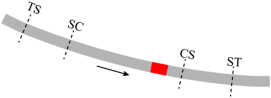 | R = 200 m α = 34° | |
| Curve 13 |  | R = 120 m α = 40° |
| Radius | n | Entering Curve Deceleration | n | Exiting Curve Acceleration | ||
|---|---|---|---|---|---|---|
| Mean Rank | Parameter | Mean Rank | Parameter | |||
| Extreme small radius curve (R ≤ 85 m) | 235 | 222.80 | E-G: p = 1 Sig = 0 E-O: p = 0.0153 Sig = 1 G-O: p = 0.138 Sig = 0 | 368 | 302.46 | E-G: p = 0.16334 Sig = 0 E-O: p = 0.41328 Sig = 0 G-O:0.0 p = 0.01762 Sig = 1 |
| General radius curve (85 m < R ≤ 150 m) | 114 | 229.99 | 122 | 267.63 | ||
| Ordinary radius curve (R > 150 m) | 121 | 265.36 | 110 | 330.41 | ||
| Angle | n | Entering Curve Deceleration | n | Exiting Curve Acceleration | ||
|---|---|---|---|---|---|---|
| Mean Rank | Parameter | Mean Rank | Parameter | |||
| Small angle curve (α ≤ 40°) | 135 | 258.20 | S-M: p = 0.00551 Sig = 0 S-L: p = 0.54075 Sig = 1 M-L: p = 0.09731 Sig = 1 | 142 | 315.26 | S-M: p = 0.00571 Sig = 1 S-L: p = 1 Sig = 0 M-L: p = 0.00322 Sig = 1 |
| Medium angle curve (40° < α ≤ 70°) | 120 | 205.11 | 99 | 244.91 | ||
| Large angle curve (70° < α ≤ 90°) | 215 | 238.21 | 358 | 309.18 | ||
Disclaimer/Publisher’s Note: The statements, opinions and data contained in all publications are solely those of the individual author(s) and contributor(s) and not of MDPI and/or the editor(s). MDPI and/or the editor(s) disclaim responsibility for any injury to people or property resulting from any ideas, methods, instructions or products referred to in the content. |
© 2025 by the authors. Licensee MDPI, Basel, Switzerland. This article is an open access article distributed under the terms and conditions of the Creative Commons Attribution (CC BY) license (https://creativecommons.org/licenses/by/4.0/).
Share and Cite
Zheng, Z.; Xu, Y.; Wang, Z.; Rao, J.; Zhang, H.; Xu, J. Unveiling Driving Risks and Geometric Parameter Relationships in Urban Underground Road Curves: A Real Vehicle Experiment. Appl. Sci. 2025, 15, 3646. https://doi.org/10.3390/app15073646
Zheng Z, Xu Y, Wang Z, Rao J, Zhang H, Xu J. Unveiling Driving Risks and Geometric Parameter Relationships in Urban Underground Road Curves: A Real Vehicle Experiment. Applied Sciences. 2025; 15(7):3646. https://doi.org/10.3390/app15073646
Chicago/Turabian StyleZheng, Zhanji, Yuxuan Xu, Zhenke Wang, Jiaqiang Rao, Heshan Zhang, and Jin Xu. 2025. "Unveiling Driving Risks and Geometric Parameter Relationships in Urban Underground Road Curves: A Real Vehicle Experiment" Applied Sciences 15, no. 7: 3646. https://doi.org/10.3390/app15073646
APA StyleZheng, Z., Xu, Y., Wang, Z., Rao, J., Zhang, H., & Xu, J. (2025). Unveiling Driving Risks and Geometric Parameter Relationships in Urban Underground Road Curves: A Real Vehicle Experiment. Applied Sciences, 15(7), 3646. https://doi.org/10.3390/app15073646