1. Introduction
Soil compaction in agriculture is a significant problem caused by various factors such as the use of machinery, intensive farming, and improper soil management [
1]. Anti-compaction techniques include reducing pressure on the soil, working with the soil at optimal moisture, and increasing organic matter content [
2]. The compression rate of soils increases with clay content, affecting soil strength and limiting plant growth [
3]. High wheel pressure on the soil can lead to deep substrate compaction, resulting in a permanent reduction in yield [
3]. This condition worsens as agricultural machinery’s weight increases [
4]. Soil compaction changes soil structure, reducing aeration and root development and contributing to environmental problems [
5], limiting access to water for the proper development of plants [
6]. To improve compacted soil structure, especially in row crops, new tools combine classic knives and vertical minidiscs to remove weeds and prevent the plants from being buried in the rows. These mechanical improvements in inter-row crops are critical to chemical-free weed control [
7]. Mechanical inter-row weeding tools have effectively reduced herbicide use in sugarcane cultivation, significantly impacting weed coverage and yields [
8]. In addition, the experiments showed that weed cover was reduced considerably with treatments combining mechanical and chemical weed control compared to the crop itself, and cereal yields were slightly reduced only under certain conditions [
9]. These results highlight the importance of cultivator design and working speed and the effectiveness of combining mechanical and chemical weed control methods for effective weed management in row crops. Combining different inter-row tillage tools can increase the effectiveness of weed removal. However, more research is needed to reduce crop damage while maintaining high crop protection efficiency [
10]. The interrelated phenomena related to the technology of treatments, soil compaction, and the ecological aspect of inter-row cultivation require the search for technical solutions to limit the forces needed to overcome soil resistance with the most favourable cultivation parameters.
Understanding the forces acting on tillage tools is critical to optimising soil tillage processes and improving energy efficiency in agriculture. The draught and vertical forces exerted on the duckfoot of row cultivators significantly impact the overall performance of agricultural implements in terms of fuel consumption, soil loosening, and operational efficiency [
11]. These forces are influenced by various factors, including soil structure and moisture, working depth, tool geometry, and working speed, as well as the stiffness of the duckfoot’s attachment tines [
12]. Proper consideration of these parameters is crucial for modelling and successful application in precision agriculture [
13].
The available results of the research on cultivator tools focused primarily on assessing draught force, which is the force needed to pull the tool through the soil. The role of key soil parameters, such as soil moisture and bulk density, has been widely recognised as significantly impacting pulling power [
14]. In particular, it has been shown that moisture content plays a crucial role in soil preservation during soil cultivation. When the moisture content is low, the soil becomes more resistant to penetration, which requires more force to crack and move the soil. Conversely, the soil takes a plastic form with higher moisture, reducing the force on the tools. However, this can increase pulling, complicating the tool’s functionality [
15].
In addition to soil moisture, the working depth significantly impacts the draught and vertical forces on the tillage implements. Deeper tillage increases the volume of soil cut off and loosened, leading to a proportional increase in draught forces. Studies consistently show that working depth is one of the main factors affecting pulling power, with deeper operations requiring more pulling power due to the increased soil mass cut off by the implement [
16]. For example, it has been shown that increasing depth causes a significant increase in both draught and vertical forces, especially in heavy, cohesive soils where the mechanical strength of the soil becomes a critical factor [
17].
Tool geometry is another significant factor in draught and vertical forces. Duckfoot tools are widely used in agricultural cultivation due to their wide wings, which are designed to cut and lift large amounts of soil. The width of the implement affects the contact area with the soil, which means that more soil rests on the wider tines, thus increasing the resistance that the duckfoot should overcome. In addition, the shape and angle of the tool’s cutting edge can significantly impact the forces acting on the tool, as sharper edges or smaller rake angles can reduce draught force and improve cutting performance [
18].
Working speed is also a critical parameter that affects the forces acting on the tillage implements. Studies have shown that the draught force increases with increasing working speeds due to the inertia of the soil mass accelerated by the tool [
19].
The inter-row cultivator caused unacceptable soil movement and damage to the plants at 6.11 and 7.82 km h
−1 [
20]. Another study found that an inter-row cultivator was more effective at reducing weed populations than a standard row cultivator [
21]. Ultimately, choosing the suitable inter-row cultivator significantly impacts the efficiency of weed removal and minimises damage to crops depending on the speed and depth of work [
22]. The conclusion is that properly selecting an inter-row cultivator is crucial for effective weed control and minimising crop damage depending on soil conditions and work speed.
Stiff and resilient tines play a crucial role in the weeding elements of the row cultivator. The choice between rigid and flexible tines on a row cultivator has a significant impact on the effectiveness of weed control and the reduction in plant damage, highlighting the need to consider the choice of cultivator and its operating parameters carefully. In analysing the effect of tool vibration on draught forces, discrete element method simulations show a significant impact of tool vibration on draught forces [
23]. For a 200 mm comprehensive tool mounted to a rigid tine, working at depths of 35, 100, and 150 mm in light sand with a soil density of 2510 kg·m
−3, the relative error of the prediction of draught force based on McKyes’ model was 24.6%, 27.0%, and 32.0%, respectively (the model was overestimated) [
24].
Despite much research on draught forces, less focus has been placed on vertical forces, which play a crucial role in understanding the tool’s ability to penetrate and lift soil [
25]. Vertical forces are fundamental in tools such as duckfoot, where the wings are designed to lift and crack the soil, and failure to take these forces into account can result in an inaccurate prediction of the performance of the loosening tool [
26].
While previous studies have provided valuable information on the effects of individual factors—such as soil moisture, depth, width, and speed—on the forces acting on tillage tools [
27], there remains a significant gap in understanding how these factors interact consistently with complex tools, such as duckfoot attached to tines with varying stiffness. Most models in the literature focus on more straightforward tools, such as narrow chisels with simple geometry [
28] and wide duckfoots that cut, lift, and crack soil. The lack of empirical data on vertical forces limits the accuracy of existing models, especially in the context of tools that work at shallow depths [
29].
The research problem is the identified gap in the current state of knowledge about the combined effects of soil moisture, depth, tool width, working speed, and, especially, tine stiffness on both draught and vertical forces acting on comprehensive duckfoot tools. From the current knowledge, the ratio of depth to tool width is more important than their absolute values [
30], and will be used in the developed mathematical models. There is, therefore, a need to create comprehensive empirical models based on which it will be possible to evaluate these forces under different field conditions and use these models to optimise the performance of tools operating in various field environments. Considering variable factors, interactions between the tillage tool and the soil are essential for minimising agronomic and environmental problems (Damanauskas and Janulevich, 2022) [
31].
Based on the research problem, the following scientific hypotheses were formulated: (1) Soil moisture, the ratio of depth to width of the duckfoot, the movement speed, and the stiffness of the tine flexibility significantly impact both the draught and vertical forces acting on duckfoots. An increased tool depth-to-width ratio and movement speed will result in greater draught forces, and a lower tine stiffness will have a measurable effect on reducing horizontal and vertical forces. It will be incorporated into the developed models, improving accuracy compared to existing models. (2) Mathematical empirical models developed in this study will allow for predicting forces in a two-dimensional (2D) system with different soil conditions and tool configurations. Empirical models focus mainly on linear relationships and interactions and include nonlinear variables. Models will be validated for optimal conditions based on relative errors.
The scientific novelty of this study lies in developing comprehensive mathematical, empirical models that will allow for the simultaneous evaluation of both draught and vertical forces for duckfoot under different operating conditions. While previous research has primarily focused on draught forces and simpler tool geometries, this study will fill the gap by addressing vertical forces, which are critical to understanding the behaviour of tools for penetration, lifting, crushing, cracking, and soil spreading. The models presented in the manuscript consider the existing essential soil and implement parameters, such as soil moisture and movement speed, as well as the duckfoot depth-to-width ratio and, in particular, tine stiffness. Based on the developed models, it is possible to fully understand the forces acting on the duckfoot, which is essential for optimising the implementation design and energy efficiency in modern precision agriculture. The model’s optimisation will allow us to indicate the optimal working conditions of tillage tools and determine the minimum and maximum values of forces in a 2D system.
3. Results and Discussion
3.1. Results of the Statistical Analysis
Based on the analysis of variance and the matrix of correlation coefficient values, the statistical analysis results provided important information about the influence of individual independent variables and their interaction with the draught forces,
Fx, and vertical forces,
Fy. The study showed that the key variables influencing the forces acting on duckfoots were tine stiffness,
k, tool depth-to-width ratio,
d/
w, tool movement speed,
v, and soil moisture,
MC. Each of these variables had a statistically significant effect on the forces
Fx and
Fy, which was confirmed by the values of the Fisher–Snedecor coefficients and the significance level
p < 0.0001 for most of the analysed principal factors and their interactions (
Table 2).
The ratio of the depth to the width of the tool,
d/
w, showed the most significant impact on the differentiation of draught and vertical force values. This variable had the relatively highest values of the Pearson’s correlation coefficients, amounting to 0.326 for draught
Fx and 0.547 for force
Fy (
Table 3). Higher values of correlation coefficients for a variable
d/
w indicated a direct relationship between a change in the depth-to-width ratio and an increase in the forces acting on the tools. The importance of this variable has also been confirmed in the literature, where many studies have shown that a more excellent value of the ratio
d/
w increased the resistance of the cut soil, which, in response, translated into increased draught and vertical forces, which affected the efficiency of cultivation and energy consumption by the tool [
30].
The second important variable was the movement speed of the tool,
v, which positively affected the values of draught and vertical forces. The correlation coefficients for speed were 0.257 for
Fx and 0.168 for
Fy. These results supported the findings of previous studies that indicated that an increase in the speed of working implement movement led to increased draught forces, which was associated with dynamic effects of acceleration and soil deformation [
39]. The high movement speed of the working implements contributed to higher soil resistance, increasing the tool’s energy consumption, but it could also promote more efficient soil loosening under certain conditions.
Tool stiffness,
k, was another critical variable that affected the values of draught and vertical forces. The correlation coefficient for this variable was 0.165 for
Fx and 0.031 for
Fy, which suggested that the stiffness of the spring used to make the duckfoots mounting tines had a more significant impact on
Fx than
Fy. The literature emphasises the importance of the stiffness of the working elements of tillage tools in the context of the forces acting on the tools. Studies show that tools with higher rigidity are more effective on hard soil, while flexible tools can generate less pulling resistance, which confirms the results obtained [
40].
Soil moisture,
MC, showed a minimally negative effect on the values of both forces. This result was in line with those of previous studies that showed that sandy soil with a low proportion of clay particles with higher moisture content has lower pulling resistance due to lower soil cohesion and better tool slippage in moist soil layers [
41]. Lower soil-tool adhesion force in conditions of increased moisture reduces the pulling resistance, which can also lead to more effective tool operation. However, it should be emphasised that other soil species may show different properties with increasing moisture.
The analysis of interactions between variables allows us to conclude that most of the analysed interactions had a significant impact on the values of forces
Fx and
Fy. Dual interactions such as stiffness, soil moisture (
k ×
MC), depth-to-width ratio, and tool movement speed (
d/
w ×
v) statistically affected both forces. These results indicate that independent variables do not act alone but, when combined, can produce synergies and significantly influence force values, underscoring the importance of analysing interactions in tillage tool research [
42].
The analysis of variance also showed that triple interactions such as stiffness, soil moisture, and depth-to-width ratio (
k ×
MC ×
d/
w) had a very significant impact on the values of the
Fx and
Fy (
p < 0.0001). This indicates the complexity of the processes involved in soil–tool interactions, which requires consideration not only of individual factors but also of multiple combinations of factors in predictive models. These relationships are consistent with the observations of other researchers, who suggest that models that consider the interactions of many variables are more precise and effective in predicting the actual forces acting on the tools [
43].
Overall, statistical analysis provided vital information on the influence of individual variables and their interaction with the values of draught and vertical forces. The most important factors were the tool’s depth-to-width ratio and the movement speed, while the stiffness and soil moisture had a more minor but still significant impact on the forces acting on the tools. These results confirm the complexity of soil–tool interactions, which requires considering multiple variables and their combinations in developing predictive models.
3.2. Mathematical Empirical Models
Mathematical, empirical models developed for draught force, Fx, and vertical force, Fy (Equation (2)) were based on analysing the influence of key independent variables and their interactions. These models extended previous approaches, often only considering basic operating parameters such as working depth, d, tool width, w, and movement speed, v. The developed models were more complex, as they additionally considered the effects of tine stiffness, k, and soil moisture content, MC.
Entering stiffness
k as a variable was essential to research on modelling soil–tool interactions. As shown earlier, tool stiffness can significantly affect draught forces, which is confirmed in the literature [
40]. Stiffness affects the susceptibility of the tool to adapt to soil conditions, especially when the soil is more compact or when there is significant working resistance resulting from the operation of the tools at specific technical parameters. Including this parameter in the mathematical model enabled a more accurate prediction of the values of the forces acting on the tool.
The empirical models developed included both linear and non-linear effects of variables and interactions between variables. These interactions were crucial for correctly mapping the impact of several variables simultaneously, which is particularly important in studying soil–tool interactions. The literature notes that considering variable interactions, especially double and triple interactions, improves the precision of predictive models, which was also reflected in the present study [
42].
A general regression equation included all relevant factors affecting these forces in the models developed for draught force
Fx (Equation (3)) and vertical force
Fy (Equation (4)). These equations were more complex than traditional models, reflecting the complexity of the soil–tool interaction process. These models considered the linear relationships between variables and their squares and interactions between variables, allowing for more precise prediction results.
One of the critical elements of the models was the inclusion of the constant,
β0, which served as an equalisation of the prediction level. The lack of a constant in the model would artificially inflate the multiple correlation coefficient, R, values, which could lead to erroneous conclusions about the model’s validity; including a constant allowed the model to fit the data more realistically, which is especially important for non-linear relationships between variables [
44]. The values of constants in both models were statistically significant, confirmed by the results of the Student’s
t-tests, and were of great importance in improving the prediction quality (
Table 4). The analysis of variance and evaluation of model fit confirms their statistical significance,
p < 0.0001 (
Table 5).
The values of multiple correlation coefficients, R, for the developed models were 0.4996 for
Fx and 0.6227 for
Fy, indicating a moderate fit of the models to the experimental data. This may be due to random variability of the compacted soil, too low implement movement speed, instability of the working depth related to tine stiffness, and the associated change in the duckfoot rake angle. Still, they were statistically significant and showed a satisfactory reflection of the real-world phenomena occurring in the soil–tool interaction. These results are consistent with those of previous studies that indicated that nonlinear models, especially in cultivator tool studies, have moderate R-values associated with high variability in soil conditions [
43].
The developed models can predict draught and vertical forces in various soil and operational conditions. In particular, these models can help design and optimise agricultural tools, as they allow the analysis of the impact of different technical and environmental variables on the resistance of tools. These models can also be used to assess the impact of new materials and technologies on tool efficiency, which is essential for the sustainable development of agriculture.
The developed mathematical, empirical models considering stiffness and soil moisture significantly extend existing approaches to modelling soil–tool interactions. These models were characterised by a statistically significant fit to experimental data and can be used in agricultural practice and research on optimising agrarian tools.
The developed empirical model describes the draught force
Fx and the vertical force component
Fy depending on the operating parameters of the tool and soil conditions. Although the model is based on experimental data, its structure is based on the basic principles of soil mechanics and soil–tool interactions. In classical theories of soil mechanics, such as the Terzaghi and Mohr–Coulomb models [
45], soil resistance is described as a function of the tool’s internal friction, cohesion, and geometric parameters. In the context of wide tools, including duckfoots, the draught force results from the friction components and plastic deformations of the soil around the tool, which is reflected in the nonlinear interactions included in the model. These mechanisms have been analysed in the literature (e.g., [
46,
47]) and are consistent with the trends described in the presented results. Including dynamic effects, such as the influence of the speed of movement and the elasticity of the tine, extends the classic theoretical approach with additional aspects influencing the actual cutting resistance of the soil. To compare the empirical model with the theory of soil mechanics, the obtained values of the tractive force were compared with those obtained from the analytical models, which confirmed the agreement of trends and provided additional validation for the developed model.
3.2.1. Detailed Model Description for Draught Force, Fx
The empirical model developed for draught force, Fx, considered the influence of several independent variables, such as stiffness, k, tool depth-to-width ratio, d/w, tool movement speed, v, and soil moisture, MC. The model also included interactions between these variables, including double, triple, and single quadrupole interactions. These were crucial for correctly mapping the effect of different combinations of factors on the value of draught force. A vital element of this model was to consider non-linear relationships, which allowed for more accurate prediction of draught forces under varying soil conditions.
The regression analysis results show that the speed of tool movement,
v, and its square,
v2, are among the regression coefficients. The regression coefficient for the square of speed was 17.8, and the value of the Student’s
t-test for this variable reached 7.81, indicating the importance of this variable in the model. The speed of the implement’s movement was one of the main factors determining the draught force, which is confirmed by previous studies indicating that an increase in speed leads to an increase in draught forces, especially in soils with higher cohesion and higher moisture content [
39]. The soil flowing through the surface of the sweep was cracked, thus creating a loose soil effect. This result differs from the findings regarding narrow tools with a larger tooth angle [
46] and a wide tool with a dimension of 200 mm [
24]. At higher speeds, there was a more significant increase in tractive force with an increasing height (thickness) of the tool’s cutting edge, but this had little effect on vertical force [
48]. In the study of three types of tines (S, Vibroflex, and with a double coil of a coiled spring) concerning the working speed on the draught force of the tines working on different soils, good correlations between the values of forces and velocities were found [
49]. These results are consistent with soil deformation mechanics, which suggest that increasing the speed of the implement leads to an increase in dynamic forces, which, in turn, increases the pulling resistance.
Another essential element of the model was the tool depth-to-width ratio,
d/
w. The regression coefficient for this linear variable was −502, and the
t-test value was −2.04, indicating a robust and negative effect of the ratio
d/
w on the value of the draught force. This confirms previous observations that a greater working depth concerning a smaller tool width increases pulling resistance [
30]. In this context, increasing the ratio of
d/
w can increase resistance, which is especially important for tools of different widths. The negative regression coefficient may suggest that under certain conditions, an increase in the tool depth-to-width ratio leads to a decrease in tractive effort, confirming the results of previous studies [
30]. The negative regression coefficient given
d/
w should be considered in the context of interaction with other model variables, such as implement speed and soil moisture. The combined interaction of these parameters can modulate the effect of the variable
d/
w pulling power; therefore, increasing the ratio of
d/
w does not always lead directly to a reduction in resistance, and this effect can vary depending on the width of the tool and other operating conditions.
Interactions between variables played a vital role in the
Fx model. Among the dual interactions, the product of the
d/
w ratio and the movement speed
v (
d/
w ×
v) significantly affected the value of the draught force, with a regression coefficient of 1073 and a
t-test value of 6.65. These results suggest that the combination of higher movement speed and the
d/
w ratio of the implement increased soil resistance, which is in line with expectations for the behaviour of agricultural implements in the soil. The conjunction of stiffness and speed
k ×
v, the ratio of depth to width and soil moisture (
d/
w ×
MC), the movement speed and soil moisture (
v ×
MC), the stiffness and soil moisture (
k ×
MC), and the stiffness and the ratio of depth to width had a significant influence on the draught force (
k ×
d/w). In addition, the quadruple interaction of all independent variables (
k ×
d/
w ×
v × MC) was significant. This indicates the complexity of the soil–tool interaction process, in which many factors act simultaneously and affect the final values of draught forces. Previous research shows that the draught force was greater for rigid tools than for flexible tools, and that increasing the speed of the flexible tool increased the draught force. The
d/
w ratio also affects the effectiveness of soil loosening, directly affecting soil compaction and crop yields [
30].
The analysis also showed that certain variables had a negative effect on the pulling power, indicating their mitigating effect on the tool’s operating resistance. The most significant negative regression coefficient (−542) was assigned to the square of the tool depth-to-width ratio (
d/
w)
2. Such quadratic relationships are often observed in research on agricultural tools, where an increase in technical parameters above a specific value ceases to bring benefits in the form of increased tool efficiency [
46]. The value of the draught force was negatively affected by regression coefficients with linear forms of all four independent variables
k,
d/
w,
v, and
MC. Similarly, all triple conjunctions of the analysed parameters had a negative effect on the draught force: (
k ×
d/
w ×
v), (
k ×
d/
w ×
MC), (
k ×
v ×
MC), and (
d/
w ×
v ×
MC). However, this negative effect of the variables should be considered in combination with other variables. Still, these negative values of regression coefficients with the variables highlighted may suggest that, under certain conditions, an increase in these variables did not necessarily lead to an increase in draught force. For example, increasing the moisture content of specific soil types may have led to a decrease in pulling resistance, which is consistent with the literature, which indicates that moist soil with one particular granulometric structure has less adhesion to implements, which reduces resistance to tool movement [
41].
The models include the square of the speed, and the analyses above of empirical models show that the draught force is also affected by linear speed. Therefore, it can be concluded that further modification of the models should consider both forms of speed: quadratic and linear. It was indicated that the Söhne, McKyes, and Perumpral models should be modified for comprehensive tools, as the models have a more significant agreement between the predictive and experimental values for a narrow tool [
50].
Overall, the model for the draught force, Fx, was highly complex, considering both linear and nonlinear relationships between independent variables, as well as interactions between these variables. The regression analysis showed that the tool movement speed and depth-to-width ratio significantly impacted the draught force. In contrast, stiffness and soil moisture had a more minor but significant effect. This model is essential to developing predictive methods for agricultural implements, enabling more accurate prediction of draught forces under varying operating conditions.
3.2.2. Model Description for Vertical Force, Fy
The empirical model for vertical force, Fy, considered vital independent variables, as did the model for draught force, Fx, i.e., stiffness, k, tool depth-to-width ratio, d/w, movement speed, v, and soil moisture, MC. However, due to other physical phenomena related to the vertical impact of the implement on the soil, not all variables and interactions had the same significant impact on the vertical force as in the case of the draught force.
Regression analysis revealed that the tool depth to the width ratio,
d/
w, had the most significant effect on
Fy. The regression coefficient for this variable was 1705, and the value of the Student’s
t-test reached 33.34 (
Table 4). A high regression factor value meant that the greater the ratio of the depth to the width of the tool, the greater the vertical force acting on the tool. This variable, therefore, had a dominant influence on the
Fy, which is in line with the results of previous studies that highlight that the working depth of the tool concerning its width plays a crucial role in generating vertical forces when working in soil [
30].
As with the
Fx, tool movement speed,
v, also significantly affected the value of the vertical force
Fy, but its effect was negative. The regression coefficient for this variable was −176, and the
t-test value was −13.36. This result suggests that an increase in the tool movement speed resulted in a decrease in vertical force. This aligns with the results of previous studies showing that soil can be ejected more efficiently at higher working speeds, reducing the vertical forces exerted on the implement [
51]. In this context, the higher speed could have been conducive to more efficient lifting of the soil from the implement, which reduced vertical force.
The interactions between the variables were less meaningful in the model for vertical force
Fy than in the model
Fx, but a few were statistically significant. One crucial interaction was the combination of the depth-to-width ratio of the tool,
d/
w, and soil moisture,
MC, which had a regression coefficient of −56.3 and a
t-test value of −13.56. This interaction indicates that at higher soil moisture values, the effect of the
d/
w was weakened to vertical force. This result is consistent with the results of studies on soil–tool interactions, which suggest that under higher moisture conditions, soil tends to reduce the vertical resistance of the tool, which may be due to the lower soil cohesion associated with moisture [
41].
In the
Fy, as in the
Fx, the squares of the variables were included, but not all of them were statistically significant. For example, the square of the movement speed,
v2, was rejected from the model because its effect on the vertical force was statistically insignificant. On the other hand, the square of the depth-to-width ratio (
d/
w)
2 had a significant negative impact on the vertical force, with a regression coefficient value of −776. This result suggests that at very high ratios
d/
w, the vertical force began to decrease, which may be because wide implements no longer move the soil upwards efficiently, and most of the forces are directed horizontally [
30].
The linear influence of the stiffness
k and its square
k2 were rejected from the model as statistically insignificant. This result may be because the stiffness primarily affects the horizontal draught forces, not the vertical forces, which depend more on the implement geometry and soil conditions [
40]. The most critical factors in the
Fy were the tool’s geometrical parameters,
d/
w, and movement speed,
v.
In conclusion, the empirical model for vertical force, Fy, showed that the most significant factor influencing vertical force was the depth-to-tool width ratio, d/w, which had a dominant influence on the vertical forces generated. The tool movement speed, v, had a negative effect on the value of the vertical force, suggesting that higher working speeds led to a reduction in vertical resistance. Variable interactions, particularly those related to soil moisture, also significantly impacted the vertical force value, indicating the complexity of the soil–tool interaction process. This model allows for more accurate prediction of vertical forces, which is essential from the point of view of optimising the operation of agricultural tools and minimising their negative impact on the soil.
3.3. Optimisation of Parameters and Values of Objective Functions Fx and Fy
Partial derivatives concerning decision variables are presented as a system of four equations, separately for the model
Fx, Equation (5) and
Fy, Equation (6).
The maximum value of the draught force of 438.55 N (
Table 6) was achieved with higher values of the variables
k,
d/
w, and
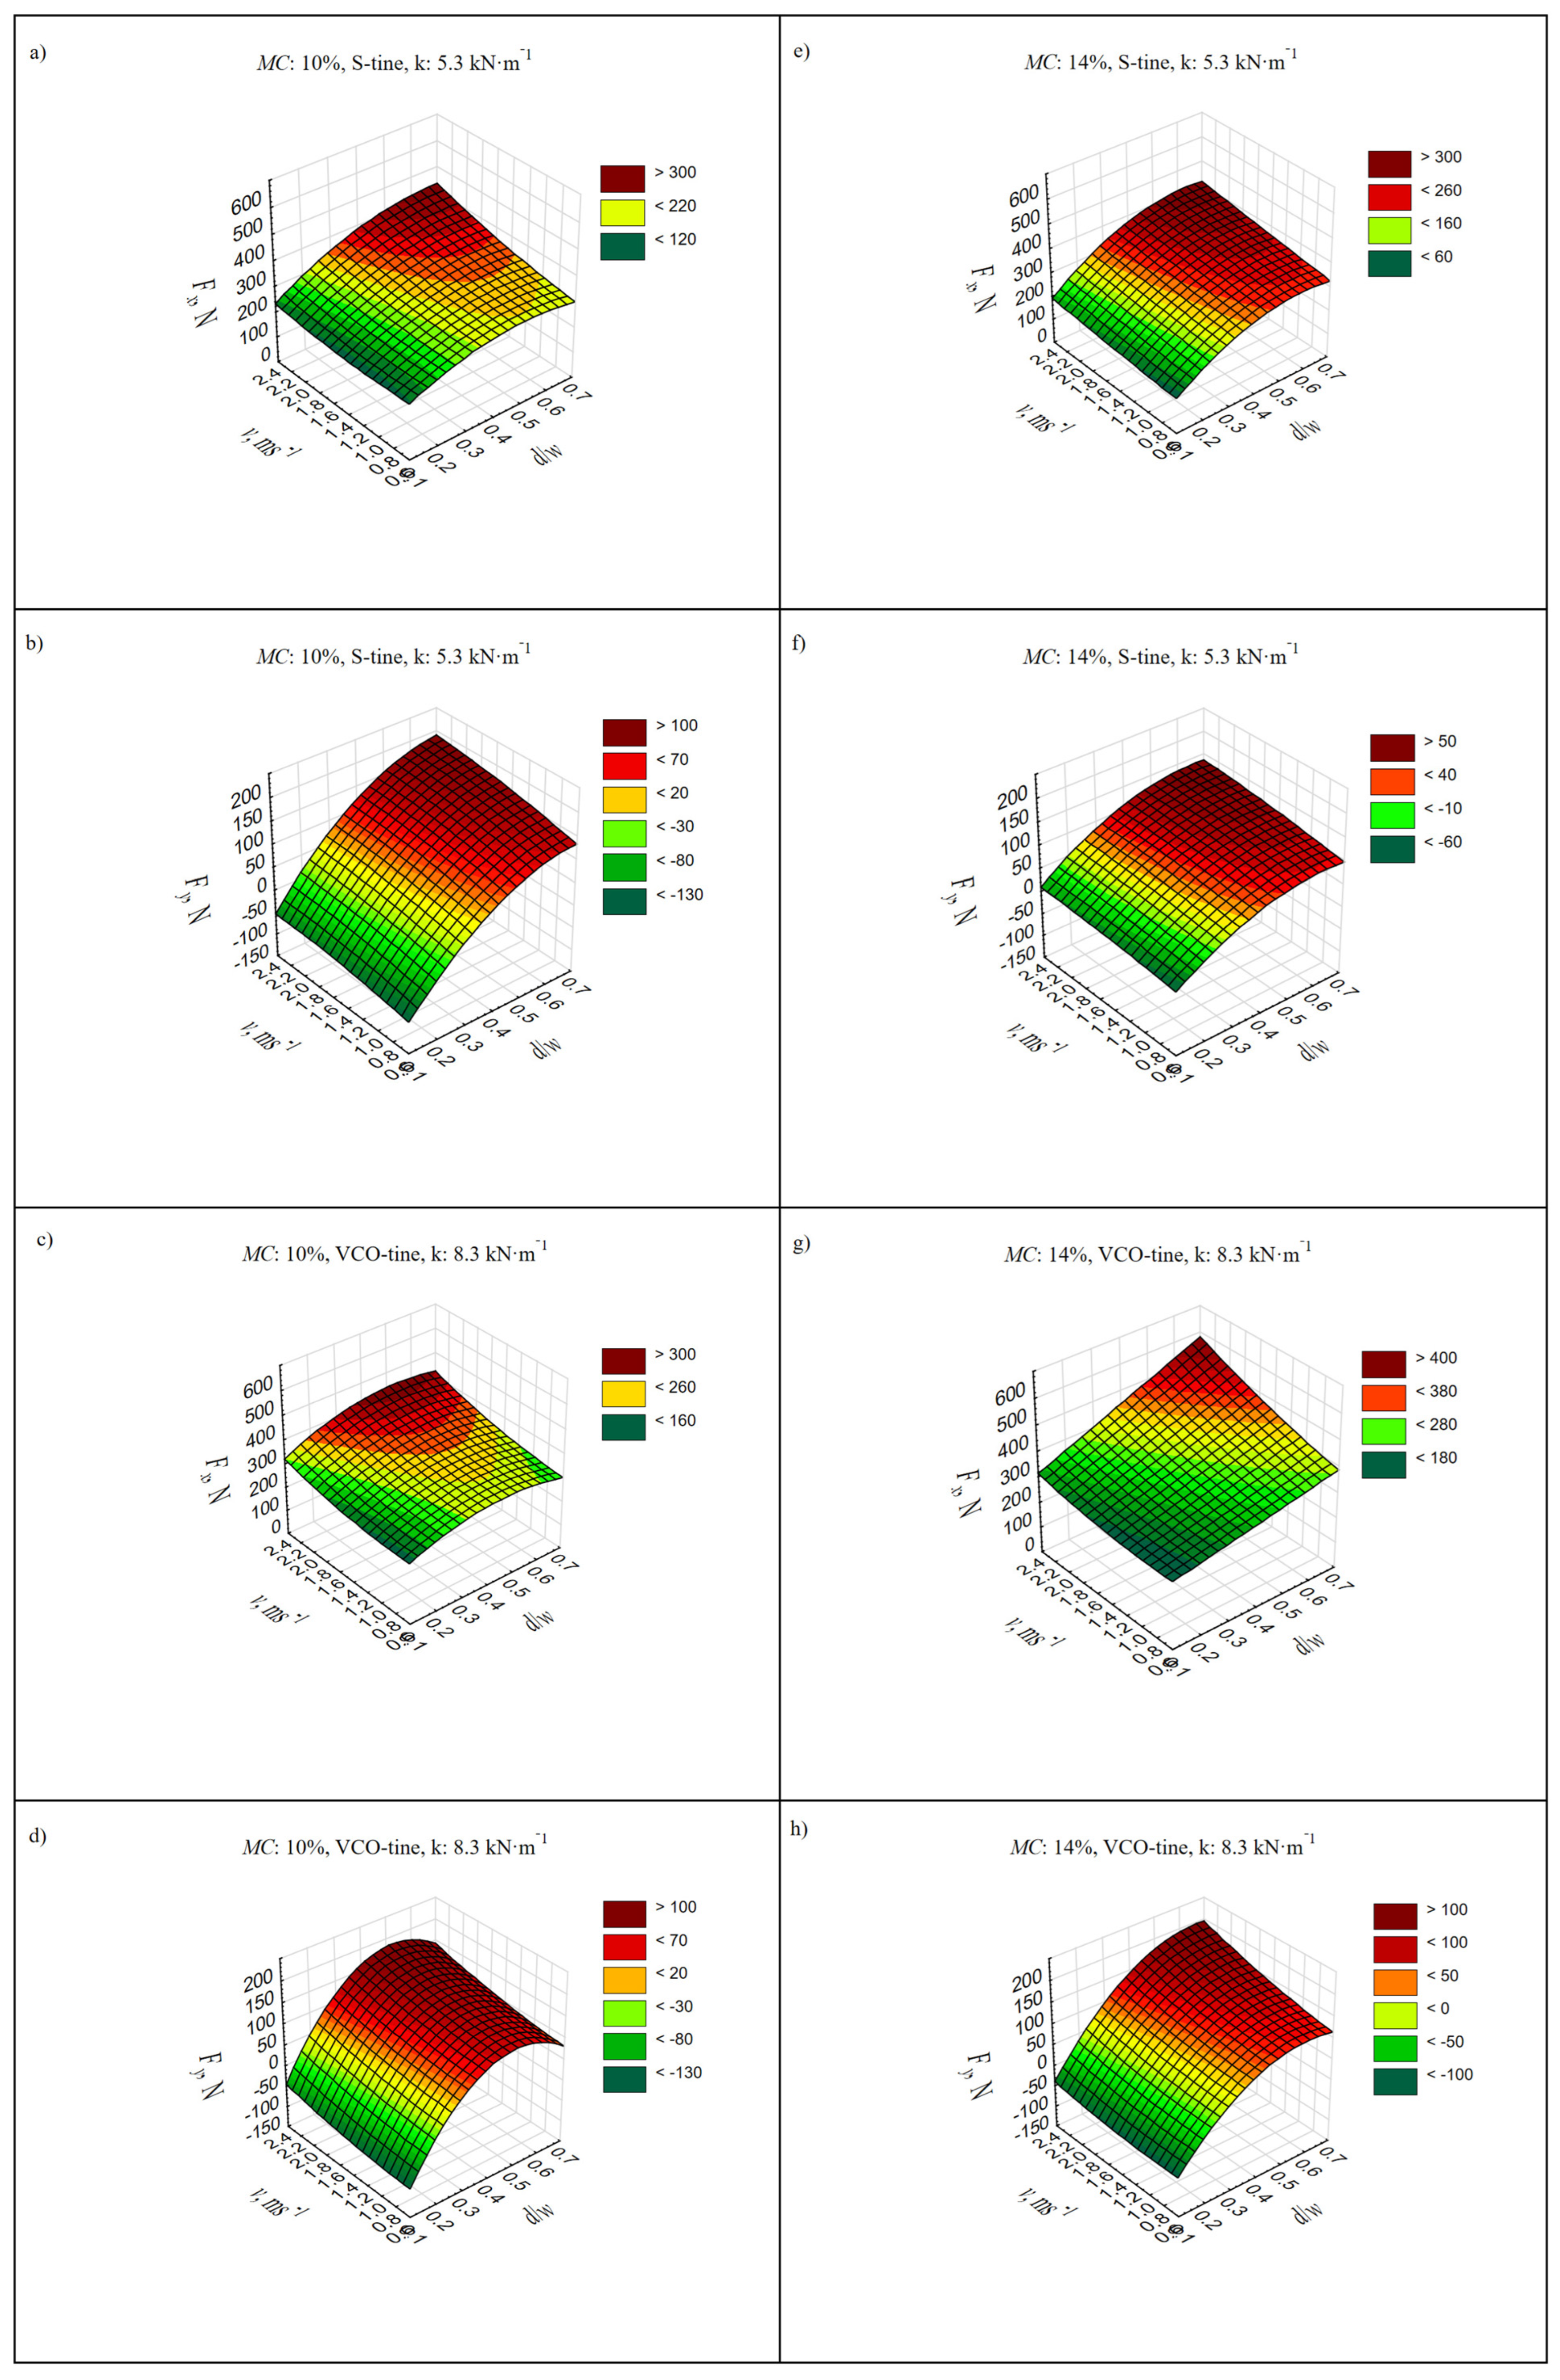
v. This confirms that tools with higher rigidity working at greater depths at higher speeds require more pulling power. A graphical interpretation of the objective function
Fx and
Fy is presented in graphs (
Figure 2). In the literature [
30], the tool’s higher stiffness and speed significantly increase its pulling resistance, especially in soils with higher moisture.
On the other hand, minimising the draught force of 98.98 N required working at lower depths at lower speeds, significantly reducing soil resistance. This aligns with research [
46] showing that shallow tools generate less draught force, promoting energy savings in agricultural processes.
Vertical force optimisation,
Fy, showed that, as in the case of pulling power, the maximum and minimum values were reached at the ends of the ranges of the technical variables. A maximum vertical force of 135.25 N was achieved at higher values of
k,
d/
w, and
v, which means that higher tool stiffness, a larger depth-to-width ratio, and higher working speed led to a higher vertical force. These values align with the research [
40], suggesting that tools working at greater depths and higher speeds generate higher vertical forces due to the more significant amount of soil being moved upwards.
The minimisation of vertical force (−84.55 N) was achieved at lower values of
k,
d/
w, and
v, suggesting that reducing the tool’s working depth, speed, and stiffness leads to lower vertical forces. Minimum values are consistent with the results [
30] indicating that tools that work shallowly and slower generate less vertical force because less soil is moved upwards. A critical rake angle has already been calculated, related to the angle of friction of the soil with the metal, which is 22.5°, relative to which the vertical force changes the sign from positive to negative [
52].
When working duckfoot at the lowest depth, the gravitational force of the soil resting on the tool and the vertical component of soil resistance was smaller than the vertical component of the soil breakout force by the tool’s cutting edge [
50]. Therefore, the vertical force value was negative at the lowest working depth. The negative vertical force can be assigned to natural sandy soil [
40]. Thus, for very small angles of attack, the proportion of vertical force from the weight of the soil wedge was less than from the adhesion force.
The optimal values of the variables were at the ends of the considered ranges, suggesting that in the analysed conditions, the best results are achieved at the extremes of the technical variables. This is visible in all eight surface plots (
Figure 2). The runs of these charts allow us to assume that a combination of
d/
w and
v values can be expected for optimal forces
Fx and
Fy with maximum values. It is, therefore, advisable to carry out tests at higher velocities where a more significant influence of the square of the speed (
v2) can be expected and with a higher depth-to-width ratio,
d/
w, e.g., by increasing the working depth. This would only be appropriate for cognitive purposes because expanding the depth of loosening excessively, e.g., in agricultural practice, would not be advisable, due to the risk of covering plants with soil. In addition, a more significant
d/
w relationship would go beyond a wide tool’s scope and apply to narrow tools. Particular attention should be paid to the same value of soil moisture
MC = 14%, which was optimal for both maximum and minimum draught and vertical force values. This result indicates that soil with this moisture content offers optimal resistance to the tool, and changes in moisture outside this range can destabilise the tool’s work process. This shows that with this moisture, the soil offers stable resistance to the implementation, which reduces variability in the results. Soil moisture affects soil adhesion and friction, crucial for soil displacement during tool operation [
41].
The developed mathematical, empirical models are characterised by minor relative errors, which, for optimal values, range from −1.72% to −4.81% (negative values indicate an overestimation of the model concerning actual values).
Optimisation of the draught Fx and vertical Fy forces using partial derivatives and the SLSQP method provided detailed information on the influence of technical and environmental variables on the value of these forces. Introducing the variable k (stiffness) into the empirical model’s Fx and Fy has enabled a more precise representation of the actual operating conditions of agricultural implements, which is essential for optimising machine operation and energy savings. The SLSQP optimisation method provided tools to accurately determine the values of variables that minimise or maximise draught and vertical forces, which is of great importance for agricultural practice.
The lower values of the correlation coefficient R2 result from dynamic changes and confounding factors that affected the pulling forces Fx and the vertical force component Fy. One of the key factors was the variability in the actual working depth of the tool due to the oscillations of the tines with different stiffnesses. Deviations of the elastic elements led to a change in the tool rake angle and, thus, to changes in the soil–tool force system. The influence of these oscillations was eliminated by averaging the values of forces using the trapezoidal method, but random fluctuations resulting from dynamic interactions remained. In addition, the experiments involved disturbing factors such as the heterogeneity of soil structure, the variability of soil density and moisture, and differences in internal and external friction angles, as well as cohesion and adhesion. These factors affected the change in the actual width of the deformed soil fragments and the non-uniformity of the work element movement. All these aspects resulted in a dispersion of results that cannot be eliminated in the empirical model, resulting in a moderate R2 value. Nevertheless, the obtained values of relative errors for optimal values in the range from −1.72% to −4.81% confirm the high prediction accuracy within the limits of the analysed operational parameters.
4. Conclusions
The main research problem was the development of mathematical, empirical models for the prediction of the draught force Fx and the vertical force component Fy, which take into account the critical parameters of duckfoots, such as tine stiffness, k, tool depth-to-width ratio, d/w, tool movement speed, v, and soil moisture, MC, which have not been thoroughly analysed in the literature so far.
The developed empirical models aimed to accurately represent the values of the forces acting on the tool, considering the non-linear relationships between the independent variables and their interactions. These models allowed for a more comprehensive understanding of implement–soil interactions, which was crucial for optimising the operation of agricultural implements under different operating conditions. Previous studies, although focused on selected parameters such as working depth or movement speed, rarely considered the stiffness of the duckfoot fixing tine and soil moisture.
The results of statistical analyses and correlations showed that the values of forces Fx and Fy were most affected by the ratio d/w and the tool movement speed v. The d/w variable had the most significant effect on both forces (Fx and Fy), which was confirmed by the relatively high values of the Pearson’s correlation coefficients. The values of the multiple correlation coefficients for the models were not very large and were 0.4996 for Fx and 0.6227 for Fy. Still, all regression coefficients were statistically significant, so the type of study can be considered acceptable.
The operating parameters were optimised using partial derivatives concerning k, d/w, v, and MC. Then, the equation system was solved using the SLSQP method. The optimisation showed that the maximum values of the forces Fx and Fy were achieved at the extremes of the considered intervals of the technical variables. The maximum draught force was 438.55 N, achieved with higher variable values such as stiffness, the ratio of depth to width of the tool, and the speed of the tool movement. The minimum value of the draught force (98.98 N) was reached at lower values of the same variables.
Similarly, optimising the vertical force Fy indicated that the maximum value (135.25 N) was associated with higher values of the same parameters. In comparison, the minimum value of the vertical force (−84.55 N) was achieved with lower values of the variables. The optimal values were at the ends of the ranges, suggesting the possibility of further research into the complex soil–duckfoot relationships. The optimisation should also be extended to soil loosening efficiency, which is directly related to the state of soil compaction.
The analysis of the results indicates that relatively small relative errors for the optimal values were obtained for the developed mathematical empirical models, which confirms the model’s agreement with the experimental results. The relative errors ranged from −1.72% to −4.81%, which is evidence of good prediction accuracy, and the negative values of the errors indicate a slight overestimation of the models compared to the actual values.
Based on the justifications carried out, there were no grounds to reject the hypothesis that the ratio of the depth to the width of the tool, d/w, the movement speed, v, the tine stiffness, k, and the soil moisture, MC have a significant effect on the draught Fx and the vertical Fy forces, as the experimental results showed agreement with the predictive values of empirical models.
The developed empirical model differs from traditional theoretical models such as the McKyes, Söhne, or Perumpral models [
50], which are based on simplified geometrical and mechanical assumptions of soil–tool interactions. These models often treat soil as a homogeneous medium based on strength criteria such as the Mohr–Coulomb theory [
45]. In contrast, the developed model considers the tool depth and width change, the stiffness tines, and nonlinear interactions between soil and tools. This allows for better prediction of traction forces in actual working conditions.
The developed empirical models have limitations resulting from the range of analysed values and assumptions regarding their mathematical structure. They do not consider dynamic effects related to the temporal variability of soil parameters, deformability of working elements, and influence of random variables occurring in actual field conditions. In addition, the models are based on experimental data obtained in controlled conditions, which may limit their application in an environment with greater soil and topographic variability. Further research may focus on developing theoretical, more universal models that will consider dynamic soil–tool interactions and the influence of random variables. Particular attention should be paid to the use of numerical methods, such as the FEM or the DEM, which will allow for taking into account soil deformation processes and interactions between soil particles and the tool. Additionally, it is worth considering the development of hybrid models, combining an empirical approach with physical modelling, which will allow for extending the range of predictions to various soil and operational conditions.


 ,
, 
