1. Introduction
Multimedia communication and security technologies are important issues in both academia and industry. The most widely used method for information security is encryption, which encrypts information so that only authorized recipients can decrypt it. However, encrypted images have the problem of potentially attracting the attention of attackers. On the other hand, data hiding (DH) [
1,
2,
3,
4,
5] is a method of covertly concealing secret data in multimedia media, with the advantage that attackers cannot easily determine the existence of the data. Due to these characteristics, DH is advantageous for covertly transmitting small amounts of confidential information to the receiving end and is therefore being extensively researched.
DH techniques can be broadly divided into non-reversible data hiding (Non-RDH) and reversible data hiding (RDH). In Non-RDH, the cover image cannot be restored to its original state after extracting the hidden information. On the other hand, RDH [
6,
7,
8,
9,
10,
11,
12,
13] allows for the perfect restoration of the original cover image after extracting the hidden data, making it ideal for applications requiring high fidelity such as medical images, military maps, and art preservation. Over the years, various RDH techniques have been developed to achieve an optimal trade-off between data embedding capacity and visual quality.
A variety of RDH techniques, including difference expansion and histogram shifting, have been developed to balance embedding capacity and image quality. Notable methods include difference expansion (DE), proposed by Tian [
8,
9], Histogram Shifting (HS), introduced by Ni et al. [
10], and Prediction Error Expansion (PEE) [
13]. These techniques have improved the performance of RDH by enhancing capacity and image quality. Tian (2003) [
8] introduced the difference expansion (DE) technique, which uses the difference between two adjacent pixels to hide data. The DE technique provides high embedding capacity and has the advantage of being able to restore the original image without loss. However, this method may have limited embedding capacity and may result in some degradation of image quality.
Ni et al. (2006) [
10] proposed the Histogram Shifting (HS) technique, introducing a method of embedding data by shifting the positions of the peak and zero points in the image histogram. This method has relatively low embedding capacity but shows excellent performance in maintaining image quality. The HS technique became the foundation for RDH research, and various modified techniques were subsequently developed. Alattar (2004) [
9] proposed a reversible watermarking technique that generalized the DE technique and applied it to quads. This method provides high embedding capacity and can restore the original image without loss. However, it requires complex calculations and may have limitations in real-time applications.
Li et al. (2013) [
14] proposed a high-fidelity RDH technique that combines Pixel Value Ordering (PVO) and prediction-error expansion (PEE). This method simultaneously provides high insertion capacity and excellent image quality, making it effective for use in various application areas. By combining PVO and PEE techniques, they reduced distortions that could occur during the data insertion process and improved the ability to restore the original image.
Dual reversible data hiding (RDH) [
15,
16,
17,
18,
19,
20,
21,
22,
23,
24,
25,
26,
27] is a technique that simultaneously achieves high embedding capacity and good image quality. This method incorporates the concept of Secret Sharing (SS) [
28,
29] to ensure data security and recoverability. SS is a technique that divides secret data into multiple pieces and distributes them, allowing the original data to be reconstructed only when pieces meeting specific conditions are gathered. Prominent examples of this method include Shamir’s SS [
28]. The main purpose of SS is to enhance data security and ensure that even if secret data are leaked, the original data cannot be reconstructed from only a portion of the pieces.
Chang et al. (2007) [
15] proposed a dual image-based RDH method using the Exploiting Modification Direction (EMD) [
30] technique. The EMD technique optimizes image quality by inserting data using the modification direction of each pixel, which allows for achieving high PSNR (Peak Signal-to-Noise Ratio) values. However, there is a potential issue of quality differences occurring between the two generated images. Kim et al. (2024) [
27] proposed a method to optimize the LSB matching revisited [
31] technique and the dual RDH method based on EMD by Chang et al. (2006) [
15]. Lee and Huang (2013) [
16] also converted secret data into base 5 secret symbols. Every two continuous secret symbols were referred as a group for embedding in an identical pixel pair. The reversibility was fulfilled by the orientation combination of pixel pairs in dual stego-images.
Lu et al. (2015) [
17] introduced a dual image-based RDH technique using LSB (least significant bit) matching. This technique uses seven rules to conceal pixel modifications and maintains high hiding capacity and image quality. By generating two stego images, it can effectively hide secret data and restore the original image after data extraction.
Huynh et al. (2015) [
18] introduced a dual image-based RDH scheme using a Sudoku reference matrix. Huynh et al. took the initiative to take a grayscale image as the secret data. Each pixel in the secret image was first converted into three base 9 numeral symbols, and then three symbols were concealed in a cover pixel pair to generate two stego pixel pairs with the help of the Sudoku reference matrix. Though a higher embedding ratio (ER) of 2 bpp could be achieved in their scheme, the image quality of each stego image was only about 36 dB.
Yao et al. (2017) [
19] improved the dual image RDH technique by using a strategy of selecting movable pixel coordinates with minimal distortion. This method generates two stego images and maintains high image quality by minimizing distortion during data insertion. This approach is particularly useful when dealing with sensitive data such as medical images and can achieve high PSNR values. Chen and Guo (2020) [
22] used the same idea as Lee and Huang [
16], but their embedding ratio reaches to 1.14 bits per pixel.
Matrix encoding (ME), discovered by Crandall [
32] in 1998, demonstrates excellent performance in terms of embedding efficiency for DH. Westfeld first implemented ME in his F5 steganography [
33] algorithm. To enhance the F5 algorithm’s efficiency for lengthy messages, Fridrich et al. (2001) [
34] proposed random linear codes. Bose–Chaudhuri–Hocquenghem (BCH) codes [
35] were later applied to achieve an optimal balance between embedding complexity and efficiency.
Zhang et al. (2006) [
36] proposed an efficient data hiding method utilizing the error detection and correction capabilities of Hamming code (HC). Later, in 2009, they introduced an advanced data hiding technique called Hamming + 1 DH (H1DH) [
37], which maximized performance. This technique extends the fundamental principles of HC to allow for the hiding of larger amounts of data. H1DH offers superior embedding efficiency compared to matrix encoding based on Hamming coding. While matrix encoding is efficient, it falls short of theoretically achievable bounds for payloads exceeding 67% of embedding capacity. LSB substitution-based DH schemes can achieve high embedding capacity.
In this study, we propose a method to maximize dual RDH performance by integrating HC with arithmetic coding (AC) compression techniques [
38,
39,
40]. Our approach utilizes two duplicate grayscale images derived from the original cover image. While HC is effective in data encoding and error correction, it has inherent limitations in embedding large amounts of data and lacks robustness as a standalone RDH solution. To address these issues, we introduce a RDH framework that compresses the HC syndrome representation using AC and subsequently embeds the compressed data through an enhanced EMD method. This combined approach ensures high embedding capacity, efficient data compression, and the reliable recovery of the original cover image.
The key contributions of this work are as follows: First, we present a novel reversible data hiding technique that seamlessly integrates Hamming coding, AC, and an enhanced EMD method to address the limitations of existing RDH approaches. Second, we achieve a significant improvement in DH capacity, reaching an embedding rate of 1.5 bpp, while maintaining exceptional image quality, with an average PSNR of 66 dB. Third, leveraging the unique strengths of HC and AC, our method ensures efficient data compression and accurate recovery, making it a promising solution for secure and high-capacity data hiding applications. Fourth, this work demonstrates the practical potential of combining multiple techniques to overcome the individual limitations of existing methods, paving the way for further advancements in RDH technologies.
This study focuses on a data hiding technique for bitmap (pixel-based) images, aiming to achieve a high embedding rate while preserving image quality. The proposed method utilizes pixel value-based modification techniques, making it difficult to apply directly to geometrically represented data such as vector graphics (e.g., SVG, AI). Furthermore, the proposed approach is designed for two-dimensional (2D) image data and is not directly applicable to one-dimensional (1D) data, such as audio or sensor data. However, with certain modifications, it may be possible to extend the method to audio data by applying a sample block-based approach or to sensor data by utilizing specific frequency bands. These potential extensions will be considered in future research.
The rest of this paper is organized as follows:
Section 2 provides a review of Hamming code as a single-error correcting code, AC, and EMD method.
Section 3 introduces the proposed dual RDH method, which utilizes Hamming code, AC, and an enhanced EMD method with dual cover images.
Section 4 presents the experimental results, and
Section 5 concludes the paper with a summary and discussion.
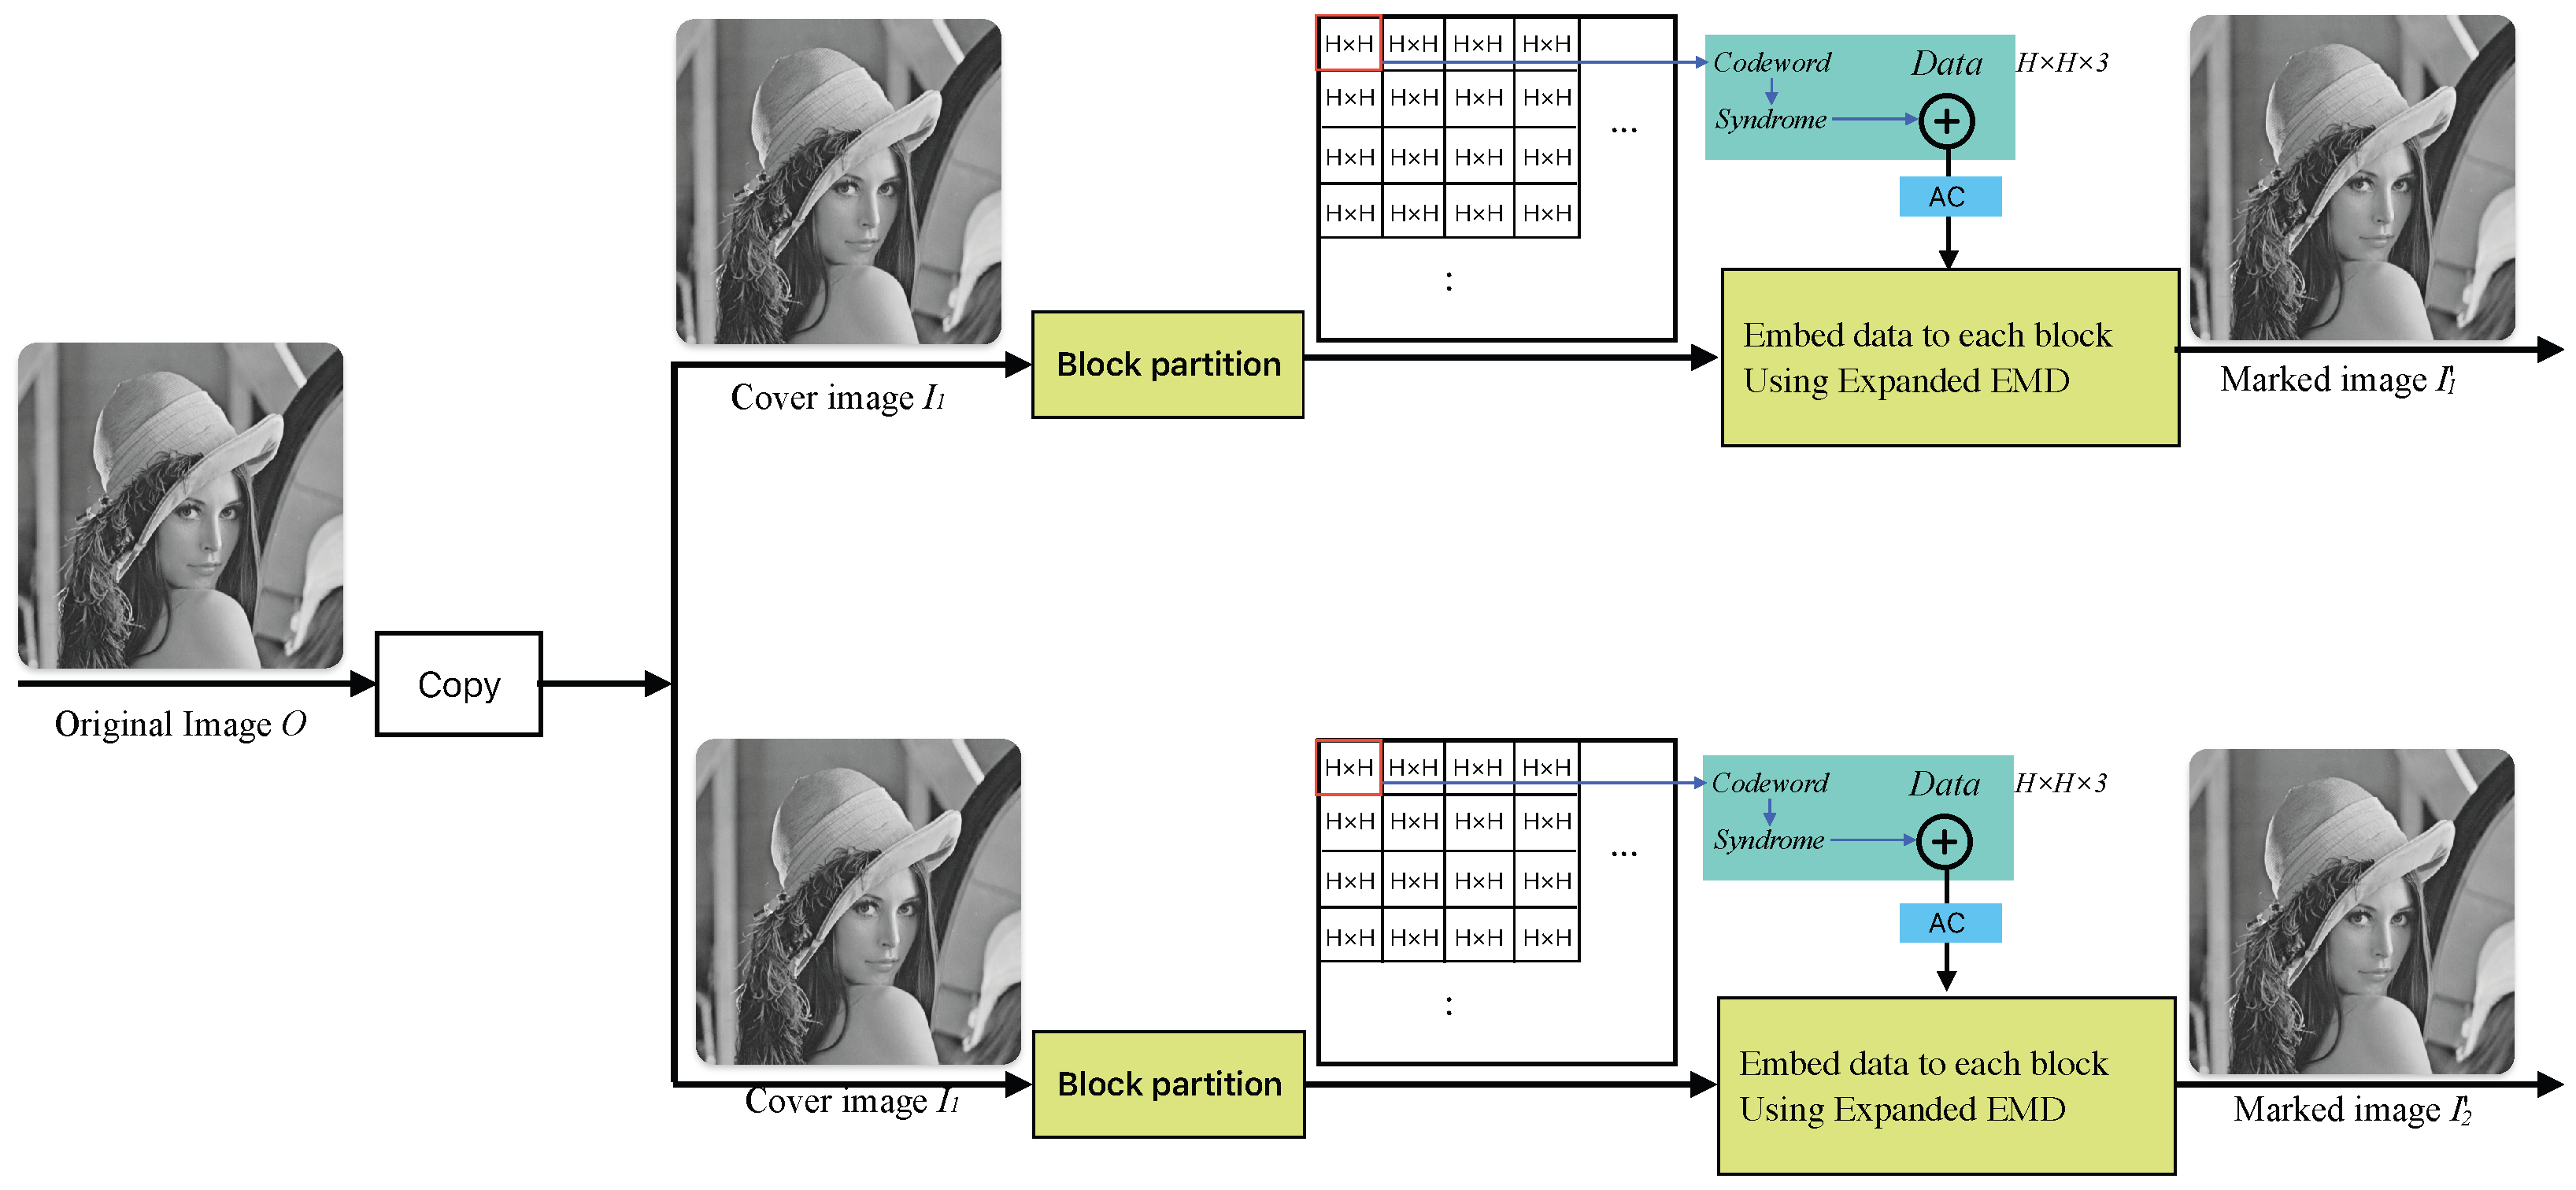
3. Proposed Method
In this paper, we propose a dual RDH method based on grayscale images (
Figure 1). This method aims to achieve DH while considering efficiency and security aspects. To this end, copies
and
of the original image
O are used as cover images. Given arbitrary-length binary data to be hidden,
, a block (
) is then read from the two cover images and assigned to
and
.
From each block, one pixel is sequentially taken from both blocks to form a codeword P, after which the HC is calculated to obtain the syndrome S. The result of XORing this syndrome S with the binary data m is stored sequentially in M. This process is applied to all pixels in the block, and then AC compression is performed to generate . The compressed binary bits are sequentially converted into quinary numbers, and the extended EMD method is applied to each pixel of the two blocks to hide the data. The dual RDH method proposed in this paper introduces an efficient data hiding scheme that ensures security, enhances data hiding performance, and maintains high image quality.
3.1. Embedding Procedure
As preparation for DH, the original image O is used as the first cover image , and a copy of the original image is prepared as the second cover image . By applying our proposed DH method to these two cover images, two marked images are produced as the final result. The data embedding procedure involves encoding the secret data using Hamming code, arithmetic coding, and extended EMD. The embedding process is outlined as follows:
- Input:
Two cover images and and data bits .
- Output:
Two marked images and .
- Step 1:
Divide the grayscale images and into non-overlapping blocks of size .
- Step 2:
Read corresponding blocks and from and . The blocks and are composed of pixels and . The total length of binary bits to be hidden in each block is .
- Step 3:
Sequentially read pixels (
and
) from the two blocks
and
read from the cover image. To embed the binary message
m, combine the upper 4 bits and upper 3 bits of the pixel
to generate a codeword
P (Equation (
3)). For the codeword
P, calculate the Hamming syndrome
S using Equation (
4). Perform an XOR operation between the syndrome
S and the corresponding secret bit
:
. Append the resulting syndrome
sequentially to the array
M:
. Continue the process for all pixels in both blocks until each pixel pair is processed.
- Step 4:
If all pixels in the block have been processed, move to step 5. Otherwise, repeat step 3 for the remaining pixels.
- Step 5:
Compress the encoded message M using the arithmetic encoding function defined in Algorithm 1. The compressed data and its length L are given by and .
- Step 6:
The compressed data
are hidden in the LSB (least significant bit) of the pixels within the blocks
and
.
is embedded into pixel pairs (
and
) using Equation (
5). The calculation results in
, which is used to adjust the pixel values according to the rules in Equation (
6) to hide the data. This process is repeated for all pixels in the block. The data length
L is stored in the pixel positions
within the blocks (
) and (
) using the methods described in Equations (
5) and (
6). The length information
L is an essential payload for the data extraction process.
- Step 7:
The block with hidden data is swapped with the corresponding block at its designated location according to Equation (
7). This process is repeatedly applied to all blocks. If there are remaining blocks to process, return to step 2. If no more blocks remain to be processed, this procedure is complete.
Finally, two marked images and containing the embedded data are created, and these two marked images are sent to different recipients.
Algorithm 3 represents the detailed description provided above in the form of a pseudocode algorithm. This algorithm performs the process of hiding secret data in two cover images, namely
and
. The images are divided into
non-overlapping blocks, and the upper bits of pixels in each block are extracted to generate codewords. The Hamming code is used to compute the syndrome, which is then XORed with the secret data. The encoded data are compressed using arithmetic coding, and the least significant bits (LSBs) of the pixels are modified to embed the data. The length of the embedded data is stored in each block, and after processing all blocks, the final marked images are generated. As a result, the modified images can be sent to different recipients.
| Algorithm 3 Data hiding algorithm |
Require: Cover images , secret data bits Ensure: Marked images - 1:
Initialization: - 2:
Divide and into non-overlapping blocks of size - 3:
for each block pair do - 4:
Encoding: - 5:
for each pixel pair do - 6:
Extract upper bits to form codeword P - 7:
Compute syndrome - 8:
- 9:
Store in encoded message M - 10:
end for - 11:
Compression: - 12:
▹Apply arithmetic encoding - 13:
- 14:
Embedding (RDH EMD) method: - 15:
for to do - 16:
Compute - 17:
▹ binary to decimal value - 18:
Compute - 19:
if then - 20:
- 21:
end if - 22:
if then - 23:
- 24:
else if then - 25:
- 26:
else if then - 27:
- 28:
- 29:
else if then - 30:
- 31:
- 32:
end if - 33:
end for - 34:
Store length L in pixels of - 35:
end for - 36:
Finalization: - 37:
Replace original blocks in with modified blocks - 38:
return Marked images
|
3.2. Data Extraction and Image Recovering Procedure
The receiver, who has the two marked images and sent by the sender, can extract the data from these images using the data extraction and image restoration algorithm that is shared between the sender and receiver. The process of data extraction and cover image restoration is the reverse of the data hiding process, and the detailed procedure is as follows:
- Input:
Two marked images and .
- Output:
One original image O and hidden bits, m.
- Step 1:
The marked images and are divided into non-overlapping blocks of size .
- Step 2:
Read blocks and from the marked image and .
- Step 3:
To extract the length of the binary data embedded in a block, Equations (
5) and (
6) are applied to the pixel positions
of blocks
and
to extract binary digits, which are then converted to a decimal number and assigned to the variable
L. Given the length
L in the block, the following process is performed: Equation (
5) is applied to the pixels
and
of blocks
and
, respectively, to calculate the value
f. The extracted data are assigned to
M, where
. Here, the
is a function that converts a decimal integer
f to a binary integer.
- Step 4:
The calculation result of Equation (
8) restores the original pixel
. The pixel
is replaced by the corresponding pixel at the same position as the two blocks. This process is repeated for a length of
to recover the block. By replacing the pixels
and
in blocks
and
that constitute the block, the restored block (as described in Equation (
9) can be obtained. Each block is completed through the process explained in Equation (
10) along with the original cover image.
- Step 5:
After restoring M, decompress it using the AC (Algorithm 2) function ; that is, .
- Step 6:
Two pixels (
and
) are read from each of the blocks
and
and assigned to the variables
and
, respectively. The codeword
is constructed by extracting the top 4 bits of
and the top 3 bits of
, as described in Equation (
3). The value of
is first converted to a decimal number and stored in the variable
l, which identifies the error position in the codeword
. The corresponding bit in
is then flipped to correct the error, and Equation (
11) is applied to compute the syndrome. Here,
denotes a function that converts binary numbers to a decimal format.
- Step 7:
Repeat step 6 for the length of . Afterwards, if there is another block to process, return to step 2. The process terminates when there are no more blocks left to process.
- Step 8:
The recovered cover images and were restored to be identical to the original image O, and the message m was successfully recovered.
Algorithm 5 presents the process described above in the form of a simplified pseudocode algorithm. This algorithm extracts the hidden data from the two marked images
and
and restores the original image. The images are divided into
blocks, and the length of the hidden data
L is extracted from specific pixel positions. The pixel values are used to recover the hidden data, and arithmetic decoding is applied to decompress the extracted data. The recovered data are then used to reconstruct codewords by combining the upper bits of the pixels, and the error positions are corrected to retrieve the hidden secret data. Finally, all the blocks are combined to restore the original image, and the extracted data are the output.
| Algorithm 4 Data extraction and image recovery algorithm |
|
3.3. Underflow and Overflow Management
In the embedding phase of our steganographic method, the careful handling of pixel values at the boundaries of the allowable range (0–255) is essential to prevent underflow and overflow. These safeguards ensure the accuracy of data extraction and maintain the integrity of pixel values throughout the process.
Underflow occurs when a pixel value drops below 0, while overflow results from a pixel value exceeding 255. Such conditions can lead to errors during data extraction, as pixel values must remain within the defined range to ensure proper interpretation. To address this, pixel pairs at the extremes—(0, 0) and (255, 255)—are excluded from both data embedding and extraction. By avoiding these edge cases, the system minimizes the risk of misinterpretation and ensures that the hidden data and pixel values are preserved accurately.
Initially, the complete set of pixel pairs available for data hiding is defined as (0, 0), (1, 1), …, (255, 255), where each pair contains identical pixel values. However, to prevent potential issues arising from boundary cases, such as calculated pixel values exceeding the valid range, the pairs (0, 0) and (255, 255) are omitted. The revised set for data embedding is therefore limited to (1, 1), (2, 2), …, (254, 254). This adjustment reduces ambiguity and errors, ensuring a smoother and more reliable embedding process.
For example, when using a pixel pair (1, 1) with a data range of 0 to 4, the possible resulting pixel pairs include (1, 2), (1, 0), (0, 1), (1, 1), and (2, 1). By carefully selecting and managing these pairs, decoding challenges are effectively mitigated, resulting in a more secure and robust steganographic procedure. Through the exclusion of extreme pixel values and the precise adjustment of pixel pairs, this method significantly enhances the reliability, efficiency, and security of the steganography system.
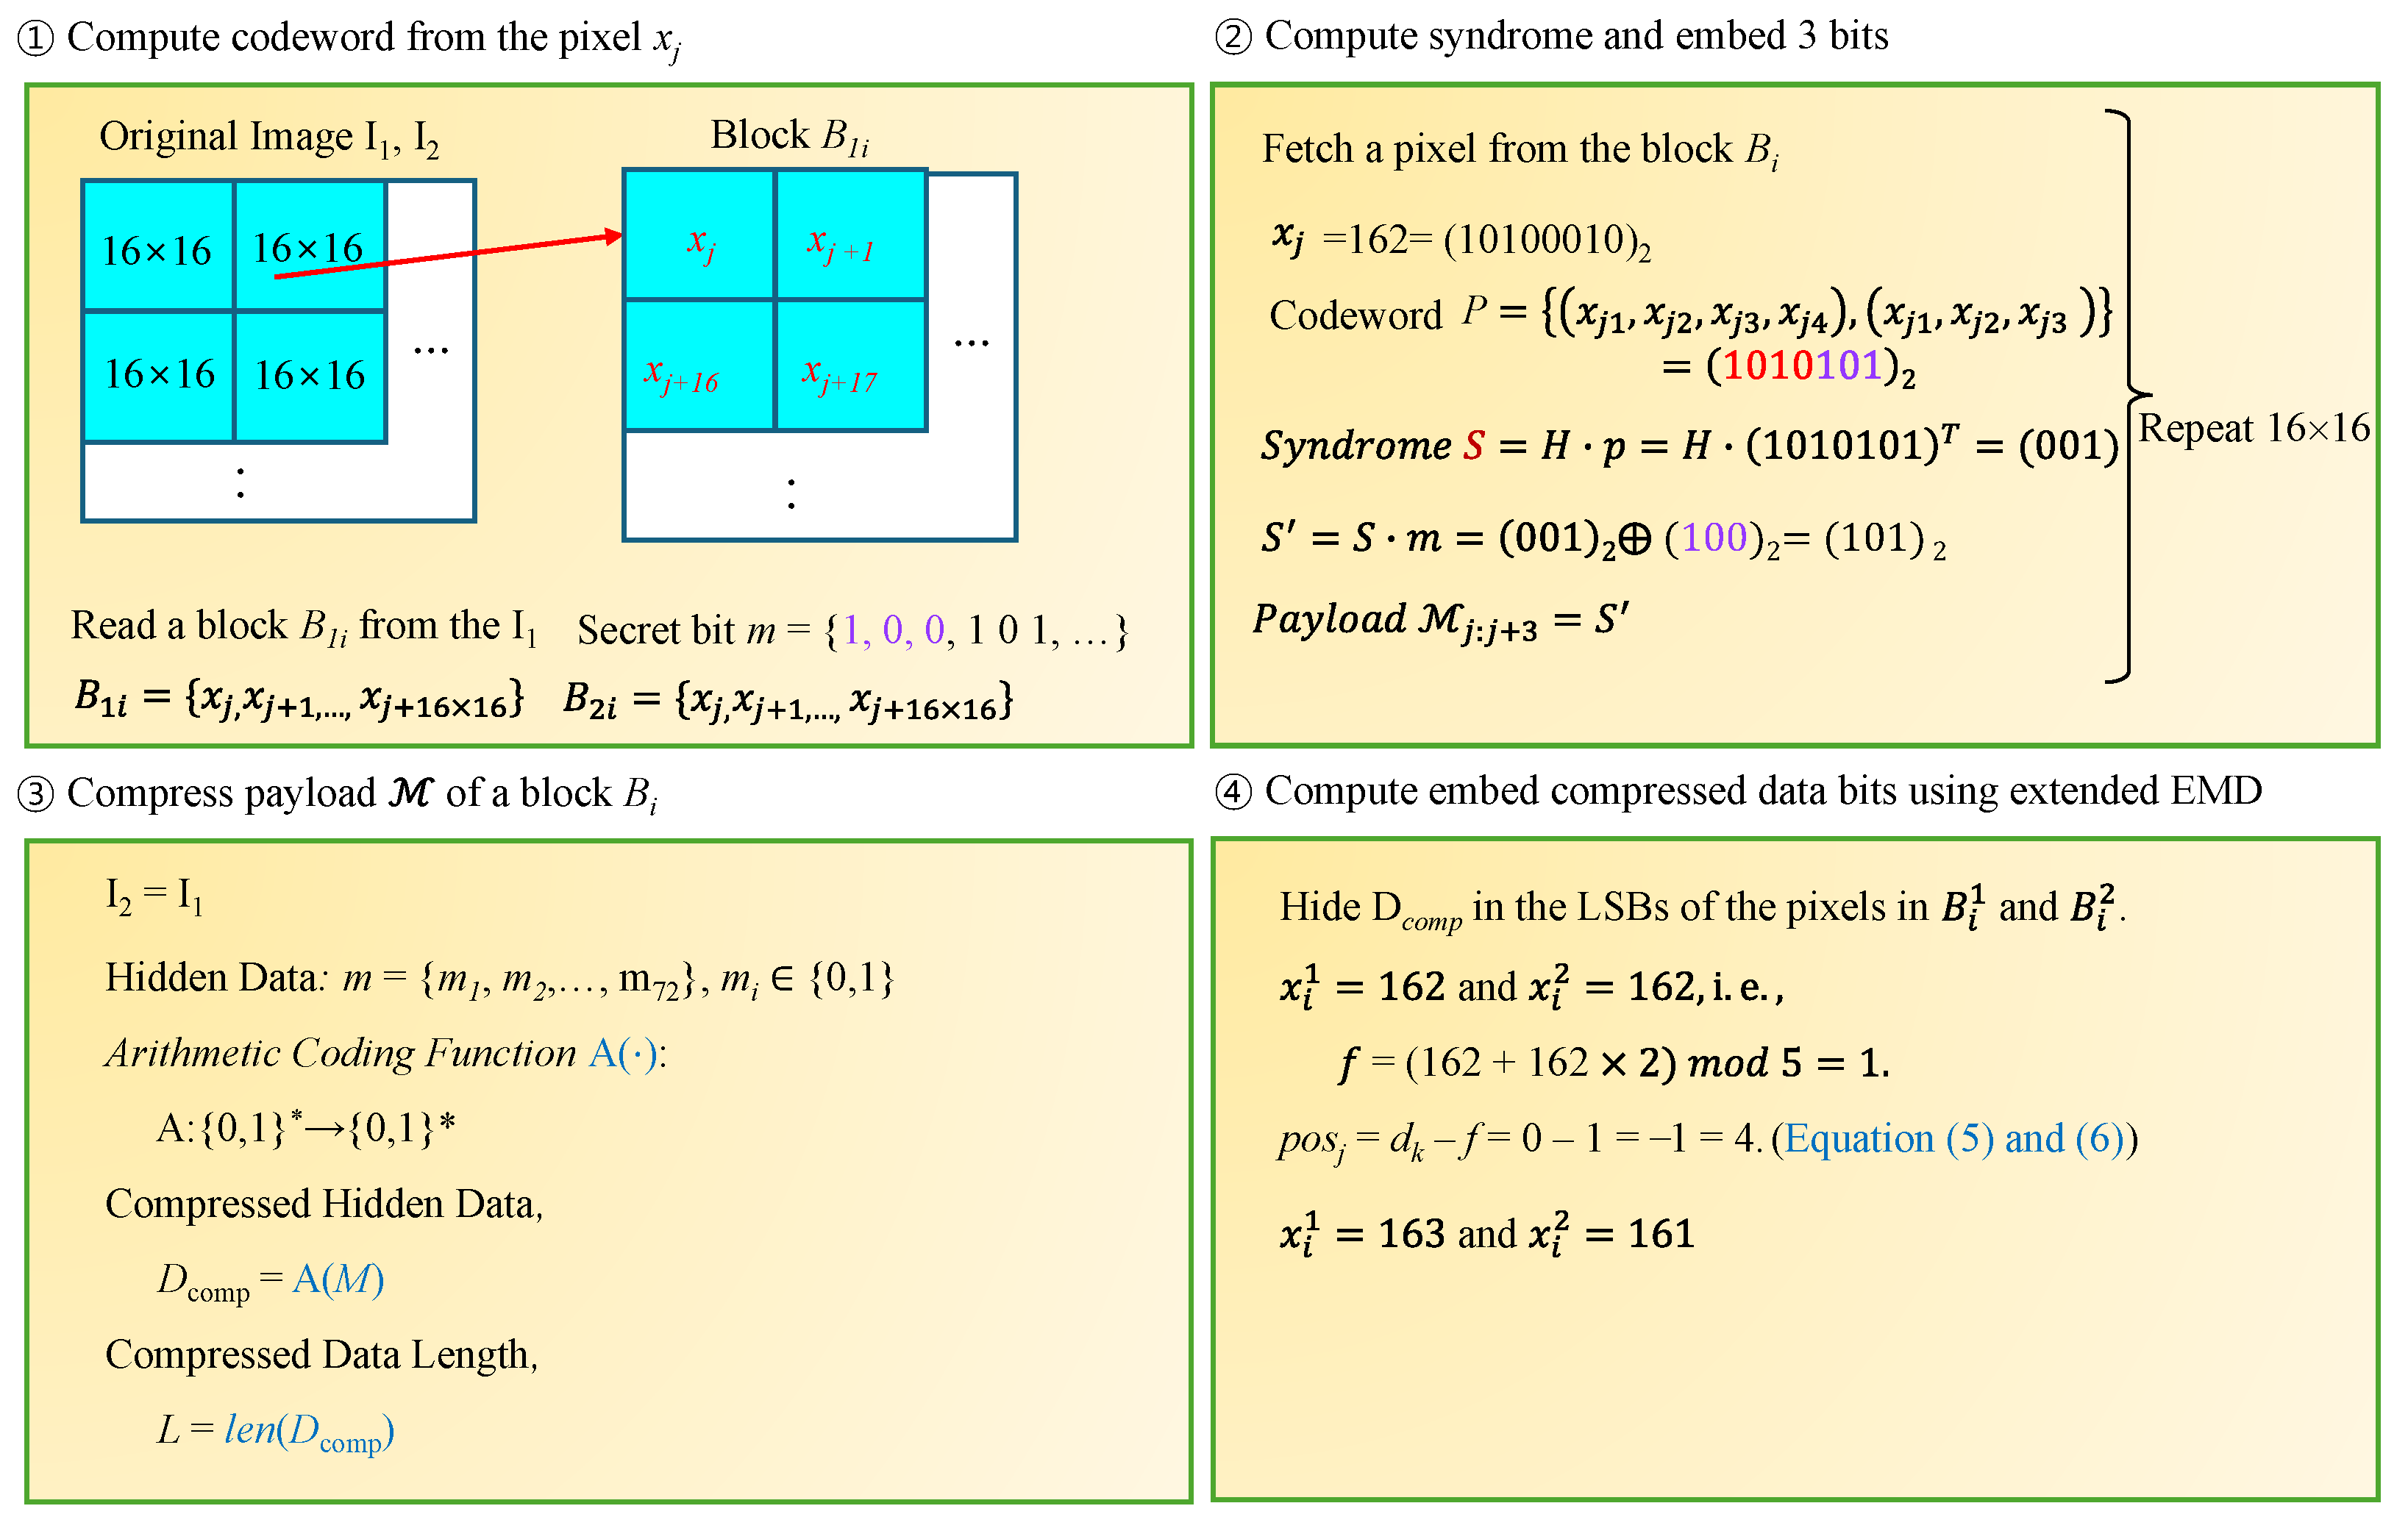
3.4. Examples
The process of hiding data for the block given in Equation (
12) is briefly explained with an example (
Figure 2). Assume the secret data
.
- (1)
The values
and
read from the first block (
Figure 2) are both assigned as 162. Using these values, the codeword
P is constructed first. The binary representation of pixels
and
is
, and the codeword
P is generated by concatenating the upper 4 bits of
with the upper 3 bits of
; that is,
=
.
- (2)
For the constructed codeword P, calculate the syndrome of the HC, i.e., . Here, H is the HC checker matrix. Perform an XOR operation between this syndrome S and the secret bit to calculate a new syndrome, i.e., . Add the syndrome to the array M; that is, .
- (3)
After completing steps (1) and (2) for all the pixels in the block, the array
M will contain data hiding information
in size. Since the amount of information is too large to be hidden in the LSB without degrading the image quality, this data are compressed using arithmetic coding; that is,
, and the compressed data are hidden in
, with their length being
L (
Figure 2). For example, if
, the compression result is
and
.
- (4)
Hide
in the LSBs of the pixels that make up blocks
and
. In this process, data hiding is performed by applying Equations (
5) and (
6). Specifically, since
and
, we have
. Therefore,
. According to Equation (
6), the two pixels
and
become 163 and 161, respectively (
Figure 2).
- (5)
Data hiding is completed by applying the process iteratively to the pixels within the block for the length L. Subsequently, the next blocks are read in order, and the same process is repeated. As a result, two cover images, and , are produced.
The data extraction process can be performed by reversing these steps.
3.5. Improvements over Existing Approaches
In this study, we analyzed various data hiding techniques proposed in previous research and introduced a new method that improves upon them by combining Hamming coding, arithmetic coding, and an enhanced EMD technique. Traditional methods typically use LSB (least significant bit) embedding or conventional EMD techniques, which often suffer from limited embedding capacity and difficulties in maintaining high image quality.
Our proposed method enhances data recovery accuracy through Hamming coding and improves compression efficiency using arithmetic coding, allowing for higher data embedding while achieving superior PSNR and SSIM values. While previous studies reported an average PSNR of 45–55 dB, our approach achieves 6–68 dB, minimizing visual quality degradation. Additionally, previous research often limited the embedding rate (ER) to 1.0 bpp or lower, whereas our method allows for up to 1.5 bpp, maximizing embedding efficiency.
Furthermore, many existing methods do not consider error correction, whereas our approach incorporates Hamming coding to enhance data stability and robustness. Additionally, previous techniques often involve high computational complexity, making large-scale data processing inefficient, while our method optimizes encoding and decoding operations using arithmetic coding, thereby improving computational efficiency.
In summary, the proposed method demonstrates significant improvements over previous studies in terms of higher embedding capacity, enhanced image quality (PSNR and SSIM), increased data stability (error correction), and improved computational efficiency (optimized coding operations).
4. Experimental Results
In this section, we evaluate the performance of the proposed dual image-based RDH method by analyzing three key aspects: data hiding capacity, the quality of the marked images, and the ability to restore the original images. To this end, we selected nine test images from the USC-SIPI (University of Southern California—Signal and Image Processing Institute) standard dataset [
44], which is widely used as a benchmark in steganography and image processing research. As illustrated in
Figure 3, the experiments utilized eight
images, including Baboon, Barbara, Boat, Goldhill, Airplane, Peppers, Tiffany, Zelda, and Elaine.
The selected images were chosen to reflect diverse texture and frequency characteristics. For example, Baboon, Lena, and Barbara contain rich high-frequency components and complex textures, while Peppers, Goldhill, and Airplane include relatively smooth regions and well-defined edges. This ensures that the proposed data hiding method is evaluated across various image patterns to verify its consistency in performance. Additionally, we used grayscale images instead of color (RGB) images to assess the proposed method, as it operates on bitmap (pixel-based) images. Grayscale images simplify the analysis by using a single intensity channel, whereas color images require independent data embedding for each RGB channel, introducing additional complexity. Therefore, the evaluation focuses on the fundamental performance of the method, while its applicability to color images requires further analysis.
Although the study is based on nine test images, the selected dataset consists of a representative mix of natural images, structured patterns, and complex textures, aligning with the standard benchmarks widely used in steganography and data hiding research. Thus, the experimental results are not limited to specific images but reflect the method’s performance across diverse image types.
Furthermore, the proposed method operates on a block-wise basis, making it independent of image resolution. While the experiments were conducted using standard-resolution images, the method can be applied to high-resolution images such as 5 MP medical images, 50 MP smartphone images, 100 MP pathological images, and 1000 MP satellite images in the same manner.
Embedding capacity is typically expressed as the number of bits per pixel (bpp) in an image, denoted as 1 bpp. The term bpp indicates how many bits can be embedded within each pixel. An embedding capacity of 1 bpp signifies that one bit can be hidden in each pixel, making the total amount of data that can be concealed directly proportional to the total number of pixels in the image. For instance, if the data are embedded at 1 bpp in an image with a resolution of
, the total embedding capacity is 262,144 bits (equivalent to 32,768 bytes or 32 KB). The embedding capacity is generally computed using the following formula (Equation (
13)):
Using the above formula, we can calculate how much data can be hidden depending on the size of the image and the value. For example, if data hiding is performed at 1 bpp and the image resolution is , the embedding capacity will be bits.
The quality of the marked image, in which data are hidden, is very important in data hiding. In data hiding, the PSNR [
27] evaluation of the marked image is a key metric that measures the similarity between the original image and the image after the data have been hidden. The PSNR is used to quantitatively assess the visual quality degradation that occurs in the marked image. The PSNR is generally expressed by the following formula (Equation (
14)):
Here, MAX is the maximum pixel value of the image, which is typically 255 for an 8-bit image. The MSE (Mean Squared Error) represents the average squared error between the original image and the marked image, and it is calculated as follows:
The symbols and stand for the pixel values of the original grayscale image and the marked image at the respective position, respectively, and is the width and height of the original image.
In data hiding techniques, the PSNR is used to evaluate the difference between the original image and the marked image; the higher the PSNR value, the less quality degradation and the more similar the marked image is to the original. Generally, a PSNR value of 30 dB or higher is considered to be nearly imperceptible to the human eye. When comparing the performance of various data hiding techniques, the PSNR serves as an important criterion. A higher PSNR value indicates that the data have been effectively hidden while maintaining the image quality. The PSNR objectively measures how well a data hiding technique preserves image quality.
Another performance measure is the SSIM (Structural Similarity Index Measure), a formula (Equation (
16)) that measures the similarity between the original image and the marked image. The SSIM is a metric used to evaluate the structural similarity between images, precisely assessing the visual quality between the original image and the one after data embedding. The SSIM mimics the way the human visual system perceives images, providing a more intuitive quality assessment. It calculates the similarity by combining three components: luminance, contrast, and structure. The formula for the SSIM is as follows:
and are the mean values of the original image I and the marked image , respectively.
and represent the standard deviations of I and , respectively.
and is the covariance between I and .
and are small constants added to ensure numerical stability in the calculations.
The SSIM value is expressed as a number between and 1, where a value closer to 1 indicates a higher structural similarity between two images. By utilizing the SSIM in DH techniques, even subtle structural differences between the original image and the marked image can be accurately assessed. The SSIM is useful for evaluating how well the primary structure and detailed information of an image are preserved during the DH process. In particular, it enables the assessment of high-frequency components (such as edges or textures in the image), allowing for the verification of whether there are significant visual changes after data embedding.
In this study, SSIM, ER, and RS values were measured to evaluate the performance of data hiding. For the SSIM, it is generally considered that values above 0.98 indicate that differences are nearly imperceptible to the human eye. In our study, we achieved an excellent average SSIM value of 0.999 or higher. Therefore, setting the minimum acceptable SSIM threshold at 0.98 or higher is appropriate.
Additionally, an ER of 1.0 bpp or higher is typically regarded as a high-capacity data hiding technique. In our study, we achieved a high ER value of 1.5 bpp. Hence, the minimum acceptable ER threshold in this study is set at 1.0 bpp or higher. Finally, RS analysis can be used to detect traces of data hiding. Previous studies have evaluated RS values within the 0.3 to 0.4 range as a safe level. In our study, the average RS value remained within 0.32 to 0.38, and thus, setting the minimum acceptable threshold at 0.35 or lower is considered appropriate.
Table 1 presents the experimental results evaluating the data hiding performance of the proposed scheme. After embedding 30,000 bits into each image, the PSNR and SSIM values were measured. The results show that the PSNR values of the marked images ranged from 65.33 dB to 68.24 dB, with an average PSNR of approximately 66.7770 dB, demonstrating a robust embedding process with minimal degradation in image quality.
The SSIM values consistently remained close to 1 across all test images, confirming that the structural integrity of the images was largely preserved even after data embedding. For the Peppers image, the PSNR values for and were measured at 65.2328 dB and 68.1832 dB, respectively, with an average PSNR of 66.7080 dB. These results confirm that the proposed method effectively maintains high image quality despite data hiding. The Elaine image achieved the highest average PSNR of 66.9104 dB, demonstrating strong resilience to distortion even after dual embedding.
In particular, the Baboon image exhibited an SSIM value of 1.0, which can be attributed to its high-frequency components and complex texture characteristics. Since the SSIM measures structural similarity, images with intricate textures tend to experience minimal perceptual changes even with pixel modifications, causing the SSIM value to approach 1.0. Compared to other test images (e.g., Peppers, Goldhill), the Baboon image contains fine patterns and strong variations, making structural changes less detectable. In contrast, images with simpler backgrounds are more susceptible to noticeable differences caused by minor pixel modifications. Therefore, analyzing the SSIM in conjunction with the PSNR provides a more comprehensive evaluation rather than relying solely on the SSIM. This study accounts for both metrics to ensure a balanced assessment of image quality after data embedding.
Overall, the proposed dual RDH scheme demonstrates excellent performance in terms of both the PSNR and SSIM. With an average PSNR of approximately 66.77 dB and SSIM values consistently close to 0.99985, the method achieves RDH with minimal perceptual degradation. These findings validate the effectiveness of the proposed approach as a high-quality and robust RDH solution for applications requiring reliable image reconstruction after data extraction.
The ER measures the amount of data that can be embedded relative to the image size, with higher values indicating better performance while maintaining image quality.
The proposed scheme consistently achieved an embedding ratio of 1.5 across all tested images, which surpasses the performance of existing methods. In contrast, methods by Chang et al. [
15], Lee et al. [
16], Chen et al. [
22], and Liu et al. [
20] achieved ER values ranging from 1.0 to 1.14, highlighting the superiority of the proposed approach in terms of data hiding capacity. The consistent results across all images demonstrate the robustness and adaptability of the proposed method to various image types.
The results emphasize that the proposed method significantly increases the embedding capacity while maintaining image fidelity. This improvement suggests that the technique can be effectively applied in applications where high-capacity and reversible data hiding are crucial, such as secure communication, medical imaging, and digital forensics. Additionally, the stability of the achieved ER values across different images further validates the reliability of the proposed approach in practical scenarios.
Overall, the experimental findings confirm that the proposed RDH method offers a competitive advantage over existing approaches [
15,
16,
20,
22], making it a promising solution for high-capacity data embedding applications.
Table 2 presents the average PSNR values of nine test images for each shadow generated using the comparative methods when embedding 5000, 10,000, and 20,000 bits of data. The results demonstrate that the proposed scheme achieves a superior PSNR in most shadow images compared to other methods. To ensure a fair evaluation, only dual image RDH methods were selected for comparison. The studies included meet the following criteria:
Dual image RDH methods were chosen to maintain consistency with the proposed approach and avoid unfair comparisons with Single-Image RDH techniques.
Well-cited and representative studies in the field were selected to highlight key advancements and distinctions.
Studies providing PSNR, SSIM, and ER metrics were included to enable an objective performance comparison.
Among the existing approaches, Liu et al. [
20] and Zhang et al. [
26] achieved the highest PSNR values, apart from our proposed method. Zhang et al.’s [
26] approach improves the data hiding efficiency by embedding and extracting data using a vector coordinate transformation (TOC) approach without requiring a codebook. This method minimizes unnecessary additional data storage and reduces distortions, leading to higher PSNR values. As a result, it effectively balances high embedding capacity and image quality preservation. On the other hand, the methods proposed by Lu et al. [
23] and Lee et al. [
25] achieved maximum PSNR values of 61.25 dB and 65.33 dB, respectively, which are relatively lower than those of the methods compared in
Table 2.
While our method already demonstrates significant PSNR improvements over previous approaches, further PSNR optimization remains a crucial research objective. Although a PSNR above 30 dB is generally considered to be visually imperceptible, optimizing the PSNR is still essential for data hiding research. A higher PSNR is particularly critical in applications requiring high-fidelity image quality, such as medical imaging, forensic analysis, and security-sensitive environments. Additionally, recent advancements in AI-based steganalysis suggest that higher PSNR values can reduce the likelihood of detection, making data hiding techniques more robust against automated detection systems.
Furthermore, increasing the PSNR while maintaining a high ER presents a technical challenge, and our method demonstrates that high-quality data hiding can be achieved without compromising capacity. Therefore, PSNR optimization in this study is not merely aimed at surpassing 30 dB but rather at maximizing the applicability of the proposed method across different domains while enhancing its resistance to detection.
Regular–Singular (RS) analysis [
45] is a statistical method used to evaluate the detectability or quality changes resulting from data hiding in images. This analysis classifies pixel blocks in an image as either “Regular” or “Singular” to assess the impact of data hiding on the statistical properties and block patterns of the image. Typically, in the natural state of an image, “Regular” blocks make up the majority, while the proportion of “Singular” blocks gradually increases as data hiding is performed.
RS analysis proceeds in the following steps:
- (1)
Block Generation: The original image and the marked image are divided into multiple small blocks. Typically, the block size is set to pixels.
- (2)
Applying Masking Function: A masking function is applied to each block to evaluate changes in the block. The masking function modifies the pixel values of the block in a specific manner. The most commonly used masking functions either increase or decrease the difference between pixel values. For example, if the pixel values of a block are , after applying the masking function, the block becomes .
- (3)
Calculating RS Value: The RS value is calculated using the number of Regular and Singular blocks. This can be defined as follows:
Here, and represent the number of Regular and Singular blocks, respectively, after the masking function is applied. The same calculation is performed when the masking function is applied in the opposite direction. When two masking functions are applied, the RS value can be obtained using the values and for each case.
- (4)
Detecting Data Hiding: The presence of data hiding is assessed by analyzing the RS value. Generally, if the RS value is close to 0, it can be determined that no data have been hidden in the image. If the RS value deviates significantly, it can be concluded that data hiding has occurred.
This method is particularly useful when compared to the statistical characteristics of the original image and can be used to detect the presence and intensity of hidden data in the image. RS analysis can identify traces of data hiding and assess the integrity of the image.
The two RS analysis results in
Table 3 and
Table 4 were conducted on two different marked images,
and
. Each experiment measured RS values for various images, such as Boat, Barbara, Tiffany, Pepper, and Goldhill, using different message lengths (20,000 bits and 50,000 bits). This evaluation analyzes the differences and consistency of the RS values by examining the measured values of
,
,
, and
for each image.
In the Pepper image, the RS values for both and are similarly observed at 0.3308 (or 0.3309) for 20,000 bits and 0.3305 (or 0.3309) for 50,000 bits. This suggests that the two hiding methods exhibit almost identical statistical characteristics in the Pepper image. As the message length increases, the RS values show a slight decreasing trend, which consistently appears in both images, indicating that data hiding has minimal impact on the statistical properties of the image.
For the Goldhill image, the RS values show highly consistent results in both experiments. For a 20,000-bit message, the value is measured at 0.3309 (or 0.3316), and for a 50,000-bit message, the value remains nearly the same at 0.3317. The Goldhill image contains natural scenes with complex textures, which helps to reveal the effects of data hiding more clearly.
Overall, the two experiments yielded very similar RS values for the same image, suggesting that the two proposed data hiding methods have a consistent impact on the statistical properties of the image. The consistency of RS values for each image indicates that the data hiding methods can effectively conceal data without significantly compromising the statistical integrity of the image. Additionally, the minimal variation in RS values as the message length increases implies that the proposed methods maintain stable performance across various message lengths.
Table 3 and
Table 4 summarize the results under specific experimental conditions. Instead of including all nine test images, representative images were selected to effectively illustrate the key trends observed in the experiments. The selection includes images with different texture characteristics to ensure a balanced evaluation. However, all nine images were tested, and the complete results remain consistent with the trends presented in these tables.
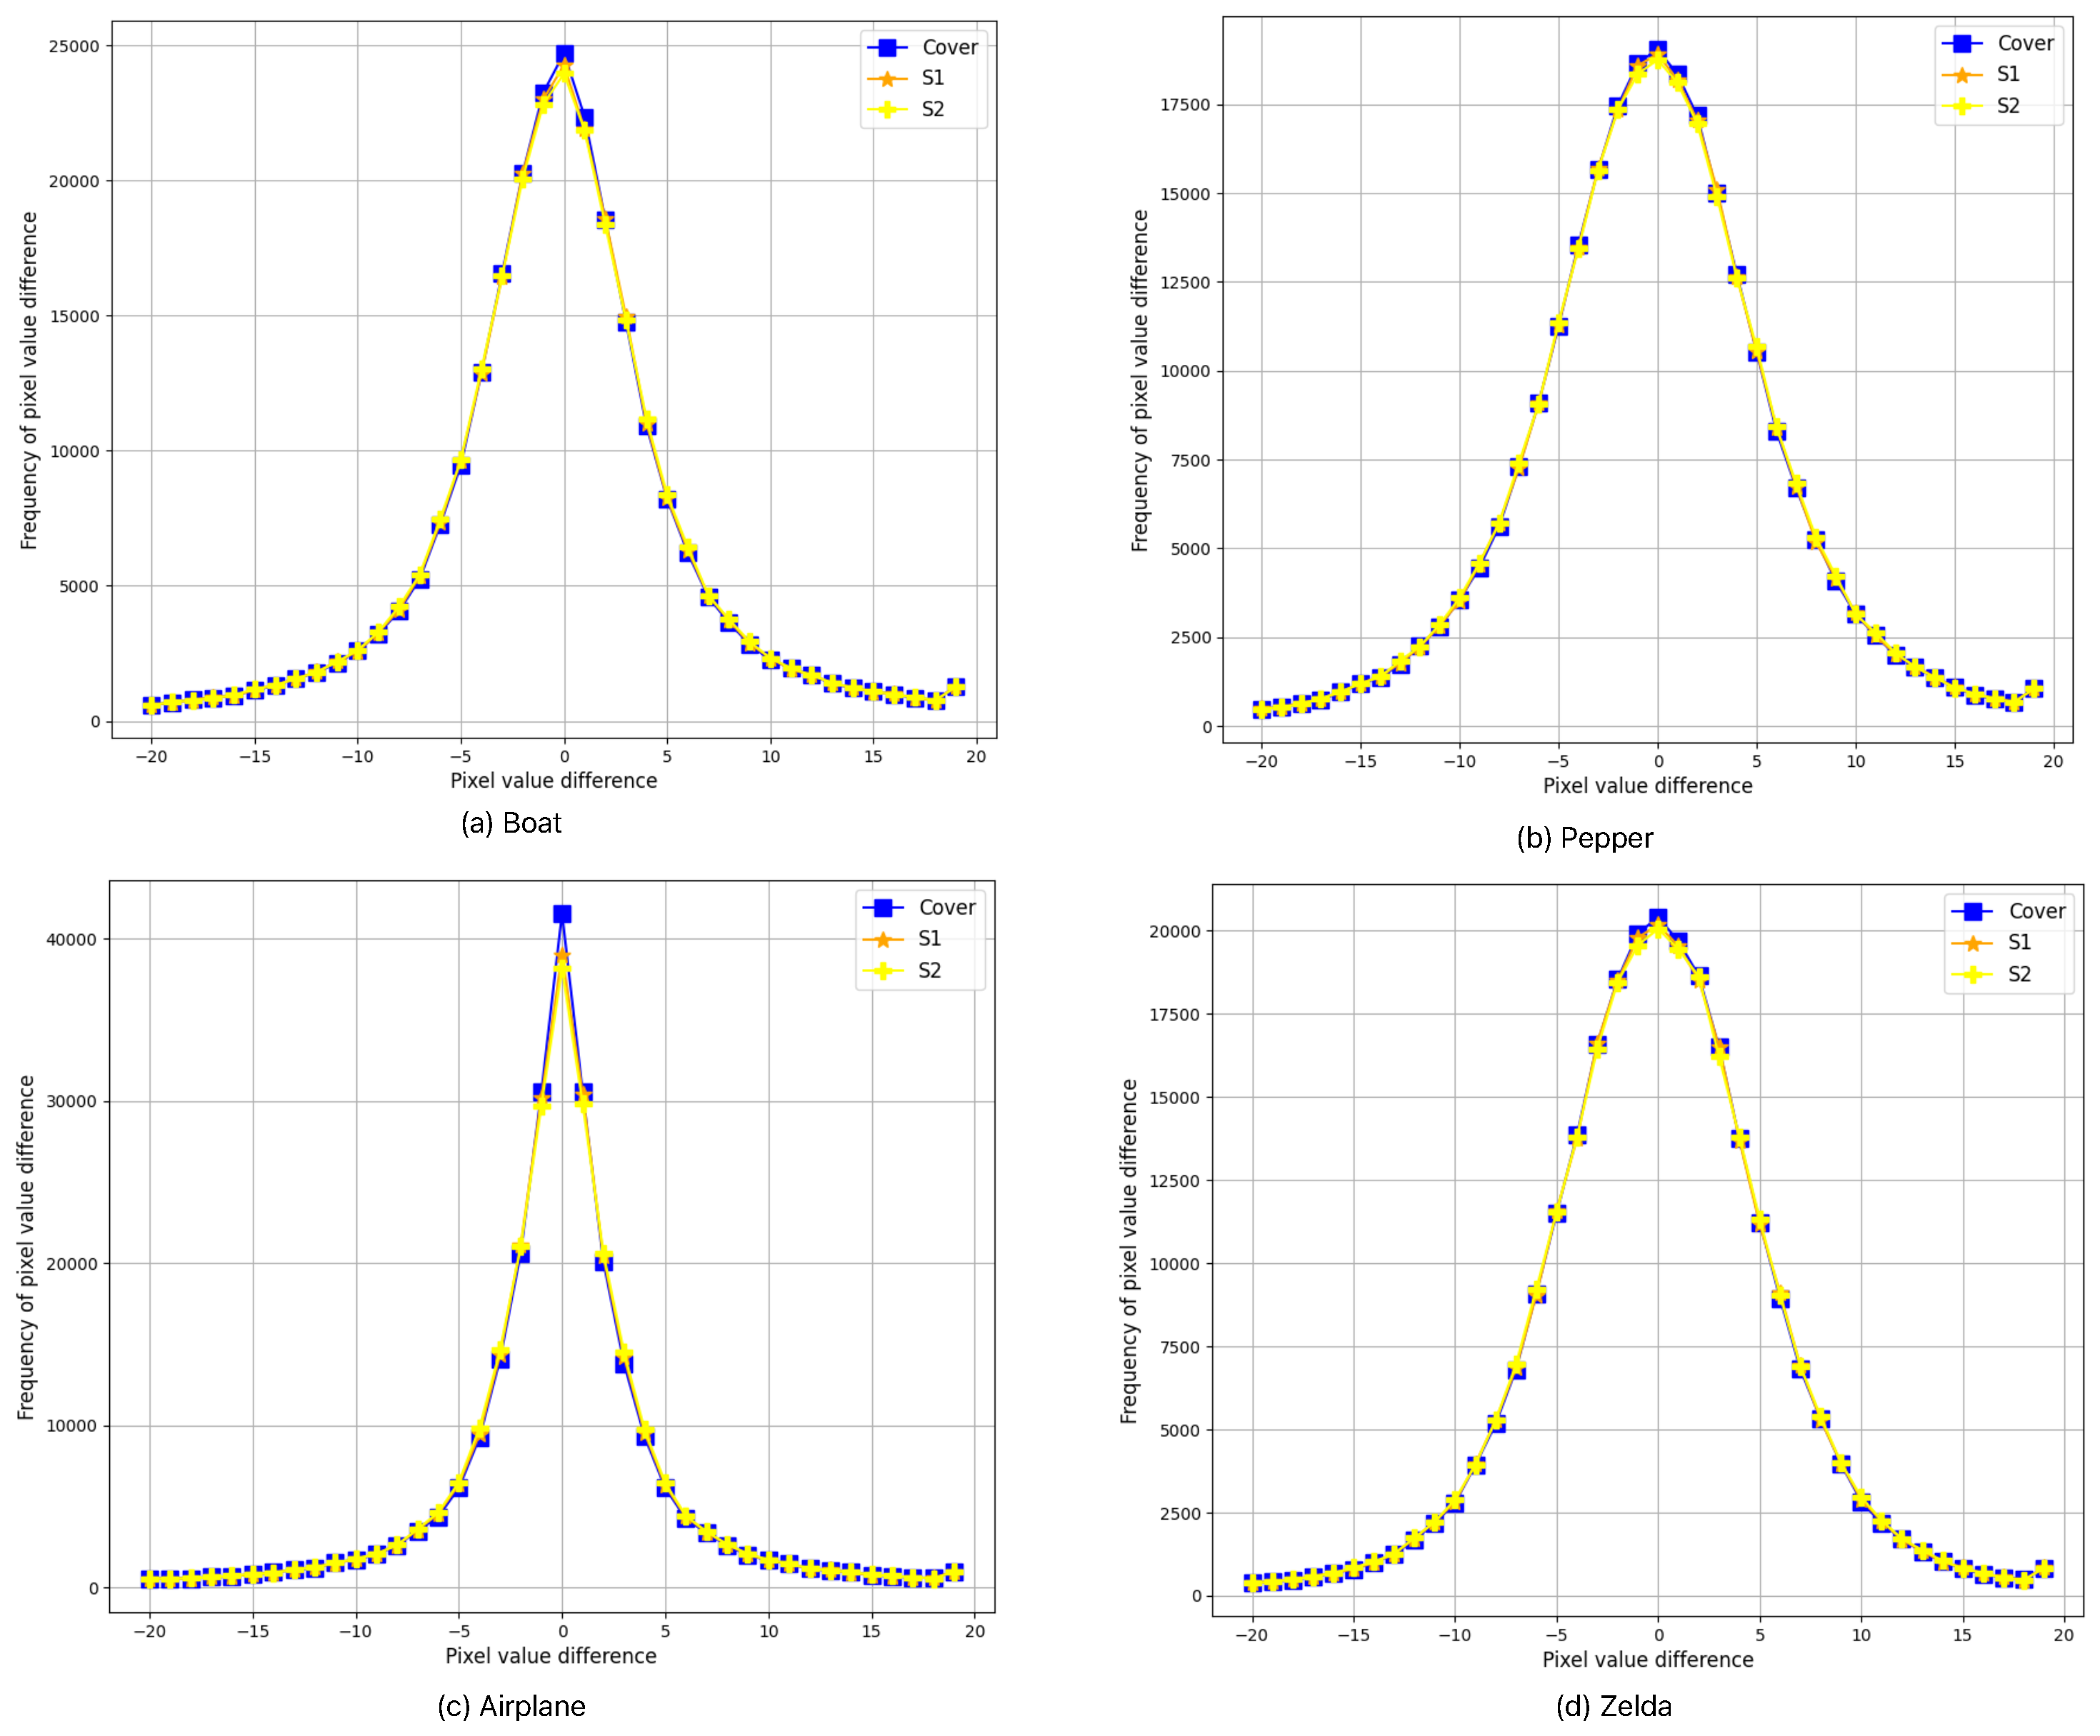
Figure 4 shows the results of analyzing the pixel value difference (PVD) histogram to evaluate data hiding performance. The PVD histogram represents the differences between adjacent pixels in the image, playing a crucial role in assessing how the distribution of pixel values changes after data hiding.
In this study, the PVD histograms of the original image and the stego image (the image with hidden data) were compared. Through histogram analysis, the impact of data hiding on pixel value differences in the image can be visually observed. When data is hidden in the image, subtle changes may occur in the shape of the histogram, which can be more pronounced in regions with small difference values. These changes indicate that some pixel values were adjusted during the data hiding process.
If the histogram does not differ significantly from the original image, it indicates that data hiding has been successfully performed without causing noticeable visual changes. Conversely, if there are significant changes in the histogram, it suggests that the data hiding process may be easily detectable.
The analysis of the four images presented in
Figure 4 shows that the histograms of the original image and the stego image are almost identical. This indicates that data hiding was effectively performed, and the hidden data have minimal impact on the visual quality. Therefore, this experiment demonstrates the successful application of the PVD-based data hiding technique.
The selection of test images was carefully made to cover a diverse range of characteristics, ensuring a fair evaluation of the proposed method. The chosen images represent different levels of texture complexity and frequency components, making them well suited for testing the robustness and visual impact of the proposed reversible data hiding technique. Moreover, as in previous studies, we focused on commonly used benchmark images rather than evaluating the entire dataset, as not all images in the USC-SIPI dataset are relevant to reversible data hiding research.


