1. Introduction
With the development of 3D printing, its applications are increasing. The technology is ideal both in industry, where it is used to print designs and prototypes, among other things, and in less obvious fields such as medicine. It is possible to create teaching aids in this way, such as anatomical models, or elements intended for direct permanent contact with the human body. The use of 3D printing in medicine makes it possible to produce individual pieces in a short period of time, minimizing production costs [
1].
One of the main fields of medicine where 3D printing has found its application is dentistry. The possibilities offered by this technique have made the process of creating dental restorations more precise, efficient, and customized for even the most demanding patients. Using incremental technologies, elements necessary for implant-prosthetic treatment, such as temporary prosthetic restorations designed to be attached to dental implants, are increasingly being made. They are mainly used in the osteointegration stage of the new implant with the bone, where they have both an aesthetic function, recreating the patient’s smile from the first day after the procedure, and also a functional one, making it possible to return to normal life while waiting for the final permanent prosthesis [
2,
3].
Depending on the incremental technology used, different groups of materials are used, and so for FDM (Fused Deposition Modelling), these are thermoplastic materials, and for SLS (Selective Laser Sintering) photopolymer materials. In recent years, these are the ones that have gained popularity in dentistry [
4,
5]. Compared to other groups of materials, photopolymers stand out for their fast production time and high aesthetics of fabricated parts, making them an attractive choice for use in the production of temporary prosthetic restorations. Although these products are intended for use in the human body for no longer than 6 months, the durability of the materials under the changing conditions of the oral cavity, where they are exposed to dynamic chewing forces and temperature, is still a topic of research [
4,
6].
During activities of daily life such as speaking or chewing, a person makes an average of about 1500 to 2000 jaw movements per day, so the photopolymer materials used in dentistry must show sufficient resistance to cyclic loads [
7,
8]. The forces that occur during the occlusion phenomenon accompanying the contact between the upper and lower teeth can lead to the phenomenon of material fatigue, which can lead to wear or damage. In the context of temporary restorations that are to be used for only a few months, this aspect is extremely important. Any inconsistencies that arise in the healing stage of the oral cavity can affect the patient’s comfort and health. Unfortunately, the available research on materials used in 3D printing in dentistry is mainly based on evaluating mechanical strength under static conditions [
9]. The subject of fatigue testing remains largely under-researched.
Comprehensive fatigue strength analyses of materials used for temporary reconstructions on implants are lacking in the literature [
10]. Available studies focus on evaluating materials such as polyamides, polycarbonates, and epoxy resins, which are not used in medicine due to the lack of confirmation of their neutrality in the human body environment. They show that these materials have a high resistance to static loading, but their behaviour under cyclic loading is less stable, limiting their use in demanding oral conditions [
11,
12,
13]. In consideration of the above, there is a need for full fatigue analyses of materials used in implant prosthetics for additive technologies. These will allow us to assess how these materials behave under prolonged, repetitive mechanical loads, sometimes even exceeding the patient’s recommended range of use.
Periodontal testing, otherwise known as fatigue analysis, is a key element in assessing the durability of dental materials, which usually show high resistance to static loads. Those that also score high on fatigue load resistance can significantly improve the quality and longevity of temporary restorations, which has a direct impact on the success of implant-prosthetic treatment.
When considering the area of research on the effect of temperature on materials used for temporary restorations, the most information can be found in the area of recording dimensional changes (shrinkage) due to the curing process of resin fillings [
14,
15,
16]. It should be noted that in the field of research on resinous dental materials, there is a lack of information on thermal expansion (contraction) during the operation of these materials in and outside the oral cavity during hygienic procedures performed on them.
The purpose of the conducted research is to perform fatigue analyses of the selected 3D printing materials used as temporary prosthetic reconstructions on dental implants. Three materials commonly used in implantology photopolymers were selected: NextDent Denture 3D, NextDent C&B MFH Bleach, and Graphy TC-80DP [
9,
17,
18]. Their resistance to cyclic loading was analyzed to identify material properties that may contribute to potential damage or failure during use. A method was also proposed for the initial evaluation of the materials used for temporary dental restorations in terms of their thermal expansion and dimensional stability during their cyclic heating and cooling in the temperature range normally encountered during their normal use. The present work is intended to fill the research gap regarding the behaviour of 3D-printed dental materials under cyclic loading. The pilot study conducted will provide preliminary results that can form the basis for more detailed and advanced research in this area.
2. Materials
Currently, in restorative dentistry, a widely used group of materials is temporary materials. They enable prosthetic care for patients during the post-procedure period, such as tissue healing or implant osseointegration, adaptation of prosthetic restorations to the function of the masticatory system, and aesthetic acceptance by the patient. These materials can be shaped using injection moulding, milling, or manual modelling. The 3D printing method allows for the creation of complex shapes, structural homogeneity, and time and cost optimization [
19,
20,
21].
There are various 3D printing methods with specific materials; however, the most commonly used is LED projector-based printing, which cures photopolymer resins. In this study, the Phrozen Sonic Mini printer (Phrozen Tech. Co., Ltd., Hsinchu City, Taiwan) with an 8K resolution was used, along with medically certified resins: NextDent C&B Bleach, NextDent Base Light Pink (NextDent B.V., Soesterberg, The Netherlands), and Harz Graphy TC-80DP (Graphy Inc., Seoul, Republic of Korea).
After printing, a post-production protocol recommended by the manufacturer was applied, which includes ultrasonic cleaning to remove uncured resin from the surface of the print, and UV curing, during which the print is dried and cured in a UV chamber to achieve its full physical properties.
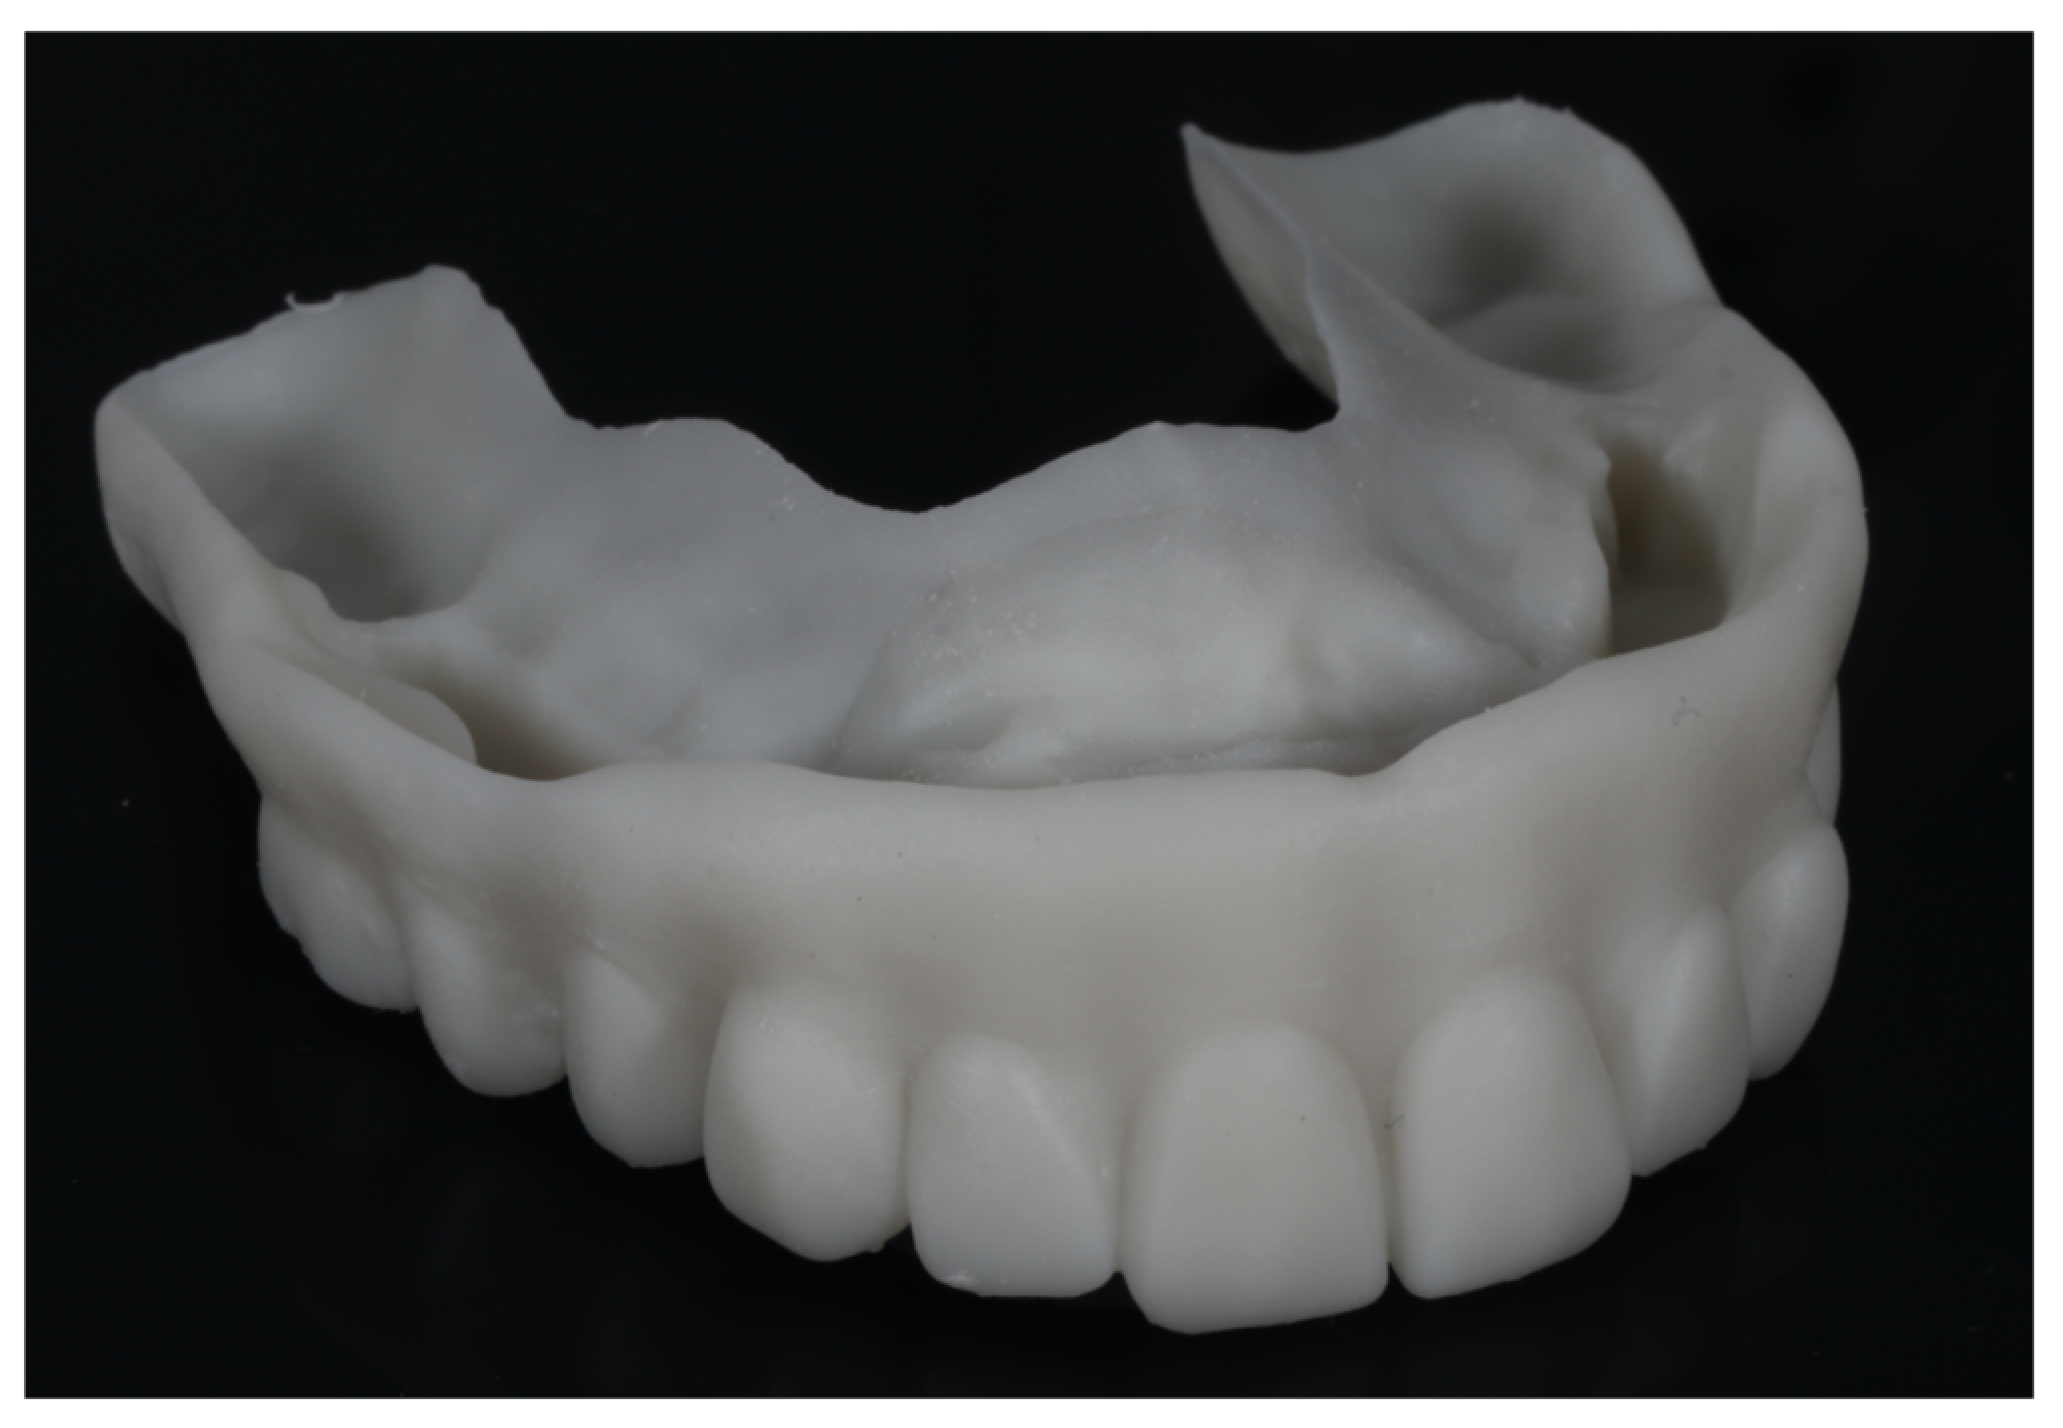
The creation of precise biocopies replicating complex structures with structural uniformity is made efficient and cost-effective through advanced techniques like 3D printing. After scanning a removable prosthetic restoration, it is printed and post-processed before being delivered to the patient as a temporary solution. This temporary restoration serves the patient during the necessary period for manufacturing the final restoration using definitive materials. An example of a restoration provided to the patient on the same day is shown in
Figure 1.
Digital Smile Designs (2D DSDs and 3D DSDs) can be swiftly and accurately transformed into physical models using 3D printing technology. The primary objectives during the design and fabrication of such prosthetic restorations are to improve the functionality of the masticatory system, enhance aesthetics, and assess whether the patient adapts to the new occlusal conditions [
22,
23,
24].
Temporary prostheses are a key component of the prosthetic treatment process, allowing the patient to maintain chewing function and aesthetics during the transitional period. Depending on the requirements, these prostheses can be made entirely from a single material, simplifying the production process and increasing structural durability. Alternatively, they can be fabricated from different materials to achieve higher levels of aesthetics and functionality [
25,
26].
Figure 2 shows a prosthesis composed of two main parts: a pink section made of NextDent Denture 3D, mimicking gum tissue, and a white section made of NextDent C&B Bleach, replicating tooth structures. These two parts were manufactured separately and subsequently joined using an adhesive cured with UV light.
The method of assembling a prosthesis from different materials, as demonstrated in the example, provides greater flexibility in tailoring the properties to the individual needs of the patient. For instance, the gingival section can be made from a more flexible material to enhance comfort, while the dental section is typically rigid and abrasion-resistant. The connection of these two elements requires precision and a suitable adhesive that ensures durability and a secure bond [
27,
28,
29].
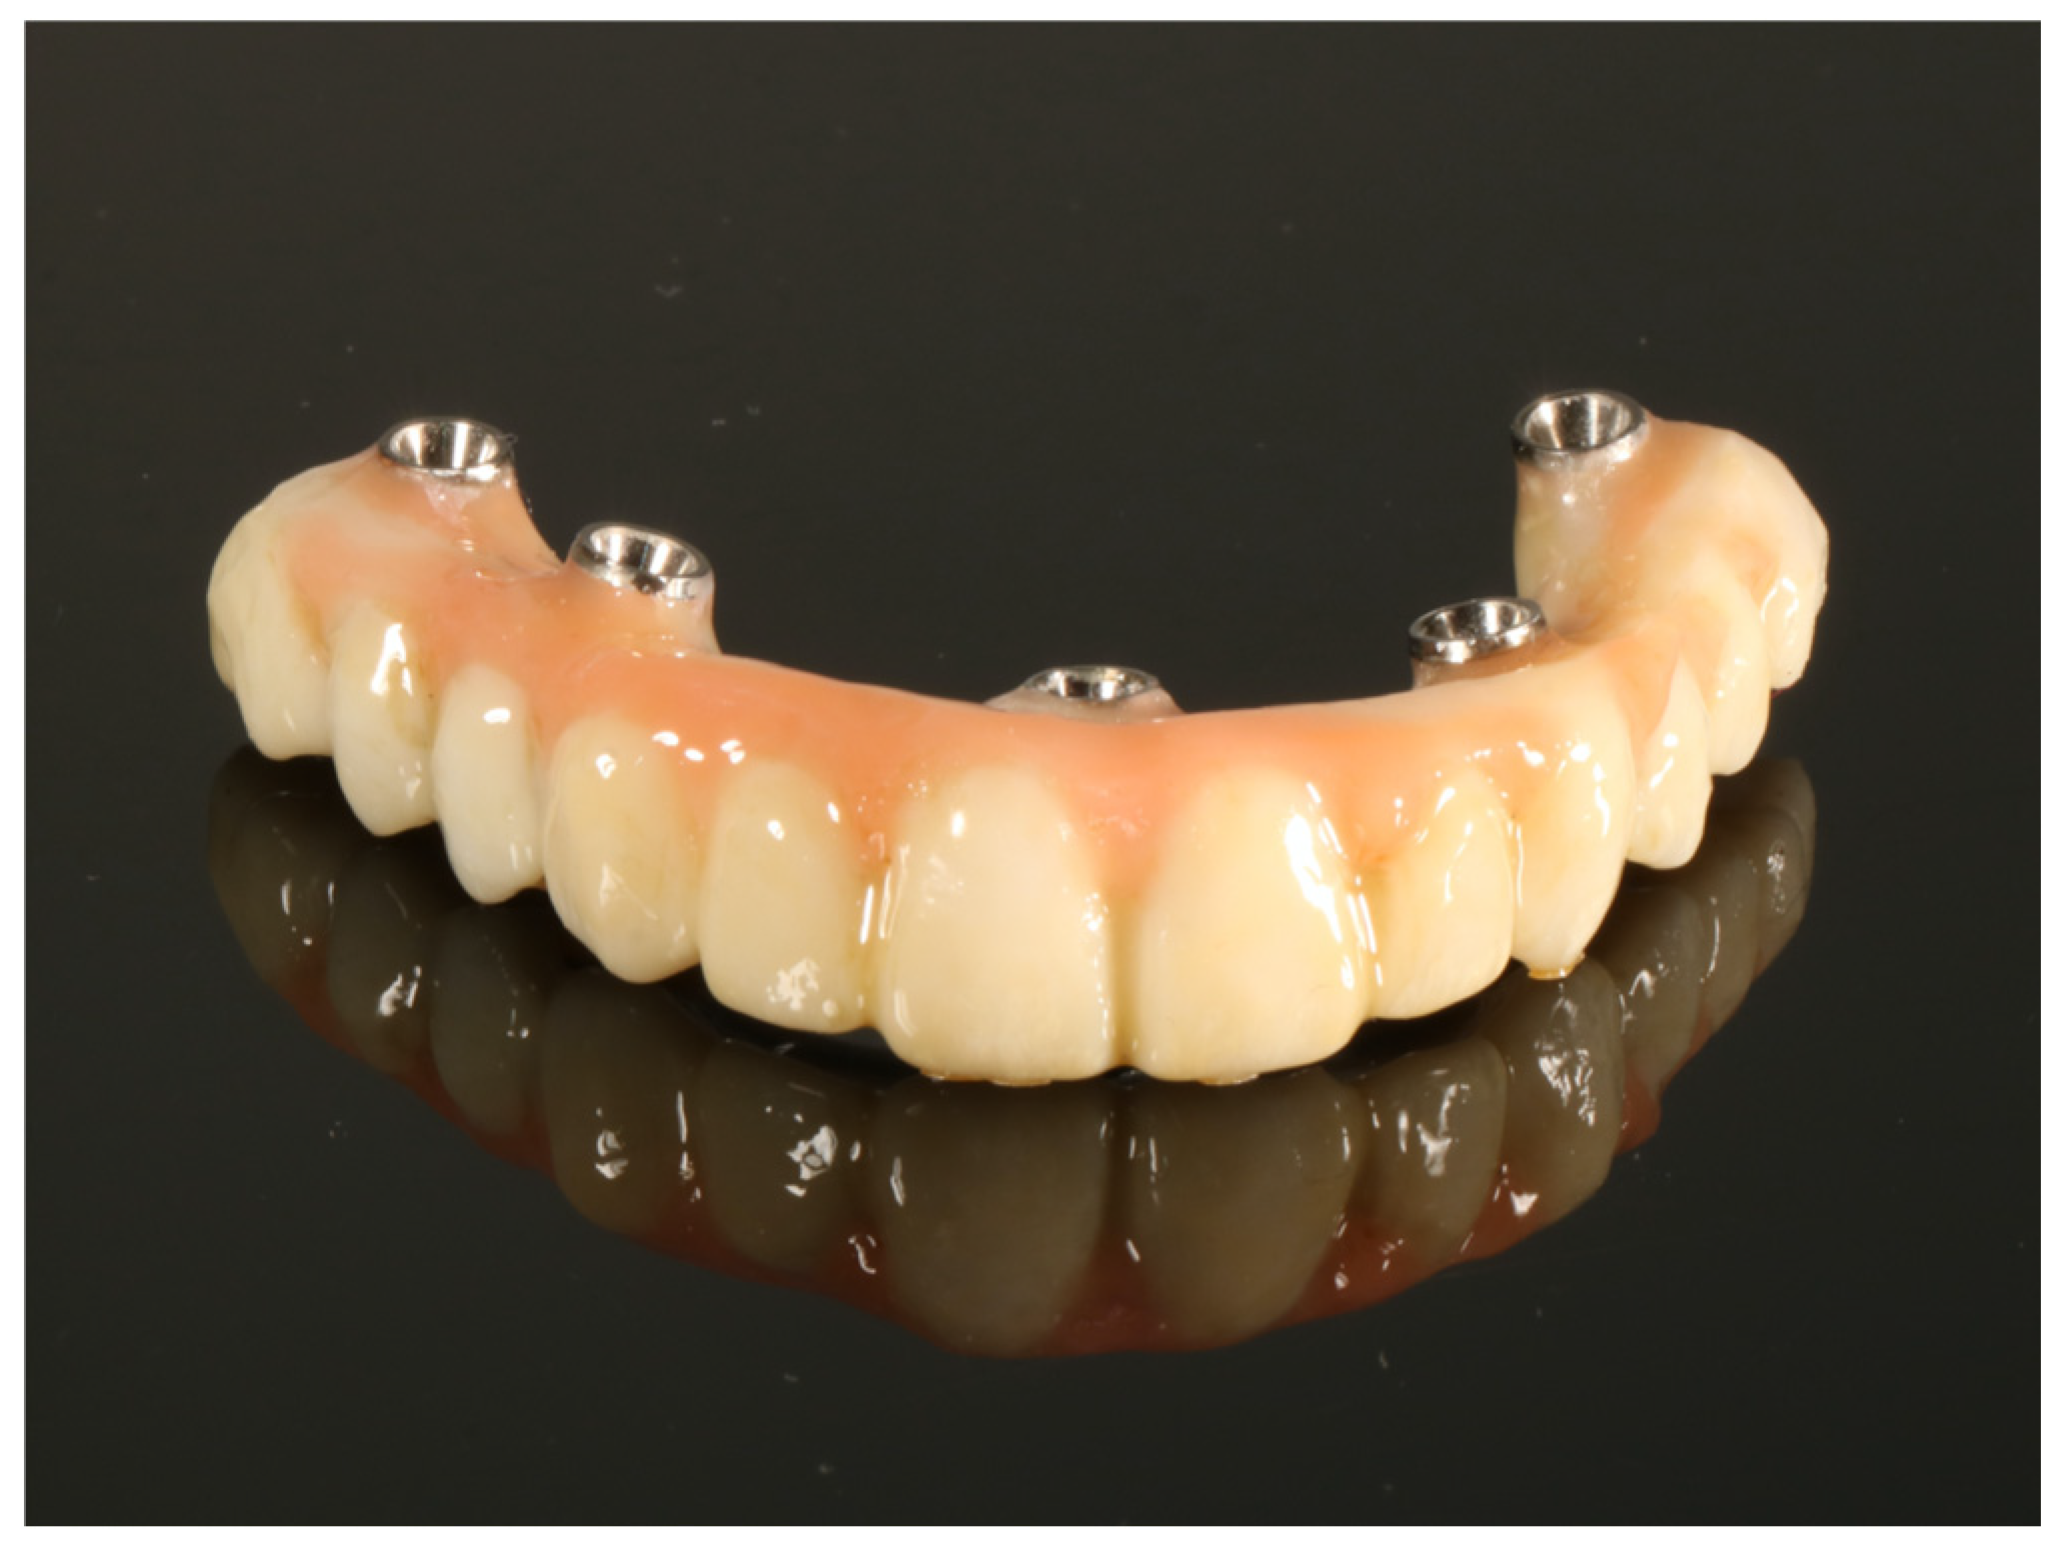
During immediate implant loading procedures—commonly referred to as “smile in a day”—implants are placed in the patient and immediately loaded with a fixed, non-removable prosthetic restoration. This restoration stabilizes the implants, ensures uniform distribution of chewing forces, and allows the patient to maintain consistent functionality in society.
These restorations, retained with screw fixation, are created by combining a 3D-printed shell with a 1.5 mm wall thickness, a rigid titanium framework welded intraorally, and a space filler—usually a bis-acrylic resin-based composite. An example of this type of system is shown in
Figure 3.
The above examples pertain to the most demanding and complex prosthetic cases for patients, whether involving removable or fixed prostheses. A separate category includes single or multi-unit temporary restorations on natural teeth, such as veneers, crowns, bridges, as well as inlays and onlays. It is crucial for professionals utilizing these materials to understand their strength limitations to better harness their potential and ensure optimal application in dental practice.
3. Methods
The advancement of modern technologies in prosthetic dentistry, such as 3D printing, enables the creation of materials with high precision and tailored mechanical and thermal properties. To ensure their durability and functionality under demanding usage conditions, comprehensive studies are required to assess their behaviour under various external factors.
The presented research aimed to provide a comprehensive evaluation of the properties of three materials used in prosthetic dentistry: NextDent Denture 3D, NextDent C&B MFH Bleach, and Graphy TC-80DP. The focus was on two key aspects of their use: dimensional stability and mechanical strength.
Thermal expansion studies were conducted to determine how the materials respond to temperature changes, considering their potential application in the oral environment. Strength tests were designed to evaluate the materials’ behaviour under cyclic loading, simulating the processes associated with chewing and other mechanical functions of prostheses.
Additionally, microscopic analyses were performed to investigate the internal structure of the tested materials and the mechanisms of their damage. These analyses provide a deeper understanding of their behaviour under real-world usage conditions.
3.1. Dimensional Stability and Thermal Expansion Studies
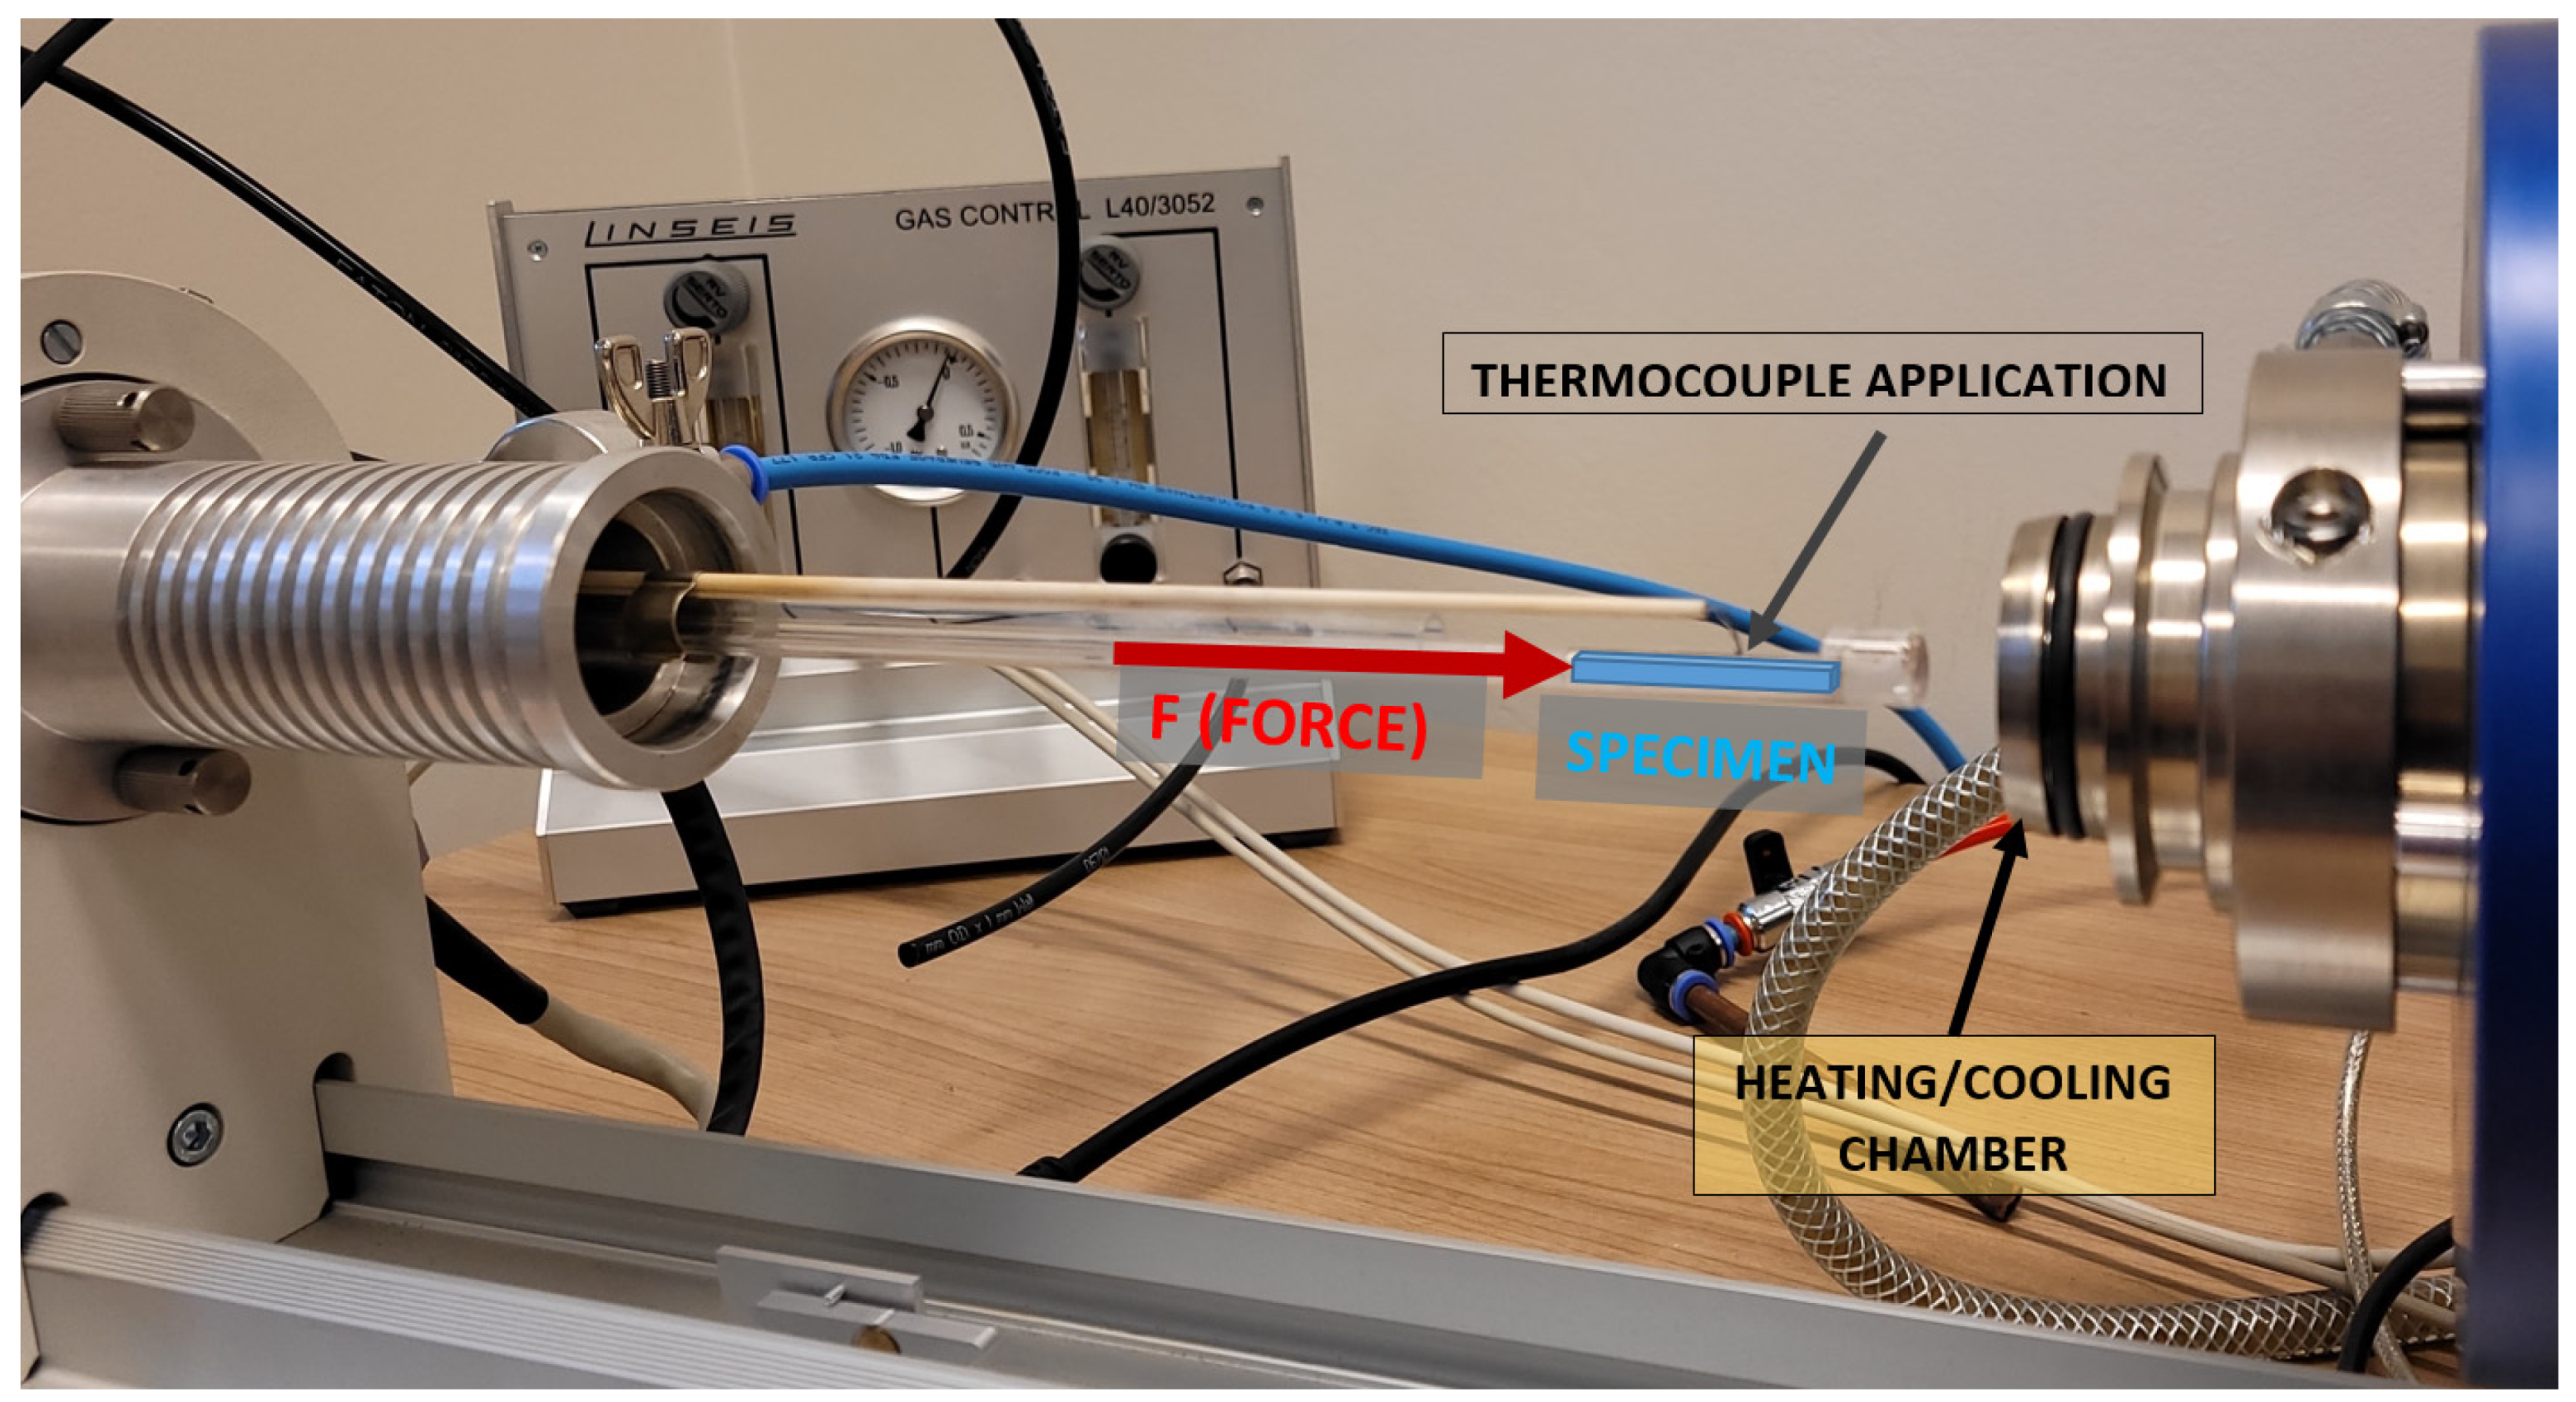
The measurements were conducted using a direct horizontal dilatometer, Linseis L75 HS (Linseis Messgeraete GmbH, Selb, Germany), on rectangular samples with dimensions of 4.0 × 4.0 × 25.0 mm ± 0.1 mm. The principle of the measurement is illustrated in the schematic of the dilatometer setup shown in
Figure 4. The study was conducted based on the ISO 11359-2:2021 standard, adjusting parameters such as the applied pressing force to the selected sample size range [
31].
The study was initially designed to test three materials: NextDent C&B Bleach (NextDent, Soesterberg, The Netherlands), NextDent Denture 3D, and Graphy TC-80DP (Graphy Inc., Seoul, Republic of Korea), in two series of experiments with fixed pressing forces applied to the samples: F = 80.0 mN (measurements in Series A) and four times higher pressing force, F = 320.0 mN (measurements in Series B), during cyclic heating and cooling. Two constant force values were proposed in each series to eliminate the potential influence of the adopted measurement methodology on the horizontal dilatometer setup, which might affect the suppression of the linear thermal expansion phenomenon in the three tested resins. The samples in both Series A and B were heated from room temperature (25 °C) to approximately 60.0 °C at a rate of 1 °C/min. Upon reaching the target temperature, the samples were held at 60.0 °C for 10 min. Due to the thermal inertia of the dilatometer chamber and the measurement system, the samples were heated up to 63.0 °C. Subsequently, the chamber with the sample was cooled down at a rate of 1 °C/min to 20.0 °C. After cooling the device’s chamber and measurement system, the linear thermal expansion measurements restarted. Cyclic measurements of the linear thermal expansion of each sample were performed five times without opening the dilatometer chamber. In each cycle, the first measurement was always discarded due to potential disturbances caused by the adjustment of the sample to the measuring system, which included a component responsible for pressing the sample against the stop.
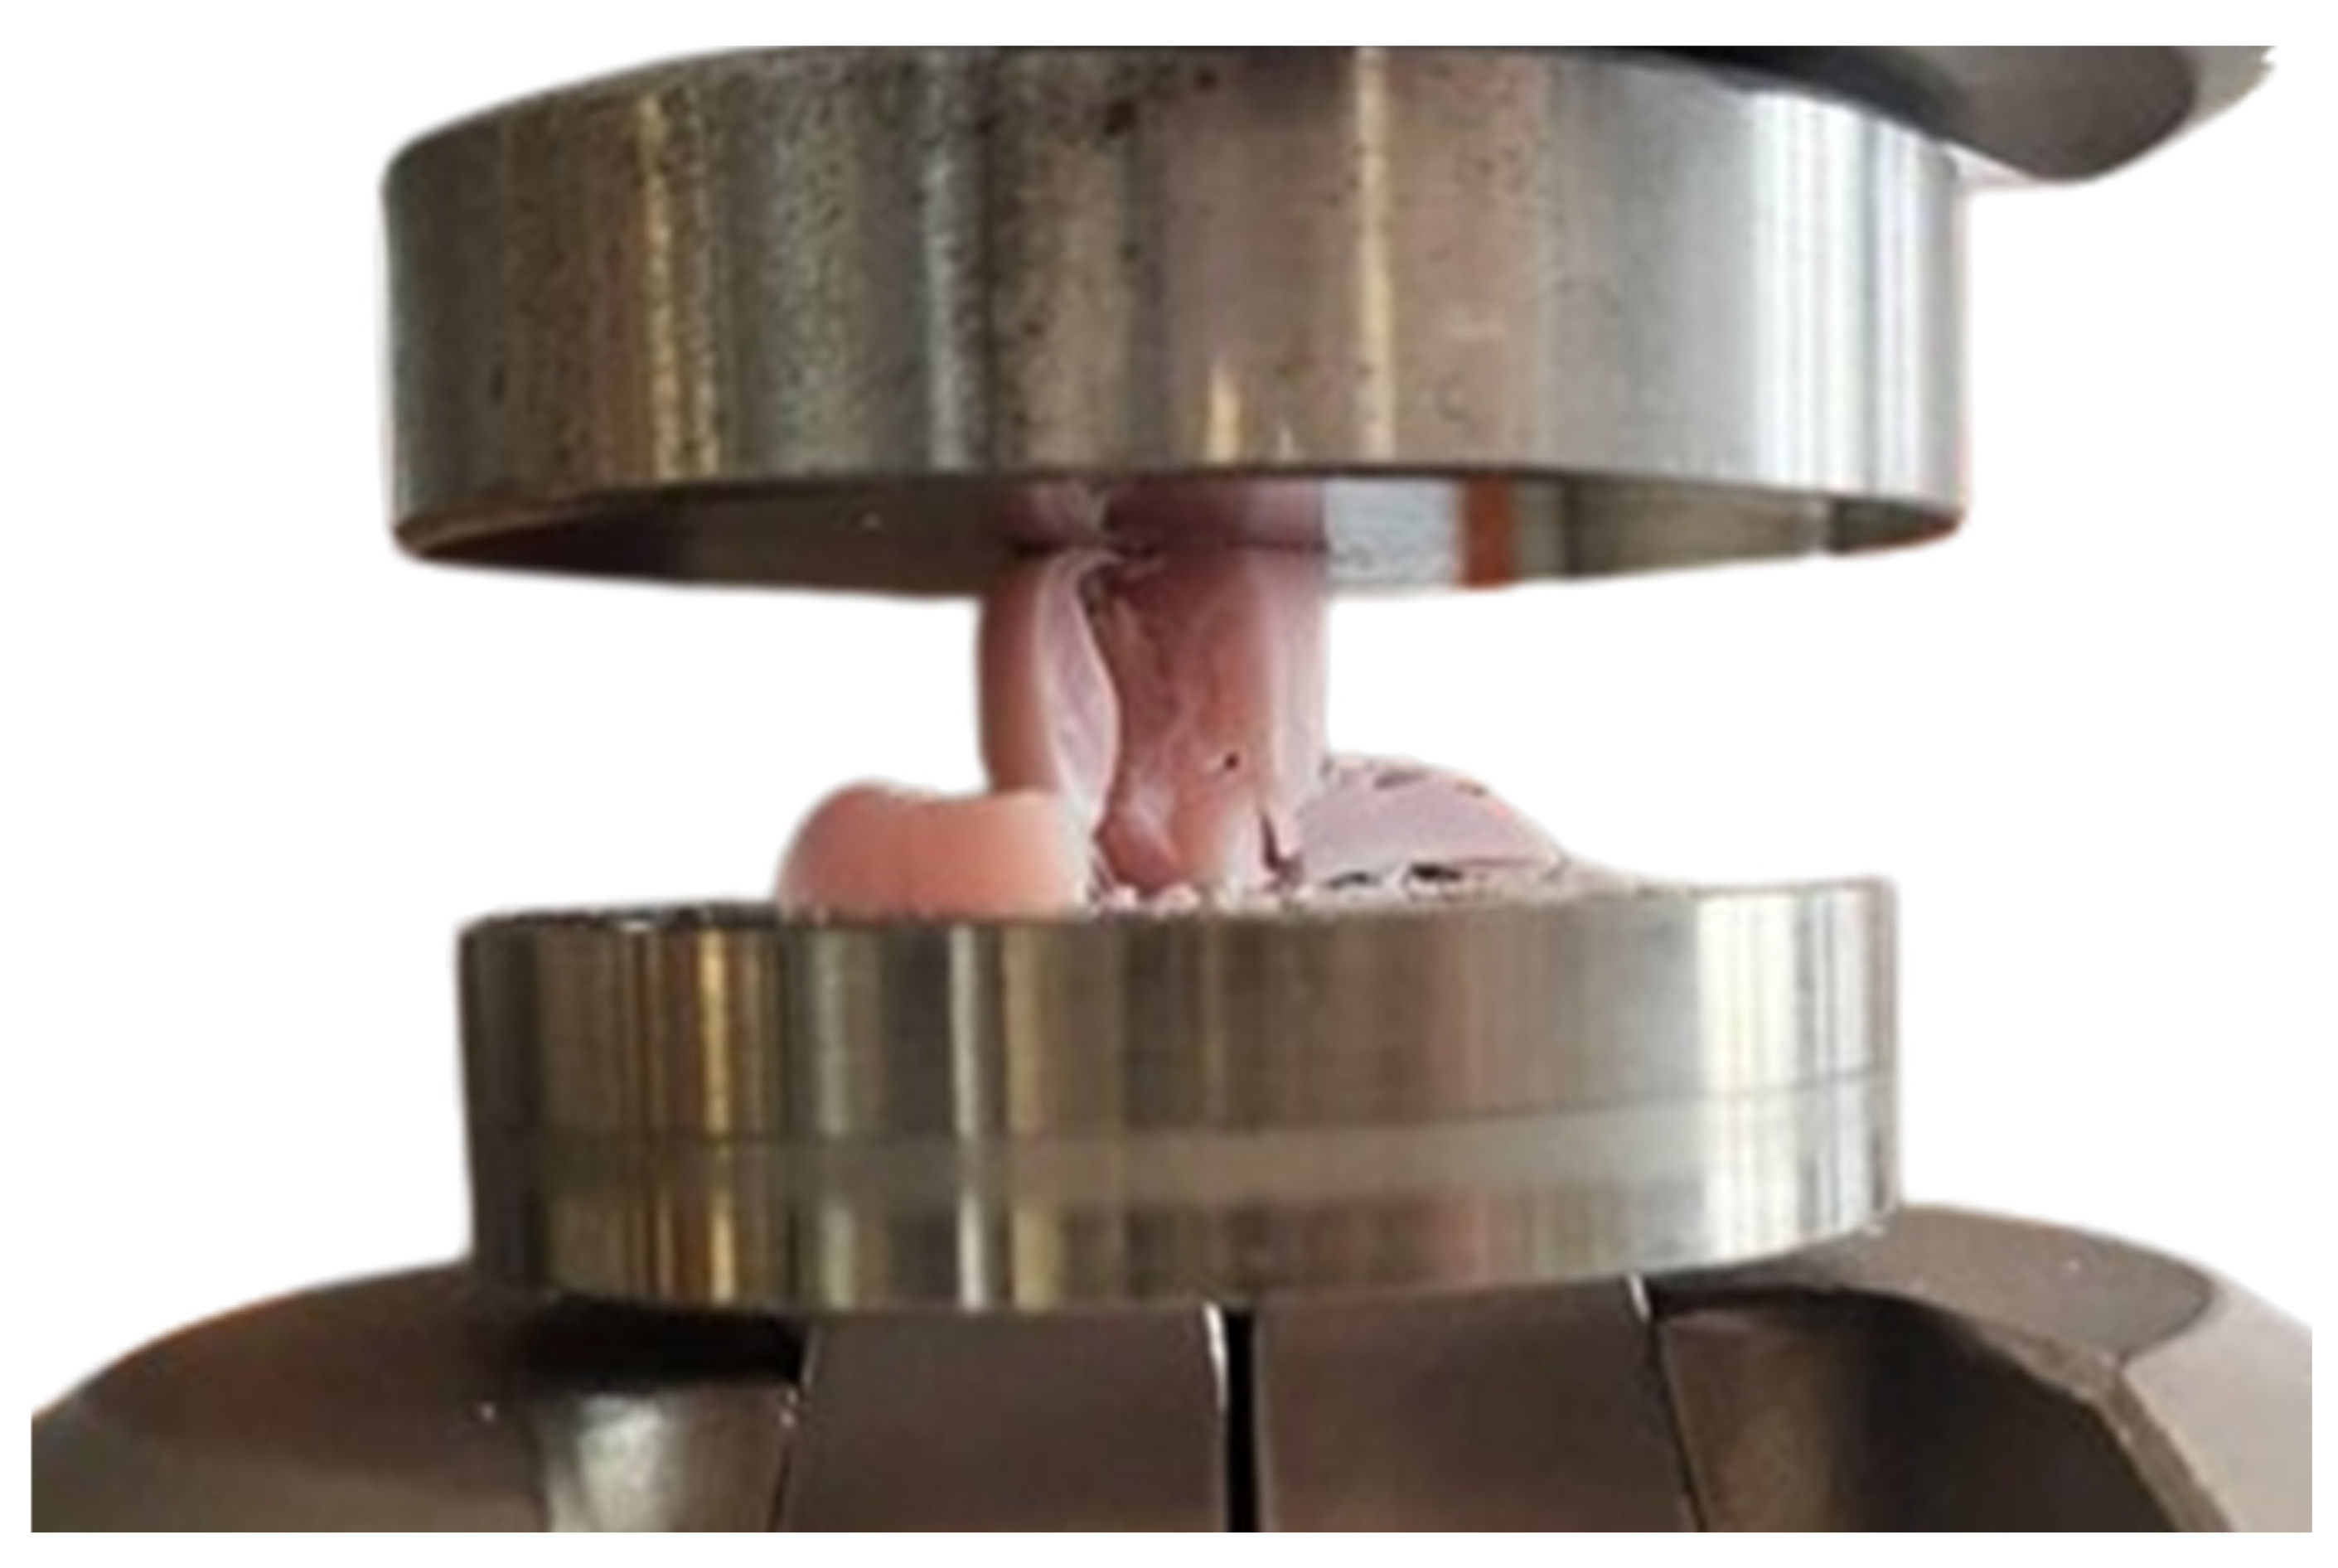
3.2. Fatigue Testing
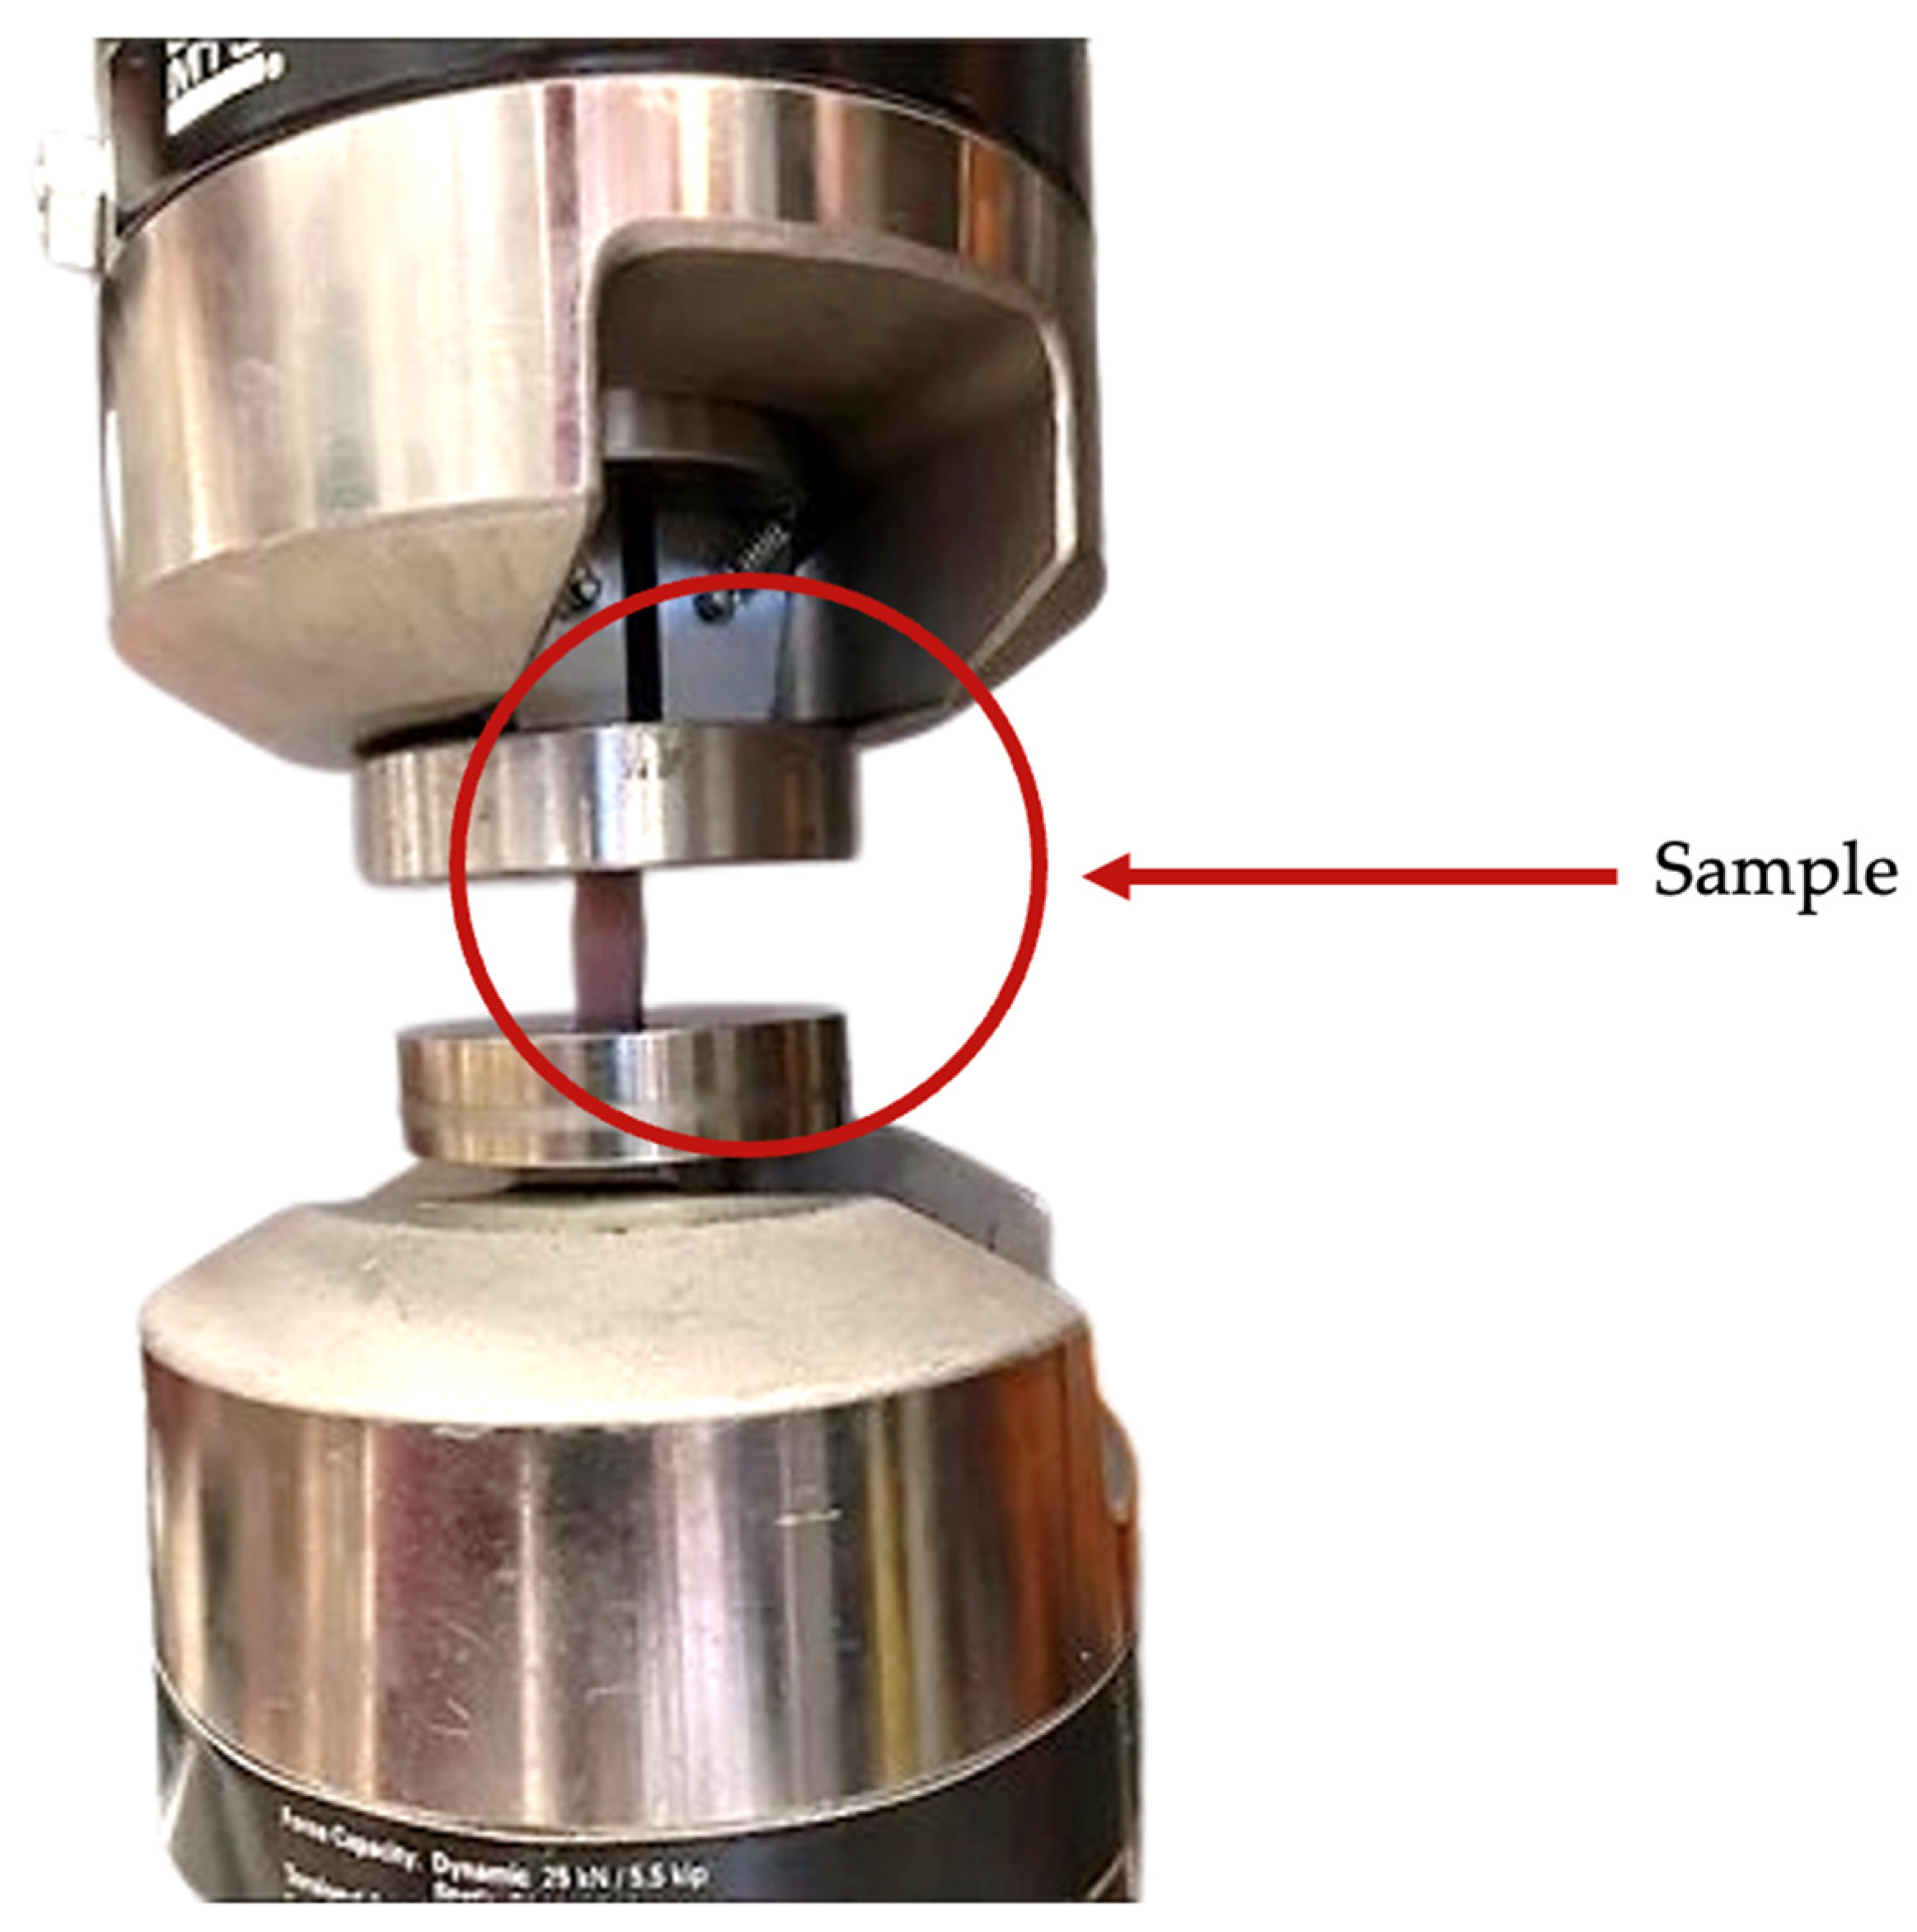
The fatigue tests were conducted using a Bionix mechanical testing machine from MTS (MTS Systems, Eden Prairie, MN, USA) with a force range of up to 25 kN (
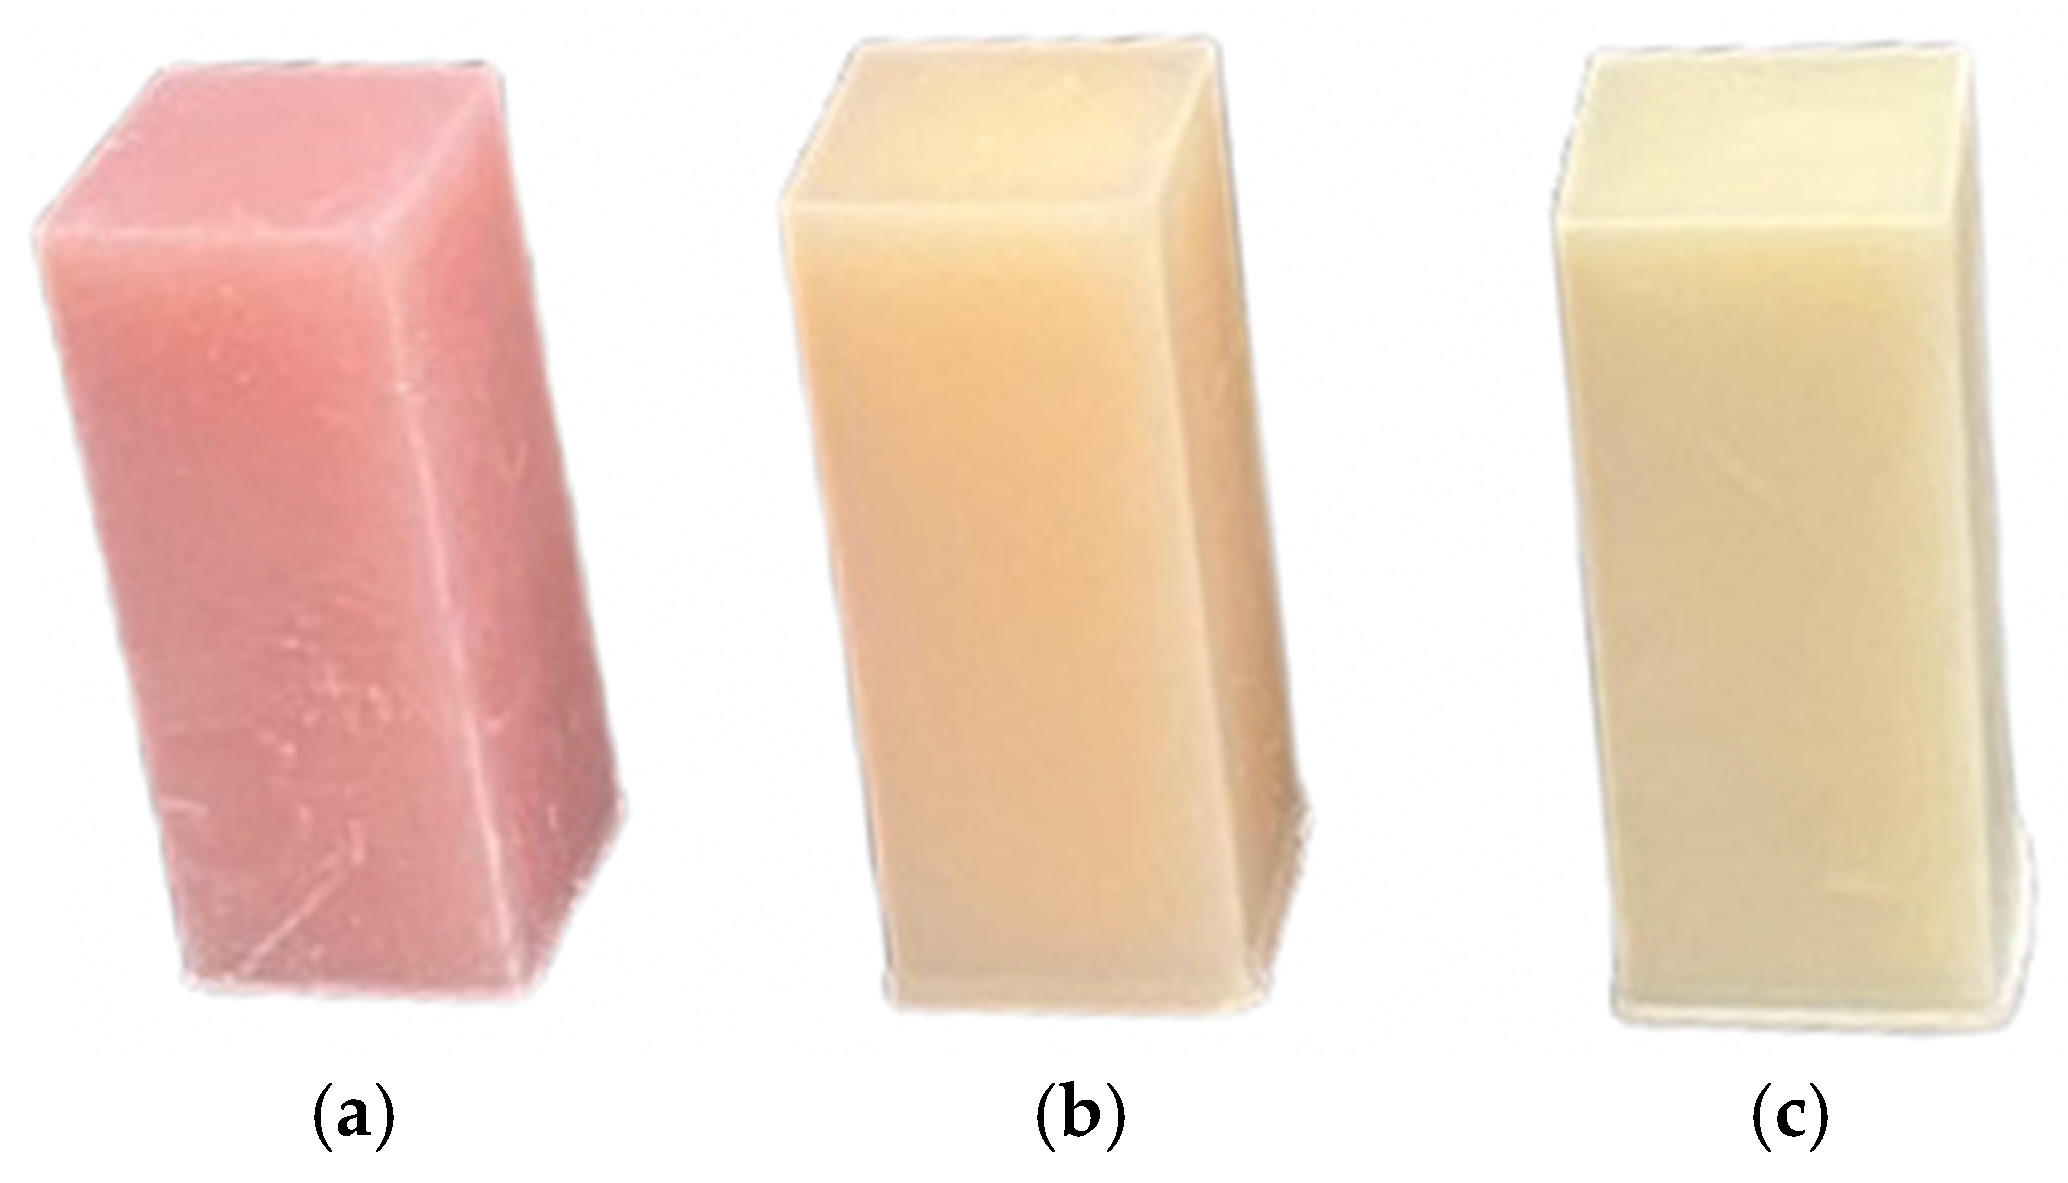
Figure 5). The test samples were prepared using a 3D printing method, with dimensions of 10.0 × 10.0 mm and a height of 25.0 mm (
Figure 6). The load was applied perpendicular to the printed surface. Prior to the main tests, a static compression test and an incremental load test were performed to estimate the load amplitude range for the fatigue tests. There is no universal standard in the literature for the fatigue testing of materials for temporary restorations. The methodology for this study was based on ISO 14801, which defines the fatigue testing of dental implants, taking into account parameters such as loading frequency [
32].
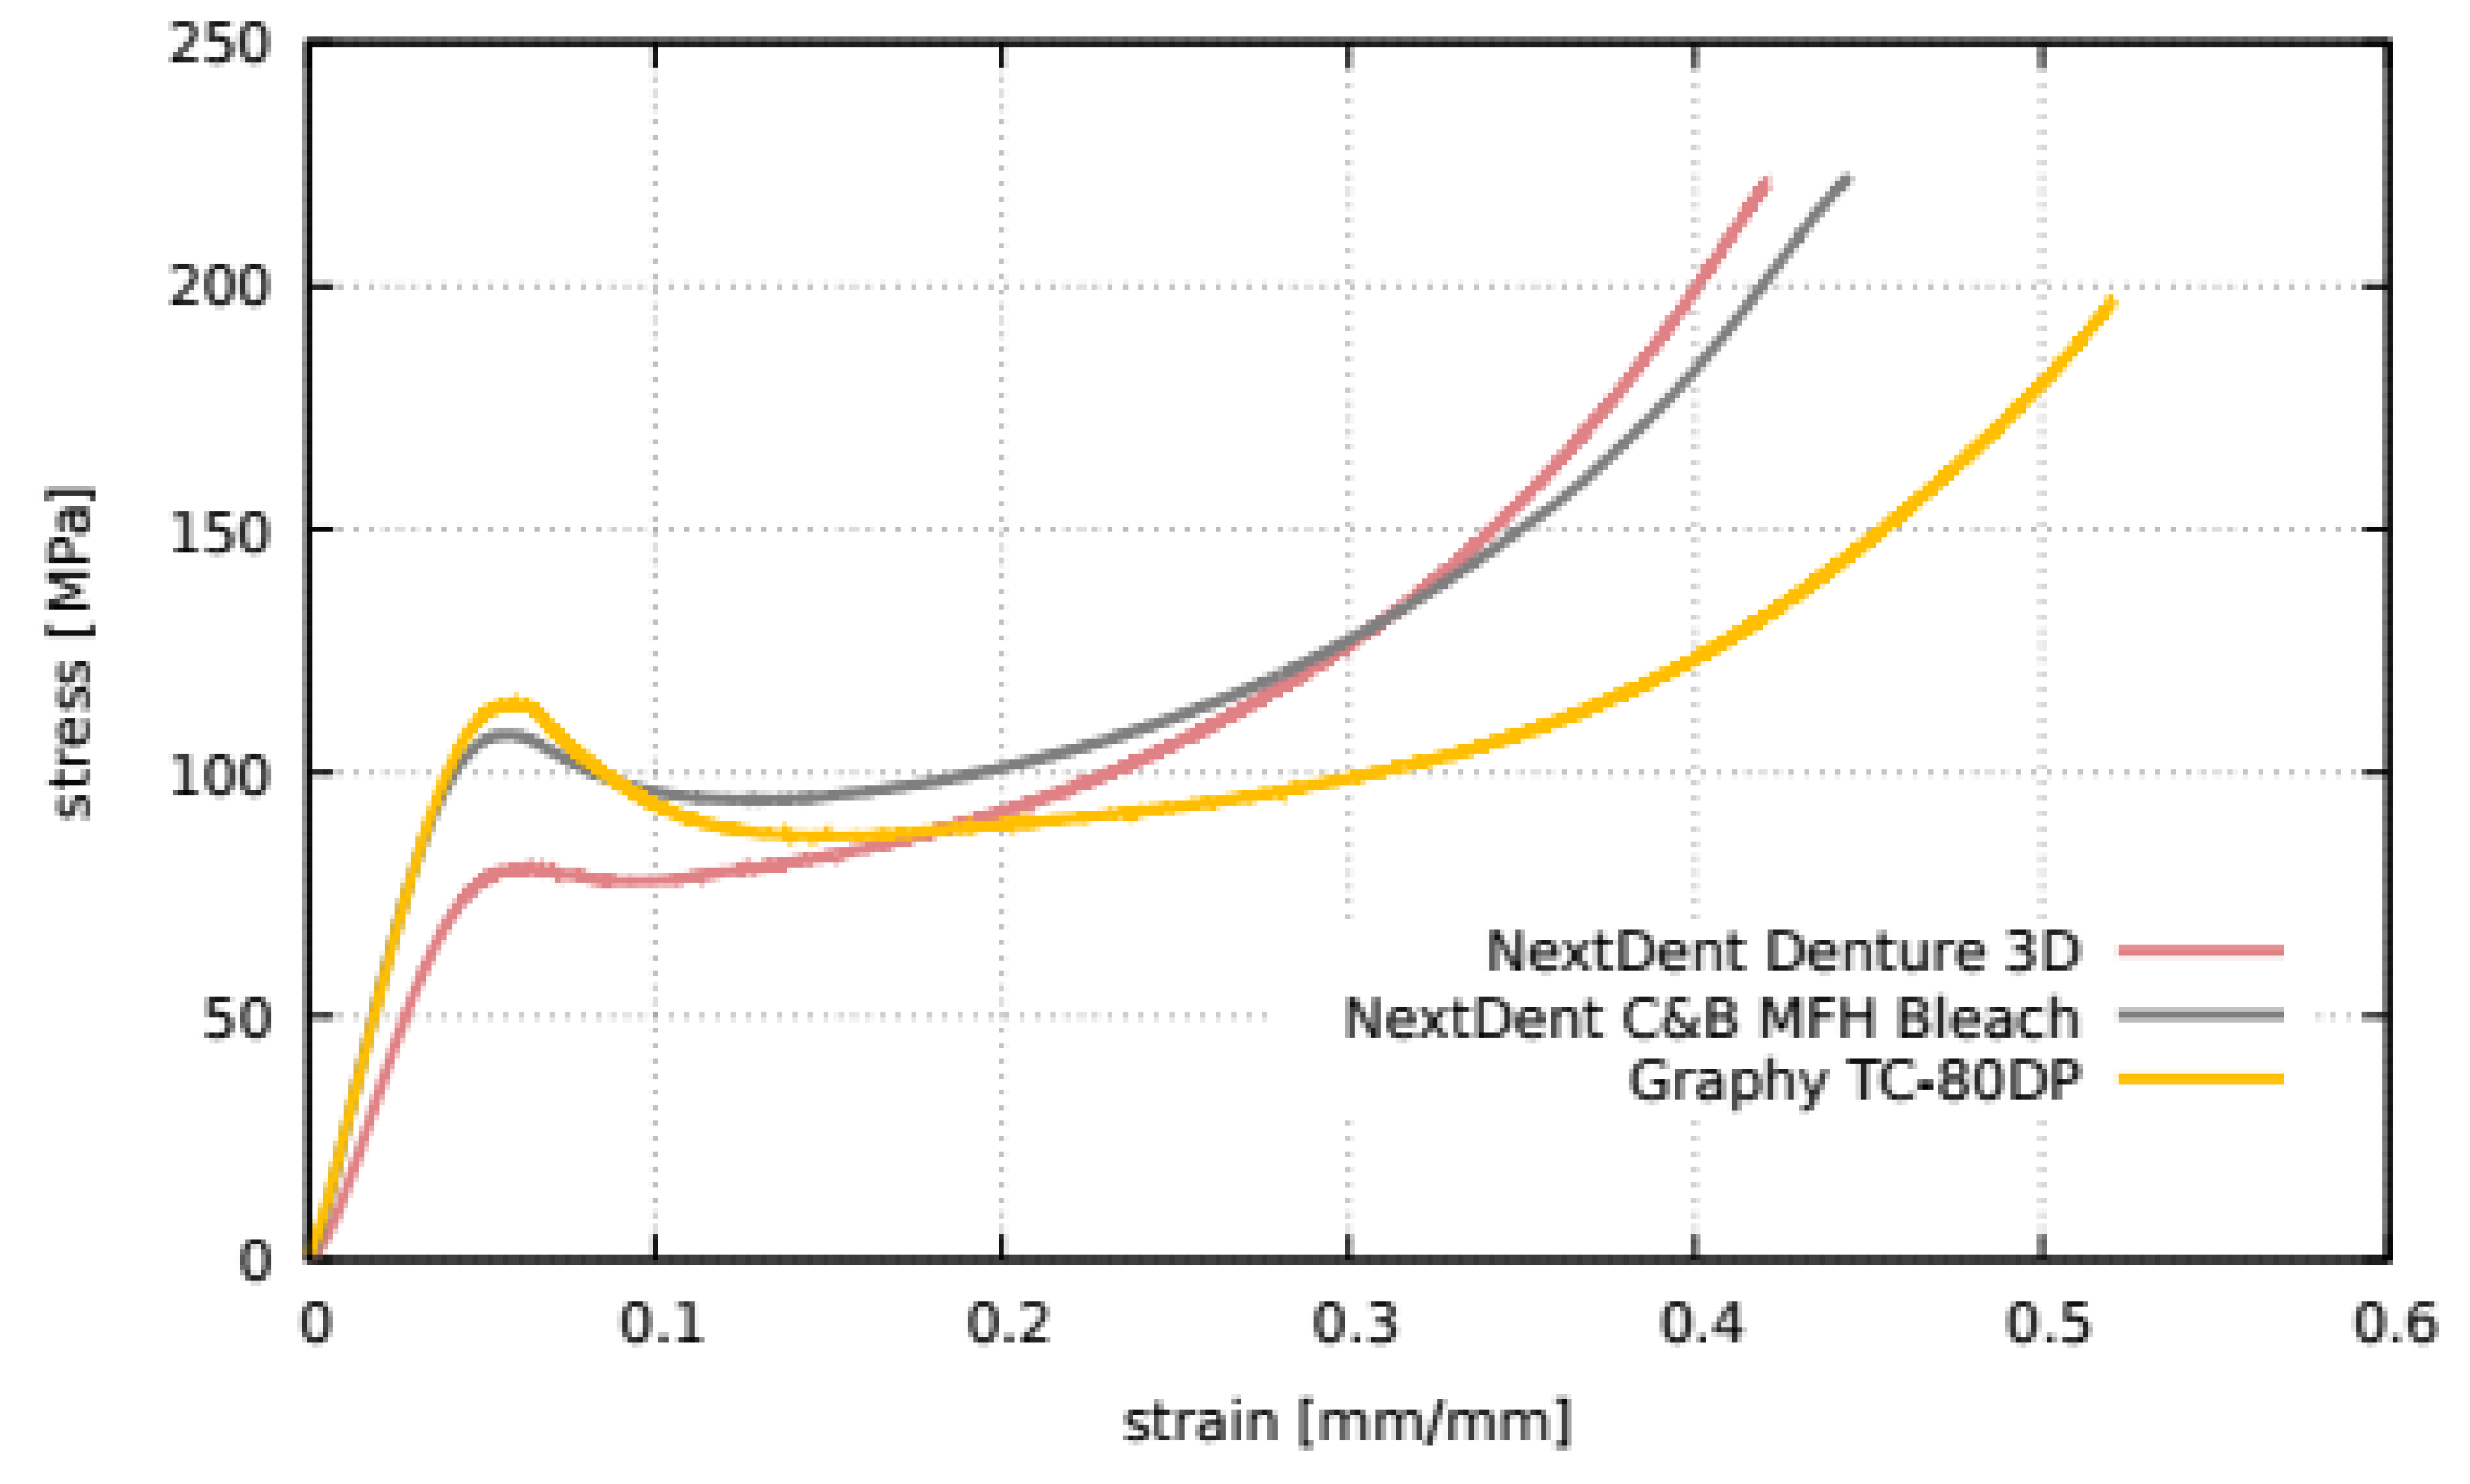
Static tests were conducted on three samples for each material. The graph in
Figure 7 shows the representative compression curves (for clarity) for each material. The nature of the curves reveals a distinct yield point (the first peak on the graph), which is 80.0 MPa for NextDent Denture 3D, 108.0 MPa for Graphy TC-80DP, and 114.0 MPa for NextDent C&B MFH Bleach. The variation in these values within each material did not exceed 2%. The results of the static tests allowed the determination of the maximum load amplitudes achievable during fatigue testing. To estimate the lower range of load amplitudes, an incremental load test was conducted. This test involved the cyclic compression of the sample (similar to standard fatigue testing) with a gradual increase in load amplitude. The incremental load test allows for an approximate estimation of the fatigue limit (if it exists). However, this was not the objective of the present study. The test was performed under controlled force, with each load level lasting for 2000 cycles [
7,
8]. The loading frequency was 2 Hz.
4. Results
To comprehensively evaluate the thermal and mechanical behaviour of the tested materials, the results are presented in two main sections. The first part focuses on thermal expansion characteristics, while the second part addresses fatigue resistance under cyclic loading.
4.1. Dimensional Stability and Thermal Expansion Studies
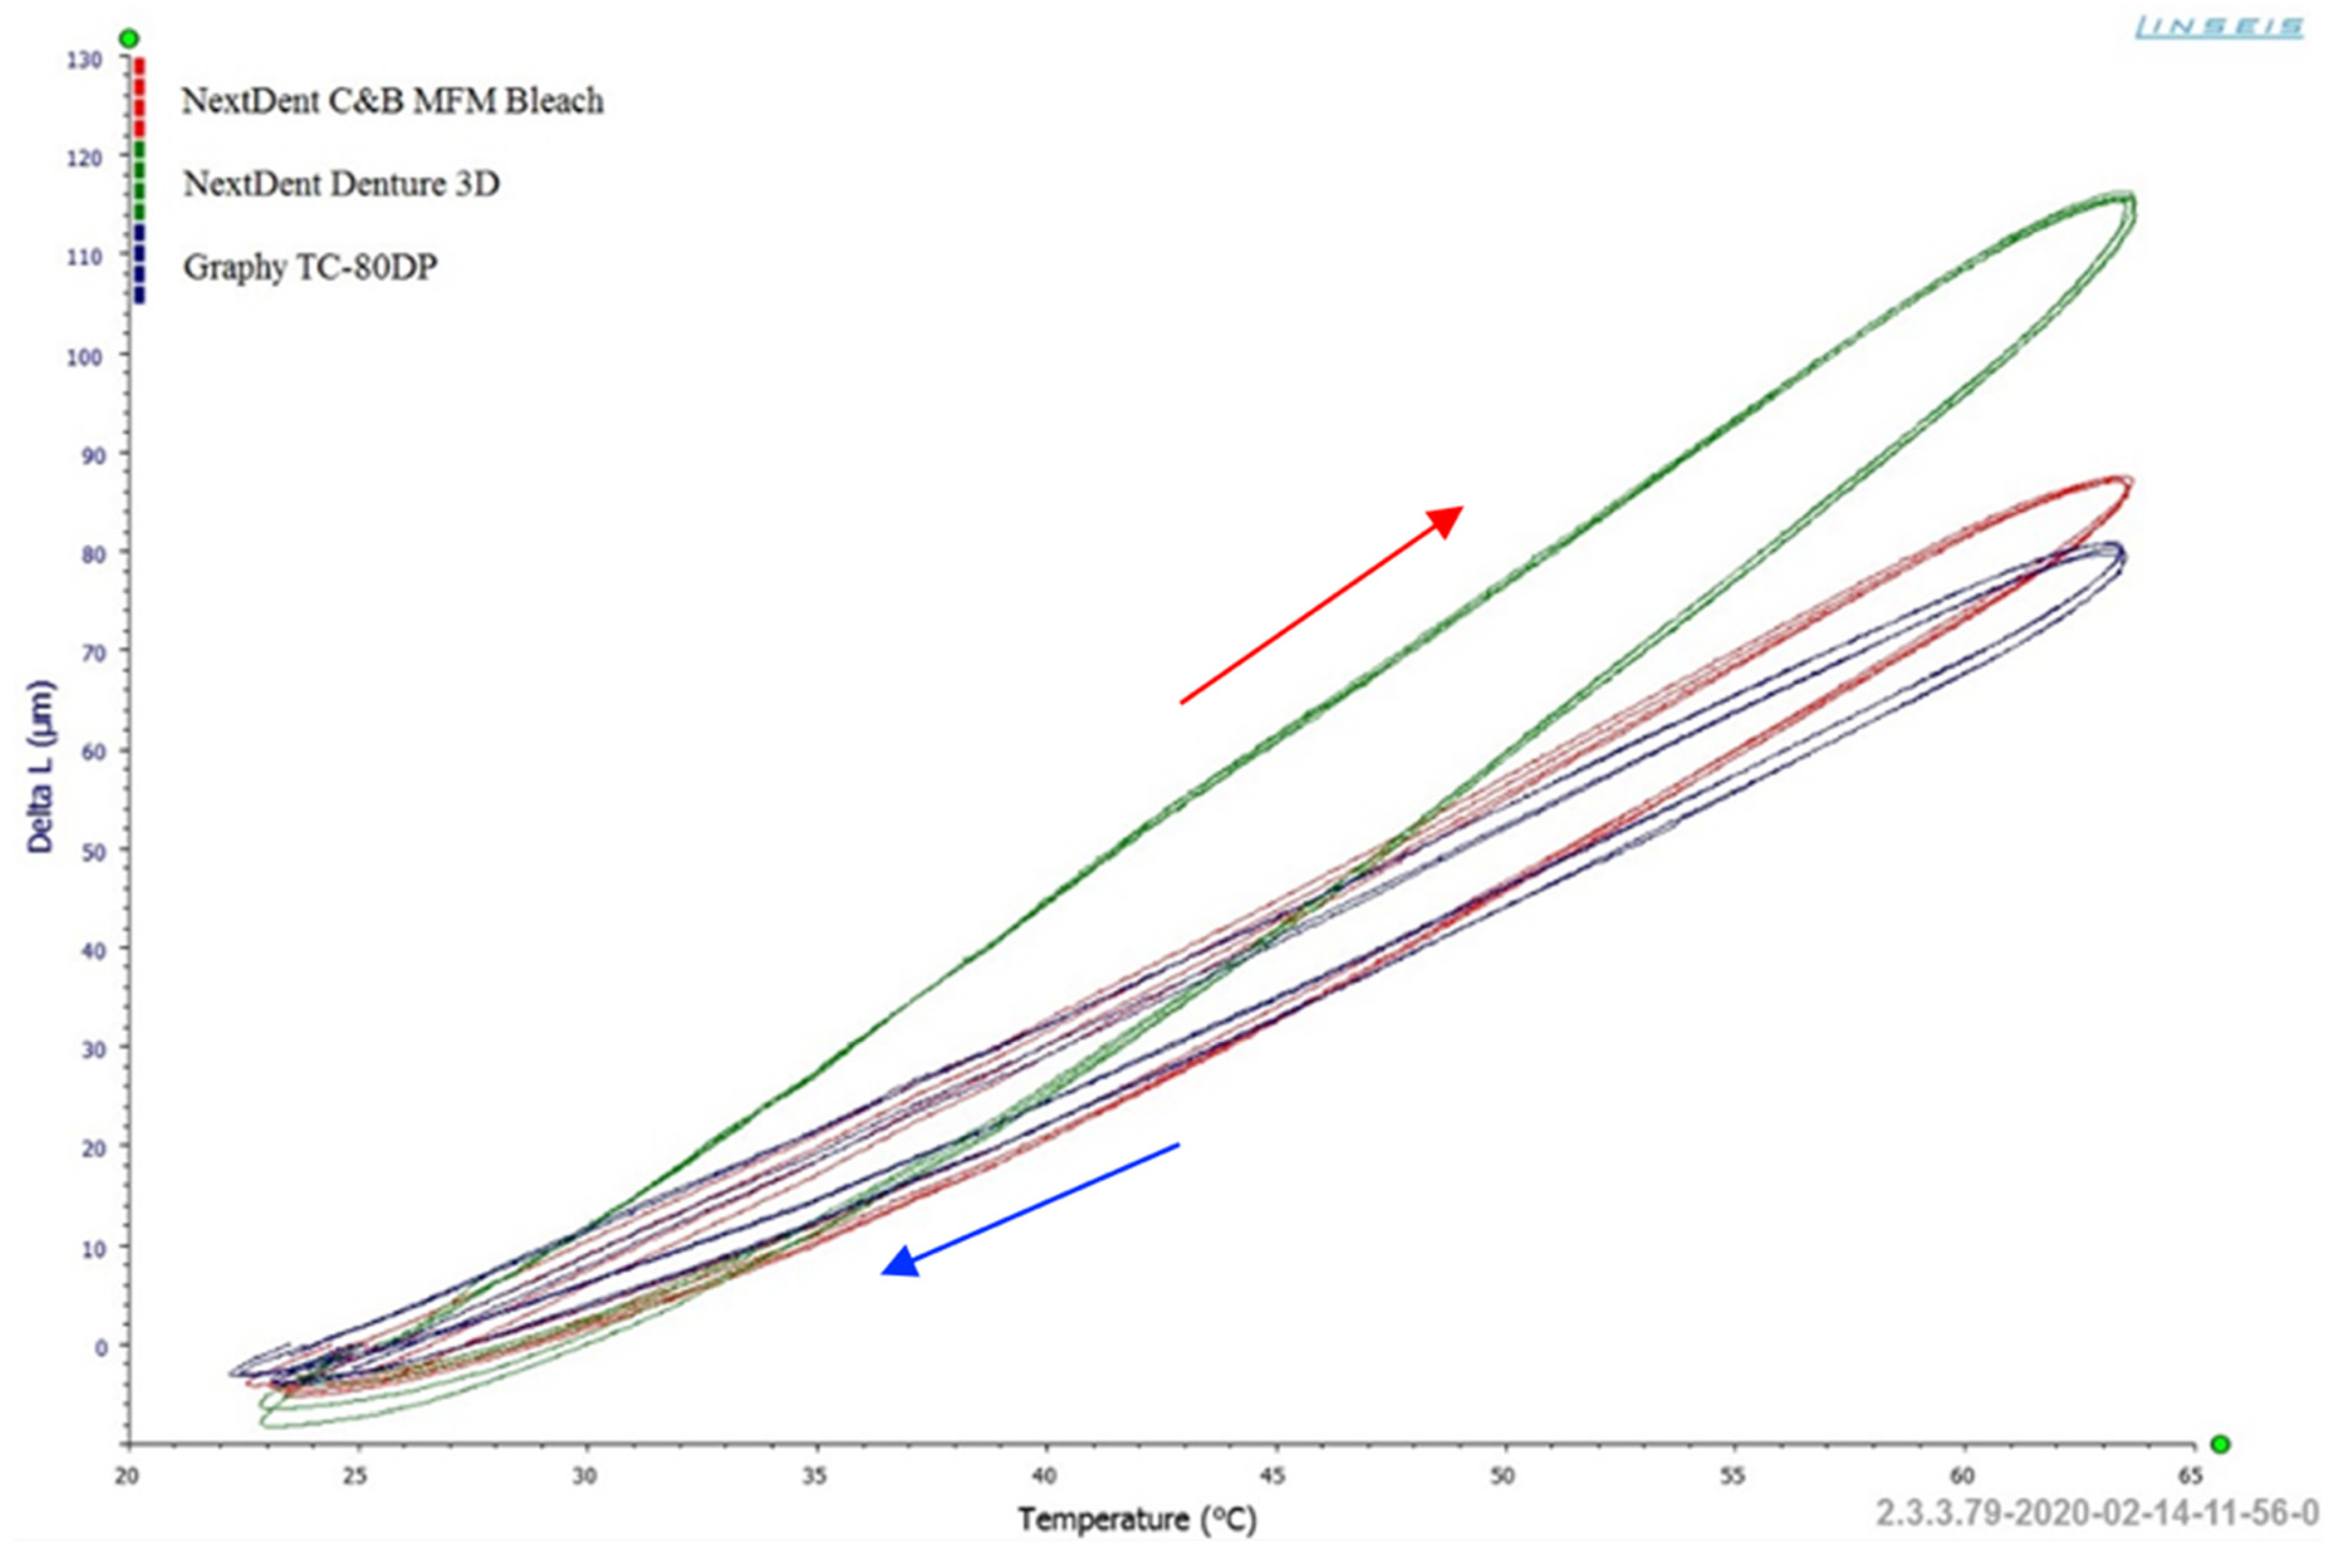
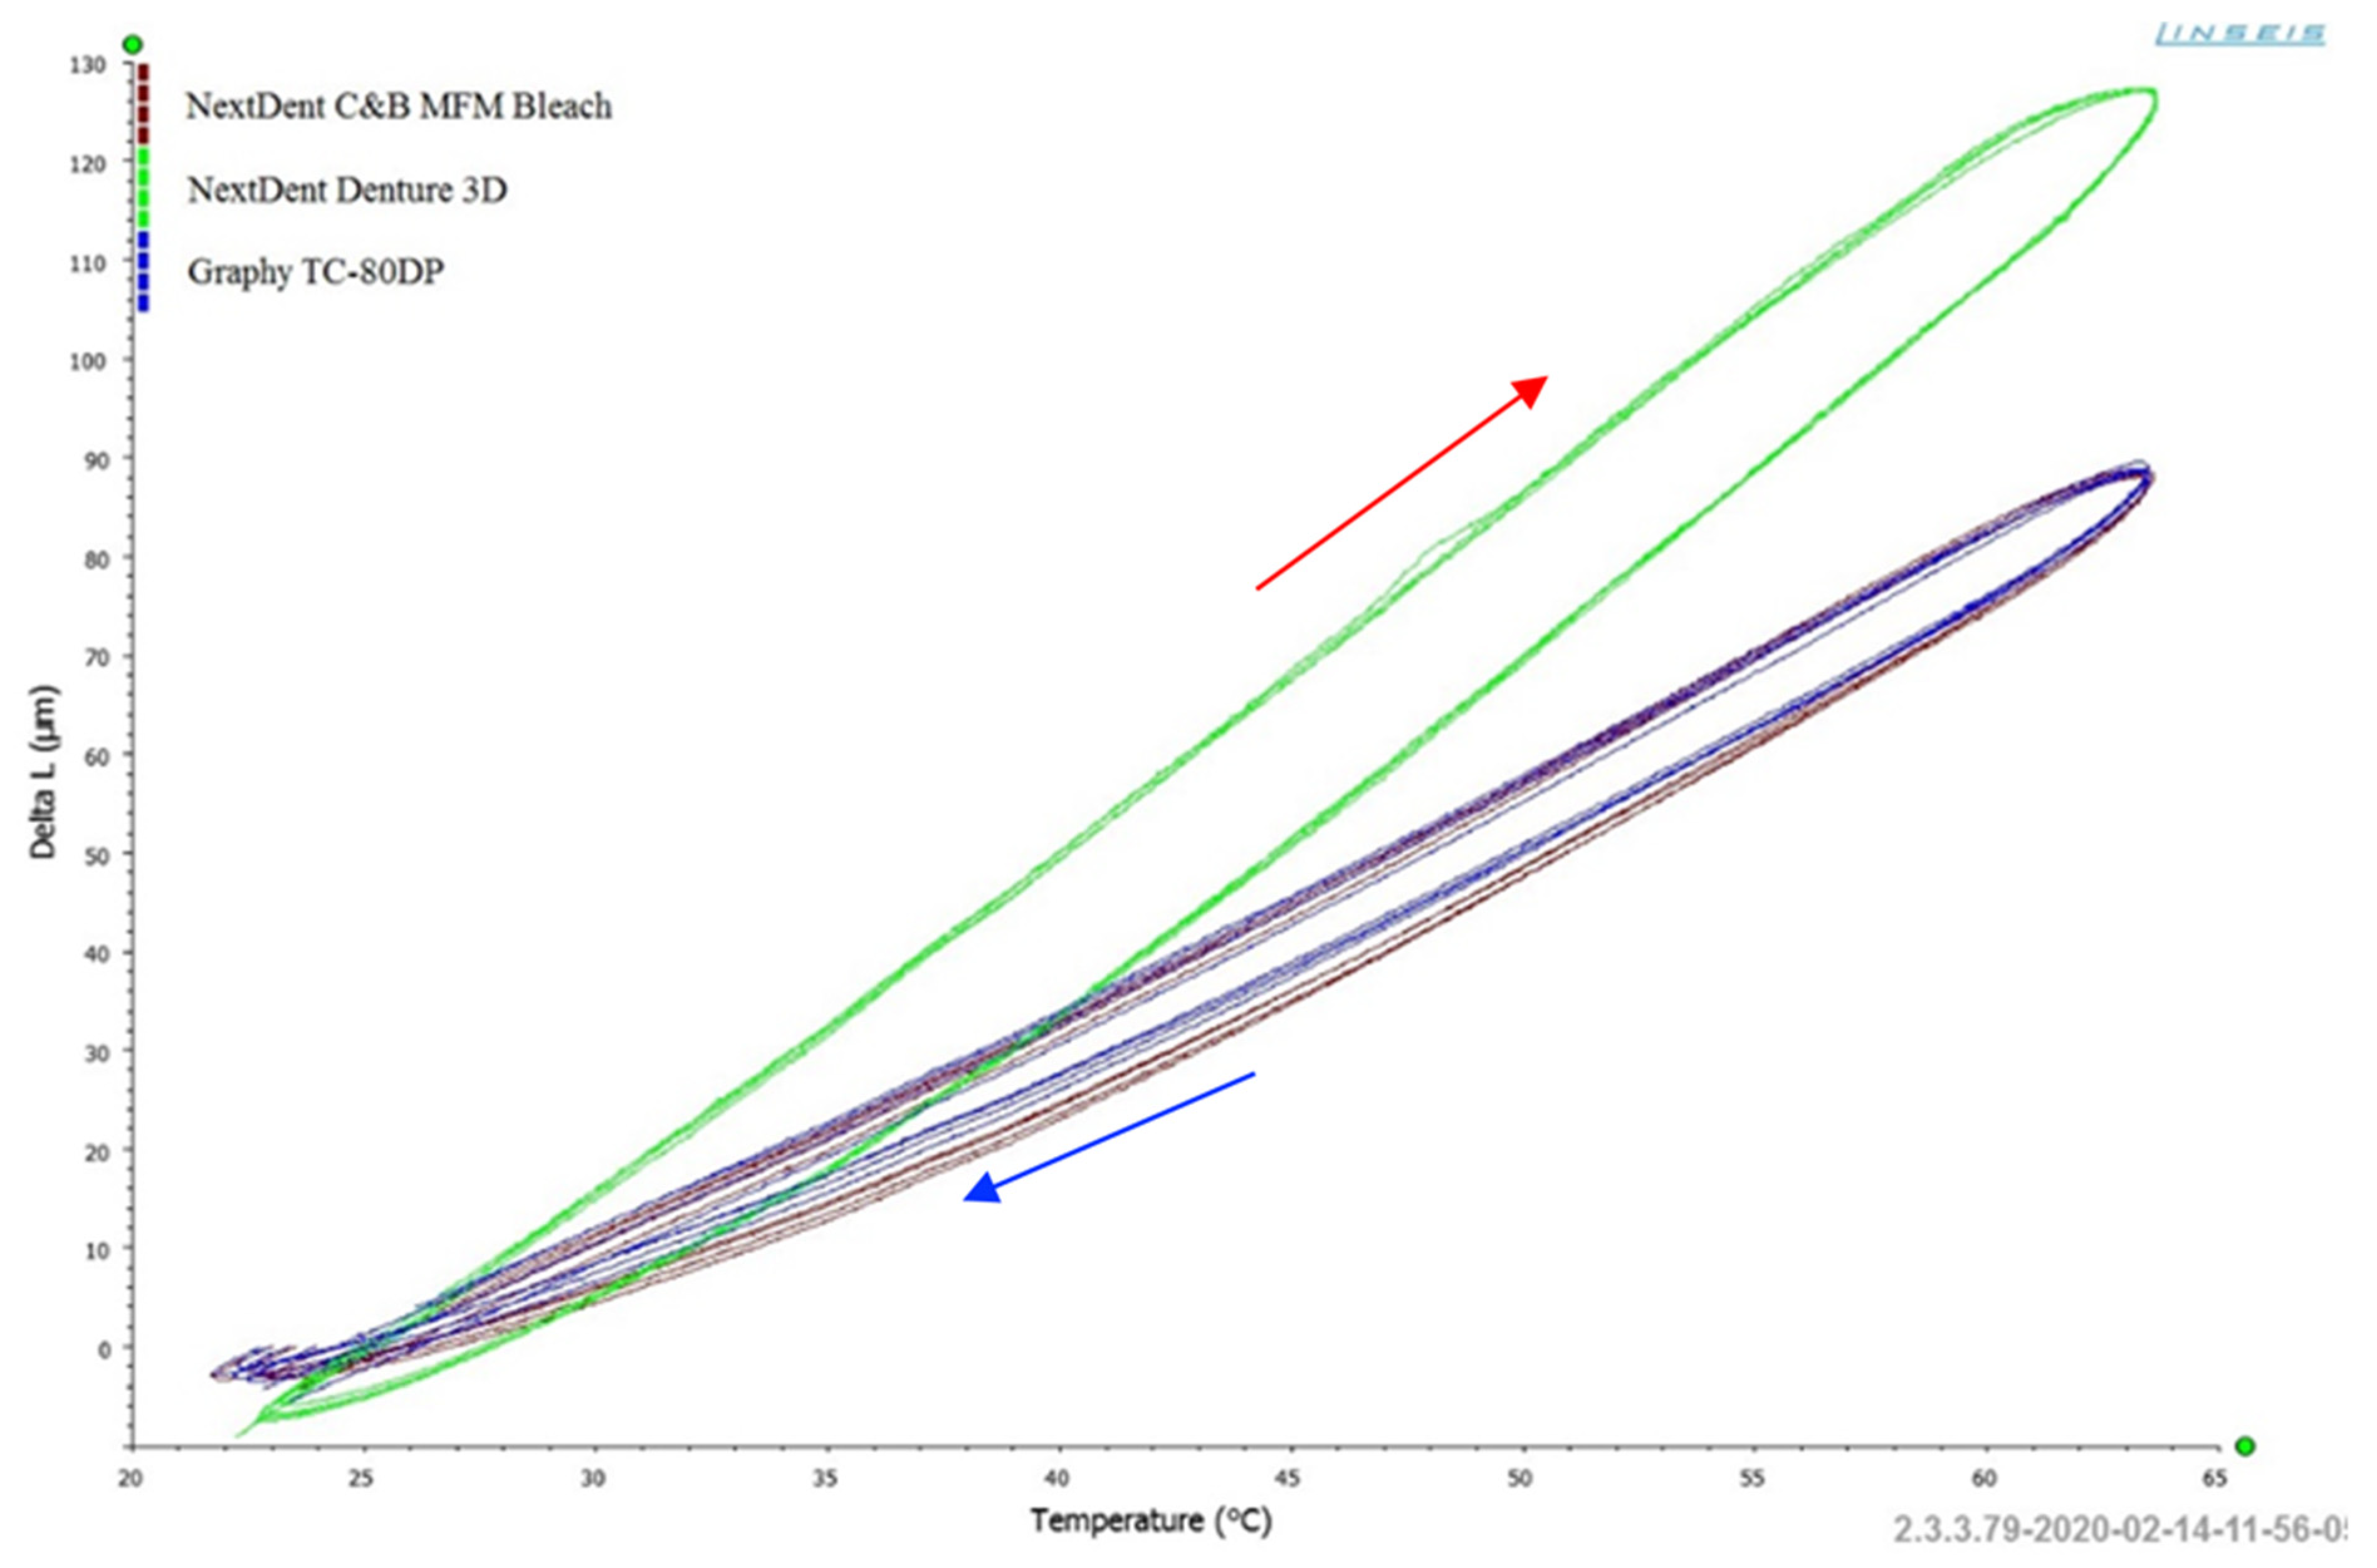
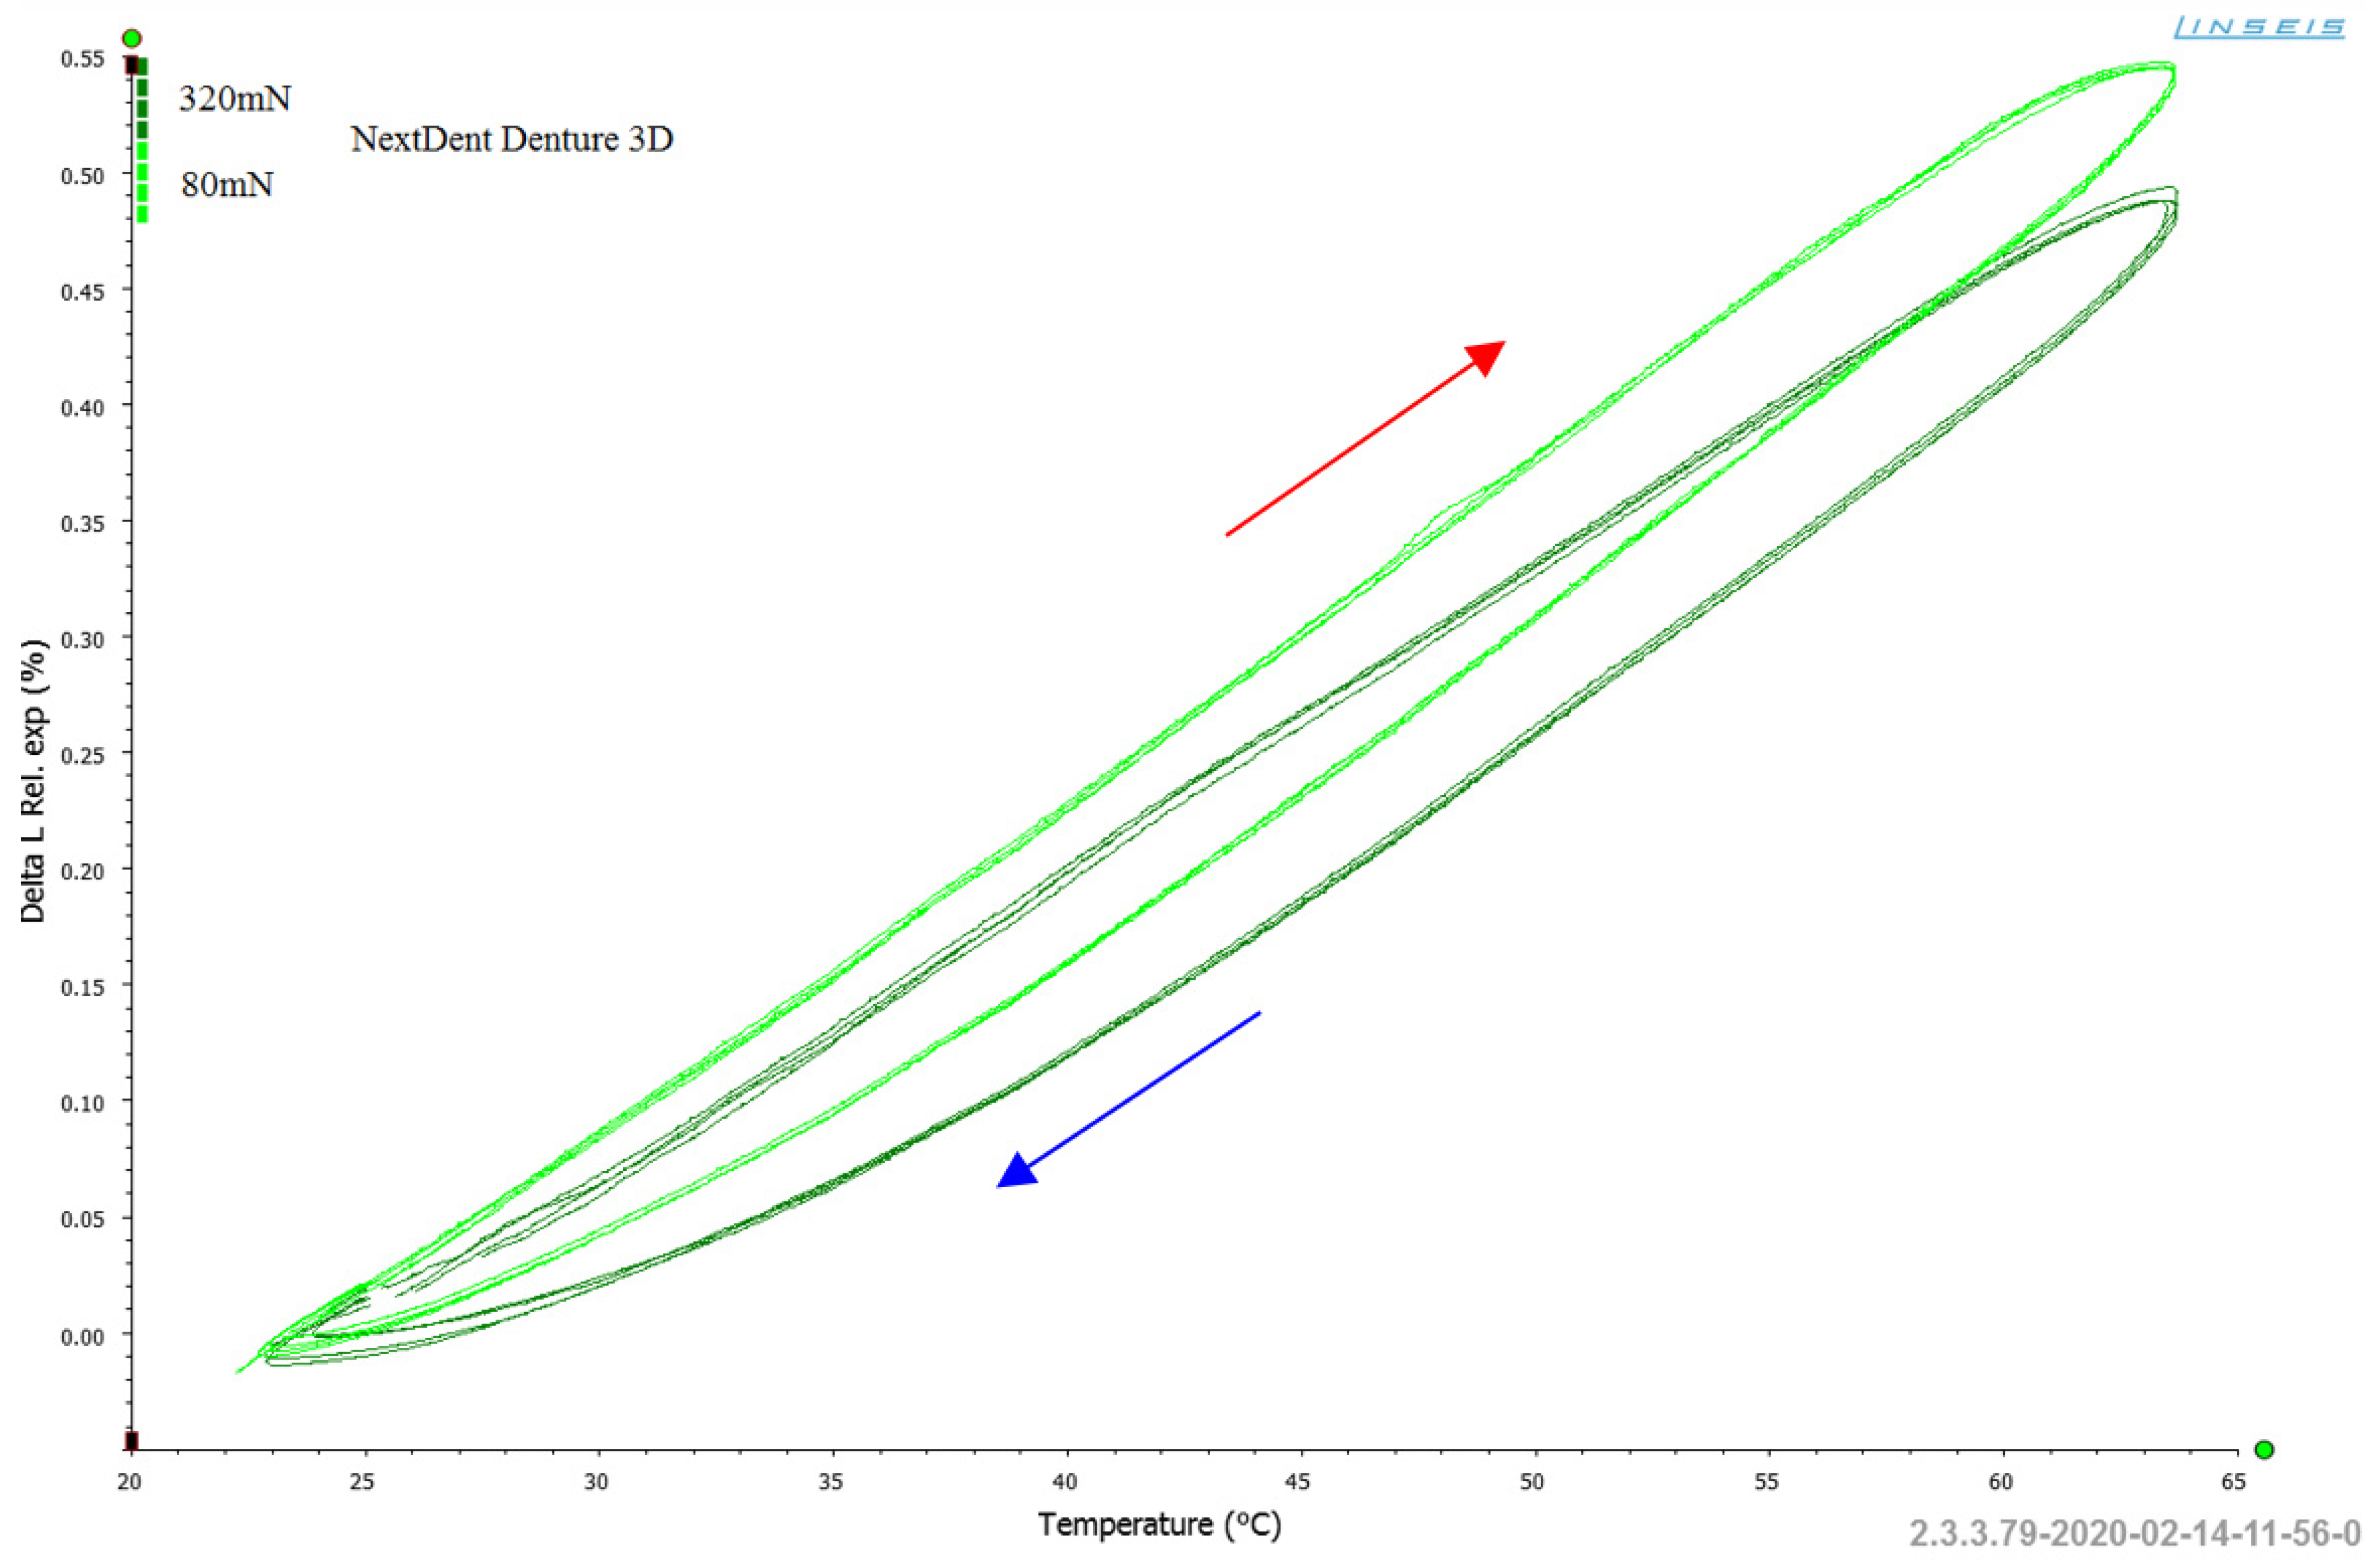
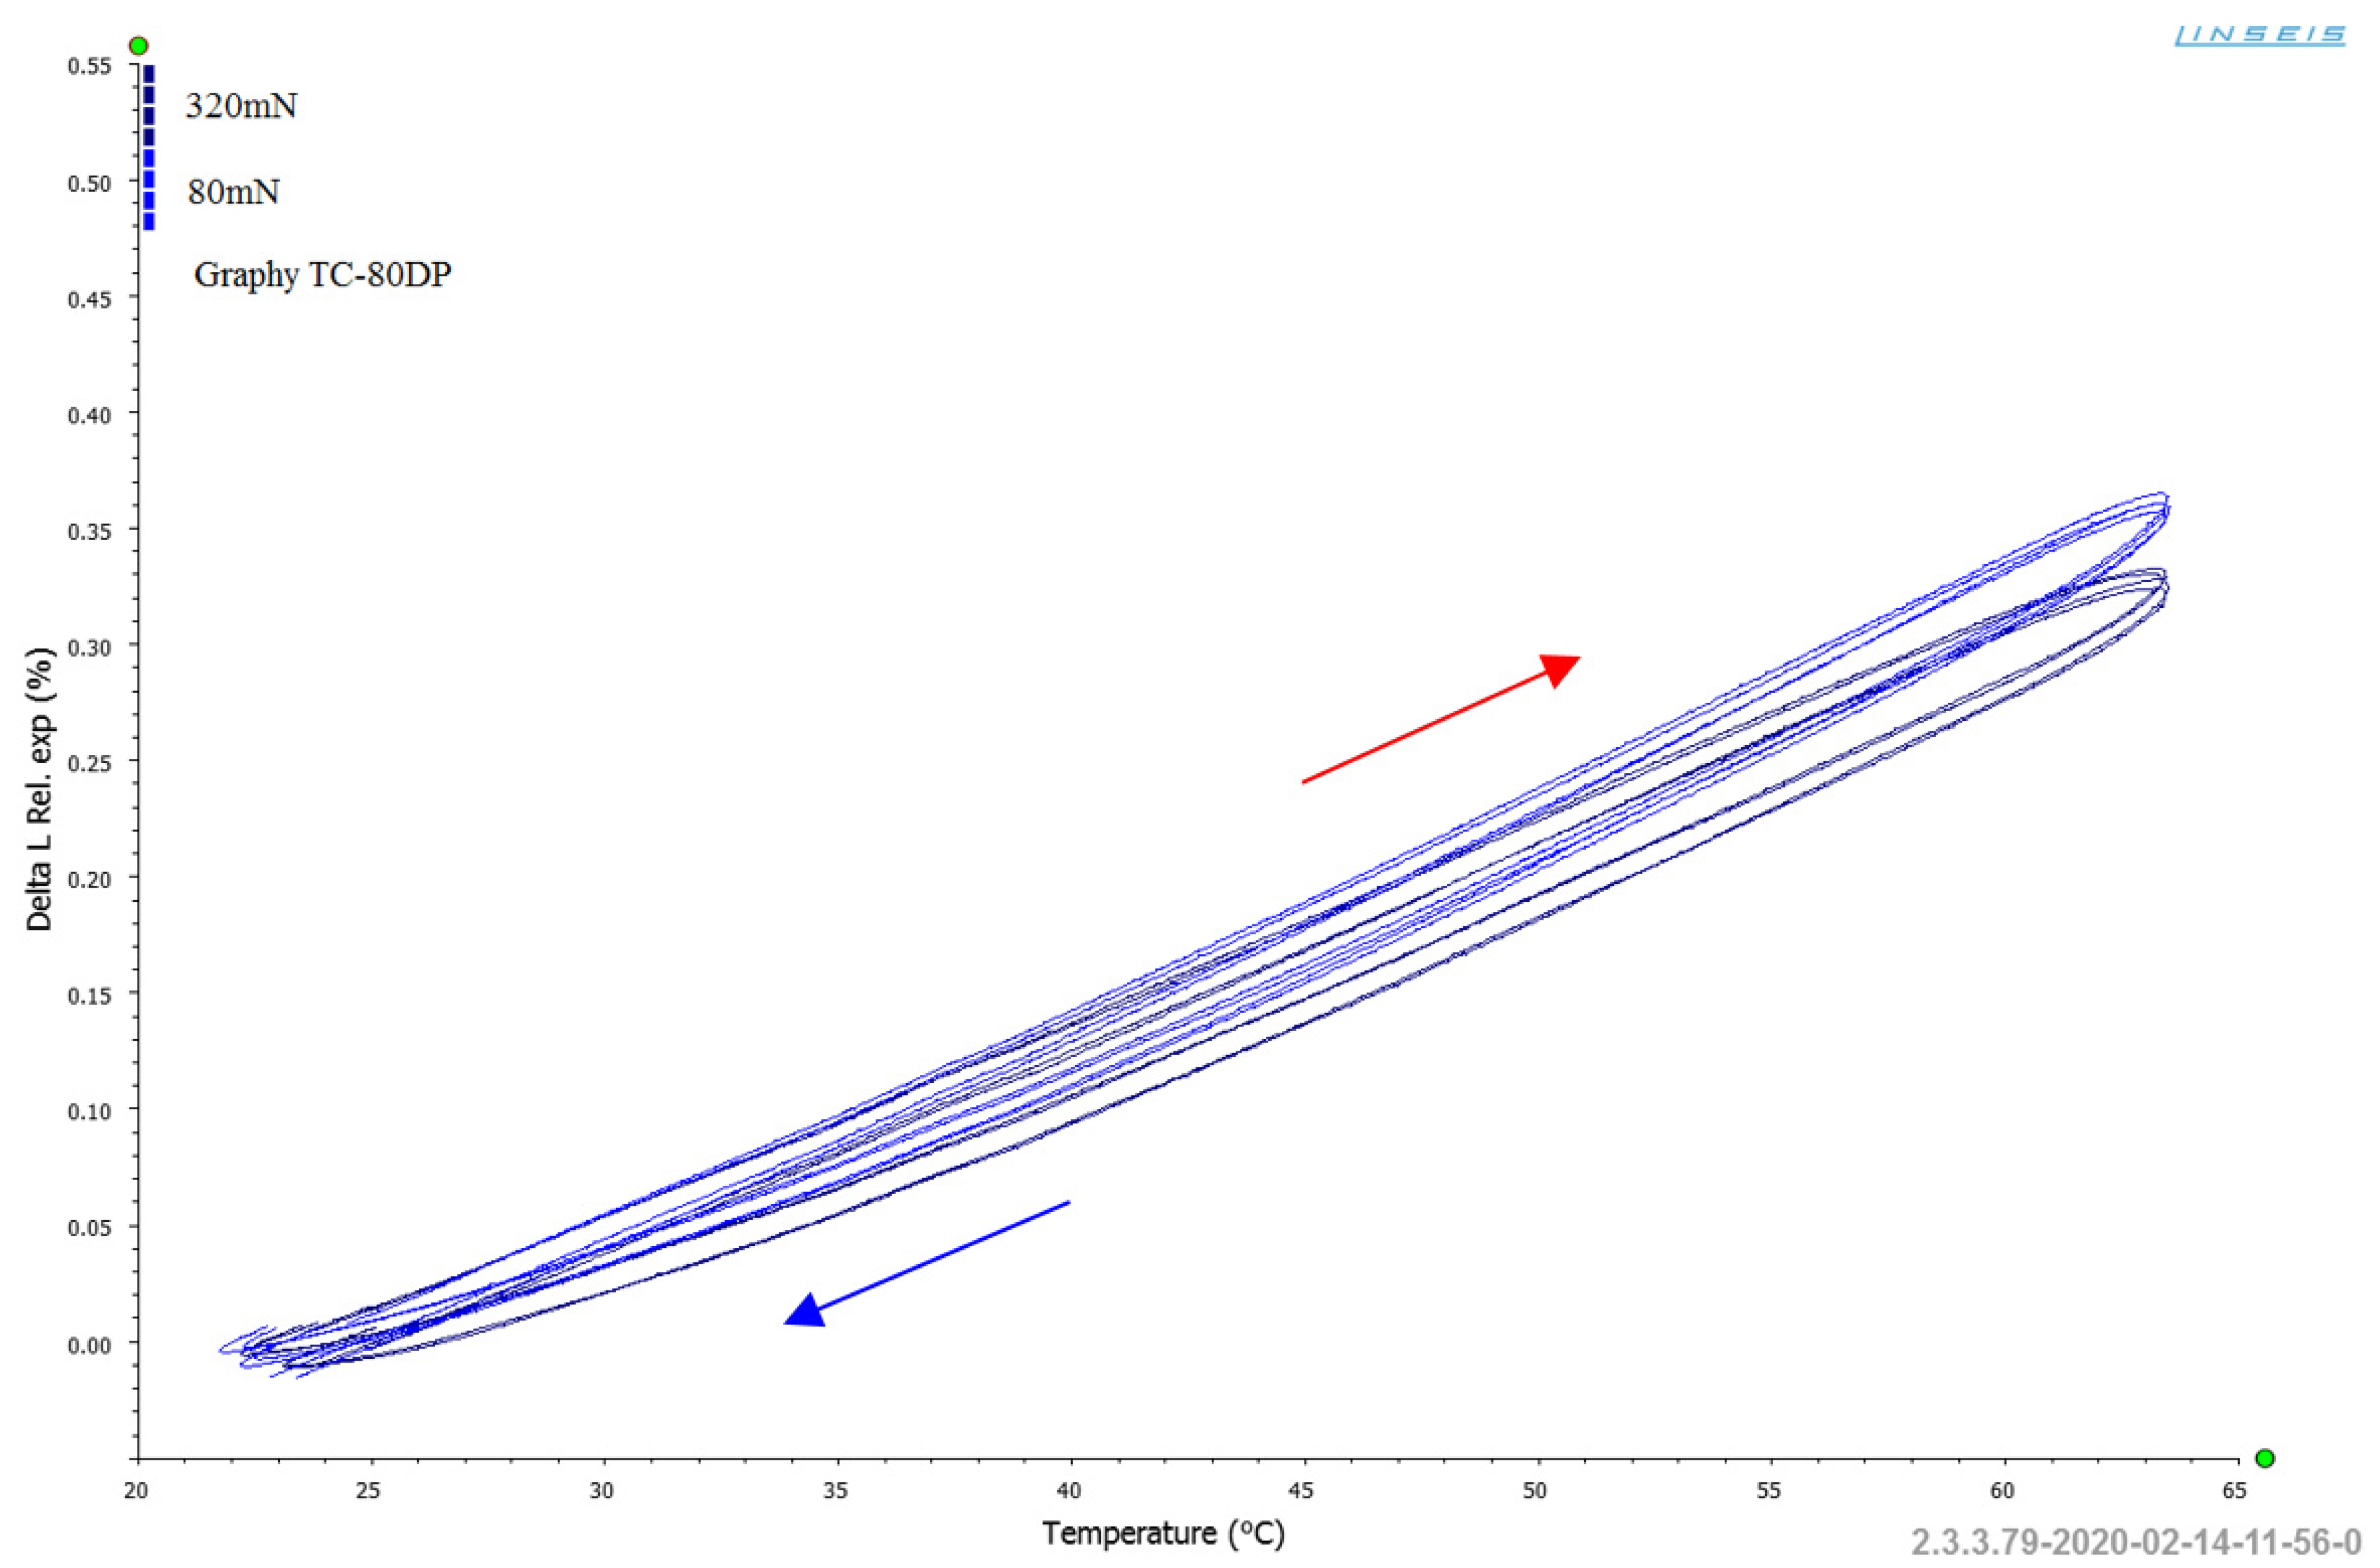
Figure 8 shows the results of the length change (ΔL) as a function of temperature for the samples from the three resins in Series A (constant pressing force F = 80.0 mN), while
Figure 9 presents the results for Series B (pressing force F = 320.0 mN). These graphs provide an initial overview of the materials’ response to thermal cycling, illustrating the dimensional changes occurring as the samples undergo controlled heating and cooling cycles.
Comparing the results presented in
Figure 8 and
Figure 9, notable differences are observed in the behaviour of the three tested materials during cyclic heating (marked with a red arrow) and cooling (marked with a blue arrow). Comparative analysis of
Figure 8 and
Figure 9 highlights significant differences in thermal behaviour between the tested materials.
The material NextDent Denture 3D exhibits a greater tendency to change (expand) its dimensions due to heating up to 60 °C in both Series A and Series B. In contrast, NextDent C&B Bleach and Graphy TC-80DP demonstrate significantly better dimensional stability within the tested temperature range. For NextDent C&B Bleach, a tendency to suppress the thermal expansion effect is also observed (
Figure 6) under an applied pressing force of F = 320.0 mN in Series B.
This behaviour highlights the distinct thermal expansion characteristics of the materials, with NextDent Denture 3D showing the least stability, while NextDent C&B Bleach and Graphy TC-80DP perform better under similar conditions.
Since the samples varied slightly in length (within the acceptable dimensional tolerance for their fabrication), efforts were made to exclude the impact of manufacturing quality on the observed measurements of length changes (ΔL) as a function of temperature. To account for these variations, the relative thermal expansion coefficient (expressed in [%]) was introduced instead of absolute length changes (ΔL).
Figure 10,
Figure 11 and
Figure 12 illustrate the comparison of the effect of pressing force on length changes, expressed through the relative thermal expansion coefficient (ΔL
Rel.
exp.). These figures provide a clearer understanding of how the applied force influenced the expansion behaviour of the materials.
Analysing
Figure 10,
Figure 11 and
Figure 12, it is evident that the applied pressing force (within the tested temperature range) had a noticeable effect on the relative linear expansion of the NextDent Denture 3D samples (
Figure 10). In contrast, in the other cases (
Figure 11 and
Figure 12), the impact of the pressing force on suppressing the linear expansion phenomenon of the tested resins was negligible.
As a result, it was concluded that in comparative studies aimed at determining the linear thermal expansion coefficient of resin-based dental materials, it is safe to use the minimum possible pressing force. This approach was followed in the conducted research, where a minimum force of F = 80.0 mN was applied.
For further analyses of the dimensional stability of resins intended for prosthetic applications, data from Series A were utilized.
Table 1 presents the results of thermal expansion coefficient α (10
−6/K) measurements for the three tested materials at 1 °C intervals during cyclic runs 2–5.
To facilitate interpretation of the results,
Table 2 presents the averaged thermal expansion coefficient values over 5 °C intervals, highlighting temperature-dependent trends in material expansion.
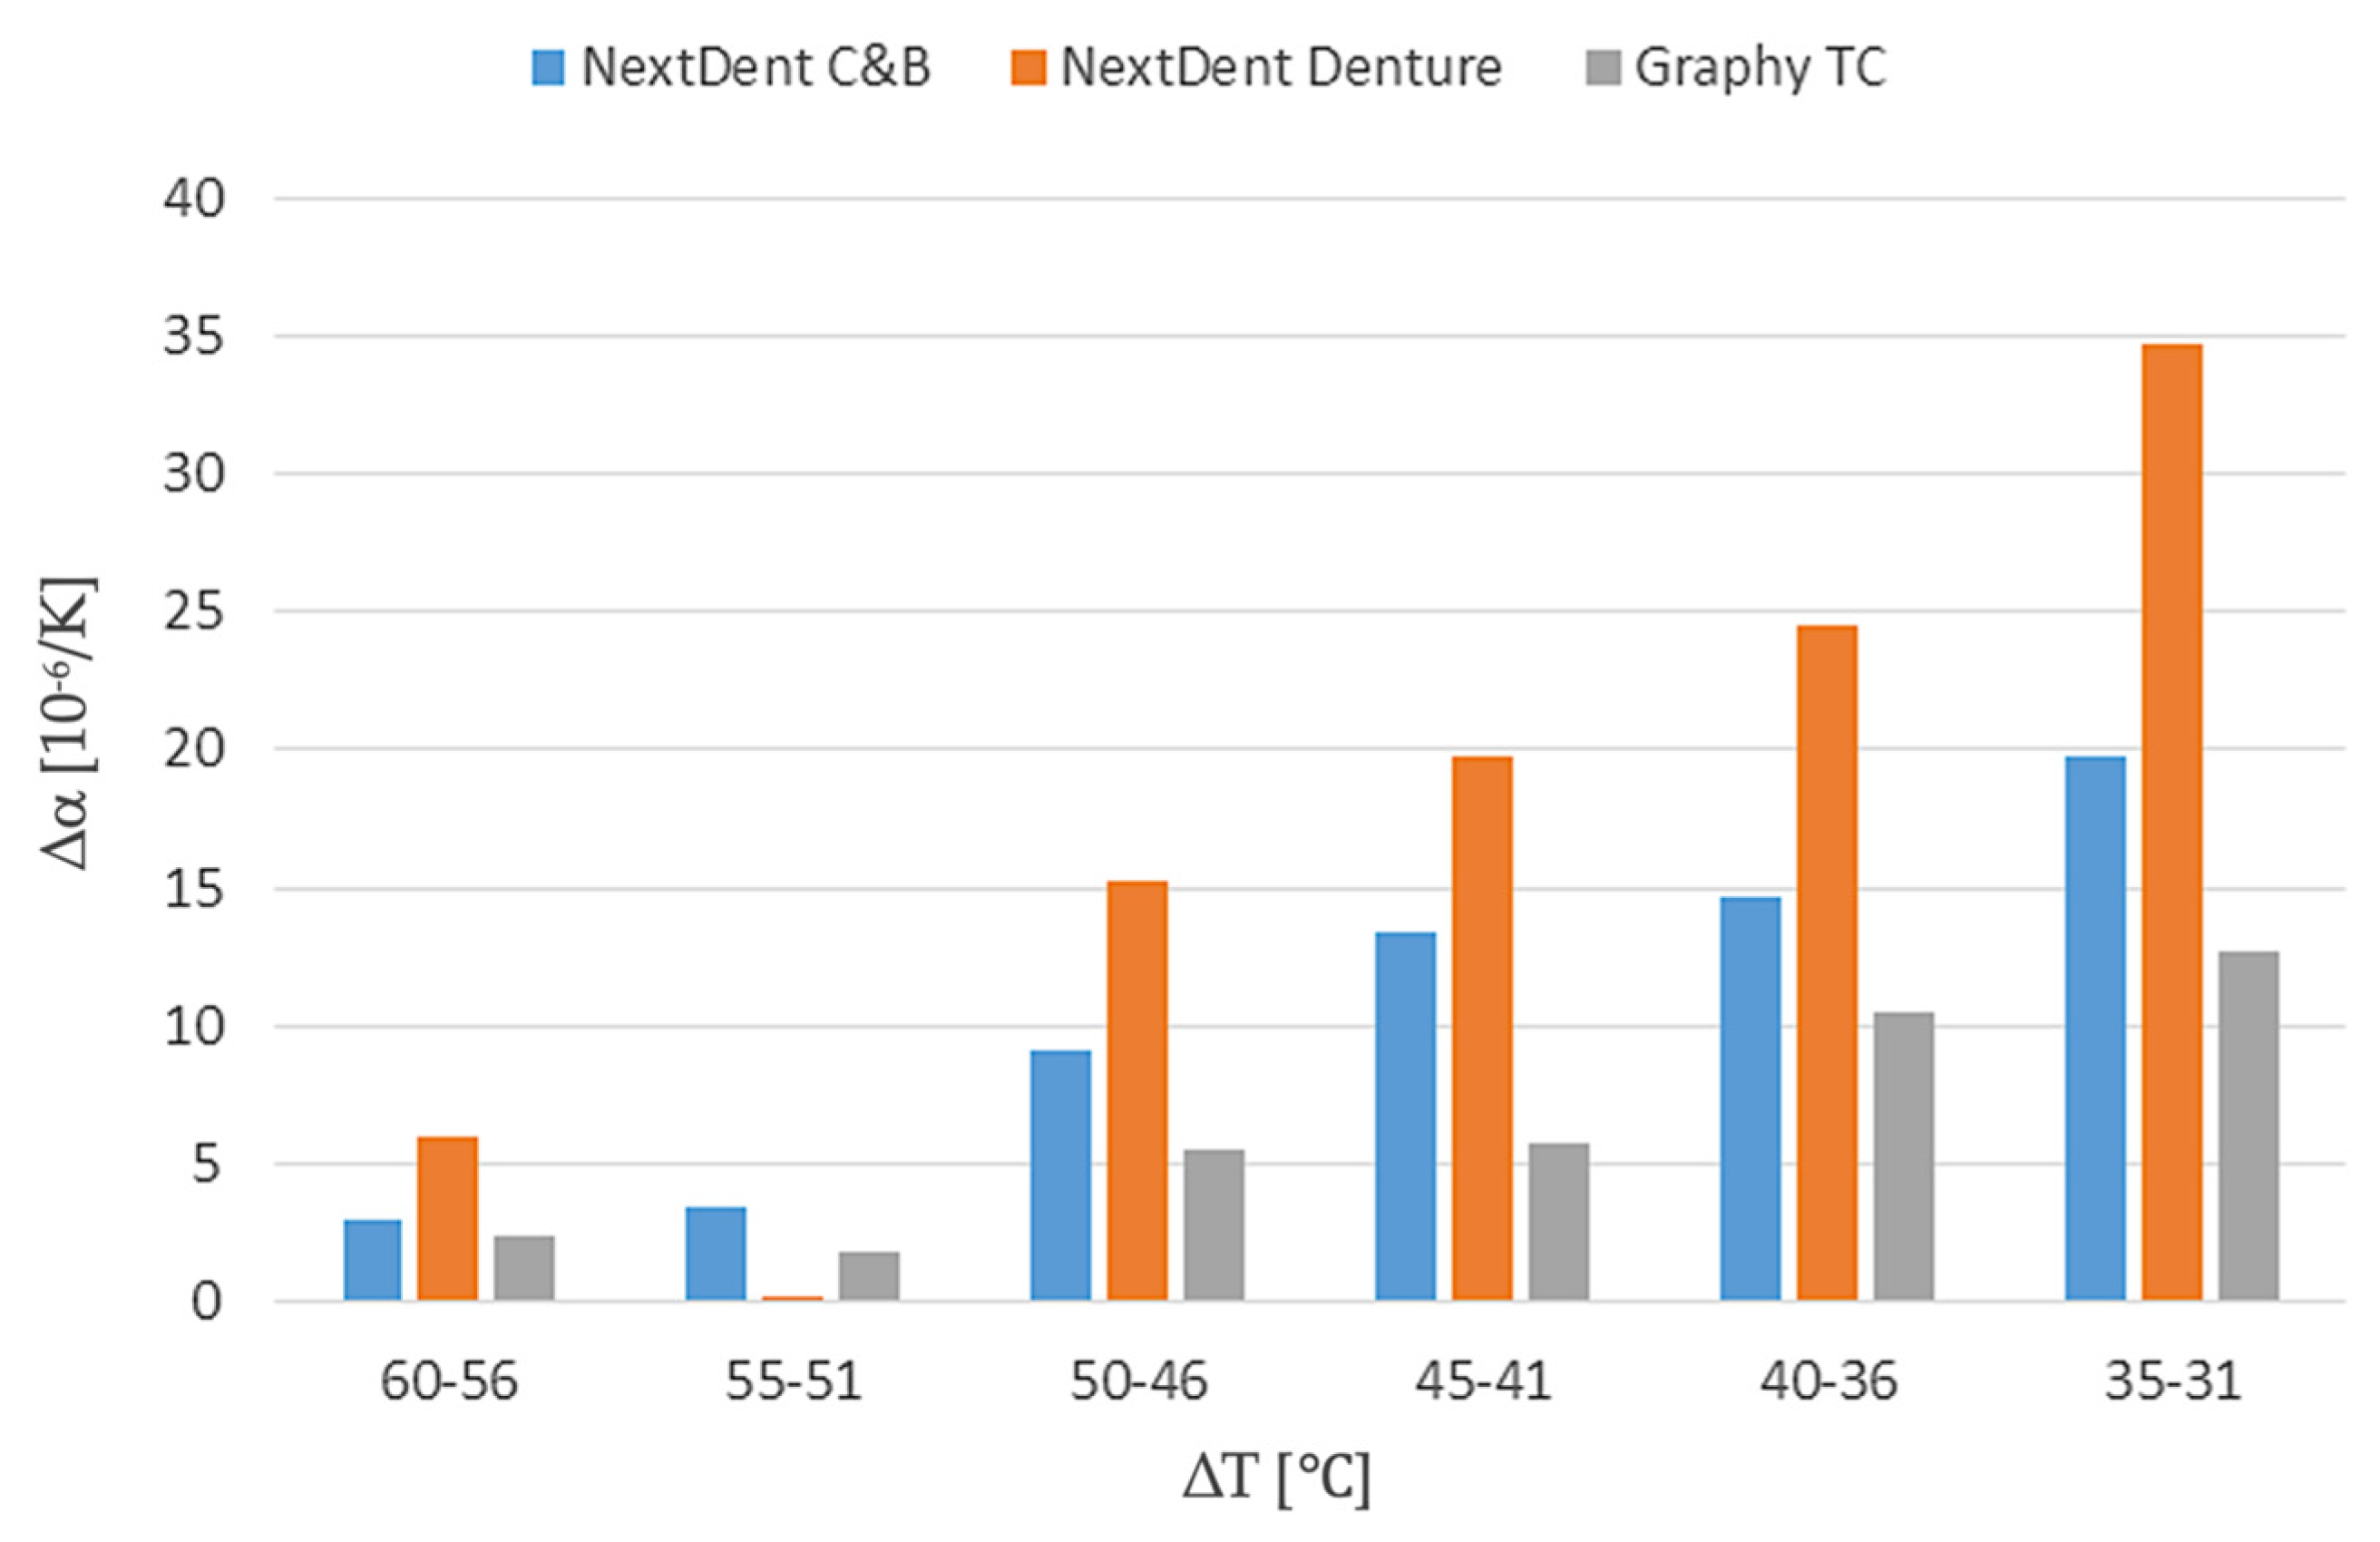
Based on the average α coefficient values presented in
Table 2,
Figure 13 illustrates the increments in values across each specified interval to highlight the differences in thermal expansion changes for each of the tested materials.
The conducted studies revealed that the largest increases in the thermal expansion coefficient α occur in the temperature range of 31–35 °C for all the tested resins. In subsequent intervals, up to a temperature of 50 °C, the increases in α gradually decrease. Beyond 50 °C, the increases (Δ) in α become minimal. The largest increases in α within the specified temperature ranges were observed for NextDent Denture 3D, while the other resins exhibited smaller increases. This indicates that the dimensional changes caused by temperature increases were significantly less dynamic for NextDent C&B Bleach and Graphy TC-80DP, making them more stable under thermal variations.
Table 3 summarizes the thermal expansion studies, expressed as the cumulative values of the linear thermal expansion coefficient over the entire measurement range, from 25 °C to 63 °C.
Analysing the cumulative values of the thermal expansion coefficients α (10
−6/K) presented in
Table 3, it is evident that the materials NextDent C&B MFH Bleach and Graphy TC-80DP exhibit similar tendencies to change their linear dimensions as a result of temperature variations. In contrast, the material NextDent Denture 3D shows the highest propensity for elongation (α = 123.6) due to increasing temperature. This characteristic may be significant when selecting this material for prosthetic or dental applications, especially if the material is expected to operate within the tested temperature range.
4.2. Fatigue Testing
To complement the thermal expansion analysis, fatigue resistance was assessed through incremental and cyclic loading tests, allowing for the evaluation of mechanical stability under simulated functional conditions.
The results of the incremental load test are presented in
Figure 14. The graph shows the gradual change in load amplitude (bottom chart) and the corresponding change in sample height (top chart). Significant changes in both signals are visible at the final load level of 40.0 MPa, at which point severe structural failure occurs. Such a high load caused large deformations, leading to the complete destruction of the sample. This suggests that the fatigue limit is below 40.0 MPa, beyond which the material cannot maintain structural integrity.
A thorough analysis of the chart (
Figure 14) reveals increasing deformation of the tested materials even under small loads. At a load level of 20.0 MPa, the height of the sample consistently decreases. This effect intensifies as the load increases. These findings indicate that prosthetic restorations fabricated from these resins will gradually change their dimensions under functional loads over time. However, the dimensional changes in the sample at this load level do not exceed 0.1 mm over a length of 25.0 mm (0.4%). In the main studies, where the load amplitudes are significantly higher, the deformations are correspondingly greater. It is also worth noting that the considered load of 20.0 MPa falls within the initial elastic region of the static compression curve (
Figure 7).
The primary fatigue tests involved uniaxial compression of the samples under cyclically varying loads with a fixed load amplitude until failure. The failure criterion was defined as the occurrence of a crack in the sample. The cycle asymmetry coefficient was R = −∞ (referred to as zero-based compression). The load had a sinusoidal waveform with a frequency of 2 Hz. This frequency was chosen to approximate the loading frequency of an implant during the chewing process. Additionally, such a low frequency prevented the samples from heating during loading, ensuring that their mechanical properties were not altered due to temperature changes. A total of 54 samples were tested, and the results are presented in
Table 4.
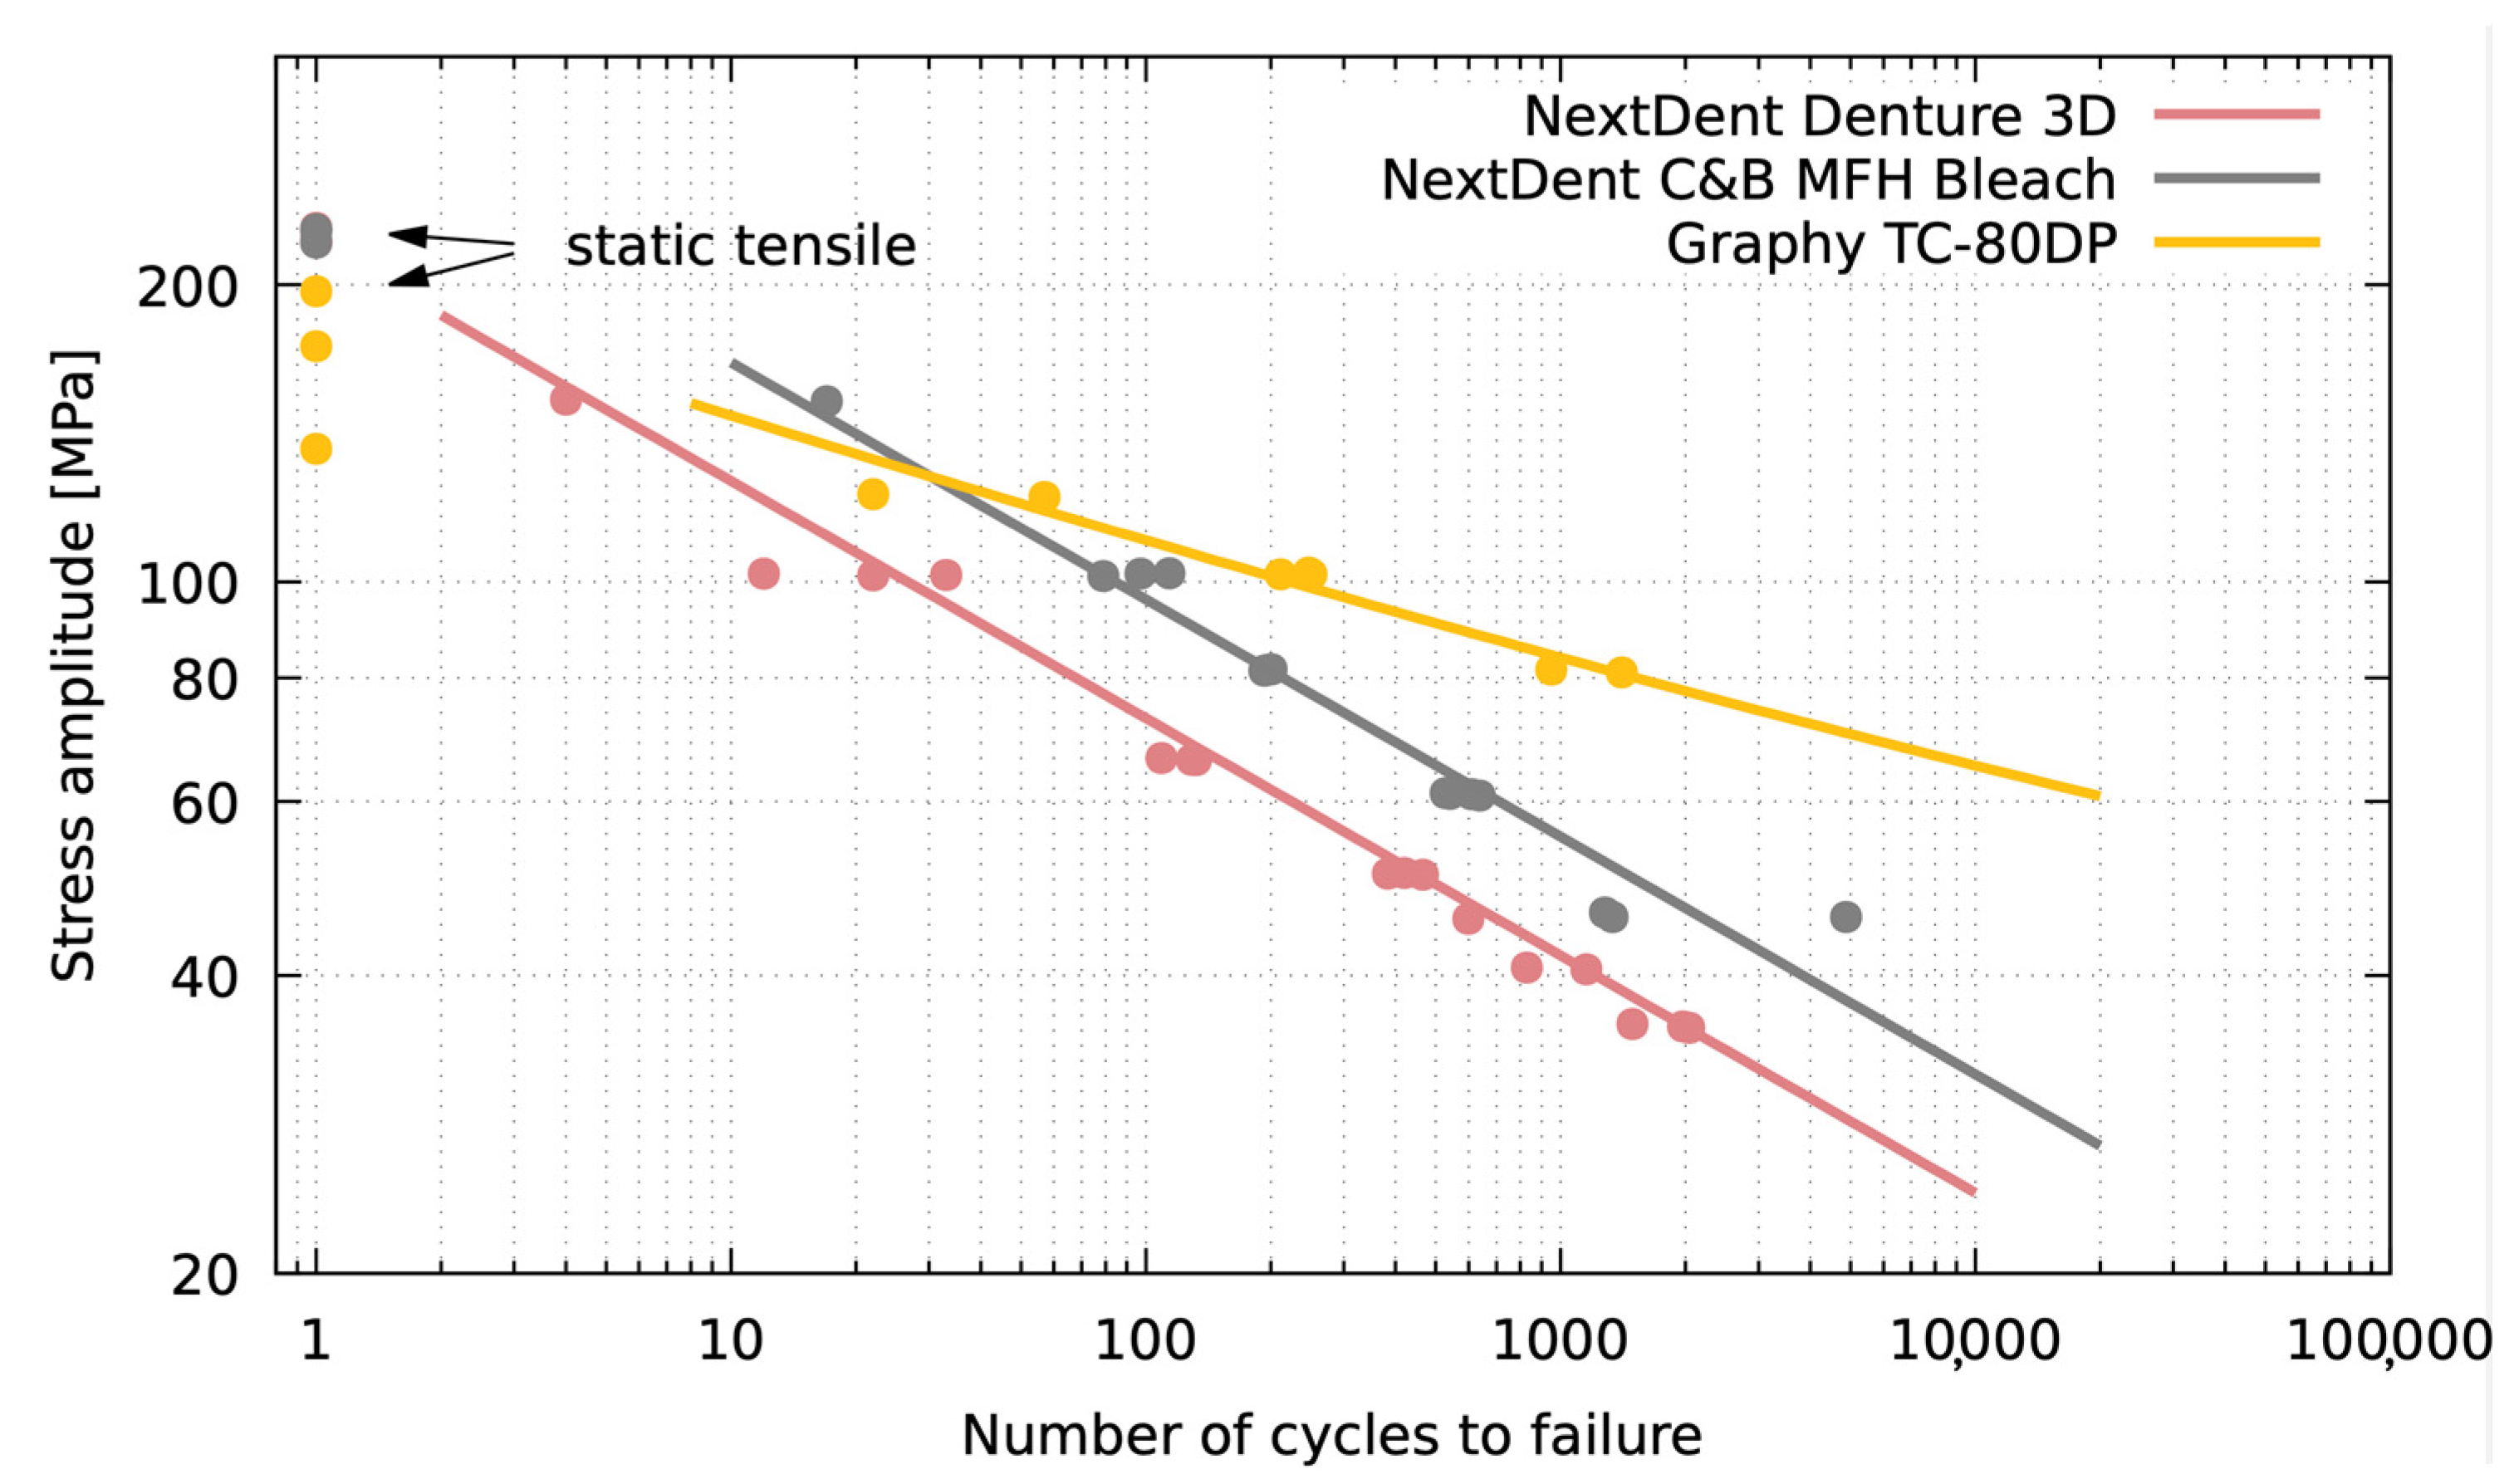
The obtained results are presented graphically in the chart shown in
Figure 15. The results are primarily limited to the range of quasi-static fatigue strength (below 1000–10,000 cycles).
Figure 15 provides a graphical representation of the fatigue strength results, illustrating the relationship between the applied stress and the number of cycles to failure.
The analysis of the presented chart (
Figure 15) indicates that the Graphy TC-80DP material exhibits the best fatigue properties among the tested materials. At the same load level, this material endures the highest number of cycles before failure compared to the other materials. Additionally, the slope of the fatigue curve for Graphy TC-80DP is the lowest among all the tested materials, indicating that variations in load amplitude have a smaller impact on its lifespan compared to the others.
The NextDent Denture 3D material (pink line) demonstrates the lowest fatigue resistance, as evidenced by its lower cycle count before failure. This material consistently failed at lower stress levels and exhibited greater dimensional changes under load. An example of a sample made from NextDent Denture 3D after a failure during fatigue tests is shown in
Figure 16.
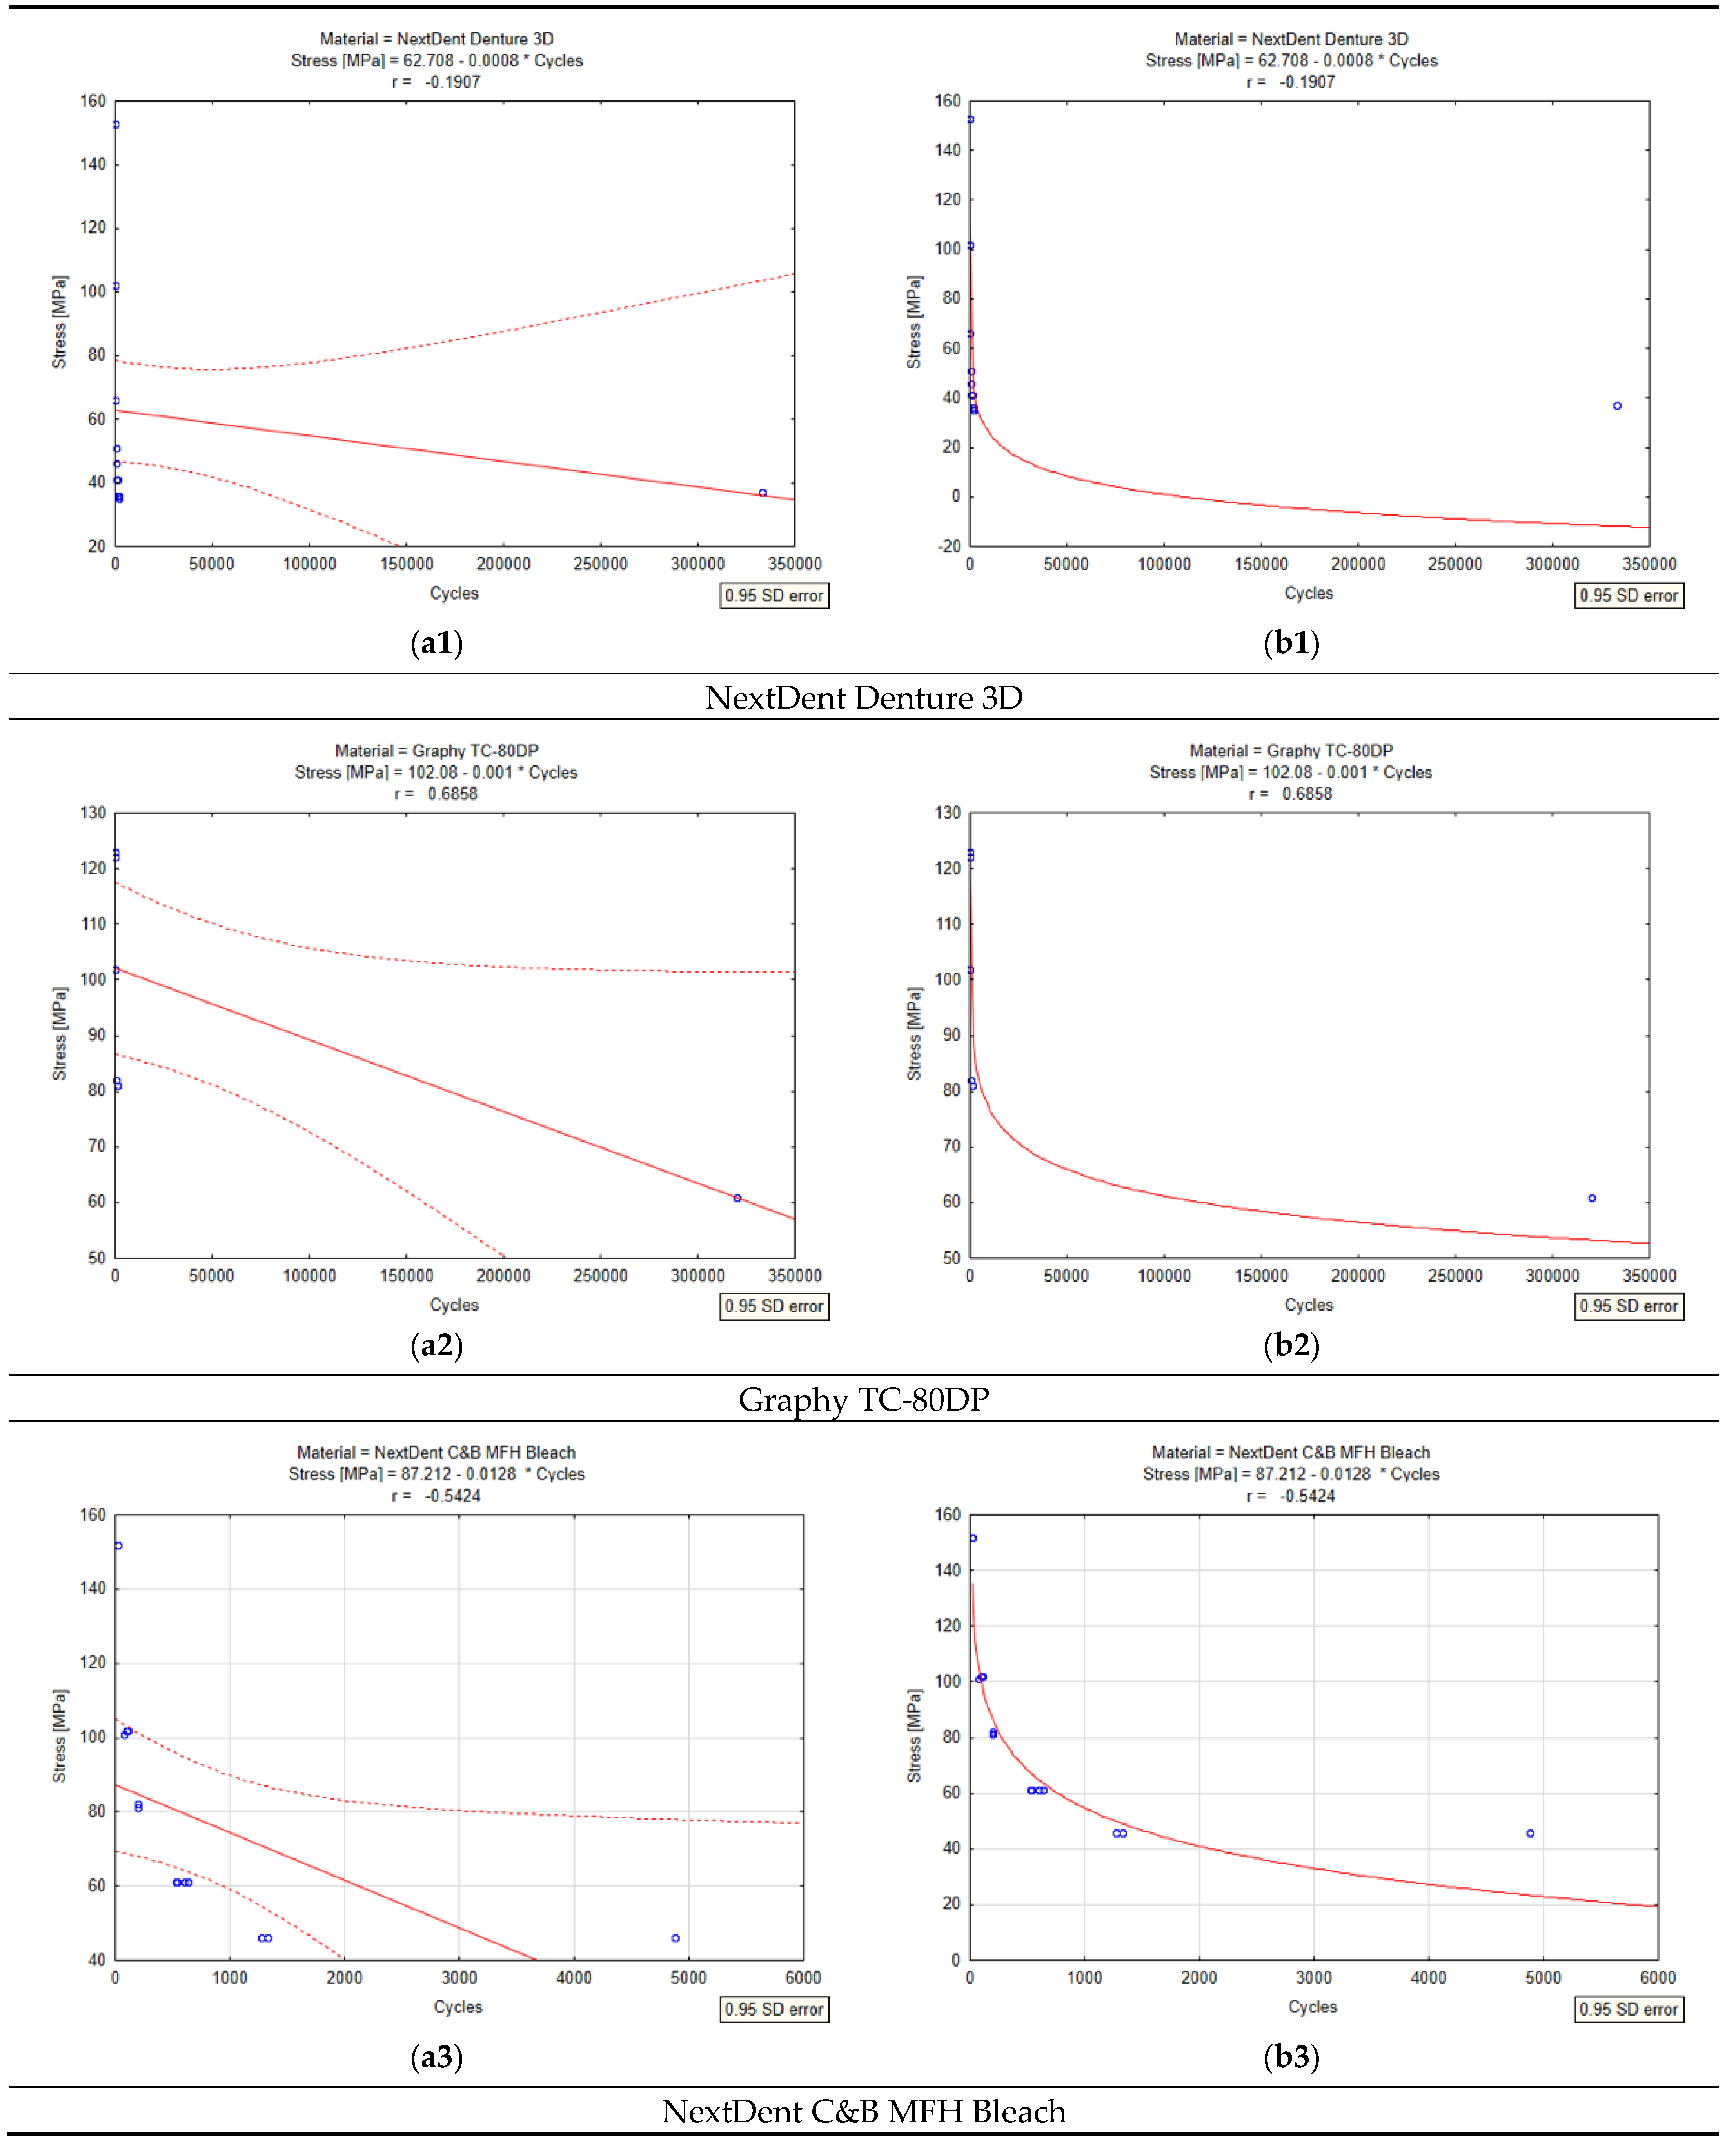
A statistical analysis conducted in Statistica 13.3 showed significant differences in the fatigue resistance of the tested materials (
Figure 17). Graphy TC-80DP achieved the highest mean stress (102 MPa) and the smoothest decrease in stress as a function of number of cycles (r = −0.001), suggesting its greater fatigue resistance. NextDent C&B MFH Bleach showed the lowest durability, with a sharp decrease in stress (r = −0.0128) and average initial stress of 87 MPa, confirming its lower resistance to cyclic loading. NextDent Denture 3D occupies an intermediate position, but its correlation coefficient of r = −0.1907 indicates a weaker relationship between the number of cycles and stress compared to Graphy TC-80DP (r = 0.6858).
The analysis of variance (ANOVA) and the Kruskal–Wallis test showed no statistically significant differences in the number of cycles between materials (p = 0.9246), but log-log regression analysis and the ANCOVA test showed that the slopes of the fatigue curves are significantly different between materials (p < 0.05). The regression plots confirm that Graphy TC-80DP has the lowest stress loss as a function of the number of cycles, indicating its better fatigue resistance compared to NextDent Denture 3D and NextDent C&B MFH Bleach. Graphs with 95% confidence intervals show that Graphy TC-80DP has the most predictable behaviour under load, while NextDent C&B MFH Bleach and NextDent Denture 3D have greater variability in the results.
An analysis of
Figure 16 allows us to conclude that the NextDent Denture 3D material has significantly deformed and completely destroyed under cyclic loading conditions. The observed destruction is a result of low fatigue resistance and susceptibility to delamination and cracking under repeated mechanical stresses.
5. SEM Microscopic Analyses
The microscopic analyses were performed using a Hitachi TM-3000 scanning electron microscope (SEM) (Angstrom Scientific, Inc., Tokyo, Japan). The studies utilized a BSE detector and a module for surface topography observation. The observations and analyses were conducted at an accelerating voltage of 15 kV with magnifications ranging from 40× to 10,000×.
The analyses were carried out on sample surfaces obtained by cutting the specimens along their axes. The resulting surfaces underwent preparation, including grinding with water-based abrasive papers ranging from P320 to P4000 and final polishing on polishing cloths using suspensions containing fine-dispersed Al2O3 particles. The studies also included observations of the fracture surfaces from the specimens subjected to complete destruction.
To enhance detail visibility on the analyzed surfaces, all the tested samples were prepared by coating their surfaces with graphite using the Q150T modular vacuum sputtering system equipped with a turbomolecular pump.
5.1. Grinded Surface Tests
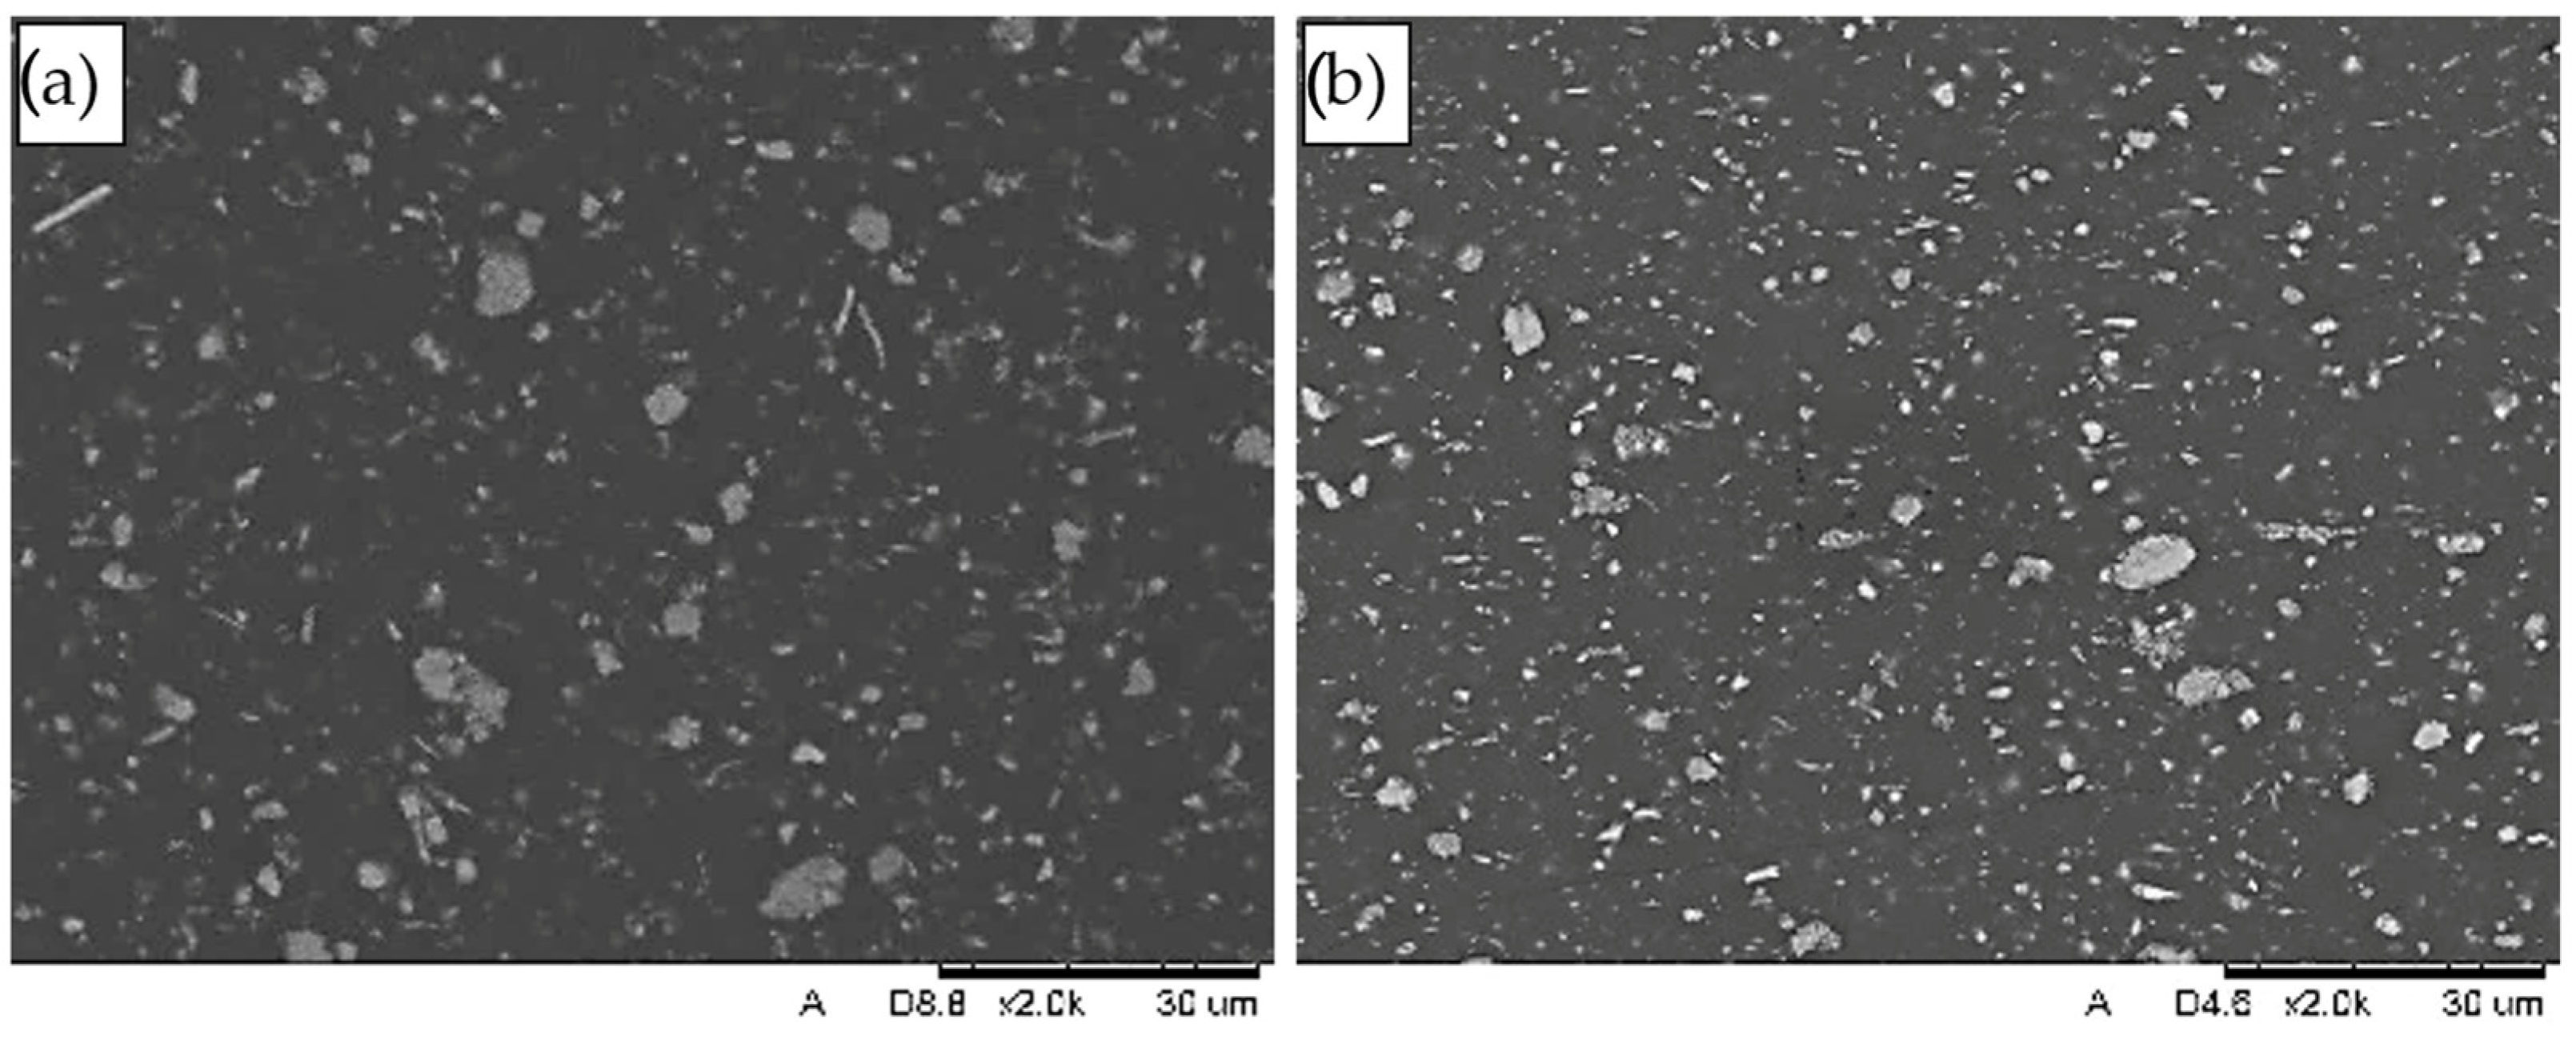
The view of the exemplary internal structure of the base materials subjected to fatigue testing is presented in
Figure 18. Preliminary studies of the material structures revealed that both the NextDent Denture 3D and NextDent C&B MFH Bleach materials consist, throughout their volume, of a matrix containing uniformly distributed filler particles. These filler particles are fine-dispersed, with sizes ranging from 0.1 mm to approximately 5.0 mm.
Studies conducted in [
17] indicate that the filler components include compounds such as SiO
2, Al
2O
3·SiO
2, Al
2O
3, and TiO
2. In contrast, no filler components were detected in the matrix of the Graphy TC-80DP material.
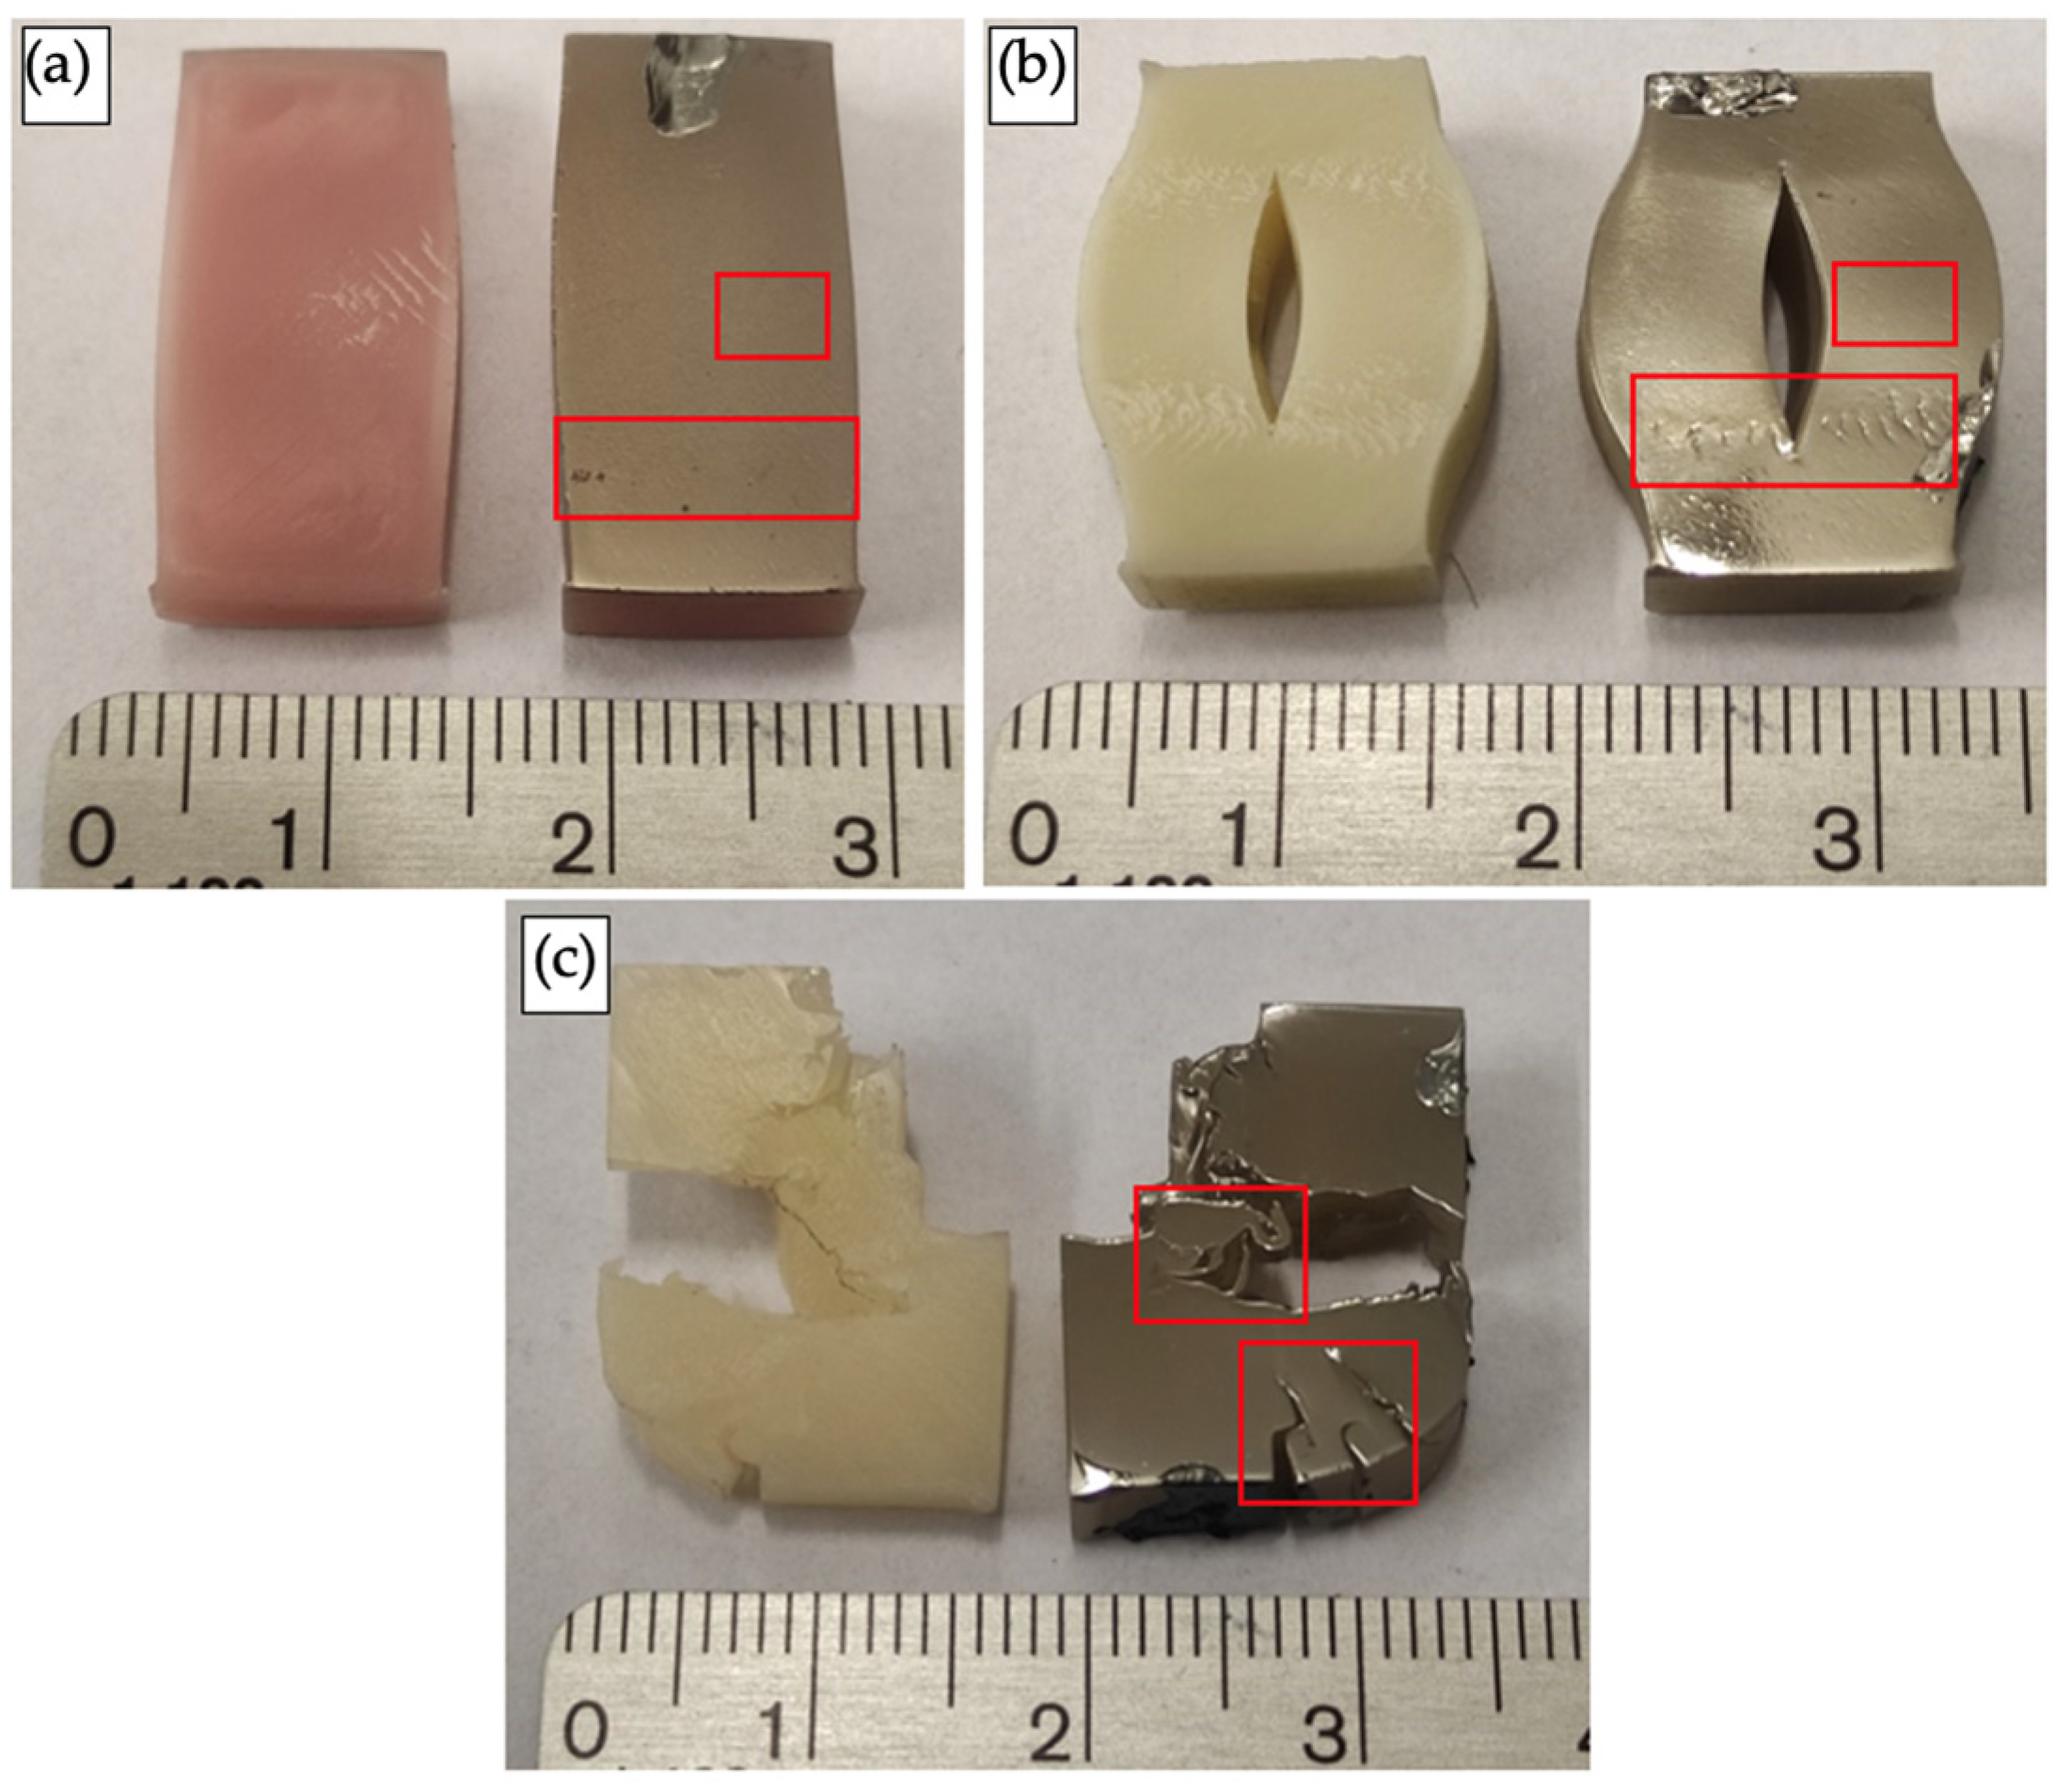
Below, in
Figure 19, a general view of the exemplary flat grinding surfaces subjected to fatigue testing is presented. Observations with the naked eye revealed that in all the examined cases, after 10,000 loading cycles, permanent dimensional changes or destruction of the samples were visible.
The smallest degree of deformation/destruction was observed in the NextDent Denture 3D samples, which mostly exhibited visible permanent deformation in the form of compression, resulting in the sample acquiring a barrel-shaped form (
Figure 19b). In the NextDent C&B MFH Bleach samples, the compression was so extensive that it caused significant delamination along the axis of the sample (
Figure 19b). The greatest degree of destruction was observed in the Graphy TC-80DP material samples, which underwent complete destruction under cyclic loading (
Figure 19c).
Based on the observations with the naked eye, areas (marked in the figure) were selected for further SEM analysis to provide a more detailed microscopic examination.
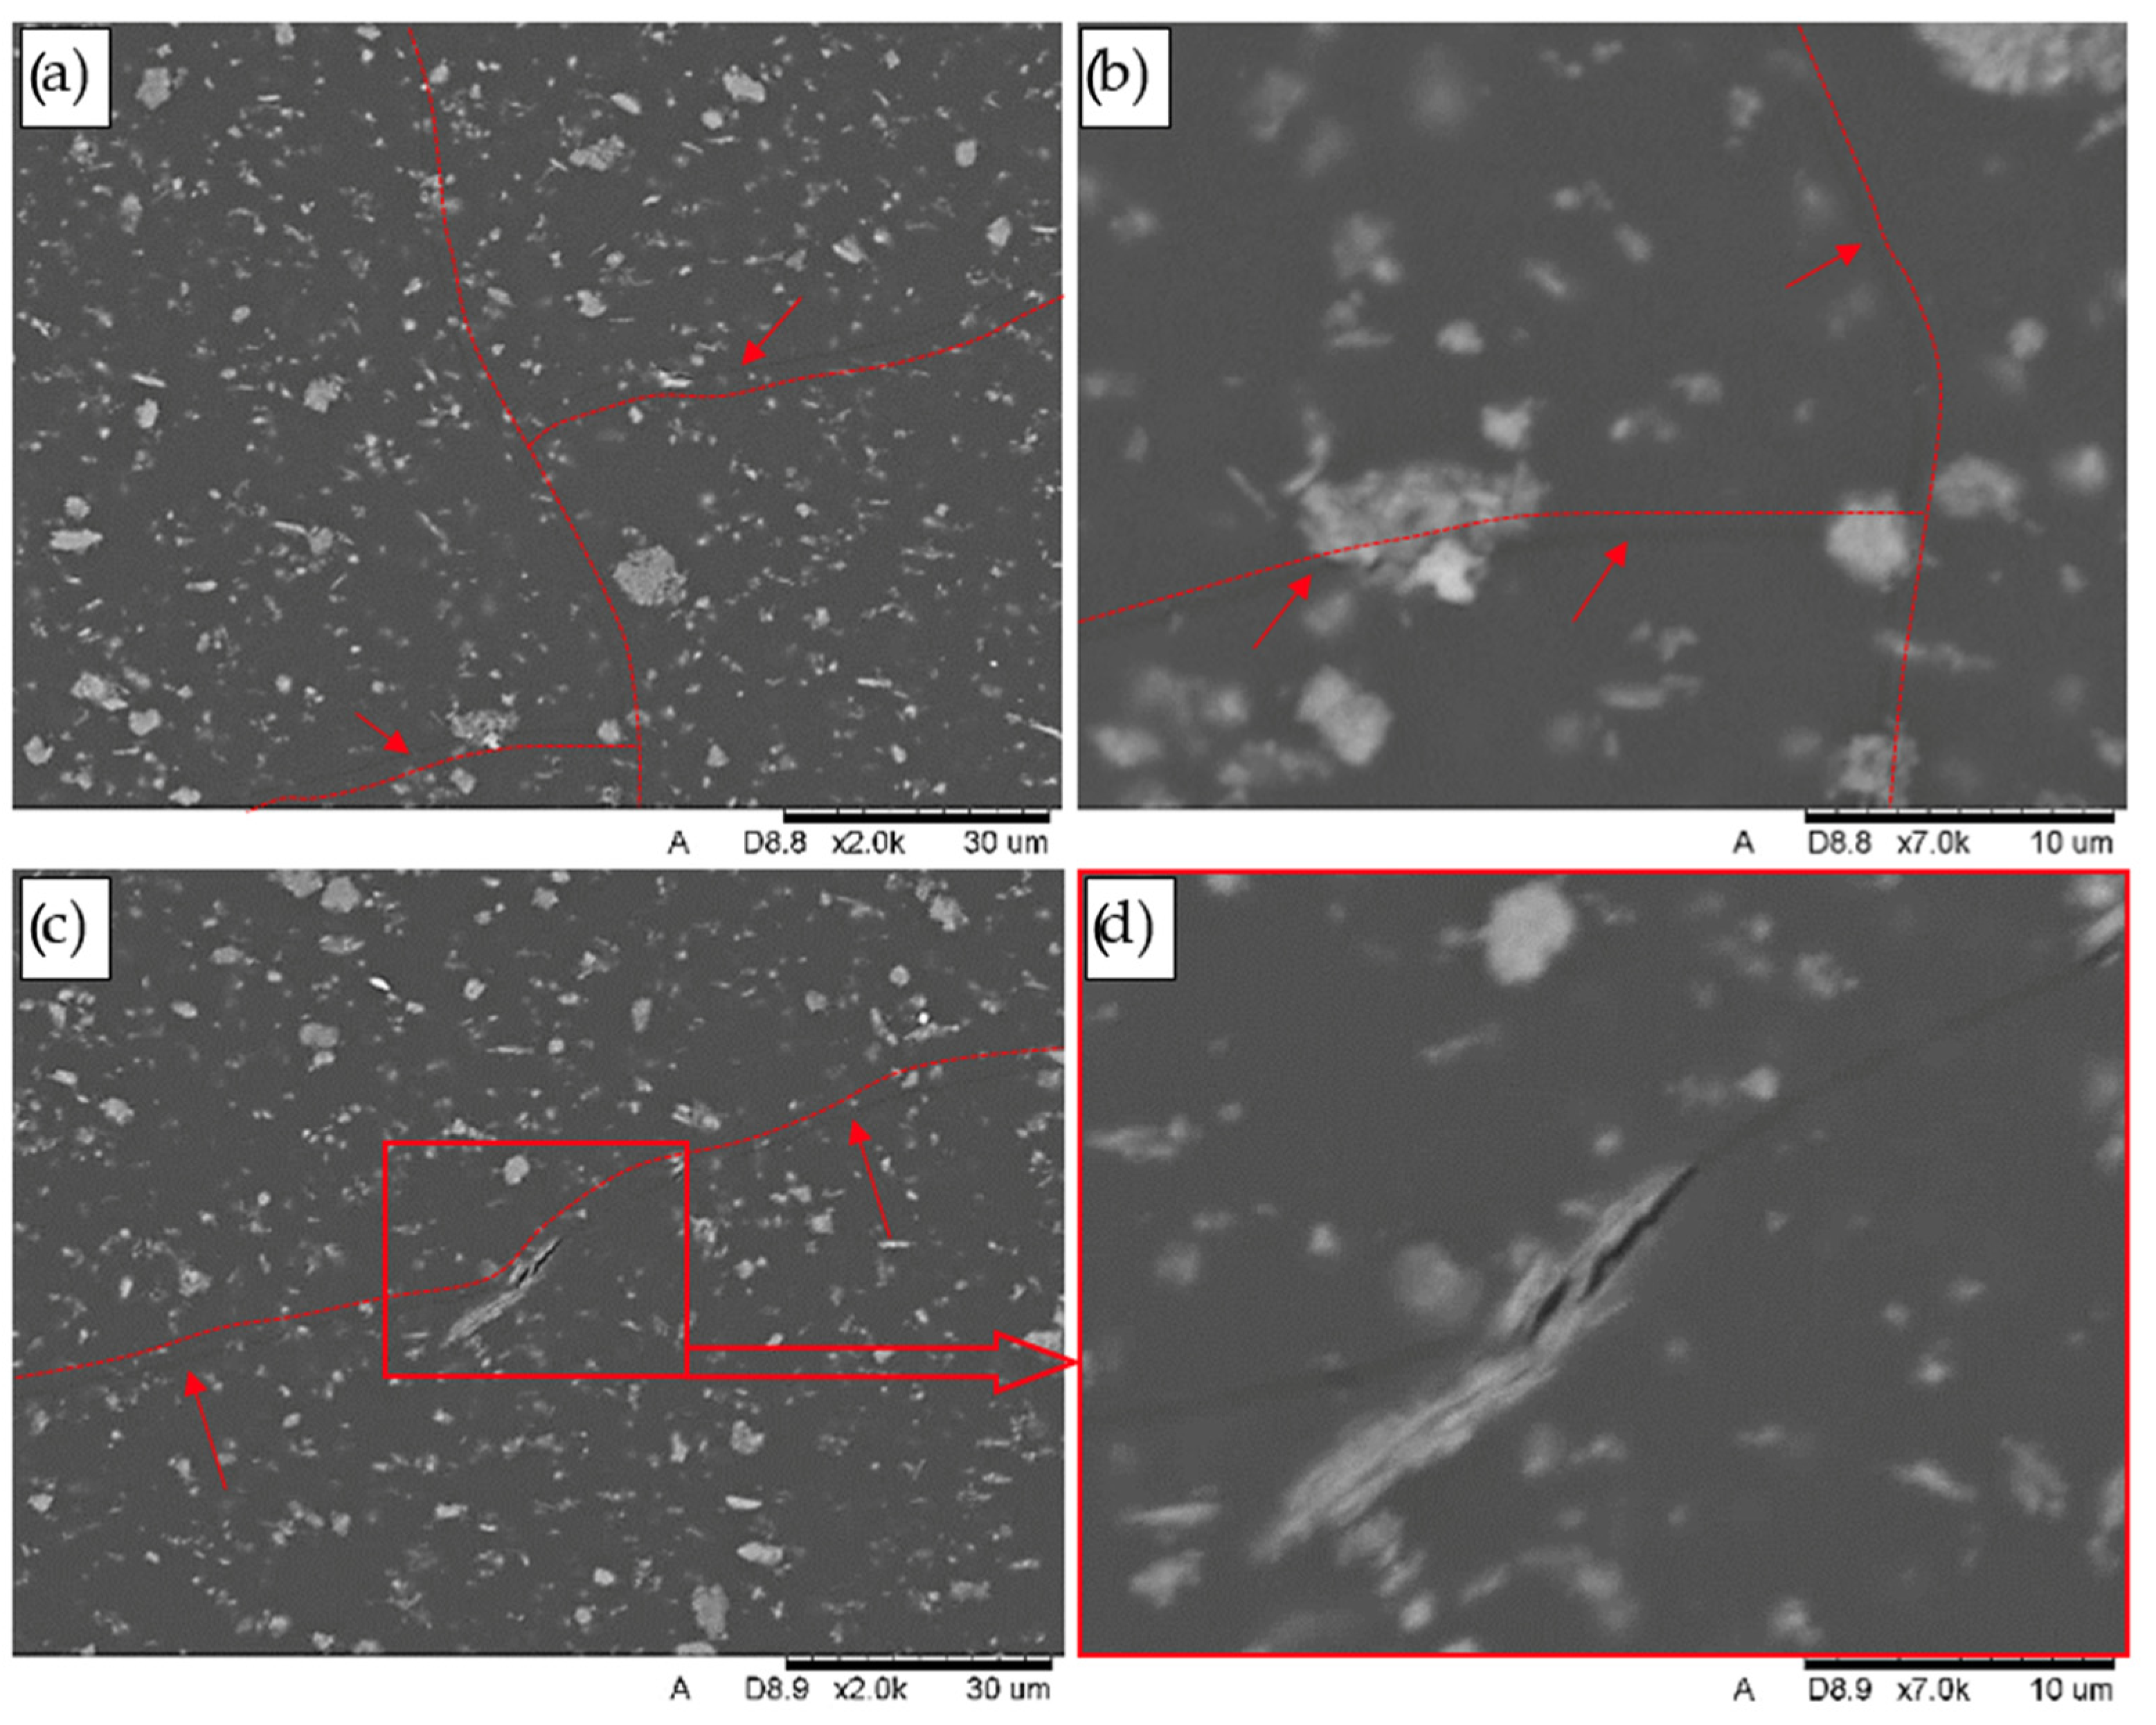
In the areas marked in the figure above (
Figure 19), on the flat grinding surfaces of both the NextDent C&B MFH Bleach and NextDent Denture 3D samples, numerous interconnected longitudinal and transverse microcracks were observed. From the longitudinal microcracks aligned with the direction of compressive forces, transverse microcracks branch out at a 90° angle, forming a network of microcracks on the grinding surface. The structure of the grinding surfaces, along with the revealed crack network, is shown in
Figure 20 and
Figure 21.
Analysis revealed that the key difference in the destruction mechanism of the discussed materials lies in the crack front’s behaviour. In the NextDent Denture 3D material (
Figure 20b–d), the crack front passes through the filler particles, while in the NextDent C&B MFH Bleach material (
Figure 21b), it progresses along the matrix–particle boundaries. This mechanism of fracture formation results from differences in the primary fraction structure of the fillers used.
In the NextDent Denture 3D material, the filler elements visible in the microstructure, which form the primary fraction, typically consist of smaller particles or flakes that are packed or agglomerated. In contrast, the filler elements in NextDent C&B MFH Bleach are usually monolithic. Consequently, when the crack front encounters greater resistance from a monolithic particle, it bypasses it and progresses along the boundary. Numerous matrix–particle separations indicate weak adhesive bonding between the material’s components.
For a clearer depiction of the microcrack network, red lines were added to the images near the cracks, and the cracks themselves are indicated with arrows.
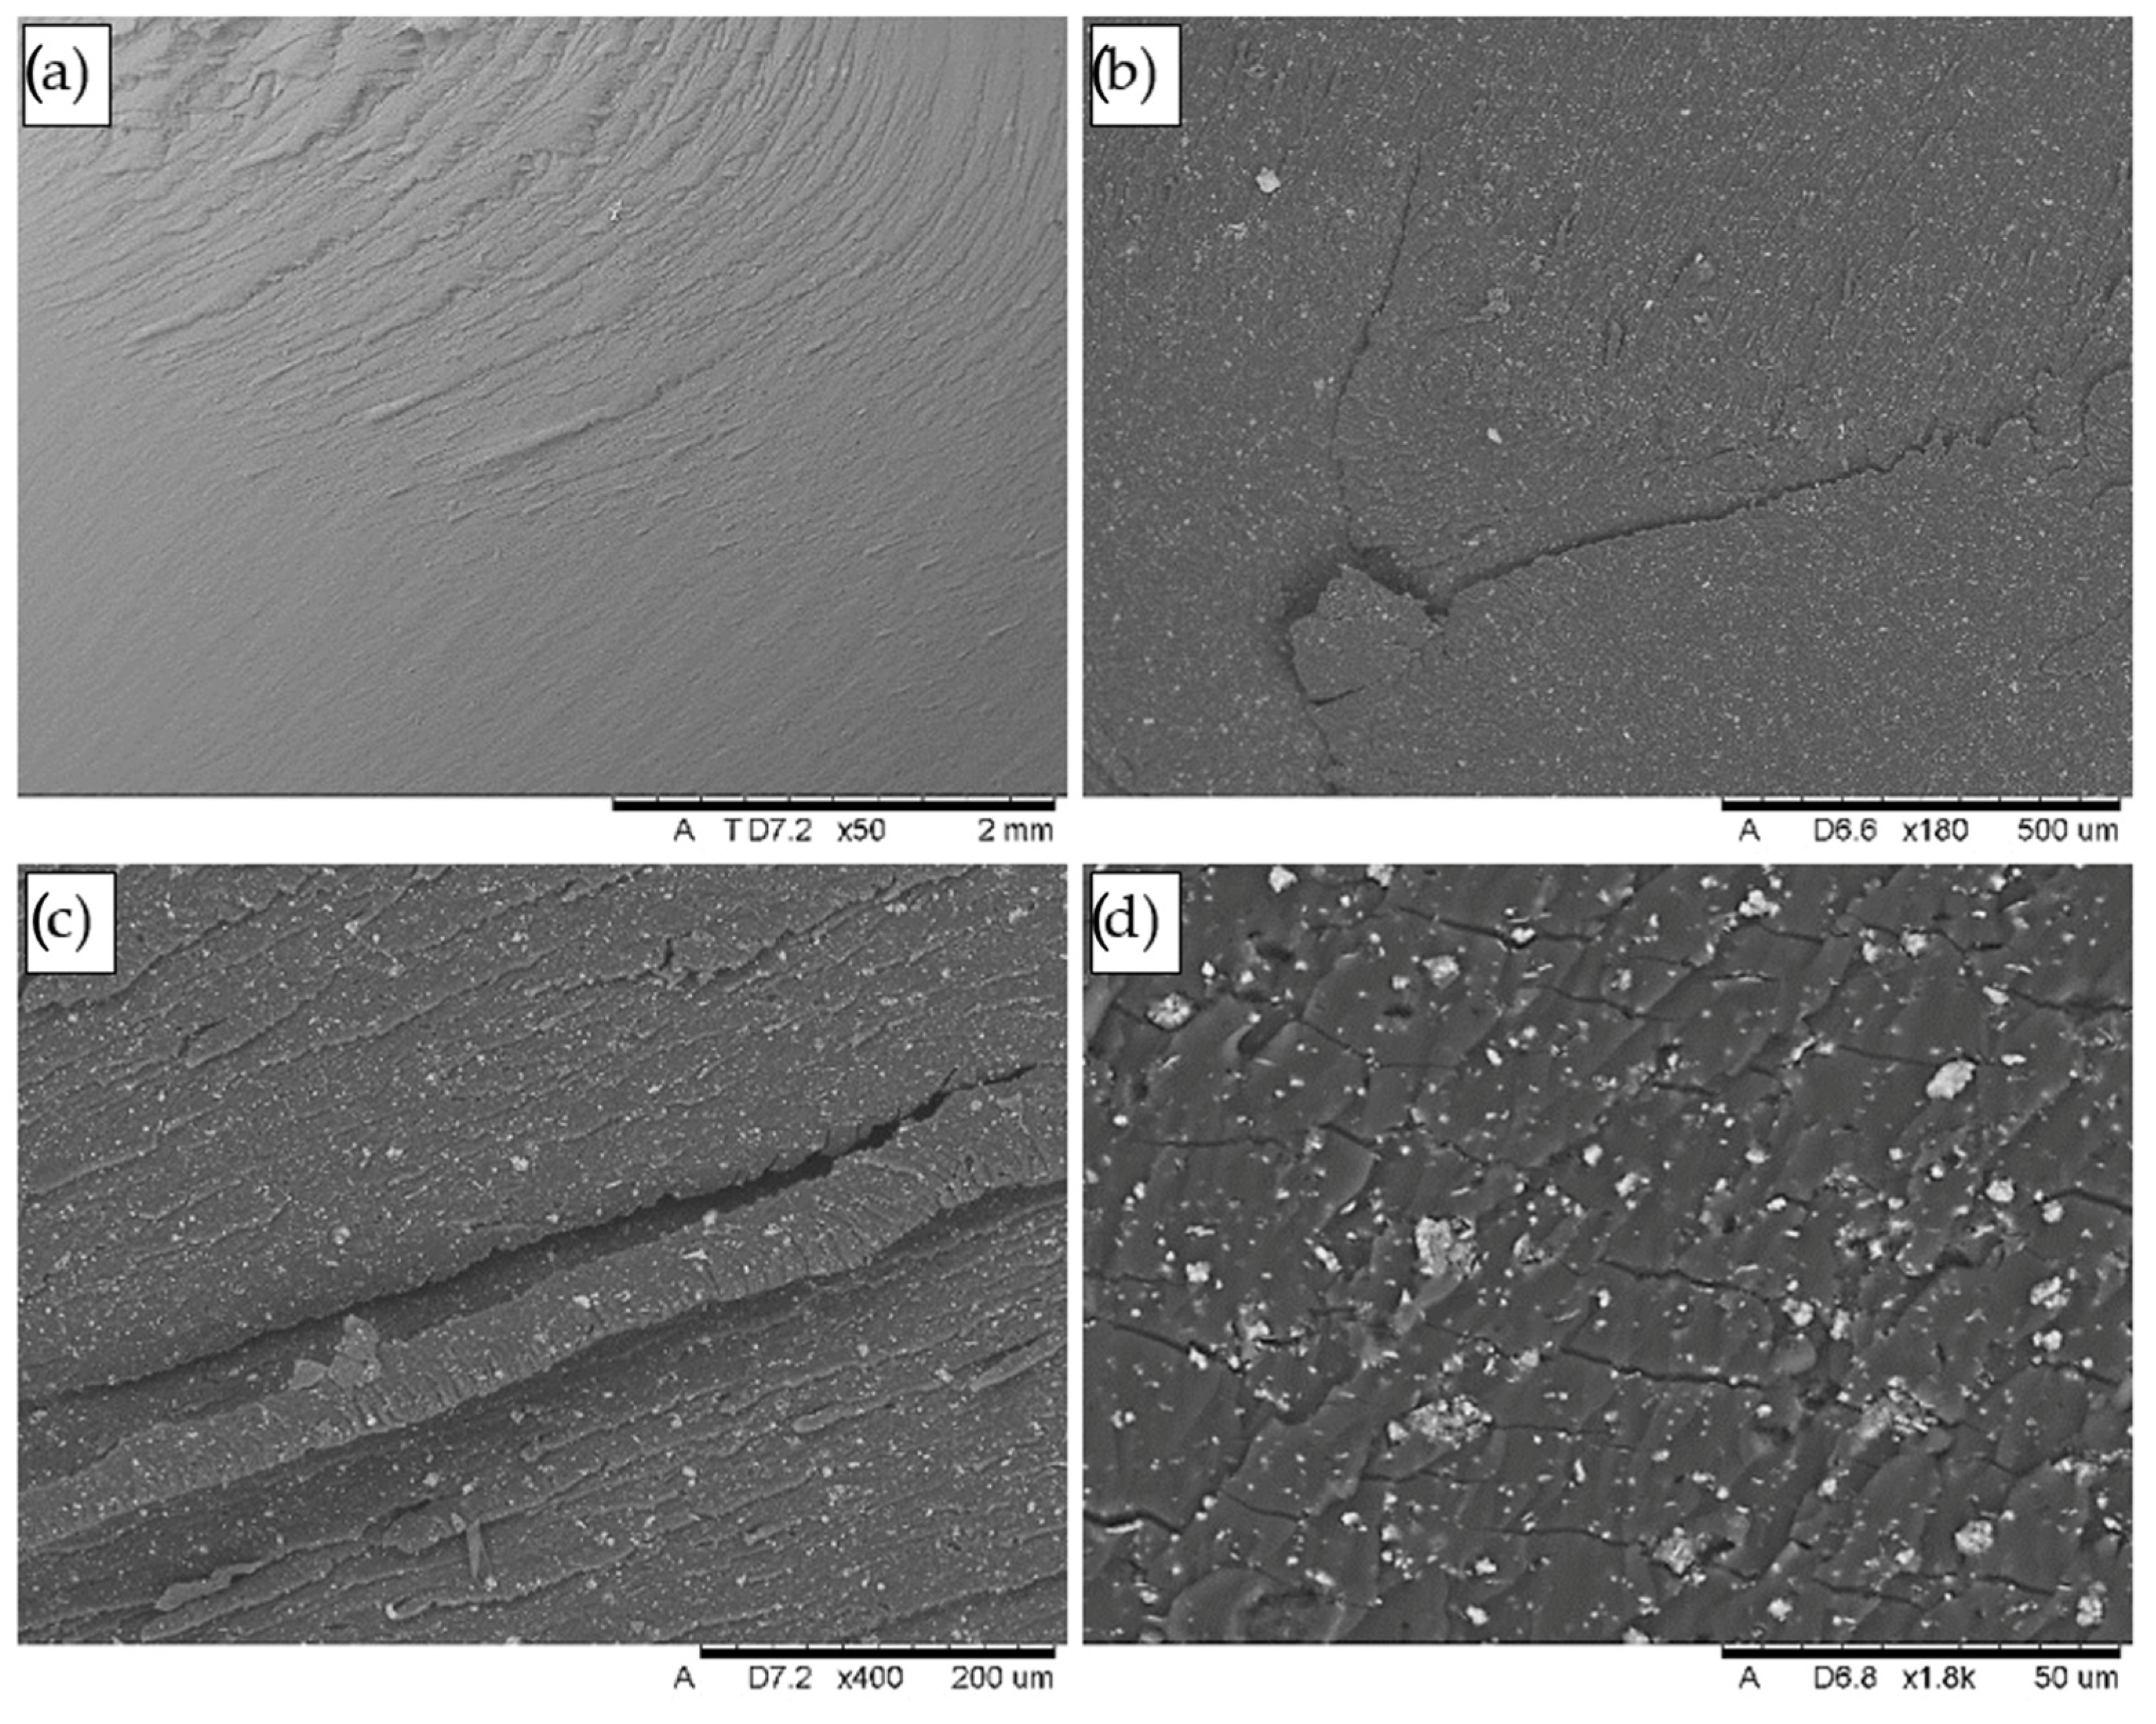
On the grinding surfaces of the samples made from the NextDent C&B MFH Bleach material, numerous delaminations and separations of material sections were observed, concentrated in the areas marked in
Figure 22a. The direction and distribution of the resulting delaminations are illustrated in
Figure 22b,c. Within the delaminated spaces, fragmented, loosely embedded filler particles were identified, with some particle fragments remaining on the edges of cracks, adhering to the matrix via adhesive bonds.
In the NextDent Denture 3D material, no delaminations as extensive as those observed in the NextDent C&B MFH Bleach samples were found in this zone. Instead, only cracks were observed, as shown in
Figure 20.
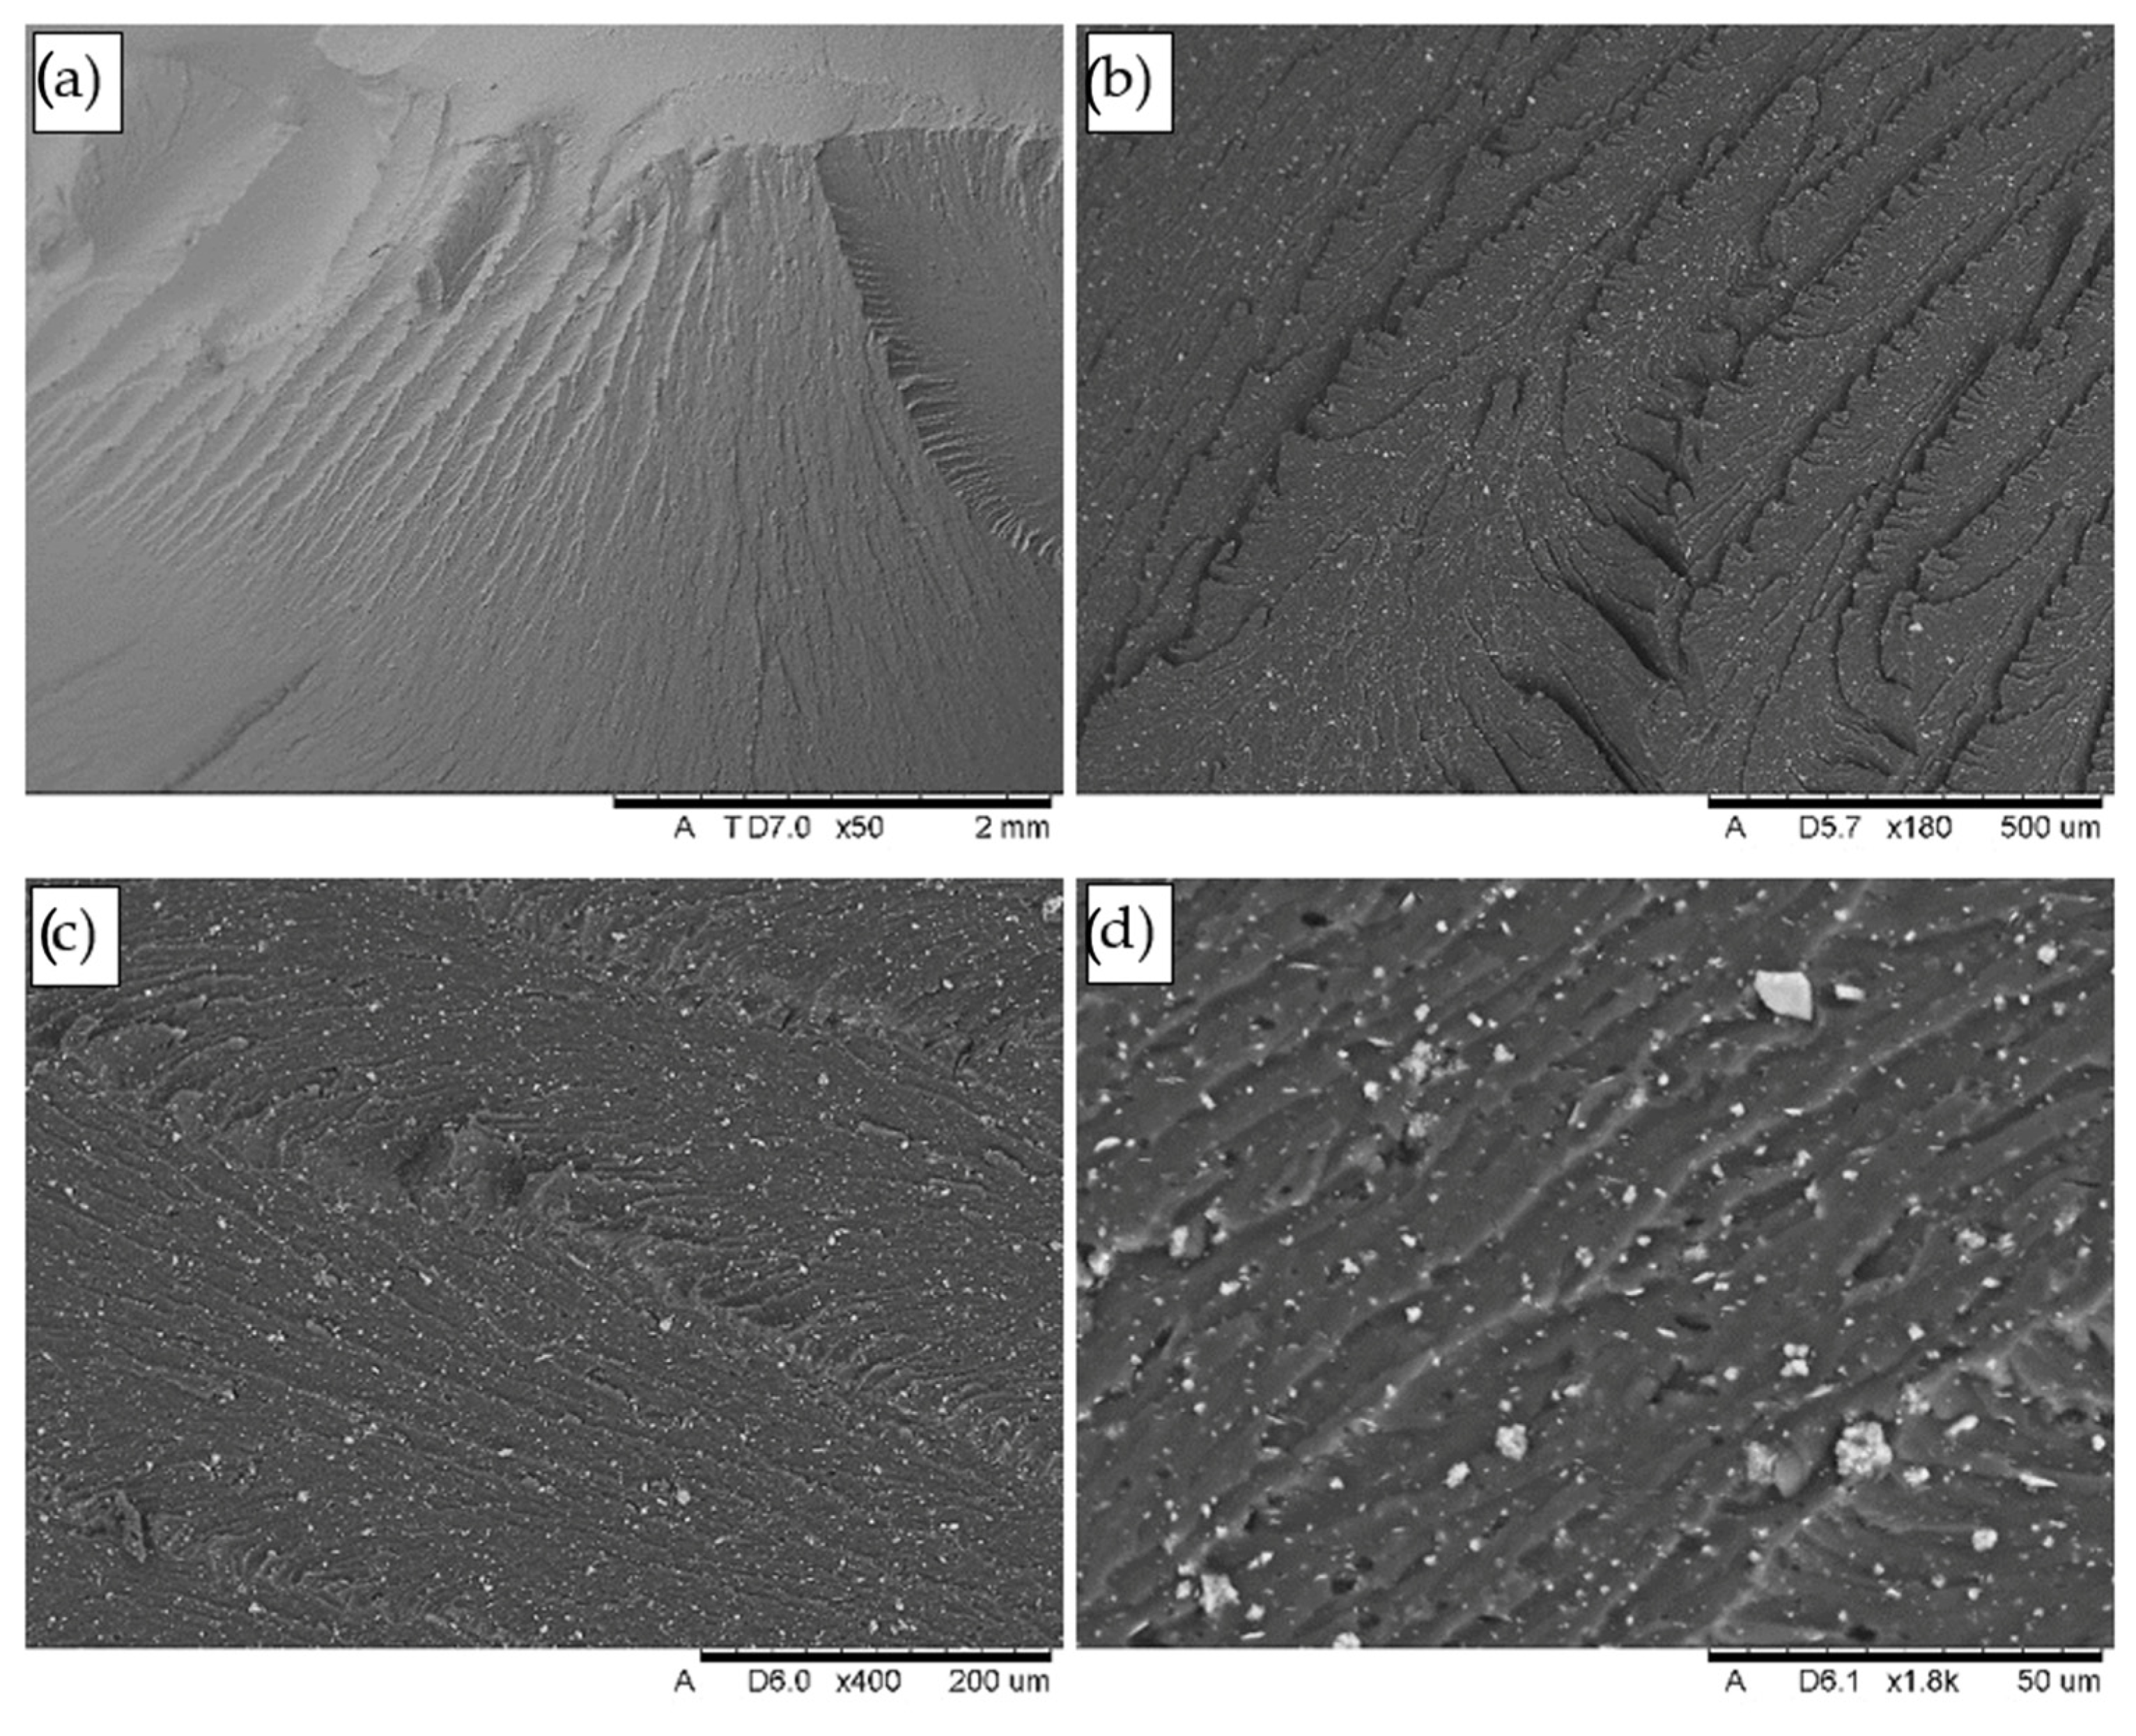
In the Graphy TC-80DP material, extensive cracks and delaminations were observed, most often leading to the complete destruction of the material. The torn fragments of the sample, as revealed in the cross-sections of the prepared grinding sections, showed minimal permanent plastic deformation. The lateral surfaces of the delaminations exhibit bends (indicated with arrows).
The propagation of cracks also occurs in a manner characteristic of brittle materials, exhibiting step-like propagation (
Figure 23a,c,d). As shown in
Figure 23d, extensive delaminations often form as the crack front splits into two directions. The initiation of this process is shown at a magnification of 7000× in the inset in
Figure 23d.
5.2. Fracture Surface Studies
Below, in
Figure 24, a general view of the exemplary fracture surfaces is presented, along with the surfaces coated with graphite prepared for the SEM analysis. The samples of the NextDent Denture 3D and NextDent C&B MFH Bleach materials were obtained by mechanical tearing along the delaminations formed in the samples (
Figure 22a), which followed the direction of the applied loads. The Graphy TC-80DP material samples fractured and fragmented during testing—views of the sample fragments after testing are shown in
Figure 24c. The analyses were primarily focused on the areas where the highest number of defects were observed during surface grinding studies. This area is marked with the letter A in the figure.
The results of the SEM observations in the form of topography and microstructure images of the fractures are presented in
Figure 25,
Figure 26,
Figure 27. The analysis revealed that both on the surfaces of the NextDent Denture 3D and NextDent MFH Bleach samples (
Figure 25a,b and
Figure 26a,b), arrangements of high faults are visible in the surface topography, located in the area marked with the letter A. In the remaining part of the fractures (central area), low faults are visible on the flat fracture surface. Beneath the high faults, numerous tears and delaminations of the materials are observed, running along the fatigue bands formed in this area (
Figure 25c and
Figure 26c), accompanied by microcracks causing delamination.
On the fracture surfaces, the observations confirm the presence of filler particles typically associated with the matrix material, but a few particles are also visible resting freely on the surface (
Figure 25d and
Figure 26d). Observations revealed that in the NextDent Denture 3D material, additional transverse microcracks formed perpendicular to the direction of the fatigue bands (
Figure 25d), a phenomenon not observed in the NexDent MFH Bleach material.
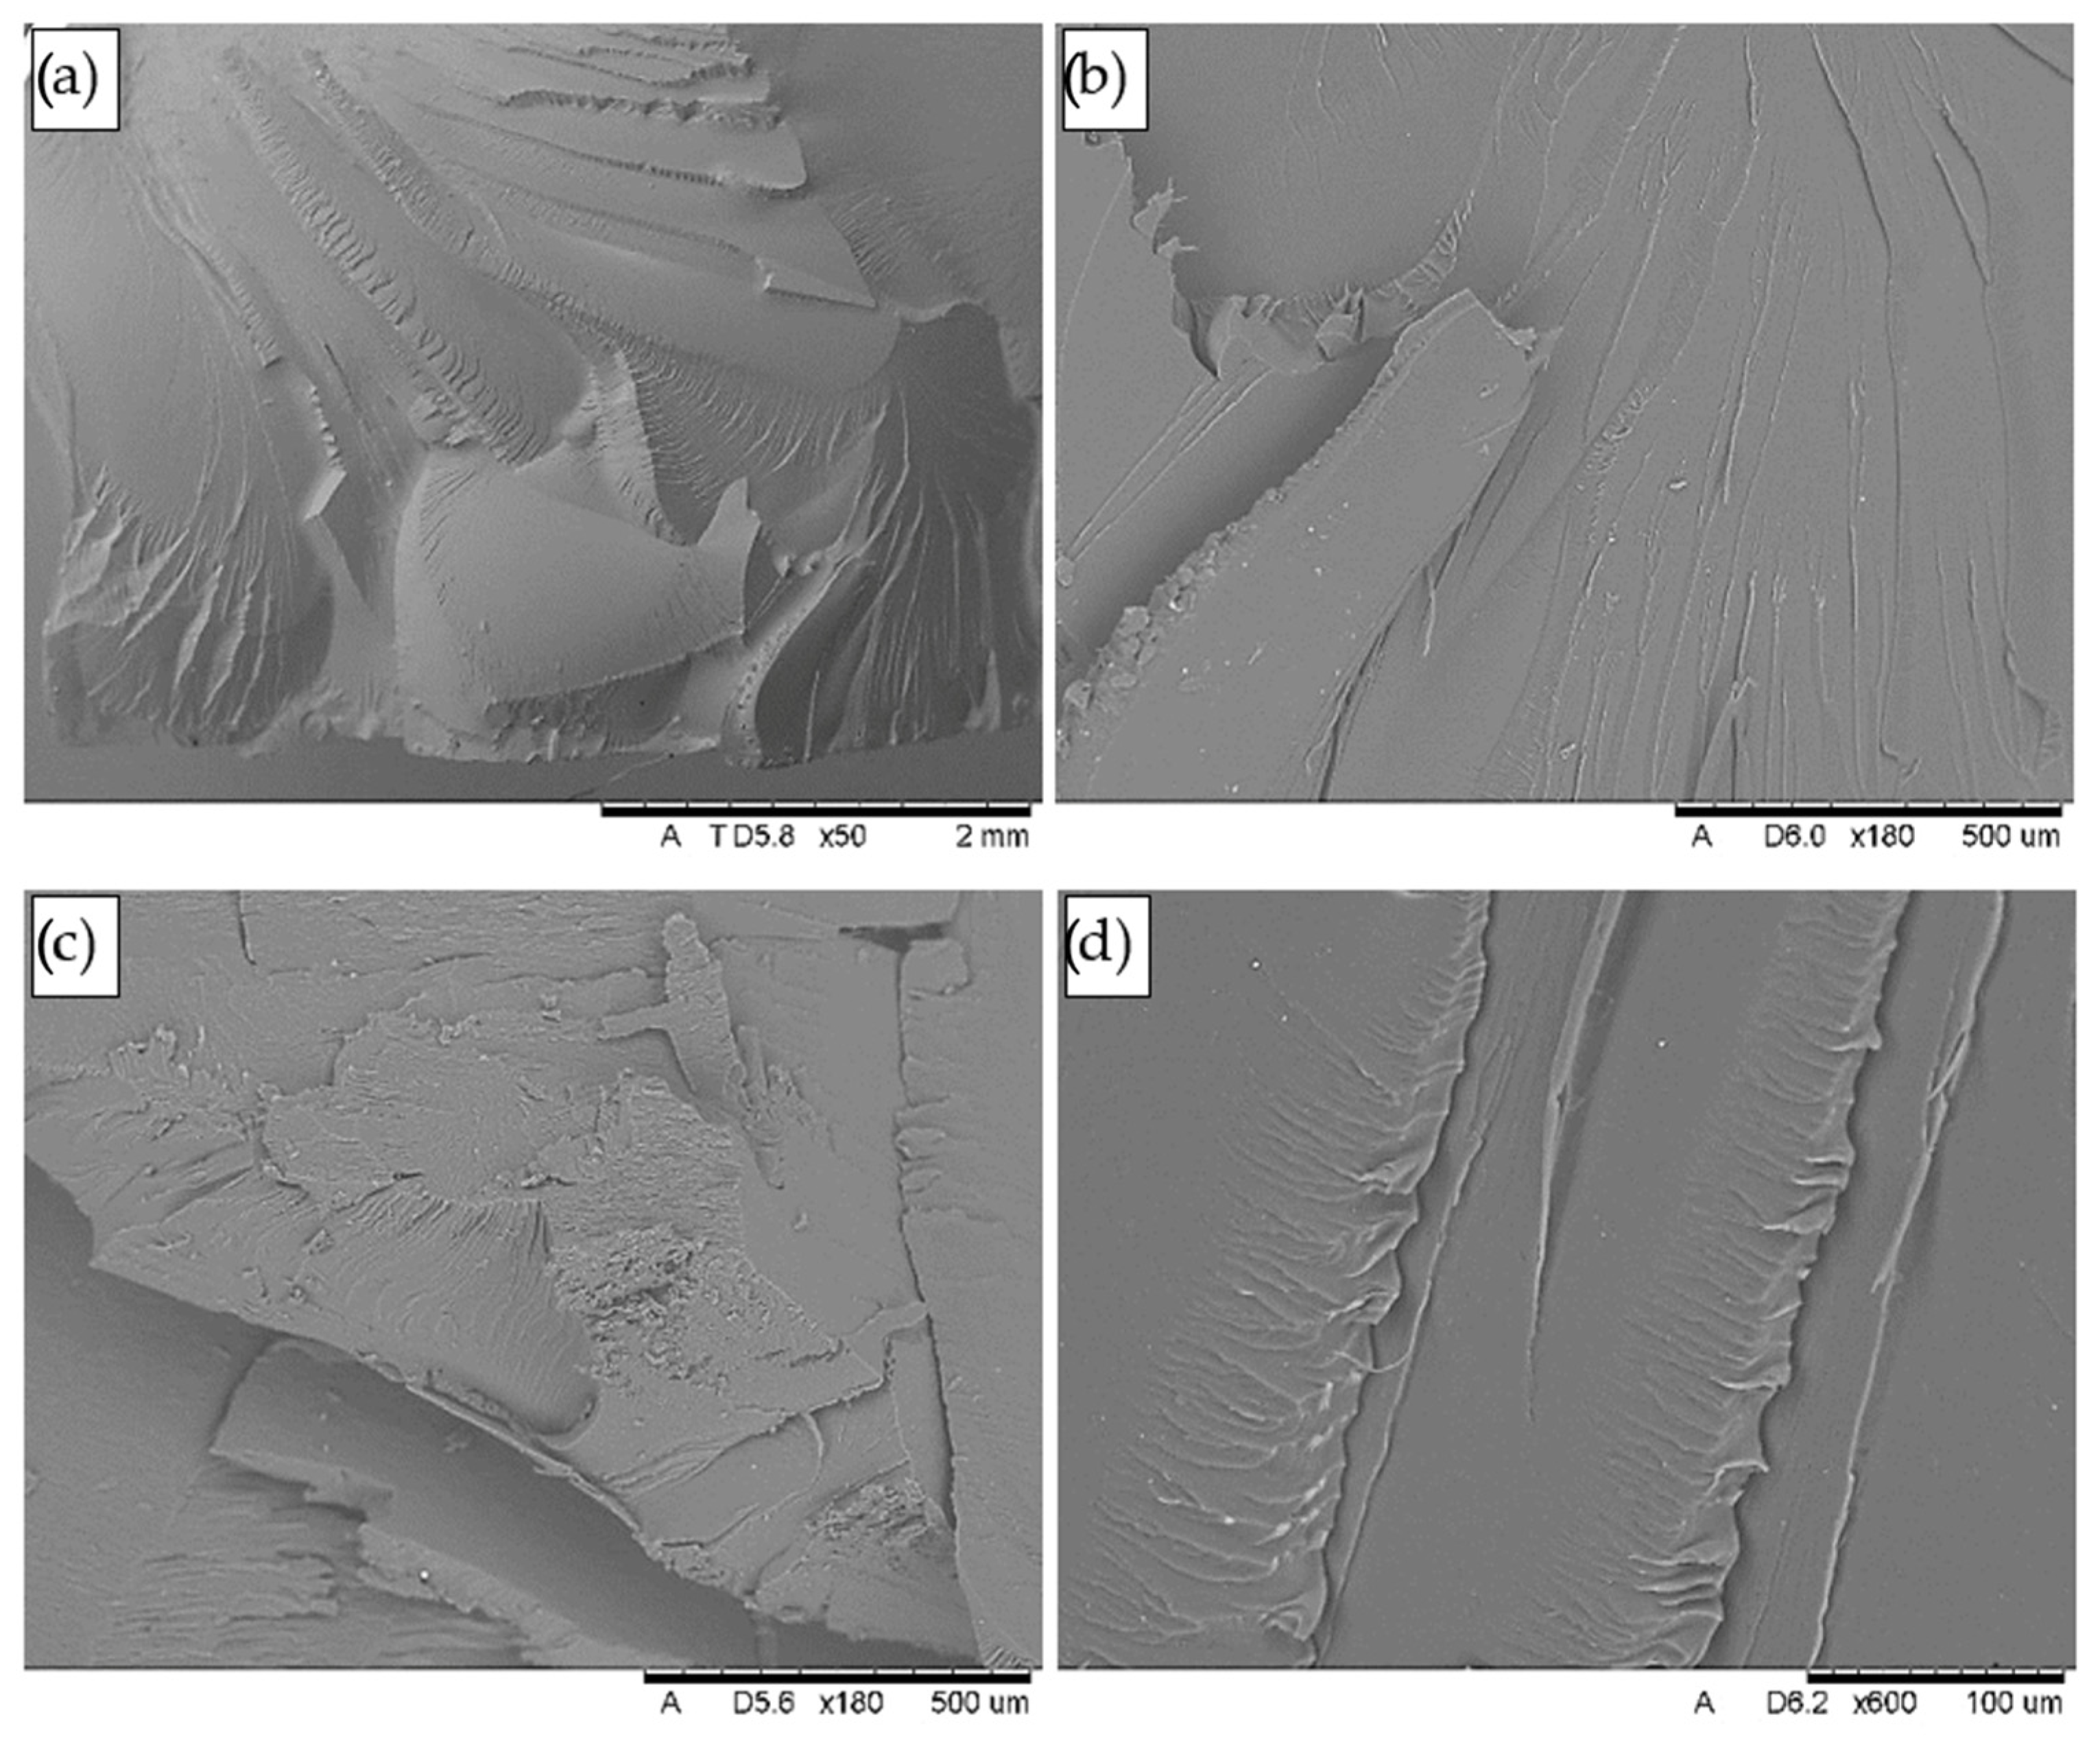
In turn, the fracture surfaces of the Graphy TC-80DP material exhibited the most complex surface topography in terms of the presence of high faults.
The formed faults created a network of elevations and depressions with varying orientations and angles of inclination of their walls. In such a surface topography arrangement, it was challenging to identify the fracture origin or determine fatigue bands. The fault pattern in the area marked as Area A in
Figure 24 is illustrated at different magnifications in
Figure 27.
6. Discussion and Conclusions
The study was conducted to comprehensively evaluate the properties of three photopolymer 3D printing materials used as temporary dental implant restorations: NextDent Denture 3D, NextDent C&B MFH Bleach, and Graphy TC-80DP. The goal was to find out which of these materials exhibit the best mechanical and thermal properties relevant to their clinical application. Temporary prosthetic restorations perform a key function in implant treatment, allowing patient functionality and aesthetics during the period of implant osteointegration.
Dimensional stability and thermal expansion studies have shown that all the materials studied have a low coefficient of thermal expansion, making them stable under varying temperature conditions, such as those found in the oral cavity. The results of dilatometric analysis indicate that the materials maintain high dimensional stability, returning to their original dimensions after cyclic heating and cooling. This is particularly important in the context of their daily use, where the materials are exposed to a variety of temperature changes due to eating, drinking, or oral hygiene.
The Graphy TC-80DP material showed the least dimensional changes over the temperature range tested, indicating its greater stability compared to the other materials. NextDent Dent 3D, on the other hand, showed a greater tendency toward thermal expansion, which may limit its use in more demanding conditions, such as implant prosthetics for patients prone to mechanical and thermal stresses.
The fatigue tests conducted under cyclic loading conditions simulating chewing forces revealed significant differences between the tested materials. Graphy TC-80DP showed the best fatigue properties, withstanding the highest number of cycles before failure at a fixed load amplitude. The slope of its fatigue curve was the smallest among the materials tested, meaning that load fluctuations have less impact on the lifespan of this material compared to the others. This makes Graphy TC-80DP the most suitable material for clinical applications requiring higher mechanical load resistance.
NextDent C&B MFH Bleach showed average results, suggesting that the material can be used in less demanding clinical settings, such as short-term temporary restorations. NextDent Denture 3D showed the lowest fatigue resistance, indicating its limited use in situations subject to prolonged or intense cyclic loading.
The results obtained in this study can be compared with the existing research on the fatigue resistance of conventional dental materials such as polymethyl methacrylate (PMMA) and acrylics. Available studies on the fatigue testing of dental materials used for temporary restorations show that PMMA-based dental resins exhibit significantly lower fatigue resistance compared to alternative fibre-reinforced or nano-filler materials [
33,
34,
35]. Similar conclusions were drawn by Vallittu et al., who found that conventional PMMA restorations tend to develop microcracks under cyclic loading, leading to progressive structural degradation [
36]. Compared to these findings, the 3D-printed materials tested in this study, particularly Graphy TC-80DP, showed superior fatigue performance, withstanding a significantly higher number of cycles before failure. This suggests that modern 3D-printed resins may offer a more durable alternative to traditional PMMA-based restorations, particularly in clinical cases where high fatigue resistance is required.
Based on the analysis of the experimental results, we can distinguish several key aspects regarding the damage mechanism. In the case of the NextDent Denture 3D material, the observed microcracks and gradual deformation indicate the dominance of the plastic deformation mechanism and gradual weakening of the structure, leading to deformation in the form of a ‘barrel-shaped’ specimen. In the NextDent C&B MFH Bleachdominant failure mechanism was delamination at the interface between the polymer matrix and filler particles, resulting from weakened interfacial bonds. In this case, cracks propagated mainly along the particle–matrix boundaries, resulting in a greater susceptibility to cracking and delamination of the material.
The most complex failure mechanism was observed in the case of Graphy TC-80DP, where brittle-plastic cracking dominated, as confirmed by the SEM analysis. Although this material showed the best long-term fatigue resistance, under extreme cyclic loading, there was a gradual propagation of microcracks that merged into larger cracks, leading to the complete failure of the specimen. The structure of the fractures showed ductile fracture characteristics, suggesting that the material could operate under varying loads for an extended period of time before reaching a critical point leading to its destruction.
These observations align with previous research on conventional PMMA materials, which showed that microcracks in PMMA tend to propagate more rapidly due to their inherent brittleness. In contrast, fibre-reinforced PMMA composites demonstrated better crack resistance, as reported by the team from the University of Iowa [
37]. This suggests that improvements in the internal structure of dental materials, such as optimized polymer matrices and filler integration, could further enhance the fatigue resistance of 3D-printed resins.
The SEM microscopic observations revealed significant differences in the internal structure of the tested materials, which directly affect their behaviour under load. Graphy TC-80DP is characterized by a homogeneous structure with no visible fillers, which explains its higher mechanical resistance. The NextDent Denture 3D and NextDent C&B MFH Bleach materials showed the presence of filler particles, which affected crack propagation in different ways. In the case of NextDent C&B MFH Bleach, the cracks propagated mainly along the matrix and particle boundaries, indicating a weak adhesive bond between the material components. In contrast, in the case of NextDent Denture 3D, the cracks propagated through the filler particles, indicating a more complex internal structure, but at the same time possibly leading to greater material brittleness.
From the conducted research, the main conclusions worth pointing out were made as follows:
- -
All the tested materials exhibit low thermal expansion and high dimensional stability under cyclic heating and cooling conditions.
- -
The Graphy TC-80DP material shows the best mechanical and fatigue properties among those tested, making it the most suitable for clinical applications requiring high cyclic load resistance.
- -
The NextDent Denture 3D material shows the lowest fatigue resistance, which limits its use in more demanding clinical cases. It is recommended for use in situations with lower mechanical loads.
- -
The SEM results indicate that the internal structure of the materials and the way the filler particles are bonded to the matrix have a key impact on their mechanical properties. Material homogeneity and strong bonds between the filler and polymer matrix increase the strength and durability of restorations. An uneven structure or weak bonds can lead to defects and lower material quality.
Compared to conventional PMMA and acrylic materials, the results suggest that 3D-printed resins offer superior fatigue performance and resistance to crack propagation. However, further studies are needed to fully compare their long-term clinical performance under actual oral conditions. Incorporating fibre reinforcement or modifying polymer compositions could further enhance their mechanical stability, as suggested by previous studies on reinforced PMMA composites.
The results of the study are clinically relevant and provide valuable guidance for clinicians in selecting the appropriate material for temporary restorations. The findings indicate that the choice of material should consider both mechanical stability and resistance to temperature changes. Graphy TC-80DP is recommended for more demanding cases, particularly in areas subjected to high masticatory loads or for patients awaiting long-term prosthetic solutions. NextDent C&B MFH Bleach is suitable for standard cases where a balance between cost and durability is crucial. NextDent Denture 3D, due to its greater flexibility, may be best suited for short-term restorations, especially in situations requiring a better fit to soft tissue structures, where mechanical loads are less significant.
It should be emphasised that the present study was a pilot study and included a limited number of samples, which may affect the statistical interpretation of the results. In addition, the tests were carried out under laboratory conditions, which do not take into account the actual conditions of use of the prosthesis, such as the action of saliva, pH fluctuations, or prolonged dynamic loading. Further research should focus on the analysis of material ageing and its resistance to chemical degradation. It will be especially important to determine how factors such as changes in pH, contact with saliva, or prolonged loading cycles affect the fatigue resistance of materials and their durability under actual conditions of use.


 ,
, 


