

Investigation of Airborne Particulate Matter from a Holiday Celebration in Central Oklahoma Using an Unmanned Aerial Vehicle (UAV)

 , ,
, ,
Abstract
1. Introduction
2. Materials and Methods
3. Results and Discussion
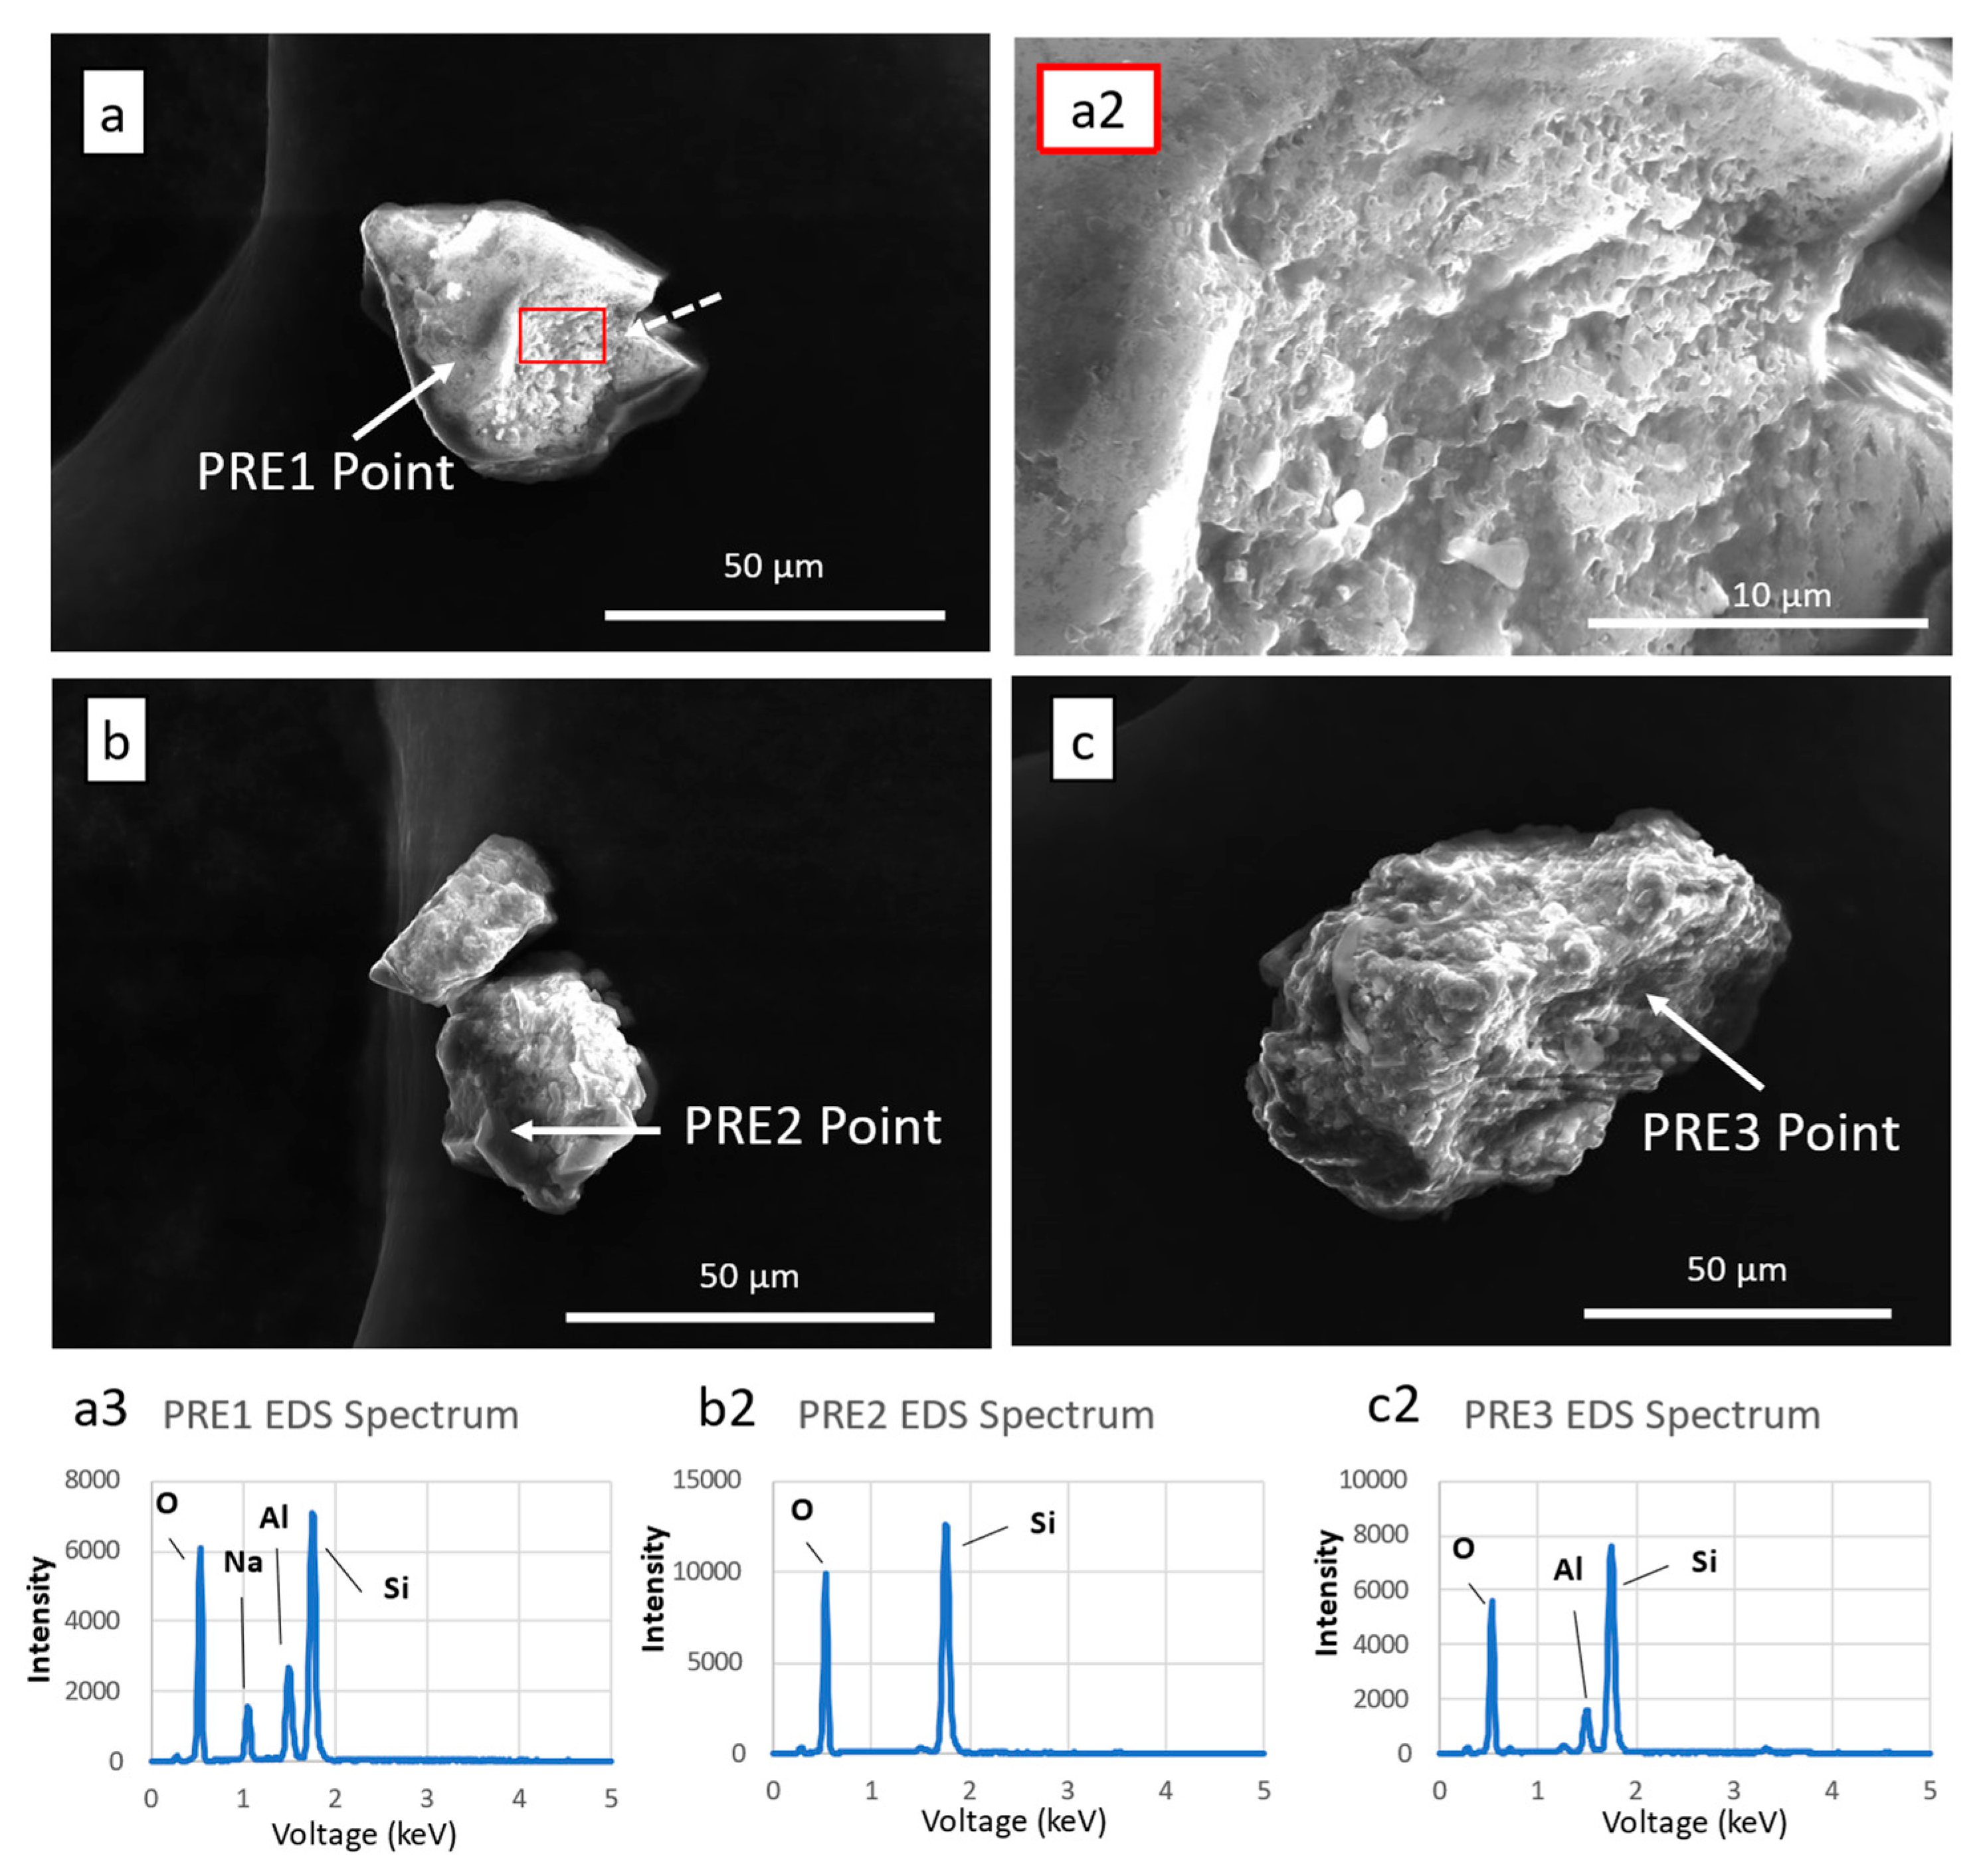
3.1. Control Sampling
3.2. Particulate Sizing
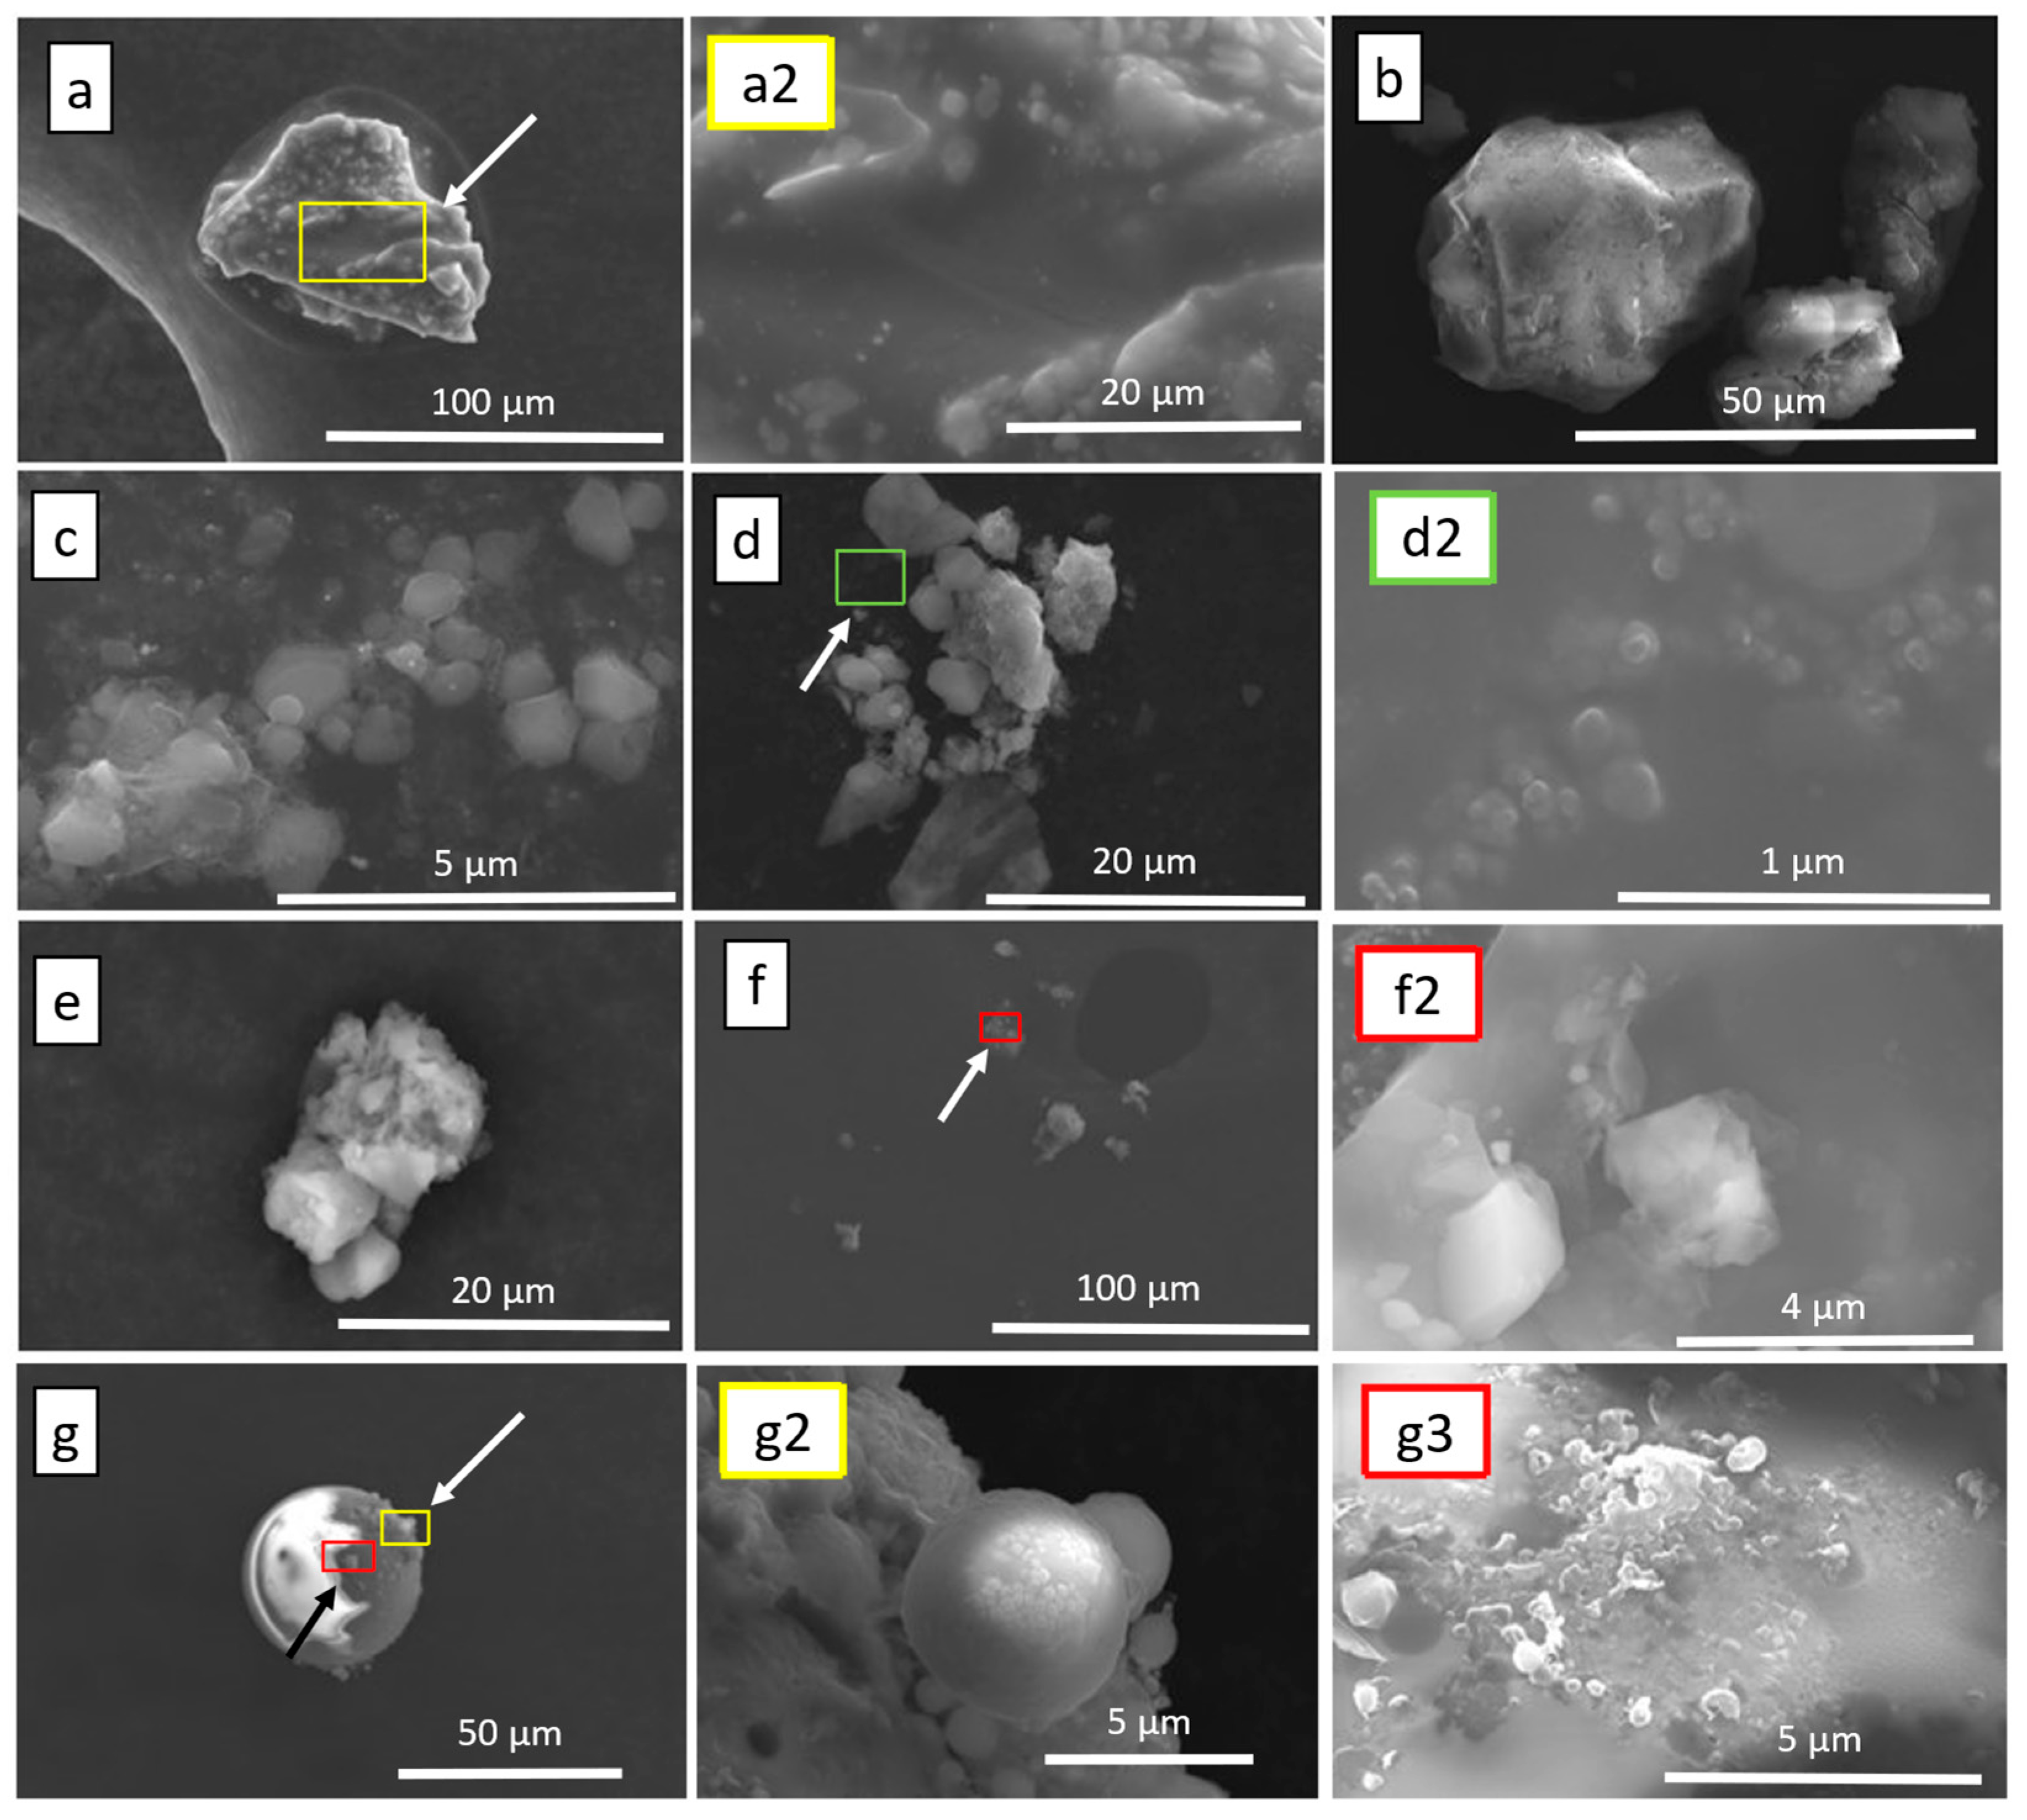
3.2.1. Low-Altitude Samples
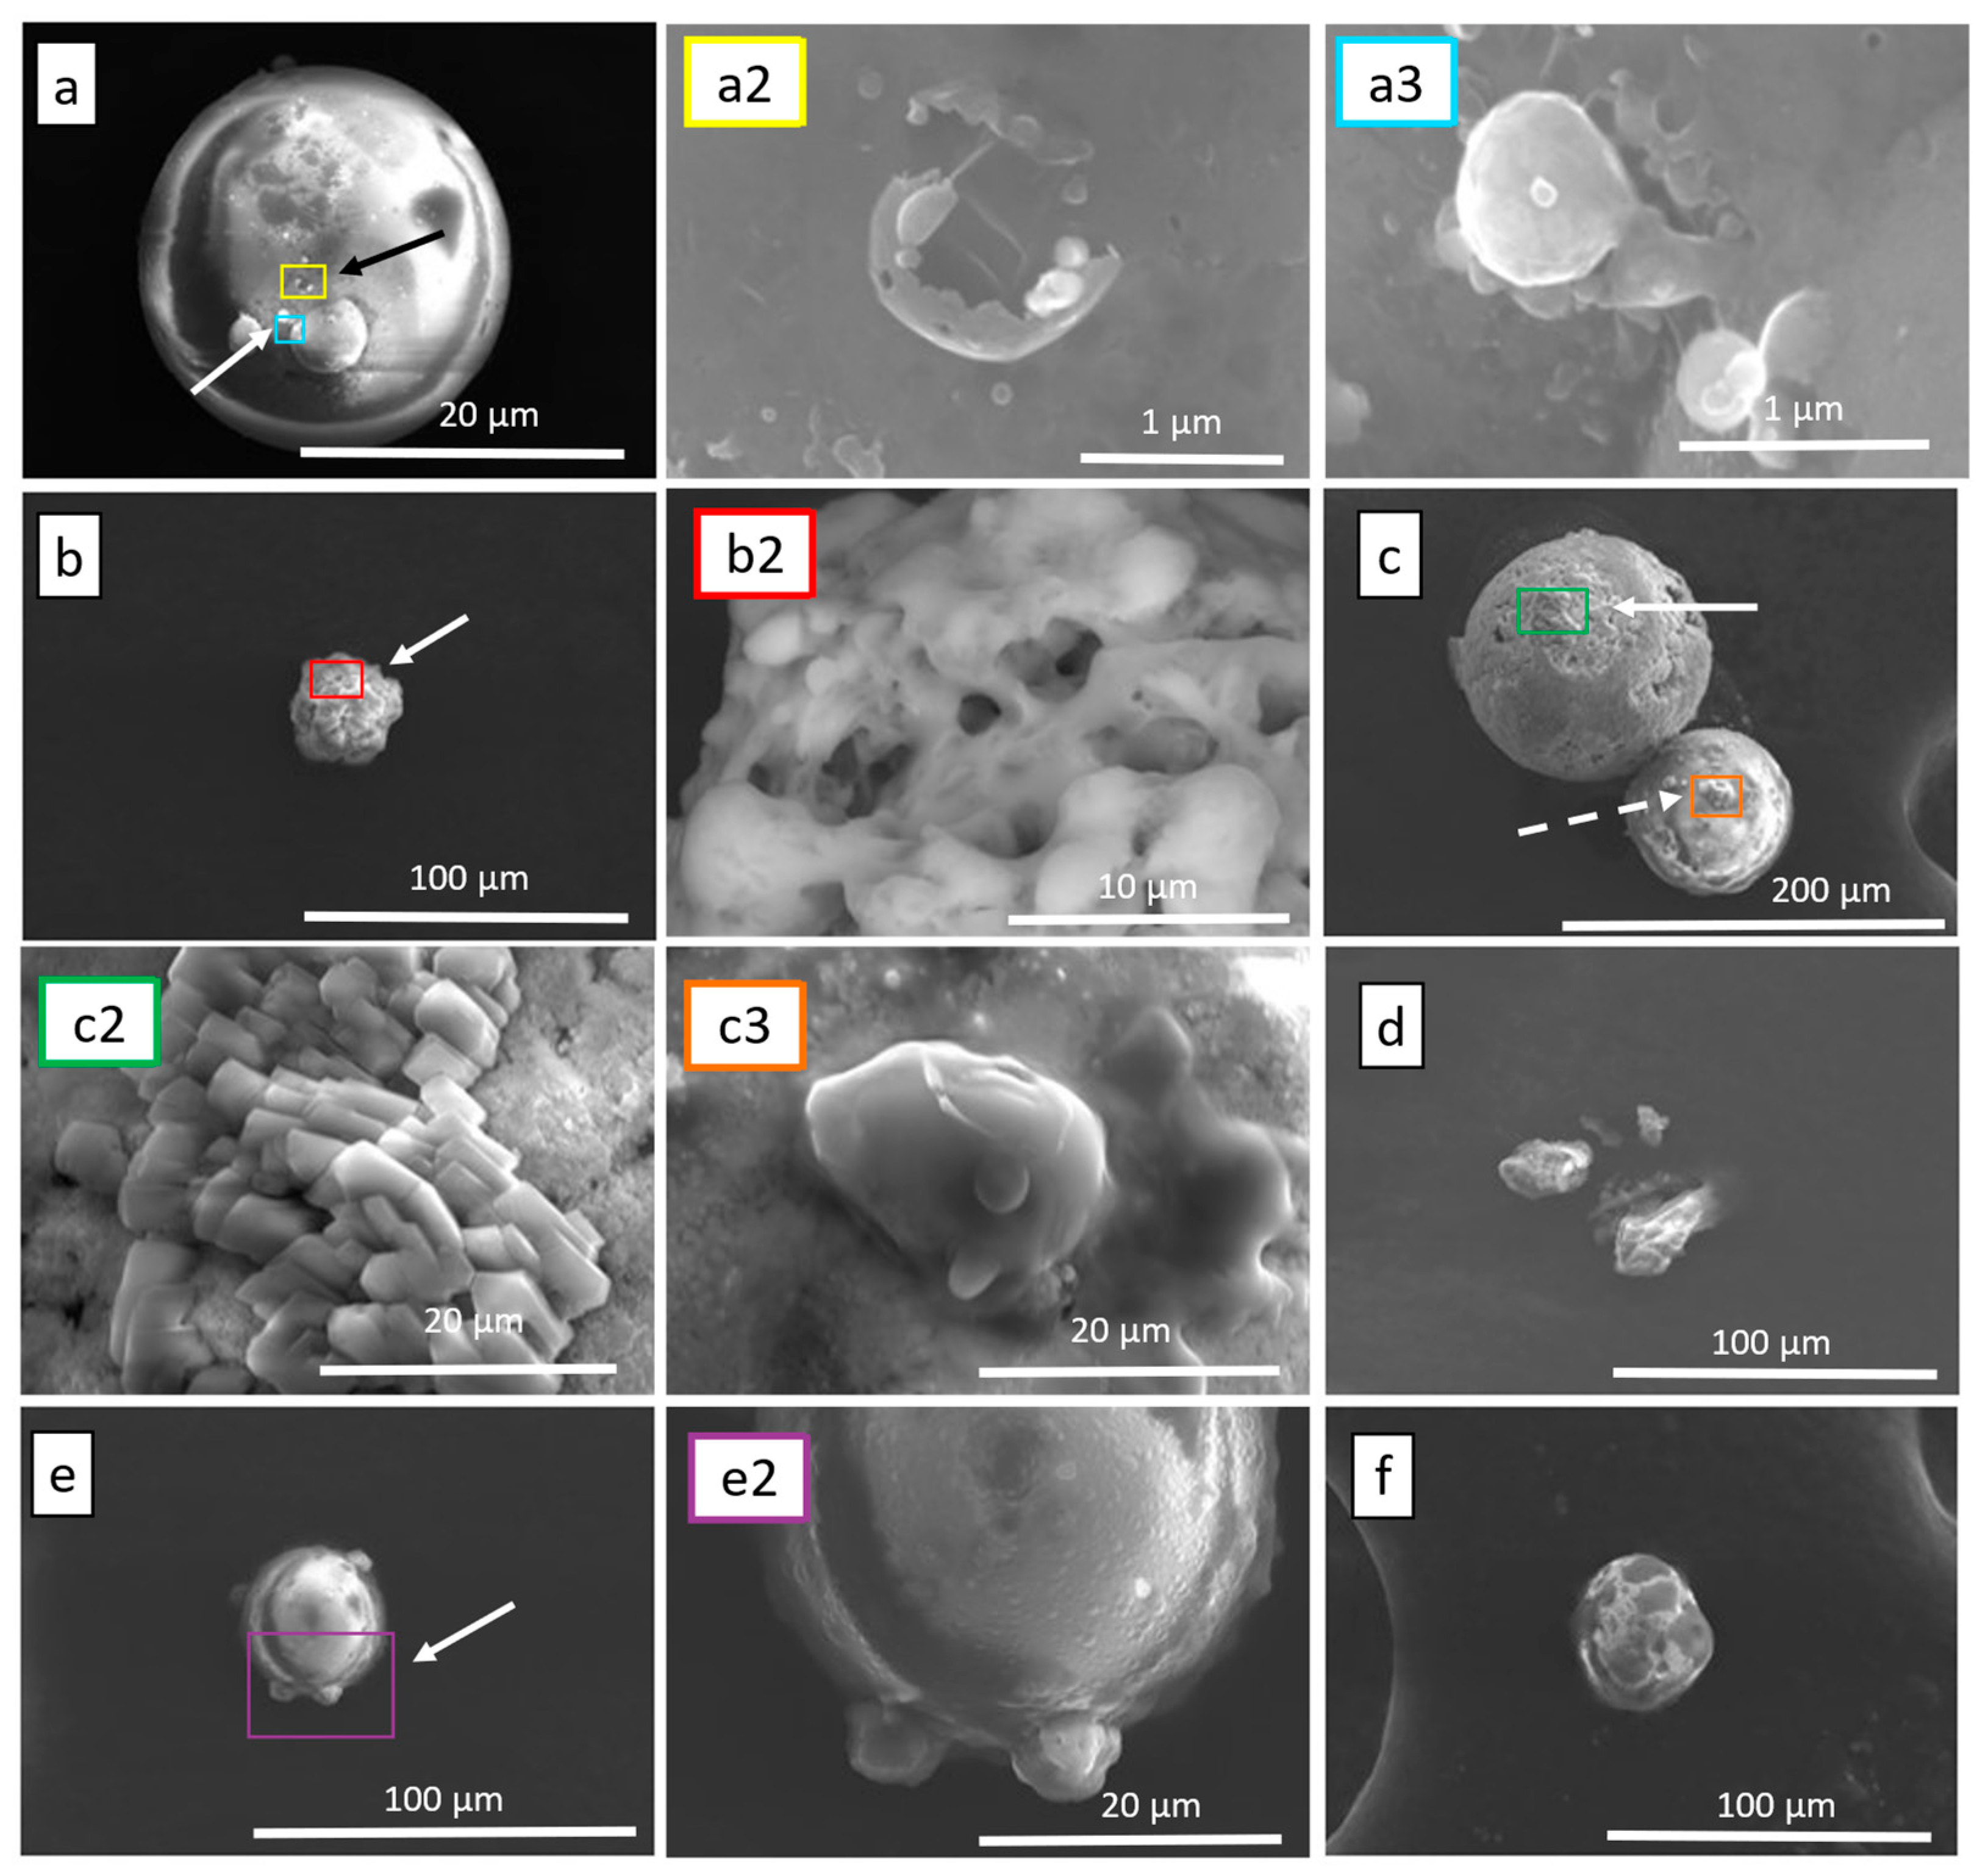
3.2.2. High-Altitude Samples
3.3. Elemental Analysis
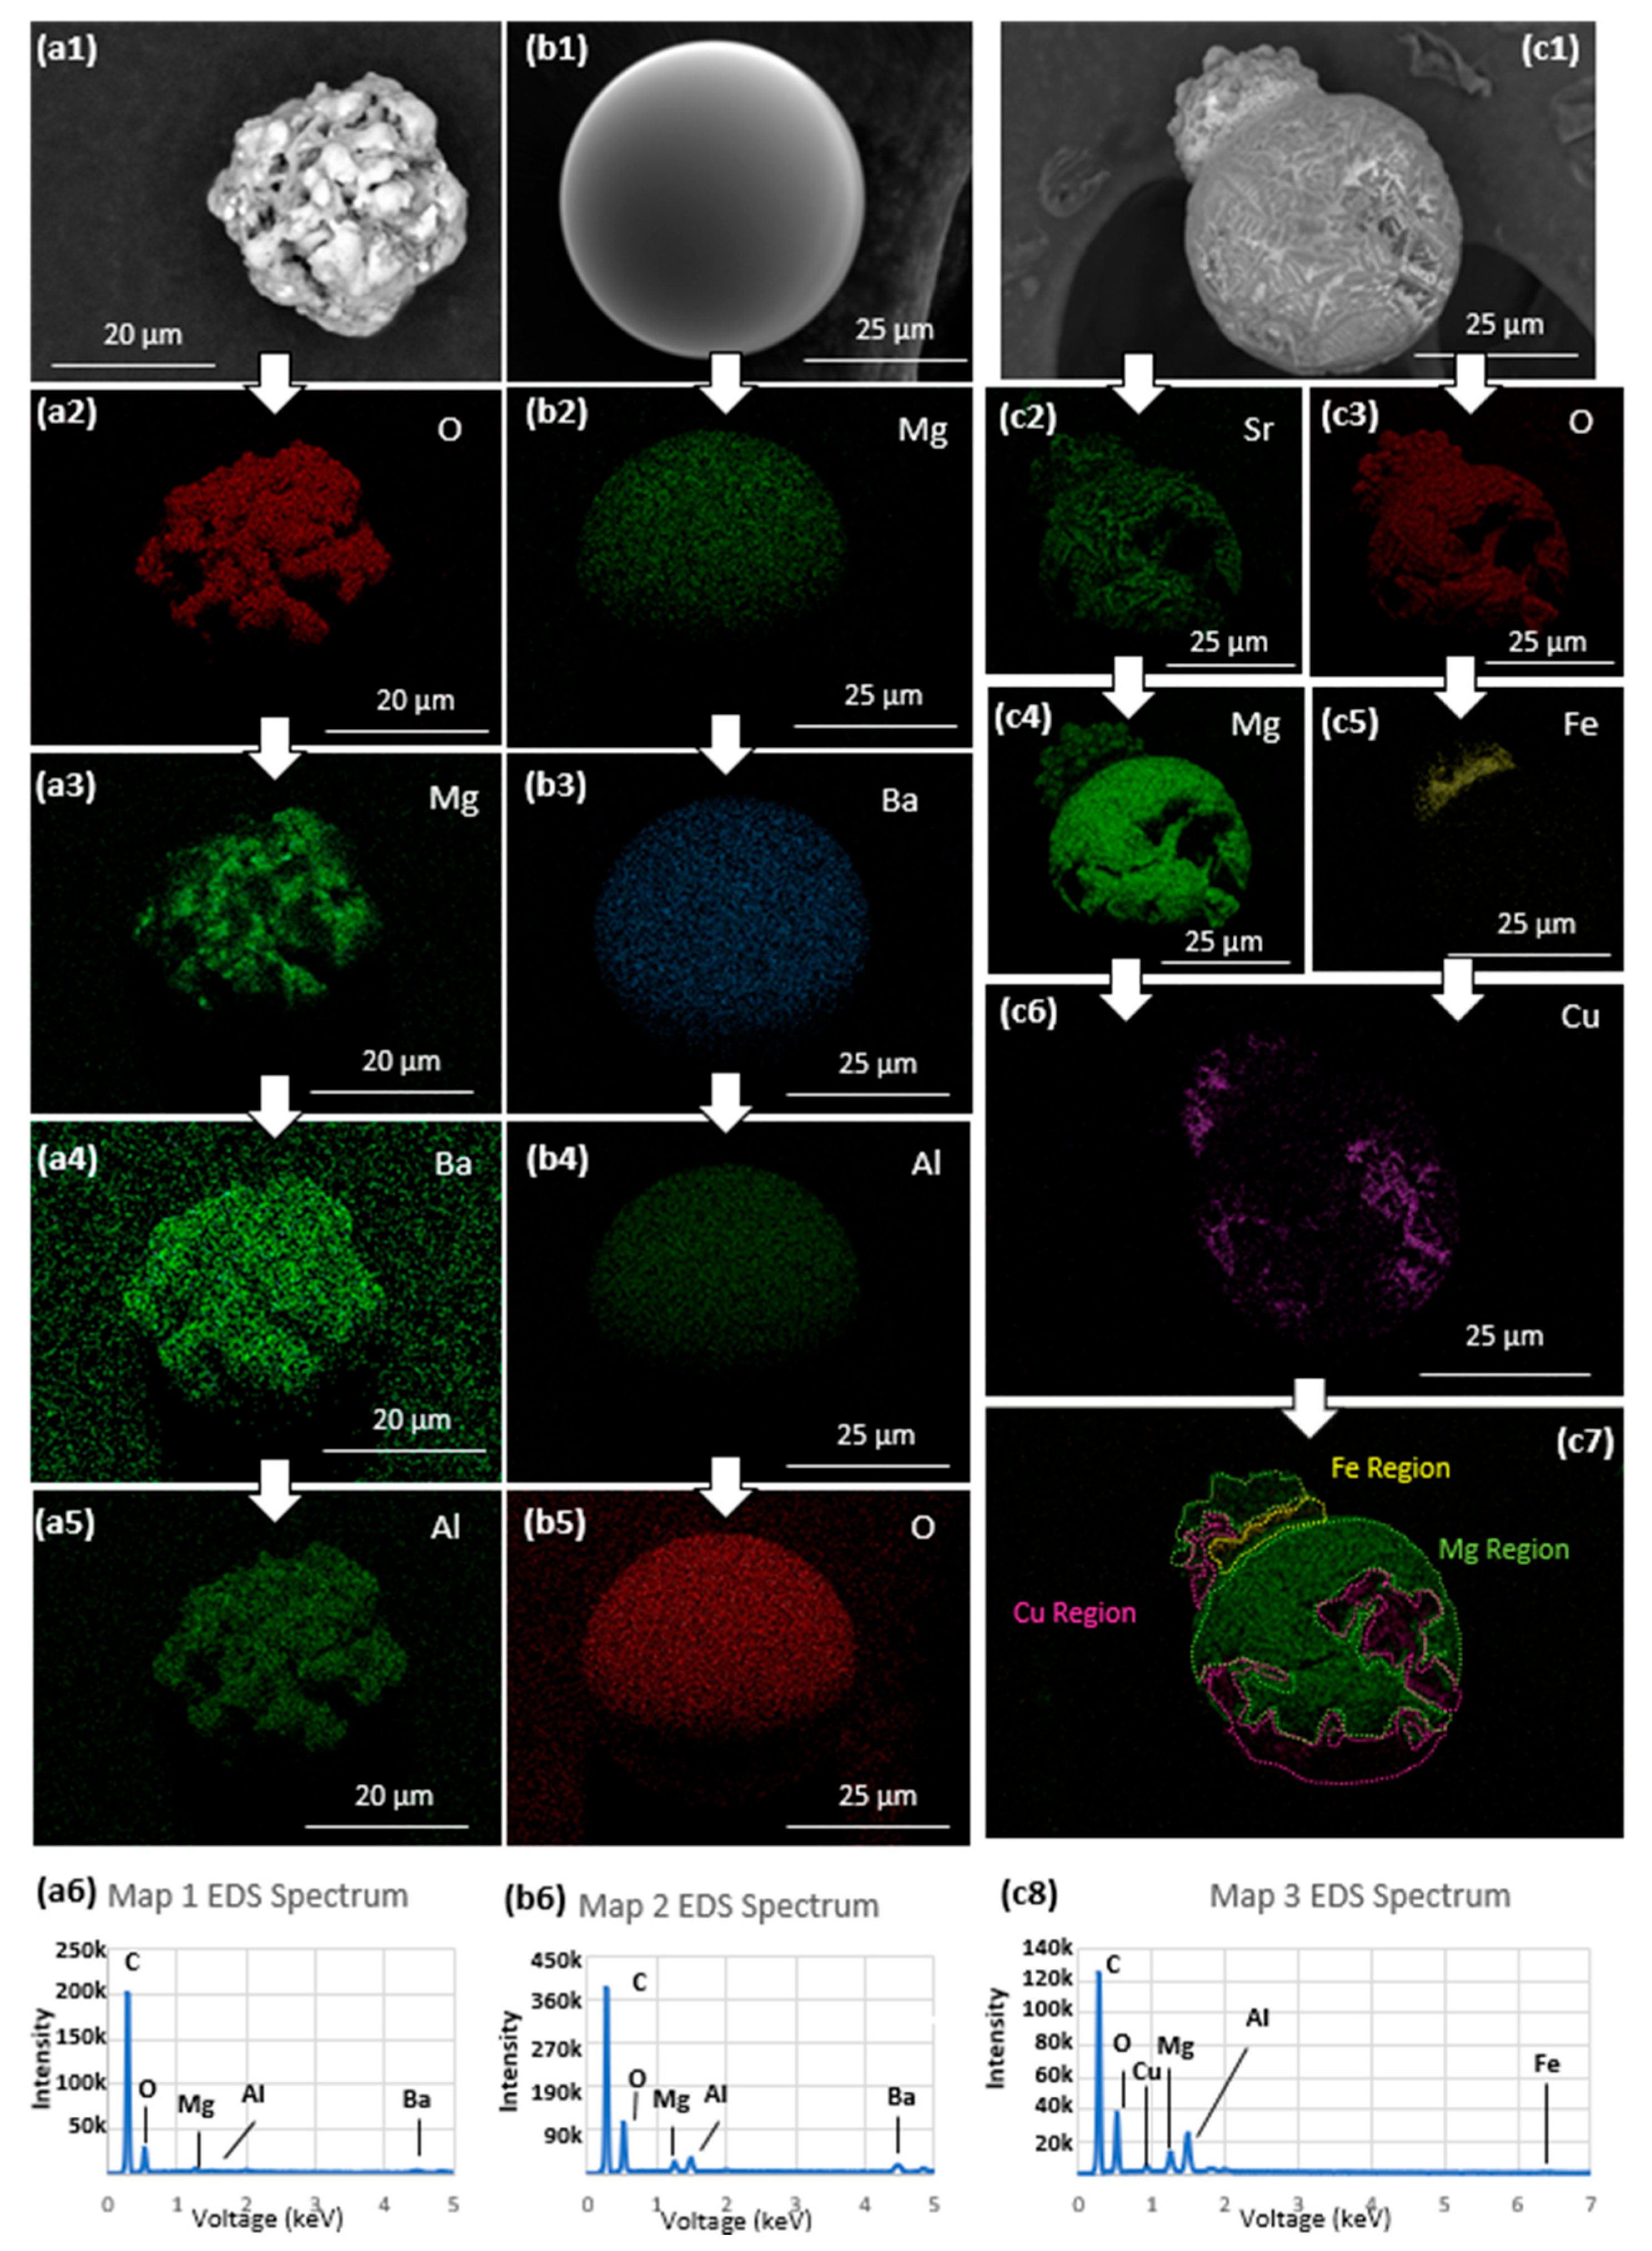
3.3.1. High-Altitude Samples
3.3.2. Low-Altitude Samples
3.4. Proposed Growth Mechanism
4. Conclusions
Supplementary Materials
Author Contributions
Funding
Institutional Review Board Statement
Informed Consent Statement
Data Availability Statement
Acknowledgments
Conflicts of Interest
Nomenclature
| UAV | Unmanned Aerial Vehicle |
| SEM | Scanning Electron Microscopy |
| EDX/EDS | Energy Dispersive X-Ray Spectroscopy |
| TEM | Transmission Electron Microscopy |
| LAS | Low-Altitude Sample |
| HAS | High-Altitude Sample |
| PM | Particulate Matter |
| VOCs | Volatile Organic Compounds |
| XRF | X-Ray Fluorescence Spectroscopy |
| FTIR | Fourier Transform Infrared Spectroscopy |
References
- Tiwari, S.; Chate, D.; Srivastava, M.; Safai, P.; Srivastava, A.; Bisht, D.; Padmanabhamurty, B. Statistical evaluation of PM 10 and distribution of PM 1, PM 2.5, and PM 10 in ambient air due to extreme fireworks episodes (Diwali festivals) in megacity Delhi. Nat. Hazards 2012, 61, 521–531. [Google Scholar] [CrossRef]
- Nasir, U.P.; Brahmaiah, D. Impact of fireworks on ambient air quality: A case study. Int. J. Environ. Sci. Technol. 2015, 12, 1379–1386. [Google Scholar] [CrossRef]
- Zhang, J.; Yang, L.; Chen, J.; Mellouki, A.; Jiang, P.; Gao, Y.; Li, Y.; Yang, Y.; Wang, W. Influence of fireworks displays on the chemical characteristics of PM2.5 in rural and suburban areas in Central and East China. Sci. Total Environ. 2017, 578, 476–484. [Google Scholar] [CrossRef] [PubMed]
- Lin, C.-C.; Huang, K.-L.; Chen, H.-L.; Tsai, J.-H.; Chiu, Y.-P.; Lee, J.-T.; Chen, S.-J. Influences of Beehive Firework Displays on Ambient Fine Particles during the Lantern Festival in the YanShuei Area of Southern Taiwan. Aerosol Air Qual. Res. 2014, 14, 1998–2009. [Google Scholar] [CrossRef]
- Godri, K.; Green, D.; Fuller, G.; Dall’Osto, M.; Beddows, D.; Kelly, F.; Harrison, R.; Mudway, I. Particulate oxidative burden associated with Firework activity. Environ. Sci. Technol. 2010, 44, 8295–8301. [Google Scholar] [CrossRef]
- Hamad, S.; Green, D.; Heo, J. Evaluation of health risk associated with fireworks activity at Central London. Air Qual. Atmos. Health 2016, 9, 735–741. [Google Scholar] [CrossRef]
- Plimpton, G. Fireworks; Doubleday & Co.: New York, NY, USA, 1984; p. 286. [Google Scholar]
- Tanda, S.; Ličbinský, R.; Hegrová, J.; Goessler, W. Impact of New Year’s Eve fireworks on the size resolved element distributions in airborne particles. Environ. Int. 2019, 128, 371–378. [Google Scholar] [CrossRef]
- Retama, A.; Neria-Hernandez, A.; Jaimes-Palomera, M.; Rivera-Hernandez, O.; Sanchez-Rodriguez, M.; Lopez-Medina, A.; Velasco, E. Fireworks: A major source of inorganic and organic aerosols during Christmas and New Year in Mexico City. Atmos. Environ. X 2019, 2, 100013. [Google Scholar] [CrossRef]
- Seidel, D.; Birnbaum, A. Effects of Independence Day fireworks on atmospheric concentrations of fine particulate matter in the United States. Atmos. Environ. 2015, 115, 192–198. [Google Scholar] [CrossRef]
- Hoyos, C.; Herrera-Mejia, L.; Roldan-Henao, N.; Isaza, A. Effects of fireworks on particulate matter concentration in a narrow valley: The case of the Medell´ın metropolitan area. Environ. Monit. Assess. 2020, 192, 6. [Google Scholar] [CrossRef]
- Berger, B. Parameters Influencing the Pyrotechnic Reaction. Propellants Explos. Pyrotech. 2005, 30, 27–35. [Google Scholar] [CrossRef]
- Chhabra, A.; Turakhia, T.; Sharma, S.; Saha, S.; Iyer, R.; Chauhan, P. Environmental impacts of fireworks on aerosol characteristics and radiative properties over a mega city, India. City Environ. Interact. 2020, 7, 100049. [Google Scholar] [CrossRef]
- Ambade, B. The air pollution during Diwali festival by the burning of fireworks in Jamshedpur city, India. Urban Clim. 2018, 26, 149–160. [Google Scholar] [CrossRef]
- Kong, S.; Li, X.; Li, L.; Yin, Y.; Chen, K.; Yuan, L.; Zhang, Y.; Shan, Y.; Ji, Y. Variation of polycyclic aromatic hydrocarbons in atmospheric PM2.5 during winter haze period around 2014 Chinese Spring Festival at Nanjing: Insights of source changes, air mass direction and firework particle injection. Sci. Total Environ. 2015, 520, 59–72. [Google Scholar] [CrossRef] [PubMed]
- Moreno, T.; Querol, X.; Alastuey, A.; Minguillon, M.-C.; Pey, J.; Rodriguez, S.; Miro, J.-V.; Felis, C.; Gibbons, W. Recreational atmospheric pollution episodes: Inhalable metalliferous particles from firework displays. Atmos. Environ. 2007, 41, 913–922. [Google Scholar] [CrossRef]
- Tsai, H.-H.; Chien, L.-H.; Yuan, C.-S.; Lin, Y.-C.; Jen, Y.-H.; Ie, I.-R. Influences of fireworks on chemical characteristics of atmospheric fine and coarse particles during Taiwan’s Lantern Festival. Atmos. Environ. 2012, 62, 256–264. [Google Scholar] [CrossRef]
- Feng, J.; Yua, H.; Su, X.; Liu, S.; Li, Y.; Pan, Y.; Sun, J.-H. Chemical composition and source apportionment of PM2.5 during Chinese Spring Festival at Xinxiang, a heavily polluted city in North China: Fireworks and health risks. Atmos. Res. 2016, 182, 176–188. [Google Scholar] [CrossRef]
- Singh, D.-P.; Gadi, R.; Mandal, T.-K.; Dixit, C.-K.; Singh, K.; Saud, T.; Singh, N.; Gupta, P. Study of temporal variation in ambient air quality during Diwali festival in India. Environ. Monit. Assess. 2010, 169, 1–13. [Google Scholar] [CrossRef]
- Li, W.; Shi, C.; Yan, L.; Dong, C.; Wang, W. Individual Metal-Bearing Particles in a Regional Haze Caused by Firecracker and Firework Emissions. Sci. Total Environ. 2013, 443, 464–469. [Google Scholar] [CrossRef]
- Yan, C.; Chen, H.; Xu, Q.; Zhou, Y.; Zhou, R.; Li, R.; Zheng, M.; Xie, M.; Jiang, B.; Zhang, Z.; et al. New insights into the influences of firework combustion on molecular composition and formation of sulfur- and halogen-containing organic compounds. Sci. Total Environ. 2024, 932, 172929. [Google Scholar] [CrossRef]
- Saha, U.; Talukdar, S.; Jana, S.; Maitra, A. Effects of Air Pollution on Meteorological Parameters During Diwali Festival Over an Indian Urban Metropolis. Sci. Total Environ. 2014, 98, 530–539. [Google Scholar]
- Parra, R.; Saud, C.; Espinoza, C. Simulating PM2.5. Concentrations duing New Year in Cuenca, Ecuador: Effects of Advancing the Time of Burning Activities. Toxics 2022, 10, 264. [Google Scholar] [CrossRef] [PubMed]
- Van Der Kamp, D.; McKendry, I.; Wong, M.; Stull, R. Lidar ceilometer observations and modeling of a fireworks plume in Vancouver, British Columbia. Atmos. Environ. 2008, 42, 7174–7178. [Google Scholar] [CrossRef]
- Kosanke, K.L.; Kosanke, B.J.; Dujay, R.C. Pyrotechnic Reaction Residue Particle Identification by SEM/EDS. J. Pyrotech. 2001, 13, 40–53. [Google Scholar]
- Castro, K.; de Vallejuelo, S.; Astondoa, I.; Gonic, F.; Madariaga, J.-M. Analysis of confiscated fireworks using Raman spectroscopy assisted with SEM-EDS and FTIR. J. Raman Spectrosc. 2011, 42, 2000–2005. [Google Scholar] [CrossRef]
- Grima, M.; Butler, M.; Hanson, R.; Mohameden, A. Firework displays as sources of particles similar to gunshot residue. Sci. Justice 2012, 52, 49–57. [Google Scholar] [CrossRef]
- Mishra, S.; Khosla, D.; Arora, M.; Sharma, C.; Prasad, M.; Aggarwal, S.; Gupta, B.; Radhakrishnan, S.; Guleria, R.; Kotnala, R. SEM-EDS and FTIR Characterization of Aerosols during Diwali and Post Diwali Festival over Delhi: Implications to Human Health. J. Environ. Nanotechnol 2016, 5, 12–26. [Google Scholar]
- Anwar, K.; Ejaz, S.; Ashraf, M.; Ahmad, N.; Javeed, A. Monitoring trace elements generated by automobiles: Air pollutants with possible health impacts. Environ. Sci. Pollut. Res. 2013, 20, 4574–4586. [Google Scholar] [CrossRef]
- Gu, J.; Cai, X.; Wang, Y.; Guo, D.; Zeng, W. Evaluating the Effect of Nano-SiO2 on Different Types of Soils: A Multi-Scale Study. Int. J. Environ. Sci. Technol. 2022, 19, 16805. [Google Scholar] [CrossRef]
- Argente-García, A.; Hakobyan, L.; Guillem, C.; Campíns-Falcó, P. Estimating Diphenylamine in Gunshot Residues from a New Tool for Identifying both Inorganic and Organic Residues in the Same Sample. Separations 2019, 6, 16. [Google Scholar] [CrossRef]
- Jaishankar, M.; Tseten, T.; Anbalagan, N.; Mathew, B.; Beeregowda, K. Toxicity, mechanism, and health effects of some heavy metals. Interdiscip. Toxicol. 2014, 7, 60–72. [Google Scholar] [CrossRef] [PubMed]
- Arumugachamy, A.; Russel, N.; Rajamanickam, A. A preliminary study of combustion flame by digital image processing and residue for fireworks flashpowder. ISA Trans. 2024, 153, 482–489. [Google Scholar] [CrossRef] [PubMed]
- Ineichen, H.; Berger, B. Pyrotechnics in Fireworks. CHIMIA 2004, 58, 369. [Google Scholar] [CrossRef]
- Geng, L.; Liu, Q.; Chen, J.; Jia, P.; Ye, H.; Yan, J.; Zhang, L.; Tang, Y.; Huang, J. In situ observation of electrochemical Ostwald ripening during sodium deposition. Nano Res. 2022, 15, 2650–2654. [Google Scholar] [CrossRef]
- Fedraza, F.; Podor, R. Influence of annealing conditions on the formation of hollow Al2O3 microspheres studied by in situ ESEM. Mater. Charact. 2016, 113, 198–206. [Google Scholar] [CrossRef]
- Sugimoto, T. Chapter 4-Recrystallization. In Monodispersed Particles, 2nd ed.; Elsevier B.V.: Amsterdam, The Netherlands, 2019; pp. 167–179. [Google Scholar]
- Lebel, L.; Brousseau, P.; Erhardt, L.; Andrews, W. Measurements of the Temperature Inside an Explosive Fireball. J. Appl. Mech. 2013, 80, 031702. [Google Scholar] [CrossRef]
- Moran-Zuloaga, D.; Merchan-Merchan, W.; Rodriguez-Caballero, E.; Mulas, M.; Hernick, P. Long-range transport and microscopy analysis of Sangay volcanic ashes in Ecuador. Air Qual. Atmos. Health 2023, 17, 155–175. [Google Scholar] [CrossRef]
- Oderji, H.; Farid, N.; Sun, L.; Fu, C.; Ding, H. Evaluation of explosive sublimation as the mechanism of nanosecond laser ablation of tungsten under vacuum conditions. Spectrochim. Acta Part B At. Spectrosc. 2016, 122, 1–8. [Google Scholar] [CrossRef]
- Martín-Alberca, C.; García-Ruiz, C. Analytical Techniques for the Analysis of Consumer Fireworks. TrAC 2014, 56, 27–36. [Google Scholar] [CrossRef]
- Gonzalez, A.; Boies, A.; Swanson, J.; Kittelson, D. Measuring the effect of fireworks on air quality in Minneapolis, Minnesota. SN Appl. Sci. 2022, 4, 142. [Google Scholar] [CrossRef]
- Saporito, A.; Gordon, T.; Kim, B.; Huynh, T.; Khan, R.; Raja, A.; Terez, K.; Camacho-Rivera, N.; Gordon, R.; Gardella, J.; et al. Skyrocketing pollution: Assessing the environmental fate of July 4th fireworks in New York City. J. Expo. Sci. Environ. Epidemiol. 2024, 1–9. [Google Scholar] [CrossRef] [PubMed]
- Hilker, N.; Wang, J.M.; Jeong, C.-H.; Healy, R.M.; Sofowote, U.; Debosz, J.; Su, Y.; Noble, M.; Munoz, A.; Doerksen, G.; et al. Traffic-related air pollution near roadways: Discerning local impacts from background. Atmos. Meas. Tech. 2019, 12, 5247–5261. [Google Scholar] [CrossRef]
- Coccia, M. The effects of atmospheric stability with low wind speed and of air pollution on the accelerated transmission dynamics of COVID-19. Int. J. Environ. Stud. 2020, 78, 1–27. [Google Scholar] [CrossRef]


| MICROSCOPY STUDIES OF FIREWORK PARTICULATES | ||||
|---|---|---|---|---|
| Author | Techniques | Particle Collection | Particle Composition | Particle Shape |
| K.L. Kosanke et al. [25] | SEM *, EDS **, X-ray EDS | Residual Material Sampling | Mg-Al-Ba, Si-Ca, Si | 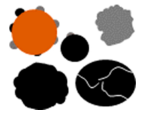 |
| Castro et al. [26] | Raman Spectroscopy, SEM *, EDS ** & FTIR *** | Confiscated Fireworks (Non-burst in Powder/fiber form) | Grain Type-1 (N, O, Sr), Grain Type-2 (C, O), Grain-3 (Cl, N, O), Grain-4 Ba, N, and O). |  |
| Li W. et al. [20] | TEM &/EDS ** | Sampled on Cu TEM grids using a single-stage impactor | Fe-Si, Ba-S, K-Si, Mg-Al, K-Ba, K-Al |  |
| Grima et al. [27] | SEM *, SEM-EDS ** | Sampling on SEM double-sided carbon tapes at Site | Spheroidal and Hollow shaped. Sr-Ba, Sr-Sb-Ba |  |
| Mishra et al. [28] | SEM-EDS **, FTIR ***, XRF # | Aerosol Filter-based Sampling | Si-Al-Ca-O, Ca-Fe-O, Si-Mg-Al-Fe, Ca-S, Ca-O, Cu-S |  |
| (This work) | SEM *, SEM-EDS ** | UAV (Drone) and Passive Sampling | Spheroidal, Grain, and Hollow shaped | 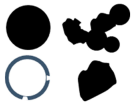 |
| Low Altitude Samples | High Altitude Samples | |
|---|---|---|
| Average Diameter | 12 µm | 39 µm |
| Standard Deviation | 16 µm | 33 µm |
Disclaimer/Publisher’s Note: The statements, opinions and data contained in all publications are solely those of the individual author(s) and contributor(s) and not of MDPI and/or the editor(s). MDPI and/or the editor(s) disclaim responsibility for any injury to people or property resulting from any ideas, methods, instructions or products referred to in the content. |
© 2025 by the authors. Licensee MDPI, Basel, Switzerland. This article is an open access article distributed under the terms and conditions of the Creative Commons Attribution (CC BY) license (https://creativecommons.org/licenses/by/4.0/).
Share and Cite
Murray, J.-T.; Lohatepanont, M.; Sisniega Serrano, F.; Perez Avendano, D.; Merchan-Merchan, W. Investigation of Airborne Particulate Matter from a Holiday Celebration in Central Oklahoma Using an Unmanned Aerial Vehicle (UAV). Appl. Sci. 2025, 15, 3151. https://doi.org/10.3390/app15063151
Murray J-T, Lohatepanont M, Sisniega Serrano F, Perez Avendano D, Merchan-Merchan W. Investigation of Airborne Particulate Matter from a Holiday Celebration in Central Oklahoma Using an Unmanned Aerial Vehicle (UAV). Applied Sciences. 2025; 15(6):3151. https://doi.org/10.3390/app15063151
Chicago/Turabian StyleMurray, John-Thomas, Mark Lohatepanont, Fernando Sisniega Serrano, Diego Perez Avendano, and Wilson Merchan-Merchan. 2025. "Investigation of Airborne Particulate Matter from a Holiday Celebration in Central Oklahoma Using an Unmanned Aerial Vehicle (UAV)" Applied Sciences 15, no. 6: 3151. https://doi.org/10.3390/app15063151
APA StyleMurray, J.-T., Lohatepanont, M., Sisniega Serrano, F., Perez Avendano, D., & Merchan-Merchan, W. (2025). Investigation of Airborne Particulate Matter from a Holiday Celebration in Central Oklahoma Using an Unmanned Aerial Vehicle (UAV). Applied Sciences, 15(6), 3151. https://doi.org/10.3390/app15063151