Abstract
Predicting battery states such as the voltage and state of charge (SOC) can help us monitor lithium batteries more efficiently during usage. This study proposed a predictive model for the lithium battery voltage and SOC by combining a second-order RC equivalent circuit model with a multi-head attention Bidirectional Long Short-Term Memory (MHA-BiLSTM) neural network. The equivalent circuit model simulates long-term charge–discharge cycles in Simulink, providing essential data for model training. The BiLSTM model, enhanced by the multi-head attention mechanism, is used for accurate short-term predictions of the battery voltage and SOC. The experimental results demonstrate that the proposed MHA-BiLSTM model outperforms other models in the prediction accuracy, achieving an R2 of 0.91, with the lowest RMSE of 0.0567 and MAPE of 0.0095. This hybrid approach effectively captures the dynamic behavior of the battery and reduces predictive errors, making it a promising solution for battery health monitoring and management.
1. Introduction
The safety issues of a lithium battery highlight the importance of monitoring the health of lithium-ion batteries throughout their lifecycle. The continuous monitoring of key parameters like the current, voltage, and internal resistance is crucial for safe operation, as they provide essential information on the battery’s state of charge (SOC) and state of health (SOH) [1,2,3,4]. Due to the difficulty of monitoring the operation parameters physically, many researchers focus on simulating a lithium battery response using electrochemical models or an equivalent circuit model (ECM) [5,6,7]. However, ECMs may become imprecise under dynamic load conditions due to their limited ability to capture the intricate relationship between the battery’s internal electrochemical properties, resulting in a less accurate SOC estimation. These limitations have prompted researchers to explore data-driven approaches like machine learning (ML) [8,9,10,11,12,13,14,15,16]. Miao et al. [17] proposed an adaptive ML framework based on a deep temporal convolutional network (TCN) and Coulomb counting for SOC estimation across different battery chemistries. Ren et al. [18] successfully employed a particle-swarm-optimized Long Short-Term Memory (LSTM) network to achieve SOC estimation errors below 0.5% and demonstrated the model’s robustness under noisy conditions. Yang et al. [19] applied unscented Kalman filtering (UKF) for SOC smoothing before using LSTM for prediction, achieving root-mean-square errors below 1.1% across temperatures ranging from 0 °C to 50 °C, with average errors below 1%.
The LSTM methods excel at handling time-series data, leading to high accuracy and efficiency in the SOC prediction. But, traditional LSTM networks may be influenced by operating conditions from various time scales, thus they sometimes struggle with long-term dependencies in battery degradation. Wang et al. [20] developed an adaptive self-attention LSTM (SA-LSTM) model that significantly enhanced the capture of degradation information in lithium batteries. With the assistance of the attention mechanism, the model could better identify and utilize relevant historical patterns, leading to improved accuracy in both SOC and SOH predictions. They further proposed a bidirectional LSTM with attention mechanisms (AM-BiLSTM) for predicting the remaining useful life (RUL). The new model processes the time series data in both forward and backward directions while using attention to focus on critical degradation indicators, achieving remarkable prediction accuracy with errors within 1%. Meanwhile, these data-driven approaches typically require extensive cycling data for effective training, making the data collection process time-consuming and resource-intensive. To overcome this, recent studies combine physical models with data-driven methods [21,22,23].
Although physical models provide fundamental electrochemical principles and domain knowledge, their simplicity often results in limited accuracy under complex operating conditions. For example, ECMs struggle to capture the nonlinear behavior of a battery’s internal dynamics under dynamic load conditions, affecting the accuracy of SOC estimation [11,12,13,14,15]. Moreover, they heavily rely on large amounts of cycling data, making the data collection process slow and resource-intensive. Additionally, most existing studies fail to deeply explore the complex correlations among various battery parameters, leading to low accuracy and significant errors in the battery state prediction [16,17,18]. Furthermore, the current research primarily focuses on predicting the battery state at the next time step rather than over an extended period [19,20,21].
To overcome these challenges, this study proposes a hybrid framework that combines a second-order RC ECM with a multi-head-attention bidirectional LSTM (MHA-BiLSTM) network. Unlike traditional approaches that rely on experimental data, ECM is used to simulate long-term charge–discharge cycles, generating synthetic data that significantly reduce the need for costly experimental data collection. This approach not only lowers the data acquisition barrier, but also ensures high fidelity simulation results. Furthermore, this model predicts both the voltage and SOC sequences 30 steps ahead, addressing the practical need for multi-step forecasting in BMS applications. The incremental charge and voltage change between consecutive time steps are introduced as additional features. The battery’s parameters are processed by a multi-head attention (MHA) mechanism, which dynamically weighs the importance of different features and captures cross-parameter dependencies. This design allows the model to better comprehend how battery states evolve, in terms of the incremental charge and voltage changes, across consecutive time steps under varying load conditions. By integrating physical modeling with advanced deep learning techniques, this work provides a scalable and efficient solution for the battery state prediction. The proposed framework not only improves the prediction accuracy, but also broadens the applicability of data-driven methods by reducing the dependency on experimental data.
This paper is organized as follows: Section 2 details the methodology, including the hybrid framework combining a second-order RC equivalent circuit model with a MHA-BiLSTM neural network. Section 3 presents the results and discussions, covering ECM validation, parameter identification, and the comparative analysis of prediction models. Section 4 concludes this study and provides an outlook of future research.
2. Methodology
Figure 1 shows the overall experimental and modeling workflow. The dashed boxes in Figure 1 indicate the potential applications of this battery state prediction model, including redundant backup and fault detection support for battery parameters.
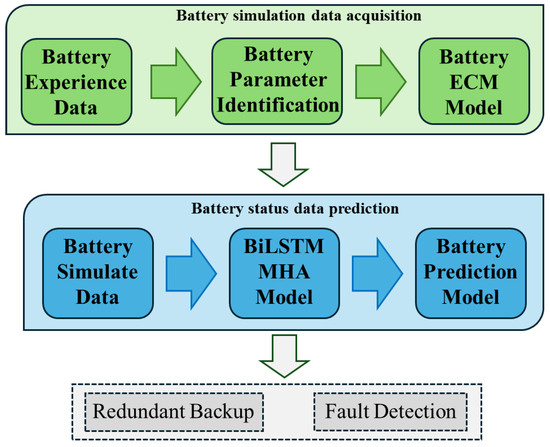
Figure 1.
Flowchart of the workflow for this study, including battery ECM establishment and state prediction model development.
- 1.
- Battery Experimental Data Collection: time-series data of essential parameters, including voltage and current, were collected from practical battery operations.
- 2.
- Parameter Identification: this process determines critical parameters in the equivalent circuit, such as internal resistance and time constants of RC networks.
- 3.
- Equivalent Circuit Model Construction: a second-order RC equivalent circuit model was established in the Simulink environment.
- 4.
- Battery Data Simulation: the constructed ECM was employed to simulate charge–discharge cycles, generating extensive training data.
- 5.
- Model Training: the simulated data were used to train a bidirectional LSTM network integrated with multi-head attention mechanism.
- 6.
- Battery State Prediction: the trained model is applied to predict battery voltage and SOC.
In this study, an NCM Li-ion battery was chosen as the experimental object. NCM Li-ion batteries are widely used in electric vehicles, consumer electronics, grid energy storage, and portable energy storage systems due to their high energy density and long cycle life. The parameters of the NCM battery are presented in Table 1. The tested parameters used are the basic parameters of the ECM.

Table 1.
The lithium battery parameters.
2.1. Equivalent Circuit Model
In this study, we selected Thevenin model, which simplifies battery behavior through essential circuit components. According to research by You H W and Li, F. et al., when using the Thevenin model as the battery equivalent circuit model, a comparison among first-order, second-order, and third-order RC circuit models revealed that the second-order RC circuit model offers an optimal balance between model accuracy and complexity. Therefore, we employed the second-order RC ECM in this study [24,25]. Figure 2 illustrates the schematic diagram of the second-order RC Thevenin ECM.
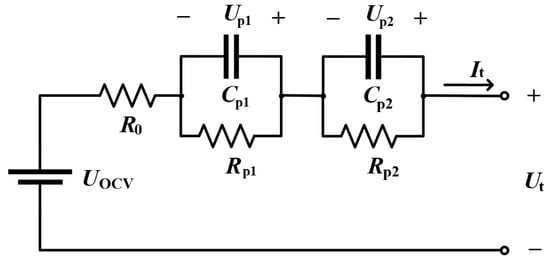
Figure 2.
Equivalent Circuit Diagram with a Second-Order RC Circuit.
The output voltage of the 2RC model, , can be described by the following equation, where represents the terminal voltage of the battery, is the ideal voltage of the battery, is the battery current, and is the internal resistance of the battery.
Up1 and Up2 represent the voltage drops across each RC circuit, calculated as follows, where and are polarization resistances, and and represent the time constants, calculated as the products of × and × , respectively.
By substituting these results into the overall voltage equation of the battery, the final output voltage can be expressed as follows:
The open-circuit voltage is an expression that depends on SOC, while the parameters , , , , and , which describe the dynamic behavior of the battery, are related to the OCV, as discussed previously. Furthermore, these parameters are also related to SOC. In this work, the formula fitting of the battery data is performed based on Equation (4), enabling the identification of parameters to facilitate the construction of the equivalent circuit. Parameter fitting is conducted using experimental data, calibrated with least squares or other fitting algorithms to improve model accuracy.
2.2. Neural Network Models
2.2.1. LSTM
Long Short-Term Memory (LSTM) networks are a specialized type of Recurrent Neural Network (RNN) designed to address the vanishing and exploding gradient problems that often occur when handling long sequential data. With its memory cell and gating mechanisms, the LSTM is effective in capturing long-term dependencies, making it particularly suitable for tasks involving sequential data. For battery state prediction, LSTMs have proven to be powerful tools, enabling accurate estimation of battery SOC and SOH. In this work, LSTM is employed to predict the battery state data, serving as a baseline model for comparison with other models. As shown in Figure 3, the LSTM unit is composed of several crucial components: input gate, forget gate, and output gate. These gates regulate the information flow into, flow through, and flow out of the memory cell.
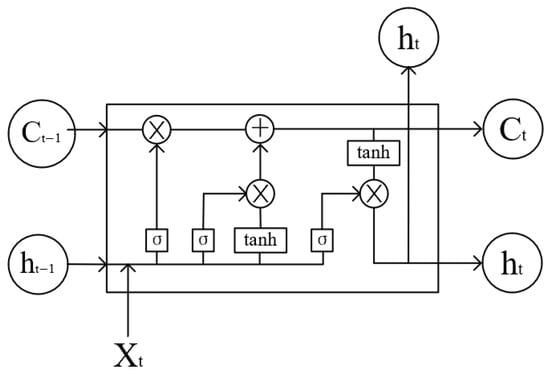
Figure 3.
Diagram of the LSTM networks.
2.2.2. BiLSTM
Bidirectional LSTM (BiLSTM) is demonstrated in Figure 4. This enhanced model augments the capabilities of traditional LSTM by incorporating two independent LSTM layers that process sequences in both forward and backward directions. The bidirectional structure enables BiLSTM to capture more comprehensive and intrinsic relationships within sequential data, as it considers both past and future information simultaneously. This characteristic makes BiLSTM particularly well-suited for battery state prediction, where future states can influence current estimates, thus enhancing prediction accuracy. Here, we further integrate an attention mechanism into the BiLSTM model to achieve improved handling of battery data, enabling the model to focus on critical features and enhance prediction performance.
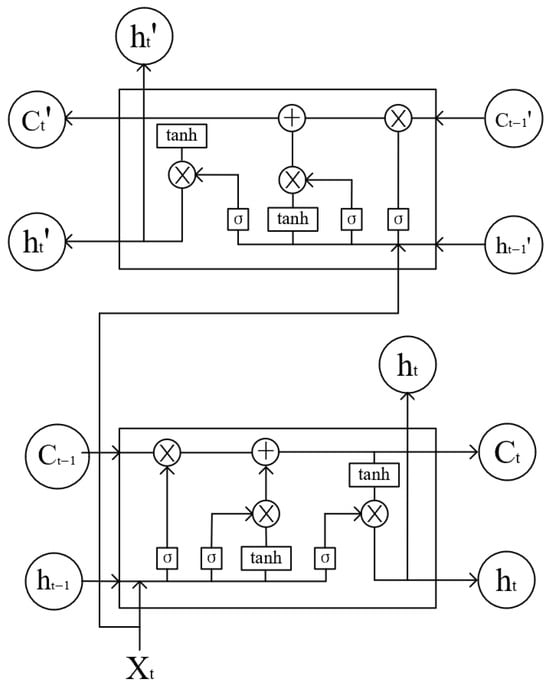
Figure 4.
Diagram of the BiLSTM networks.
2.2.3. Multi-Head Attention Mechanism
Attention mechanisms are inspired by human attention processes, aiming to dynamically focus on different parts of input sequences during processing [26]. The multi-head attention mechanism extends the basic attention mechanism by computing multiple attention heads in parallel, allowing the model to focus on different features of the input. Each attention head learns different representations, which are then concatenated and linearly transformed to produce the final output:
The outputs from multiple heads are concatenated:
where Q, K, and V come from the input feature sequence. Specifically, Q represents the query vectors obtained by linearly transforming the input features; K represents the key vectors used to compute the similarity between Q and each input vector; and V is the value matrix that contains the actual information of the input features is a learnable output weight matrix that is continuously optimized during training to combine the outputs from different attention heads. These parameters are automatically computed and updated by the algorithm during the input processing and training phases, without requiring manual assignment.
Figure 5 illustrates how the attention mechanism operates within the neural network. The attention layer acts as a bridge between the final hidden layers and the output layer, selectively focusing on the most relevant features from the input sequence. By assigning different weights to hidden states in Hidden Layer, the attention mechanism enables the model to prioritize critical temporal or spatial dependencies in the input data. This adaptive weighting improves the model’s ability to capture long-term dependencies and reduces the impact of irrelevant features, thereby enhancing the overall prediction accuracy.
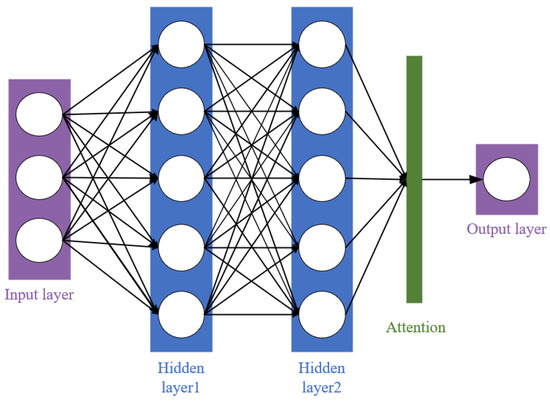
Figure 5.
Schematic Diagram of the Battery Prediction Model Structure.
3. Results and Discussions
3.1. ECM Development and Parameter Identification
In the Simulink environment, an ECM incorporating a second-order RC circuit based on the Thevenin model was constructed for the battery simulation (Figure 6). This work focused on ternary lithium batteries, and high-performance pulse discharge tests (HPPC) were executed to gather pulse discharge data spanning from 100% to 0% SOC. These data were used to support the subsequent equivalent circuit modeling.
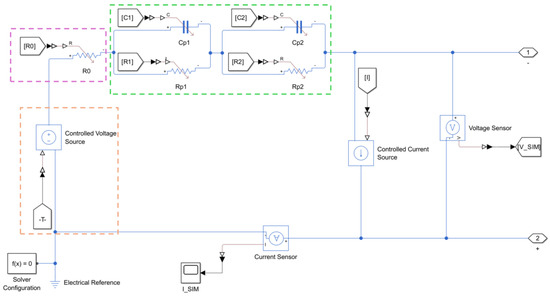
Figure 6.
Equivalent Circuit Model of a Single-Cell Battery in Simulink. The ECM model is based on Simscape components provided by MATLAB Simulink, the version is 2024b. The ‘Origin’ box represents OCV, the ‘Pink’ box represents R0, and the ‘Green’ box represents the RC circuit.
The accuracy of the parameters directly influences the precision of the ECM. We identified the parameters based on the pulse discharge data using the methods described in Section 2.1. This process included determining the battery’s internal resistance, polarization resistance, and polarization capacitance. We conducted parameter identification for a 32 Ah ternary lithium battery with an operating voltage range of 3.3 V to 4.2 V. Figure 7 illustrates the variation of different parameters in the ECM as a function of the battery’s SOC. Each subplot represents a specific component of the ECM, showing how internal battery characteristics fluctuate during charging and discharging cycles. For the transient response of the battery, the resistance exhibits a decreasing trend as the SOC decreases, reaching its minimum value at a mid-level SOC. However, as the SOC continues to drop, begins to increase slightly, which suggests that the internal resistance rises as the battery’s charge diminishes further. Regarding the relaxation response, the resistances and in the two RC branches show generally opposite trends. The exhibits an overall downward trend, with a particularly notable decrease to near zero when the SOC exceeds 0.9. Meanwhile, within the SOC range of 0.2 to 0.4, the undergoes a steep decline followed by a rapid ascent. Conversely, the generally remains at a low level, except for a notable peak when the is in a valley. In addition, the undergoes a severe increase and reaches its maximum value within the SOC range of 0.9 to 1. Meanwhile, the capacitances and display an overall oscillatory upward trend as the SOC increases. At low SOC levels, a notable dip appears in of the first RC branch, whereas in the second RC branch shows a distinct peak in the corresponding SOC range. The magnitude of this peak in approximately matches the decrease observed in . This phenomenon suggests that the first RC branch may struggle to fully capture the battery’s relaxation response under certain conditions, a gap compensated for the second RC branch. This finding underscores the superior accuracy of higher-order RC models compared to lower-order ones in fitting the battery’s response curve, highlighting their robustness and capability in capturing intricate battery behaviors.
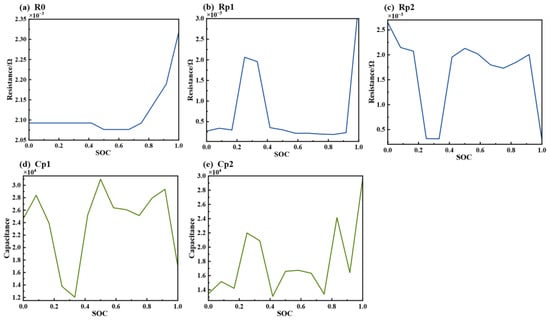
Figure 7.
Parameter identification results of components in the equivalent circuit (a–e) represent the change of R0, Rp1, Rp2, Cp1, and Cp2 with SOC, respectively).
Figure 8 shows the 14 sets of the SOC and OCV distribution points obtained from the test data. A polynomial fitting method was used to establish the relationship between the SOC and OCV. To balance the fitting accuracy and polynomial complexity, different polynomial orders were attempted, as shown in Table 2. The 5th-order polynomial yielded an R2 of 0.9994, the 6th order reached an R2 of 0.9997, and the 7th order achieved an R2 of 0.9998.
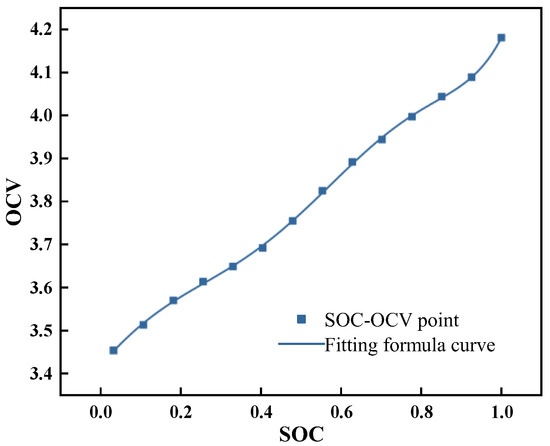
Figure 8.
Distribution of 14 SOC-OCV relationship points and the corresponding fitting curve.
Table 2.
Comparison of R2 and RMSE for different polynomial orders used in the SOC-OCV fitting process.
Considering the trade-off between accuracy and complexity, the 6th-order polynomial was chosen as the optimal option. The resulting SOC-OCV 6th-order polynomial fitting relationship is as in Formula (7).
Figure 9a presents a comparison between the simulated voltage output of the ECM and the measured voltage over a discharge cycle. The simulated voltage closely follows the trend of the real voltage, accurately capturing both the general downward trajectory and transient fluctuations observed in the experimental data. This alignment indicates that the ECM reliably represents the battery’s voltage response during discharge. Figure 9b presents the difference between the simulated voltage and real voltage over time. This difference is generally confined within a narrow range of ±0.03 V, which reveals the high accuracy of the ECM. At very low SOC levels, there is a slight underestimation, but the discrepancy remains minimal under 0.05 V. This level of accuracy confirms the robustness of the ECM parameters in effectively modeling the battery’s behavior across different SOC levels. The battery underwent continuous charge–discharge cycling between a 15% and 95% SOC under varying charge rates of 0.5C, 1C, 1.5C, 2C, and 2.5C for 1000 h. Detailed data on the battery voltage, current, and SOC were collected, which served as the input data for the subsequent data-driven model training. Each data set was generated with a fixed charge rate and discharge rate throughout the cycling process. After 1000 h of cycling, the simulated battery capacity in Simulink was set to degrade to 80%. This capacity degradation was calculated using the software’s default formula. Detailed data on the battery voltage, current, and SOC were collected, which served as the input data for the subsequent data-driven model training.
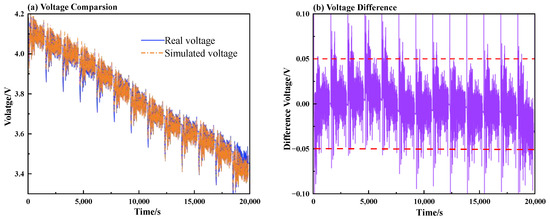
Figure 9.
Comparison between the simulated voltage output of the ECM and the actual measured voltage: (a) simulated voltage verify; (b) simulated voltage difference.
3.2. Data-Driven Prediction Model Development and Training
3.2.1. Data Processing
In this study, all models were trained using the same simulated battery data obtained from the battery model established in Section 3.1. This dataset was generated from a battery model based on the second-order RC equivalent circuit, which was constructed and parameterized using the methods discussed in Section 2.1. After the parameters were identified, the model was used to simulate continuous charge and discharge cycles of the battery. The dataset includes recorded data of the battery current, voltage, and state of charge at 10 s intervals.
3.2.2. Model Train Flow
The LSTM was used as the base model for the battery voltage and SOC prediction. To improve the model accuracy, BiLSTM was utilized to process the input data bidirectionally. The BiLSTM model’s capacity to integrate both past and future data points grants it a superior performance over conventional RNNs and GRUs for battery SOC prediction. Figure 10 shows the overall flowchart for predicting the battery voltage and SOC based on simulated cycle data derived from the Simulink equivalent circuit model. The dataset contains simulation data under various charge rates, with the input variables being the past 60 time steps of the voltage , current , voltage change , charge change , and state of charge . The output variables are the predicted voltage and SOC for the next 30 time steps, with each time step being 10 s, resulting in a total duration of 5 min. The model was trained using a fixed-length sliding window approach, where the past 60 time steps, representing 10 min of input data, were used to predict the subsequent 30 time steps.
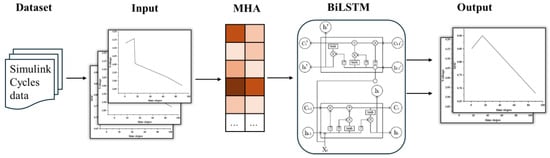
Figure 10.
Flow chart of the battery voltage and SOC prediction model using BiLSTM architecture with Multi-Head Attention (MHA).
Figure 11 shows the flow of the battery voltage and SOC prediction model using a BiLSTM architecture with MHA. The model’s input variables are first processed by an MHA mechanism, which dynamically redistributes the importance of different features across various time steps. By introducing the MHA mechanism, the model’s capacity to analyze data over long-time horizons and complex multivariable scenarios, such as the voltage and current, is significantly enhanced, improving the prediction accuracy. After MHA processing, the input variables are fed into the BiLSTM module to capture time sequential data. Finally, the output layer generates predictions for the voltage and SOC.
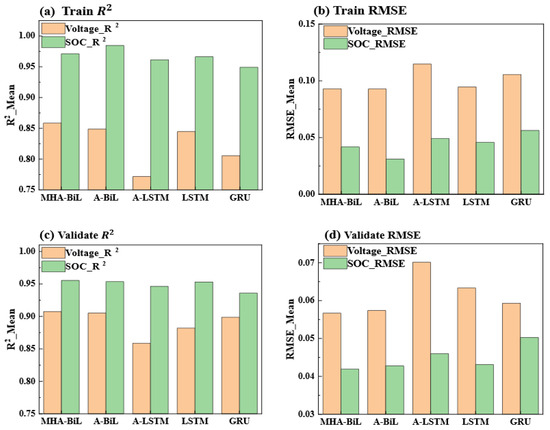
Figure 11.
Accuracy and error statistics of five prediction models in the train and validate set: (a) Train R2, (b) Train RMSE, (c) Validate R2, and (d) Validate RMSE.
The model’s hyperparameters, including the learning rate, number of neurons, number of iterations, rate of dropout, batch size, historical data window length, and prediction window length, were set as follows: 0.00025, 60, 5, 0.15, 64, 60, and 30. To assess the predictive performance of different models, this study employs the coefficient of determination (R2), Mean Squared Error (MSE), Root Mean Square Error (RMSE), Mean Absolute Error (MAE), and Mean Absolute Percentage Error (MAPE) as the model performance comparison criteria.
3.3. Model Performance Comparison
In this section, we evaluate the efficacy of the proposed MHA-BiLSTM model against four other deep learning architectures: GRU, LSTM, Attention-LSTM (A-LSTM), and Attention-BiLSTM (A-BiLSTM). The evaluation is divided into two parts. First, the performances of all five models are assessed on the training dataset to observe their learning capabilities under identical hyperparameter settings. Second, the models are evaluated on an untrained simulated dataset to examine their accuracy and generalization in realistic prediction tasks. Figure 11 presents the R2 and RMSE results for voltage and SOC predictions during both the training phase and on the unseen validation dataset for all five models. In the battery voltage prediction task, the five models were evaluated on both the training and validation datasets, using identical hyperparameter settings. On the training set, the MHA-BiLSTM model demonstrated the best performance, with its R2 surpassing the baseline LSTM and achieving a lower RMSE. On the validation dataset, MHA-BiLSTM also outperforms, with an R2 approximately 3% higher and an RMSE reduction of 10.43% compared to the baseline LSTM. These results highlight the model’s ability to obtain complex relationships between the battery parameters and its superior generalization performance.
A-BiLSTM performed comparably to MHA-BiLSTM with a slightly lower R2 and RMSE values. The integration of MHA in the MHA-BiLSTM model further enhanced its ability to capture intricate dependencies. Unlike A-BiLSTM, which leverages bidirectional dependencies and a basic attention mechanism, MHA-BiLSTM utilizes a multi-head attention mechanism to effectively learn the complex interrelations among the voltage, SOC, and other battery parameters. This capability allows MHA-BiLSTM to achieve more accurate predictions, demonstrating its superiority over models with only single-layer attention mechanisms. The GRU model showed a weaker performance than the LSTM-based models, likely due to its simpler architecture, which struggles with capturing the more complex temporal dependencies in the data. A-LSTM exhibited the lowest performance, likely due to suboptimal training under the current hyperparameter settings, resulting in reduced accuracy and higher prediction errors.
In SOC prediction, a similar trend was observed. The MHA-BiLSTM model consistently achieved the highest R2 and lowest RMSE in both the training and validation datasets, further demonstrating its ability to find the intricate dependencies among the battery parameters. A-BiLSTM again showed a competitive performance. These findings emphasize the effectiveness of the MHA-BiLSTM model in learning complex interdependencies between battery parameters, such as the voltage and SOC, resulting in a consistently superior prediction performance across different datasets. The superior performance of the MHA-BiLSTM model can be attributed to its ability to effectively learn the complex relationships among multiple battery parameters, such as the voltage and SOC. By incorporating MHA, the model captures interdependencies between these parameters, enabling more accurate and robust predictions. Across both the voltage and SOC prediction tasks on the training dataset, the MHA-BiLSTM consistently outperformed other models by reducing the prediction error and enhancing the accuracy. This highlights its comprehensive effectiveness in addressing the challenges of the battery parameters’ prediction and its capability to capture complex dependencies in battery data more effectively.
To further evaluate the model’s performance, a segment of untrained simulated battery charge–discharge cycle data was selected to test the model’s ability to predict the SOC and voltage over a five-minute interval. Figure 12a,b illustrate the performances of the five models in the voltage and SOC prediction tasks, respectively. From Figure 12a, it can be observed that the MHA-BiLSTM model consistently provides predictions closest to the actual output voltage of the equivalent circuit model throughout the entire period, with a deviation ranging from 0.015 V to 0.025 V, demonstrating the highest prediction accuracy. In comparison, the LSTM and GRU models exhibit slightly lower accuracy, with slightly larger deviations, but still within acceptable ranges. The A-BiLSTM and A-LSTM models show significantly larger deviations, approximately 0.05 V higher, which is likely due to overfitting.
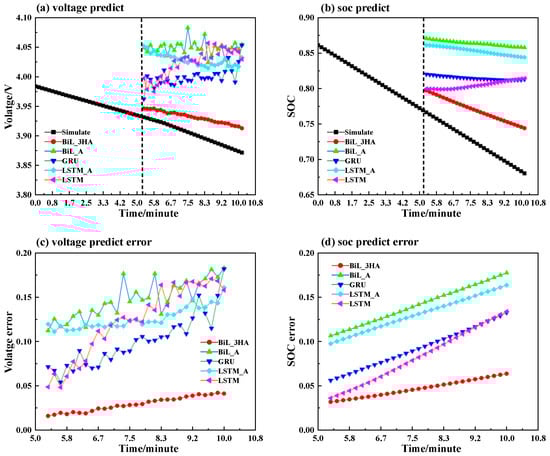
Figure 12.
Comparison of simulated and predicted results of voltage and SOC, with prediction errors for five models over a selected five-minute interval in the simulated battery data: (a) Voltage predictions, (b) SOC predictions, (c) Voltage prediction errors, and (d) SOC prediction errors.
For SOC prediction, a similar trend in the voltage prediction is observed, as shown in Figure 12b. The MHA-BiLSTM model again demonstrates the highest prediction accuracy, with deviations ranging from 0.02 to 0.04. LSTM and GRU models achieve reasonable accuracy, falling into the second tier, while A-BiLSTM and A-LSTM exhibit larger deviations, exceeding 0.1. Figure 12d provides a clearer view of the SOC prediction error trends. During the first two minutes, all models maintain acceptable prediction deviations. However, as time progresses, the prediction errors for all models increase significantly, particularly during the final two minutes, where the error accumulation effect becomes more pronounced.
The MSE and MAE results for different models are summarized in Table 3, respectively. It can be observed that in both the voltage and SOC predictions, the MHA-BiLSTM model had the lowest MSE values, at 0.000902 and 0.002253, respectively, indicating the highest prediction accuracy. In contrast, other models, such as A-BiLSTM, A-LSTM, and GRU, exhibited higher MSE values, with A-BiLSTM having the highest error in SOC prediction at 0.020177. For the voltage prediction, the GRU model had a relatively low MSE of 0.010469, but its error in SOC prediction remained significantly higher than that of the MHA-BiLSTM, at 0.007566. Overall, the MHA-BiLSTM model consistently demonstrated a superior performance across both tasks.
Table 3.
MSE and MAE Results of Voltage and SOC for Five Models in the Test Data. The highest the lowest RMSE values in the table are highlighted in bold.
4. Conclusions
In this work, a second-order RC equivalent circuit model in Simulink simulates the charge and discharge behaviors of a lithium battery. The data generated from this equivalent circuit model were used to train several neural network architectures for voltage and SOC prediction. The MHA-BiLSTM demonstrated a superior performance, leveraging multi-head attention to enhance feature extraction and improve the prediction accuracy. In voltage prediction, MHA-BiLSTM achieved an R2 of 0.9075, RMSE of 0.0567, and MAPE of 0.0095, respectively. For SOC prediction, it led with an R2 of 0.9554 and RMSE of 0.0419, outperforming LSTM and GRU with a 2.78% and 16.61% reduction in RMSE, respectively. The performance improvements primarily result from the multi-head attention mechanism, which enhances the model’s ability to capture complex battery dynamics by focusing on key features and minimizing the cumulative error. This work confirms the feasibility of integrating the second-order RC equivalent circuit model with the MHA-BiLSTM model to provide an effective framework for battery voltage and SOC prediction. This study demonstrates the feasibility of integrating physical modeling with advanced deep learning techniques to achieve accurate and efficient battery state prediction. The proposed framework not only advances the state-of-the-art in battery health monitoring, but also broadens the applicability of data-driven methods by lowering the barriers to data acquisition. Future work will focus on validating the model with experimental data from real-world battery systems and extending its capabilities to predict SOH and RUL.
Author Contributions
Conceptualization, Z.L. and H.X.; Methodology, T.L. and J.Q.; Validation, Z.L.; Resources, Z.L. and M.M.; Writing—Original Draft Preparation, H.X.; Writing—Review and Editing, Z.L., T.L. and J.Q.; Supervision, Z.L. and M.M.; Project Administration, Z.L., J.X. and S.L. All authors have read and agreed to the published version of the manuscript.
Funding
This research received no external funding.
Institutional Review Board Statement
Not applicable.
Informed Consent Statement
Not applicable.
Data Availability Statement
The authors have not been granted authorization to publicly disclose the relevant data.
Acknowledgments
M.M. acknowledges the Shanghai Eastern Talent Plan.
Conflicts of Interest
The authors declare no conflicts of interest.
References
- Hu, X.; Zhang, K.; Liu, K.; Lin, X.; Dey, S.; Onori, S. Advanced fault diagnosis for lithium-ion battery systems: A review of fault mechanisms, fault features, and diagnosis procedures. IEEE Ind. Electron. Mag. 2020, 14, 65–91. [Google Scholar] [CrossRef]
- Chang, W.-Y. The state of charge estimating methods for battery: A review. Int. Sch. Res. Not. 2013, 2013, 953792. [Google Scholar] [CrossRef]
- Xiong, R.; Cao, J.; Yu, Q.; He, H.; Sun, F. Critical review on the battery state of charge estimation methods for electric vehicles. IEEE Access 2017, 6, 1832–1843. [Google Scholar] [CrossRef]
- Hannan, M.A.; Lipu, M.H.; Hussain, A.; Mohamed, A. A review of lithium-ion battery state of charge estimation and management system in electric vehicle applications: Challenges and recommendations. Renew. Sustain. Energy Rev. 2017, 78, 834–854. [Google Scholar] [CrossRef]
- Zubi, G.; Dufo-López, R.; Carvalho, M.; Pasaoglu, G. The lithium-ion battery: State of the art and future perspectives. Renew. Sustain. Energy Rev. 2018, 89, 292–308. [Google Scholar] [CrossRef]
- Armand, M.; Axmann, P.; Bresser, D.; Copley, M.; Edström, K.; Ekberg, C.; Guyomard, D.; Lestriez, B.; Novák, P.; Petranikova, M.; et al. Lithium-ion batteries–Current state of the art and anticipated developments. J. Power Sources 2020, 479, 228708. [Google Scholar] [CrossRef]
- Newman, J.; Tiedemann, W. Porous-electrode theory with battery applications. AIChE J. 1975, 21, 25–41. [Google Scholar] [CrossRef]
- Liu, X.; Li, W.; Zhou, A. PNGV equivalent circuit model and SOC estimation algorithm for lithium battery pack adopted in AGV vehicle. IEEE Access 2018, 6, 23639–23647. [Google Scholar] [CrossRef]
- Lu, L.; Zhang, Z.; Li, J.; Hua, J.; Ouyang, M. A review on the key issues for lithium-ion battery management in electric vehicles. J. Power Sources 2013, 226, 272–288. [Google Scholar] [CrossRef]
- Rumelhart, D.E.; Hinton, G.E.; Williams, R.J. Learning representations by back-propagating errors. Nature 1986, 323, 533–536. [Google Scholar] [CrossRef]
- Bishop, C.M.; Nasrabadi, N.M. Pattern Recognition and Machine Learning, 4th ed.; Springer: New York, NY, USA, 2006. [Google Scholar]
- He, K.; Zhang, X.; Ren, S.; Sun, J. Deep residual learning for image recognition. In Proceedings of the IEEE Conference on Computer Vision and Pattern Recognition, Las Vegas, NV, USA, 27–30 June 2016; pp. 770–778. [Google Scholar]
- Hu, X.; Li, S.; Yang, Y. Advanced machine learning approach for lithium-ion battery state estimation in electric vehicles. IEEE Trans. Transp. Electrif. 2015, 2, 140–149. [Google Scholar] [CrossRef]
- Roman, D.; Saxena, S.; Robu, V.; Pecht, M.; Flynn, D. Machine learning pipeline for battery state-of-health estimation. Nat. Mach. Intell. 2021, 3, 447–456. [Google Scholar] [CrossRef]
- Ng, M.F.; Zhao, J.; Yan, Q.; Conduit, G.J.; Seh, Z.W. Predicting the state of charge and health of batteries using data driven machine learning. Nat. Mach. Intell. 2020, 2, 161–170. [Google Scholar] [CrossRef]
- Fei, Z.; Yang, F.; Tsui, K.L.; Li, L.; Zhang, Z. Early prediction of battery lifetime via a machine learning-based framework. Energy 2021, 225, 120205. [Google Scholar] [CrossRef]
- Miao, J.; Tong, Z.; Tong, S.; Zhang, J.; Mao, J. State of charge estimation of lithium-ion battery for electric vehicles under extreme operating temperatures based on an adaptive temporal convolutional network. Batteries 2022, 8, 145. [Google Scholar] [CrossRef]
- Ren, X.; Liu, S.; Yu, X.; Dong, X. A method for state-of-charge estimation of lithium-ion batteries based on PSO-LSTM. Energy 2021, 234, 121236. [Google Scholar] [CrossRef]
- Yang, F.; Zhang, S.; Li, W.; Miao, Q. State-of-charge estimation of lithium-ion batteries using LSTM and UKF. Energy 2020, 201, 117664. [Google Scholar] [CrossRef]
- Wang, F.K.; Amogne, Z.E.; Chou, J.H.; Tseng, C. Online remaining useful life prediction of lithium-ion batteries using bidirectional long short-term memory with attention mechanism. Energy 2022, 254, 124344. [Google Scholar] [CrossRef]
- Wang, Z.; Liu, N.; Chen, C.; Guo, Y. Adaptive self-attention LSTM for RUL prediction of lithium-ion batteries. Inf. Sci. 2023, 635, 398–413. [Google Scholar] [CrossRef]
- Madani, S.S.; Ziebert, C.; Vahdatkhah, P.; Sadrnezhaad, S.K. Recent progress of deep learning methods for health monitoring of lithium-ion batteries. Batteries 2024, 10, 204. [Google Scholar] [CrossRef]
- Shrivastava, P.; Soon, T.K.; Idris, M.Y.I.B.; Mekhilef, S. Overview of model-based online state-of-charge estimation using Kalman filter family for lithium-ion batteries. Renew. Sustain. Energy Rev. 2019, 113, 109233. [Google Scholar] [CrossRef]
- You, H.W.; Bae, J.I.; Cho, S.J.; Lee, J.M.; Kim, S.H. Analysis of equivalent circuit models in lithium-ion batteries. Aip Adv. 2018, 8, 125101. [Google Scholar] [CrossRef]
- Li, F.; Li, Z.; Zhang, Y.; Xu, G.; Wang, X.; Zhang, H. Analysis and Verification of Equivalent Circuit Model of Soft-Pack Lithium Batteries. Energies 2025, 18, 510. [Google Scholar] [CrossRef]
- Zaheer, M.; Guruganesh, G.; Dubey, K.A.; Ainslie, J.; Alberti, C.; Ontanon, S.; Pham, P.; Ravula, A.; Wang, Q.; Yang, L.; et al. Big Bird: Transformers for longer sequences. Adv. Neural Inf. Process. Syst. 2020, 33, 17283–17297. [Google Scholar]
Disclaimer/Publisher’s Note: The statements, opinions and data contained in all publications are solely those of the individual author(s) and contributor(s) and not of MDPI and/or the editor(s). MDPI and/or the editor(s) disclaim responsibility for any injury to people or property resulting from any ideas, methods, instructions or products referred to in the content. |
© 2025 by the authors. Licensee MDPI, Basel, Switzerland. This article is an open access article distributed under the terms and conditions of the Creative Commons Attribution (CC BY) license (https://creativecommons.org/licenses/by/4.0/).