Article

The Distribution Characteristics and Genesis Analysis of Overpressure in the Qiongzhusi Formation in the Zizhong Area, Sichuan Basin

1
Shale Gas Research Institution, PetroChina Southwest Oil & Gas Field Co., Chengdu 610051, China
2
National Key Laboratory of Petroleum Resources and Engineering, China University of Petroleum (Beijing), Beijing 102249, China
3
Unconventional Petroleum Research Institute, China University of Petroleum (Beijing), Beijing 102249, China
*
Authors to whom correspondence should be addressed.
Appl. Sci. 2025, 15(6), 2888; https://doi.org/10.3390/app15062888
Submission received: 6 January 2025 / Revised: 28 February 2025 / Accepted: 5 March 2025 / Published: 7 March 2025
(This article belongs to the Section Energy Science and Technology)

Abstract

:
Accurately predicting the genesis and distribution of reservoir pressure is essential for comprehending the distribution of oil and gas reservoirs while mitigating drilling risks. In the Qiongzhusi Formation of the Sichuan Basin, overpressure has developed, leading to high production levels in several wells. However, the distribution and causal mechanism of overpressure within the Qiongzhusi Formation remain unclear at present. This study utilizes logging data from representative drilling wells to identify the causes of overpressure in the Qiongzhusi Formation and predict the characteristics of pressure distribution. The results indicate that the pressure coefficient of the Qiongzhusi Formation ranges from 1.01 to 2.05 and increases with burial depth. The overpressure in the Qiongzhusi Formation is attributed to fluid expansion, disequilibrium compaction, and pressure transmission. The contribution of disequilibrium compaction to pressure is 9.44 MPa, while hydrocarbon generation from organic matter contributes 82.66 MPa, and pressure transmission contributes 37.98 MPa. Additionally, the uplift erosion unloading effect and geothermal decline result in pressure reductions of approximately 26.68 MPa and 56.56 MPa, respectively. This study systematically elucidates the causes and distribution of overpressure in the Qiongzhusi Formation, providing valuable insights for subsequent exploration and development of shale gas in this formation.

1. Introduction

With the increasing global energy demand, global petroleum exploration is transitioning from conventional to unconventional fields [1,2,3,4]. As exploration efforts deepen, numerous highly overpressured hydrocarbon basins have been discovered worldwide, with overpressured petroleum fields accounting for approximately 30% of global reserves [5,6,7,8]. Exploration and development practices have demonstrated that overpressure is not only closely related to the formation of hydrocarbon reservoirs but also significantly controls hydrocarbon distribution [9,10]. Consequently, the overpressure and its origins in reservoirs have garnered considerable attention from numerous scholars. Extensive previous research has identified five main causes of abnormal pressure: disequilibrium compaction, clay mineral dehydration, hydrocarbon generation from organic matter, thermal fluid expansion, and tectonic stress [11,12,13]. Regarding reservoir pressure calculation, commonly used methods include modular formation dynamic testing, abnormal drilling mud density and gas measurement, the Eaton method, and the Bowers method [14,15,16,17].
In recent years, significant breakthroughs have been achieved in Qiongzhusi Formation shale gas of the Zizhong area in the Sichuan Basin. Some wells have already produced high industrial gas flows, making it the second largest shale gas reservoir target formation after the Wufeng–Longmaxi Formation shale. Similar to the Wufeng–Longmaxi Formation shale reservoir, the Qiongzhusi Formation shale reservoir exhibits widespread overpressure. However, the overall exploration level of the Qiongzhusi Formation shale is relatively low, and the genesis and distribution of overpressure are not yet clear, which hinders further exploration progress.
Based on this, logging data from representative wells were utilized to analyze the causes of overpressure in the Qiongzhusi Formation shale and to predict the distribution characteristics of reservoir pressure, aiming to provide guidance for the exploration and development of this formation.

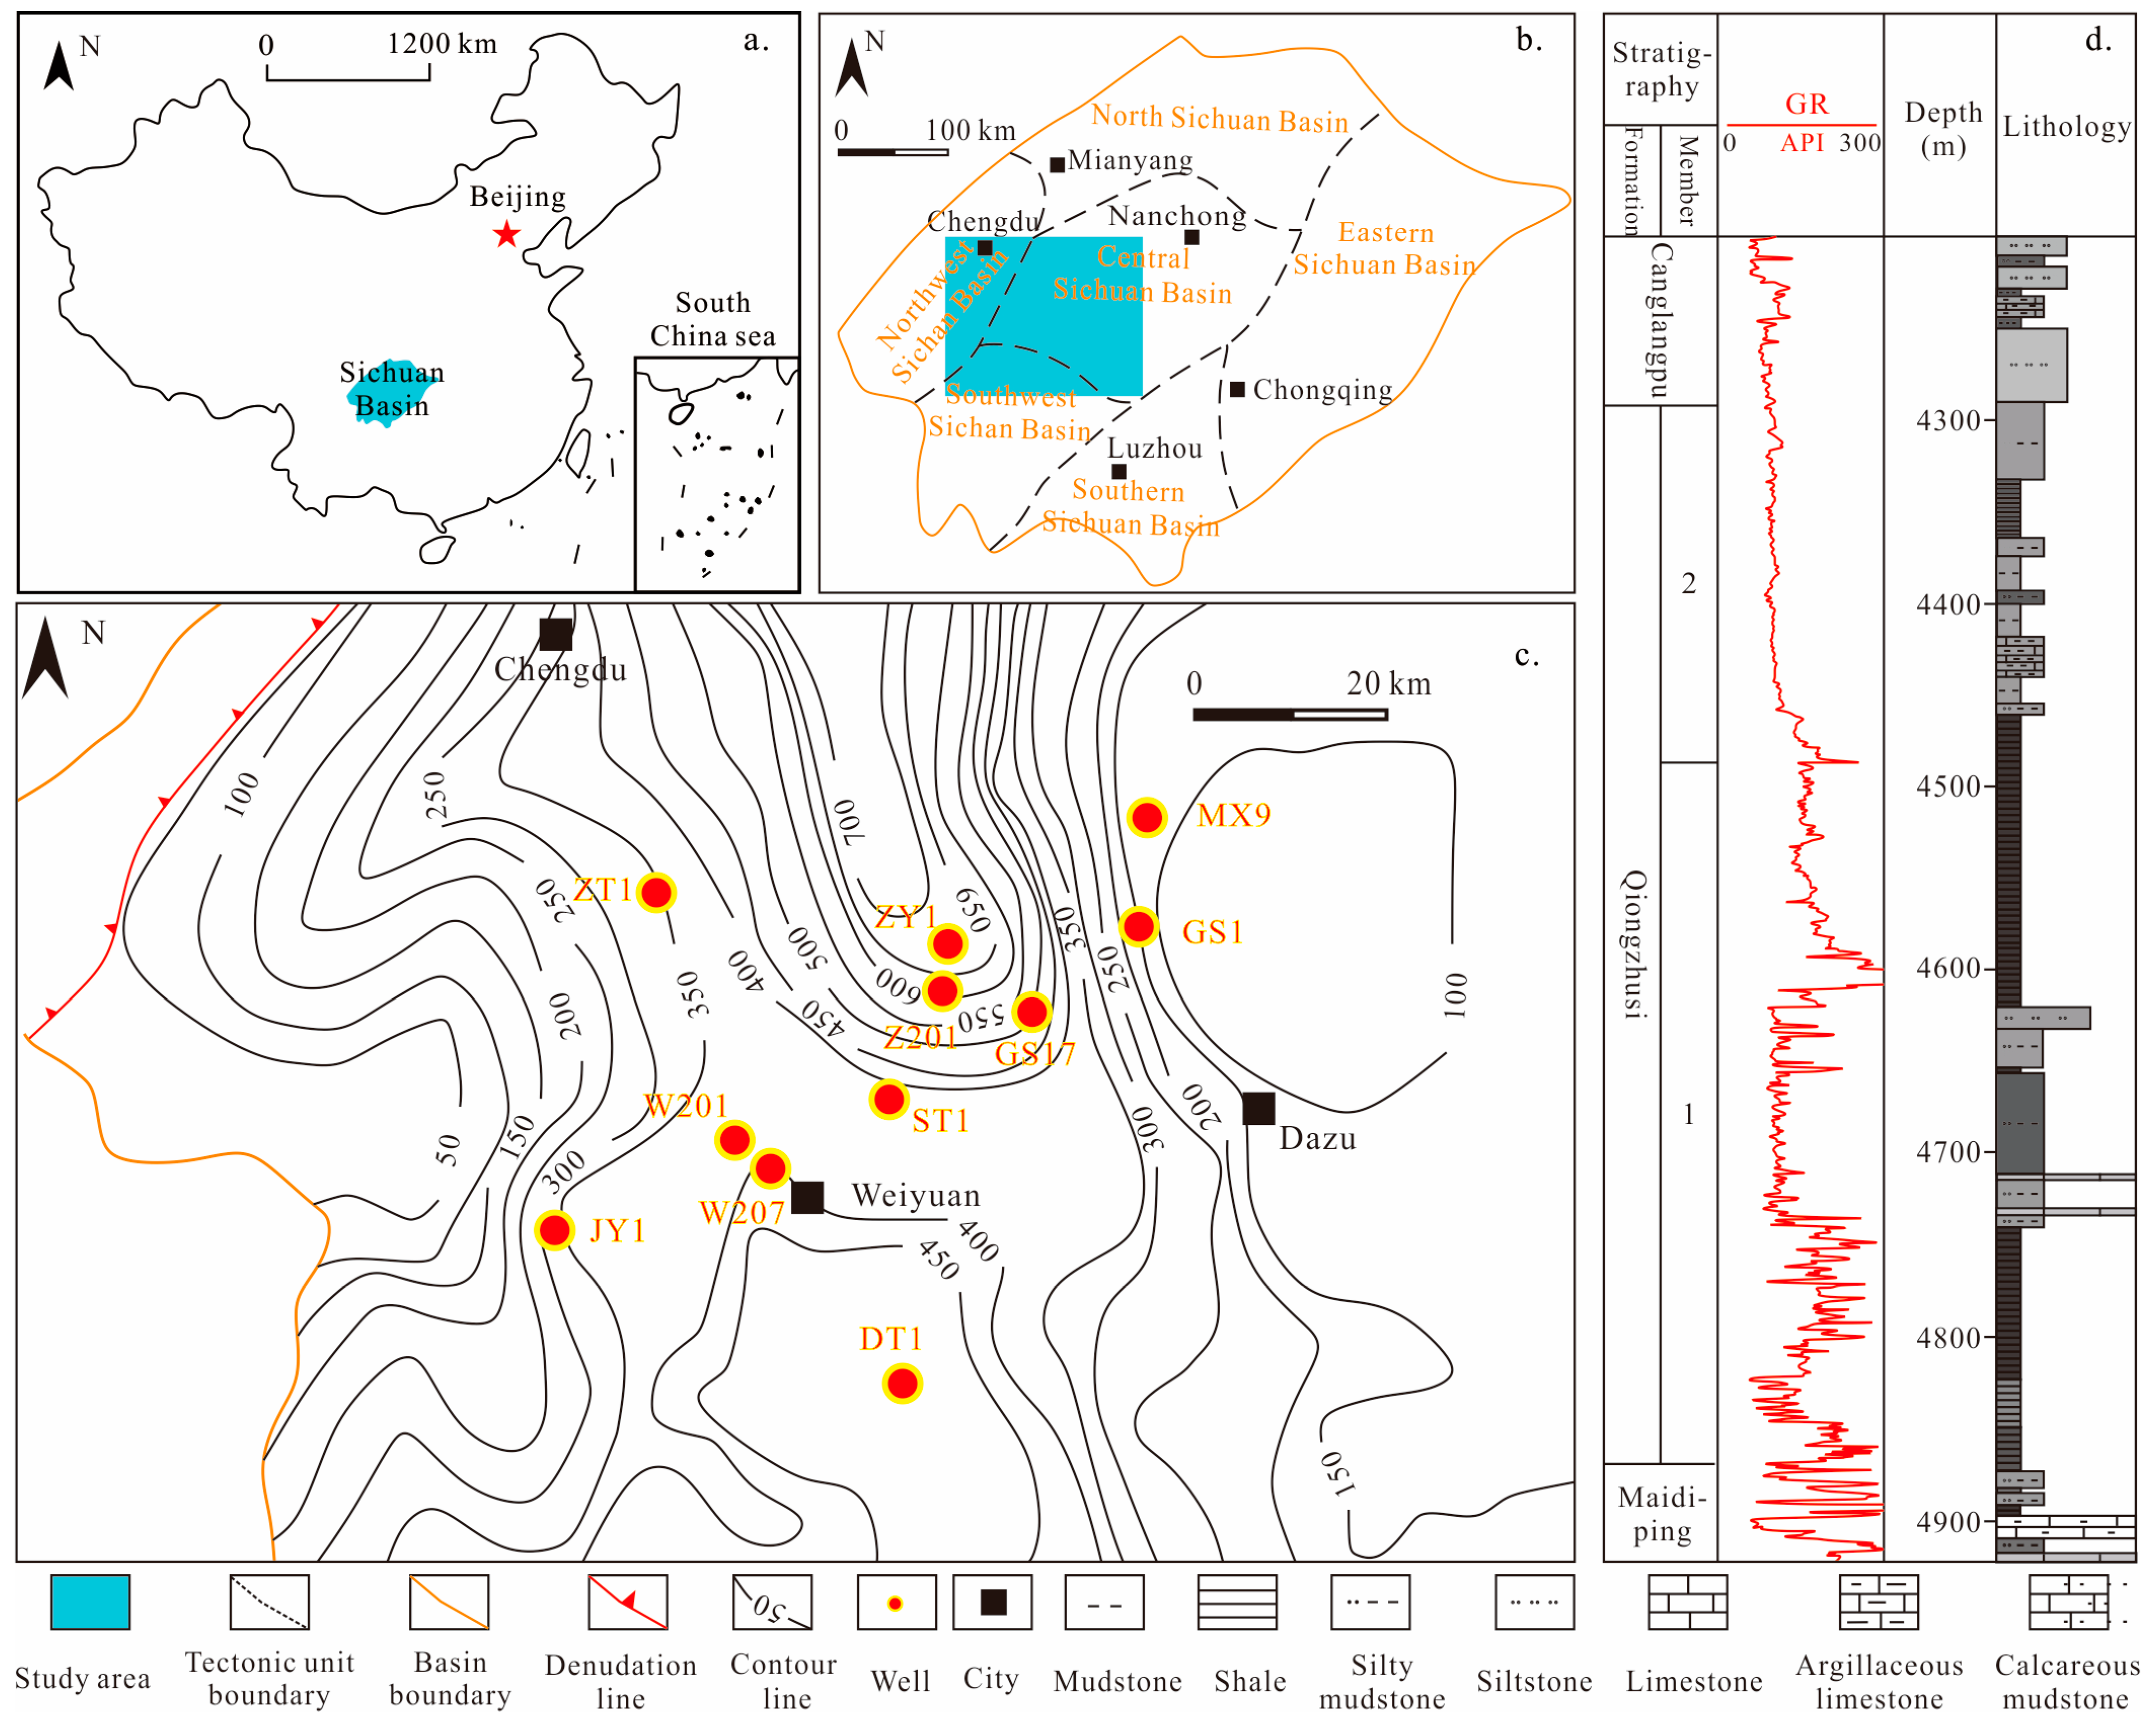
2. Geological Setting

The Sichuan Basin, located in southwestern China, covers an area of approximately 18 × 104 km2 (Figure 1a). It is a large, superimposed petroleum basin developed on a craton and has undergone multiple tectonic movements [18,19,20,21,22]. The basin can be divided into six primary tectonic units (Figure 1b). The Sichuan Basin is rich in petroleum resources, with a proven geological resource reserve of 38.18 × 10¹² m3 of natural gas. Among them, conventional gas accounts for approximately 12.47 × 10¹² m3, tight gas accounts for approximately 3.98 × 10¹² m3, and shale gas at depths shallower than 4500 m accounts for approximately 21.74 × 10¹² m3 [23,24]. It is the basin with the richest natural gas resources in China. The Zizhong area is located in the central part of the Sichuan Basin (Figure 1b), and the main body is located in the Deyang–Anyue rift trough. It is currently the primary block for shale gas exploration and development in the Qiongzhusi Formation [25].
The target formation of this study is the Qiongzhusi Formation shale, which has a thickness of 50–750 m in the research area. The shale in the Qiongzhusi Formation exhibits the characteristic of being thicker in the middle and thinner on the sides when viewed from east to west (Figure 1c). The Qiongzhusi Formation can be divided into two sections, namely Qiong 1 and Qiong 2. The lithology of the formation mainly consists of shale, mudstone, silt shale, and siltstone (Figure 1d).

3. Date and Methods

3.1. Date

In this study, we collected logging data from 9 wells in the research area. The data included caliper (CAL), neutron (CN), spontaneous potential (SP), density (DEN), acoustic travel time (AC), and resistivity (RT). Additionally, we obtained measured formation pressures [26,27] and the Ro value from the laser Raman inverse calculation of the Qiongzhusi Formation bottom boundary reservoirs from these 9 wells. To accurately calculate the reservoir overpressure value, we selected mudstones with a thickness exceeding 5 m and obtained the average value from their logging data.

3.2. Methods

3.2.1. Anomalous Pressure Prediction

To accurately predict the pressure of the Qiongzhusi Formation in the study area, this research employed the equivalent depth method, Eaton method, and Bowers method. The logging data utilized in this study were obtained from the Southwest Petroleum Field Branch of China National Petroleum Corporation. Furthermore, to enhance the accuracy of the predicted pressure values for the Qiongzhusi Formation, the aforementioned methods were calibrated using measured pressure data.
(1)
The equivalent depth method
The equivalent depth method posits that the acoustic time-difference curve exhibits a distinct compaction trend line within normally compacted strata [10,28,29,30]. This method assumes that, in normally compacted strata, the acoustic time-difference curve follows this clear compaction trend, while in abnormally compacted areas, the curve often deviates from the established trend. If the acoustic time difference between a point in the abnormally compacted zone and a point in the normally compacted zone is equal, and both points possess identical pore structure characteristics and compaction degrees, they are considered equivalent. Consequently, it can be inferred that the effective stress at the point in the abnormally compacted zone is equal to that at the point in the normally compacted zone. Therefore, the formation pressure in the abnormally compacted zone can be derived from the measurements at the point in the normally compacted zone.
(2)
Eaton method
The Eaton method was developed by Eaton [14,31,32] while analyzing the intrinsic relationship between formation pore pressure and logging parameters, such as acoustic time difference, in regions like the Gulf of Mexico. This method parallels the equivalent depth method in that it constructs a normal compaction trend line based on the theory of normal compaction and introduces a compaction correction factor (C), modeled as follows:
P p = P 0 P 0 P n V n ÷ V s C
where Pp is the abnormal pore pressure, MPa; P0 is the overlying formation pressure, MPa; Pn is the normal formation pore pressure, MPa; Vn, Vs are the acoustic time difference between the normal and abnormal formations, μs/m; and C is the compaction correction factor.
(3)
Bowers method
Bowers [33,34] found that there is a curvilinear relationship between sonic velocity and effective stress for normal and unbalanced compaction-induced pressure anomalies in strata, and that the relationship between effective stress and sonic velocity is:
V = 1500 + A σ B
where V is the velocity, m/s; σ is the effective stress, MPa; and A and B are virgin-curve parameters.
The empirical relation for the unloading curve is:
V = 1500 + A σ m a x σ / σ m a x 1 / U B
where U is the coefficient, dimensionless; σmax is the effective pressure at the starting point of the unloading curve, MPa.
σ m a x = V max 1500 / A 1 / B
where Vmax is the velocity at the onset of unloading, m/s.

3.2.2. Evaluation Methods for Overpressure Contribution

In order to quantify the contribution of different overpressure genesis to reservoir overpressure, the evaluation method of overpressure contribution established by Zhang et al. [35] was used in this study. According to the study by Zhang et al. [36], the pressurization resulting from disequilibrium compaction can be determined by calculating the equivalent depth of density. Furthermore, the pressure increment due to pressure transmission can be calculated by assessing the difference between the loading curve and the effective stress using the Bowers method [37,38].

4. Results and Discussion

4.1. Overpressure Distribution Characteristics

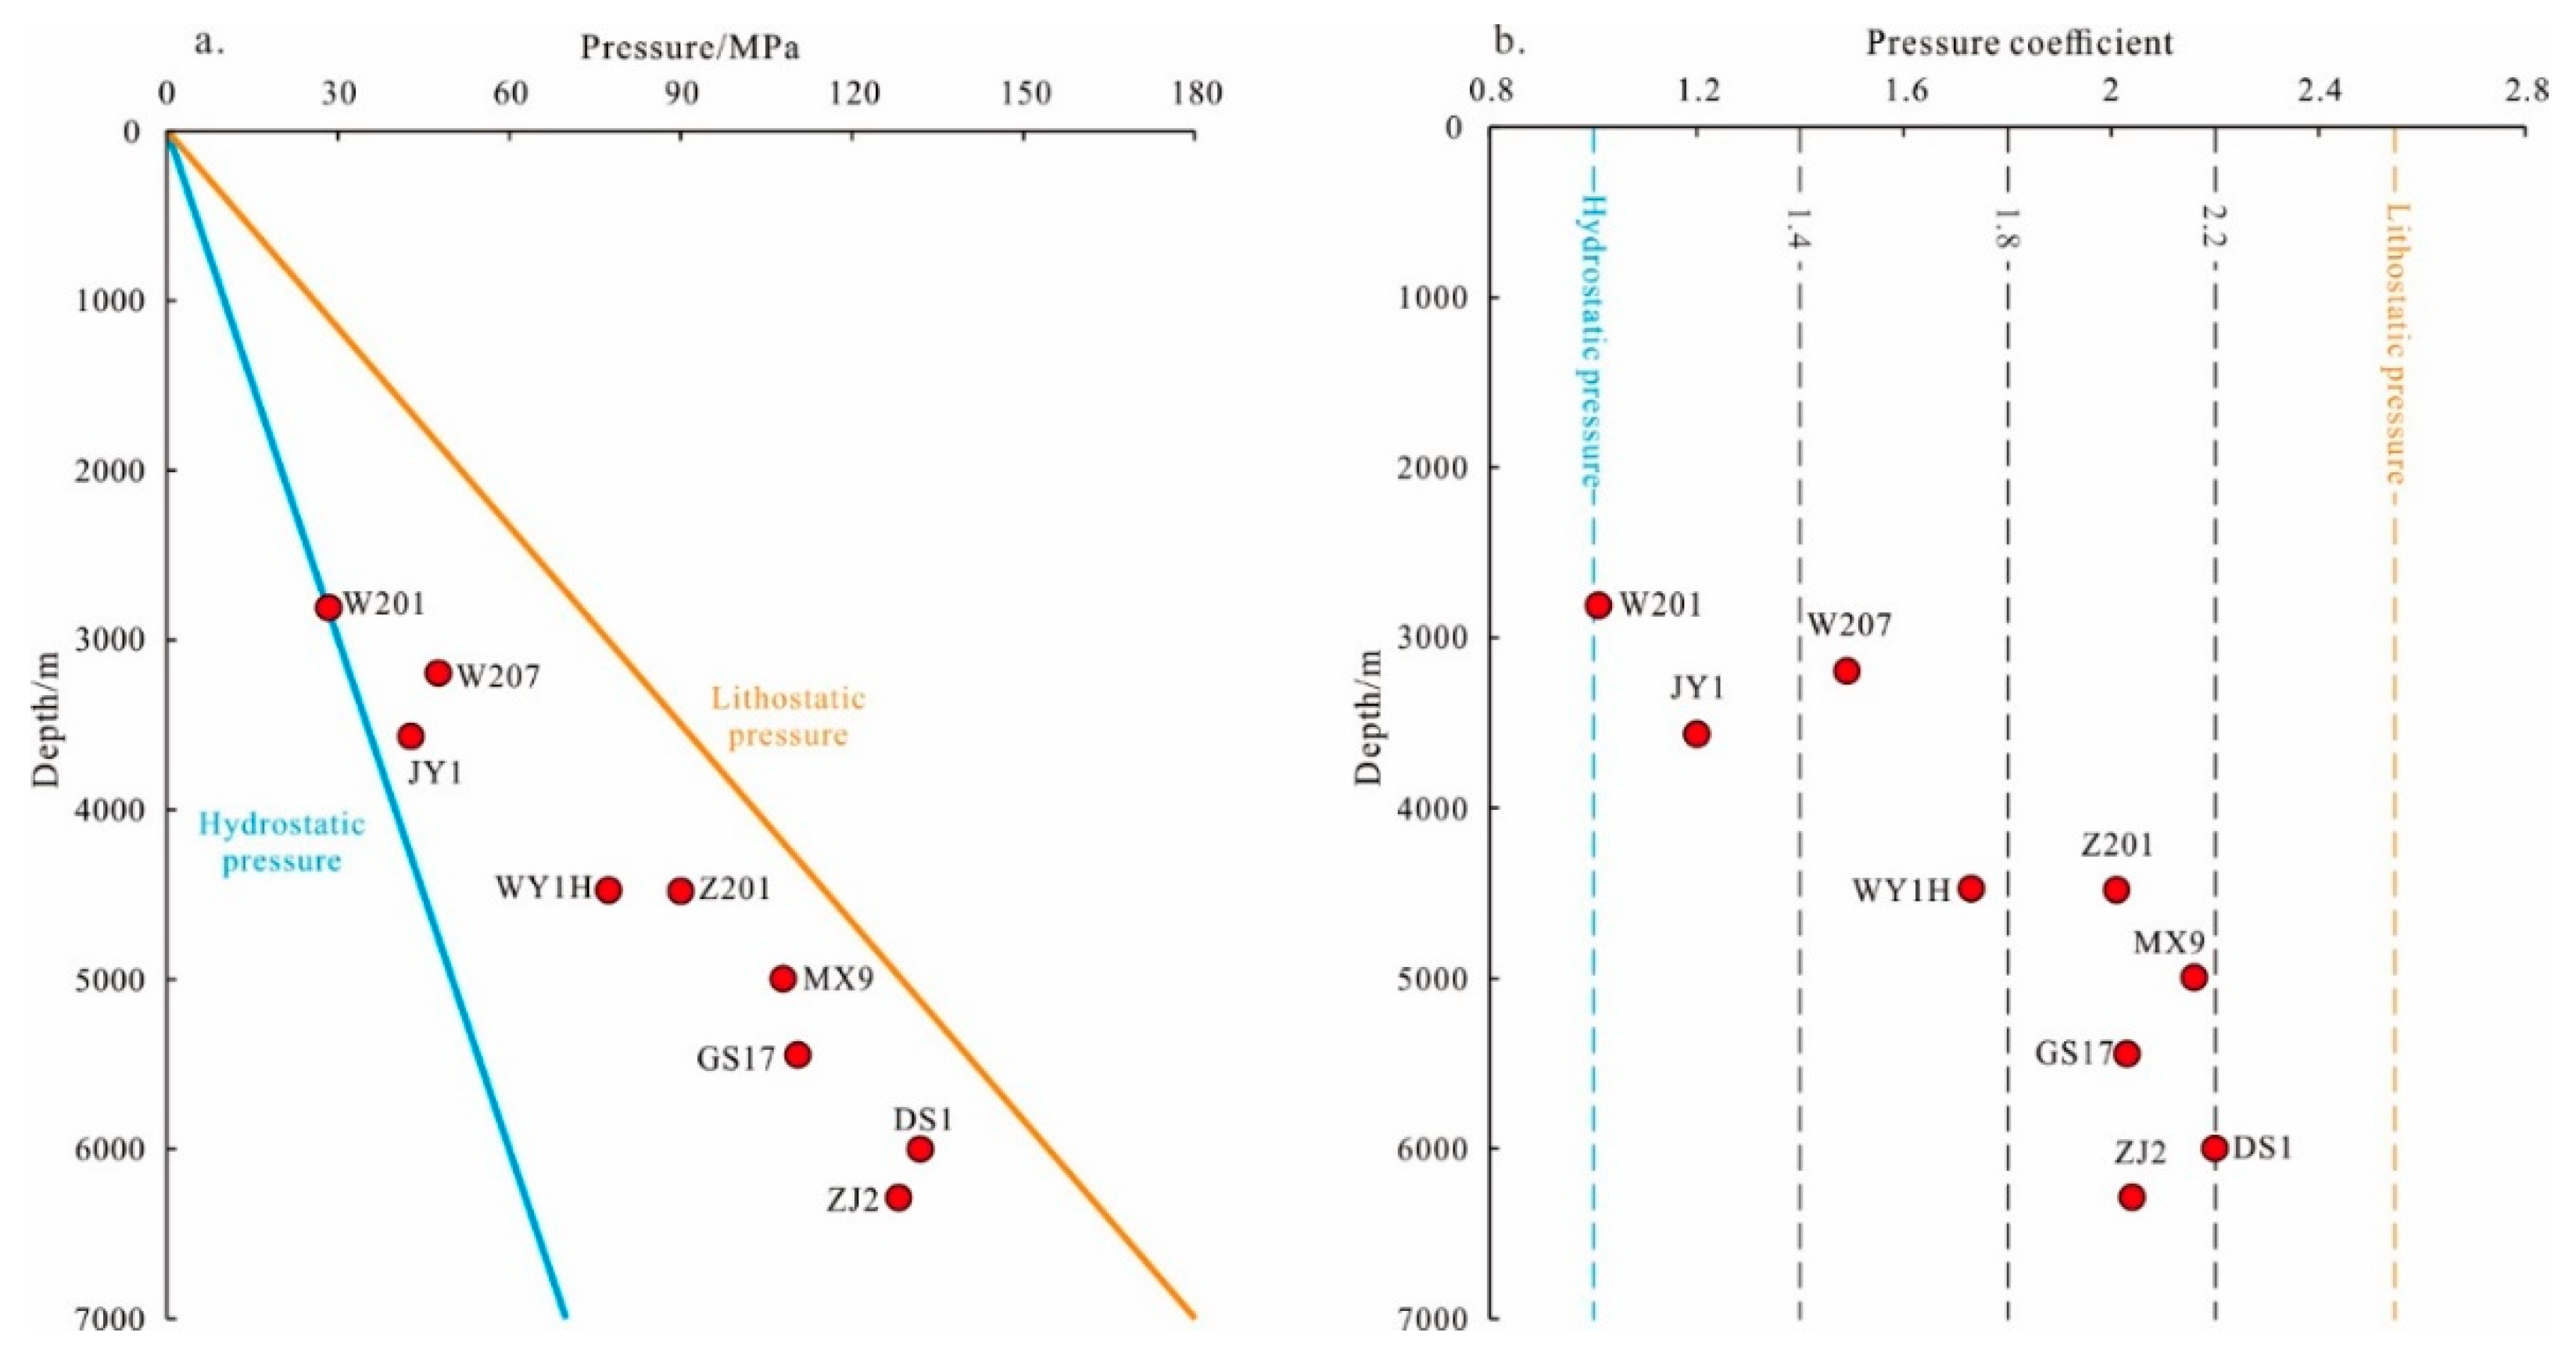
4.1.1. Pressure Characteristics

Figure 2 illustrates the pressure characteristics of the Qiongzhusi Formation. The pressure distribution within the Qiongzhusi Formation ranges from 28.38 to 128.23 MPa, with an average of 84.99 MPa. The pressure coefficient varies between 1.01 and 2.2, with an average of 1.76. Furthermore, a strong positive correlation exists between the burial depth of the Qiongzhusi Formation and both the reservoir pressure and the pressure coefficient.

4.1.2. Pressure Prediction Results

Measured pressure values provide only discrete data points; in contrast, logging-based methods can yield continuous pressure profiles [36,37,38,39]. Therefore, this study employed the equivalent depth method, the Eaton method, and the Bowers method to calculate the pressure of the Qiongzhusi Formation. To obtain continuous formation pressure profiles, we refined the logging prediction models using measured values and assessed the accuracy of these models. The results are presented in Table 1.
According to Table 1, the error rate of the equivalent depth prediction for the pore pressure of the Qiongzhusi Formation ranges from 4.63% to 9.38% (average = 6.14%). The error rate for the Eaton method model prediction is between 0.18% and 4.77% (average = 2.58%). The error rate for the Bowers method prediction ranges from 0.07% to 6.31% (average = 3.63%). Moreover, the prediction accuracy for well MX9 is higher than that of the Eaton method. This indicates that the Eaton method is the most effective approach for predicting the pore pressure of the Qiongzhusi Formation.
Based on the Eaton and Bowers methods, the pressure distribution characteristics of 8 drilling wells in the study area were predicted. The results indicated that the formation pressure of the Qiongzhusi Formation exhibited a pattern of “increase–decrease–increase–decrease–decrease–increase–decrease–increase–increase–decrease–increase–decrease–increase–decrease” as burial depth increased. The pressure coefficient of the 2 subsection of Qiong1 (Qiong12) was the highest, followed by the 1 subsection of Qiong1 (Qiong11), while the pressure coefficient of the second subsection (Qiong2) was the lowest (Figure 3).

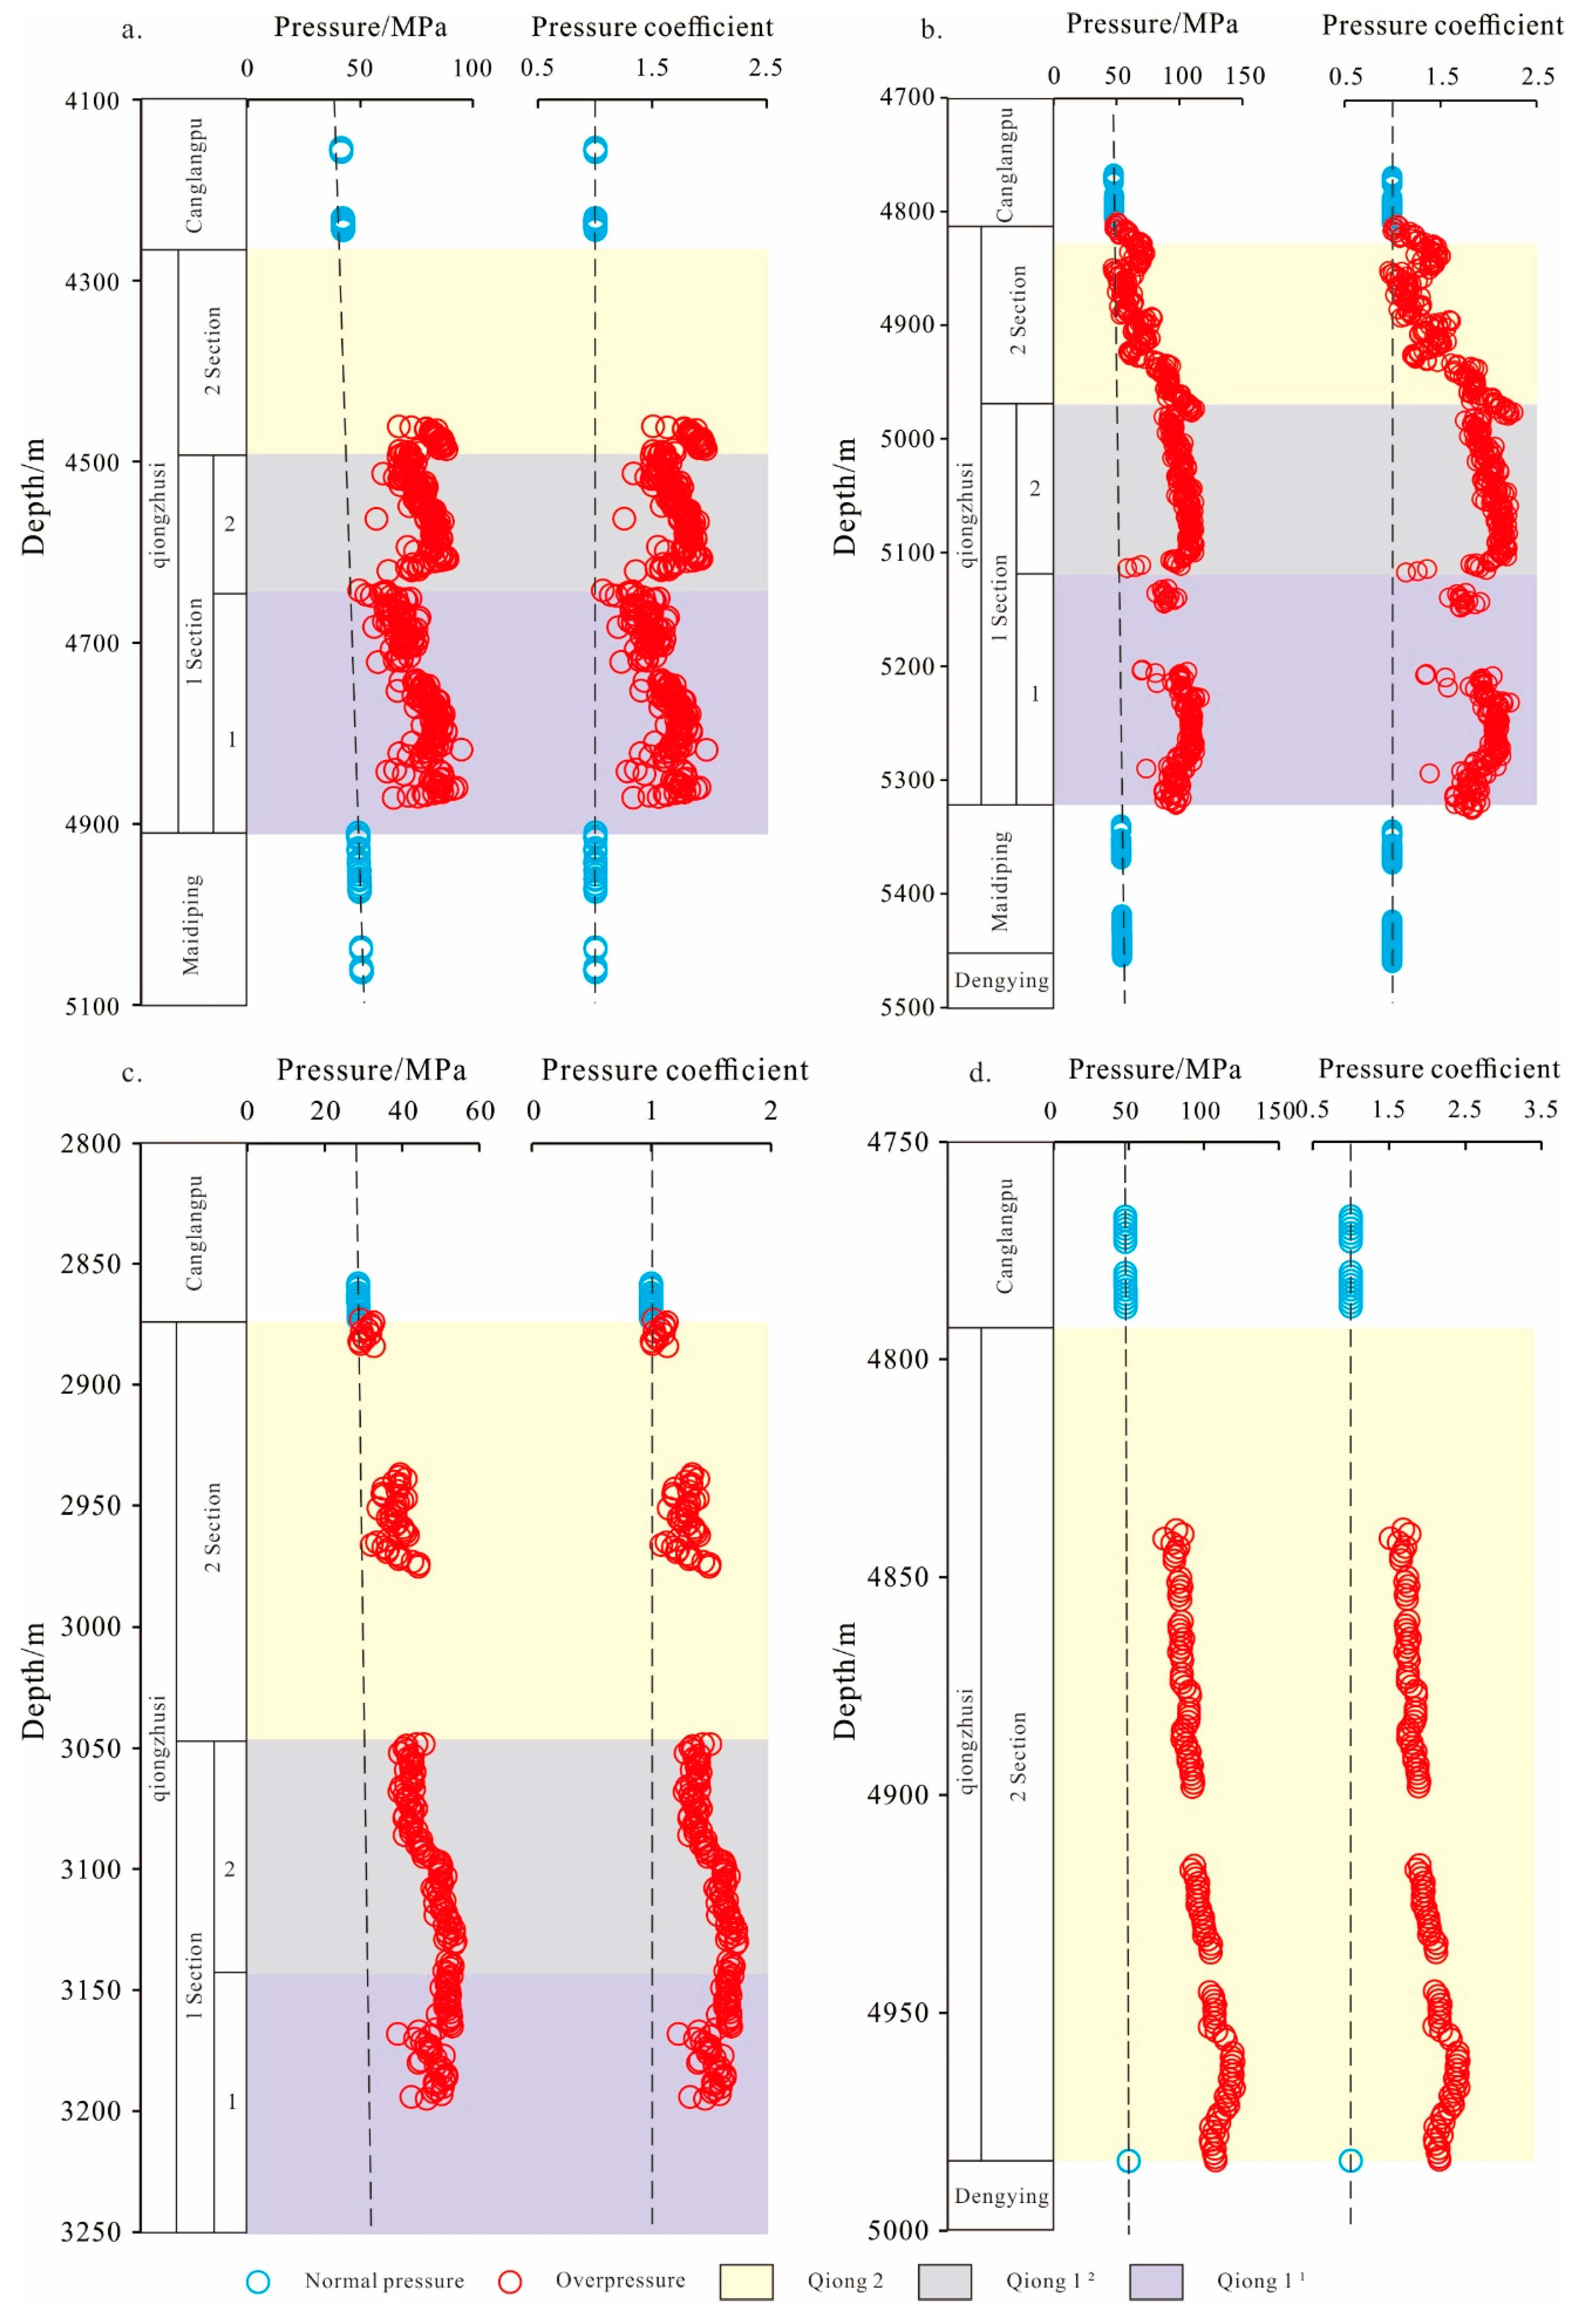
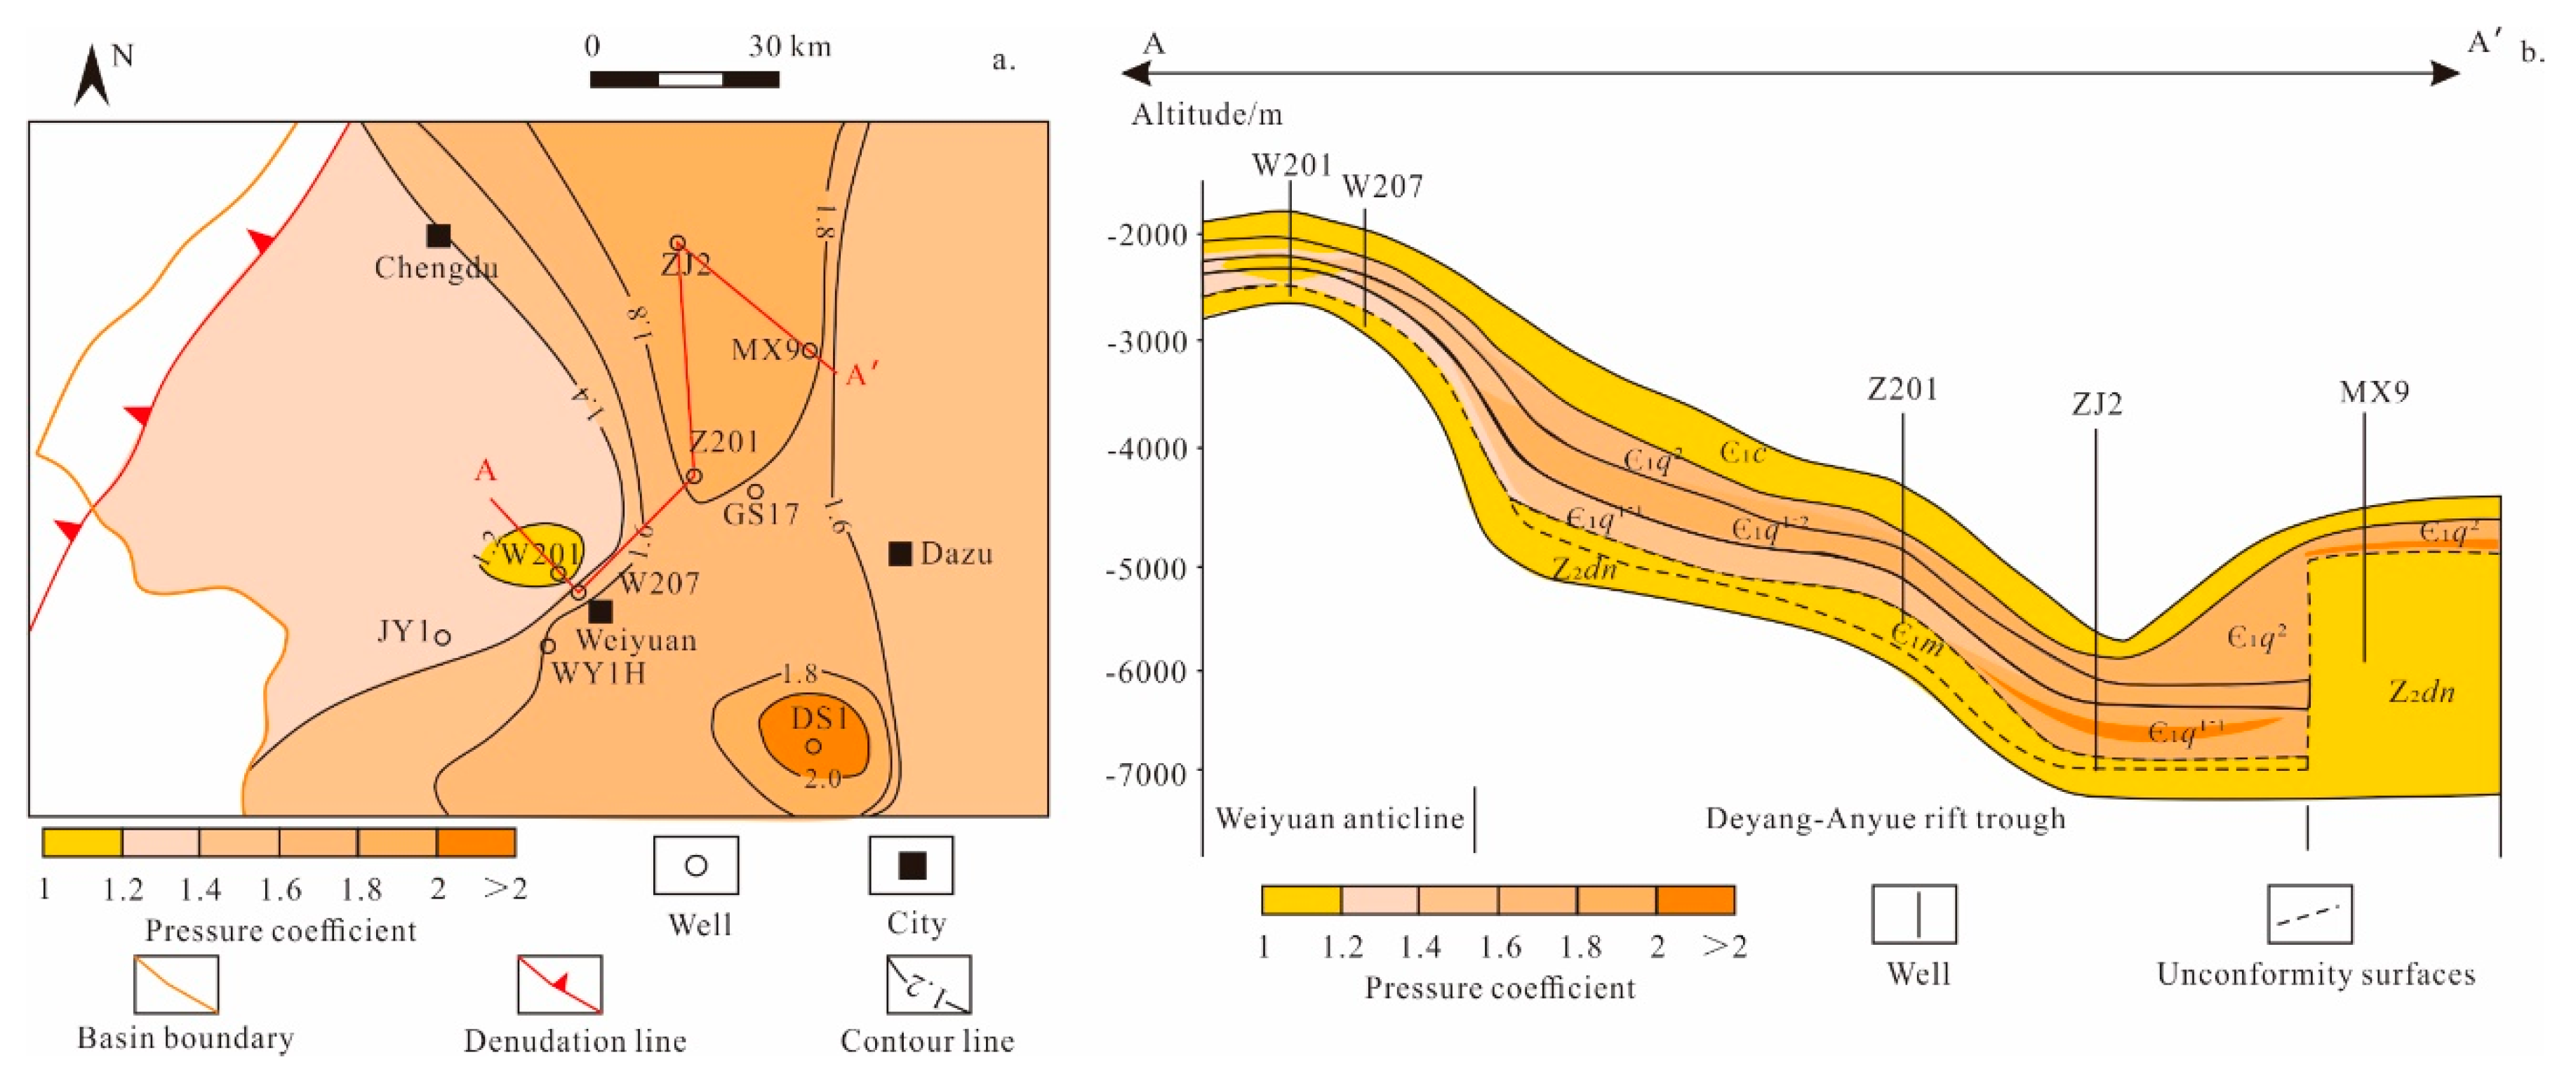
4.1.3. Pressure Distribution Characteristics

Based on the predicted pressure of the Qiongzhusi Formation, contour maps depicting the pressure coefficient of this formation were constructed (Figure 4a,b), where the pressure coefficient values represent the average for the entire Qiongzhusi Formation. According to Figure 4, the pressure coefficient for the Qiongzhusi Formation ranges from 1.01 to 2.05, exhibiting a pattern characterized by higher values in the northern and southern regions, lower values in the central region, and varying elevation in the eastern and western regions (Figure 4a). Vertically, the pressure coefficient of the Qiongzhusi Formation increases progressively with depth. Overall, the pressure coefficient within the Deyang–Anyue rift trough is approximately 1.8. The Deyang–Anyue rift trough is a well-developed section of the Maidiping Formation (Є1m), where the pressure coefficient of Qiong11 exceeds that of the areas where the Є1m is absent, indicating that favorable floor conditions are crucial for the pressure preservation of the Qiongzhusi Formation.

4.2. Origin of Overpressure

Previous studies have extensively investigated the causes of overpressure, which can be broadly categorized into five types: disequilibrium compaction, hydrocarbon generation from organic matter, overpressure transmission, tectonic compression, and clay mineral transformation [11,13,40]. However, since the research area is situated within the stable zone of the Sichuan Basin craton and is minimally affected by tectonic stress, this study does not account for pressure formation attributed to tectonic compression.

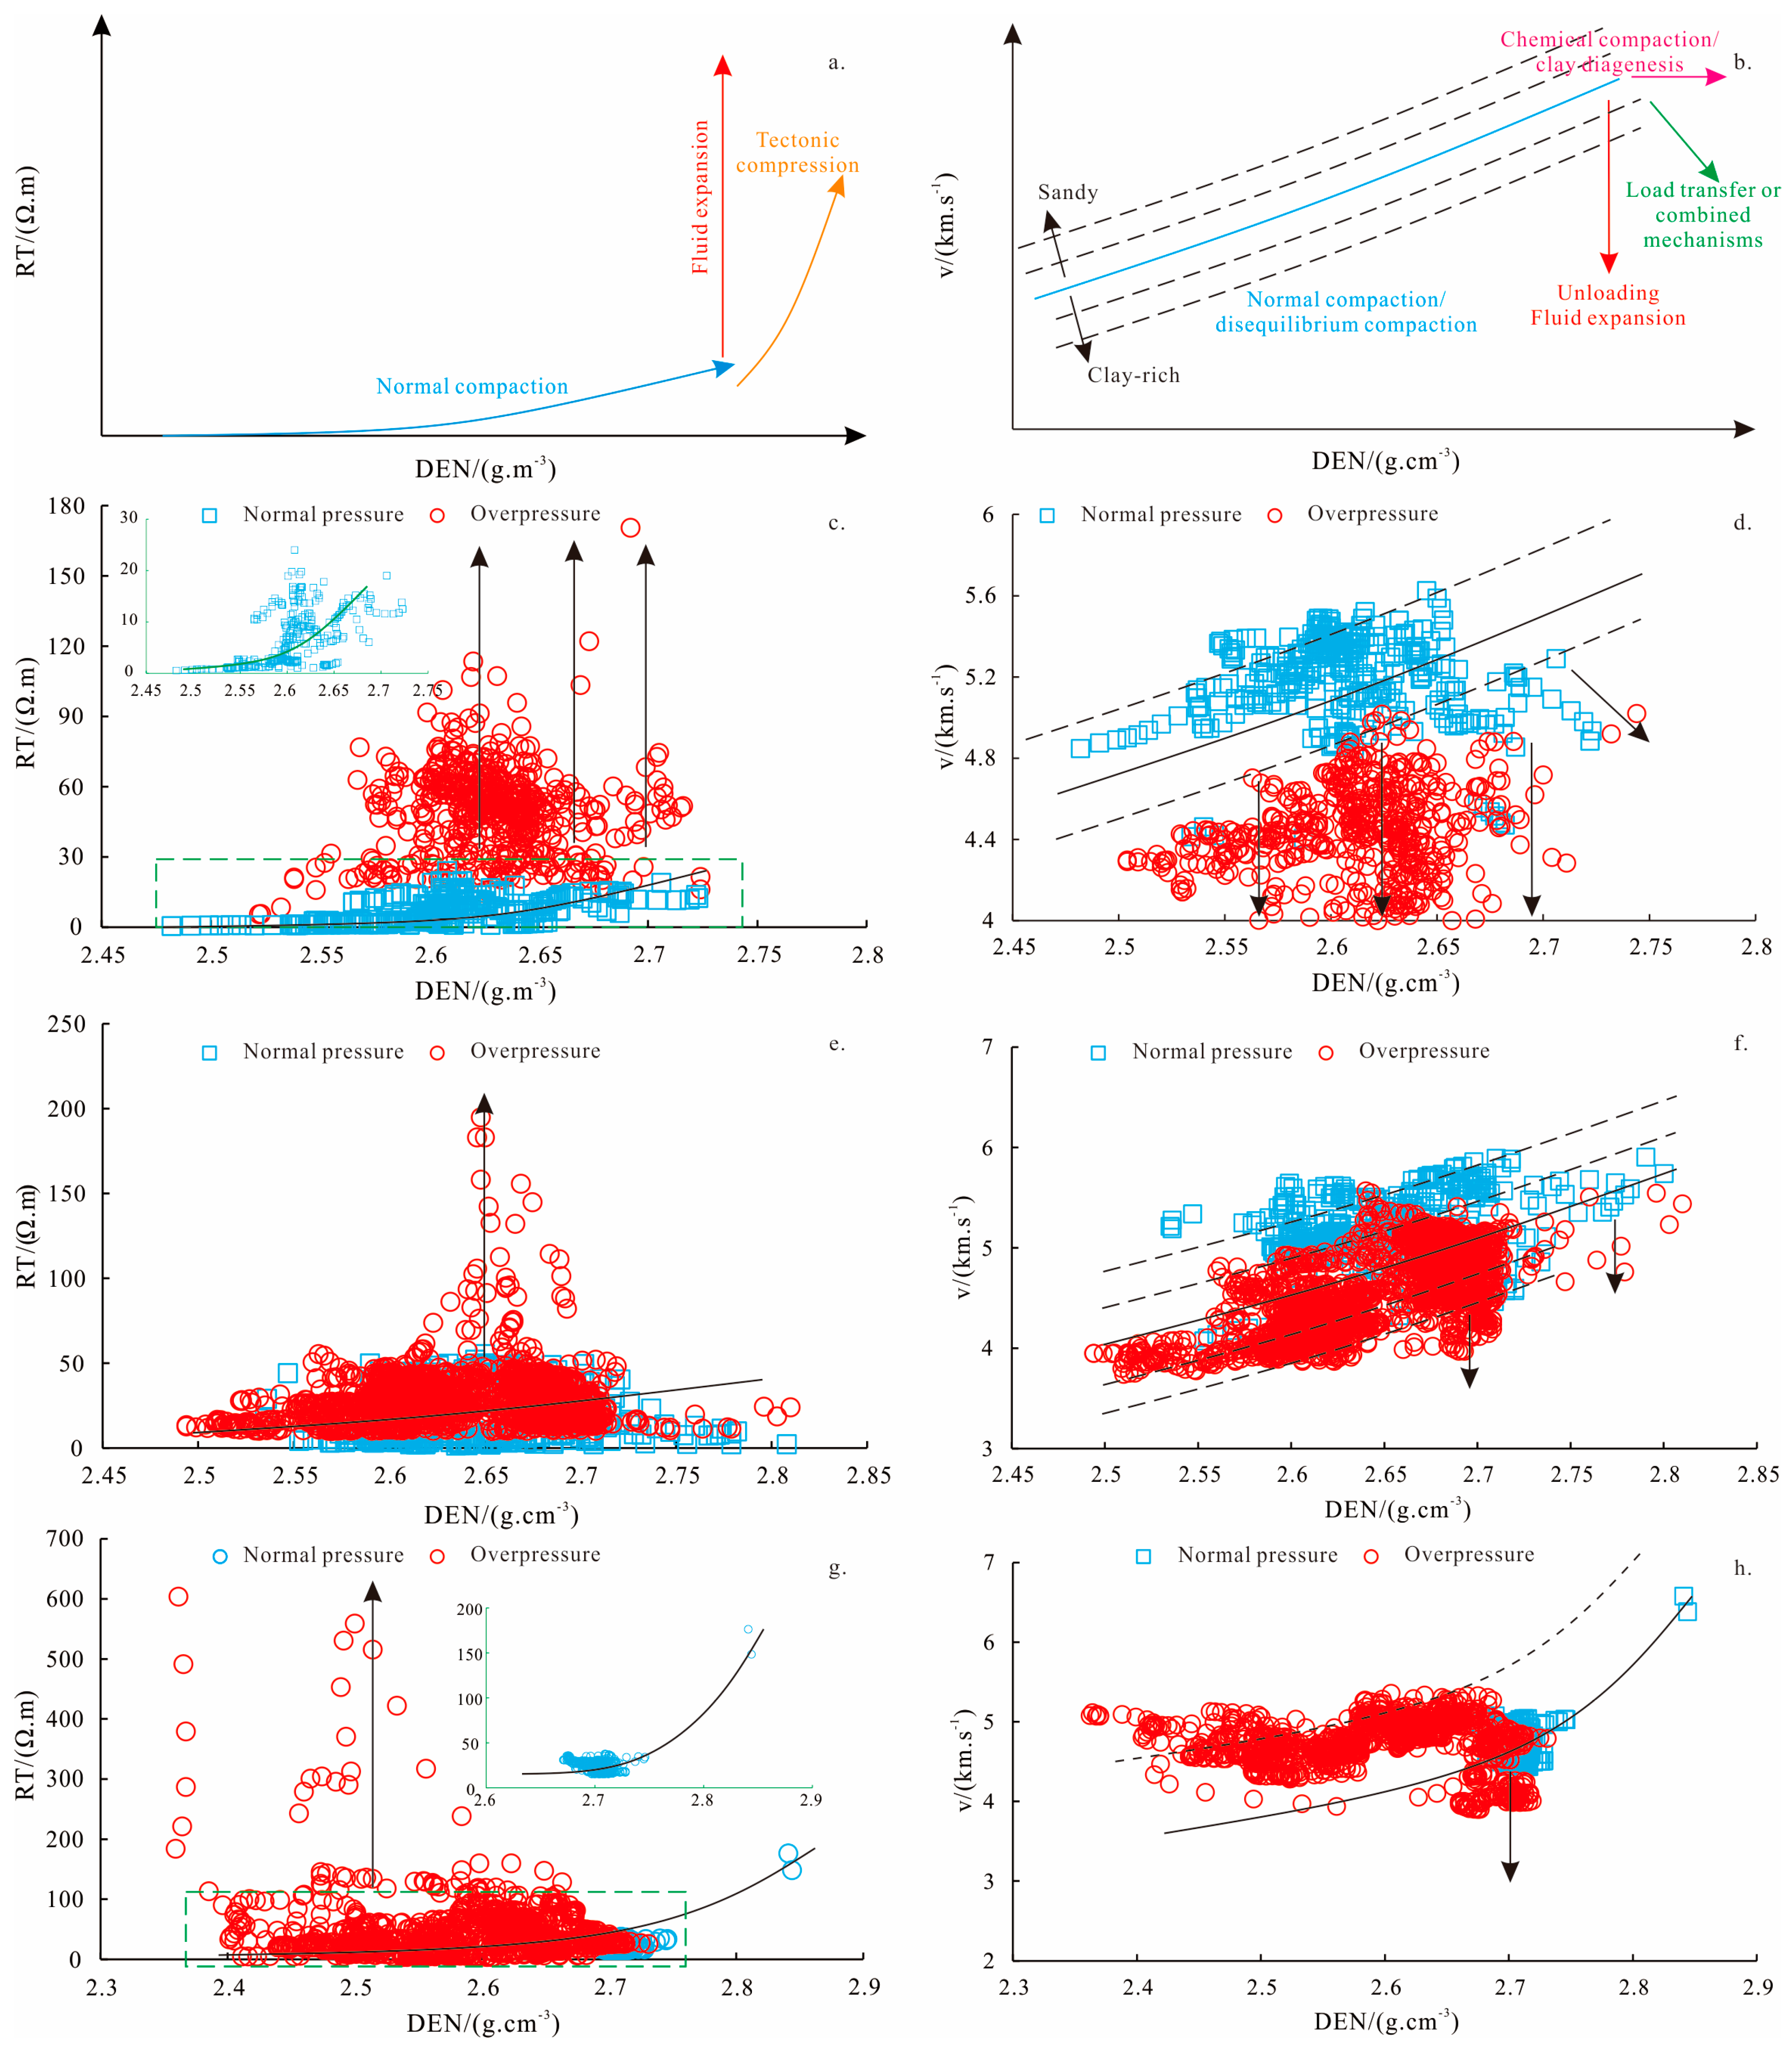
4.2.1. Logging Methods

Overpressure exhibits distinct response characteristics in the AC, RT, and DEN logging curves, enabling the use of logging parameter charts to identify its causes. Commonly utilized logging curve charts include the resistivity–density intersection chart (Figure 5a) and the sonic velocity–density intersection chart (Figure 5b). It is generally accepted that both normal and unbalanced compaction points align with the loading curve. Overpressure resulting from fluid expansion is characterized by high RT and low sonic velocity, while overpressure due to chemical compaction or clay diagenesis is marked by high DEN. Furthermore, overpressure associated with tectonic compression presents characteristics of elevated RT and DEN, while overpressure resulting from transmission or composite causes shows significant variations in sonic velocity and density [15,16,35,41,42].
In this study, we utilized the resistivity–density intersection chart and the sonic velocity–density intersection chart to analyze the overpressure genesis of Z201 (Figure 5c,d), GS17 (Figure 5e,f), and WY1H (Figure 5g,h) within the Deyang–Anyue rift trough. The results indicate that the overpressure observed in the Qiongzhusi Formation in Well Z201 is primarily attributed to fluid expansion. Most overpressure points in the GS17 and WY1H wells coincide with the normal compaction curve, while some overpressure points result from fluid expansion. This finding suggests that disequilibrium compaction significantly contributes to the overpressure in both GS17 and WY1H wells. Thus, the overpressure in the Qiongzhusi Formation is predominantly due to fluid expansion and disequilibrium compaction.

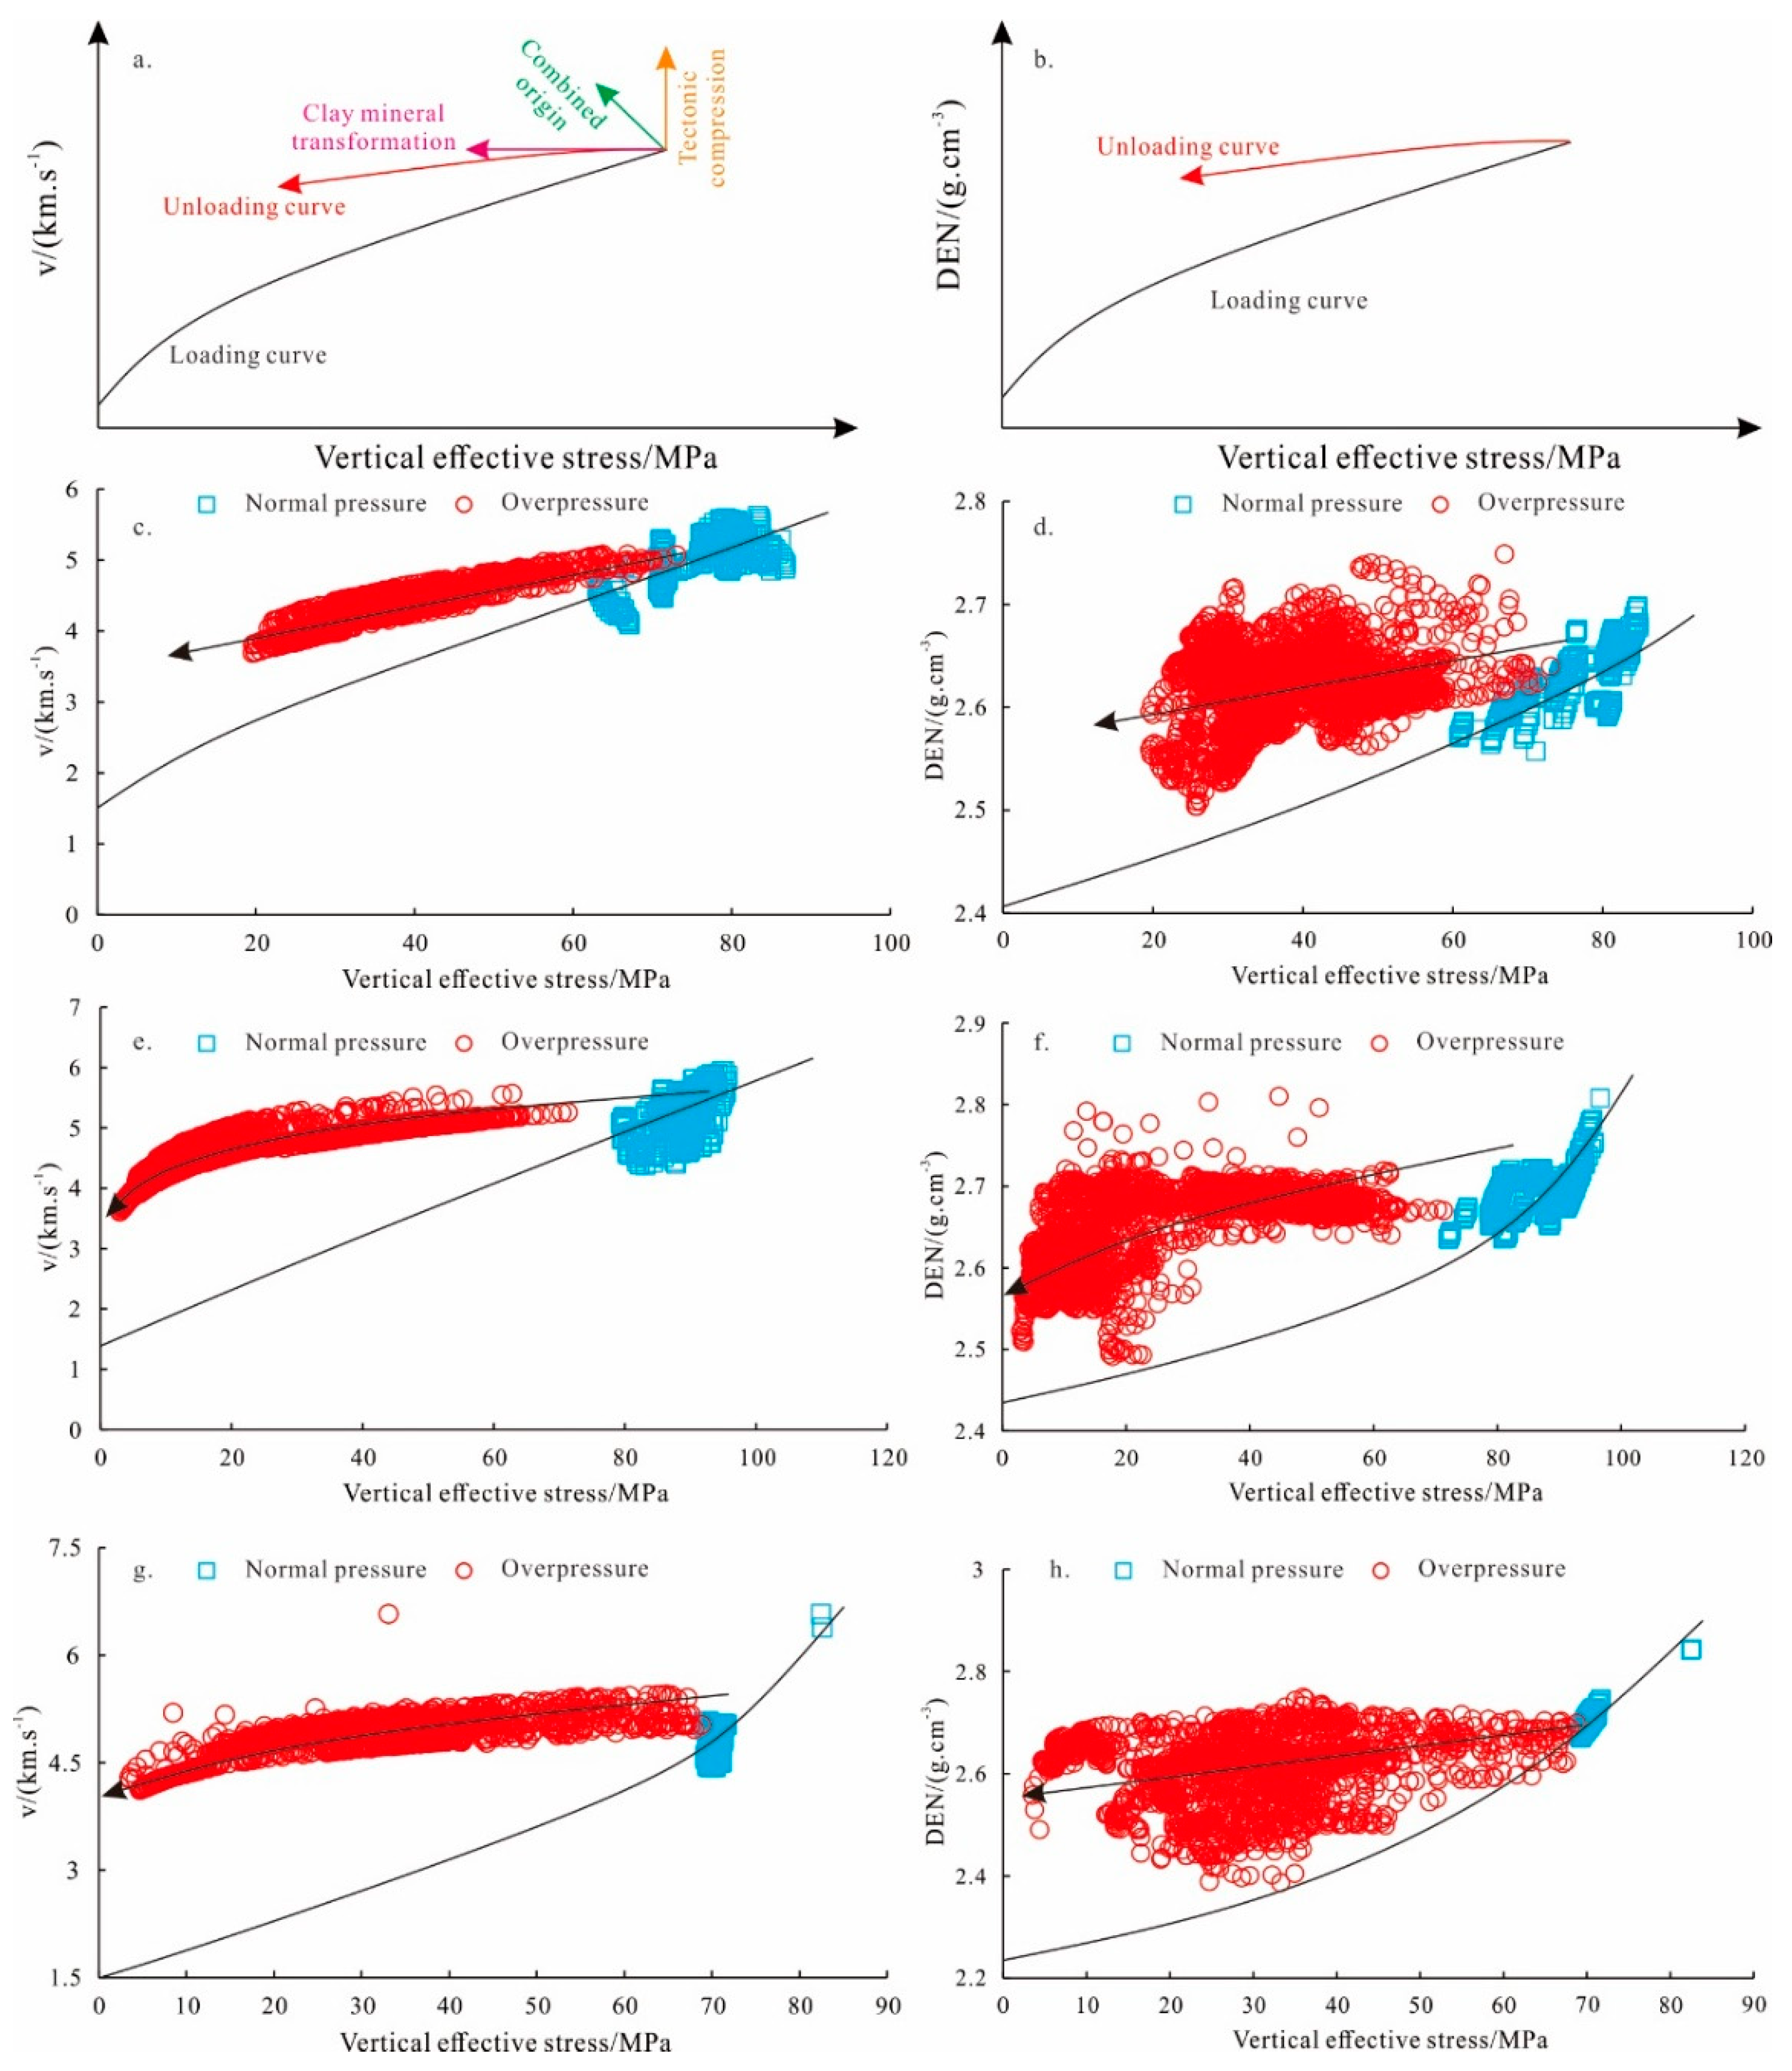
4.2.2. Bowers Method

In addition to the logging curve chart, the Bowers method serves as a crucial approach for determining the cause of overpressure [11,16,34]. This method relies on effective stress along with sonic or density logging data to construct loading and unloading curves (Figure 6a,b). It is understood that the overpressure response due to disequilibrium compaction is manifested in the loading curve, whereas fluid expansion, pressure transmission, and tectonic compression are represented in the unloading curve [8,37,43]. Utilizing vertical effective stress, sonic velocity, and DEN data, loading and unloading curves for Z201, GS17, and WY1H (Figure 6c–h) were constructed to elucidate the causes of overpressure in the Qiongzhusi Formation. The results indicate that the overpressure points in the Qiongzhusi Formation predominantly align with the unloading curve, suggesting that pressure transmission and fluid expansion are the primary drivers of overpressure in this formation. Furthermore, in the plots depicting DEN vs. vertical effective stress, a decrease in vertical effective stress corresponds to a reduction in the density of the shale in the overpressure section, indicating that disequilibrium compaction also plays a role in contributing to the overpressure of the Qiongzhusi Formation.
Previous studies have demonstrated that shale gas migrates within a shale reservoir [18,20]. Consequently, there is a contributory effect of overpressure transmission and fluid pressurization within the Qiongzhusi Formation. In summary, the overpressure in the Qiongzhusi Formation results from disequilibrium compaction, fluid expansion, and overpressure transmission.

4.3. Quantitative Evaluation of Overpressure in Different Genesis Types

The current pressure results from various geological factors throughout geological history [44,45]. Thus, in analyzing the mechanisms of overpressure formation, it is essential to quantitatively assess the contributions of different geological processes to abnormal pressure. The overpressure in the Qiongzhusi Formation arises from disequilibrium compaction, fluid expansion, and pressure transmission. The Sichuan Basin, influenced by the Himalayan Movement, underwent significant uplift, which led to a decrease in geothermal temperature and large-scale gas release, ultimately resulting in a reduction in the pressure coefficient of the Qiongzhusi Formation [46,47]. Consequently, this study quantitively analyzed the contributions of disequilibrium compaction, pressure transmission, uplift erosion unloading effect, and geothermal decline to the current pressure.

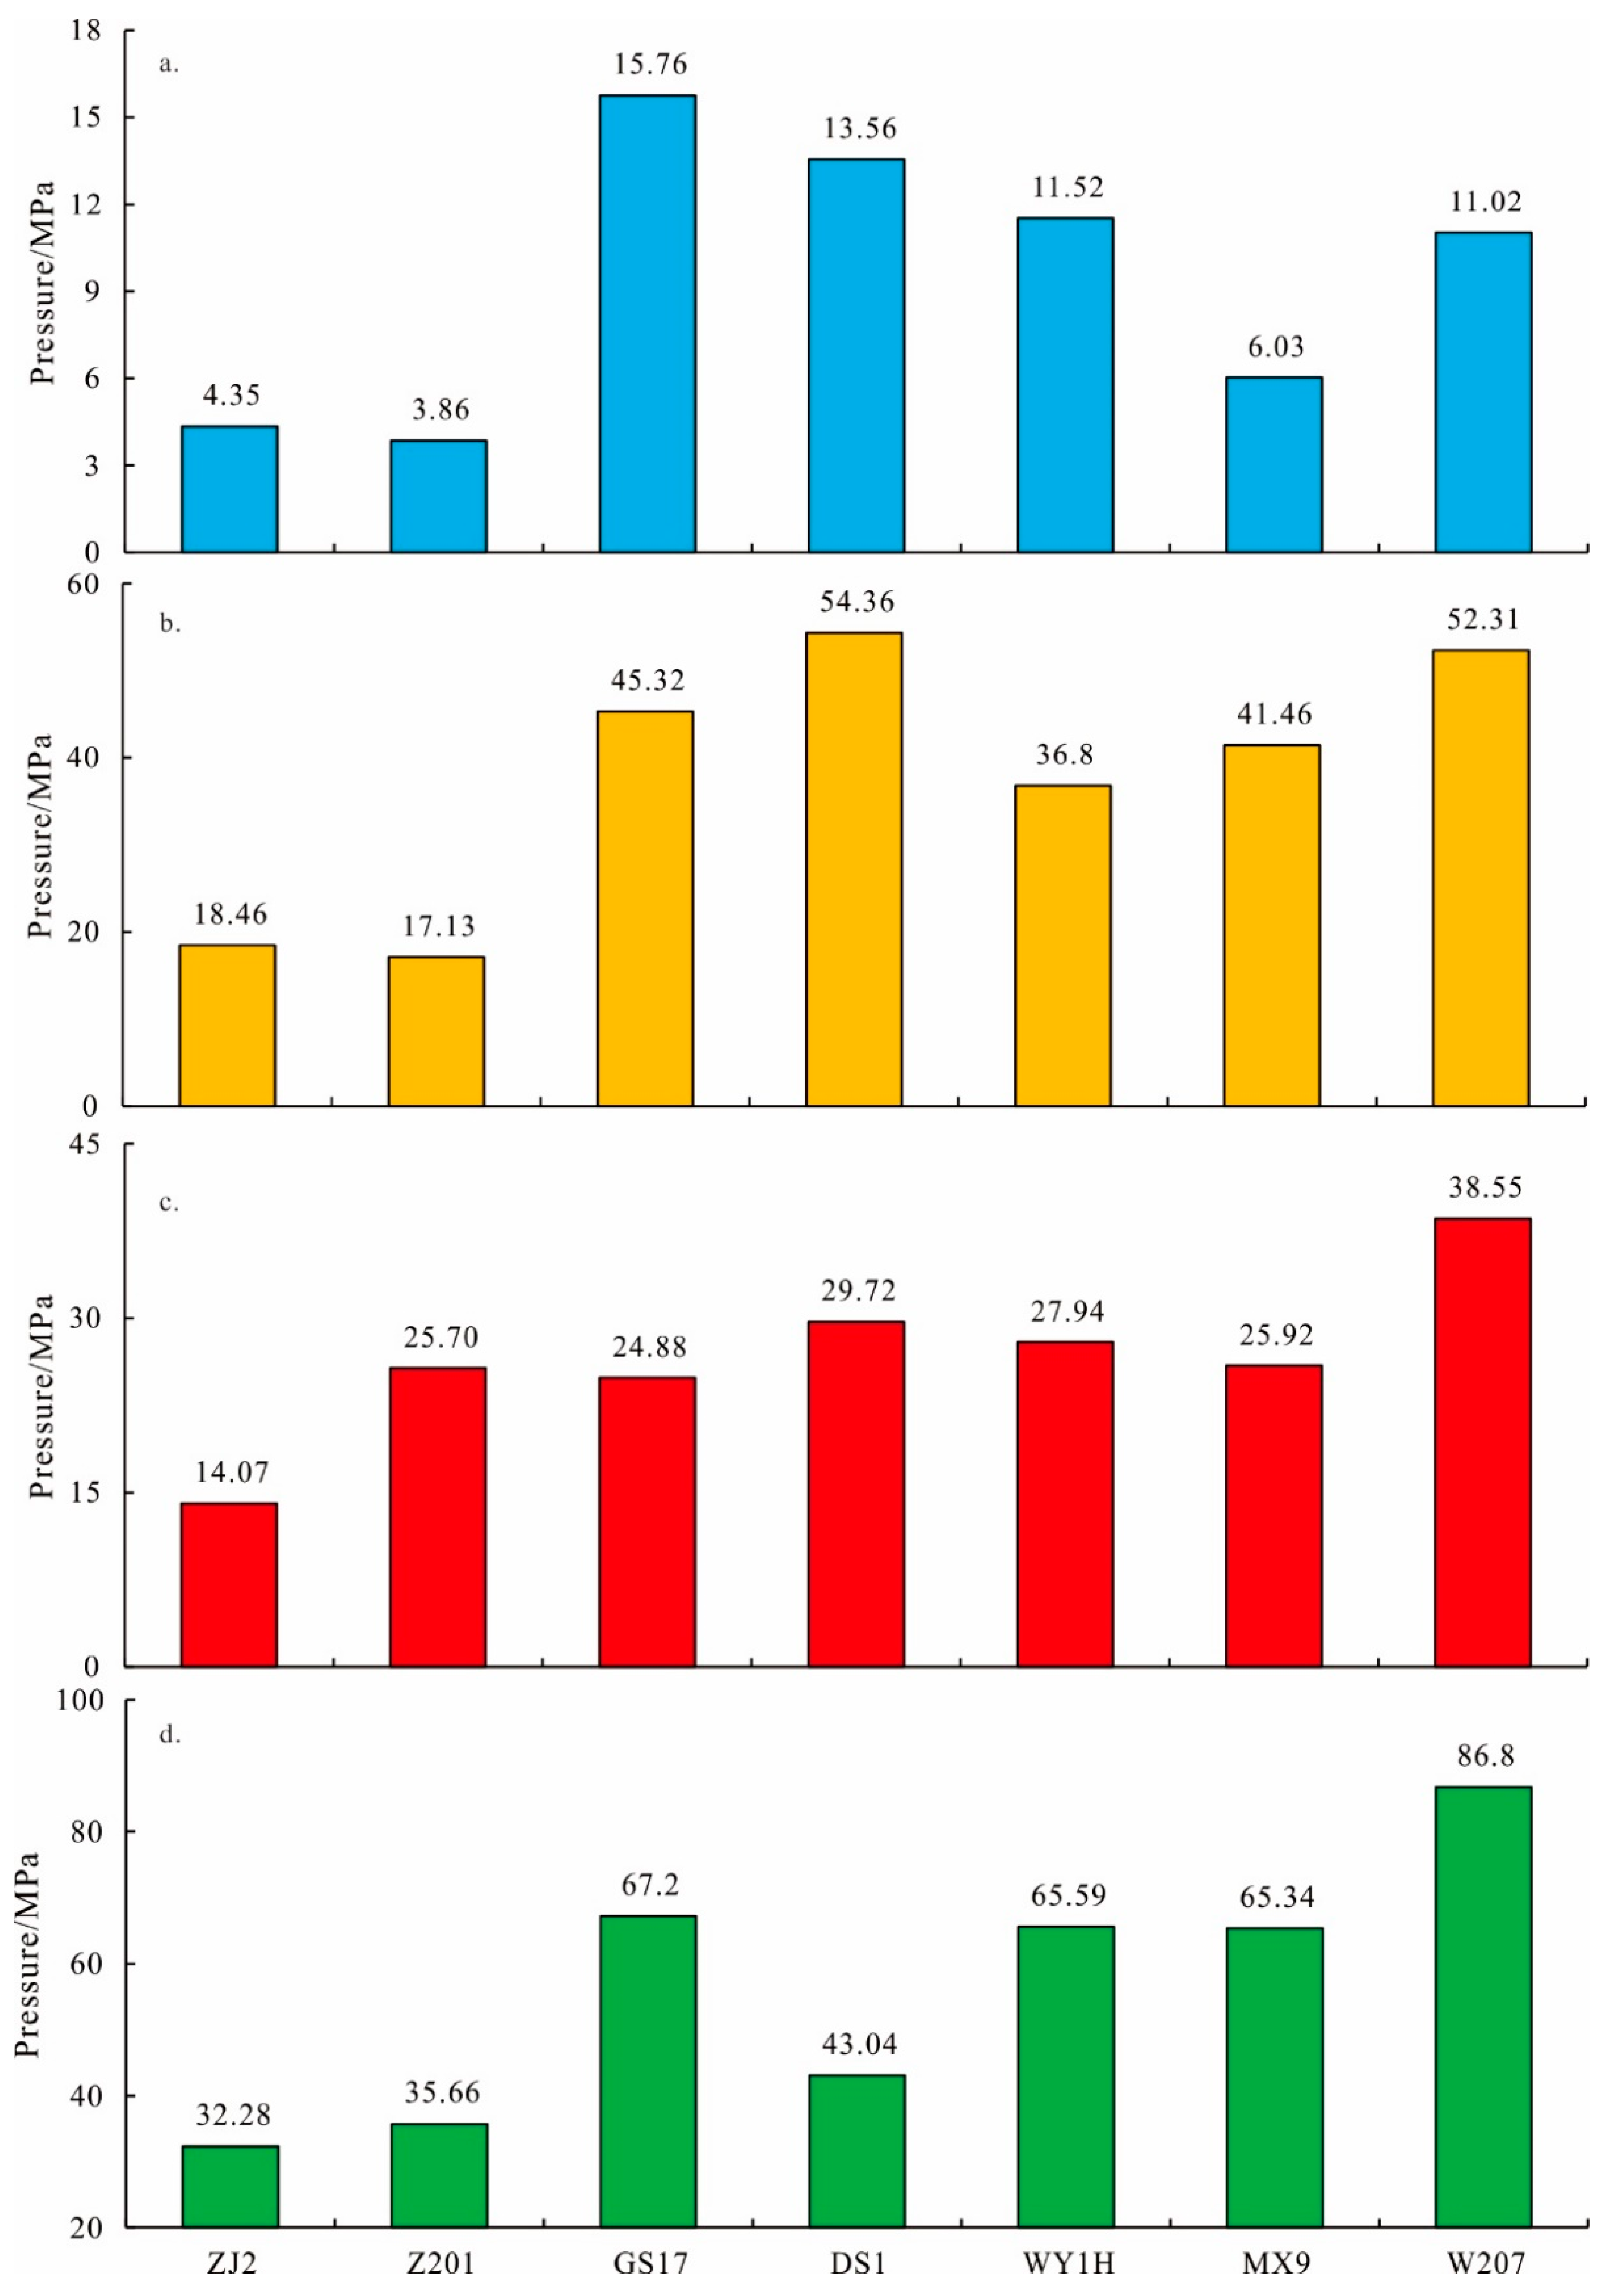
4.3.1. Disequilibrium Compaction and Pressure Transmission

The disequilibrium compaction arises from rapid sedimentation and compaction of the formation, which prevents timely fluid expulsion, resulting in suppressed pore volume compression and alterations in density and acoustic time difference curves. However, fluid expansion and pressure increases have a more pronounced effect on acoustic waves and a lesser effect on density. Therefore, the equivalent depth method for constructing density curves can be employed to quantitatively calculate the pressure increases resulting from disequilibrium [35,48,49]. Table 2 presents the pressure increases resulting from disequilibrium compaction in the Qiongzhusi Formation. The findings indicate that the pressure increase attributed to balanced compaction ranges from 3.86 to 15.76 MPa (average value = 9.44 MPa). Notably, Well Z201 exhibits the smallest pressure increase due to the disequilibrium compaction (Figure 7a).
Pressure transmission is an important mechanism contributing to pressure increase. Previous studies have indicated that the pressure increase resulting from overpressure transmission can be calculated using the sonic velocity vs. vertical effective stress diagram. An increase in overpressure transmission can lead to a reduction in effective stress within the formation, while a small decrease in acoustic velocity may cause overpressure data points to deviate from the loading curve. The difference in vertical effective stress before and after this change represents the increment of overpressure transmission [16,35,36]. Based on the acoustic velocity versus vertical effective stress diagram (Figure 6), the overpressure transmission and pressure increase in the Qiongzhusi Formation were calculated. The results demonstrated that the overpressure transmission and pressure increase ranged from 17.13 to 54.36 MPa (mean of 37.98 MPa). Well Z201 exhibited the smallest value at 17.13 MPa, while Well DS1 displayed the highest value at 54.36 MPa (Figure 7b).

4.3.2. Uplift Erosion Unloading Effect

The uplift erosion unloading effect is a key factor contributing to the abnormal low pressure observed in petroleum basins. As a result of the uplift erosion unloading effect, the pressure in the overlying rock layers decreases, leading to a rebound phenomenon in both the rock skeleton and the volume of reservoir fluid contained within it. During this rebound process, if the volume of fluid rebound in the reservoir is less than the volume of rock skeleton rebound, a relative increase in void space occurs, resulting in a decrease in pressure on the formation fluid and, consequently, a reduction in fluid pressure [50,51]. The pressure drop caused by the uplift erosion unloading effect can be quantitatively assessed using the following formula:
Δ P E = 1 3 1 + v 1 v C r C r + C w ρ r g Δ h
where ΔPE is the pressure drop caused by erosion unloading, MPa; v is the Poisson’s ratio of the rock; Cr is the compressibility coefficient of rock; Cw is the compressibility coefficient of water; ρr is the average density of eroded rock formations, g/cm3; g is the acceleration due to gravity; and Δh is the thickness of eroded rock formations, m. In this study, the value of v is 0.24, the value of Cr is 1 × 10⁻³ MPa−1, and the value of Cw is 3 × 10⁻⁴ MPa−1. The mudstone acoustic time difference method was employed to quantify the extent of erosion during the last uplift. The results indicated that the study area experienced an amplitude ranging from 1.3 to 3.5 km during this uplift, with W207 exhibiting the greatest erosion thickness of approximately 3524 m. This finding aligns closely with the calculations reported by Deng et al. [52] and Wang et al. [53].
Using Formula (5), we quantitatively assessed the pressure reduction caused by the unloading effect of uplift erosion. The results showed that the pressure reduction caused by uplift erosion unloading varied from 14.07 to 38.55 MPa, averaging 26.68 MPa. Notably, the largest pressure reduction, recorded at 38.55 MPa, occurred in Well W207 (Figure 7c, Table 2).

4.3.3. Geothermal Decline

An increase in formation temperature leads to the expansion of fluid volume, which in turn results in an increase in fluid pressure. Conversely, a decrease in formation temperature causes both fluid volume and rock skeleton volume to contract, leading to a reduction in fluid pressure. Previous studies have demonstrated that, for a given cooling amplitude, the volume change of pore fluid is greater than that of the rock skeleton [54,55]. Therefore, the cooling effect contributes to a decrease in formation pressure.
Concerning the decrease in pressure attributed to the geothermal decline, previous studies have primarily derived this relationship through a combination of Pascal’s law and fluid state equations, or via simulation experiments examining the temperature–pressure relationship of fluids [56,57]. Based on experiments evaluating the temperature–pressure relationship in closed-flow systems, Liu et al. [56] found that when pressure exceeds 15 MPa, the temperature–pressure relationship in such systems is nearly parallel, with a slope of 1.076 MPa/°C. Consequently, this study employs this model to calculate the pressure reduction resulting from geothermal decline.
Previous studies have indicated that the geothermal gradient in the area extending from central Sichuan to southwestern Sichuan was highest during the Early Triassic, ranging from 55 °C/km to 60 °C/km. By the end of the Triassic, this gradient had decreased to between 30 °C/km and 38 °C/km, and at the end of the Early Cretaceous, it further declined to between 21 °C/km and 29 °C/km. Currently, the geothermal gradient is approximately 22 to 26 °C/km [58,59]. In the study area, the Qiongzhusi Formation reached its maximum ancient burial depth by the end of the Early Cretaceous. Based on the geothermal gradient at that time and the current geothermal gradient, the reduction pressure due to the decrease in geothermal temperature was calculated. The results indicated that the pressure reduction caused by the decrease in geothermal temperature ranged from 32.38 MPa to 86.8 MPa, with an average of 56.56 MPa, and the impact of the geothermal decrease on Well W207 was the most significant (Figure 7d, Table 2).

5. Conclusions

This study explores the distribution characteristics and genesis mechanisms of overpressure in the Qiongzhusi Formation based on measured pressure and well logging data. The following key insights were obtained:
(1)
The Qiongzhusi Formation generally exhibits overpressure, with pressure coefficients ranging from 1.0 to 2.5, increasing with depth. The pore pressure in the Deyang–Anyue rift trough is greater than that in the Weiyuan anticline.
(2)
The overpressure in the Qiongzhusi Formation is caused by disequilibrium compaction, organic matter maturation, and pressure transmission, with organic matter maturation being the primary contributor to this overpressure.
(3)
The evolution of overpressure in the Qiongzhusi Formation has experienced both pressure increase and release, with the amount contributed by disequilibrium compaction being around 9.44 MPa., while OM hydrocarbon generation contributes 82.66 MPa, and pressure transmission contributes 37.98 MPa. Additionally, the uplift erosion unloading effect and geothermal decline led to a reduction in pressure values of approximately 26.68 MPa and 56.56 MPa.

Author Contributions

Formal analysis, Q.W. and Z.B.; investigation, Q.W., H.T. and Z.J.; resources, X.S., Y.Y., Y.L. and Y.H.; data curation, H.T. and H.M.; writing—original draft preparation, X.S.; writing—review and editing, X.S., Y.Y., Q.W., Y.L., Y.H., H.T., Z.J., Z.B. and H.M.; visualization, X.S.; supervision, Z.J.; project administration, X.S., Y.Y.; funding acquisition, X.S., Y.Y. All authors have read and agreed to the published version of the manuscript.

Funding

The study was conducted in accordance with the Innovative Research Group Project of the National Natural Science Foundation of China (grant nos. 42272137 and 42372144), and Key Applied Science and Technology Project of China National Petroleum Corporation (grant no. 2023ZZ21).

Institutional Review Board Statement

Not applicable.

Informed Consent Statement

Not applicable.

Data Availability Statement

In addition to the data presented in the manuscript, additional information can be obtained by contacting the corresponding author.

Acknowledgments

We would like to extend our sincere appreciation to the PetroChina Southwest Oil & Gas field Company and China University of Petroleum (Beijing) for generously providing the necessary data and laboratory facilities crucial for our research. Additionally, we are grateful to the editor and reviewers for their valuable comments for improving the manuscript.

Conflicts of Interest

Authors Xuewen Shi, Yuran Yang, Qiuzi Wu, Yanyou Li, Yifan He and He Tian were employed by the company PetroChina Southwest Oil & Gas field Co. The remaining authors declare that the research was conducted in the absence of any commercial or financial relationships that could be construed as a potential conflict of interest.

References

  1. Li, J.Z.; Tao, X.W.; Bai, B.; Huang, S.P.; Jiang, Q.C.; Zhao, Z.Y.; Chen, Y.Y.; Ma, D.B.; Zhang, L.P.; Li, N.X.; et al. Geological conditions, reservoir evolution and favorable exploration directions of marine ultra-deep oil and gas in China. Pet. Explor. Dev. 2021, 48, 60–79. [Google Scholar] [CrossRef]
  2. Miao, H.; Jiang, Z.X.; Tang, X.L.; Deng, Z.; Zhang, C.J.; Liang, Z.K.; Shi, Y.G. Hydrocarbon generation potential and organic matter accumulation patterns in organic-rich shale during the Mesoproterozoic oxygenation event: Evidence from the Xiamaling formation shale. Geomech. Geophys. GeoEngergy GeoResour. 2023, 9, 134. [Google Scholar] [CrossRef]
  3. Miao, H.; Guo, J.Y.; Wang, Y.B.; Jiang, Z.X.; Zhang, C.J.; Li, C.M. Mineralogical and elemental geochemical characteristics of Taodonggou Group mudstone in the Taibei Sag, Turpan-Hami Basin: Implication for its formation mechanism. Solid Earth 2023, 14, 1031–1052. [Google Scholar] [CrossRef]
  4. Gong, X.; Ma, X.H.; Liu, Y.Y. Analysis of geological factors affecting propagation behavior of fracture during hydraulic fracturing shale formation. Geomech. Geophys. GeoEngergy GeoResour. 2024, 10, 102. [Google Scholar] [CrossRef]
  5. Hunt, J.M. Generation and migration of petroleum from abnormally pressured fluid compartments. AAPG Bull. 1990, 74, 1–12. [Google Scholar]
  6. Law, B.E.; Ulmishek, G.F.; Slavin, V.I. Abnormal pressure in hydro-carbon environments. AAPG Mem. 1998, 70, 1–11. [Google Scholar]
  7. Pang, X.Q.; Jia, C.Z.; Wang, W.Y. Petroleum geology features and research developments of hydrocarbon accumulation in deep petroliferous basins. Pet. Sci. 2015, 12, 1–53. [Google Scholar] [CrossRef]
  8. Zhao, J.Z.; Li, J.; Xu, Z.Y. Advances in the origin of overpressures in sedimentary basins. Acta Pet. Sin. 2017, 38, 973–998. [Google Scholar] [CrossRef]
  9. Miao, H.; Jiang, Z.X.; Lu, J.M.; Zhang, C.J.; Shi, L.D.; Sun, L.D.; Yang, L.; Shang, P. Hydrocarbon Source and Relationship between Hydrocarbon Charging Process and Reservoir Tight Period of the Denglouku Formation Tight Sandstone Gas Reservoirs in the Xujiaweizi Fault Depression, Songliao Basin. Nat. Resour. Res. 2024, 33, 1657–1684. [Google Scholar] [CrossRef]
  10. Zhang, C.J.; Jiang, Z.X.; Lu, J.M.; Shi, L.D.; Bi, Z.Y.; Sun, L.D.; Yang, L.; Li, X.M.; Liu, J.J.; Miao, H. Origin and Evolution Process of Overpressure in the Shahezi Formation of Xujiaweizi Fault Depression in the Northern Songliao Basin, NE China. Acta Geol. Sin. 2025, 99, 212–227. [Google Scholar] [CrossRef]
  11. Tingay, M.R.P.; Hillis, R.R.; Swarbrick, R.E.; Morley, C.K.; Damit, A.R. Origin of overpressure and pore-pressure prediction in the Baram province, Brunei. AAPG Bull. 2009, 93, 51–74. [Google Scholar] [CrossRef]
  12. Wang, W.L.; Zhang, Y.M.; Zhao, J. Evolution of formation pressure and accumulation of natural gas in the Upper Palaeozoic, eastern-central Ordos Basin, Central China. Geol. J. 2018, 53, 395–404. [Google Scholar] [CrossRef]
  13. Xiong, T.; Cheng, L.L.; Guo, D.M.; Guan, L.J.; Jiang, Q.T.; Hu, Z.M.; Yin, S.L.; Chen, G.Y. Overpressure characteristics and geological origin of the paleogene in Baiyun Sag, Pearl River Mouth Basin. Front. Earth Sci. 2023, 11, 1118443. [Google Scholar]
  14. Eaton, B.A. The Effect of Overburden Stress on Geopressure Prediction from Well Logs. J. Pet. Technol. 1972, 24, 929–934. [Google Scholar] [CrossRef]
  15. Bowers, G.L. Determining an Appropriate Pore-Pressure Estimation Strategy. In Proceedings of the Offshore Technology Conference 2001, Houston, TX, USA, 30 April–3 May 2001; pp. 1–5. [Google Scholar]
  16. Tingay, M.R.P.; Morley, C.K.; Laird, A.; Limpornpipat, O.; Krisadasima, K.; Pabchanda, S.; Macintyre, H.R. Evidence for overpressure generation by kerogen-to-gas maturation in the northern Malay Basin. AAPG Bull. 2013, 97, 639–672. [Google Scholar] [CrossRef]
  17. Zhang, F.Q.; Lu, X.S.; Zhuo, Q.G.; Zhong, H.L.; Zhang, P.; Wei, C.; Liu, W. Genetic mechanism and evolution characteristics of overpressure in the lower play at the southern margin of the Junggar Basin, northwestern China. Oil Gas Geol. 2020, 41, 1004–1016. [Google Scholar]
  18. Miao, H.; Jiang, Z.X.; Tang, X.L.; Wang, G.Z.; Wu, Q.Z.; Fan, W.L.; Zheng, H.Y. Strata Uplift Controlled Deep Shale Gas Accumulation Modes: A Case Study from the Weiyuan Block, Sichuan Basin. Energy Fuels 2023, 37, 12889–12904. [Google Scholar] [CrossRef]
  19. Wang, D.D.; Jiang, Z.X.; Yang, Y.; Shao, X.D.; Feng, X.; Du, W.; Shi, F.L.; Chen, W.Y. Under the Control of Multistage Structure Shallow, Normal-Pressure Shale Gas Accumulation Characteristics in Fuyan Syncline of Northern Guizhou. Energy Fuels 2023, 37, 16599–16611. [Google Scholar] [CrossRef]
  20. Miao, H.; Jiang, Z.X.; Wu, J.F.; Wu, Q.Z.; Shi, X.W.; Deng, Z.; Tang, X.L.; Wu, W.; Tao, C.Q.; Zheng, H.Y. Migration evidence and dynamic enrichment model of shale gas: Take the deep shale gas in the southern Sichuan Basin as an example. Nat. Gas. Ind. 2024, 44, 29–44. [Google Scholar]
  21. Li, W.; Yu, H.Q.; Deng, H.B. Stratigraphic division and correlation and sedimentary characteristics of the Cambrian in central-southern Sichuan Basin. Pet. Explor. Dev. 2022, 39, 725–735. [Google Scholar] [CrossRef]
  22. Liu, S.G.; Deng, B.; Li, Z.W.; Sun, W. The texture of sedimentary basin-orogenic belt system and its influence on oil/gas distribution: A case study from Sichuan basin. Acta Pet. Sin. 2011, 27, 621–635. [Google Scholar]
  23. Liang, X.; Liu, S.G.; Wang, S.B.; Deng, B.; Zhou, S.Y.; Ma, W.X. Analysis of the Oldest Carbonate Gas Reservoir in China New Geological Significance of the Dengying Gas Reservoir in the Weiyuan Structure, Sichuan Basin. J. Earth Sci. 2019, 30, 348–366. [Google Scholar] [CrossRef]
  24. Shi, X.W.; Wu, W.; Wu, Q.Z.; Zhong, K.S.; Jiang, Z.X.; Miao, H. Controlling Factors and Forming Types of Deep Shale Gas Enrichment in Sichuan Basin, China. Energies 2022, 15, 7023. [Google Scholar] [CrossRef]
  25. He, X.; Liang, F.; Li, H.; Zheng, M.J.; Zhao, Q.; Liu, Y.; Liu, W.P. Breakthrough and enrichment mode of marine shale gas in the Lower Cambrian Qiongzhusi Formation in high-yield wells in Sichuan Basin. China Pet. Exp. 2024, 29, 142–155. [Google Scholar]
  26. Zachopoulos, F.N.; Nikolaos, C.; Kokkinos, N.C. Detection methodologies on oil and gas kick: A systematic review. Int. J. Oil Gas Coal Technol. 2023, 33, 1–19. [Google Scholar] [CrossRef]
  27. Chen, X.; He, M.; Xu, M.B.; Wang, S.W.; Dai, B.M. Early gas kick detection-inversion-control integrated system: The significance of applications of managed pressure drilling: A review. Geoenergy Sci. Eng. 2023, 229, 212134. [Google Scholar] [CrossRef]
  28. Athy, L.F. Density porosity and compaction of sedimentary rocks. AAPG Bull. 1930, 14, 1–24. [Google Scholar]
  29. Zhang, D.Y.; Yu, F.; Han, K.L.; Zhao, P.; Zheng, L.N.; Wang, T. Method for detecting pore pressure in Carbonate reservoirs. J. Oil Gas Technol. 2011, 33, 111–113. [Google Scholar]
  30. Kumar, A.; Gunasekaran, K.; Bhardwaj, N.; Dutta, J.; Banerjee, S. Origin and distribution of abnormally high pressure in the Mahanadi Basin, east coast of India. Interpretation 2016, 4, T303–T311. [Google Scholar] [CrossRef]
  31. Eaton, B.A. Graphical method predicts geopressures worldwide. World 1976, 183, 51–56. [Google Scholar]
  32. Eaton, B.A. The Equation for Geopressure Prediction from Well Logs. In Proceedings of the Fall Meeting of Society of Petroleum Engineers of AIME, Dallas, TX, USA, 28 September–1 October 1975; Volume 5554, pp. 1–5. [Google Scholar]
  33. Bowers, G.L. Pore Pressure Estimation from Velocity Data: Accounting for Overpressure Mechanisms Besides Undercompaction. SPE Drill. Complet. 1995, 10, 89–95. [Google Scholar] [CrossRef]
  34. Bowers, G.L. Detecting high overpressure. Lead. Edge 2002, 21, 174–177. [Google Scholar] [CrossRef]
  35. Zhang, F.Q.; Wang, Z.L.; Zhong, H.L.; Yang, C.; Wang, J.T. Recognition Model and Contribution Evaluation of Main Overpressure Formation Mechanisms in Sedimentary Basins. Nat Gas Geosci. 2013, 24, 1151–1158. [Google Scholar]
  36. Zhang, F.Q.; Lu, X.S.; Botterill, S.; Gingras, M.; Zhuo, Q.G.; Zhong, H.L. Horizontal tectonic stress as a cause of overpressure in the southern margin of the Junggar Basin, northwest China. J. Pet. Sci. Eng. 2021, 205, 108861. [Google Scholar] [CrossRef]
  37. Li, J.; Zhao, J.Z.; Wei, X.S.; Chen, M.N.; Song, P.; Han, Z.H.; Wu, W.T. Origin of abnormal pressure in the Upper Paleozoic shale of the Ordos Basin, China. Mar. Pet. Geol. 2019, 110, 162–177. [Google Scholar] [CrossRef]
  38. Zhang, J.C. Pore pressure prediction from well logs: Methods, modifications, and new approaches. Earth Sci. Rev. 2011, 108, 50–63. [Google Scholar] [CrossRef]
  39. Radwan, A.E.; Meng, M.; Zhang, J.J.C. Editorial: Overpressure in sedimentary basins and petroleum geomechanics. Front. Earth Sci. 2022, 10, 1062443. [Google Scholar] [CrossRef]
  40. Si, S.H.; Zhao, J.Z.; Meng, Q.A.; Cao, Q.; Wu, W.T.; Zhang, Y.H. The fluid inclusion paleo pressure characteristics and geological implications of gaotaizi tight reservoir in Qijia area of Songliao Basin. J. Geomech. 2018, 24, 51–59. [Google Scholar]
  41. Liu, J.D.; Zhang, C.J.; Jiang, Y.L.; Wang, L.J.; Zeng, T. Paleo-pressure evolution of reservoir and its main controlling factors in the Third Member of Xujiahe Formation in Yuanba area, Sichuan Basin. J. China Univ. Pet. (Ed. Nat. Sci.) 2021, 45, 31–41. [Google Scholar]
  42. Li, J.; Zhao, J.Z.; Hou, Z.Q.; Zhang, S.P.; Chen, M.N. Origins of overpressure in the central Xihu depression of the East China Sea shelf Basin. AAPG Bull. 2021, 105, 1627–1659. [Google Scholar] [CrossRef]
  43. Tingay, M.P.; Hillis, R.R.; Swarbrick, R.E.; Morley, C.K.; Damit, A.R. ‘Vertically transferred’ overpressures in Brunei: Evidence for a new mechanism for the formation of high-magnitude overpressure. Geology 2007, 35, 1023–1026. [Google Scholar] [CrossRef]
  44. Li, J.; Qin, D.W.; Yin, W.S.; Wang, X.P.; Dai, Y.; Shi, H.; Fan, C.Y. The Origin of Overpressure in the Pinghu Tectonic Zone of Xihu Depression and Its Relationship with Hydrocarbon Accumulation. Energies 2023, 16, 8055. [Google Scholar] [CrossRef]
  45. Qiu, N.S.; Liu, Y.F.; Liu, W.; Jia, J.L. Quantitative reconstruction of formation paleo-pressure in sedimentary basins and case studies. Sci. China Earth Sci. 2020, 50, 793–806. [Google Scholar] [CrossRef]
  46. Luo, S.B.; Yang, G.; Zeng, Q.; Yu, J.N.; Song, M.W. Burial history analysis of the Sichuan Foreland Basin based on single well data. Nat. Gas Ind. 2012, 32, 34–37. [Google Scholar]
  47. Hu, A.P.; Shen, A.J.; Chen, Y.N.; Zhang, J.Y.; Liang, F.; Wang, Y.S. Reconstruction of tectonic-burial evolution history of Sinian Dengying Formation in Sichuan Basin based on the constraints of in-situ laser ablation U-Pb date and clumped isotopic thermometer(Δ47). Pet. Geol. Exp. 2021, 43, 896–905. [Google Scholar]
  48. Liu, T.; Liu, J.D. Quantitative evaluation on overpressure generated from undercompaction and fluid expansion. Acta Pet. Sin. 2018, 39, 971–979. [Google Scholar]
  49. Sun, Y.; Xie, P.Y.; Zhang, F.Q.; Chen, S.G.; Li, Y.X.; Guan, M.; Zhou, R.; Zhang, J. Mechanism and evolution of overpressure in the Linhe Formation of the Xinglong structural belt in the Linhe Depression of the Hetao Basin. Nat. Gas Geosci. 2024, 35, 661–675. [Google Scholar]
  50. Russell, W.L. Pressure-depth relations in Appalachian region. AAPG Bull. 1972, 56, 528–536. [Google Scholar]
  51. Li, S.X.; Shi, Z.J.; Liu, X.Y.; Yang, S.Y.; Deng, X.Q.; Liu, G.L.; Li, J.H. Quantitative analysis of the Mesozoic abnormal low pressure in Ordos Basin. Pet. Explor. Dev. 2013, 40, 528–533. [Google Scholar] [CrossRef]
  52. Deng, B.; Liu, S.G.; Liu, S.; Li, Z.W.; Zhao, J.C. Restoration of exhumation thickness and its significance in Sichuan Basin, China. J. Chengdu Univ. Technol. Sci. Technol. Ed. 2009, 36, 675–686. [Google Scholar]
  53. Wang, H.; Deng, B.; Wu, J.; Jiang, Q.Q.; Liu, C.J.; Bai, Y.W. Surface exhumation thickness in the southern Sichuan Basin—Based on the date of paleo-temperature indicators and interval transit time method. Geol. Rev. 2023, 69, 90–92. [Google Scholar]
  54. Bradley, J.S. Abnormal formation pressure. AAPG Bull. 1975, 59, 957–973. [Google Scholar]
  55. Zou, H.Y.; Hao, F.; Cai, Y.X. Summarization of subnormal pressures and accumulation mechanisms of subnormally pressured petroleum reservoirs. Geol. Sci. Technol. Inform. 2003, 2, 45–50. [Google Scholar]
  56. Liu, Y.F.; Zheng, L.J.; Qiu, N.S.; Jia, J.K.; Cheng, Q. The effect of temperature on the overpressure distribution and formationin the Central Paleo Uplift of the Sichuan Basin. Chin. J. Geophys. 2015, 58, 2380–2390. [Google Scholar]
  57. Wang, Q.C. Complex Fluid Pressure Distribution, Evolution and the Its Effects on Hydrocarbon Accumulation in the Third Member of Paleogene Shahejie Formation, Huimin Depression; China University of Petroleum: Beijing, China, 2023; pp. 1–188. [Google Scholar]
  58. Zhu, C.Q.; Qiu, N.S.; Cao, H.Y.; Jiang, Q.; Branch, E.; SINOPEC. Tectonon-thermal evolution of the eastern Sichuan Basin: Constraints from the vitrinite reflectance and apatite fission track data. Earth Sci. Front. 2017, 24, 94–104. [Google Scholar]
  59. Qiu, L.; Zheng, Z.Y.; Zhang, J.Z.; Luo, Y.; Cai, J.L.; Chen, S.Q.; Li, G.L.; Chen, Y.X.; Zuo, Y.H. Study on the Meso-Cenozoic Thermal History of the Sichuan Basin. Adv. Geosci. 2020, 10, 983–991. [Google Scholar] [CrossRef]
Figure 1. Geological background of the research area: (a) Geographical location of Sichuan Basin; (b) Geographical location of Zizhong area; (c) Contour map of mudstone thickness in Qiongzhusi Formation in Zizhong area; (d) Stratigraphic chart of Qiongzhusi Formation (modified after [18,19]).
Applsci 15 02888 g001
Figure 2. Characteristics of Pressure in the Qiongzhusi Formation: (a) Pressure vs. depth; (b) Pressure coefficient vs. depth.
Applsci 15 02888 g002
Figure 3. Typical drilling pressure prediction results of the Qiongzhusi Formation: (a) Z201; (b) GS17; (c) W207; (d) MX9.
Applsci 15 02888 g003
Figure 4. The prediction results of pressure in Qiongzhusi Formation: (a) plane distribution of pressure coefficient; (b) A–A’ pressure coefficient profile.
Applsci 15 02888 g004
Figure 5. Overpressure identification chart and overpressure cause identification of Qiongzhusi Formation: (a) resistivity–density plate; (b) sonic velocity–density plate; (c,d) overpressure cause identification of Z201; (e,f) overpressure cause identification of GS17; (g,h) overpressure cause identification of WY1H.
Applsci 15 02888 g005
Figure 6. Plate of Bowers method and overpressure cause identification of Qiongzhusi Formation: (a,b) Plate of Bowers method; (c,d) overpressure cause identification of Z201; (e,f) overpressure cause identification of GS17; (g,h) overpressure cause identification of WY1H.
Applsci 15 02888 g006
Figure 7. The contribution of different causes of overpressure to the pressure of the Qiongzhusi Formation: (a) disequilibrium compaction; (b) pressure transmission; (c) uplift erosion unloading effect; (d) geothermal decline.
Applsci 15 02888 g007
Table 1. Predicting the parameters and error rate of the pressure model for the Qiongzhusi Formation.
Methods/WellsEquivalent Depth MethodEaton MethodBowers Method
Error Rate/%CError Rate/%ABUError Rate/%
ZJ25.336.851.840.1220.7231.192.99
Z2015.663.482.90.0251.1421.095.4
GS176.184.332.650.310.551.042.89
DS15.547.74.770.260.9631.226.31
WY1H9.382.912.80.930.290.584.7
MX96.234.710.181.390.221.210.07
W2074.632.132.942.170.170.983.05
Table 2. The contribution of different causes of overpressure to the pressure of the Qiongzhusi Formation.
WellsPressure Increase Value/MPaPressure Decrease Value/MPaResidual
Pressure/MPa
Disequilibrium CompactionOM Generates
Hydrocarbons
Pressure
Transmission
Uplift Erosion
Unloading Effect
Geothermal Decline
ZJ24.3577.618.4614.07 32.2854.06
Z2013.8676.6617.1325.70 35.6636.29
GS1715.7690.3545.3224.88 67.239.35
DS113.5683.5154.3629.72 43.0462.78
WY1H11.528236.827.94 65.5937.57
MX96.0392.141.4625.92 65.3448.33
W20711.0276.452.3138.55 86.814.38
Disclaimer/Publisher’s Note: The statements, opinions and data contained in all publications are solely those of the individual author(s) and contributor(s) and not of MDPI and/or the editor(s). MDPI and/or the editor(s) disclaim responsibility for any injury to people or property resulting from any ideas, methods, instructions or products referred to in the content.

