Article

Aging-Friendly Design Research: Knowledge Graph Construction for Elderly Advantage Applications

School of Industrial Design, Hubei University of Technology, Wuhan 430068, China
*
Author to whom correspondence should be addressed.
Appl. Sci. 2025, 15(5), 2848; https://doi.org/10.3390/app15052848
Submission received: 21 January 2025 / Revised: 28 February 2025 / Accepted: 4 March 2025 / Published: 6 March 2025
(This article belongs to the Special Issue Knowledge Graphs: State-of-the-Art and Applications)

Abstract

:
In the field of aging design, obtaining elderly advantage data is a challenge. In this study, we developed a visualization tool using knowledge graph technology to assist designers in studying elderly advantages, promoting their application in design practice. First, brainstorming sessions and workshops were held to analyze the challenges of applying elderly advantages in design. Based on these challenges, the concept and functional design of an elderly advantages knowledge graph were proposed. Next, the elderly advantages knowledge graph was constructed by following these steps: (1) The KJ-AHP method was used to process raw data, making them structured and quantitative. (2) The ontology of the knowledge graph was reverse-engineered based on the functional requirements of the graph, allowing the construction of the knowledge graph model layer. (3) The processed data were applied to the knowledge graph ontology through AHP-ontology mapping rules, allowing the knowledge content construction. (4) The programming language Cypher was used for the functional verification of the elderly advantages knowledge graph, and a satisfaction survey was conducted through questionnaires to assess the verification process. The elderly advantages knowledge graph constructed in this study initially fulfilled the expected functions and was met with high satisfaction. The application of knowledge graph technology provides a new reference for advantage mining in the design field. Based on the innovative combination of KJ-AHP and knowledge graph technology, this study enhances the structuring and quantification of graph data, significantly facilitating designers’ understanding of data structures, clarifying data relationships, and expanding design thinking.

1. Introduction

According to the World Health Organization it is projected that, by 2030, the population aged 60 and above will account for one-sixth of the global population; from 2020 to 2030, the population aged 60 and above will increase from 1 billion to 1.4 billion; and, by 2050, the global population aged 60 and above is expected to double, reaching 2.1 billion [1]. Population aging has become a global issue, attracting widespread attention in the field of design. Initially, due to age-related limitations, development teams held negative stereotypes about the elderly, assuming that they were resistant to technology [2], and, in research on the needs of the elderly, older individuals were inevitably positioned as being in a disadvantaged position. According to the World Health Organization’s universal standards for categorizing the elderly, older adults are divided into three stages by age: the first stage (60 to 73 years), the second stage (74 to 89 years), and the third stage (90 years and above) [3]. With improvements in healthcare and education, a significant number of elderly individuals, especially those in the first stage, are maintaining healthier physical and mental states and are more open to new things. Past research into age-friendly design primarily focused on the needs of older adults and the challenges and problems they face, but such analysis no longer fully addresses the contemporary design requirements. Therefore, this study shifts the focus to exploring the unique advantages pertaining to the elderly and their potential applications, particularly in the context of age-friendly design, highlighting the promising development prospects in this field.
In China, researchers have primarily focused on the individual cognition of the elderly and the advantages they offer, examining their impact on design activities. Zhao Chao [4] used grounded theory and case studies to explore the positive impact of factors such as intuitive cognition, prior knowledge, and familiarity on the usability and ease of use of design objects. The results indicated that the cognitive advantages of the elderly are crucial for the usability and applicability of designs. Gu Mengmeng [5] summarized the advantages offered by the elderly, such as abundant time, experience, and psychological regulation ability, through a case study on social work, offering significant guidance for the design of elderly volunteer cultivation programs. Lin Lu [6] discovered, through team experiments, that the advantages offered by the elderly play a significant role in the early stages of creative idea generation in design, particularly with respect to experience, focus, and tolerance. These studies show that involving the elderly can enhance product usability and enrich design creativity.
Abroad, researchers have focused more on social interaction and environmental design, using these approaches to promote the utilization of elderly advantages. E. Duque et al. [7] proposed that participatory design can challenge researchers’ stereotypes of the elderly and further promote the social participation of the elderly population. The effective practices of the Ledo community in Germany demonstrate that promoting intergenerational communication through reasonable planning helps elderly groups to leverage their advantages. Studies have shown that elderly individuals aged 60 to 70 are among the most active groups in the Ledo community, actively participating in community management and activities and demonstrating a strong social work initiative [8]. In addition, BMW successfully improved its production efficiency by 7% by retrofitting workplaces to be more elderly-friendly and inviting 42 older employees to form an “elderly worker production line,” providing a positive case for the professional participation and social integration of the elderly population. Although existing studies have revealed the multiple advantages offered by the elderly, determining how to effectively integrate these advantages and present and apply them using scientific methods remains a significant challenge in current research.
The current research landscape regarding the advantages offered by the elderly, both domestically and internationally, shows a predominant focus on case studies and analyses. However, these approaches are constrained by the volume of available data, hindering the generation of comprehensive and systematic information on the advantages and characteristics of the elderly. In the context of design decision-making, the Analytic Hierarchy Process (AHP) has seen widespread application due to its hierarchical structure and scalability. For instance, Li Yang et al. [9] applied the AHP-QFD method in their study on shared mobility vehicles for the elderly, translating various levels of needs into functions, thus enhancing the scientific rigor and accuracy of product demand analysis. Luo Jie et al. [10] employed the AHP-AD-TOPSIS method in their research on age-friendly home care beds, significantly enhancing user experience and satisfaction. Ma Mengyun et al. [11] employed the AHP method to calculate the weights of various indicators and determine the design direction for age-friendly functional food packaging. Nevertheless, decision-making methods based on AHP face limitations in uncovering latent needs or advantages. Knowledge graph technology, as a semantic network that reveals relationships between entities, exhibits characteristics such as intuitive representation, scalability, efficient retrieval, and deep semantic mining [12] and has been preliminarily applied in design fields. For example, research by Zhenchong Mo et al. [13] demonstrated that knowledge graph technology aids in uncovering implicit needs in personalized design, thereby indirectly confirming the importance of knowledge graph technology in identifying vague or potential advantages. Lucas Greif et al. [14] employed knowledge graph technology to make sustainable decisions in product lifecycle management, validating the enormous potential of knowledge graph technology in product lifecycle decisions. Furthermore, they emphasized that future work should incorporate uncertainty quantification methods into knowledge graph analysis to better assess the confidence levels of results and enhance the precision of risk assessments.
Building on the preceding research, this paper introduces the KJ-AHP-KG method to explore the application of elderly advantages. By developing a data-sharing and visual decision-making tool using knowledge graph technology, it fosters research on the application of elderly advantages in the field of age-friendly design. This study also seeks to integrate the KJ-AHP method with ontology construction to improve data structures, thereby providing robust support for subsequent design decisions.

2. Theoretical Overview

2.1. Aging-Friendly Design

Aging-friendly design refers to a design method that follows the design concept of being “elderly-oriented” [15], aiming to create products, environments, or services that meet the needs of the elderly by taking into account their physiological, psychological, and social characteristics in a comprehensive manner. Foreign research on aging-friendly design began early and has facilitated the formation of corresponding systems and standards, such as the United States’ Universal Housing Design and Japan’s Residential Design Guidelines for a Longevity Society [16].

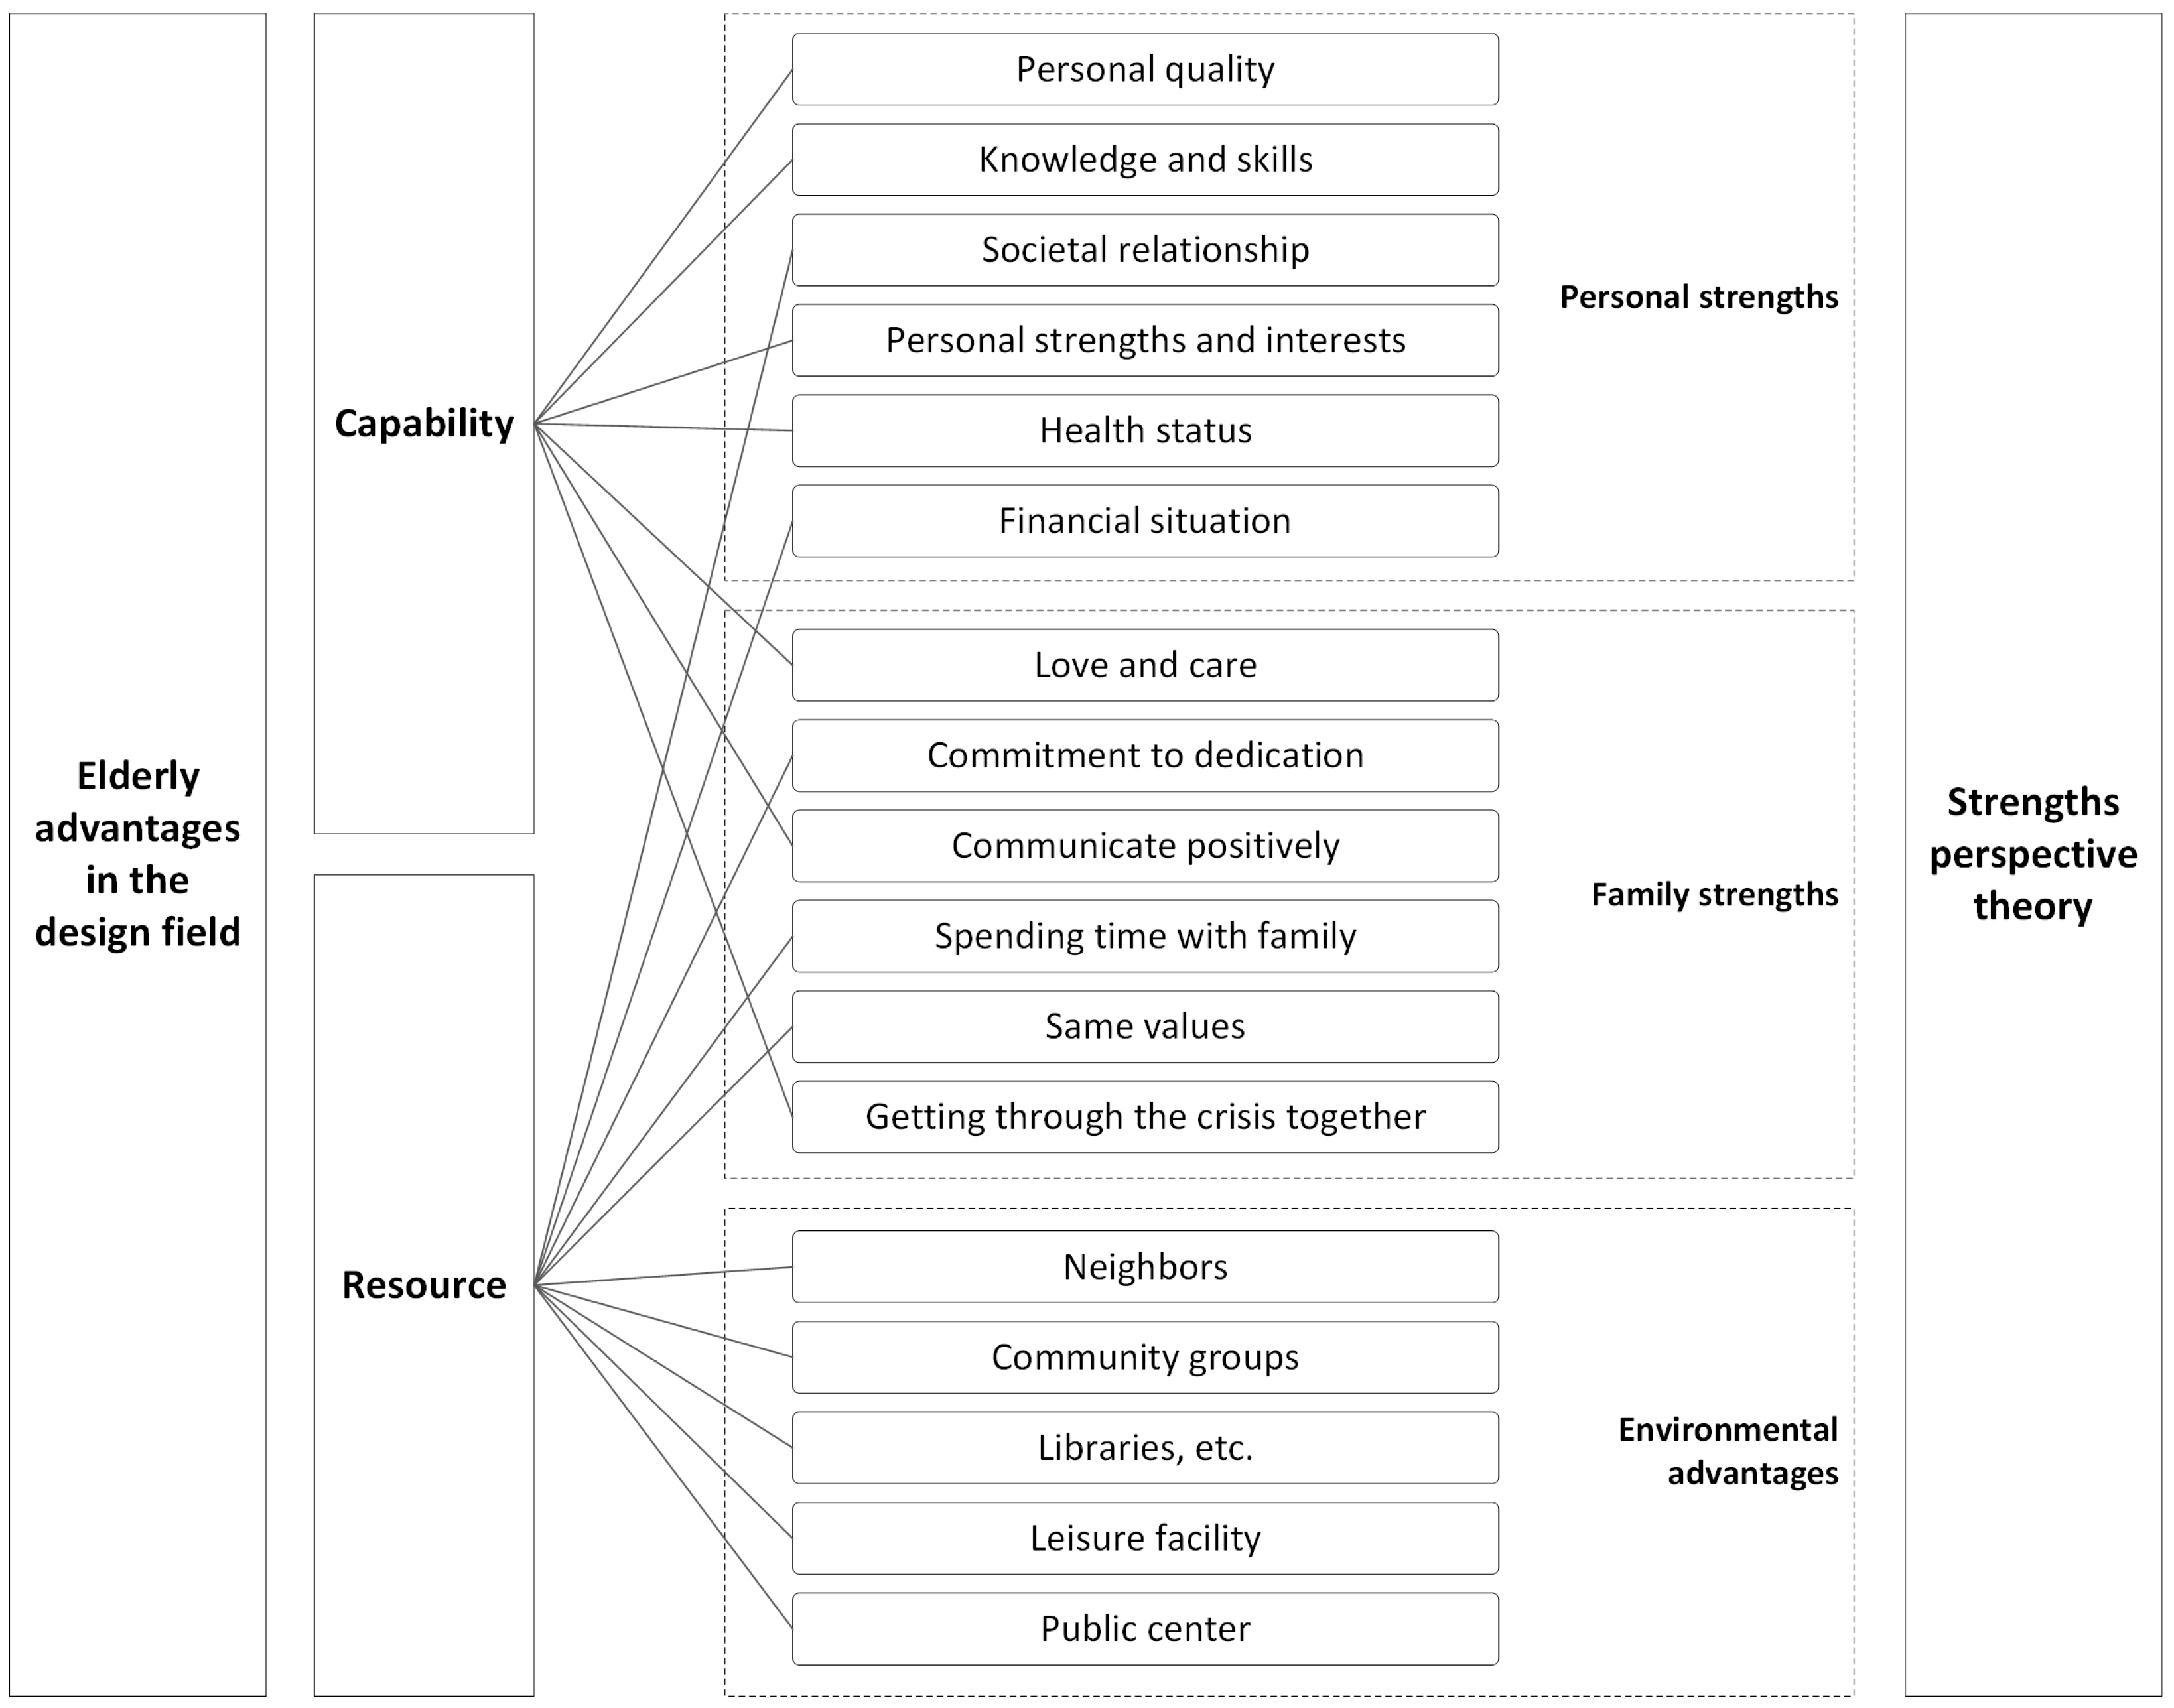
2.2. Strengths Perspective Theory

Strengths perspective theory originated in social work practices, and it argues that every individual, group, family, and community has strengths. These strengths include wealth, resources, wisdom, and knowledge [17]. The strengths perspective advocates for the use of positive, scientific interventions to integrate the strengths of people and their environments to help people solve problems and overcome challenges. The aim is to develop and improve the coping skills of caseworkers by collaboratively exploring and applying the strengths of people and their environments [18]. It emphasizes integrating resources, exploring together, stimulating strengths, and so on. Strengths perspective theory is relatively mature in the practice of discovering and guiding the strengths of caseworkers. Commonly used strengths assessment frameworks include the three-conversations model, ROPES, and the recovery model, among others [19].

2.3. Knowledge Graph

The concept of the knowledge graph was proposed by Google in 2012 [20]. It is a structured semantic knowledge base that works by representing real-world entities and the relationships among them in the form of graphs [21]. It is important in several research areas, such as intelligent question-and-answer analysis, knowledge-based reasoning, and intelligent recommendation [22].

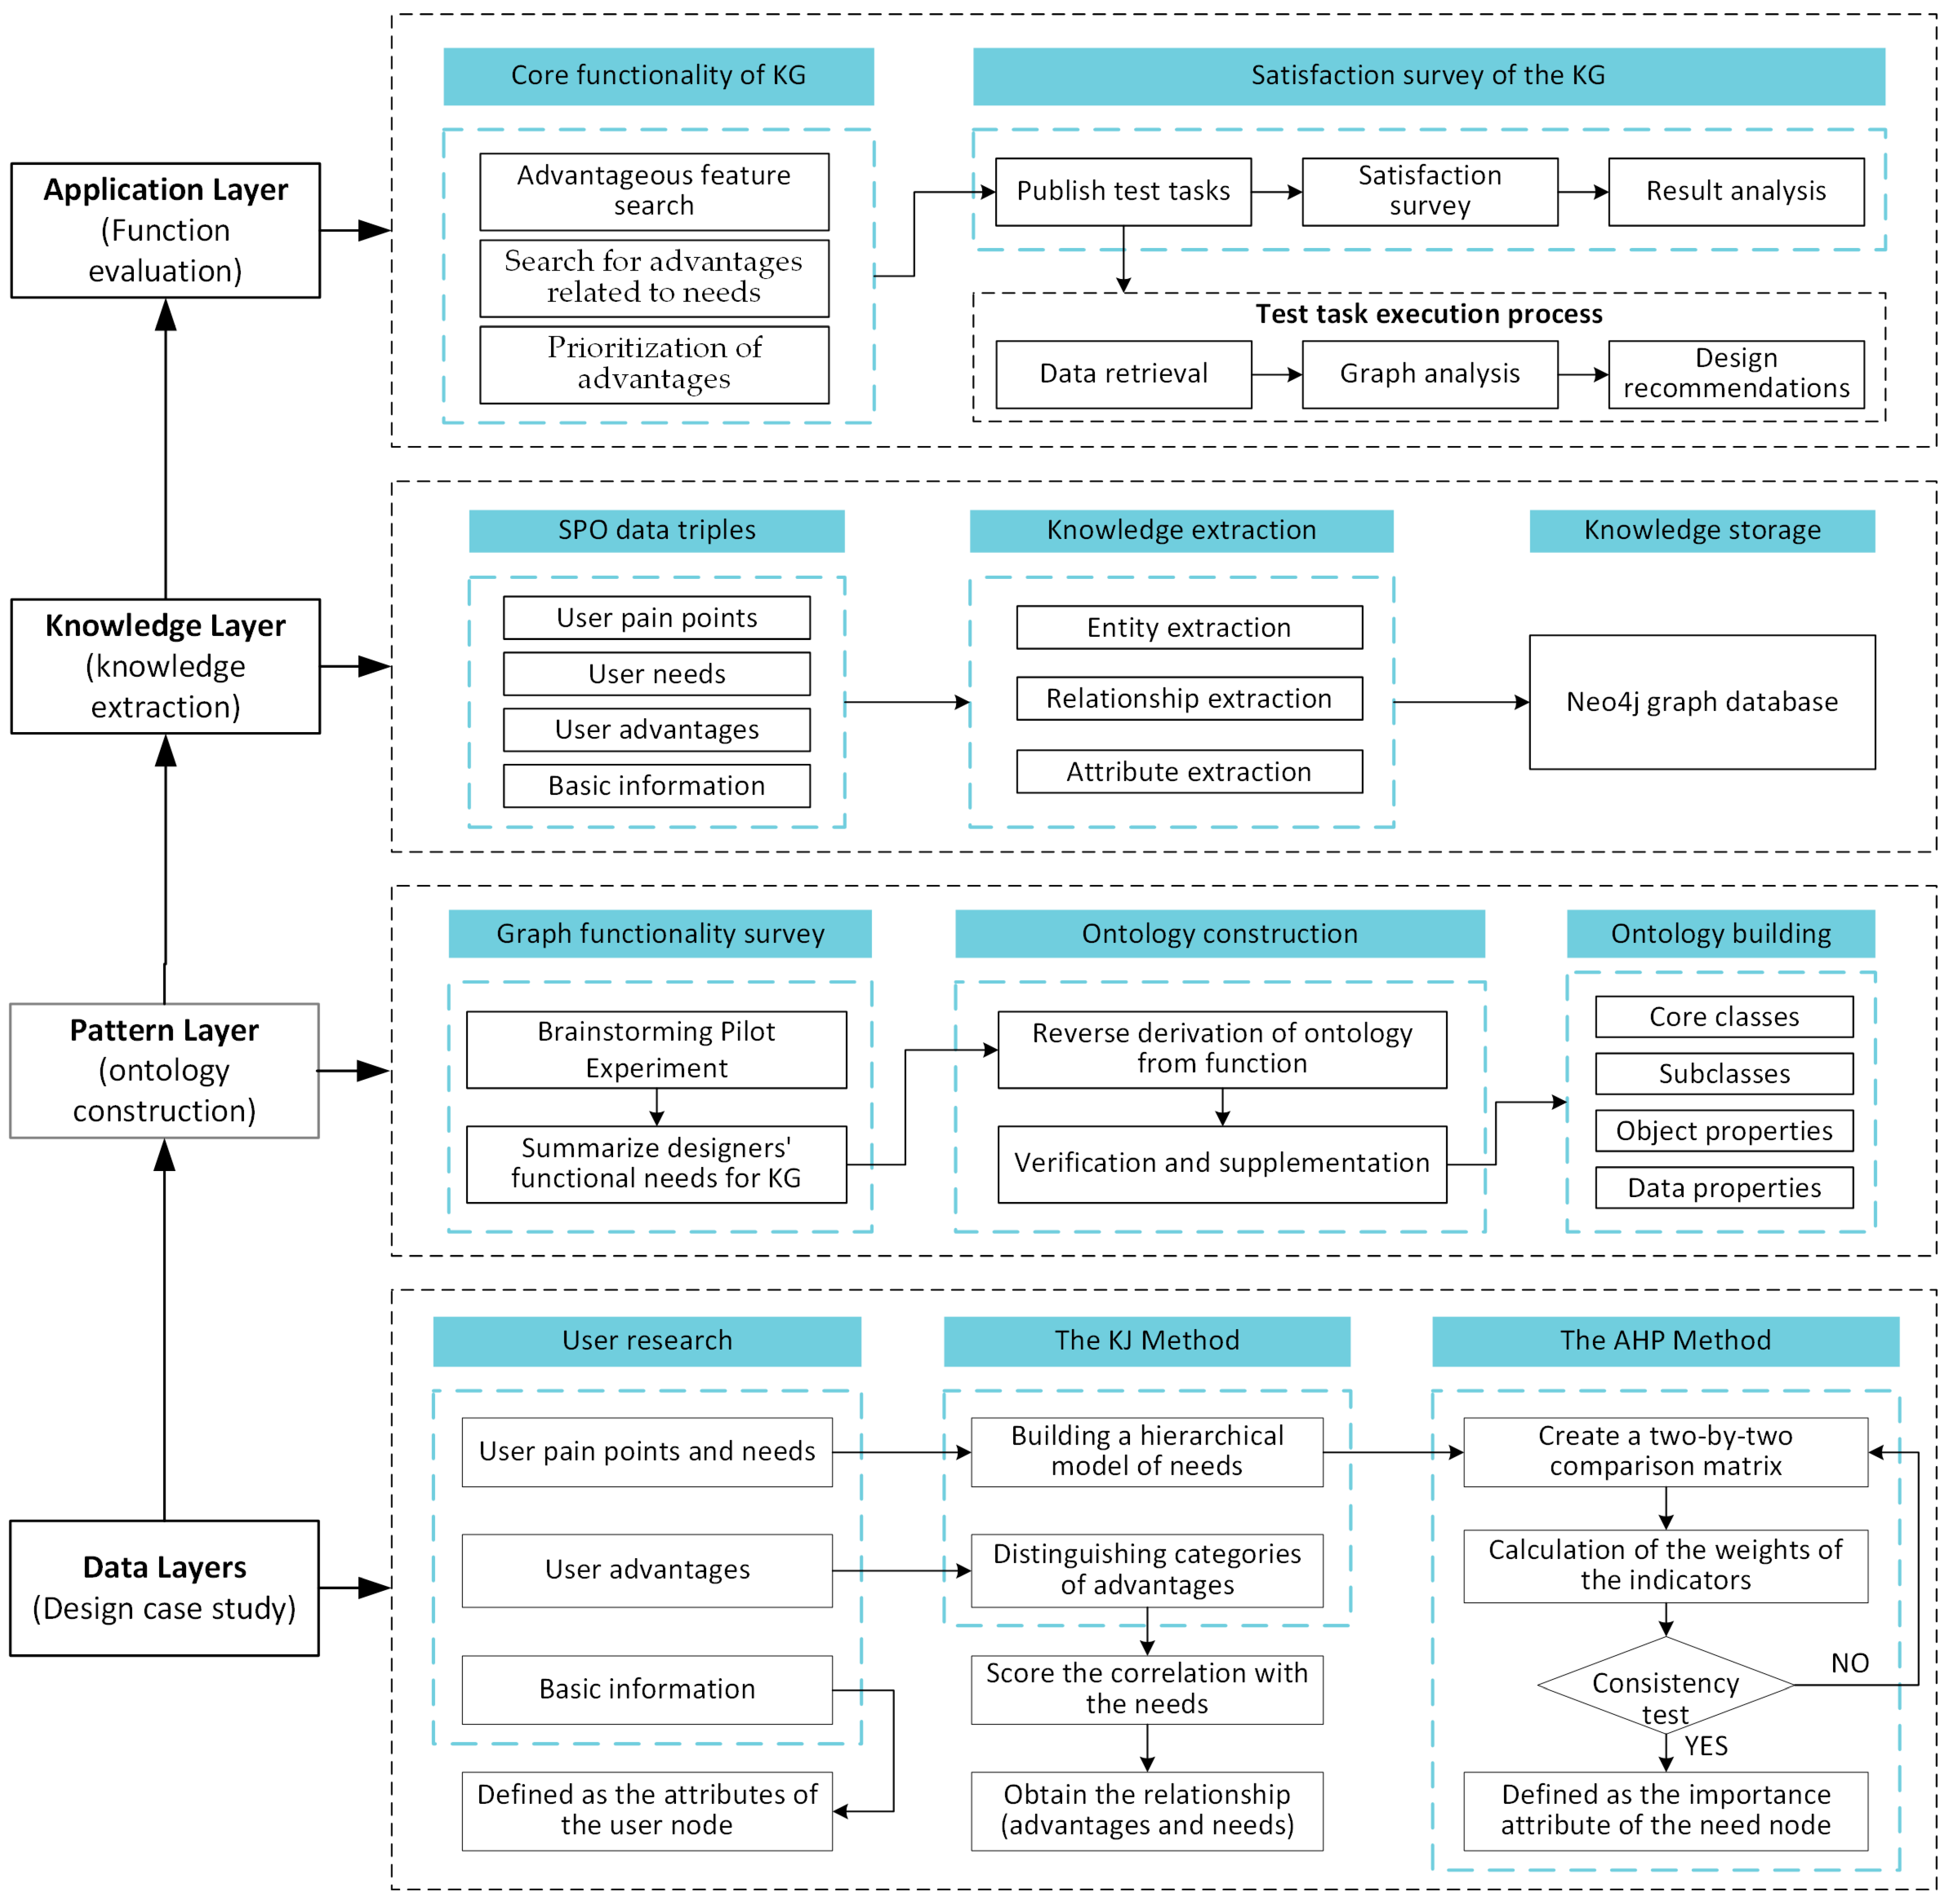
3. Presentation of the “Elderly Advantages Knowledge Graph” Program

3.1. Challenges of Integrating Elderly Advantages into Design: A Pain Point Analysis

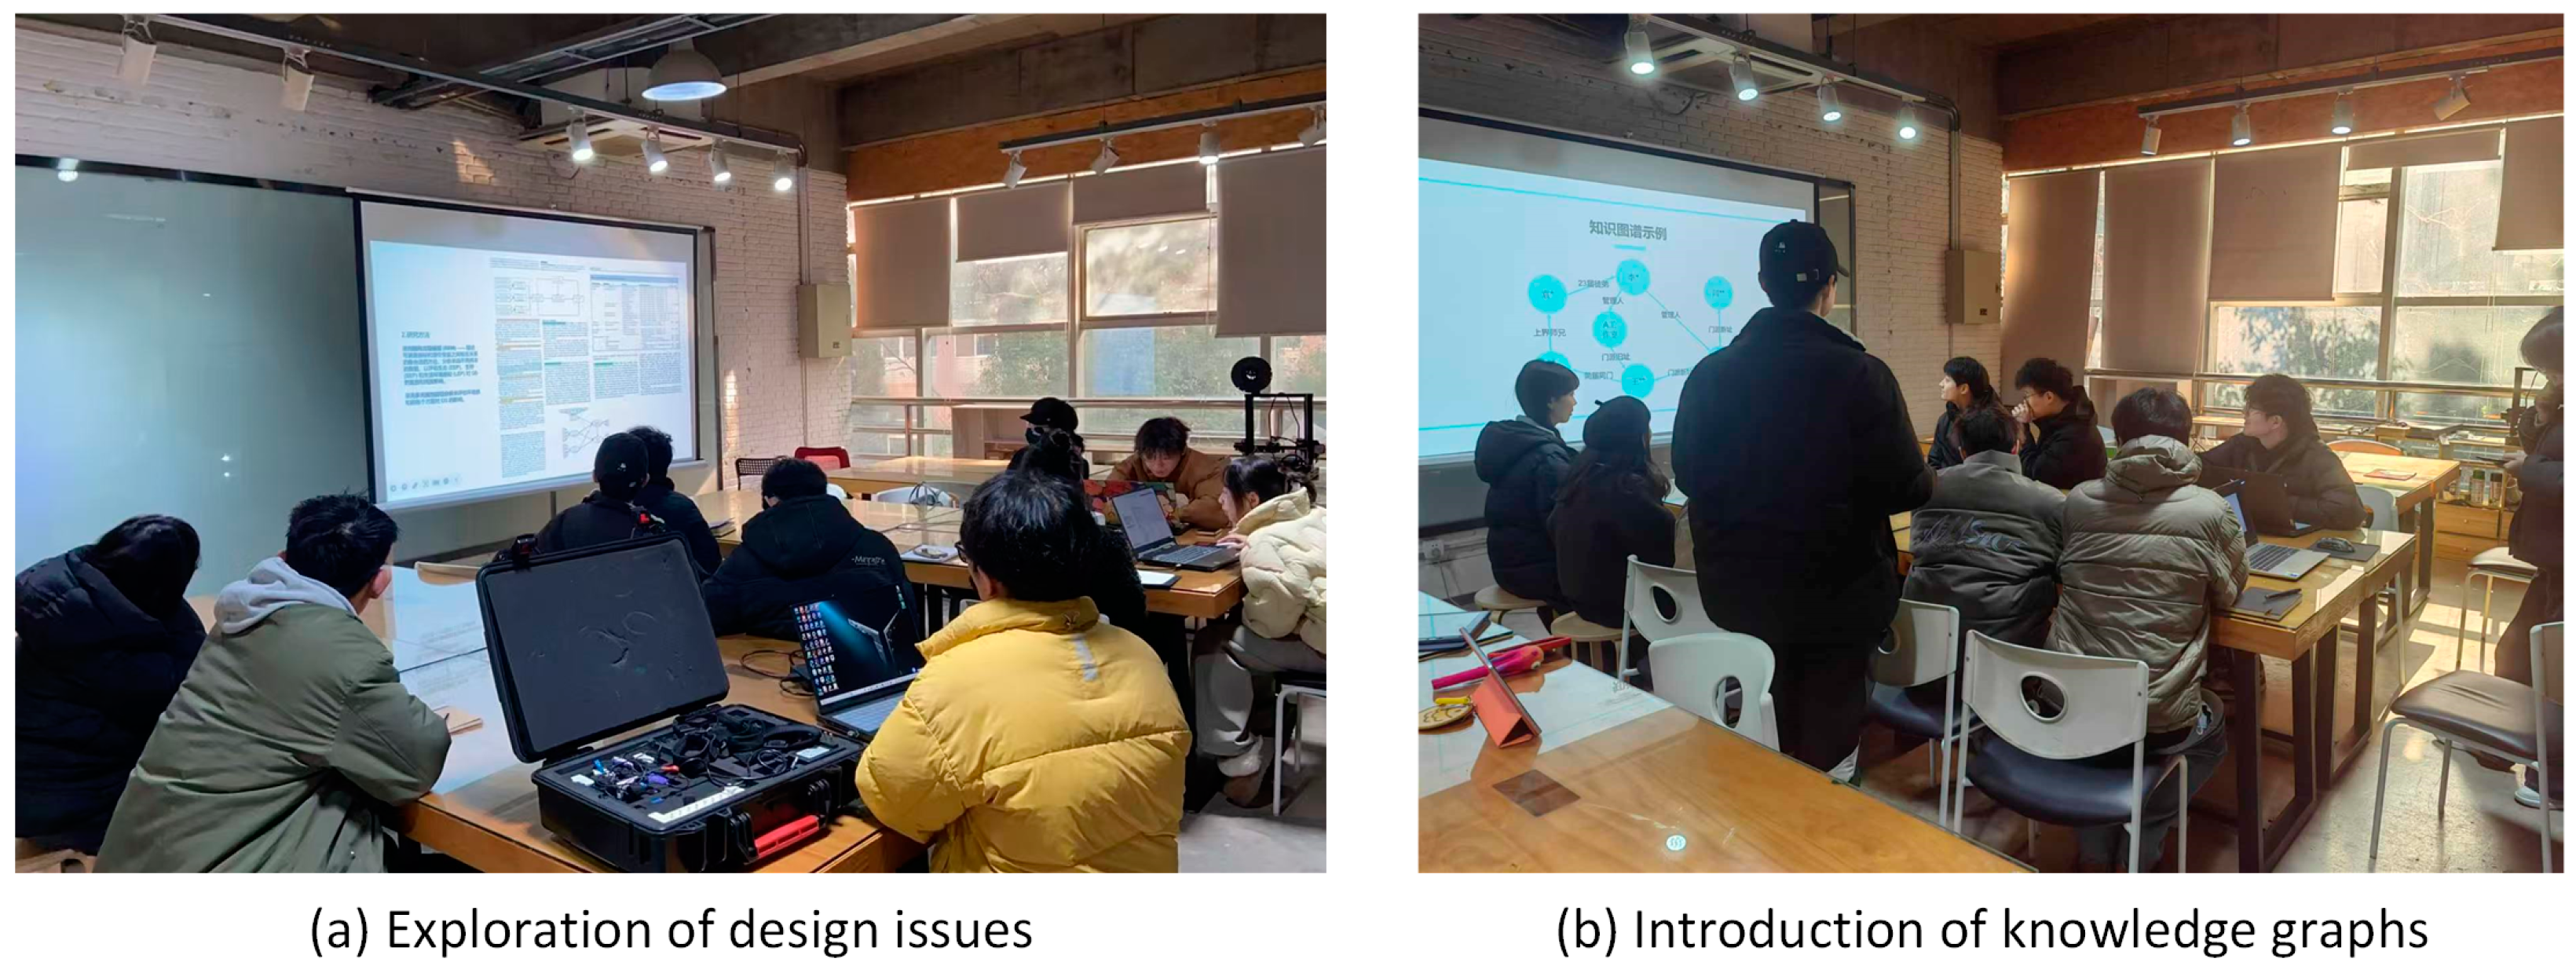
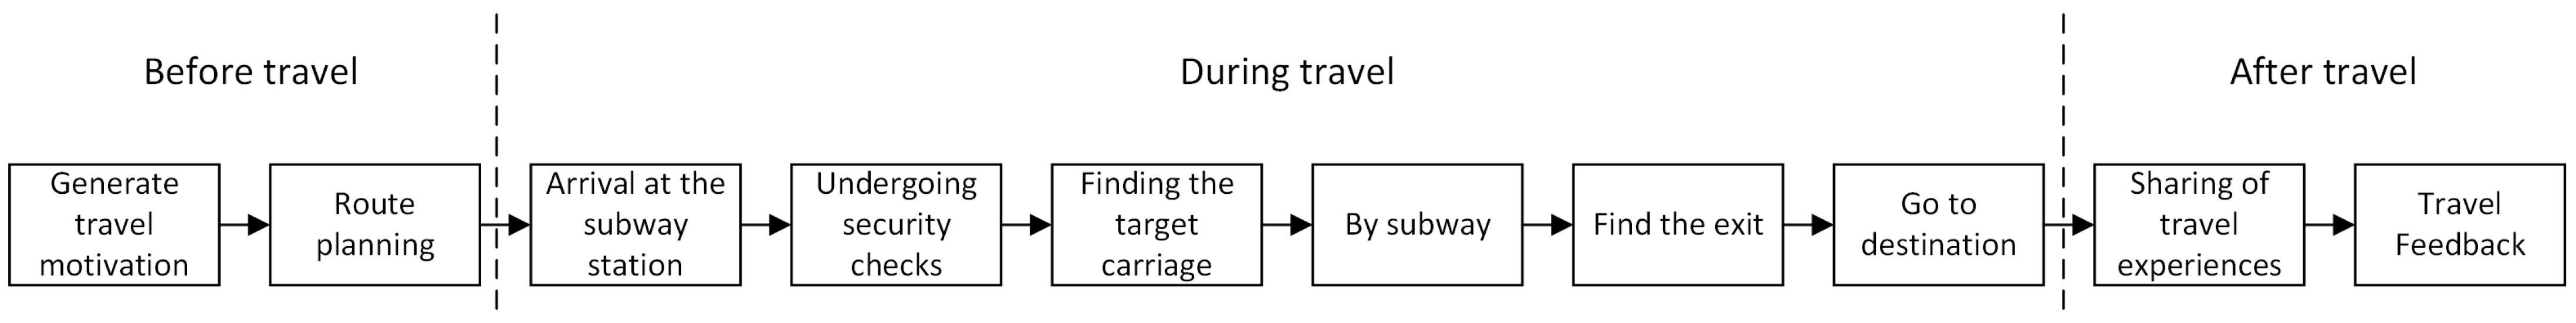
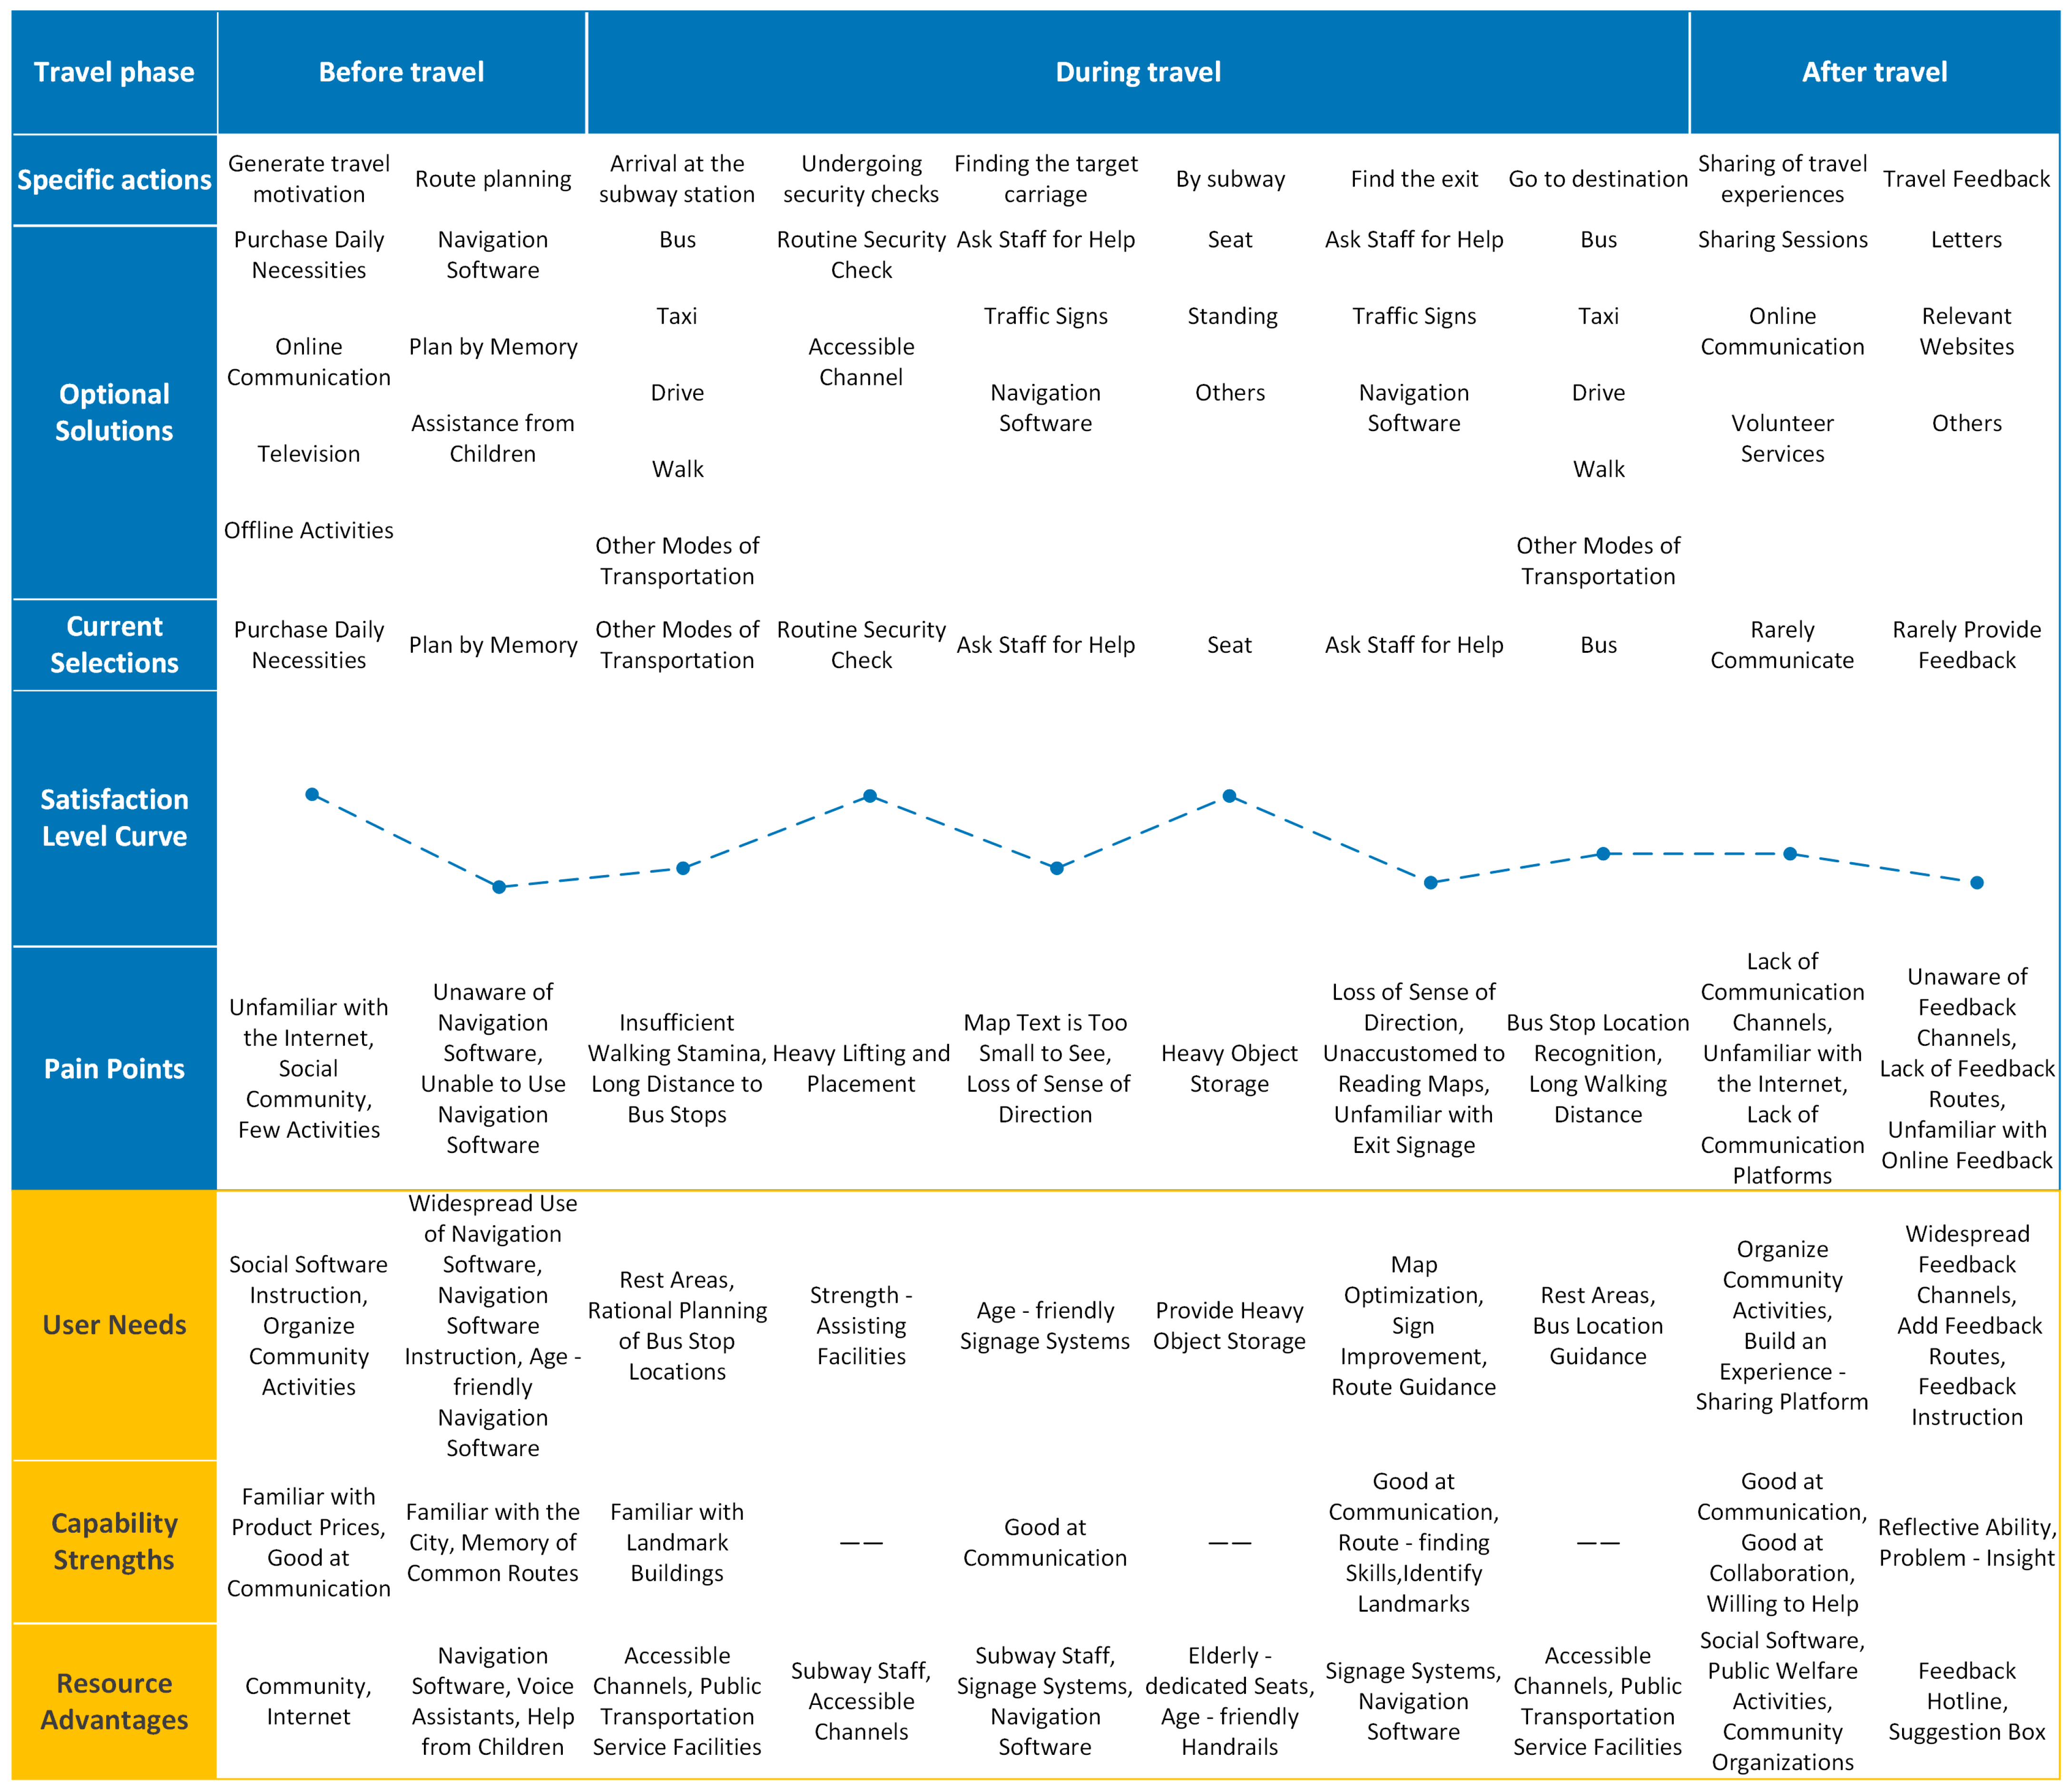
3.1.1. Exploratory Experiments: Designing with Elderly Advantages

The increasing popularity of intelligent products has brought great convenience to people’s lives, but it poses significant challenges for the elderly, such as smaller text, unfamiliar interaction methods, and a lack of tolerance for errors. These factors gradually lead the elderly to exclude themselves from new technologies [4]. Traditional aging-friendly design primarily focuses on the disadvantages for older individuals, compared to adults, in areas such as health and social status. The judgment, experience, and other characteristics that constitute elderly advantages, which set older people apart from relatively younger groups, are often overlooked [6]. Based on this research context, the researchers assembled 30 graduate students and six instructors specializing in aging-friendly design from a specific college. These participants were randomly grouped into six teams to conduct a brainstorming session entitled “Designing with Elderly Advantages”, aimed at identifying the challenges associated with applying elderly advantages in design. Figure 1 is a record of part of the meeting content.

3.1.2. Pain Points Analysis and Need Extraction

After the brainstorming session, one of the researchers distributed an open-ended questionnaire titled “Pain Points of Elderly Advantages in Design Practice” to 30 graduate students and six supervisors, with each questionnaire collecting one to three responses. The content of the questionnaire is shown in Table 1. In the subsequent seminar, the same researcher summarized seven pain points related to the application of elderly advantages in design practice: a lack of data mining methods for exploring elderly advantages, vague definitions of elderly advantages, inefficient data collection, insufficient sample sizes of available advantages in individual studies, difficulty in obtaining existing research data, ambiguous relationships between advantages and design elements, and unclear prioritization of advantageous applications. These pain points were then consolidated into five key needs for designers in advantage design: introducing research methods for elderly advantages, clarifying the classification and hierarchy of advantages, promoting the sharing of advantageous data, defining the relationship between advantages and design elements, and establishing the relevance of advantages to design elements. Table 2 lists the pain points and needs summarized from the research on “Designing with Elderly Advantages”, along with the corresponding representative statements and the number of questionnaires supporting these points.

3.2. Proposal of Solutions

3.2.1. Introduction of Strengths Perspective Theory

For needs A and B, one of the researchers applied the strengths assessment framework of the strengths perspective theory to investigate elderly advantages and recategorized the elements of strengths to align them with the requirements of the design context. This categorization is based on Professor Fogg’s behavioral design theory, which proposes methods for achieving things that are “easy to do”, improving people’s skills, and providing access to tools and resources [23]. The categorization results of the advantageous elements are shown in Figure 2.

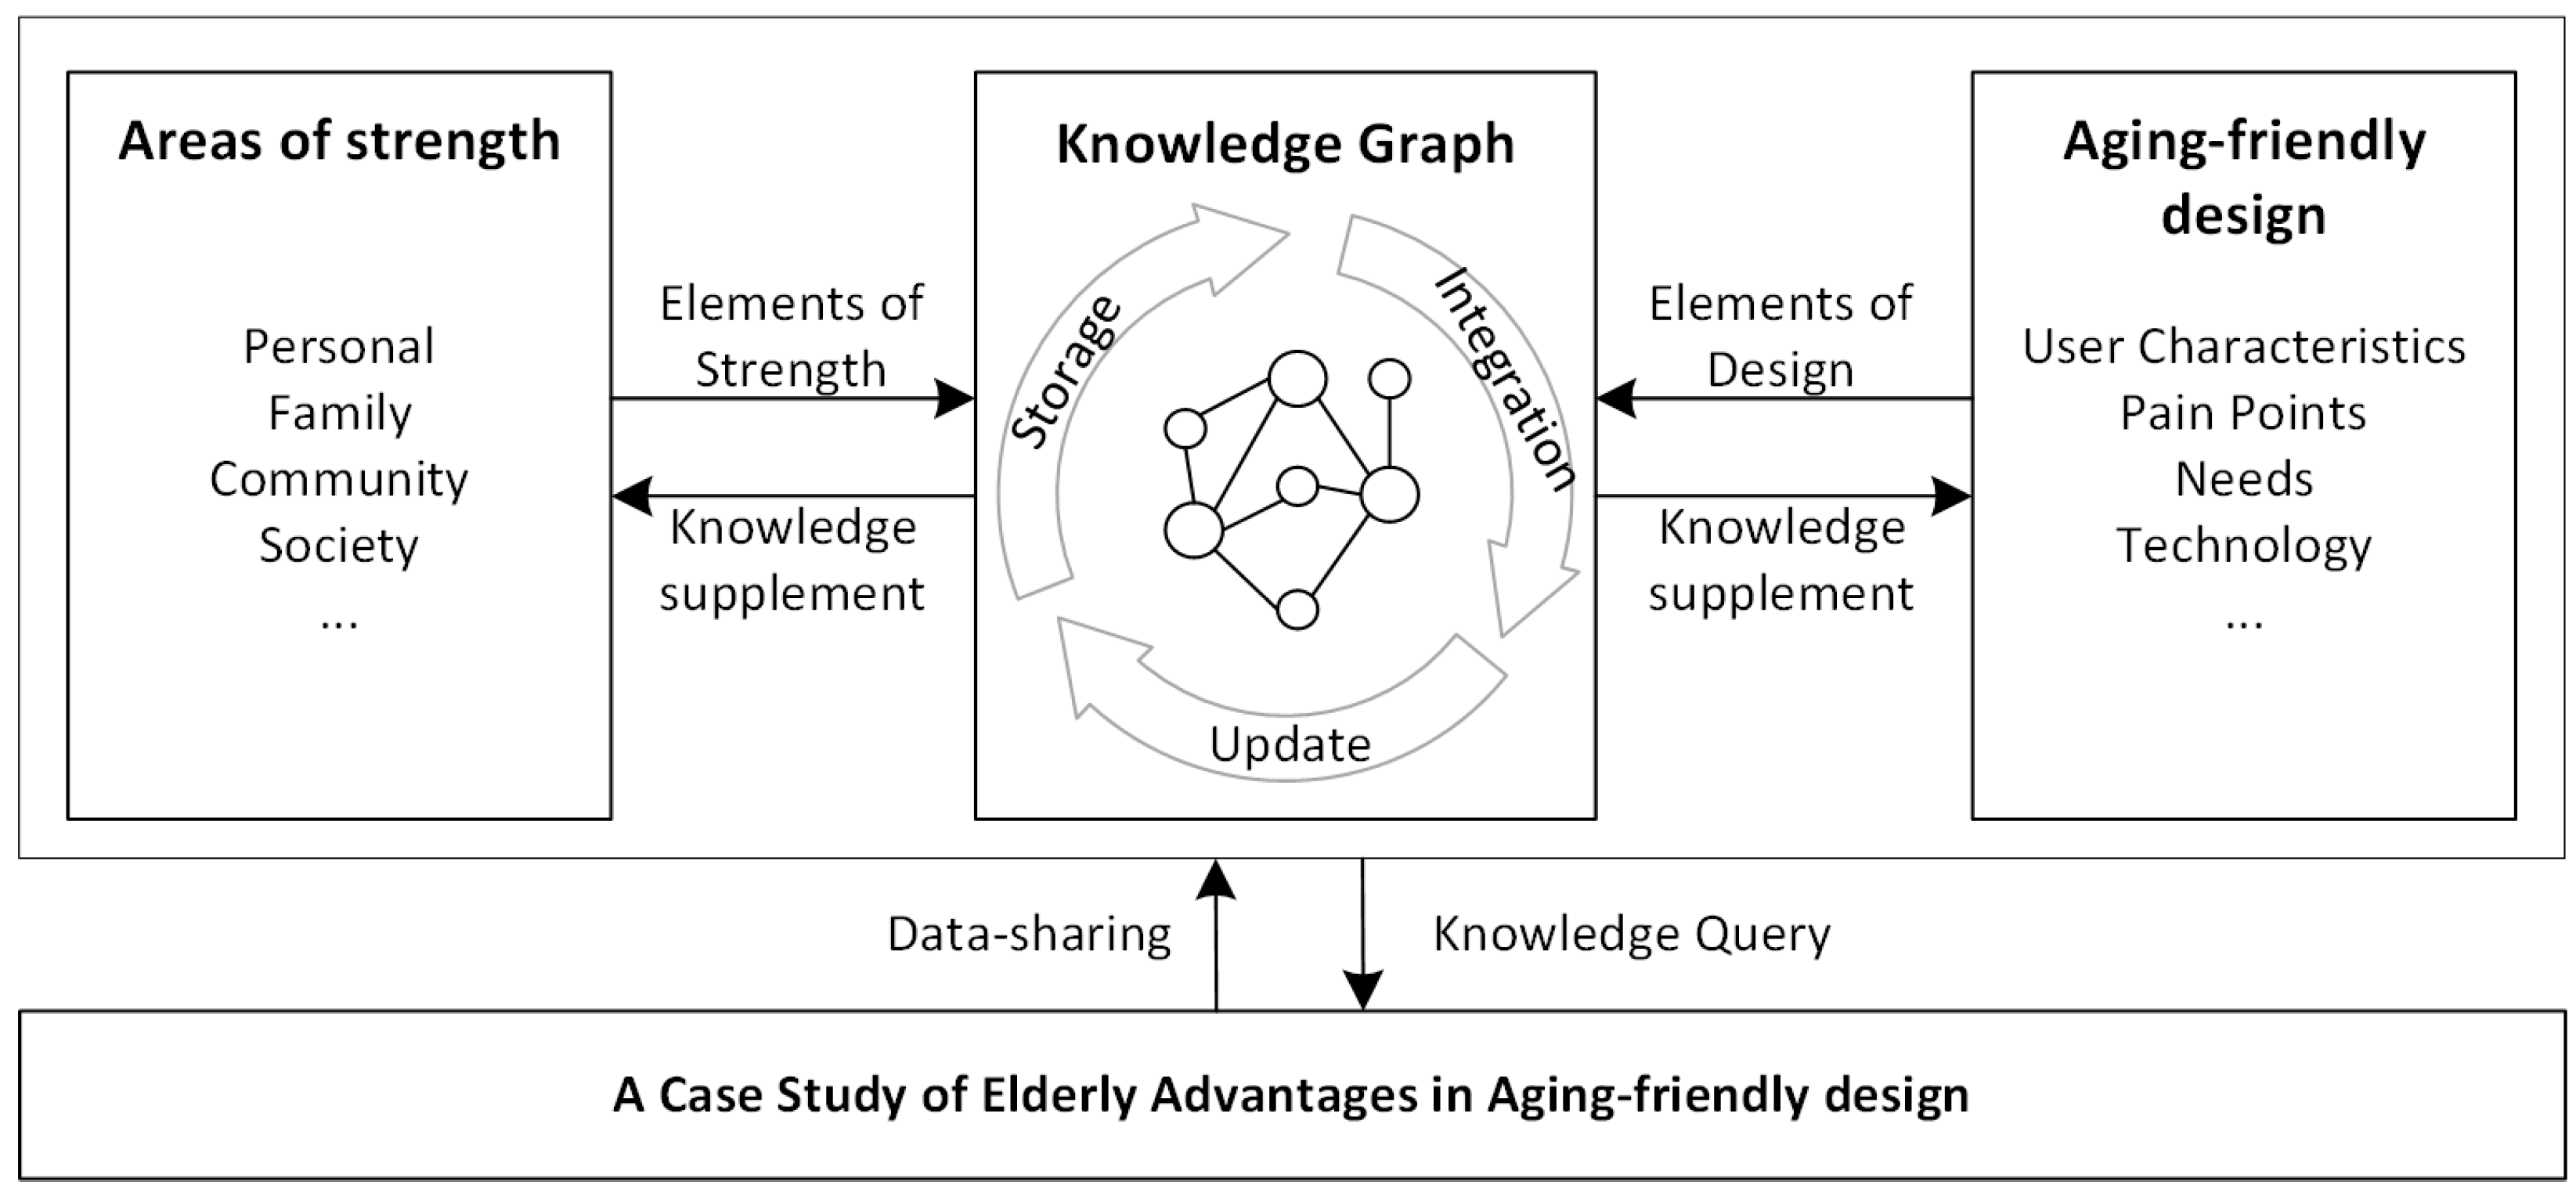
3.2.2. Conceptualization of “Elderly Advantages Knowledge Graph”

For need C, the researchers used knowledge graph technology to construct the data platform, which addresses the issues of data complexity, diversity, and siloing by structuring heterogeneous knowledge in the fields of advantage and age-friendly design [24]. Additionally, as a data visualization technique, the knowledge graph satisfies the requirements of needs D and E. With regard to selecting a database, the open-source platform Neo4j is more mature and supports the Cypher language, enabling a series of operations, such as add, delete, modify, and query, thus allowing users to create and adjust data and relationships. We used this as the foundation for conducting research on the construction of an elderly advantages knowledge graph. The research framework is illustrated in Figure 3.

3.3. Functional Envisioning of Elderly Advantages Knowledge Graphs

3.3.1. Advantageous Features Search

In the study of elderly advantages, we adopted the definition of user characteristics and introduced the concept of the characteristics of elderly advantages, which represent the advantageous attributes of a category of elderly individuals. The extraction of elderly advantage characteristics requires a large volume of data to ensure the completeness of data and representativeness of the sample, which are difficult to achieve in a single study. The researchers constructed an elderly advantages knowledge graph with the aim of encouraging relevant practitioners to collaboratively explore the characteristics of elderly advantage through data sharing. It is anticipated that, once a sufficient volume of data has accumulated, designers will be able to quickly identify the advantageous features of specific elderly groups by inputting search commands, significantly reducing the cost of data collection and enhancing design efficiency.
As shown in Figure 4, when using age as an example for retrieving advantageous features, the feedback results clearly present the beneficial attributes and characteristics of elderly individuals in different age groups, allowing designers to develop specific programs based on these advantageous features. In addition to age, designers can also use keywords such as gender, occupation, education level, and family economic status for elderly advantage retrieval based on certain design needs in order to ascertain the advantageous characteristics of elderly individuals under different attributes.

3.3.2. Search for Advantages Related to Needs

When designing in the context of elderly advantages, one approach is to promote the activation of this group’s potential advantages to meet the users’ own needs. Therefore, the second function we had hoped this graph could perform is as follows: after identifying the needs of elderly users, these needs can be used as keywords to investigate and obtain the relevant elderly advantage entries. The expected outcome is shown in Figure 5, which clearly presents the advantages related to needs N1 and N2.

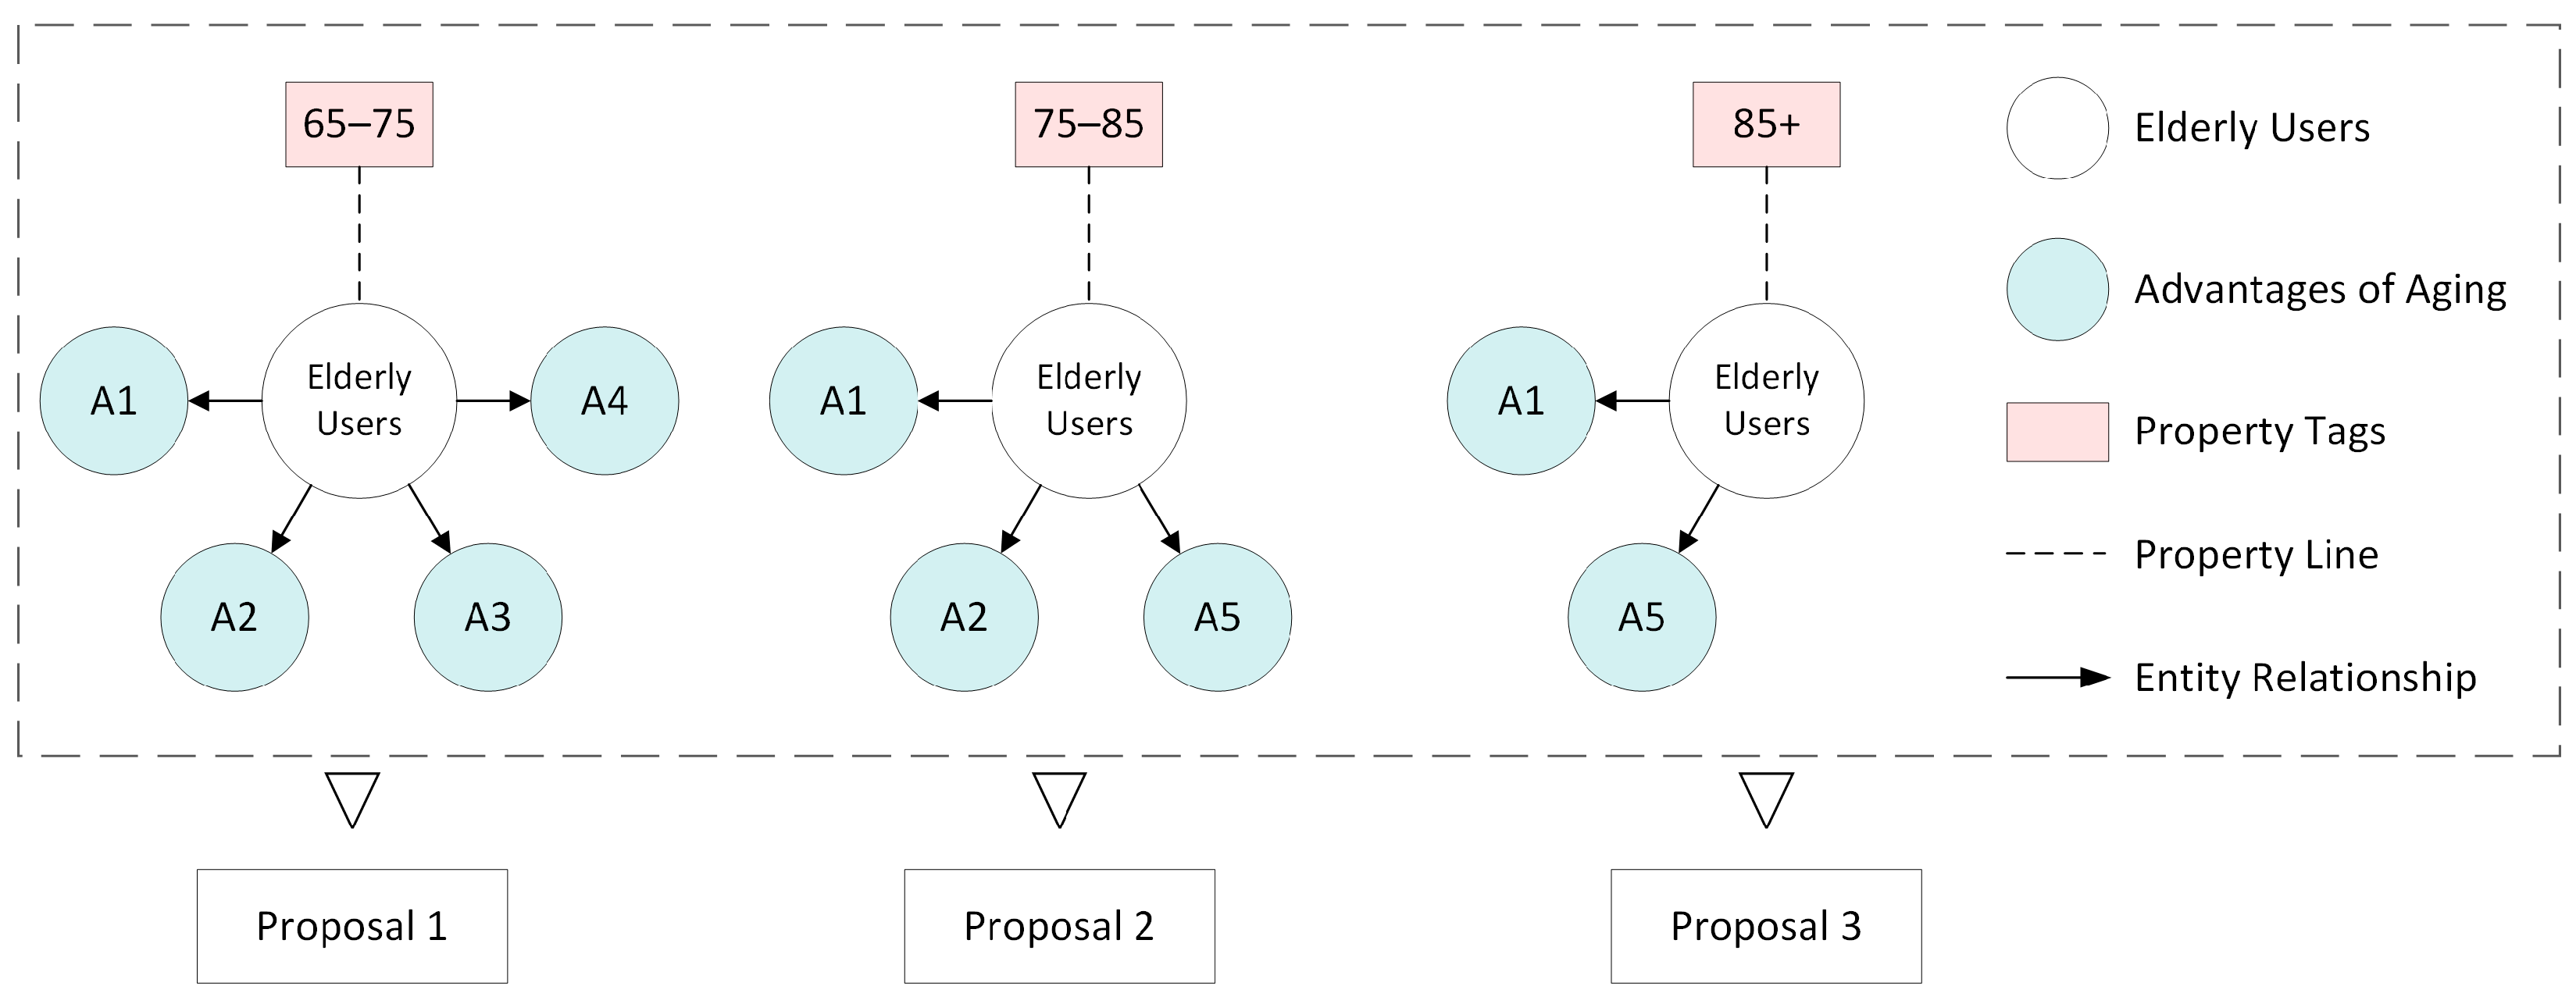
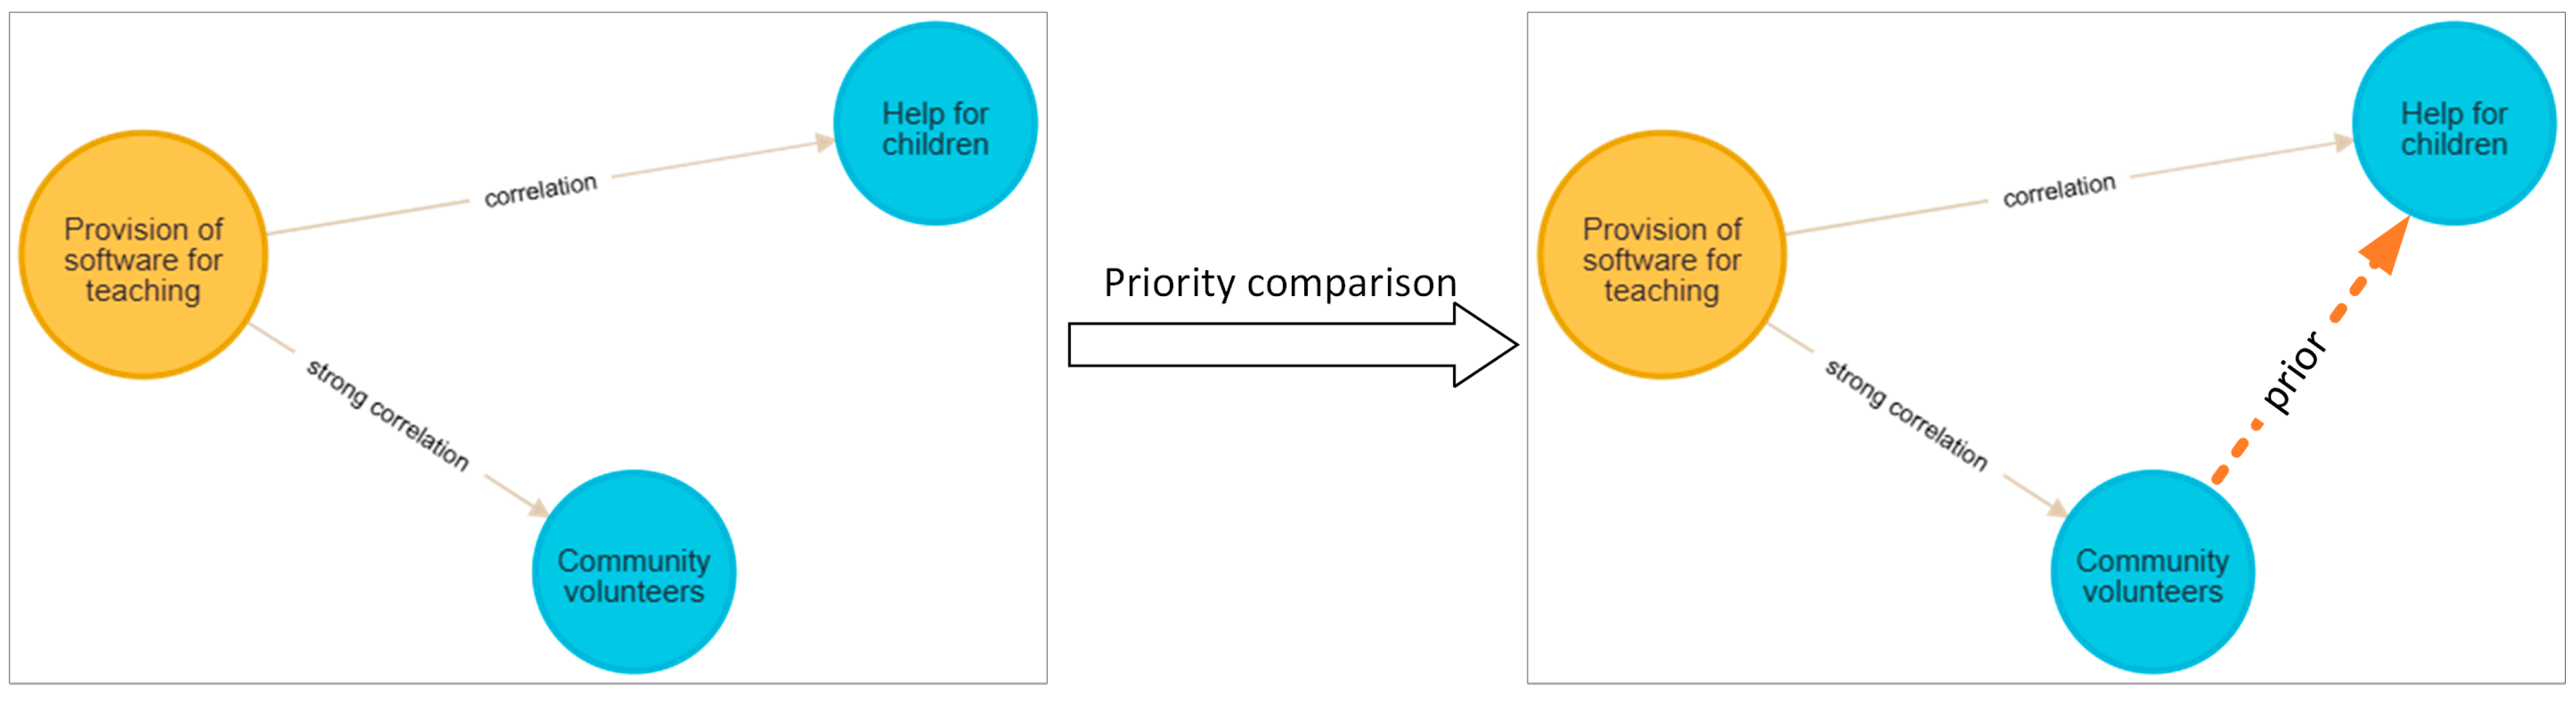
3.3.3. Prioritization of Advantages

When multiple advantages are related to needs, different advantages may lead to different design outcomes. Therefore, it is necessary to determine the application priority of these advantages. In this study, we established priority by assigning correlation value attributes to the data relationships. As shown in Figure 6, advantages A1, A2, and A3 are related to need N2, with correlation values of 3, 2, and 1, respectively. Therefore, the priority of advantage application can be ranked as follows: A1 > A2 > A3.

4. “Elderly Advantages Knowledge Graph” Construction

The construction of a knowledge graph encompasses four levels: a data layer, a model layer, a knowledge layer, and an application layer [20]. The process of constructing the knowledge graph is shown in Figure 7. The first step was constructing the data layer, where the combined KJ-AHP method was used to analyze the survey data and organize the data into the form of SPO (subject–predicate–object) triplets. The second step was constructing the model layer, which involved developing the ontology of the graph. The core idea for developing the ontology in this study was to design it through functional backward reasoning. The third step was constructing the knowledge layer, which involved knowledge extraction and graph visualization. The fourth step was constructing the application layer, which focused on evaluating the functionality of the knowledge graph. We analyzed the strengths and weaknesses of the graph through testing tasks and satisfaction surveys, ultimately proposing directions for its improvement.

4.1. Elderly Advantages and Design Application Case Studies

The literature indicates that travel restrictions are widespread among the elderly and have a negative impact on their physical and mental health [25]. In addition, in China, the proportion of elderly individuals using the subway for travel is significantly lower than that of other modes of transportation. This study focuses on the subway travel behavior of the elderly and, based on this focus, outlines the data collection process for constructing a knowledge graph of elderly advantages.

4.1.1. Methods Used in Case Study Research

  • KJ Method (Affinity Diagram)
The KJ method is a creative thinking tool that was introduced by Japanese scholar Jiro Kawakita in the 1960s [26]. The basic principle of this method is to encourage free discussion, allowing team members to fully express their opinions and ideas, thereby deeply exploring and organizing user needs [27]. The KJ method is suitable for diverse and qualitative information, helping decision makers categorize and organize scattered data. In this study, this method was employed to categorize mobility-related needs and advantages specific to the elderly.
  • AHP (Analytic Hierarchy Process)
The AHP is a multi-criteria decision-making method that was introduced by Professor T.L. Saaty in the early 1970s [28]. It is extensively applied in analysis and decision-making for complex issues. The fundamental principle of the AHP is to decompose a complex decision problem into multiple hierarchical levels, typically consisting of a goal layer, a criteria layer, and a sub-criteria layer. The goal layer sits at the top of the hierarchy and represents the ultimate objective or desired outcome of the decision-making process. The criteria layer represents the key standards or sub-goals influencing the goal layer, encompassing the critical factors or evaluation criteria to be considered in the decision-making process. Finally, the sub-criteria layer, located at the bottom level, contains the individual requirements or alternative options. The AHP allows experts and decision makers to make comparative judgments to assess the importance and influence of factors at each level, ultimately determining the priority of each sub-criterion and selecting the optimal solution. Its advantage lies in its flexibility, enabling integration with various decision evaluation methods to provide a more objective basis for decision-making [29].

4.1.2. Data Survey

  • User Behavior Survey
According to Nielsen’s classic theory, five participants are typically sufficient to identify 85% of the issues that emerge during the usage process in qualitative research [30]. The researchers observed the subway travel behavior of elderly individuals at a subway station in Wuhan, collected behavioral data, and organized the elderly individuals’ subway travel process (Figure 8).
  • User Needs Survey
Based on the elderly subway travel process, the researchers expanded the scope of this study. The researchers conducted unstructured interviews with elderly individuals across eight subway stations in Wuhan, involving 72 participants in total. During the interviews, the researchers appropriately guided the interviewees to reflect on their past experiences. This approach enriched the data related to their needs and enhanced the validity of the collected content. Table 3 presents a summary of the basic information of the interviewees, which can be incorporated into the knowledge graph as user attributes. Age classification was performed according to the general standards of the WHO, with 73 years old serving as the dividing line. Finally, all data were organized into SPO triples, with the following serving as an example: <user 1, age attribute, 65–73>.
  • Elderly Advantages Survey
We employed the interview method to investigate elderly advantages. The target group comprised 72 elderly individuals aged 65 to 85, all of whom had independent mobility. The average interview duration was between 10 and 15 min. Raw data were collected through text and audio recordings obtained with the participants’ consent. We adopted the ROPES (Resources, Opportunities, Possibilities, Exceptions, and Solutions) interview framework from strengths perspective theory [31], with resources, opportunities, and possibilities serving as the primary interview topics for exploring advantages. The interview outline and content are shown in Table 4.
  • Summary of research data
The user journey map is a crucial tool in service design, providing a visual representation of users’ experiences, subjective reactions, and emotions during their interactions with a product or service. This map enables designers to gain insights into user needs and expectations from the user’s perspective [32]. In this study, redundant data were removed, and all collected user behavior data were summarized to create a user journey map. By analyzing the users’ pain points and satisfaction in combination with the interview contents, we derived the needs of elderly users in subway travel. We also compared available options during the users’ travel processes and, based on the interview results, pinpointed elderly advantages, categorizing them into capabilities and resources. The specific details are shown in Figure 9.

4.1.3. Demand Data Processing

  • Categorization of needs
First, we clearly defined the objective of the case study, which was to adapt the existing travel environment for the elderly to better support their mobility. This objective was set as the goal layer in the AHP.
Next, we used the KJ method to organize and categorize the demands in the user journey map, summarizing the following four categories of primary needs related to elderly mobility: (1) the need to reduce physical exertion, including the following sub-needs—provisions for heavy-item storage, opportunities for rest during travel, a reduction in walking, and promotion of physical exercise; (2) software-related learning needs, including the following sub-needs—elderly-friendly software interaction, enhanced software tolerance, and provision of stable software guidance; (3) directional recognition during travel, including the following sub-needs—elderly-friendly guide maps, train number indicators, exit prompts, popularization of relevant software, and the use of assistive tools and devices; and (4) communication and feedback needs after travel, including the following sub-needs—development of online communication platforms, community experience sharing, and feedback support.
Finally, the four primary needs related to elderly mobility were set as the criteria layer in the AHP, with the sub-needs set as sub-criteria layers, and an AHP hierarchical model for the identified needs was thus constructed. The specific details are shown in Table 5.
  • Analytic Hierarchy Process and Attribute Definition of Needs
The AHP is a widely used method in the design field for calculating the weight of user needs and distinguishing between core and general needs. In this study, the degree of importance was treated as an attribute of the need data, with the synthesized weight value serving as its attribute value. This value was then used to construct the knowledge graph. The following outlines the calculation process for determining the weight values.
We invited four design experts, four elderly participants, and two subway workers to score the importance of the criterion and sub-criterion layers in the need hierarchy using a 1–9-scale method. SPSSAU (https://spssau.com/) was used to calculate the weights, perform consistency tests, and rank the importance of the scoring results. Taking the criterion layer as an example, the calculation process was demonstrated by making pairwise comparisons between the scores for reducing physical exertion, software learning, direction recognition, and communication feedback. The average of 10 scores was then used as the final data to construct judgment matrix A.
A = 1 1 / 6 1 / 3 1 / 2 6 1 2 3 3 5 1 3 2 1 / 3 1 / 3 1
Characteristic equation of judgment matrix A:
A W = λ max W
The commonly used vector calculation methods in the analytic hierarchy process include the geometric mean and the arithmetic mean. The arithmetic mean method is more practical for discrete data. Therefore, we employed the arithmetic mean method to calculate the weight vector.
The judgment matrix was column-normalized as follows:
a ¯ i j = a i j / i = 1 n a i j ( i , j = 1 , 2 , , n ) = 0.0833 0.0833 0.0909 0.0667 0.5000 0.5000 0.5455 0.4000 0.2500 0.2500 0.2727 0.4000 0.1667 0.1667 0.0909 0.1333
The rows of the column-normalized judgment matrices were summed as follows:
W i ¯ = j = 1 n a ¯ i j ( j = 1 , 2 , , n ) = 0.3242 1.9455 1.1727 0.5576 T
The weights of the needs were calculated:
W i = W i ¯ / i = 1 n w ¯ i ( i = 1 , 2 , , n ) = 0.0811 0.4864 0.2932 0.1394 T
The largest eigenvalue was calculated:
λ max = i = 1 n ( A W ) i n w i = 1 4 × 0.3295 0.0811 + 1.9773 0.4864 + 1.1977 0.2932 + 0.5614 0.1394 = 4.0608
The consistency was verified:
C I = λ max n / n 1 = 4.0608 4 / 4 1 = 0.0203
C R = C I / R I = 0.0203 ÷ 0.89 = 0.023
The CI value of this fourth-order judgment matrix was determined to be 0.0203, while the RI value of the fourth-order matrix was found to be 0.890 in the table. The CR value was calculated as 0.023, which is less than 0.1 according to Formula (8), indicating that the judgment matrix passed the consistency test.
Following the above steps, the weights of the needs in the sub-criteria layer were calculated, the weight values of all judgment matrices were derived, and the comprehensive weights of each need in the sub-criteria layer were computed. The specific results are presented in Table 6.
Needs with a combined weight greater than 0.05 were defined as core needs, while those between 0.01 and 0.05 were defined as general needs, and needs below 0.01 were excluded due to their low importance.
  • Data collation
The above data we organized into the SPO triple format and stored in an Excel file. Example data content include <User Needs, Contains, Provide Software Instruction> and <Provide Software Instruction, Attribute: Core Needs, Attribute Value: 0.3367>.

4.1.4. Advantage Data Processing

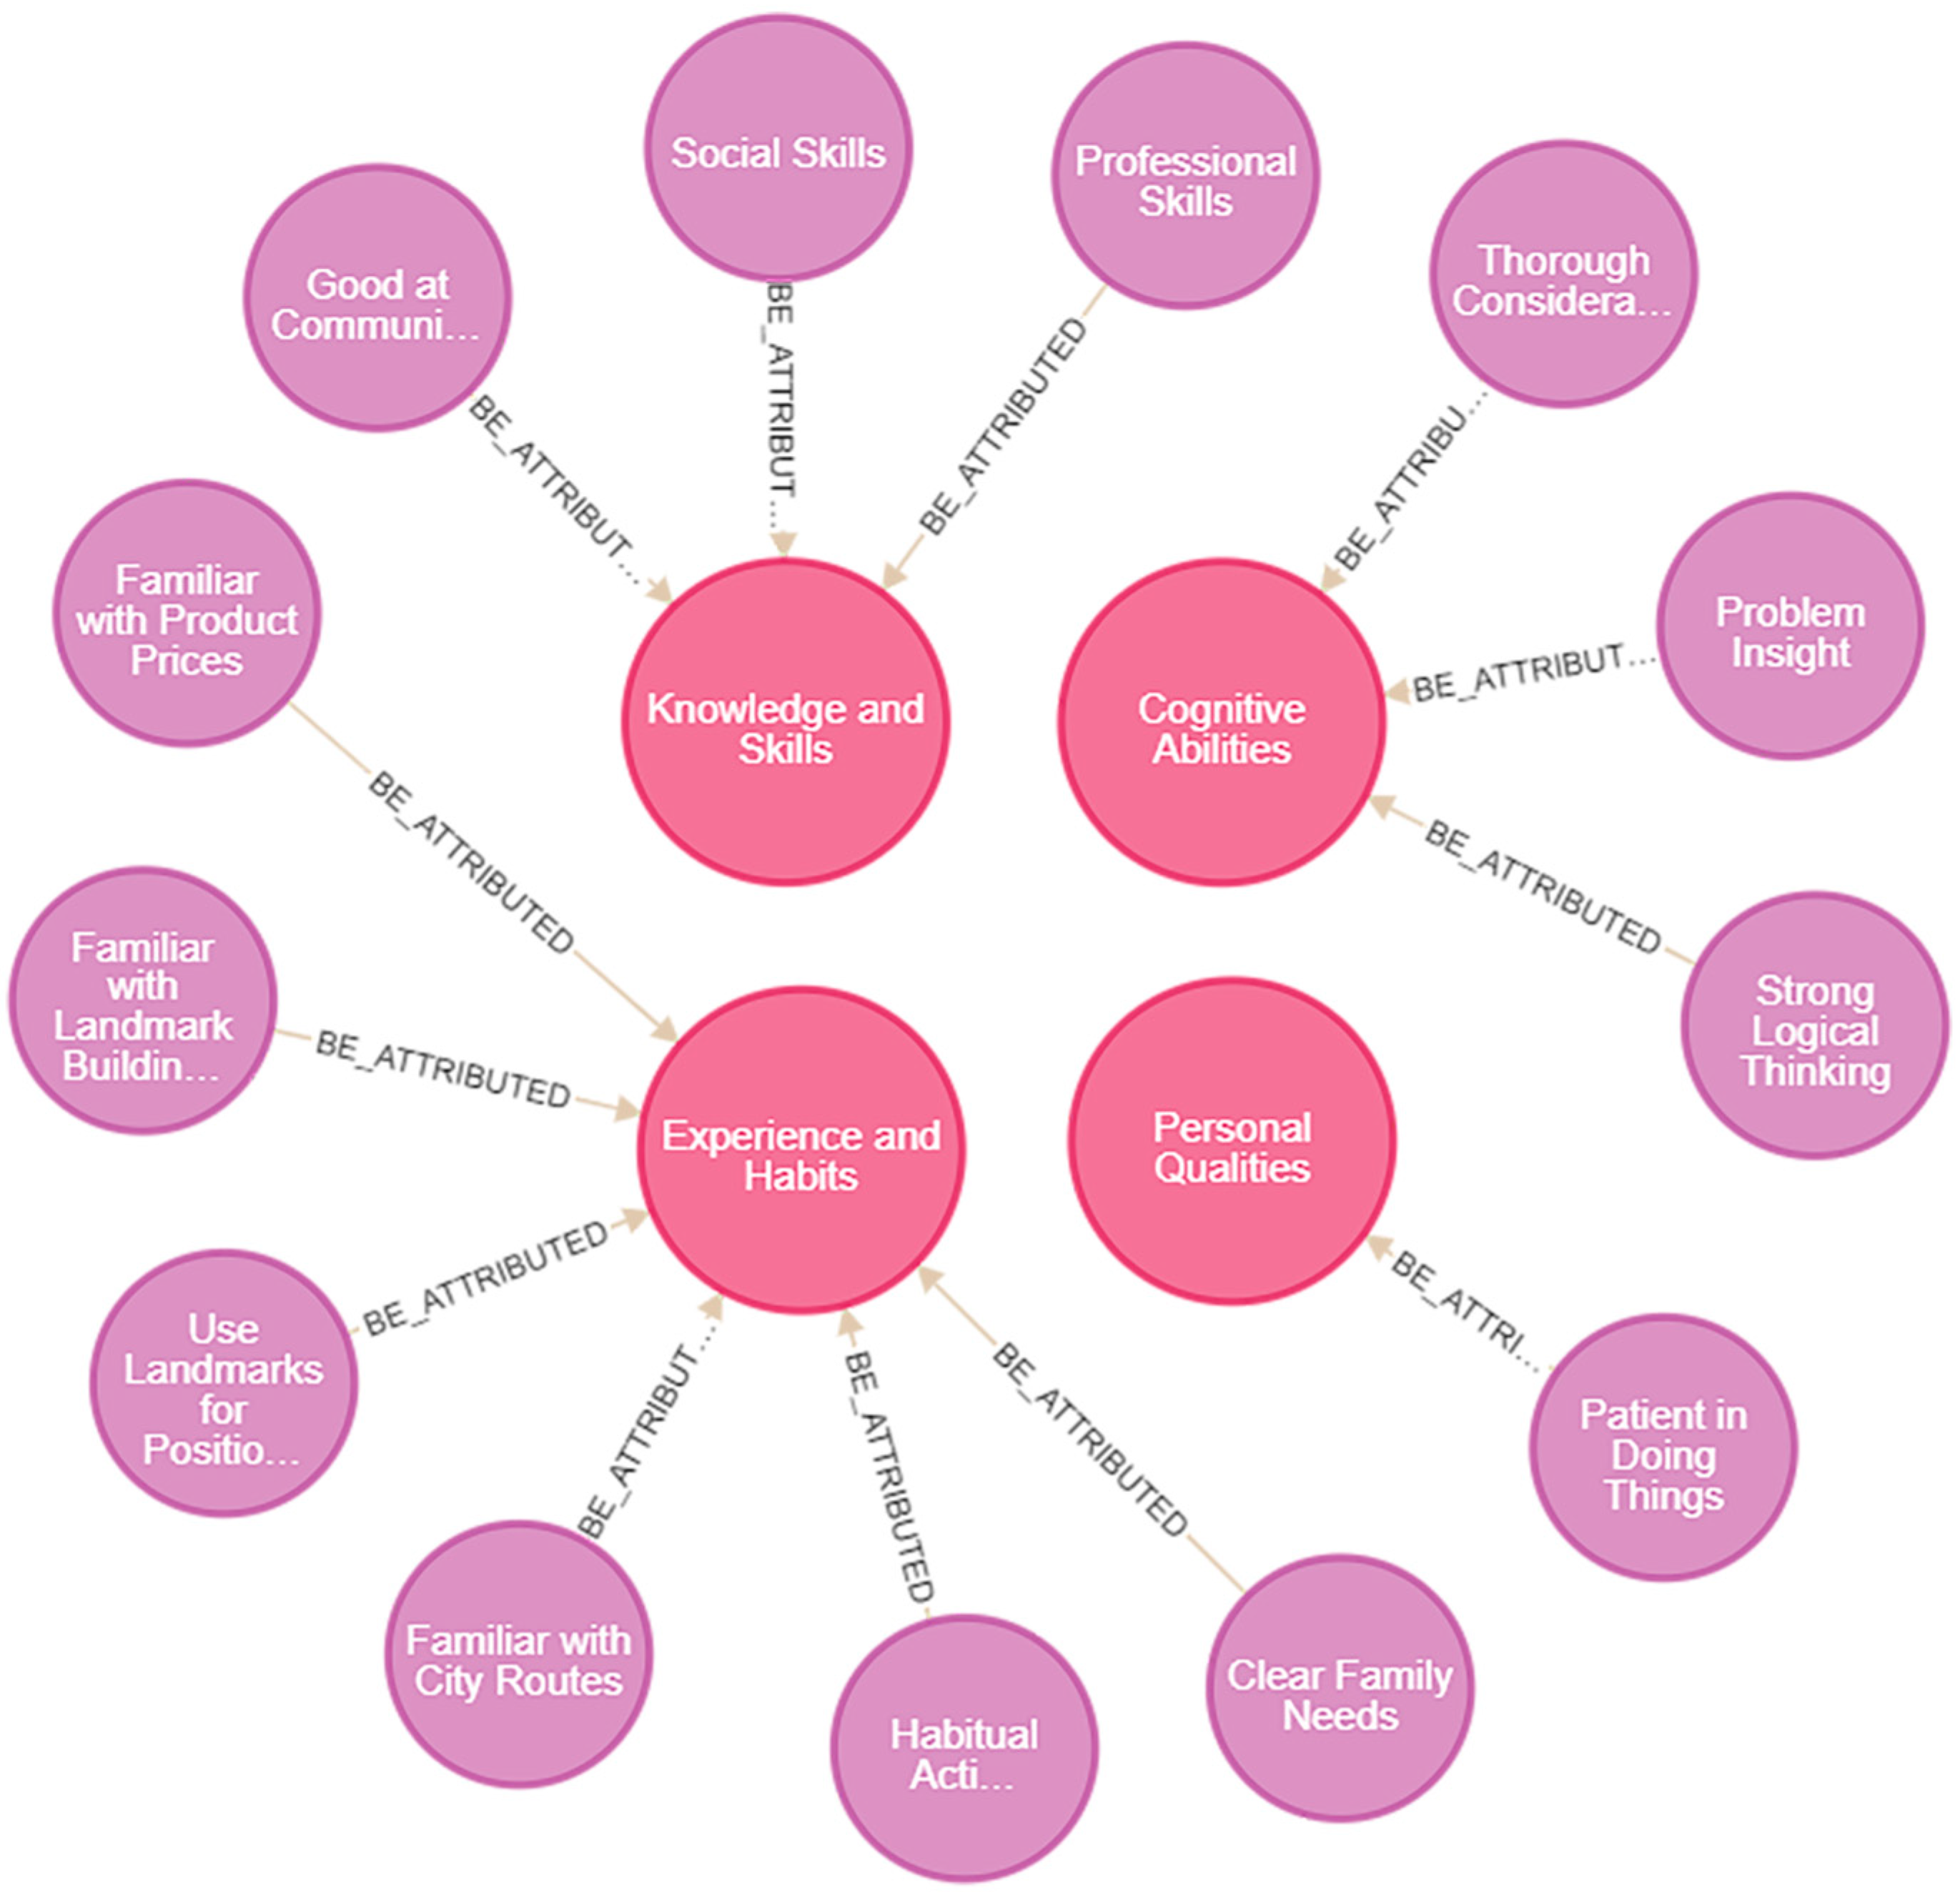
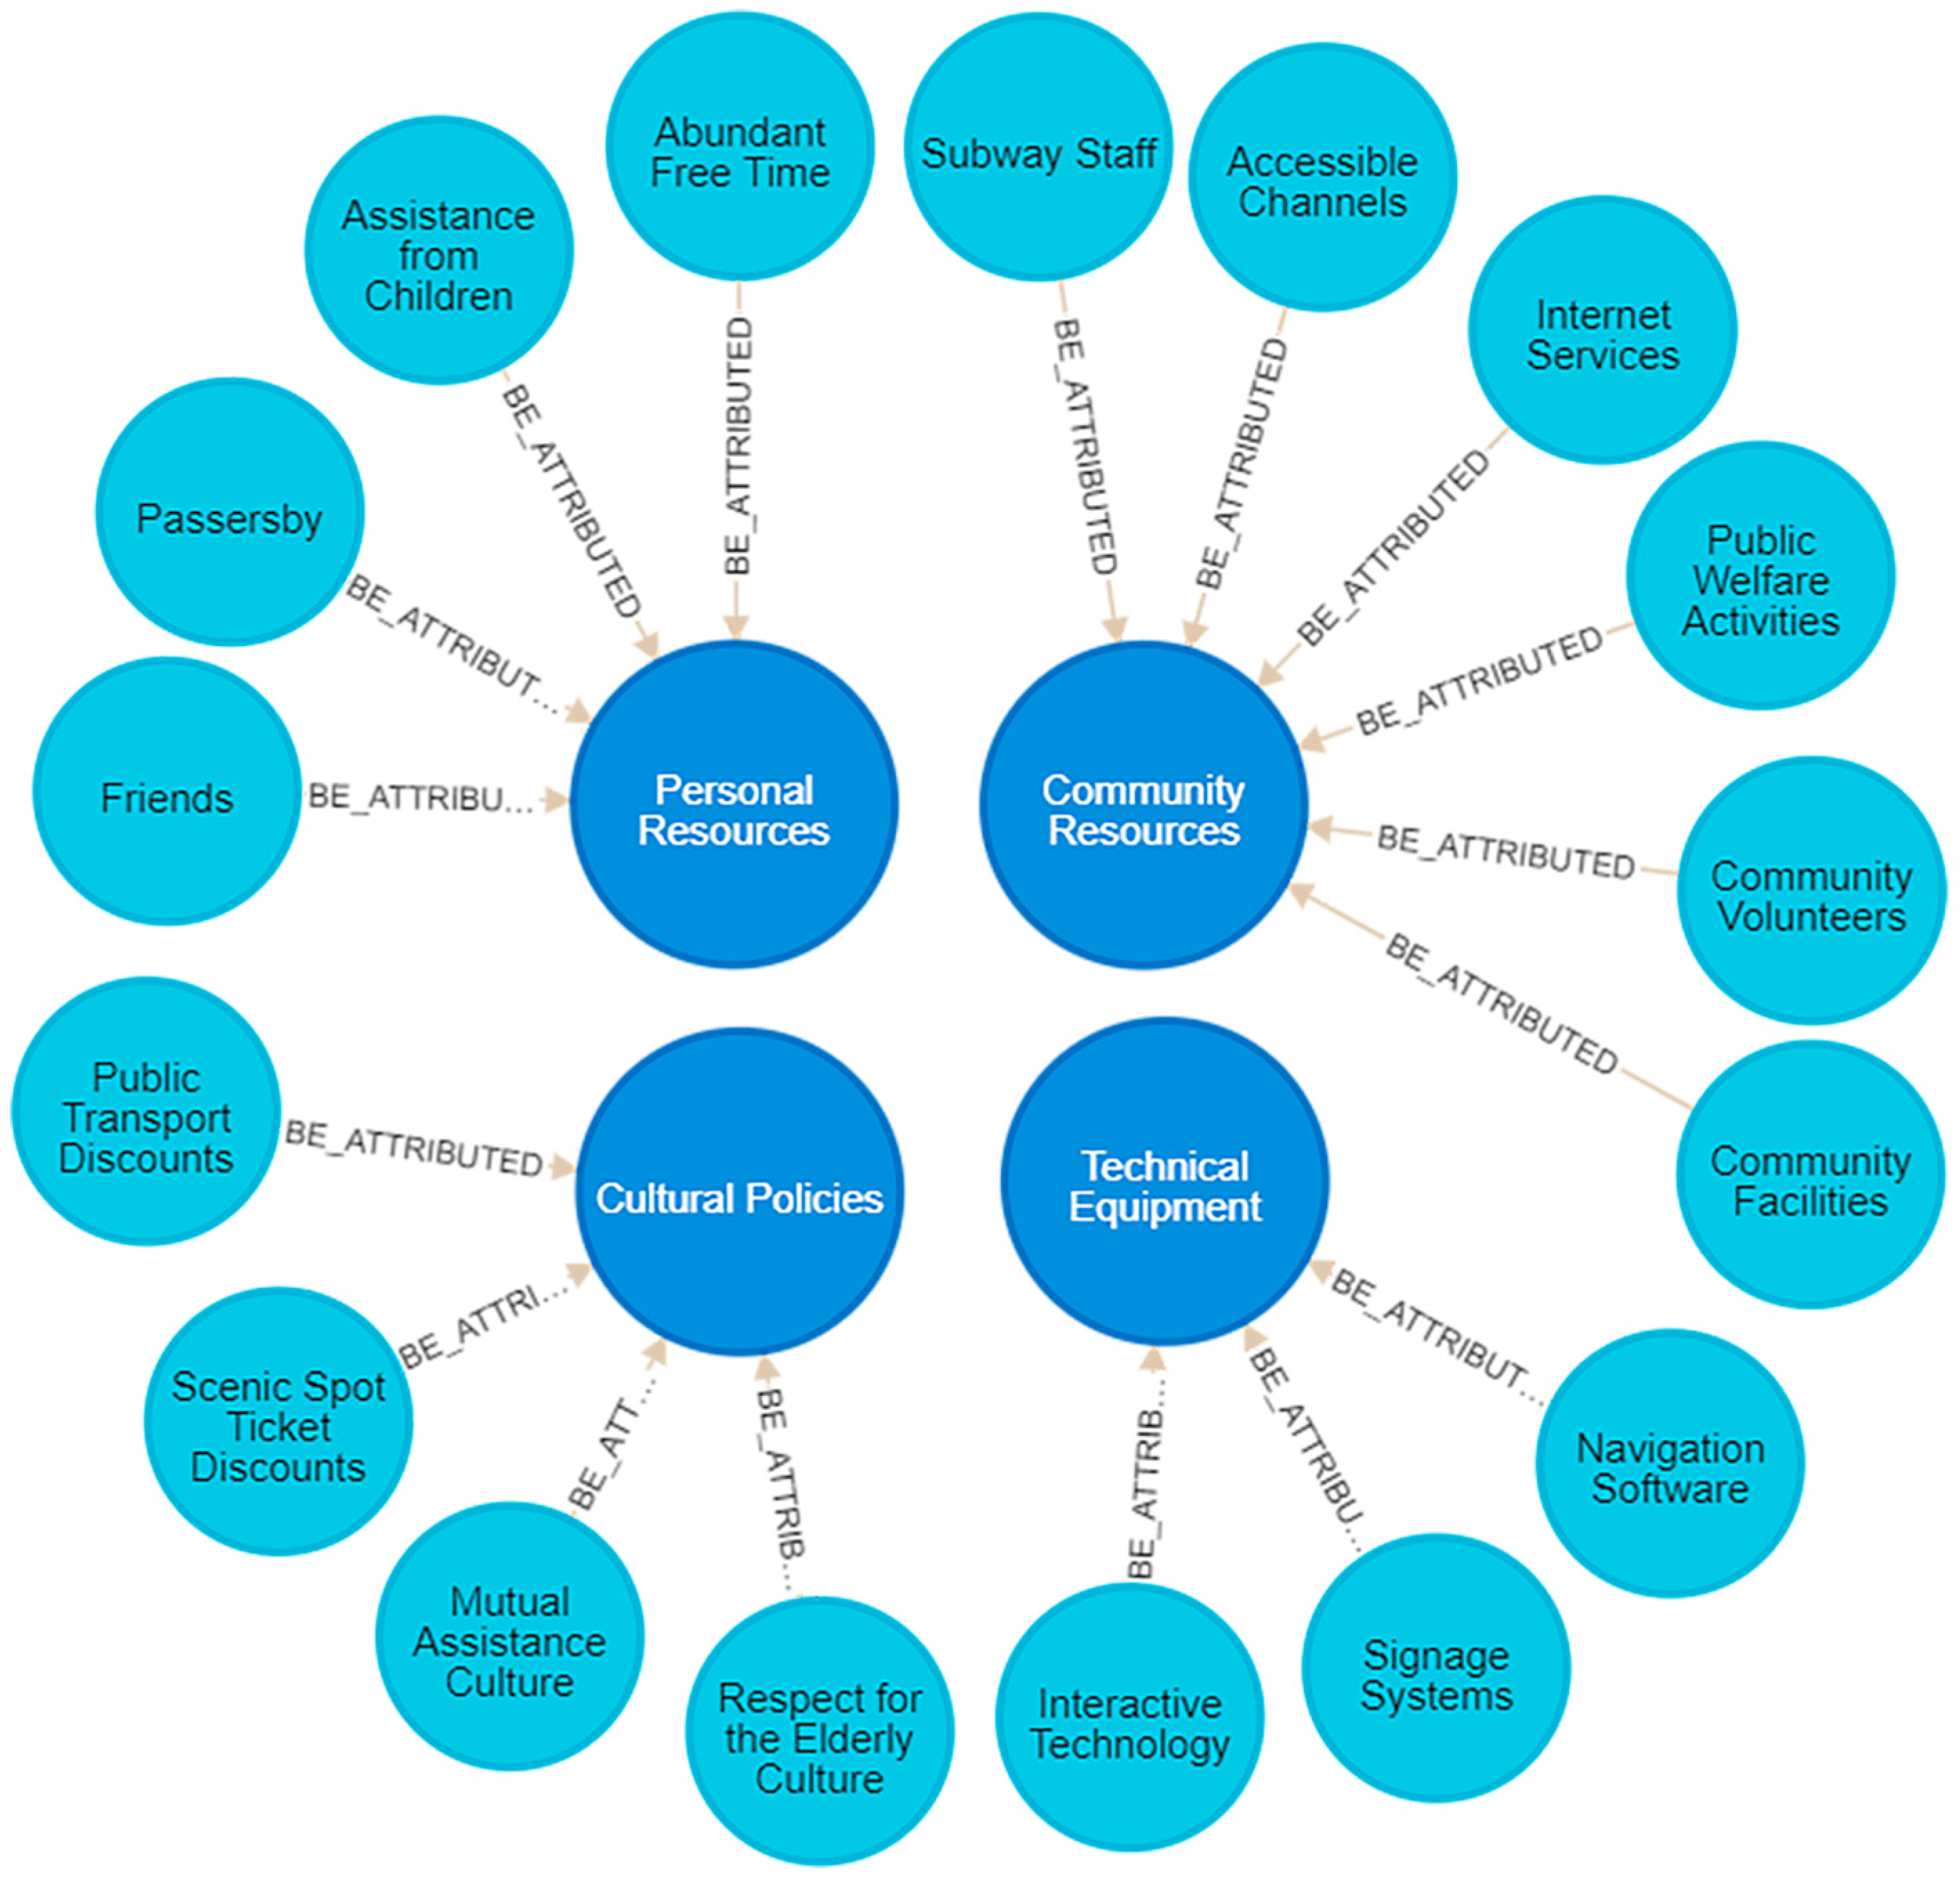
  • Classification of advantages
The KJ method was also employed in advantage categorization to organize the advantage entries collected from the user journey map. The categorization process involved design experts and users in the discussion, ensuring a high level of credibility. After removing duplicate phrases and merging semantically similar entries, a total of 31 initial advantages were identified, comprising 13 advantages in the capability category and 18 advantages in the resource category. Further categorization of the 31 advantages resulted in the identification of eight types of advantages. The capability category includes knowledge and skills, cognitive ability, experience and habits, and personal qualities. The resource category encompasses personal resources, public resources, technical equipment, and cultural policies. The details are shown in Table 7.
  • Establishing relevance to needs
In this phase, the researchers invited six graduate student instructors to assess the correlation between needs and advantages. During the assessment process, the design experts compared each advantage with the corresponding need to determine whether a design solution meeting the need could be generated. They assigned scores based on the number and difficulty of the solutions generated. To reduce the difficulty of assessing correlations, we employed a simplified version of the Likert scale, with a range of 0 to 3, where the values represent irrelevant, weakly correlated, moderately correlated, and strongly correlated, respectively. In order to control bias, the six tutors conducted multiple rounds of scoring. Additionally, to avoid the influence of extreme scores on the final result, we selected the most frequent score as the final score rather than using the average score. The final scoring results are shown in Table 8.
  • Data collation
The above data were organized into SPO triple format and stored in an Excel file. Example data content include <Elderly Advantages, Contains, Good Communication Skills> and <Good Communication Skills, Strong Relevance, Software Teaching>.

4.2. Ontology Construction for Elderly Advantages Knowledge Graph

Ontology and knowledge graph (KG) methods are essential for achieving semantic integration, effectively addressing semantic heterogeneity in systems engineering through formalization, normalization, and shareability [33,34]. In this study, we adopted a method consisting of constructing the ontology by reasoning based on graph functionality, which is essentially an improvement of the rule-based construction approach. The application steps included demand analysis of graph functionality, ontology derivation, verification and supplementation, and ontology construction.
Function 1: Advantageous feature retrieval: Relevant entities include “user”, and “elderly advantages”, with user attributes including age, gender, and so on.
Function 2: Relevant advantage query for needs: The relevant entities include “user needs”, and “elderly advantages”, with a relational connection between the needs and advantages.
Function 3: Prioritization judgments for advantageous applications: The relevant entities include “user needs” and “elderly advantages”, and there are associative attributes between needs and advantages.
In summary, the core classes of the elderly advantages knowledge graph ontology include users, user needs, and elderly advantages. By referring to the user journey map from the previous data survey, pain point behaviors were integrated into the ontology to supplement contextual information when user needs are generated, thereby optimizing the content of the ontology.

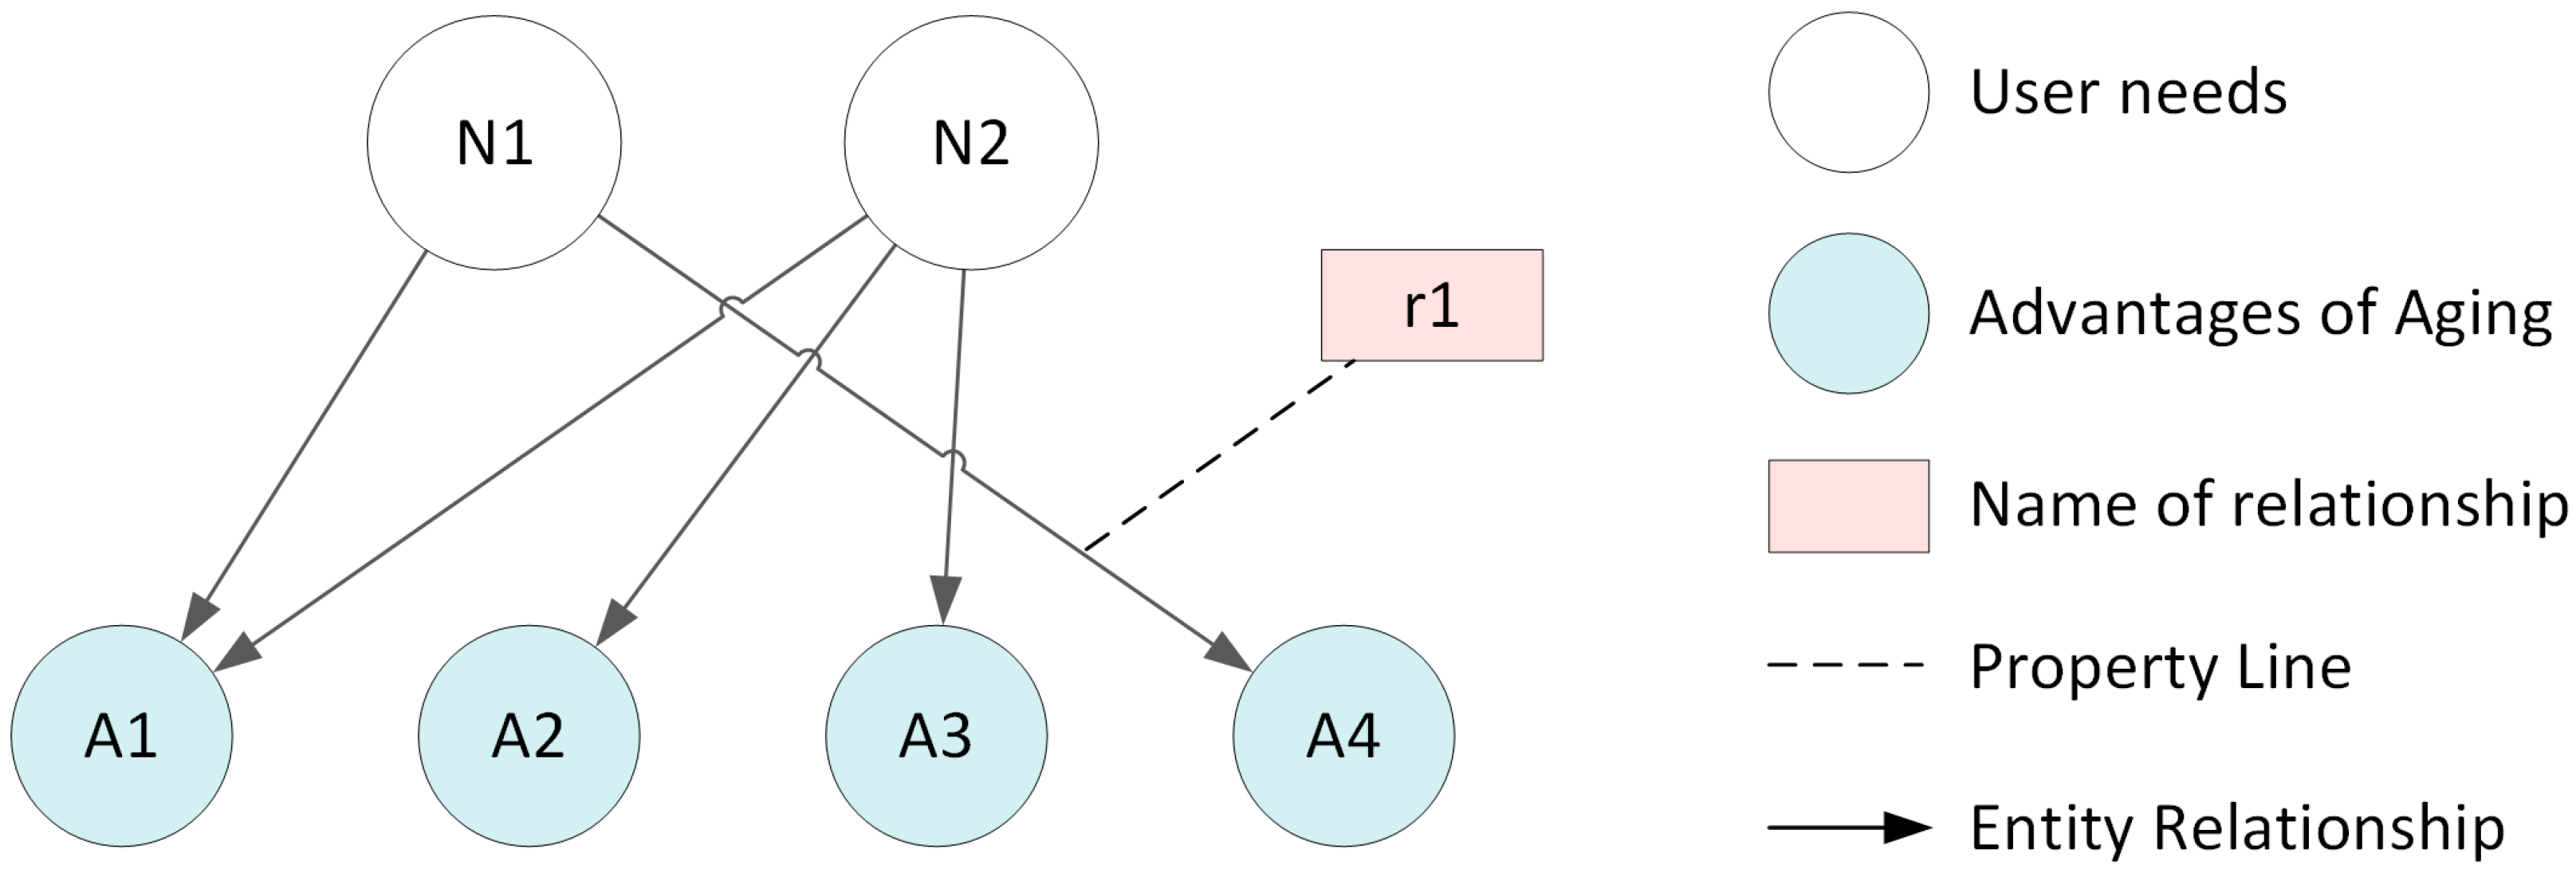
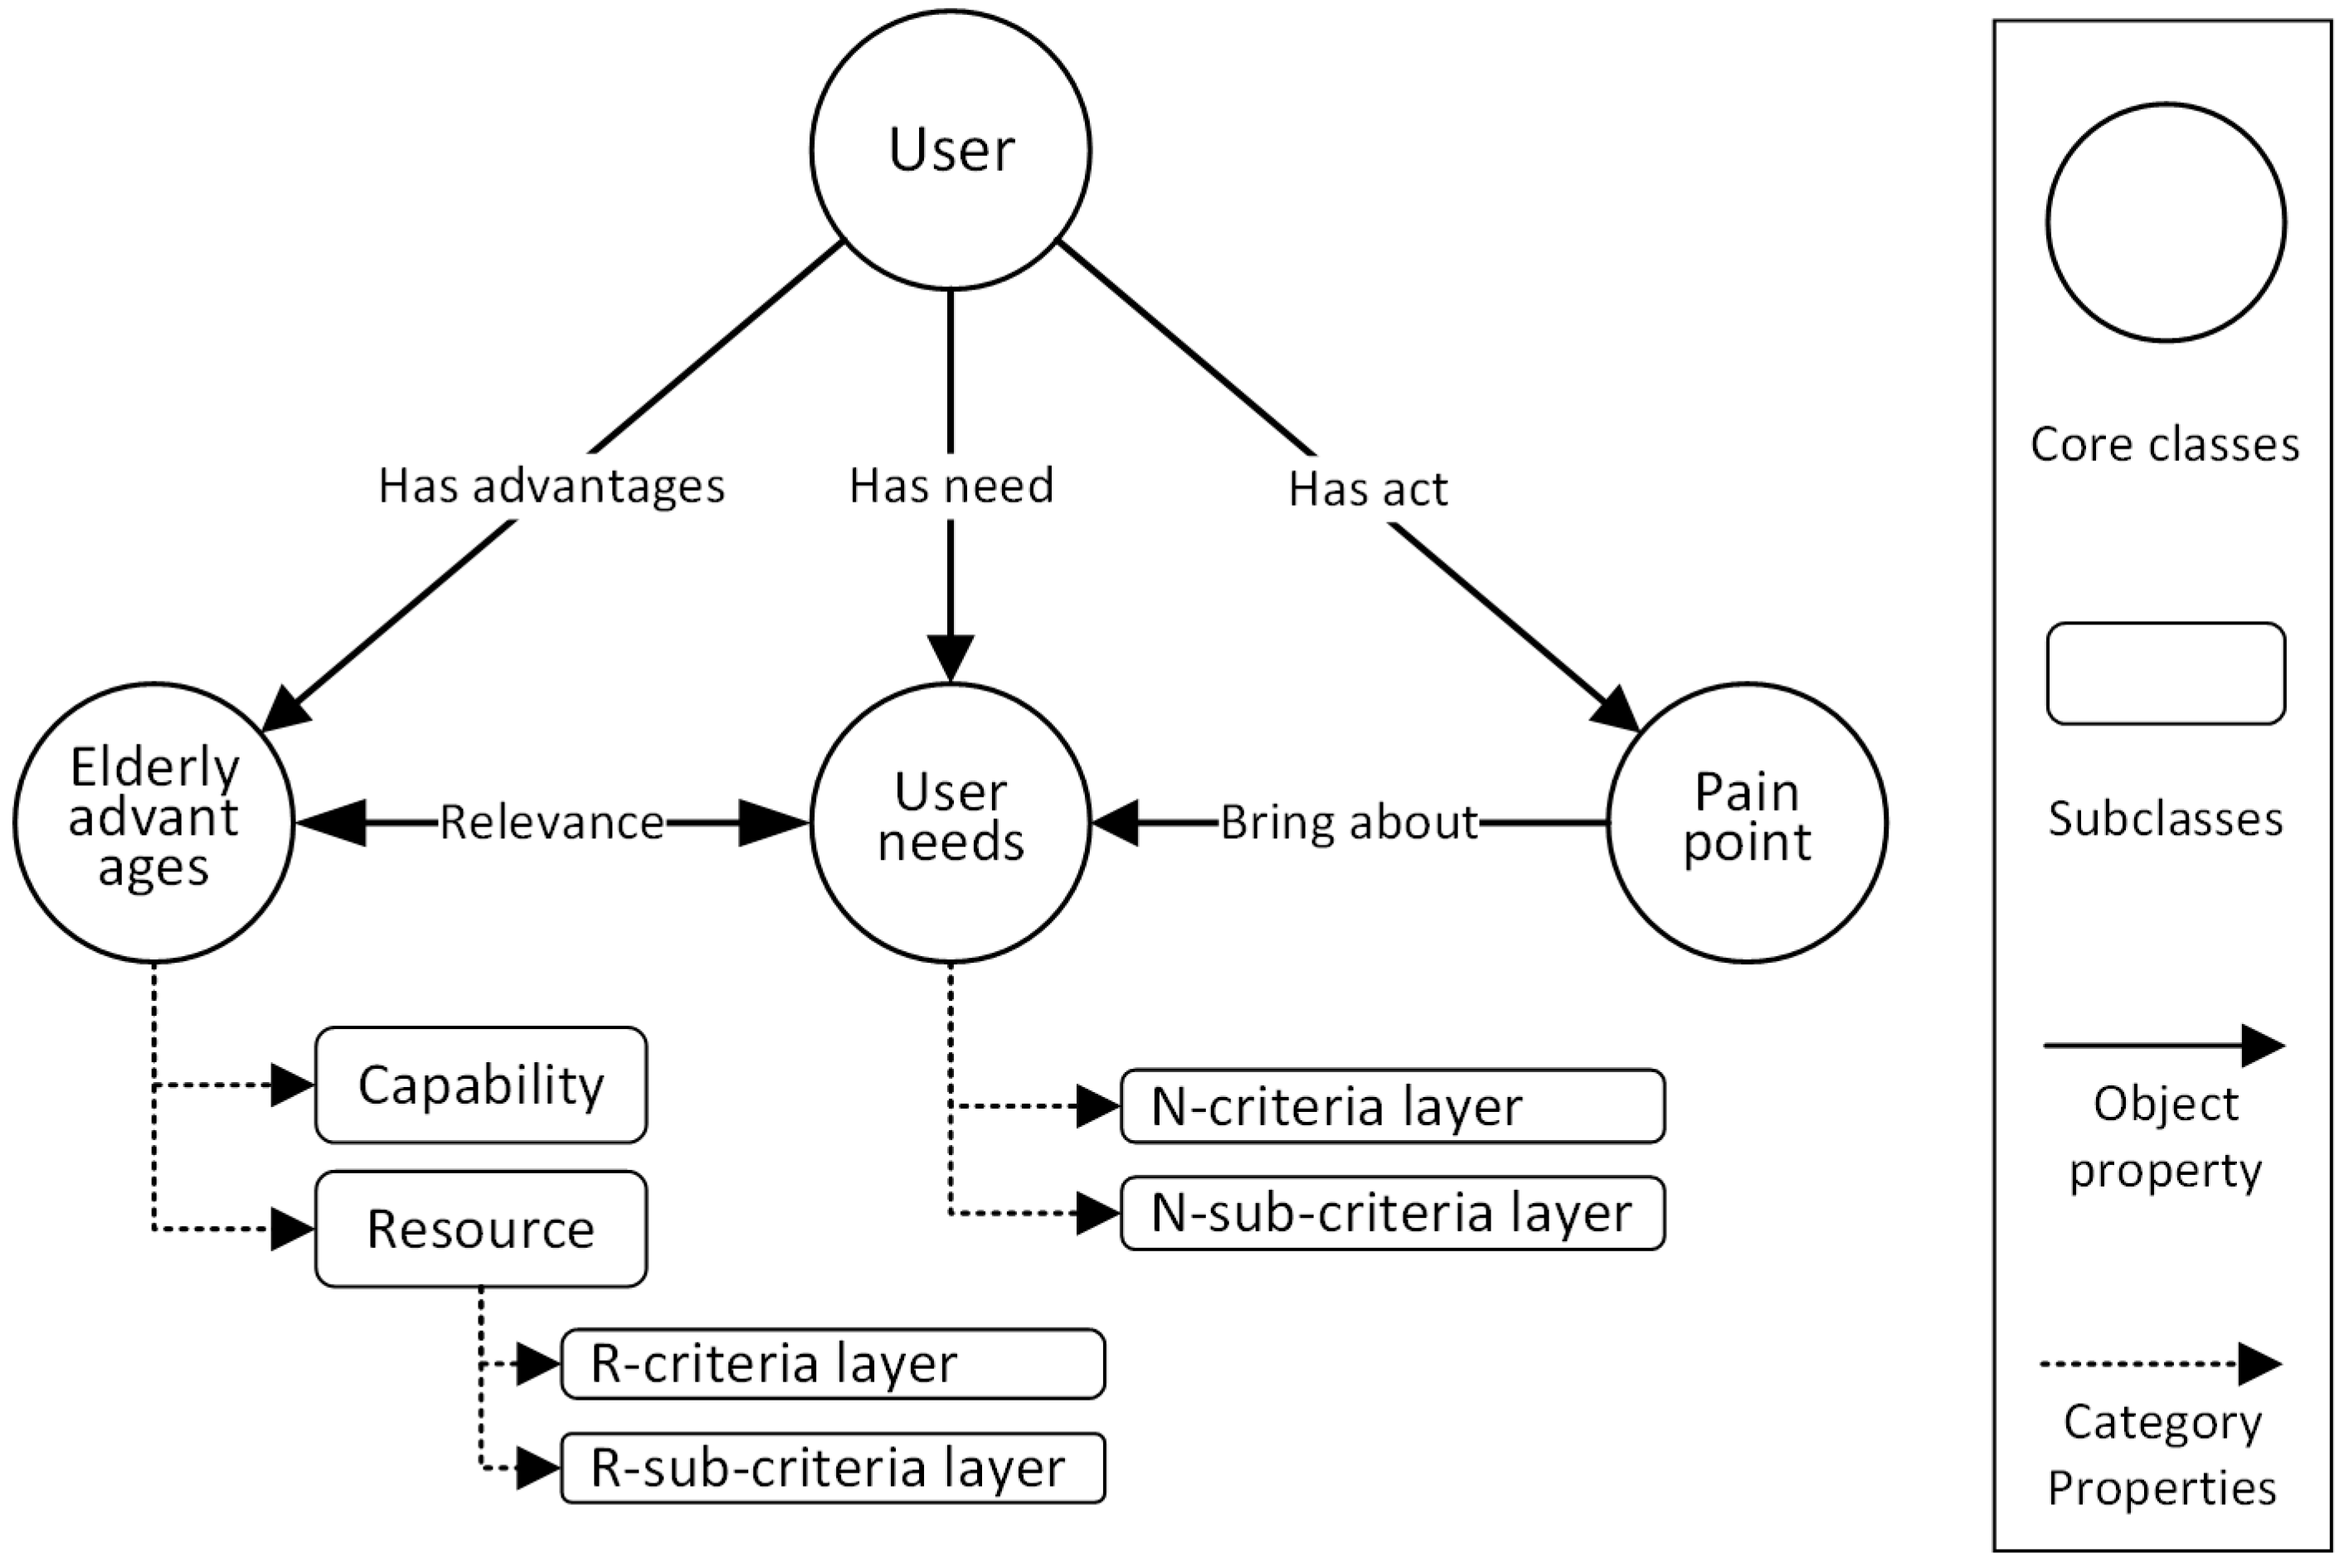
4.2.1. Core Classes and Their Attribute Relationship Definitions

Definition 1 (user): Unlike the traditional concept of a user in data-related fields, the user in design refers to a group characteristic, representing a class of individuals with similar traits or attributes. In this study, the user’s attributes include three fundamental pieces of information, namely, age, gender, and activity ability, which form the basis for identifying elderly advantages. Associations are established between these attributes and pain point behaviors, user needs, and elderly advantages.
Definition 2 (pain point behavior): This refers to behaviors that result in poor user experience during the use of a product or service. It reflects the situational information when a user need arises. These pain point behaviors are associated with user needs.
Definition 3 (user needs): This refers to the unmet functional requirements and experiences of users when using a product or service, typically generating specific associations with pain point behaviors. In this case study, based on the AHP hierarchical analysis method, the subcategories of user needs are defined as N-criteria layer and N-subcriteria layer.
Definition 4 (elderly advantages): Elderly advantages fall under two categories: capabilities and resources. In this case study, based on the AHP hierarchical analysis method, both capabilities and resource advantages are further divided into subcategories, namely, C-criteria layer, C-subcriteria layer, R-criteria layer, and R-subcriteria layer.
The final constructed knowledge graph ontology is shown in Figure 10.

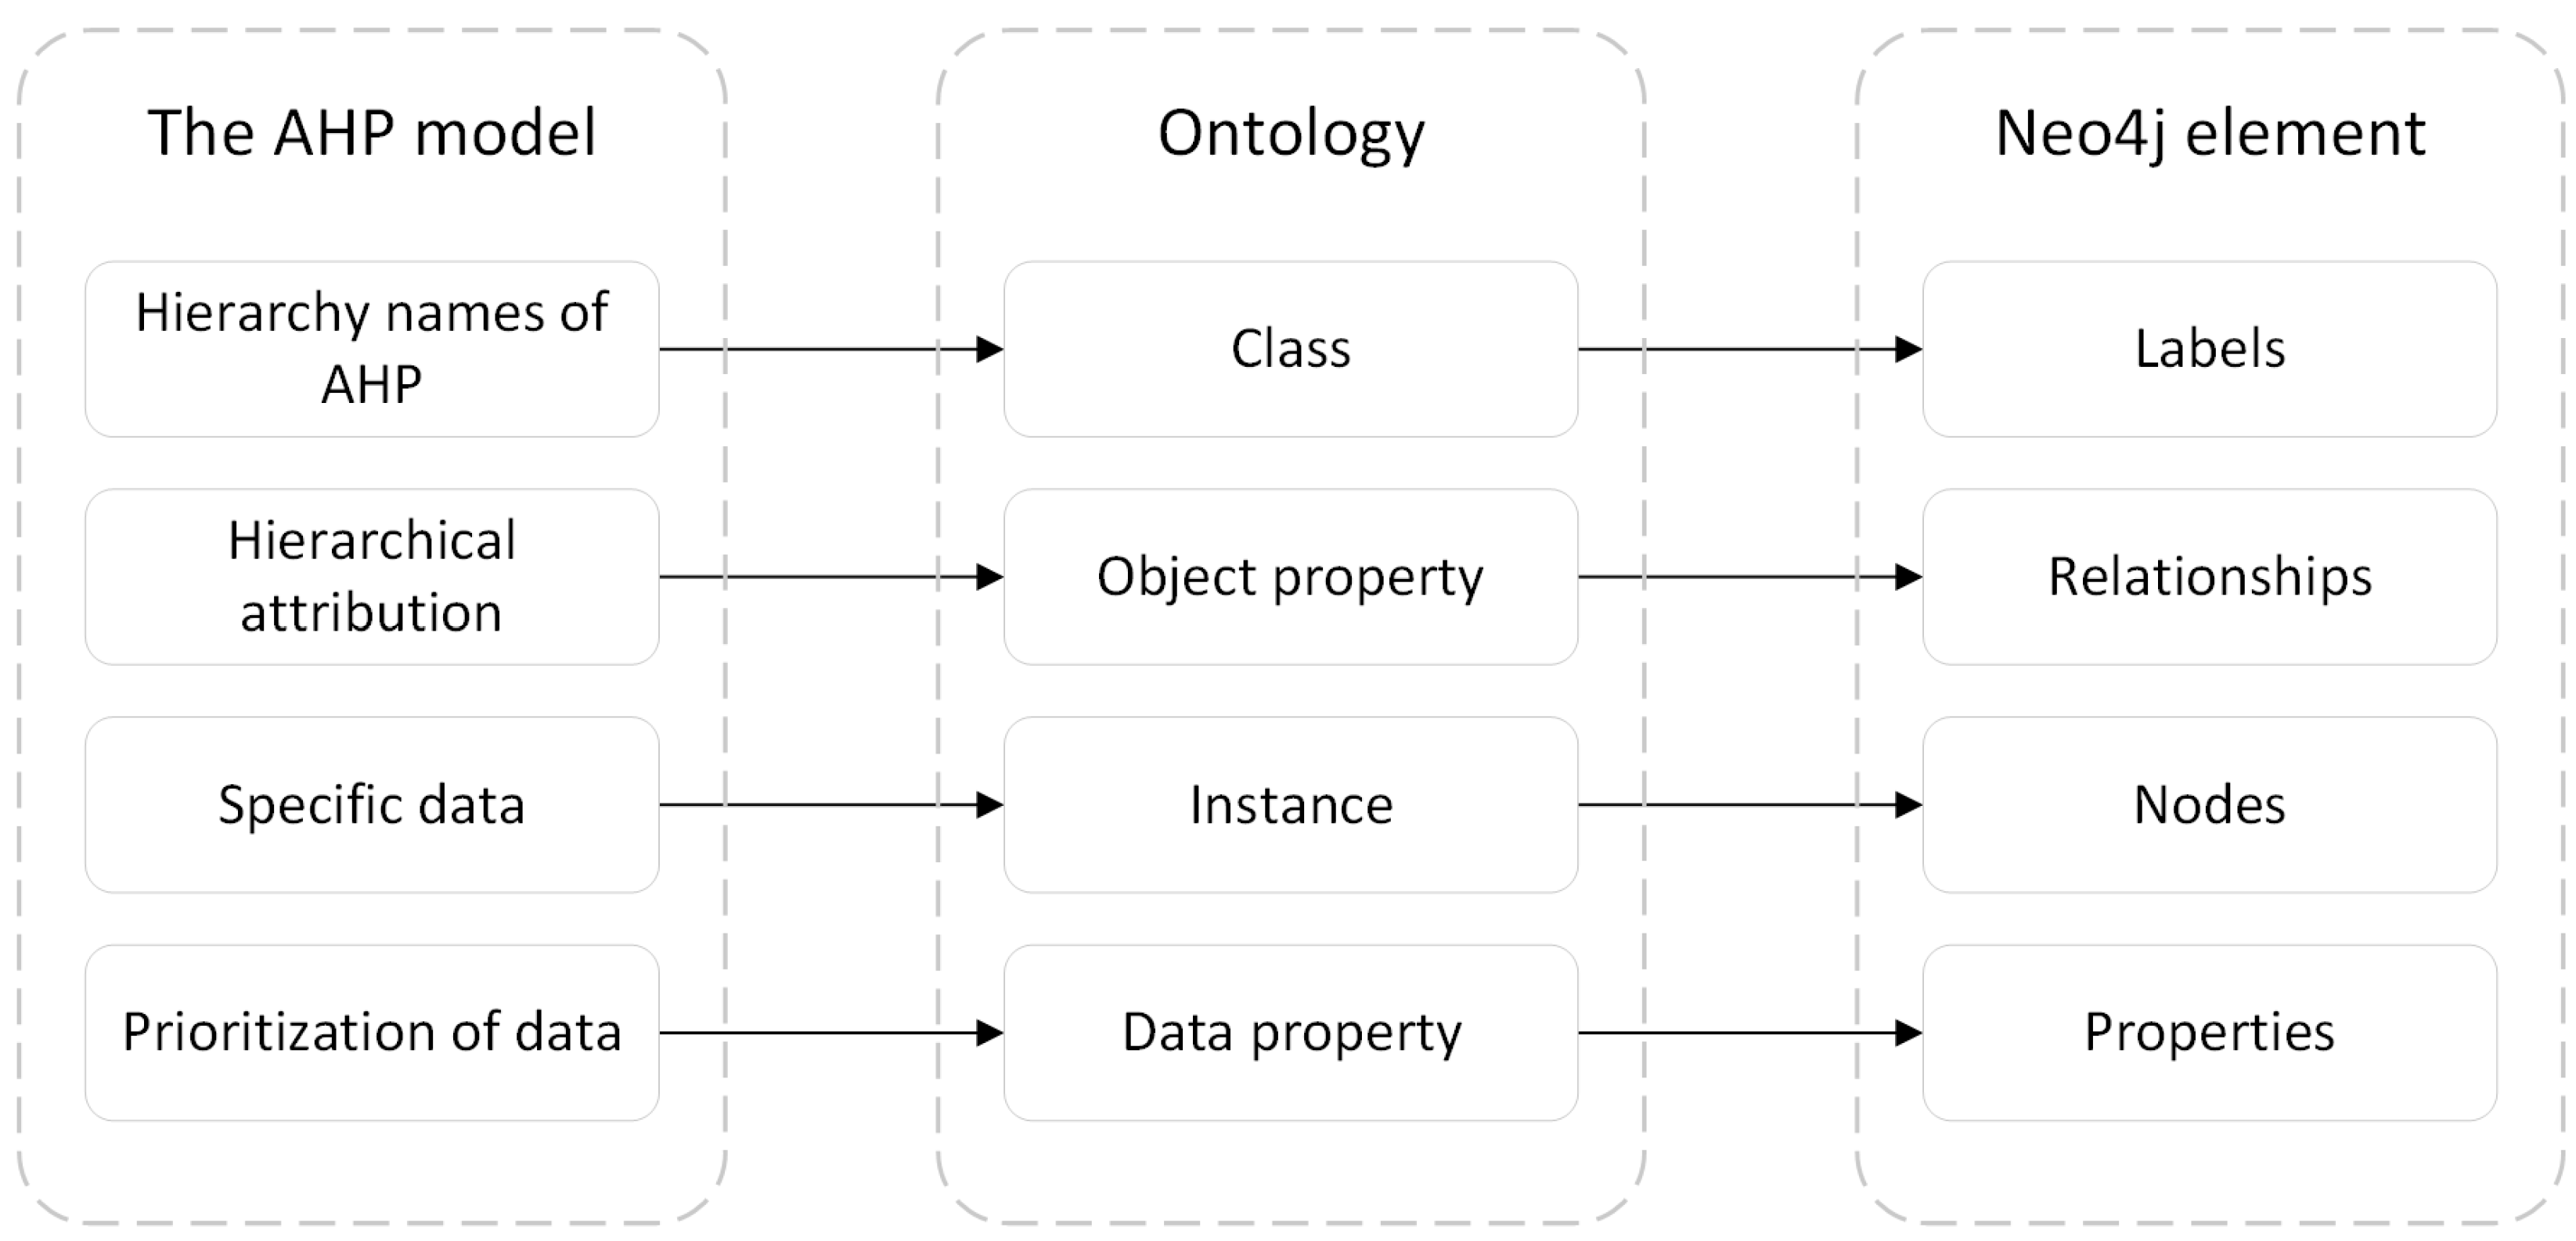
4.2.2. Data Mapping Rules

The Neo4j graph database consists of four types of elements [20]: labels, relationships, nodes, and node attributes. These elements correspond one-to-one to the classes, object attributes, instances, and data attributes in the ontology, enabling mapping from the ontology layer to the data layer. Additionally, the AHP hierarchical model constructed in this study provides an important reference for the mapping logic from the data layer to the ontology layer, where the names of the AHP layers correspond to the classes in the ontology, the hierarchical attributions correspond to data relationships, the specific data within each AHP layer correspond to the instances in the ontology, and the priorities calculated by the AHP correspond to data attributes, with the weights corresponding to the attribute values. The specific contents are illustrated in Figure 11.

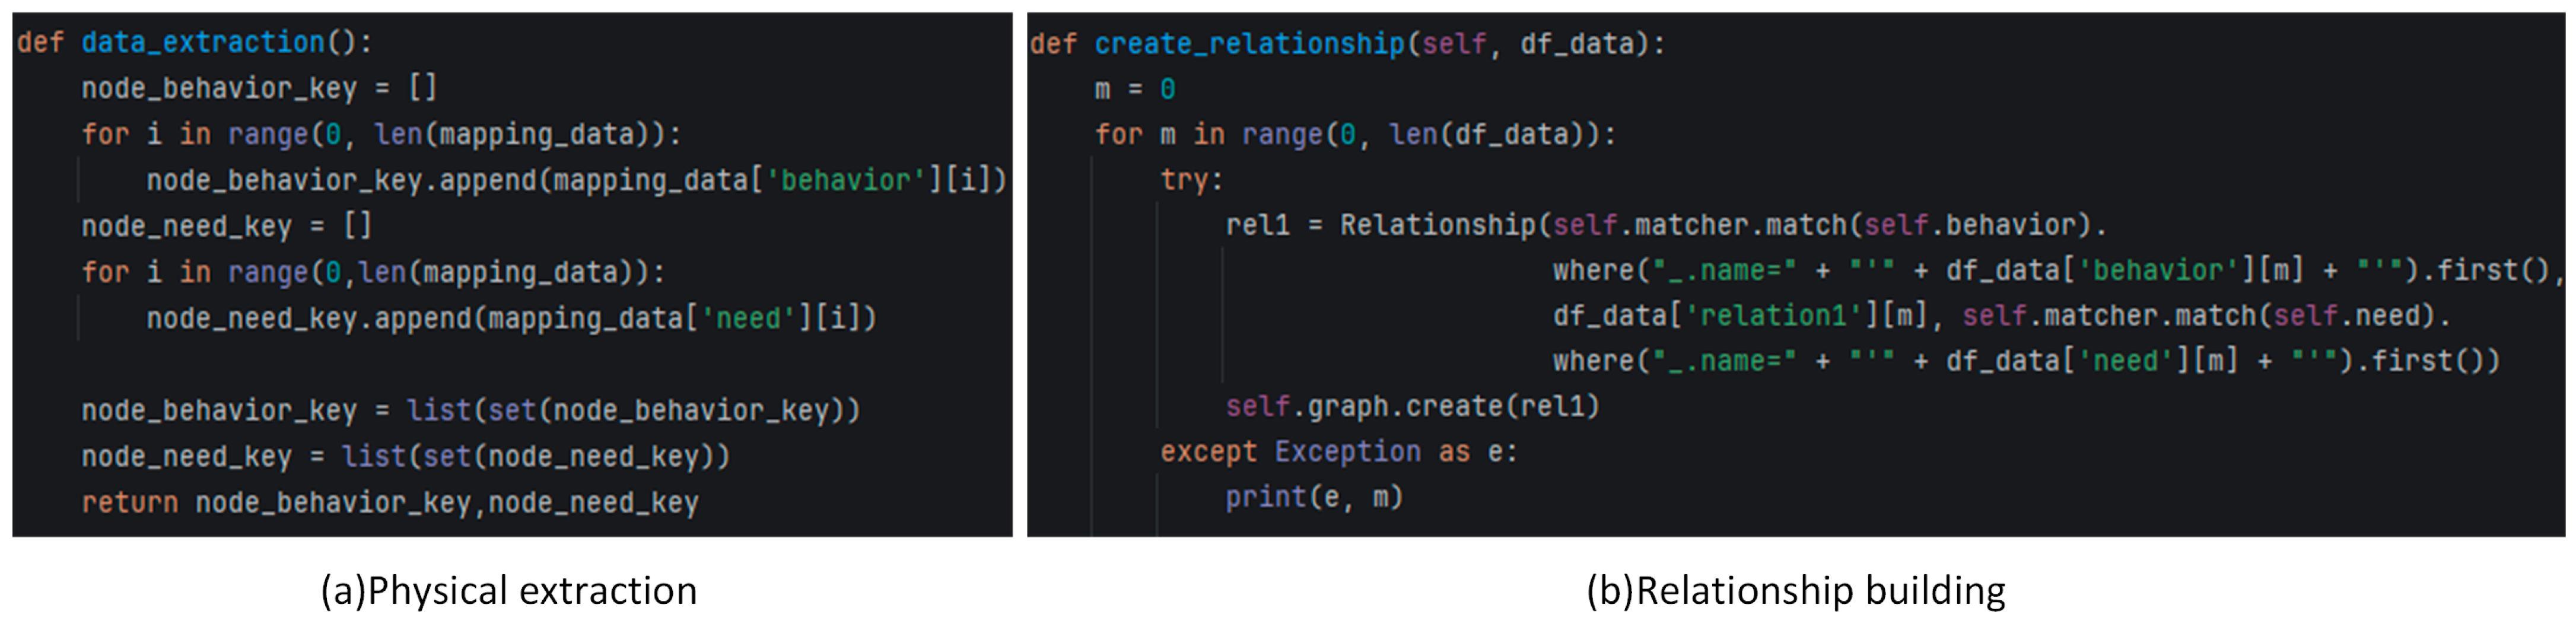
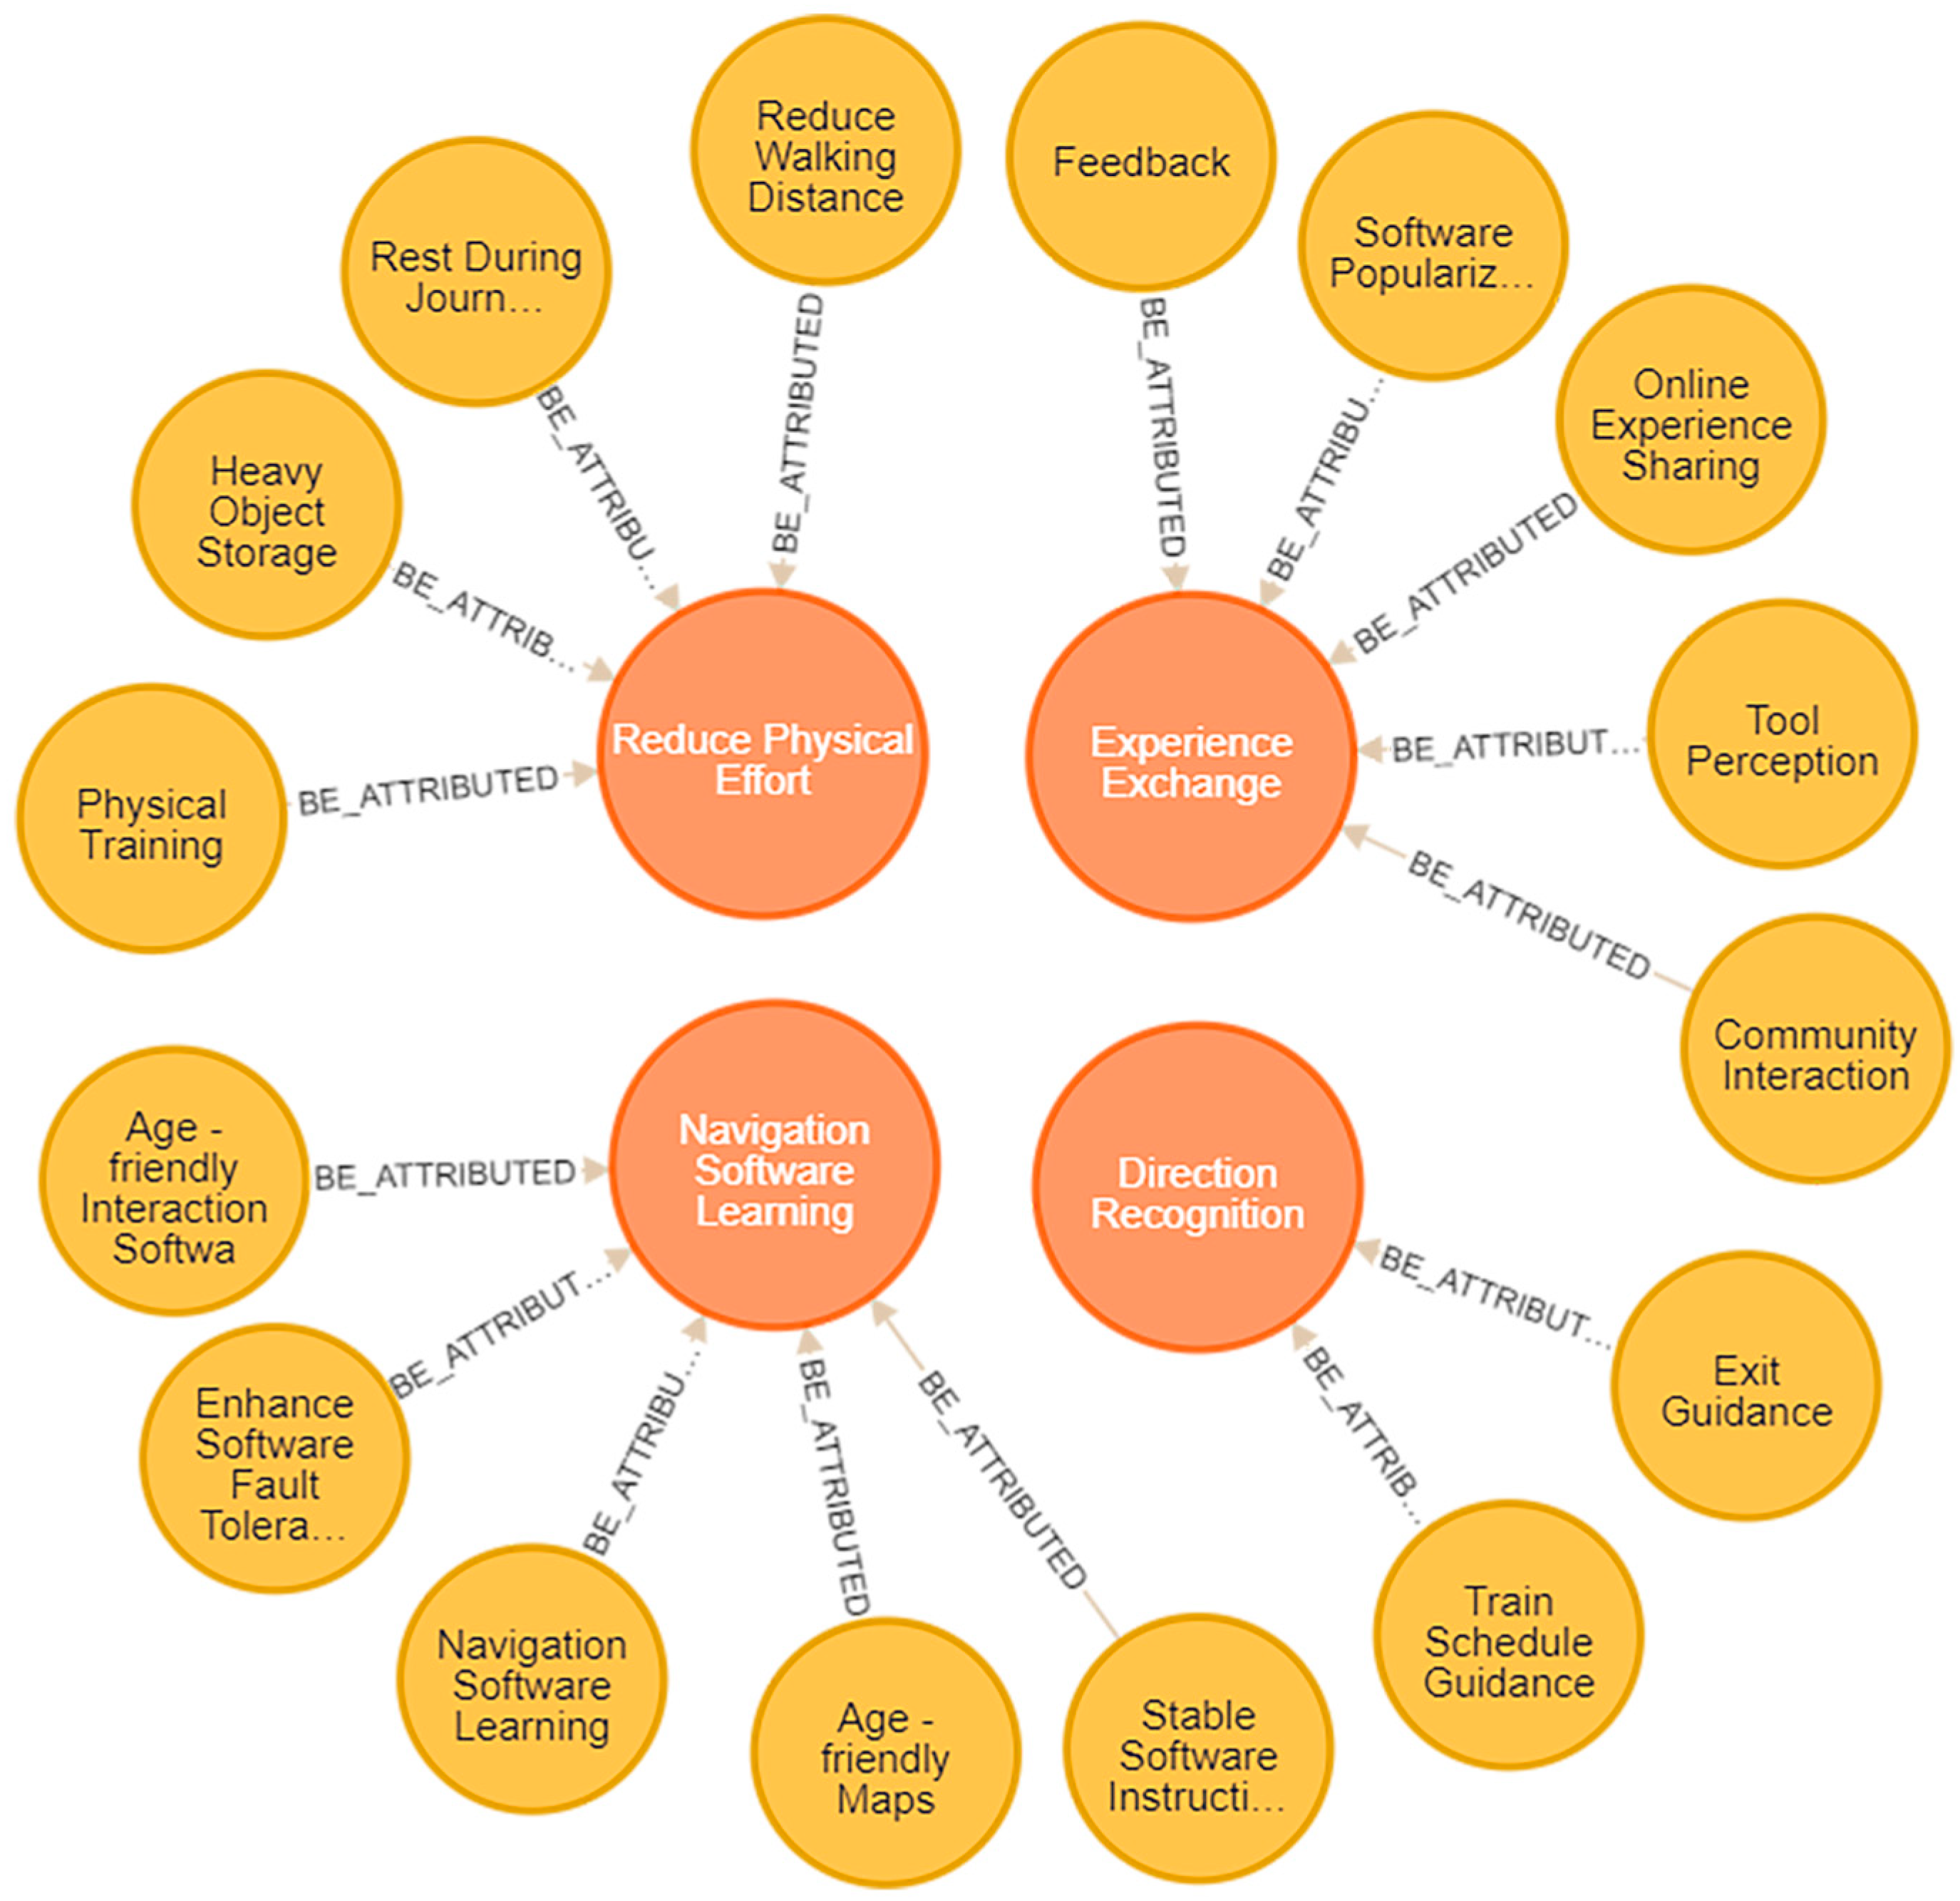
4.3. Extraction of Knowledge

In this study, knowledge extraction was performed using PyCharm 2024 version,, the Py2neo plug-in, and the web version of Neo4j for data visualization. The code example is shown in Figure 12. First, we wrote the program based on the data-mapping rules and placed the organized Excel file into the PyCharm project directory. Then, the connection to the data platform was established using the Py2neo plug-in, and knowledge extraction was performed using a custom python script. Finally, the command MATCH (n) RETURN (n) was input into the Neo4j data platform to generate the visualized advantage graph, as shown in Figure 13, Figure 14 and Figure 15, which represent the visualized results of the AHP hierarchies for user needs, capability advantages, and resource advantages, respectively.

4.4. Knowledge Graph Functionality Evaluation

4.4.1. Functional Task Testing

In the functionality-testing phase, the research team invited six graduate student mentors to participate in the usability testing of the elderly advantage map. The test tasks are detailed in Table 9. The testing process encompassed three steps, namely, a search, graph analysis, and design suggestions, as elaborated below.
  • “Advantage Feature Retrieval” Test Process
Query and Feedback: The elderly population in this study ranged from 65 to 85 years old. Based on the WTO standard, this group was divided into two age ranges: 65–73 years and 74–85 years. By querying the 65–73-year-old group, we obtained Figure 16A; by querying the 74–85-year-old group, we obtained Figure 16B. In the figure, the purple nodes represent capabilities, while the blue nodes represent resources.
Graph Analysis: The chart reveals that the 65–73 age group had some experience with internet use and route-planning software. Their capabilities were reflected in their professional skills and logical thinking, and they usually had the ability and willingness to live independently. In contrast, the 74–85 age group tended to rely more on traffic signs and their familiarity with the city when planning routes. Moreover, with age, individuals become more patient and more focused on community resources, such as volunteer activities and neighborhood support. They begin to adapt to collaboration and companionship.
Design Suggestions: Based on the feedback of the above advantages, for the 65–73 age group, most elderly individuals were physically healthy and experienced with internet and navigation software. The focus of our design lies in identifying the factors influencing elderly individuals’ experience sharing and facilitating the realization of their self-value through appropriate service design. For the 74–85 age group, as their physical decline and mobility decrease, their main daily activities become more confined to the community. Effectively utilizing community resources to foster interaction and communication between the elderly and other members can help alleviate loneliness and create a supportive community environment.
  • “Relevant Advantage Retrieval for Needs” Test Process
Query and Feedback: Based on the discussion and analysis, we believe that route planning and navigation are crucial for elderly individuals during travel. Therefore, we investigated the capabilities and resource advantages related to the “provide software teaching” requirement, and the results are shown in Figure 17. A total of 12 relevant elderly advantages were identified, with the light-blue nodes representing resource advantages and the light-purple nodes representing capability advantages.
Graph Analysis: (1) Overall, among the advantages related to the “provide software teaching” requirement, elderly individuals’ resource advantages are more evident. (2) In the Neo4j database, by double-clicking on an advantage node, we can view the category to which each advantage belongs. Personal and community resources are more prominent, with three advantages in personal and family resources, three in community resources, and two in technology equipment resources. In terms of capabilities, prior knowledge is more prominent, with two advantages.
Design Suggestions: Based on the feedback, the resource advantages related to the “provide software teaching” requirement are primarily found in the community environment, such as among children, neighbors, and volunteers. Therefore, design should be focused on developing a community service system aimed at helping elderly individuals learn how to use software. Additionally, prior knowledge stands out as a significant capability advantage. The service system should promote cooperation among the elderly, utilizing their communication skills. Furthermore, the system should encourage elderly individuals with software experience to leverage their expertise and help translate these advantages into social value.
  • “Priority Judgment for Advantage Application” Test Process
Query and Feedback: By displaying the relationship between the elderly advantages and user needs, designers can more clearly identify which advantages should be prioritized in a specific context. Using “provide software teaching” as an example, as shown in Figure 18, the advantage query focuses on the two target advantages: children’s help and community volunteers’ help.
Graph Analysis: The chart shows that the relationship between children’s help and community volunteers’ help with the “provide software teaching” requirement are correlated and strongly correlated, respectively. Therefore, when guiding elderly individuals in using navigation software, designers should prioritize the involvement of community volunteers. The results of our analysis suggest that in community environments, elderly individuals’ children may not be able to provide timely assistance due to work or other reasons, whereas community volunteers might have more suitable time availability.
Design Suggestions: Organizing community activities to enhance interaction between volunteers and elderly individuals while reducing the cost of seeking help and increasing elderly individuals’ enjoyment of activities can increase their willingness to seek assistance from volunteers.

4.4.2. Survey on Satisfaction with the Testing Process

After the test, the team conducted a satisfaction survey using a five-point scale, where 1 to 5 correspond to very dissatisfied, dissatisfied, neutral, satisfied, and very satisfied, respectively. The aim of the survey was to verify the specific impact and role of the elderly advantage map in design practice compared to traditional design processes, and the results are shown in Table 10. The design team expressed lower satisfaction with the usability and learnability of the map due to the use of the programming language Cypher in data querying, which poses a learning barrier for the designer group, thereby reducing the usability of the knowledge graph. Compared to the enhancement of design thinking, this map shows slight inadequacies in improving the creativity of design solutions. The team members believe that the map’s use of visualized data provides clearer guidance for design thinking, but the creativity still heavily relies on the individual designer, leading to a lower rating.

5. Discussion

5.1. Theoretical Contributions and Practical Implications

In theoretical terms, we applied the combined KJ-AHP method to process the raw data in the graph, providing a structured and quantitative analytical approach in the considered field. Compared to other decision-making methods, such as TOPSIS and KANO, the AHP’s multi-level structure clearly presents the dependencies between the levels, providing a clear framework for constructing a knowledge graph. Specifically, the levels in the AHP model framework align well with the core elements (e.g., labels, relationships, and entities) in the Neo4j database, and their effective mapping significantly simplifies the transition from the data layer to the knowledge layer. This study systematically demonstrates the application of the KJ-AHP method in graph data processing. The proposed mapping rules among the AHP levels, the graph ontology levels, and the database elements provide important references for related research.
In practice, this study explored the application of elderly advantages in design practice from the perspective of age-friendly design. Through brainstorming sessions and workshops, the research team thoroughly discussed the difficulties and needs that designers encounter when applying elderly advantages in design.Based on this, we proposed a knowledge fusion approach centered on knowledge graph technology, promoting the integration of elderly advantages and age-friendly design elements. The research team validated the approach through practice and developed an elderly advantages knowledge graph for age-friendly design. The functionality test of the graph showed that the elderly advantages knowledge graph developed in this study can help designers with data structuring, clarifying data relationships, and expanding design ideas, ultimately improving the feasibility of design solutions.
Specifically, the application of the KJ-AHP-KG method affects design decisions in the following three ways.
Enhancing Data Completeness for Multi-dimensional Decision Analysis: As highlighted in the introduction, current case study methods face challenges in generating comprehensive and systematic data on elderly advantages. In contrast, the data stored in a knowledge graph can complement case study findings, thereby enhancing the completeness of the data. This supplementation ensures that the decision-making process takes into account a broader range of relevant factors.
Improving the Structuring of Visual Data through AHP to Enhance Decision Accuracy: The hierarchical nature of the AHP method strengthens the structure of the ontology, making the overall data presentation more intuitive. By ranking the importance of various factors, the AHP helps prioritize core issues that should be addressed first in the decision-making process.
Revealing Data Associations to Inform Decision-Making: Through the construction of the ontology, this study clarifies the relationships between different data types, such as users, pain points, behaviors, needs, and relevant advantages. The feedback results in Table 8 demonstrate that this interconnectedness significantly enhances the design approach by providing clearer insights and guidance.

5.2. Current Issues and Future Prospects

In the field of age-friendly design, the focus on elderly advantages is still in its infancy, and, therefore, this study inevitably has certain limitations in its exploration. Firstly, the AHP hierarchical analysis method used in the study ranks the priority of sub-criteria, which enhances data structuring, but it cannot completely avoid subjective interference. Future research could integrate other decision-making methods to further enhance the objectivity of data prioritization.
Additionally, in the functional testing phase of the graph, a satisfaction survey was conducted. The results revealed two issues with the elderly advantage graph: (1) The Cypher language in Neo4j has a steep learning curve, which reduces the ease of use and learnability of the knowledge graph. Future research should minimize code usage and develop a natural language retrieval system. (2) The visualized data in the graph significantly improved the designers’ thinking process but had a limited impact on the creativity of design solutions. In future research, generative training of the knowledge graph will be combined with artificial intelligence approaches to enhance the creativity of design solutions and reduce the need for manual decision making.

5.3. Supplementary Explanation of the Method’s Applicability

Applicability Across Different Countries or Regions: Aging is a global issue. However, variations in the classification of the elderly across different countries or regions—due to factors such as levels of development, healthcare systems, and policies—pose challenges for the applicability of the knowledge graph. Future research should refine the ontology, for instance, by adding attributes such as nationality and region under the “user” category. This would enhance the method’s applicability across different countries, regions, and cultural contexts.
Applicability to Different Types of Elderly Individuals: As illustrated in Figure 19, elderly individuals have two distinct life stages as they age. (1) The Ability Maintenance Period: During this phase, elderly individuals maintain relatively good physical and mental health, actively participating in social activities. Accordingly, the focus should be on the ability advantages within the knowledge graph. The design’s primary goal is to create external conditions that enable the elderly to maximize these advantages through strategic planning. (2) Ability Decline Period: In this phase, elderly individuals lose the health conditions necessary to maintain independent living. When applying this method, the focus should shift to the user’s needs and resource advantages within the knowledge graph. The primary design goal is to integrate external resources based on the user’s needs, aiming to enhance the elderly’s quality of life.

6. Conclusions

Aging design should not only address the shortcomings of the elderly population but, more importantly, integrate environmental resources to activate this population’s inherent strengths, thereby enhancing the adaptability and acceptance of new products. In this study, we combined the KJ-AHP method with knowledge graph technology, providing a structured and quantitative data-processing approach for aging design. It not only offers systematic theoretical support for the exploration of elderly advantages but also provides valuable reference for future related research. In addition, this study provides designers with an innovative tool that helps them to integrate elderly advantage features and needs more efficiently during the design process, thereby improving accuracy and feasibility.
Although this study has made significant progress in constructing and applying an elderly advantage map, some limitations still remain. First, the Cypher-based graph retrieval system presents certain challenges in terms of usability and learning costs. Future research should consider developing a natural language retrieval system to further enhance the system’s usability. Second, while the graph effectively expands design thinking, its impact on enhancing design creativity remains relatively weak. Therefore, integrating artificial intelligence technology to drive the intelligent generation of design creativity is expected to be a key direction for future research.

Author Contributions

Conceptualization, X.W. and X.L.; methodology, X.W.; software, X.W.; validation, X.W. and G.L.; formal analysis, X.W. and G.L.; investigation, X.W. and G.L.; data curation, X.W. and G.L.; writing—original draft preparation, X.W.; writing—review and editing, X.L.; visualization, X.W. All authors have read and agreed to the published version of the manuscript.

Funding

This research received no external funding.

Institutional Review Board Statement

The study was conducted in accordance with the Decla-ration of Helsinki, and approved by the Ethics Committee of Hubei University of Technology (protocol code HBUT20250002 and date of 17 January 2025).

Informed Consent Statement

Informed consent was obtained from all subjects involved in the study.

Data Availability Statement

The original contributions presented in the study are included in the article; further inquiries can be directed to the corresponding author.

Conflicts of Interest

The authors declare no conflicts of interest.

References

  1. Available online: https://www.who.int/zh/news-room/fact-sheets/detail/ageing-and-health (accessed on 1 October 2024).
  2. Cozza, M.; Tonolli, L.; D’Andrea, V. Subversive Participatory Design: Reflections on a Case Study. In Proceedings of the 14th Participatory Design Conference: Short Papers, Interactive Exhibitions, Workshops-Volume 2 (PDC ’16), Aarhus, Denmark, 15–19 August 2016; ACM: New York, NY, USA, 2016; pp. 53–56. [Google Scholar]
  3. Mei, Z.P. Research on Aging Issues—A Collection of Materials from the World Assembly on Aging; China Translation and Publishing Corporation: Beijing, China, 1983. [Google Scholar]
  4. Zhao, C. Building the Theoretical Model for Aging Design: Intuitive Cognition, Prior Knowledge and Familiarity in the Context of Technology and Culture. Art Des. 2022, 5, 12–19. [Google Scholar] [CrossRef]
  5. Gu, M.M. The Research on Social Work Intervention in Cultivation the Elderly Volunteers with Strengths Perspective–Taking the X Community Y Project in Foshan city as an Example; South China University of Technology: Guangzhou, China, 2018. [Google Scholar]
  6. Lin, L. Intelligence Enhancement Design: A New Form of Design for the Aged from the Perspective of Advantage. Art Des. 2022, 5, 31–39. [Google Scholar] [CrossRef]
  7. Duque, E.; Fonseca, G.; Vieira, H.; Gontijo, G.; Ishitani, L. A systematic literature review on user centered design and participatory design with older people. In Proceedings of the 18th Brazilian Symposium on Human Factors in Computing Systems, Vitória, Brazil, 22–25 October 2019; pp. 1–11. [Google Scholar]
  8. Peng, Y.N.; Zhou, S.H. Analysis on the Governance Mechanism of the Multigenerational Housing Communities from the Perspective of Actor Network: A Case Study of Ledo Multigenerational Housing in Cologne, Germany. Urban Plan. Int. 2018, 33, 75–81. [Google Scholar]
  9. Li, Y.; Liu, G.C.; Liu, S.; Niu, R.C.; Ren, T.G. Ergonomic Design of Shared Elderly Mobility Scooter Based on AHP-QFD. Packag. Eng. 2023, 44, 52–60. [Google Scholar]
  10. Luo, J.; Zhao, X. Design of Age-friendly Home Nursing Beds Based on AHP-AD-TOPSIS Model. Packag. Eng. 2024, 45, 111–120. [Google Scholar]
  11. Ma, M.Y.; Song, W.; Qi, Y.C.; Han, Y.; Nian, X.C. Functional Food Packaging Design for the Elderly Based on Analytic Hierarchy Process. Packag. Eng. 2024, 45, 317–324. [Google Scholar]
  12. Xu, Z.X.; Yi, X.W.; Bao, J.; Li, T.R.; Zhang, J.B.; Zheng, Y. Construction and Application of Knowledge Graph for Epidemiological Investigation. Comput. Appl. 2025, 1–12. Available online: http://kns.cnki.net/kcms/detail/51.1307.TP.20241008.1636.004.html (accessed on 3 March 2025).
  13. Mo, Z.; Gong, L.; Gao, J.; Cui, H.; Lan, J. A Knowledge Graph-Based Implicit Requirement Mining Method in Personalized Product Development. Appl. Sci. 2024, 14, 7550. [Google Scholar] [CrossRef]
  14. Greif, L.; Hauck, S.; Kimmig, A.; Ovtcharova, J. A Knowledge Graph Framework to Support Life Cycle Assessment for Sustainable Decision-Making. Appl. Sci. 2025, 15, 175. [Google Scholar] [CrossRef]
  15. Cheng, Y.H.; Li, P.P. Research on Design of Bedroom Furniture Suitable for the Aged. Furnit. Inter. Des. 2019, 8, 80–82. [Google Scholar]
  16. Shi, Y.; Wu, H.P.; Zhang, Z.Y.; Liang, G.W.; Zhao, J. Research on Aging friendly Design of Different Elderly Care Models under Human Factors Engineering. Chin. J. Gerontol. 2016, 36, 987–991. [Google Scholar]
  17. Saleebey, D. Strengths Perspective in Social Work Practice; East China University of Science and Technology Press: Shanghai, China, 2015. [Google Scholar]
  18. Meng, J. Exploration of the Theoretical Connotation of the Advantage Perspective in Social Work. J. East China Univ. Sci. Technol. Soc. Sci. Ed. 2019, 34, 55–64. [Google Scholar]
  19. Strengths-Based Approach in Social Work: 6 Examples & Tools. Available online: https://positivepsychology.com/social-work-strength-based-approach/ (accessed on 31 May 2022).
  20. Liu, Y.C.; Liu, J.; Xi, S.L.; Zhao, X.R.; Hou, N.; Zhu, W.L. Research on the Digital Knowledge Graph of Central Axis Art Value Based on Neo4j. Packag. Eng. 2024, 45, 211–223. [Google Scholar]
  21. Zhang, X.F.; Zhang, L.P.; Yan, S.; Hou, M.; Zhao, Y.B. Personalized learning recommendation in collaboration with knowledge graph and large language model. Comput. Appl. 2025, 1–15. Available online: http://kns.cnki.net/kcms/detail/51.1307.tp.20241012.1733.014.html (accessed on 3 March 2025).
  22. Jiang, M.J.; Zhang, W.C.; Rong, H.M.; Zhang, J.Q.; Huang, S.H. Helicopter component assembly sequence planning method based on knowledge graph. J. Graph. Sci. 2024, 45, 1062–1070. [Google Scholar]
  23. Fogg, B.J. Tiny Habits; Tianjin Science and Technology Press: Tianjin, China, 2021. [Google Scholar]
  24. Liu, J.; Sun, X.; Zhang, Y.Q. Educational resource content review method based on knowledge graph and large language model collaboration. J. East China Norm. Univ. Nat. Sci. Ed. 2024, 5, 57–69. [Google Scholar]
  25. Huang, J.Z.; Ma, Y.X.; Hu, G.Y. Research progress on elderly travel behavior from a health perspective. Sci. Technol. Rev. 2020, 38, 69–75. [Google Scholar]
  26. Ma, X.H.; Liu, W.L. Design of a “One-stop” Fruit APP Based on the KJ-KANO Model. Packag. Eng. 2024, 45, 192–203. [Google Scholar]
  27. Liu, W.L.; Ma, X.H. Research on Parent-Child Home Cultural and Creative Product Design Based on KJ-KANO Model. Furnit. Inter. Des. 2024, 31, 72–77. [Google Scholar]
  28. Xu, X.Q.; Cheng, Y.S.; Chen, G.Q. Evaluation Method and Application of RV Modeling Based on AHP Method. J. Mach. Des. 2020, 37, 140–144. [Google Scholar]
  29. Xie, W.T.; Xu, C. Design of Intelligent Kitchen Appliances for the Elderly Based on KJ-AHP-VIKOR Integration Method. Packag. Eng. 2024, 45, 411–419. [Google Scholar]
  30. Li, X.Y.; Yang, X.Y. Shopping Cart Design for the Visually Impaired Based on Behavior-significance Mapping. Mach. Des. Res. 2022, 38, 172–178. [Google Scholar]
  31. Graybeal, C. Strengths-based social work assessment: Transforming the dominant paradigm. Fam. Soc. 2001, 82, 233–242. [Google Scholar] [CrossRef]
  32. Xie, Q.S.; Lu, D.B. Social Emotion Action Expression Method of Robots Based on Customer Journey Map. Packag. Eng. 2023, 44, 84–90. [Google Scholar]
  33. Wang, B.; Huang, T.; Zhou, L.; Guan, L.; Wan, K. Integration of EMU Overall Design Model Based on Ontology–Knowledge Collaboration. Appl. Sci. 2024, 14, 7828. [Google Scholar] [CrossRef]
  34. Zhang, J.X.; Wang, Y.Q.; Jiao, X.M.; Zhang, Y.X. An ontology and NLP-based knowledge graph construction method for dangers of earth-rock dams. J. Hydraul. Eng. 2024, 55, 9. [Google Scholar] [CrossRef]
Figure 1. Partial meeting minutes.
Applsci 15 02848 g001
Figure 2. Advantage categorization based on the Fogg behavior model.
Applsci 15 02848 g002
Figure 3. Theoretical model of elderly advantages knowledge graph.
Applsci 15 02848 g003
Figure 4. Retrieval of elderly advantage features based on age attribute.
Applsci 15 02848 g004
Figure 5. Need-centric advantage retrieval.
Applsci 15 02848 g005
Figure 6. Application priority of advantages.
Applsci 15 02848 g006
Figure 7. Process of constructing the elderly advantages knowledge graph.
Applsci 15 02848 g007
Figure 8. Subway travel process for the elderly.
Applsci 15 02848 g008
Figure 9. User journey map, including needs and advantages.
Applsci 15 02848 g009
Figure 10. Ontology construction of elderly advantages knowledge graph.
Applsci 15 02848 g010
Figure 11. Mapping rules for data.
Applsci 15 02848 g011
Figure 12. Python code for knowledge extraction (partial).
Applsci 15 02848 g012
Figure 13. Visualization of the user-needs AHP hierarchical model.
Applsci 15 02848 g013
Figure 14. Visualization of the user capability advantages AHP hierarchical model.
Applsci 15 02848 g014
Figure 15. Visualization of the user resource advantages AHP hierarchical model.
Applsci 15 02848 g015
Figure 16. Functional verification of advantage feature retrieval.
Applsci 15 02848 g016
Figure 17. Functional verification of relevant advantage retrieval for needs.
Applsci 15 02848 g017
Figure 18. Functional verification of advantage application prioritization.
Applsci 15 02848 g018
Figure 19. Aging process diagram.
Applsci 15 02848 g019
Table 1. “Pain Points of Elderly Advantages in Design Practice” survey content.
Serial No.Question
1Are there difficulties in applying elderly advantages in design?
2What difficulties exist? Please list at least one.
3What do you think is the key to solving these problems?
Table 2. Pain points and needs summary sheet (for elderly advantage applications).
Original Representative StatementsPain Points in
Advantage Design
No. of
Questionnaires
Designers’ Needs
Focusing on elderly advantages is indeed important, but the design field currently lacks a methodology for mining elderly advantages.(a1) Lack of advantage-related data-mining methods7(A) Introduce advantageous research methods
I think the content of elderly advantages is too vague, such as experience advantage, decision-making advantage, what specific contents are included, and what the specific aspects are.(a2) The specifics of elderly advantages are vague8(B) Clarify the categorization and hierarchy of advantages
We usually use interview methods, observation methods, and other manual collection methods in design research. Elderly advantage data collection is inefficient. On the one hand, it is not possible to collect a sufficient amount of data, and on the other hand, some of the advantages cannot be useful for design activities.(a3) Inefficient data collection23(C) Promote the sharing of advantageous data
(a4) Insufficient superior samples available in single studies
There is less research on elderly advantages in the field of design, and there are difficulties in finding information about previous research.(a5) Difficulty in obtaining information on existing studies13(C) Promote the sharing of advantageous data
The relationship between the data on elderly advantages obtained through the research and the design elements is not clear, and it is not possible to determine the needs corresponding to specific advantage phrases.(a6) Ambiguous relationship between advantages and design elements15(D) Clarify the relationship between advantages and design elements
When faced with multiple advantages corresponding to the same need, it is difficult to prioritize the use of advantage phrases.(a7) Unclear prioritization of advantageous applications8(E) Define the relevance of advantages to design elements
Table 3. Basic information on the interviewees.
GendersNumberAge RangeNumberMobility of the ElderlyNumber
Male2965–7351Independent59
Female4374–8521Instrumental13
Table 4. ROPES advantage evaluation framework (partial).
ROPESContents of the
Assessment
Example Problem
(Using Route Planning as An Example)
ResourcesIndividuals and familiesWhat are some methods of route planning?
Community involvementWhat kinds of people are available to help?
Social contextWhat tools are available?
OpportunitiesPresent focusHow do you do route planning in your life?
Emphasis on choiceWhat methods have not been tried?
PossibilitiesFuture focusHow would you like to carry out route planning in the future?
CreativityHow can these goals be realized?
Table 5. AHP hierarchical model for user needs.
Sub-Criteria LayerCriteria LayerObjective Layer
C1—Heavy-Load StorageB1—Reduced Physical ExertionTransfoem the environment to assist elderly mobility
C2—Rest on the Way
C3—Reduced Walking
C4—Physical Training
C5—Aging-Friendly Software InteractionB2—Software Learning
C6—Software Teaching
C7—Software Fault Tolerance
C8—Aging-Friendly MapB3—Direction Recognition
C9—Metro Trip Alert
C10—Metro Exit Alerts
C11—Related Software Popularization
C12—Cognitive Tools and Resources
C13—Building a Networking PlatformB4—Communication Feedback
C14—Experience Sharing in the Community
C15—Feedback on Traveling
Table 7. Elderly advantages and their categories.
Sub-Criteria LayerCriteria LayerObjective LayerSub-Criteria LayerCriteria LayerObjective Layer
Good at CommunicationKnowledge and SkillsCapability
Advantage
Classification
FriendsPersonal
Resources
Resource
Advantage
Classification
Professional SkillsPassersby
Social SkillsAssistance from Children
Strong Logical ThinkingCognitive AbilitiesAbundant Free Time
Problem InsightCommunity FacilitiesCommunity
Resources
Thorough ConsiderationPublic Welfare Activities
Familiar with LandmarkExperience and HabitsCommunity Volunteers
Use Landmarks for PositioningAccessible Channels
Habitual Joint ActionsSubway Staff
Clear Family NeedsInternet ServicesTechnical
Equipment
Familiar with Product PricesInteractive Technology
Familiar with City RoutesNavigation Software
Patient in Doing ThingsPersonal QualitiesSignage Systems
Mutual Assistance CultureCultural
Policies
Respect for the Elderly Culture
Public Transport Discounts
Scenic Spot Ticket Discounts
Table 8. Correlation-scoring table for needs and advantages (partial).
Good at CommunicationSkills SpecializationInsight into the ProblemHabits in Action TogetherFamiliarization with LandmarksFamiliarity with City RoutesSocially AdeptHelp for ChildrenNetwork ServiceVoice Interaction TechnologyNavigation Simulation SoftwareCommunity VolunteersMetro Staff
Software Teaching3000000220330
Software Popularization3000000220021
Aging-Friendly Interaction2020220003301
Community Activities3103110000030
Metro Trip Alert0000312020302
Cognitive Tools and Resources3000000220223
Reduced walking0000030000300
Table 9. Knowledge graph testing tasks.
Serial No.Test Task Name
1Open the Neo4j graph database using the task interface and browser.
2Execute three query tasks using Cypher commands.
3Conduct discussions and analysis based on the feedback from the graph.
4Propose design suggestions based on the content of the graph.
Table 10. Satisfaction questionnaire survey results.
Serial No.QuestionPurposeSatisfaction Mean
1Is the operation process clear?Process satisfaction3.9
2Is it easy to understand and master?Usability and learnability2.8
3Is the feedback content accurate?Data structure satisfaction4.0
4Are the relationships among the contents clear?Relationship mining satisfaction4.5
5Does it enhance design creativity?Creativity enhancement satisfaction3.8
6Does it help guide the design thinking?Improvement of thought process satisfaction4.6
7Has the graph fulfilled its intended function?Satisfaction with graph functionality4.2
Table 6. Comprehensive weight table of user needs.
Criteria LayerWeight
Value
Sub-Criteria LayerWeight ValueComprehensive Weight ValueRankings
B1—Reduced
Physical Exertion
0.0811C1—Heavy-Load Storage0.10690.008714
C2—Rest on the Way0.29230.023711
C3—Reduced Walking0.54350.04417
C4—Physical Training0.05740.004715
B2—Software Learning0.4864C5—Aging-Friendly Software Interaction0.23080.11233
C6—Software Teaching0.69230.33671
C7—Software Fault Tolerance0.07690.03748
B3—Direction Recognition0.2932C8—Aging-Friendly Map0.08570.025110
C9—Metro Trip Alert0.25360.07445
C10—Metro Exit Alerts0.04400.012913
C11—Related Software Popularization0.45080.13222
C12—Cognitive Tools and Resources0.16600.04876
B4—Communication Feedback0.1394C13—Building a Networking Platform0.12220.017012
C14—Experience Sharing in the Community0.64800.09034
C15—Feedback on Traveling0.22990.03209
Disclaimer/Publisher’s Note: The statements, opinions and data contained in all publications are solely those of the individual author(s) and contributor(s) and not of MDPI and/or the editor(s). MDPI and/or the editor(s) disclaim responsibility for any injury to people or property resulting from any ideas, methods, instructions or products referred to in the content.

