1. Introduction
In recent years, China has actively advanced the intelligent development of coal mines [
1], significantly enhancing the mechanization of coal mining operations [
2]. As frontline workers at excavation sites [
3], coal mine tunneling machine operators are tasked with extensive human–machine interaction, such as operating roadheaders, under hazardous conditions, including coal and gas outbursts, high temperatures, dust, noise, and high humidity [
4]. Additionally, these operators must maintain a heightened level of vigilance to monitor abnormal conditions in the roof, floor, and coal walls, and the presence of surrounding personnel near the roadheader [
5]. This requires operators to frequently perform or switch between multiple tasks simultaneously [
6], with task interruptions being both common and often urgent [
7]. Working in such harsh environments, roadheader operators are particularly susceptible to fatigue due to heavy workloads, shift work, and sleep deprivation, which disrupt their circadian rhythms [
8]. Evidence from case studies highlights that task interruptions under fatigued conditions can lead to unsafe behaviors among workers. Research further indicates that 90% of accidents in human–machine interaction processes are attributable to unsafe human behaviors [
9]. As a result, worker behavior plays a pivotal role in ensuring the safety and efficiency of coal mining operations [
10].
Previous studies have independently examined the associations between task interruptions, fatigue, and unsafe behaviors; however, few have considered the combined effects of both factors on unsafe behaviors in coal mining environments. This study aims to fill this gap by investigating the behavioral and neural mechanisms underlying task interruptions and fatigue states. Unsafe behaviors are assessed through behavioral performance, with a focus on analyzing the impact of task interruptions on operators’ safety behaviors in a fatigued state. In existing research, Hakim et al. [
11] explored the impact of task-unrelated interruptions on the neural representation of working memory, observing that task interruptions lead to shifts in attention and adjustments in information retrieval mechanisms. Kalgotra et al. [
12] found that task interruptions trigger changes in multiple brain regions, with the frontal, temporal, and insular lobes showing the most pronounced associations with interruptions. These findings reveal how task interruptions, by affecting different brain regions, in turn influence operators’ work efficiency and decision-making abilities. This study draws on the ACT-R (Adaptive Control of Thought–Rational) cognitive architecture [
13], particularly its concepts of executive control and resource allocation. ACT-R is of significant relevance in studying unsafe behaviors in high-risk environments, as it suggests that task interruptions increase cognitive load, making it difficult for individuals to switch between tasks and slowing down information processing [
14]. Furthermore, the theory posits that task interruptions affect attention mechanisms and executive control processes [
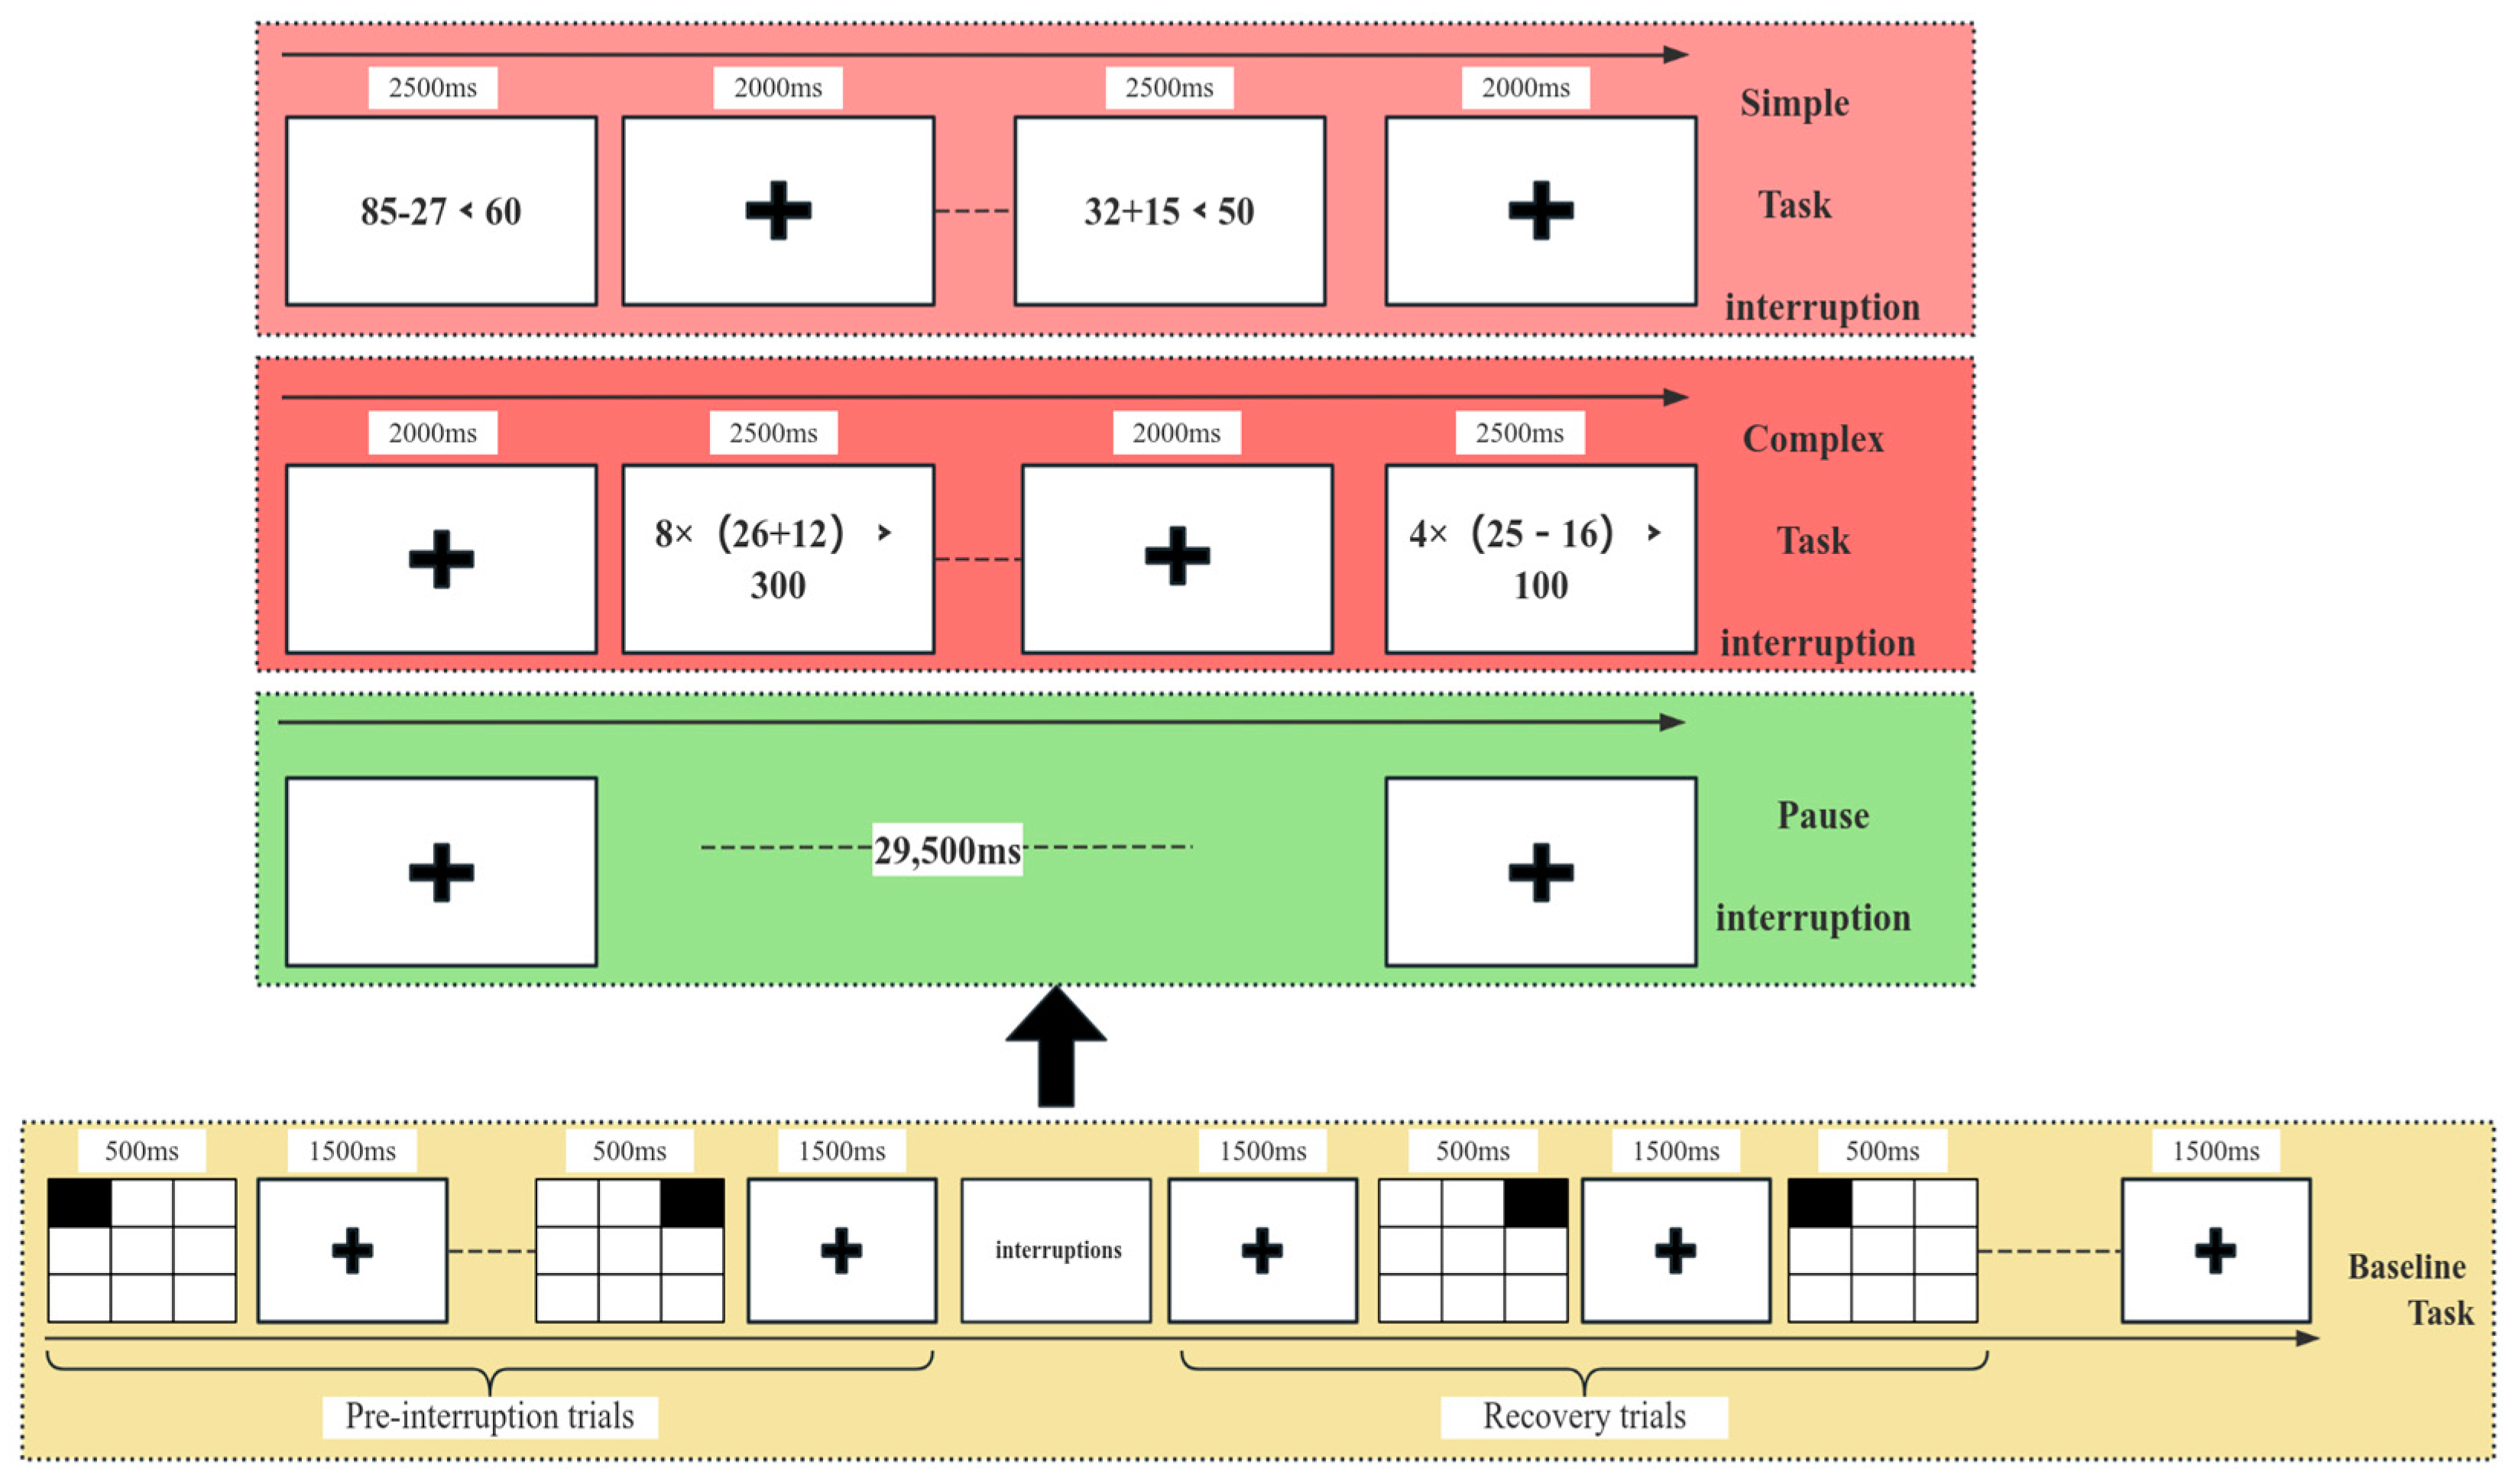
15]. Building on the ACT-R framework, this study employs the spatial 2-back task as the primary interruption task, alongside simple mathematical problems as interruptive tasks. Additionally, while previous studies have primarily focused on the effects of secondary task interruptions on subsequent performance, less attention has been given to pauses in task flow. This study expands the scope by incorporating research on pause-based interruptions. Furthermore, by using the AX-CPT (Continuous Performance Test) task to induce fatigue in participants, this study explores the effects of task interruptions on brain activity under both fatigued and non-fatigued states, while also investigating the moderating role of fatigue in the task interruption process.
3. Experimental Results
3.1. Analysis of Subjective Scale Scores
- (1)
Validation of Fatigue Induction via AX-CPT Task: To verify the effectiveness of fatigue induction in this experiment, the Stanford Sleepiness Scale (SSS) was used. As normality testing indicated that the data did not follow a normal distribution, the Wilcoxon signed-rank test, a non-parametric method, was employed to analyze the pre- and post-task SSS scores. Results showed that the post-AX-CPT task scores (mean = 6.13, SD = 1.12) were significantly higher than the pre-task scores (mean = 2.49, SD = 1.23) (p < 0.001), indicating that the 90 min AX-CPT task successfully induced fatigue in participants.
- (2)
Analysis of NASA-TLX Scale Scores: A two-factor repeated-measures ANOVA was conducted on NASA-TLX scores, with the factors of fatigue state (non-fatigue vs. fatigue) and task type (task interruption vs. pause interruption). The results revealed a significant main effect of fatigue (F(1, 48) = 17.59, p < 0.001), with the subjective mental workload significantly higher in the fatigue state than in the non-fatigue state. The main effect of task type was also significant (F(2, 80) = 32.15, p < 0.001), showing that the mental workload during task interruptions was higher than during pause interruptions.
3.2. Behavioral Data Analysis
Descriptive statistics for behavioral performance are shown in
Table 1. In the non-fatigue state, the mean RT for the baseline task without interruptions was 692.09 ± 114.10 ms, while the mean RT for the baseline task with interruptions was 813.81 ± 230.64 ms. A significant difference in RT was observed between the two baseline tasks (
F(1, 83) = 8.302,
p = 0.005,
= 0.091). For ACC, the mean ACC for the baseline task without interruptions was 94.1 ± 0.5%, compared to 92.8 ± 2.5% for the baseline task with interruptions. However, no significant difference in ACC was found between the two baseline tasks (
F(1, 83) = 2.348,
p = 0.131). Under fatigue conditions, the mean RT for the non-interrupted baseline task was 751.16 ± 61.11 ms, while that for the interrupted baseline task was 889.38 ± 227.01 ms, with a significant difference between the two tasks (
F(1, 83) = 9.234,
p = 0.003,
= 0.10). The mean ACC for the non-interrupted baseline task was 92.3 ± 2.8%, compared to 90.0 ± 1.6% for the interrupted baseline task, also showing a significant difference (
F(2, 82) = 17.92,
p < 0.01,
= 0.30).
A 2(fatigued, non-fatigued) × 3(simple task interruption, complex task interruption, pause interruption) × 2(pre-interruption trials, recovery trials) repeated-measures ANOVA was conducted. The results (see
Table 2) revealed a significant interaction between fatigue state and interruption type for RT (
F(1, 48) = 5.389,
p = 0.002,
= 0.147). Significant interactions were also found between fatigue state and trial type, as well as between interruption type and trial type. Further analysis showed that, in the non-fatigued state, RTs differed significantly in the recovery trials (
F(1, 28) = 4.829,
p = 0.038,
= 0.147). Significant differences in RTs were observed in recovery trials across the three interruption types in the fatigued state.(
F(1, 28)
= 3.449,
p = 0.004,
= 0.11), as well as in ACC (
F(1, 28)=20.255,
p < 0.01,
= 0.420). However, only ACC (
F(1, 48) = 9.839,
p = 0.003,
= 0.057) showed significant differences in the pre-interruption trials.
To further explore the relationship between fatigue and task interruption complexity, a 2(fatigued, non-fatigued) × 2(simple task interruption, complex task interruption) × 3(pre-interruption trials, interruption trials, recovery trials) repeated-measures ANOVA was performed. The results (see
Table 3) showed that, in the non-fatigue condition, task interruption type had a significant main effect on RT (
F(1, 36) = 27.143,
p < 0.01,
= 0.24), but no significant effect on ACC (
F(1, 36) = 5.714,
p = 0.54). This indicates that, despite longer RTs for complex tasks, sufficient cognitive resources and processing capacity maintained high ACC levels. In the fatigue condition, task interruption type significantly affected both RT (
F(1, 36) = 15.490,
p = 0.04,
= 0.054), and ACC (
F(1, 36) = 12.822,
p = 0.007,
= 0.170), reflecting the detrimental impact of fatigue on cognitive resource allocation and performance. In recovery trials, there was no significant difference in RT (
F(1, 36) = 1.739,
p = 0.224), but ACC showed a significant decline (
F(1, 36) = 48.000,
p < 0.01,
= 0.420).
3.3. Event-Related Potential (ERP) Analysis
- (1)
P200
The descriptive statistics for P200 mean amplitude and peak latency are shown in
Table 4. A 2(fatigued, non-fatigued) × 3(simple task interruption, complex task interruption, pause interruption) repeated-measures ANOVA revealed that fatigue state significantly affected P200 mean amplitude in the frontal (
F(1, 446) = 50.225,
p < 0.01,
= 0.101), central (
F(1, 446) = 28.275,
p < 0.01,
= 0.060), and parietal regions (
F(1, 446) = 48.817,
p < 0.01,
= 0.099). Interruption type significantly increased P200 amplitude in the frontal region (
F(2, 429) = 4.817,
p = 0.009,
= 0.022), while no significant effects were observed in the central (
F(2, 445) = 2.813,
p = 0.114) or parietal regions (
F(2, 429) = 2.867,
p = 0.058). A significant interaction between fatigue state and interruption type was observed in all three regions, highlighting the modulation of cognitive resource allocation under fatigue conditions. For P200 peak latency, fatigue state significantly affected the frontal region (
F(1, 446) = 5.979,
p = 0.015,
= 0.021), but had no significant effects in the central (
F(1, 446) = 16.529,
p = 0.784) or parietal regions (
F(1, 446) = 0.985,
p = 0.322).
To analyze the differences in the mean amplitude and peak latency of the P200 component under varying fatigue states and interruption task types across different trial types, a 2(fatigued, non-fatigued) × 3(simple task interruption, complex task interruption, pause interruption) × 3(pre-interruption trials, interruption trials, recovery trials) repeated-measures ANOVA was conducted for the frontal, central, and parietal regions. The trial type significantly affected the intensification of the mean amplitude of P200 in the frontal region, but the main effects were not significant for the central region (F(2, 445) = 2.813, p = 0.114) or the parietal region (F(2, 445) = 1.585, p = 0.206). An interaction effect between fatigue state and trial type was observed for mean P200 amplitude in the frontal (F(5, 442) = 5.766, p < 0.01, = 0.061), central (F(2, 445) = 7.539, p < 0.01, = 0.063), and parietal regions (F(2, 429) = 10.723, p < 0.01, = 0.048). Further analysis of simple effects revealed that the trial type primarily amplified the P200 amplitude in the frontal region. In the fatigued state, significant differences in P200 amplitude were also noted among trial types in the central and parietal regions. These findings suggest that the frontal region plays a relatively prominent role in cognitive tasks. Additionally, an interaction effect between trial type and interruption type on P200 amplitude was significant in the frontal region (F(7, 440) = 6.530, p < 0.01, = 0.094), but not in the central (F(7, 440) = 1.266, p = 0.265) or parietal regions (F(7, 440) = 1.117, p = 0.351). This further underscores the importance of the frontal region in processing these tasks. For P200 peak latency, an interaction effect between fatigue state and trial type was observed in the frontal region (F(2, 429) = 0.911, p = 0.033, = 0.014), but not in the central (F(2, 445) = 2.813, p = 0.114) or parietal regions (F(2, 429) = 1.257, p = 0.286). Analysis indicated that differences in peak P200 latency across trial types were significant only in the fatigued state.
- (2)
P300
The descriptive statistics for the mean amplitude and peak latency of the P300 component are presented in
Table 5. A 2(fatigued, non-fatigued) × 3(simple task interruption, complex task interruption, pause interruption) repeated-measures ANOVA was conducted, and the results are summarized as follows: The main effect of fatigue state on P300 mean amplitude was not significant (frontal: (
F(1, 446) = 0.158,
p = 0.692); central: (
F(2, 445) = 0.042,
p = 0.837); parietal: (
F(1,446) = 0.927,
p = 0.336). However, a significant interaction between fatigue state and interruption type was observed, particularly in the frontal (
F(1, 446) = 6.002,
p < 0.01,
= 0.013) and central regions (
F(1, 446) = 2.373,
p = 0.038,
= 0.005). Descriptive statistical analysis indicated that under fatigue conditions, the P300 amplitude in the frontal region gradually decreased following task and pause interruptions as the experiment progressed, while the P300 amplitude in the central region increased after task interruptions. For P300 peak latency, the fatigue state significantly affected the frontal region (
F(1, 446)=9.573,
p = 0.002,
= 0.021) but had no significant effects on the central (
F(1, 446) = 1.154,
p = 0.283) or parietal regions (
F(1, 446) = 0.038,
p = 0.854). The interruption type had a significant effect on P300 peak latency in the central (
F(1, 446) = 4.031,
p = 0.018,
= 0.035) and parietal regions (
F(1, 446) = 3.226,
p = 0.041,
= 0.017), but not in the frontal region (
F(1, 446) = 0.658,
p = 0.518).
To further analyze the effects of trial type on P300 mean amplitude and peak latency, a 2(fatigued, non-fatigued) × 3(simple task interruption, complex task interruption, pause interruption) × 3(pre-interruption trials, interruption trials, recovery trials) three-way repeated-measures ANOVA was conducted for the frontal, central, and parietal regions. In the frontal region, trial type had a significant main effect on P300 mean amplitude, and showed a significant interaction with fatigue state (F(2, 445) = 6.002, p < 0.01, = 0.163). Further analysis revealed significant differences in P300 amplitudes across trial types under fatigue (F(1, 222) = 10.058, p = 0.004, = 0.069), with a notable decline in the recovery trials. Similarly, P300 peak latency showed significant differences across trial types in the fatigue condition (F(1, 222) = 5.264, p = 0.014, = 0.026), indicating that fatigue inhibited the redistribution of attention and cognitive resources between trials. In the central region, a significant three-way interaction was found between fatigue state, interruption type, and trial type for P300 mean amplitude (F(1, 222) = 6.254, p = 0.044, = 0.027). Further analysis showed that in the non-fatigue condition, P300 mean amplitude in the recovery trials during pause interruption was significantly lower than in the pre-interruption trials (F(1, 222) = 4.589, p = 0.022, = 0.022). However, this effect was not observed under fatigue conditions.
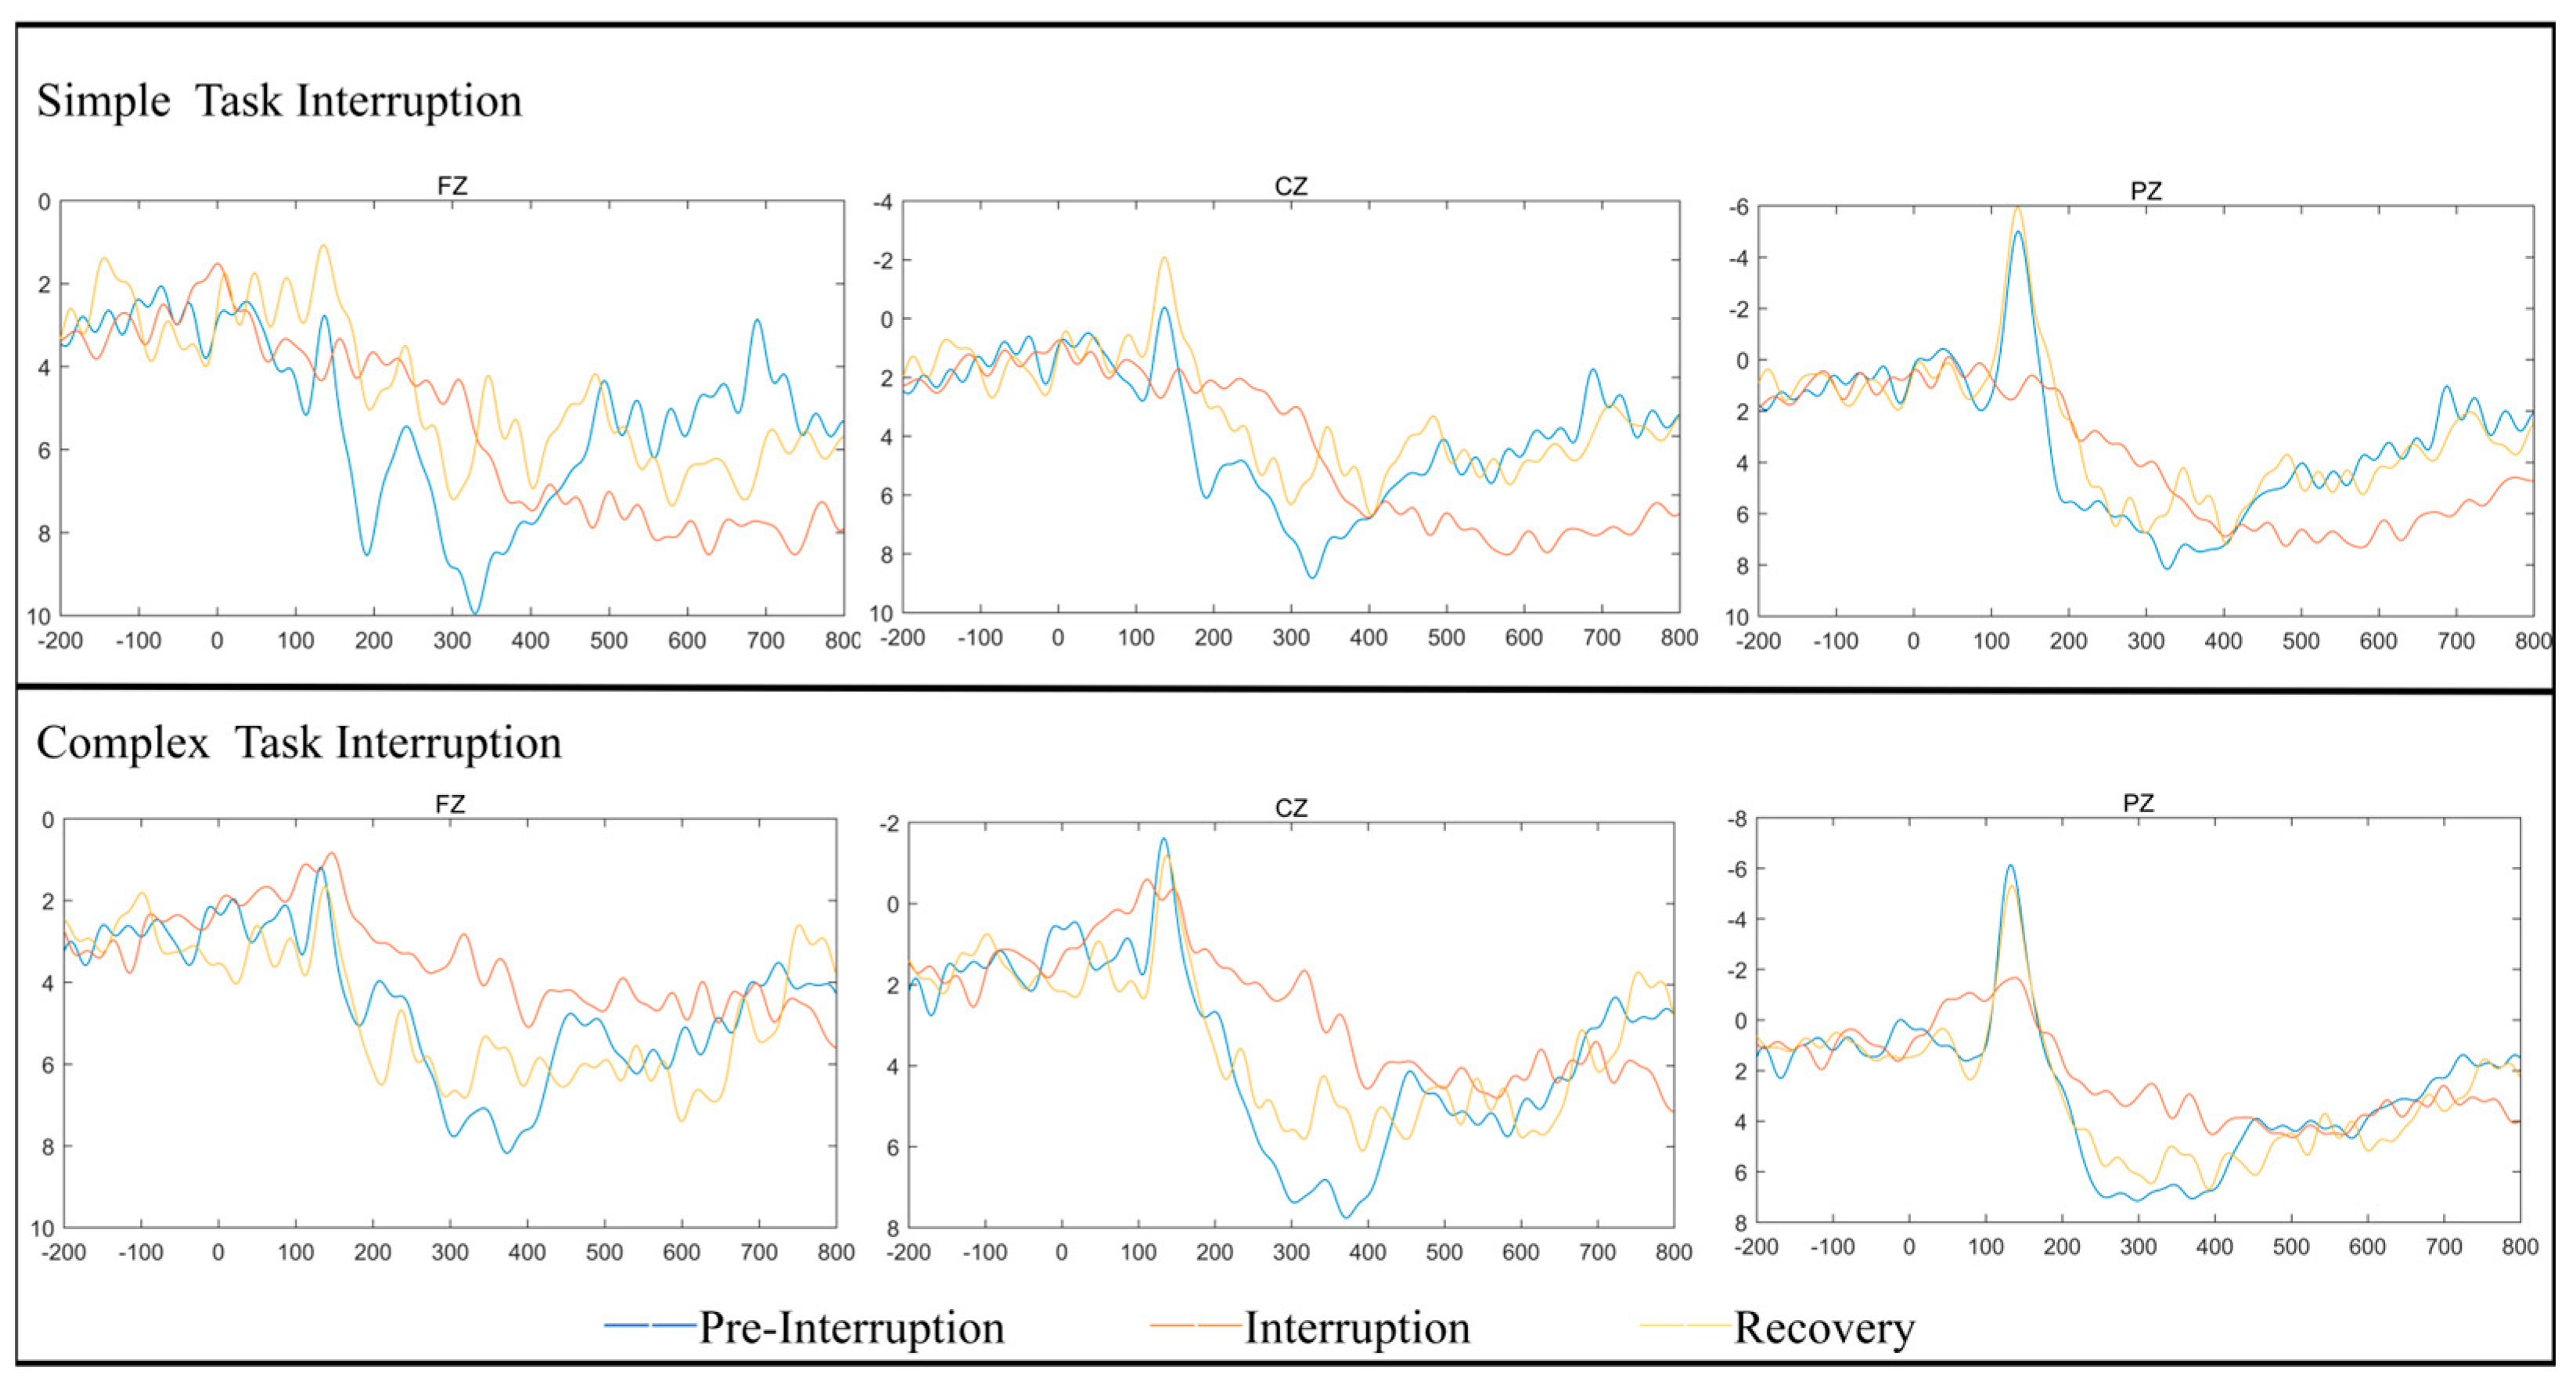
The heatmaps and waveform plots for different electrode regions under the fatigued state are shown in
Figure 3 and
Figure 4. This is consistent with previous studies, such as Chen’s [
24], which utilized brain imaging techniques to reveal that the fronto-parietal network plays a crucial role in working memory and attention. As attention shifts and the amount of information in working memory increases, activity in the fronto-parietal network also rises.
Time Window: 180–280 ms: In this time window, the scalp potential distribution for simple task interruption displayed lower electrical activity, especially in the frontal, central, and parietal regions, with reduced negative potentials represented by light blue areas. This indicates that simple task interruptions impose a relatively low load on early attention allocation and perceptual processing. In contrast, complex task interruption showed a broader range of negative potential distributions in the same time window, particularly in the prefrontal and central regions. This suggests that under complex task interruptions, the brain requires more cognitive resources to handle task switching, resulting in larger P200 amplitudes. These findings align with the ANOVA results.
Time Window: 300–450 ms: In this later window, the P300 distribution for simple task interruptions showed reduced positive potential distribution, primarily concentrated in the frontal region. This reflects relatively lower demands on working memory updating and cognitive control. Conversely, complex task interruptions demonstrated higher positive potential distributions, particularly in the central and parietal regions. This corresponds to a larger P300 amplitude, suggesting that complex task interruptions require more cognitive resources for information processing and decision-making. These findings support the ANOVA results, which highlight the significant increase in cognitive load caused by complex task interruptions.
Electrode Region Sensitivity: Under both task interruption conditions, the frontal region (FZ) demonstrated higher sensitivity to complex tasks, particularly within the P300 time window. This aligns with the ANOVA findings, which highlighted significant amplitude changes in the frontal region during complex cognitive tasks. The central region (CZ) and parietal region (PZ) also showed stronger responses under complex task interruption conditions. In particular, the P300 response in the parietal region was significantly enhanced, suggesting that these regions bear a higher cognitive load during information categorization and task recovery. The heatmaps and waveform plots corroborate the ANOVA results, further validating the influence of interruption type and fatigue state on cognitive resource allocation and neural activity in the brain.
4. Discussion
This study explored the moderating effects of fatigue on task and pause interruption by comparing behavioral performance and ERP data in both fatigued and non-fatigued states. From both behavioral and neuroscientific perspectives, it provides an in-depth investigation into the mechanisms through which fatigue impacts behavioral performance during task interruptions. At the behavioral level, the results indicated that task interruptions significantly increased RTs, while their impact on ACC was contingent on the fatigue state. Specifically, ACC was more adversely affected under fatigued conditions compared to non-fatigued states. ERP data revealed that in the fatigued state, participants exhibited significantly reduced P300 amplitudes in the frontal region, alongside a significant increase in P200 amplitudes in the same region. This reflects the impact of task interruption on cognitive resource processing and working memory, which is consistent with previous research [
25]. However, further studies have found that fatigue negatively moderates behavioral performance by exacerbating the adverse effects of task interruptions on working memory and overall behavioral performance.
- (1)
Fatigue and Task Interruptions: Impacts on Behavioral Performance
From the behavioral performance data, a significant interaction between fatigue state and trial type was observed for RTs, indicating that interruptions led to a decline in post-interruption performance, with fatigue amplifying this negative effect. Subtle differences were noted between task interruptions and pause interruptions, where fatigue had a slightly greater negative impact during pause interruptions than simple task interruptions. These phenomena can be understood through the mediating effects of fatigue and the compensatory control mechanisms.
In the ACT-R cognitive architecture, executive control primarily coordinates and manages the activities of various cognitive modules (e.g., perception, cognition, memory, and motor modules) [
26]. Its core functions include regulating attention, managing working memory, suppressing impulsive and erroneous responses, and adapting task switching strategies to meet changing task demands. Executive control achieves optimal cognitive resource allocation and task switching through the coordination of the facilitation system and the inhibition system [
27]. During task interruptions, the facilitation and inhibition systems collaborate to regulate cognitive and behavioral responses. The facilitation system accelerates responses to new tasks by enhancing arousal levels and attention focus, possibly via neurotransmitter release. Meanwhile, the inhibition system reduces interference and protects working memory for the primary task.
When an interruption occurs, executive control’s coordination of cognitive resources is disrupted, and the balance between the facilitation and inhibition systems is compromised, reducing the efficiency of reactivating the primary task, and thereby impairing behavioral performance. Previous studies have shown that enhancing system performance can lead to the neglect of relevant cues, resulting in longer response times and increased error rates in completing the main task [
28]. Fatigue further diminishes allocation efficiency, weakening the activation of the facilitation system and making the inhibition system more active. This overactivation hinders the ability to filter irrelevant stimuli, impairing information processing, which leads to longer RTs and decreased ACC after interruptions.
In the non-fatigued group, “compensatory control mechanisms” [
29] were observed. When the executive control system is overloaded and cognitive resources such as working memory capacity are impaired, individuals may unconsciously activate compensatory control mechanisms to counteract this damage. These compensatory control mechanisms work by adjusting execution strategies, prioritizing important tasks, or adopting more effort-efficient approaches to maintain behavioral performance [
30]. Under non-fatigued conditions, significant differences in RTs between task interruptions and pause interruptions were only observed in the recovery trials. The compensatory control mechanisms effectively redistributed cognitive resources in response to the attentional shifts caused by interruptions. This redistribution and accelerated processing resulted in longer RTs, but participants were able to maintain relatively high ACC. This phenomenon demonstrates that the executive control system can sustain cognitive capabilities at a relatively high level through adaptive resource allocation strategies, although its capacity for regulation is finite.
In the fatigued state, the facilitation system was weakened, and complex task interruptions induced additional stress and frustration, further diminishing the system’s effectiveness. Behavioral performance was more severely impaired under these conditions. Complex interruptions, which involve more information and interference factors, required participants to allocate more inhibitory resources to suppress distractions. Fatigue increased the load on the inhibition system, reducing its efficiency and impairing its ability to filter irrelevant information. This supports the conclusion that fatigue primarily disrupts the balance between the facilitation and inhibition systems. Moreover, it highlights the limited capacity of the executive control system to effectively adjust between primary and interrupting tasks, which in turn affects behavioral performance.
During pause interruptions under fatigue, participants were in a relatively task-free state, which more readily activated the inhibition system. Extended pauses, often characterized by monotony and a lack of challenge, induced boredom and drowsiness [
31], further diverting attention from the primary task. Combined with accumulated fatigue, the inhibition system increasingly suppressed cognitive engagement. This coordination mechanism may represent a rest signal to avoid overexertion and maintain homeostasis. As fatigue accumulated, the inhibition system’s role became more pronounced, leading to further declines in task performance. Consequently, when the primary task resumed, participants required more time to reactivate relevant cognitive resources, resulting in a larger increase in RTs.
In contrast, during simple task interruptions, although the interruptions themselves might have increased cognitive load, participants were able to maintain a certain level of cognitive alertness to respond to the interruption [
32]. This alertness partially activated the facilitation system, helping individuals to sustain or improve task performance under resource-constrained conditions. This mitigated the negative impact of mental fatigue on cognitive abilities, allowing participants to more quickly recover primary task performance after interruptions. Thus, despite the effects of fatigue, the increase in RTs after simple task interruptions was relatively small.
- (2)
ERP Evidence of Fatigue-Induced Cognitive Decline: P200 and P300 as Key Indicators
The ERP analysis revealed that fatigue significantly affects the amplitude and latency of P200 and P300, leading to a decline in task processing efficiency. Following task interruptions, the increase in P200 amplitude and prolongation of its latency reflect the depletion of cognitive resources. Under fatigue conditions, the decrease in frontal P300 amplitude over the course of the experiment indicates impaired executive control, reduced attentional allocation, and diminished working memory updating capacity. Although the increase in central P300 amplitude may reflect a compensatory control mechanism, it fails to effectively offset the negative effects of fatigue.
Fatigue state significantly affected the average amplitude and peak latency of the P200 component. The effects of trial type and task type on the P200 amplitude and latency were primarily observed in the frontal region. Trial type significantly altered the P200 amplitude in the frontal area, and changes in P200 amplitude are associated with early attentional allocation and active maintenance during working memory updating in the prefrontal cortex (PFC) [
25], indicating the role of the executive control system in coordinating cognitive resources after an interruption occurs [
33]. Under non-fatigued conditions, the P200 amplitude in the frontal region increased after both task and pause interruptions, suggesting a quick response of the facilitation system to task switching [
34]. Notably, pause interruptions provide individuals with a brief “cognitive buffer”, allowing the facilitation system to respond rapidly to task switching, resulting in a slightly higher P200 amplitude compared to simple task interruptions [
35]. Under fatigue, when cognitive resources are nearly depleted, during pause interruptions, the inhibition system further reduces cognitive resource allocation, making it difficult for individuals to reallocate attention to the task. As a result, the P200 amplitude decreases, which is consistent with the behavioral data and aligns with previous research findings.
Fatigue and trial type showed a significant interaction effect on P200 latency in the frontal region. Generally, P200 latency is a measure of stimulus classification speed, and is used as an indicator of neural efficiency and processing speed. Under fatigued conditions, increased P200 latency suggested a slight decrease in information processing speed [
36]. Functionally, the frontal region is involved in generating attention-switching control signals, and shorter P200 latencies reflect stronger task switching abilities [
37]. Task interruptions inherently involve switching between primary and interrupting tasks. Under non-fatigued conditions, P200 latency in the central and parietal regions decreased slightly after pause interruptions compared to pre-interruption trials, likely because participants could prepare and rehearse for the subsequent task during the pause. However, this preparatory advantage was not observed under fatigued conditions. The significant increase in post-interruption latency under fatigue aligns with the increase in RTs observed in the behavioral data. The increase in P200 amplitude and latency under fatigue indicates that the executive control system was actively adjusting strategies to address the challenges posed by fatigue, expending additional effort to maintain task stability and ACC. However, due to resource depletion and reduced efficiency of the facilitation system, behavioral performance further deteriorated.
Fatigue did not significantly affect the mean amplitude of P300 overall, but its interaction with task type resulted in distinct neural response patterns under specific tasks. Fatigue significantly affected the peak latency of P300 in the frontal region, but not in other regions. The P300 component reflects attention reallocation to task-relevant events and their evaluation [
38]. In the frontal region, fatigue, task type, and trial type demonstrated significant interaction effects for P300 amplitude. Under fatigued conditions, P300 amplitude decreased as the experiment progressed, following task and pause interruptions. Decreased frontal P300 amplitude indicates impaired executive control, with reduced capacity for working memory updating and attentional resource allocation [
39]. Fatigue exacerbated these impairments [
40], weakening inhibition functions and the ability to suppress irrelevant information [
41], which is a typical top-down process requiring active executive control. This is consistent with the earlier findings.
In the central region, P300 amplitude showed a significant interaction between fatigue and task type. Under fatigued conditions, P300 amplitude increased with experimental progression in both types of task interruptions. This suggests that as fatigue accumulated, the frontal region failed to allocate sufficient resources to meet task demands [
42], leading to a decline in active control ability [
43]. The brain compensated by shifting more attention to the central region to maintain task performance. Previous research has shown that the central region is associated with perceiving task-relevant information and processing automatic responses [
44]. Therefore, under fatigued conditions, individuals may rely more on automation to handle tasks and meet lower-level task demands. Fatigue and trial type also showed a significant interaction effect for P300 latency. Under non-fatigued conditions, P300 latency decreased slightly post-interruption, but this phenomenon was absent under fatigue. P300 latency reflects attentional focus during the information processing stage, and is functionally used to evaluate attention and memory capabilities [
45].
Consistently with previous research, under fatigued conditions, decreased P300 amplitude post-interruption indicates impaired executive control, slower decision-making adjustments, and increased risk of critical failures. Further studies have found that the differing changes in P300 amplitude between the frontal and central regions reveal the complex effects of task interruptions on response inhibition under fatigue. Decreased P300 amplitude in the frontal region reflects weakened inhibition function, while increased P300 amplitude in the central region represents a compensatory control mechanism, where the brain reallocates attention to maintain task execution. However, this compensation does not always effectively counteract the negative effects of fatigue. Changes in cognitive resource allocation strategies under fatigue may impair efficiency and precision, increasing the likelihood of unsafe behaviors.
- (3)
Mechanisms of Unsafe Behaviors Under Fatigue: the limitations of the compensation mechanism.
Task interruptions under fatigue increase the risk of unsafe behaviors by impairing the functioning of the executive control system and disrupting the coordination of cognitive resources. As analyzed earlier, after a task interruption, individuals must exert greater cognitive effort to resume task execution. This involves the facilitation system supporting task switching, and the inhibition system reducing interference from irrelevant information and errors. In non-fatigued states, increases in P200 and P300 amplitudes provide evidence for these mechanisms. From the observed increase in P200 latency and RTs, it is apparent that the compensatory control mechanisms made efforts to mitigate the negative effects of task interruptions through strategies such as increased cognitive effort and adjustments in execution strategies, partially offsetting the adverse impacts. However, fatigue exacerbates the cognitive load required for task switching, demanding more cognitive resources to re-engage in the task—resources that are nearly depleted in the fatigued state. The difficulty in reallocating cognitive resources after task interruptions directly impacts the timeliness and ACC of decision-making, as evidenced by significant changes in RTs and ACC under fatigue. Changes in neural components reflect the detrimental effects of fatigue on the executive control system. The increase in P200 amplitude and prolongation of its latency indicate a slower response to task switching, while the reduction in the frontal region P300 amplitude and the extension of its latency further reveal weakened executive control. This is particularly pronounced during complex task interruptions, where overactivation of the inhibition system impairs its ability to effectively suppress irrelevant information and distractions, further affecting individuals’ judgment and response efficiency during tasks. Meanwhile, the increased P300 amplitude in the central region suggests that the brain attempts to compensate for this imbalance. However, this compensatory control mechanism fails to adequately counteract the lack of cognitive resources, leading to reduced efficiency in information processing and task execution. Consequently, this inefficiency increases the likelihood of unsafe behaviors.
In this study, the experimental conditions were relatively controlled, whereas task interruptions in actual tunneling operations are more complex and diverse. The characteristics of interruptions may vary significantly depending on task requirements and stress intensity. Future research could expand to multitasking or high-risk scenarios to investigate the impact of fatigue on different occupational groups and enhance the ecological validity of the findings. Fatigue is typically a cumulative process, while this study primarily focused on the effects of short-term fatigue on task interruptions. Longitudinal studies could be conducted to examine the dynamic changes in behavior and neurophysiological mechanisms associated with long-term fatigue (e.g., sleep deprivation or chronic fatigue syndrome), and explore its sustained impact on executive control and resource allocation systems. Although this study primarily employed ERP data to analyze neurophysiological mechanisms, fatigue may also induce other physiological and psychological changes, such as heart rate variability (HRV), electrodermal activity (EDA), or subjective fatigue ratings. Integrating multimodal data could provide a more comprehensive depiction of the effects of fatigue on individual cognition and behavior. In addition, future research could further explore the moderating effects of non-cognitive factors, such as work environment and social support, on miner fatigue. Based on the neurophysiological and behavioral characteristics revealed in this study, fatigue state prediction models could be developed. Coupled with machine learning algorithms, intelligent monitoring systems could be designed to monitor fatigue states in real time and issue alerts in high-risk tasks, thereby reducing the risks associated with fatigue-induced accidents.


 ,
, 


